single-molecule afm cantilever for thz force detectioncy977mf7313/fahad_mahmood... ·...
TRANSCRIPT

1
Single-Molecule AFM Cantilever for THz Force Detection
Fahad Mahmood
Manoharan Lab, Department of Physics, Stanford University
Increasing the resonance frequency of an Atomic Force Microscope (AFM) cantilever is
necessary to effectively probe short-range chemical forces. Current AFM cantilevers
have frequencies of about 100 − 200 kHz, limiting the minimum force-gradient that can
be measured to the order of 10 pN/nm. This study demonstrates the ability of Inelastic
Tunneling Spectroscopy (IETS) to probe THz vibrational modes of a single CO molecule
attached to the tip of a low-temperature Scanning Tunneling Microscope (STM). Using
molecular manipulation, a CO molecule is transferred to the end of the STM tip and lock-
in techniques are used to measure 𝑑2𝐼/𝑑𝑉2 tunneling spectra. Shifts in the frequency of
specific vibrational modes of the CO molecule are analyzed as a function of the tip-to-
sample distance. This shows that a single molecule can be used as an AFM cantilever for
force spectroscopy with the ability to measure small force-gradients to the order of
10−6 pN/nm. IETS with a CO terminated STM tip is also performed over adsorbed CO
molecules on a Cu(111) surface revealing a novel vibrational mode due to coupling
between the two CO molecules. In future, the small force-gradients detected by STM-
IETS can be used to resolve single atoms within a molecule to reveal additional
molecular structure.
1. Introduction
Over the past 20 years, great strides have been made in nano-probe technology, giving us the
ability to not only see matter at the nano-scale but to manipulate it as well [1, 2]. Two such
probes are the Atomic Force Microscope (AFM) and the Scanning Tunneling Microscope (STM).
While both involve moving an atomically sharp tip across a surface, they use fundamentally
different physical phenomena. An AFM uses the changing force between the tip and the surface
to change the resonant frequency of the AFM cantilever. The resulting frequency shift can be
measured to give an image of the surface topography. On the other hand, an STM uses quantum
tunneling of electrons across a potential barrier to image surfaces. Both the AFM and the STM
are capable of resolving individual surface atoms with the STM having the added capability to
study electron density of states and the AFM having the capability to study both short-range and
long-range forces between molecules (force spectroscopy).
While STM imaging can study electron density of states, it is not able to resolve individual
atoms within adsorbed molecules. Unlike the AFM, an STM cannot detect short-range chemical
2
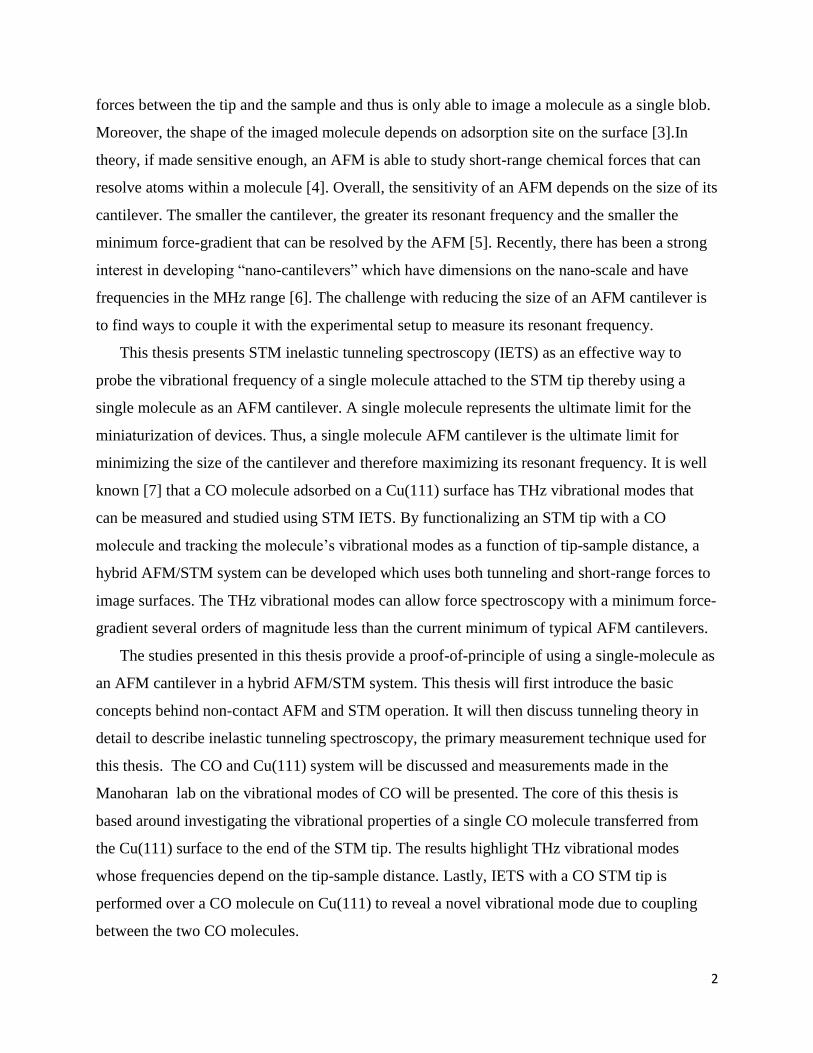
forces between the tip and the sample and thus is only able to image a molecule as a single blob.
Moreover, the shape of the imaged molecule depends on adsorption site on the surface [3].In
theory, if made sensitive enough, an AFM is able to study short-range chemical forces that can
resolve atoms within a molecule [4]. Overall, the sensitivity of an AFM depends on the size of its
cantilever. The smaller the cantilever, the greater its resonant frequency and the smaller the
minimum force-gradient that can be resolved by the AFM [5]. Recently, there has been a strong
interest in developing “nano-cantilevers” which have dimensions on the nano-scale and have
frequencies in the MHz range [6]. The challenge with reducing the size of an AFM cantilever is
to find ways to couple it with the experimental setup to measure its resonant frequency.
This thesis presents STM inelastic tunneling spectroscopy (IETS) as an effective way to
probe the vibrational frequency of a single molecule attached to the STM tip thereby using a
single molecule as an AFM cantilever. A single molecule represents the ultimate limit for the
miniaturization of devices. Thus, a single molecule AFM cantilever is the ultimate limit for
minimizing the size of the cantilever and therefore maximizing its resonant frequency. It is well
known [7] that a CO molecule adsorbed on a Cu(111) surface has THz vibrational modes that
can be measured and studied using STM IETS. By functionalizing an STM tip with a CO
molecule and tracking the molecule’s vibrational modes as a function of tip-sample distance, a
hybrid AFM/STM system can be developed which uses both tunneling and short-range forces to
image surfaces. The THz vibrational modes can allow force spectroscopy with a minimum force-
gradient several orders of magnitude less than the current minimum of typical AFM cantilevers.
The studies presented in this thesis provide a proof-of-principle of using a single-molecule as
an AFM cantilever in a hybrid AFM/STM system. This thesis will first introduce the basic
concepts behind non-contact AFM and STM operation. It will then discuss tunneling theory in
detail to describe inelastic tunneling spectroscopy, the primary measurement technique used for
this thesis. The CO and Cu(111) system will be discussed and measurements made in the
Manoharan lab on the vibrational modes of CO will be presented. The core of this thesis is
based around investigating the vibrational properties of a single CO molecule transferred from
the Cu(111) surface to the end of the STM tip. The results highlight THz vibrational modes
whose frequencies depend on the tip-sample distance. Lastly, IETS with a CO STM tip is
performed over a CO molecule on Cu(111) to reveal a novel vibrational mode due to coupling
between the two CO molecules.

3
2. Non-Contact Atomic Force Microscopy
The original AFM was developed in 1986 by Bining, Quate and Gerber [8]. Developed after
the STM, the AFM provided an experimental technique that could image both conducting and
insulating materials. The AFM consists of a probing tip which is attached to a cantilever. As the
tip moves over a sample, tip-surface forces change the deflection of the cantilever which can be
measured to give an image of the surface.
In the non-contact (NC) mode (Figure 1), the tip-cantilever system, with spring constant 𝑘,
oscillates at an unperturbed resonant frequency (𝑓𝑜 ). As the surface topography changes, the
height between the tip and the sample (𝑧) changes. This in turn changes the tip-sample force,
changing the oscillation frequency of the tip-cantilever system. The resulting frequency shift (∆𝑓)
can be measured to give a map of the surface topography. In most setups, a feedback loop adjusts
the tip-sample height so as to maintain constant ∆𝑓 and constant oscillation amplitude. The
resulting change in the tip-sample height then maps the surface topography.
The tip-sample force consists of both short-range chemical bonding forces (such as covalent
bonds with a range in fractions of nm) and long-range forces (such as van der Waals and
electrostatic forces with a range of up to nm) [1]. As the tip-sample force plays a fundamental
role in the operation of NC-AFM, it is important to understand its relationship with the
oscillation frequency shift (∆𝑓). A simplistic derivation of this relationship is given in [9]. In
general the potential energy between the tip and sample 𝑉𝑡𝑠 causes a 𝑧 component in the tip-
Figure 1: Fundamentals of the Atomic Force Microscope. The AFM consists of a sharp tip attached to an oscillating cantilever. The cantilever oscillates at an unperturbed resonant frequency 𝑓𝑜 . As the tip moves across the surface the tip-surface force changes with the changing surface topography. This in turn changes the frequency of the oscillating cantilever. The resulting frequency shift ∆𝑓 can be measured to give a map of the surface topgography.
Am
plit
ud
e
Tip
Sample
Oscillating Cantilever at 𝒇𝒐 z
4
sample force 𝐹𝑡𝑠 = −𝜕𝑉𝑡𝑠
𝜕𝑧 and a tip-sample spring constant 𝑘𝑡𝑠 related to the force gradient as
𝑘𝑡𝑠 = −𝜕𝐹𝑡𝑠
𝜕𝑧. The cantilever can be approximated as a harmonic oscillator with effective spring
constant 𝑘∗ = 𝑘 + 𝑘𝑡𝑠 . The frequency (𝑓 = 𝑓𝑜 + ∆𝑓) of the oscillator is then given by 𝑓 =
1
2𝜋
𝑘∗
𝑚, where 𝑚 is the mass of the tip-cantilever system. If 𝑘𝑡𝑠 ≪ 𝑘, the expression for 𝑓 can be
expanded as a Taylor series to give an approximate expression for the force-gradient in terms of
the frequency shift:
𝜕𝐹𝑡𝑠
𝜕𝑧= −2𝑘
∆𝑓
𝑓𝑜 (1)
The key part of this equation is that the force gradient goes as 1/𝑓𝑜 : the larger the resonant
frequency, the smaller the force gradient measured by the AFM. Thus, in order to increase the
sensitivity in the measurement of short-range forces, it is necessary to increase the resonant
frequency of the AFM cantilever. As 𝑓𝑜 ∝ 1/ 𝑚, there has been a consistent effort towards the
miniaturization of an AFM cantilever to increase its resonant frequency [6]. Currently, most
AFM cantilevers usually oscillate at a frequency (𝑓𝑜 ) of about 100 − 200 kHz [9]. As the
stiffness is to the order of 1 kN/m [9], this allows AFM’s to probe force gradients to the order of
10 pn/nm. Current techniques for miniaturization of an AFM cantilever include MEMS
fabrication which can make cantilevers with resonant frequencies as high as 100 MHz [10].
Though this is much higher than cantilever frequencies in the kHz regime, it is still well below
frequencies in the THz regime.
3. Scanning Tunneling Microscopy
Developed in 1981 by Gerd Binnig and Heinrich Roher [11], the Scanning Tunneling
Microscope (STM) is a versatile tool primarily used to image surfaces with sub-nanometer
resolution. Apart from topographic imaging, the STM can also be used to carry out spectroscopy
in which measurements are made at a fixed location, recording the current (or derivatives of the
current) as a function of voltage between the STM tip and the sample. Spectroscopic
measurements are used to determine local electronic properties of a sample and can also be used
to probe vibrational modes of single molecules. Finally, the STM allows manipulation of matter
at the atomic scale, providing the unique ability to build nanostructures one molecule at a time.
The experiments in this thesis use atomic manipulation to functionalize the tip with a single
molecule and use spectroscopic techniques to probe its vibrational modes. The experimental
5
work was done in a low temperature (4.2 K) STM that was designed and built in the Manoharan
lab at Stanford. In order to understand the results in this thesis, it is important to review the basic
concepts behind STM operation.
3.1. A Simple Model for the STM
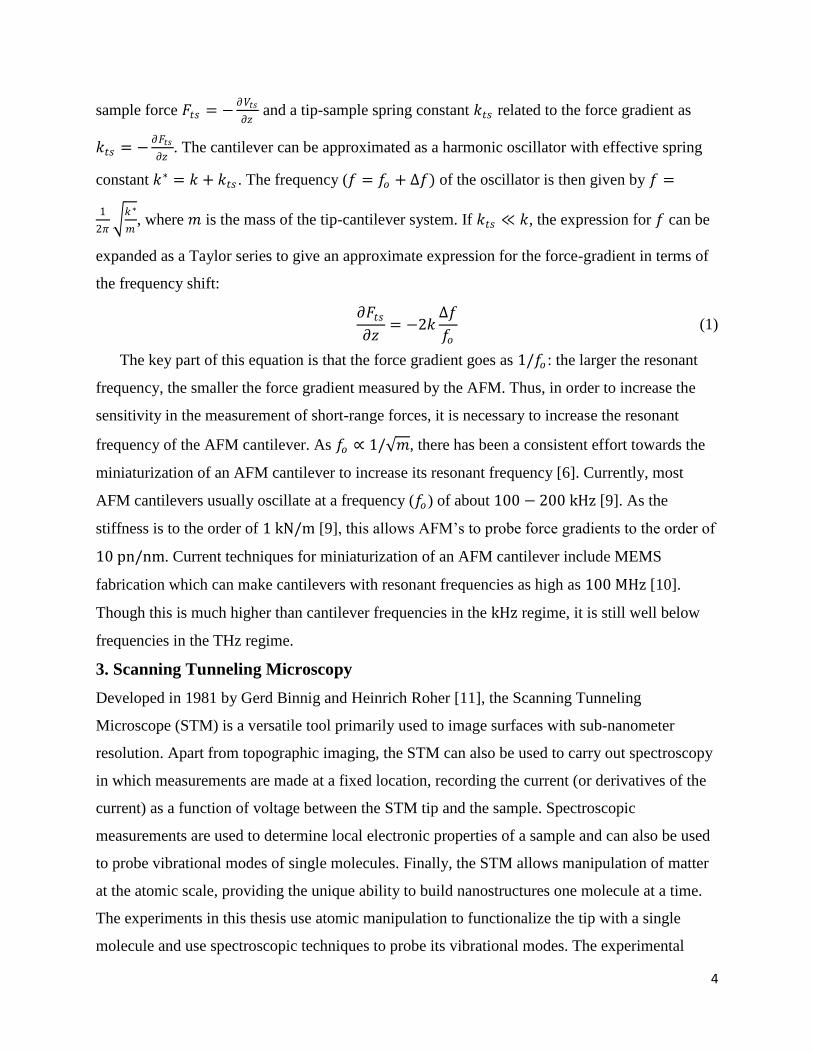
The STM consists of an atomically sharp metal tip positioned above a conducting surface (Figure
2a). The tip and sample are surrounded by vacuum and have a voltage 𝑉 applied across them.
Classically, electron transport between the tip and the sample is forbidden unless 𝑉 exceeds the
work function of the metals. However, electrons can still quantum mechanically tunnel through
the barrier between the tip and the sample. The resulting current can be measured if the tip-
sample distance is extremely small – less than a nanometer. A simple model for this system is a
one-dimensional square barrier (Figure 2b) with a height equal to Φ, the average work function
of the tip and the sample.
An electron can tunnel through this barrier with a probability that is exponentially sensitive to
the distance between the tip and the sample (). The measured current is then given by:
𝐼 ∝ 𝑒−2𝛼 (2)
𝛼 is given by:
𝛼 = 2𝑚(Φ − 𝐸)
ħ (3)
where 𝑚 is the mass of the electron and 𝐸 is its energy with respect to the Fermi level.
Figure 2: Fundamentals of the Scanning Tunneling Microscope. (a) The STM consists of an atomically sharp tip positioned above a conductive sample. A bias 𝑉 is applied between the tip can the sample. The potential barrier between the tip and the sample can be modeled as a one-dimensional square barrier (b). If the tip height () is sufficiently small, a measurable quantum mechanical tunneling current may flow between the tip and the sample. This current is exponentially sensitive to height giving the STM the ability to image surface topography.
h
V
I
Tip
Sample
z
U
z
Φ
h
V
a)
.
b)
.

6
In its most basic configuration, the STM tip is scanned across the surface with a feedback loop
that keeps the current between the tip and the sample constant. The tip then follows the
topography of the underlying surface. By measuring the amount the tip is displaced in order to
keep the current constant, the surface topography can be constructed. The exponential
dependence of the current to the height of the tip above the sample enables the sub-nanoscale
resolution of images obtained by an STM.
3.2. Tunneling Theory
While the one-dimensional square barrier model for the STM does explain topographic
imaging, it is overly simplified. It is important to apply a rigorous theory of tunneling developed
by Bardeen, Tersoff and Hamaan [12, 13] to understand elastic and inelastic tunneling
spectroscopy. In this theory, the tip and the sample are treated as two separate systems with
eigenfunctions 𝜓𝑡𝑖𝑝 and 𝜓𝑠𝑎𝑚𝑝𝑙𝑒 . When the tip height is sufficiently small, 𝜓𝑡𝑖𝑝 and 𝜓𝑠𝑎𝑚𝑝𝑙𝑒 can
overlap allowing electrons to transition from filled states in one system to empty states in the
other system. The transition rate for electrons to go from an initial state 𝑖 to a final state 𝑓 is
given by Fermi’s golden rule
𝑇𝑖→𝑓 =2𝜋
ħ 𝑀𝑖𝑓
2 (4)
where 𝑀𝑖𝑓 is the matrix element that couples the two states.
Using Fermi’s golden rule, it can be shown [14] that the total tunneling current is given by:
𝐼 =4𝜋𝑒
ħ 𝑀 2𝜌𝑡𝑖𝑝 𝜖 + 𝑒𝑉 𝜌𝑠𝑎𝑚𝑝𝑙𝑒 𝜖 [𝑓 𝜖 + 𝑒𝑉 − 𝑓(
∞
−∞
𝜖)]𝑑𝜖 (5)
where 𝜌 is the density of states, 𝑉 is the sample bias with respect to the tip and 𝑓 is the Fermi-
Dirac distribution function. A number of assumptions can be made to simplify the above
expression.
Firstly, the matrix elements 𝑀 can be modeled by a transmission factor (𝑇) that depends on
the energy, the applied bias, the work functions of the tip and sample and the tip height. Since
the applied bias (for tunneling) is much less than the work functions of either the tip or sample,
the energy and voltage dependence of the transmission can be neglected and it can be shown that
the 𝑇 depends exponentially on the distance between the tip and the sample:
𝑇 ∝ 𝑒−𝛼 (6)
where,
7
𝛼 = 4𝑚(Φtip + Φsample )
ħ (7)
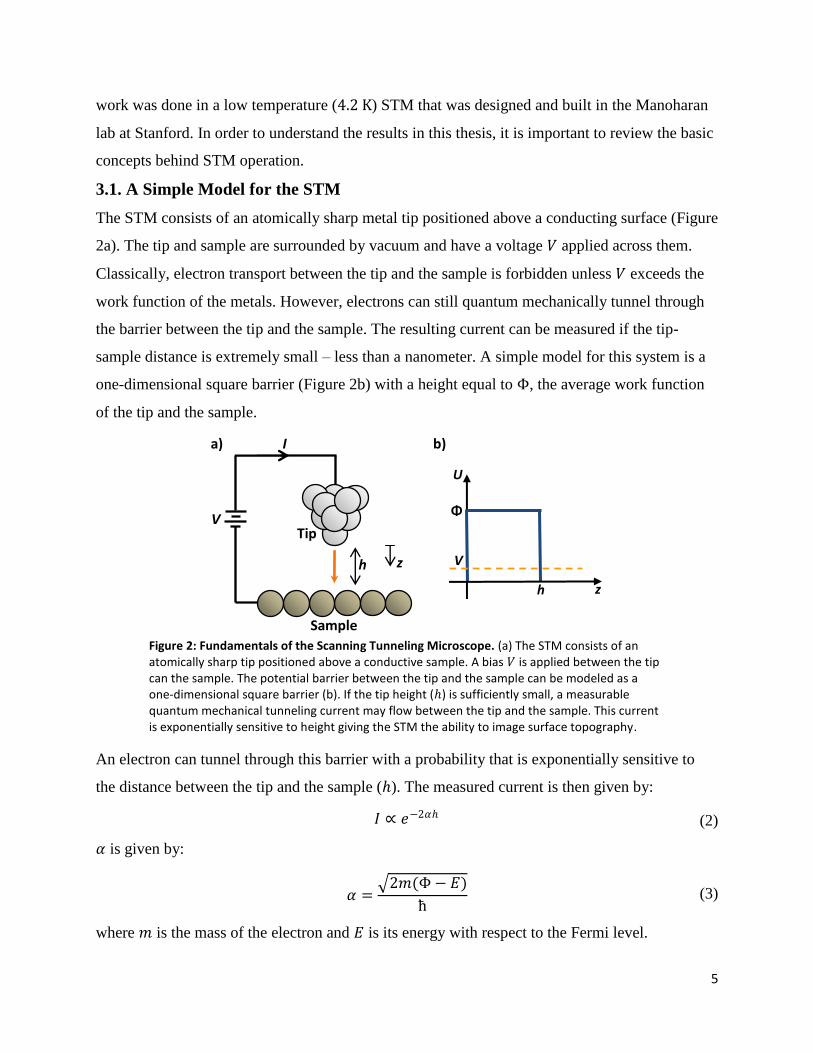
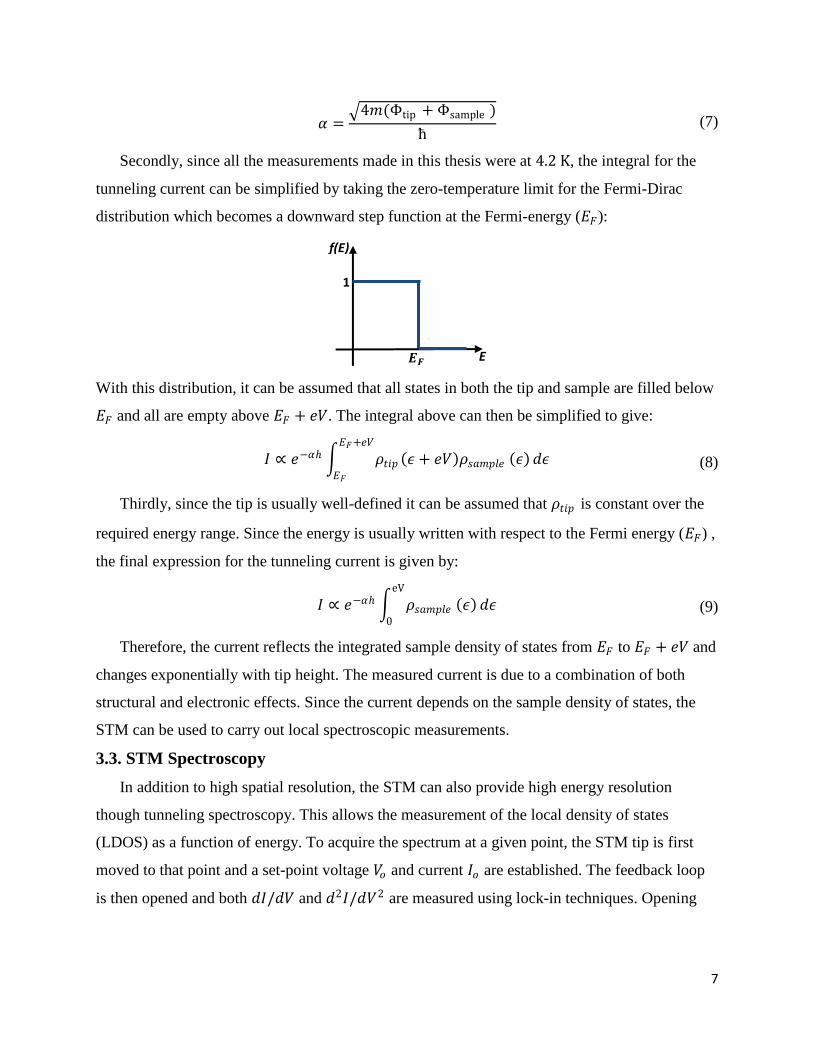
Secondly, since all the measurements made in this thesis were at 4.2 K, the integral for the
tunneling current can be simplified by taking the zero-temperature limit for the Fermi-Dirac
distribution which becomes a downward step function at the Fermi-energy (𝐸𝐹):
With this distribution, it can be assumed that all states in both the tip and sample are filled below
𝐸𝐹 and all are empty above 𝐸𝐹 + 𝑒𝑉. The integral above can then be simplified to give:
𝐼 ∝ 𝑒−𝛼 𝜌𝑡𝑖𝑝 𝜖 + 𝑒𝑉 𝜌𝑠𝑎𝑚𝑝𝑙𝑒 𝜖 𝐸𝐹+𝑒𝑉
𝐸𝐹
𝑑𝜖 (8)
Thirdly, since the tip is usually well-defined it can be assumed that 𝜌𝑡𝑖𝑝 is constant over the
required energy range. Since the energy is usually written with respect to the Fermi energy (𝐸𝐹) ,
the final expression for the tunneling current is given by:
𝐼 ∝ 𝑒−𝛼 𝜌𝑠𝑎𝑚𝑝𝑙𝑒 𝜖 eV
0
𝑑𝜖 (9)
Therefore, the current reflects the integrated sample density of states from 𝐸𝐹 to 𝐸𝐹 + 𝑒𝑉 and
changes exponentially with tip height. The measured current is due to a combination of both
structural and electronic effects. Since the current depends on the sample density of states, the
STM can be used to carry out local spectroscopic measurements.
3.3. STM Spectroscopy
In addition to high spatial resolution, the STM can also provide high energy resolution
though tunneling spectroscopy. This allows the measurement of the local density of states
(LDOS) as a function of energy. To acquire the spectrum at a given point, the STM tip is first
moved to that point and a set-point voltage 𝑉𝑜 and current 𝐼𝑜 are established. The feedback loop
is then opened and both 𝑑𝐼/𝑑𝑉 and 𝑑2𝐼/𝑑𝑉2 are measured using lock-in techniques. Opening
f(E)
E
1
𝑬𝑭

8
the feedback loop allows the tip to remain at a fixed height as the sample bias is varied from
𝑉𝑚𝑖𝑛 to 𝑉𝑚𝑎𝑥 .
The lock-in technique for spectroscopic measurements works by adding a small AC-voltage
modulation ∆𝑉𝑏𝑖𝑎𝑠 = 𝑉𝑚𝑜𝑑 cos(𝜔𝑡) directly to the DC bias voltage 𝑉𝑑𝑐 where 𝑉𝑚𝑜𝑑 ≪ 𝑉𝑏𝑖𝑎𝑠 .
The resulting modulation current can be measured using a lock-in amplifier. To understand how
this relates to 𝑑𝐼/𝑑𝑉 and 𝑑2𝐼/𝑑𝑉2, the tunneling current is written as a Taylor series expansion
around the bias voltage 𝑉𝑏𝑖𝑎𝑠 such that:
𝐼 𝑉𝑑𝑐 + ∆𝑉𝑏𝑖𝑎𝑠 = 𝐼 𝑉𝑑𝑐 + 𝑑𝐼
𝑑𝑉 𝑉𝑑𝑐
𝑉𝑚𝑜𝑑 cos 𝜔𝑡 +1
2 𝑑
2𝐼
𝑑𝑉2 𝑉𝑑𝑐
𝑉2𝑚𝑜𝑑 cos2 𝜔𝑡 + ⋯ (10)
Note that the term in cos 𝜔𝑡 is directly proportional to 𝑑𝐼/𝑑𝑉at the given 𝑉𝑏𝑖𝑎𝑠 whereas the
term in cos2 𝜔𝑡 is directly proportional to 𝑑2𝐼/𝑑𝑉2 at the given 𝑉𝑏𝑖𝑎𝑠 . If the lock-in amplifier
is set to measure the current signal at a frequency of 𝜔 then the voltage measured is directly
proportional to 𝑑𝐼/𝑑𝑉at the given 𝑉𝑏𝑖𝑎𝑠 . Similarly, since cos2 𝜔𝑡 ≡ 1 + cos(2𝜔𝑡), if the lock-
in amplifier is set to measure the current signal at a frequency of 2𝜔 then the voltage measured is
directly proportional to 𝑑2𝐼/𝑑𝑉2 at the given 𝑉𝑏𝑖𝑎𝑠 . By varying 𝑉𝑏𝑖𝑎𝑠 from some given 𝑉𝑚𝑖𝑛 to
some given 𝑉𝑚𝑎𝑥 , both the 𝑑𝐼/𝑑𝑉 and 𝑑2𝐼/𝑑𝑉2 spectrum can thus be obtained by using two
lock-in amplifiers (Figure 3).
Figure 3: Lock-in Techniques for Spectroscopy. A small modulating voltage is added to the DC bias. The resulting tip-sample current is amplified using a pre-amp. A lock-in amplifier measures the signal at the first harmonic 𝜔 to determine 𝑑𝐼/𝑑𝑉. A second amplifier measures the signal at the second harmonic 2𝜔 to determine 𝑑2𝐼/𝑑𝑉2.
3.4. Inelastic Tunneling Spectroscopy
In general there are two types of tunneling spectroscopies: elastic tunneling and inelastic
tunneling (IETS). IETS is the basis for measurements in this thesis and will be described in detail.
During elastic tunneling, an electron that tunnels from the tip to the sample (or vice versa)
9
preserves its energy. The inelastic case involves the tunneling electron losing its energy as it
moves across the tunneling barrier [15].
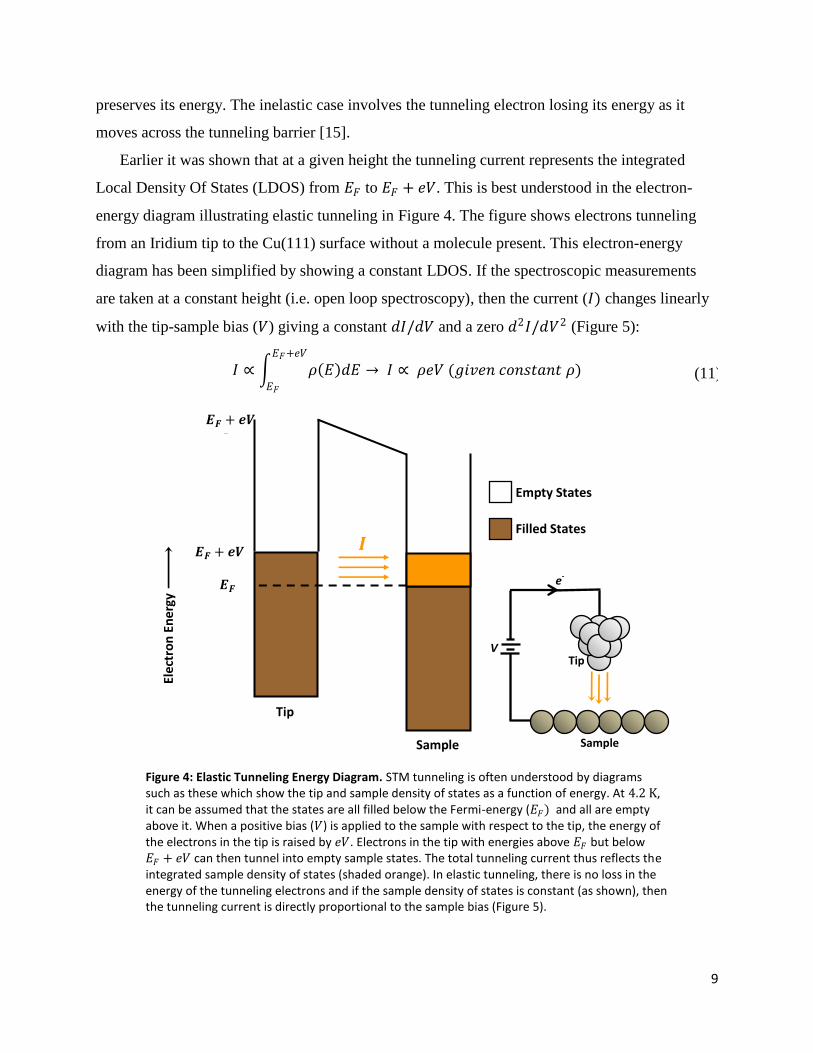
Earlier it was shown that at a given height the tunneling current represents the integrated
Local Density Of States (LDOS) from 𝐸𝐹 to 𝐸𝐹 + 𝑒𝑉. This is best understood in the electron-
energy diagram illustrating elastic tunneling in Figure 4. The figure shows electrons tunneling
from an Iridium tip to the Cu(111) surface without a molecule present. This electron-energy
diagram has been simplified by showing a constant LDOS. If the spectroscopic measurements
are taken at a constant height (i.e. open loop spectroscopy), then the current (𝐼) changes linearly
with the tip-sample bias (𝑉) giving a constant 𝑑𝐼/𝑑𝑉 and a zero 𝑑2𝐼/𝑑𝑉2 (Figure 5):
𝐼 ∝ 𝜌 𝐸 𝑑𝐸𝐸𝐹+𝑒𝑉
𝐸𝐹
→ 𝐼 ∝ 𝜌𝑒𝑉 (𝑔𝑖𝑣𝑒𝑛 𝑐𝑜𝑛𝑠𝑡𝑎𝑛𝑡 𝜌) (11)
Figure 4: Elastic Tunneling Energy Diagram. STM tunneling is often understood by diagrams such as these which show the tip and sample density of states as a function of energy. At 4.2 K, it can be assumed that the states are all filled below the Fermi-energy (𝐸𝐹) and all are empty above it. When a positive bias (𝑉) is applied to the sample with respect to the tip, the energy of the electrons in the tip is raised by 𝑒𝑉. Electrons in the tip with energies above 𝐸𝐹 but below 𝐸𝐹 + 𝑒𝑉 can then tunnel into empty sample states. The total tunneling current thus reflects the integrated sample density of states (shaded orange). In elastic tunneling, there is no loss in the energy of the tunneling electrons and if the sample density of states is constant (as shown), then the tunneling current is directly proportional to the sample bias (Figure 5).
𝑰
𝑬𝑭
𝑬𝑭 + 𝒆𝑽
𝑬𝑭 + 𝒆𝑽
+ 𝜱
Elec
tro
n E
ner
gy
Tip
Sample
Empty States
Filled States
Tip
Sample
V
e-

10
The above described 𝐼-𝑉 measurements are significantly different during inelastic tunneling.
If a molecule is placed between the tip and the sample, then it is quite likely that the tunneling
electron will absorb or emit a vibrational quantum as it interacts with the molecule [7, 16, 17]. In
order for the electron to gain energy, the molecule must relax from an excited vibrational state to
a lower excited state (or to the ground state). This requires that the molecule was already excited
by thermal or other means. However, since the measurements are taken with a low-temperature
(4.2 K) STM, it is unlikely that the molecule is thermally excited. Therefore, the dominant
inelastic tunneling process is one in which an electron loses energy.
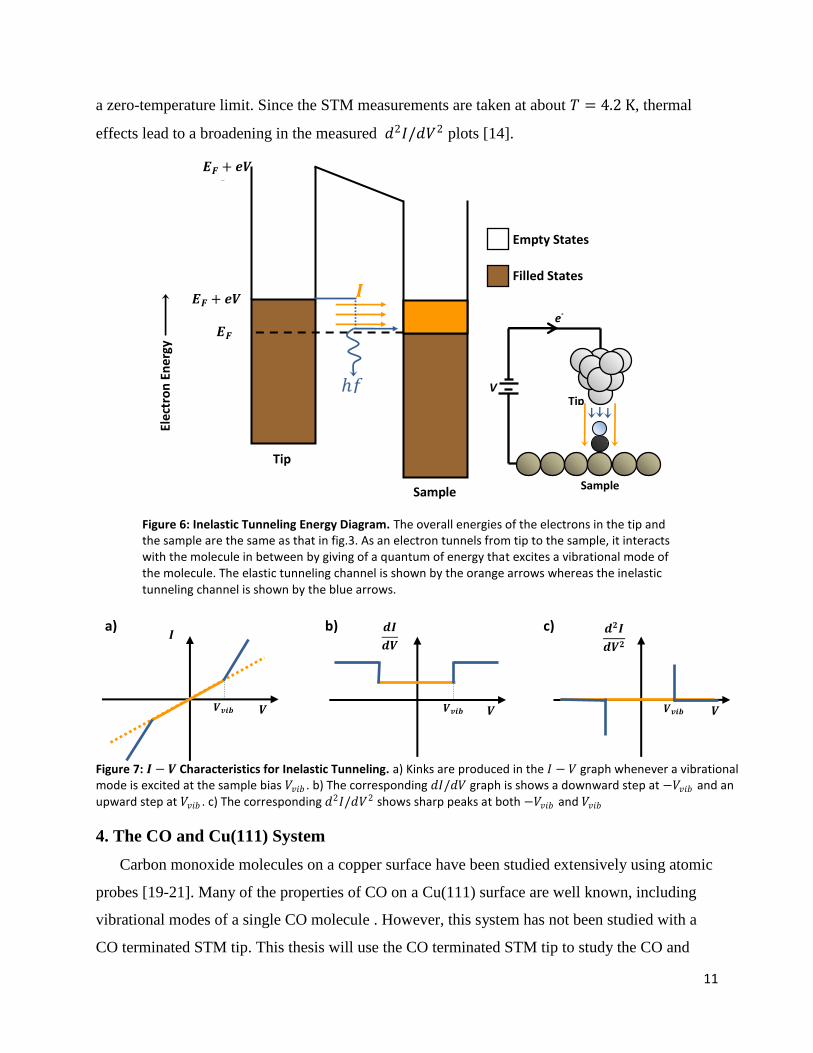
This is illustrated in the electron-energy diagram in Figure 6. As the electron tunnels from the
tip into the sample, it interacts with the molecule in between, exciting the molecule from its
ground state to an excited vibrational state with frequency 𝑓. Thus, the electron loses a quantum
of energy (𝑓). The presence of a molecule between the tip and the sample opens up another
tunneling channel increasing the probability that an electron will be able to go from the tip to the
sample [18].
Therefore, whenever a vibrational mode is excited (electron energy, 𝑒𝑉 > vibrational energy
𝑒𝑉𝑣𝑖𝑏 ), the current increases, producing a kink in the 𝐼-𝑉 graph (Figure 7). This causes a
significant change in the first and second derivatives of current when compared with the case of
elastic tunneling (Figure 5). In particular, the 𝑑𝐼/𝑑𝑉 graph shows a step at 𝑉𝑣𝑖𝑏 indicating the
increase in conductance when the molecule is excited and another tunneling channel is opened.
This leads to sharp peaks in the 𝑑2𝐼/𝑑𝑉2 plot at the vibrational mode energy (Figure 7c). Thus,
precise 𝑑2𝐼/𝑑𝑉2 measurements can be used to track any changes in the vibrational mode
energies of a molecule. These measurements form the basis of this thesis. It is important to note
that fig.6 shows sharp steps in the 𝑑𝐼/𝑑𝑉 plot and sharp peaks in the 𝑑2𝐼/𝑑𝑉2 plot by assuming
Figure 5: 𝑰 − 𝑽 Characteristics for Elastic Tunneling. a) For a constant sample density of states, the 𝐼 − 𝑉 graph is a straight line through the origin. b) The corresponding 𝑑𝐼/𝑑𝑉 graph is a constant. c) The corresponding 𝑑2𝐼/𝑑𝑉2 is zero.
𝑰
𝑽
𝒅𝑰
𝒅𝑽
𝑽
𝒅𝟐𝑰
𝒅𝑽𝟐
𝑽
a)
.
b)
.
c)
11
a zero-temperature limit. Since the STM measurements are taken at about 𝑇 = 4.2 K, thermal
effects lead to a broadening in the measured 𝑑2𝐼/𝑑𝑉2 plots [14].
4. The CO and Cu(111) System
Carbon monoxide molecules on a copper surface have been studied extensively using atomic
probes [19-21]. Many of the properties of CO on a Cu(111) surface are well known, including
vibrational modes of a single CO molecule . However, this system has not been studied with a
CO terminated STM tip. This thesis will use the CO terminated STM tip to study the CO and
Figure 7: 𝑰 − 𝑽 Characteristics for Inelastic Tunneling. a) Kinks are produced in the 𝐼 − 𝑉 graph whenever a vibrational mode is excited at the sample bias 𝑉𝑣𝑖𝑏 . b) The corresponding 𝑑𝐼/𝑑𝑉 graph is shows a downward step at −𝑉𝑣𝑖𝑏 and an upward step at 𝑉𝑣𝑖𝑏 . c) The corresponding 𝑑2𝐼/𝑑𝑉2 shows sharp peaks at both −𝑉𝑣𝑖𝑏 and 𝑉𝑣𝑖𝑏
Figure 6: Inelastic Tunneling Energy Diagram. The overall energies of the electrons in the tip and the sample are the same as that in fig.3. As an electron tunnels from tip to the sample, it interacts with the molecule in between by giving of a quantum of energy that excites a vibrational mode of the molecule. The elastic tunneling channel is shown by the orange arrows whereas the inelastic tunneling channel is shown by the blue arrows.
𝑰
𝑬𝑭
𝑬𝑭 + 𝒆𝑽
𝑬𝑭 + 𝒆𝑽
+ 𝜱
Elec
tro
n E
ne
rgy
Tip
Sample
Empty States
Filled States
𝑓 Tip
Sample
V
e-
𝒅𝟐𝑰
𝒅𝑽𝟐
𝑽 𝑽𝒗𝒊𝒃 𝑽
𝑰
𝑽𝒗𝒊𝒃
𝒅𝑰
𝒅𝑽
𝑽 𝑽𝒗𝒊𝒃
a)
.
b)
.
c)

12
Cu(111) system. This system is ideal for such a study as it allows CO molecules to be positioned
anywhere on the Cu(111) lattice with atomic manipulation leading to constructed structures
(dimmers etc.) which can then be imaged using the CO terminated STM tip.
Copper has an FCC crystal structure with a lattice constant of 𝑎𝑜 = 3.60 Å at 4.2 K. The
Cu(111) surface is a hexagonal array with an inter-atomic spacing of 𝑎 = 𝑎𝑜/ 2 = 2.55 Å. The
copper sample used in the experiments in this thesis is an atomically flat surface prepared by
repeated cycles of annealing and ion-sputtering. CO molecules are then deposited onto the
surface by exposing the sample to 1 μTorr of CO gas at 20 K. Carbon monoxide is a simple
molecule with a triple bond between carbon and the oxygen atoms (Figure 8). The carbon atom
gives two electrons to the triple bond while oxygen gives four, forming a dative covalent bond.
The molecular orbitals of CO are strongly polarized towards the carbon atoms [22, 23] making
the carbon end more likely to accept electrons. This explains why all bonding to the CO occurs
towards the carbon end of the molecule.
An illustration of CO molecules on the Cu(111) surface is shown in Figure 9a. A CO
molecule bonds on top of a Cu atom with the carbon atom bonded to the Cu atom and the oxygen
atom sticking out perpendicular to the surface [23]. An STM topograph of a CO molecule on
Cu(111) is shown in Figure 9. As seen, the CO molecule is imaged as a depression in the surface
despite sticking out. A CO molecule on Cu(111) reduces the Cu electron density in its vicinity
[14] which reduces the tunneling current and causes the tip to move closer to the surface in
close-loop topography, imaging an isolated CO molecule as a depression.
Figure 8: The Carbon monoxide molecule
𝐂 ≡ 𝐎••
••

13
5. Vibrational Properties of CO on Cu(111)
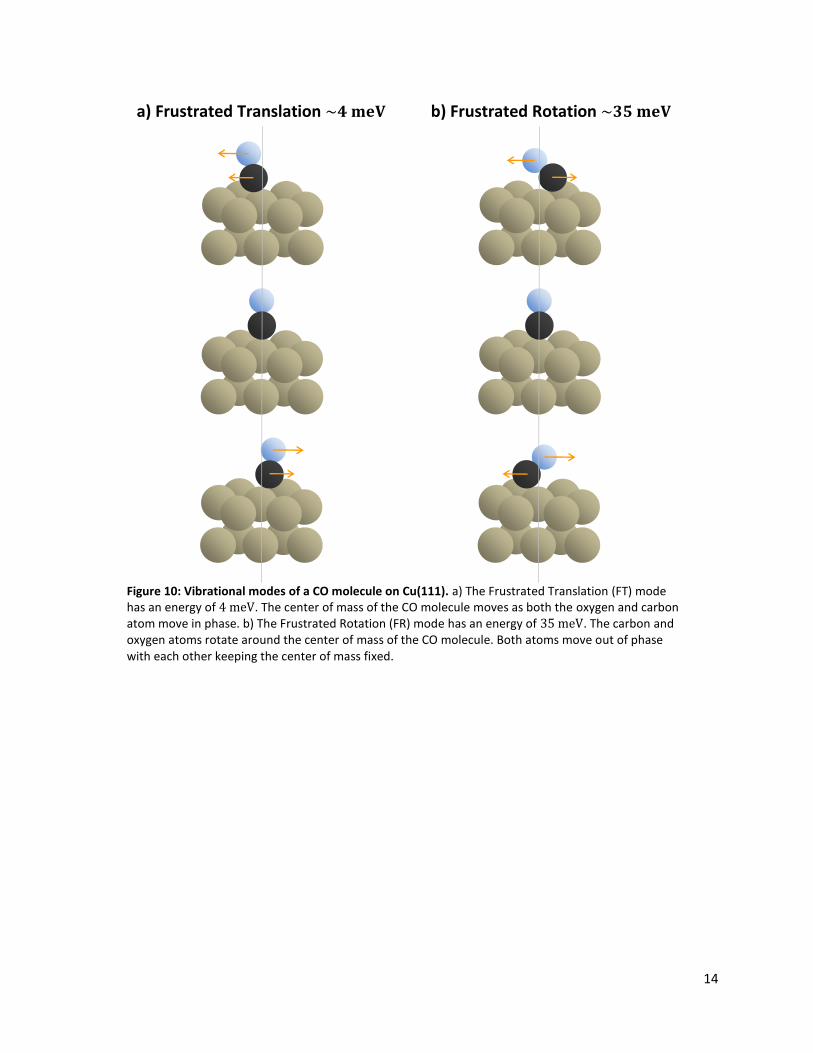
A CO molecule bound to the Cu(111) surface has 4 vibrational modes: Frustrated Translation
(FT), Frustrated Rotation (FR), CO-Cu Stretch and C-O Stretch [7]. From quantum mechanics, it
is expected that each of these modes will have a discrete energy which can be provided by the
energy of the tunneling electrons. Therefore, if the energy of the tunneling electrons (𝑒𝑉)
exceeds the energy level of a vibrational mode, that vibrational mode can be excited and
observed by the STM.
Experimentally, it is known that only the FT and the FR modes are observed by the STM
[18]. Diagrams showing the motion of the molecules in these modes are shown in Figure 10. The
energy of the FT mode is about 4 meV which corresponds to a vibrational frequency1 of ~1 THz
while the energy of the FR mode is about 35 meV (~8.5 THz). Both these THz modes have been
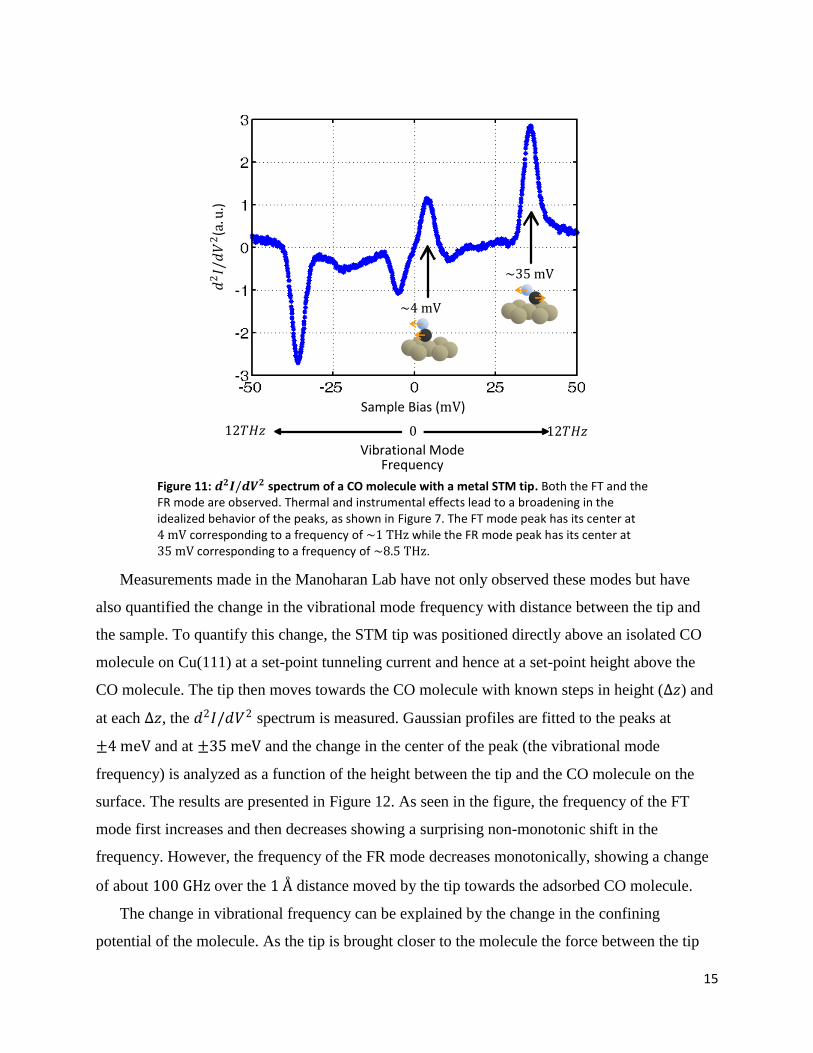
observed by the Manoharan lab using 𝑑2𝐼/𝑑𝑉2 spectroscopy (Figure 11). It is important to note
that at a temperature of 4.2 K, the thermal energy (𝑘𝐵𝑇) is quite low (0.36 meV) to excite either
of the two modes.
1 For vibrational modes of a molecule confined in a harmonic potential, 𝐸 = 𝑓
Figure 9: Adsorbed CO molecule on the Cu(111) surface. a) The CO molecule bonds to the Cu(111) surface with the carbon end bonding to a copper atom and the oxygen end sticking out perpendicular to the surface. b) Two CO molecules imaged under closed-loop conditions. The molecules are imaged as a dip as the tip moves into the sample to maintain a constant current. The dip can be clearly seen in the rendered topograph in c).
Carbon
Cu(111) Surface
Oxygen
a)
.
b)
.
c)
Å
10Å
14
Figure 10: Vibrational modes of a CO molecule on Cu(111). a) The Frustrated Translation (FT) mode has an energy of 4 meV. The center of mass of the CO molecule moves as both the oxygen and carbon atom move in phase. b) The Frustrated Rotation (FR) mode has an energy of 35 meV. The carbon and oxygen atoms rotate around the center of mass of the CO molecule. Both atoms move out of phase with each other keeping the center of mass fixed.
b) Frustrated Rotation ~𝟑𝟓 𝐦𝐞𝐕 a) Frustrated Translation ~𝟒 𝐦𝐞𝐕
15
Measurements made in the Manoharan Lab have not only observed these modes but have
also quantified the change in the vibrational mode frequency with distance between the tip and
the sample. To quantify this change, the STM tip was positioned directly above an isolated CO
molecule on Cu(111) at a set-point tunneling current and hence at a set-point height above the
CO molecule. The tip then moves towards the CO molecule with known steps in height (∆𝑧) and
at each ∆𝑧, the 𝑑2𝐼/𝑑𝑉2 spectrum is measured. Gaussian profiles are fitted to the peaks at
±4 meV and at ±35 meV and the change in the center of the peak (the vibrational mode
frequency) is analyzed as a function of the height between the tip and the CO molecule on the
surface. The results are presented in Figure 12. As seen in the figure, the frequency of the FT
mode first increases and then decreases showing a surprising non-monotonic shift in the
frequency. However, the frequency of the FR mode decreases monotonically, showing a change
of about 100 GHz over the 1 Å distance moved by the tip towards the adsorbed CO molecule.
The change in vibrational frequency can be explained by the change in the confining
potential of the molecule. As the tip is brought closer to the molecule the force between the tip
Figure 11: 𝒅𝟐𝑰/𝒅𝑽𝟐 spectrum of a CO molecule with a metal STM tip. Both the FT and the FR mode are observed. Thermal and instrumental effects lead to a broadening in the idealized behavior of the peaks, as shown in Figure 7. The FT mode peak has its center at 4 mV corresponding to a frequency of ~1 THz while the FR mode peak has its center at 35 mV corresponding to a frequency of ~8.5 THz.
Sample Bias (mV)
𝑑2𝐼/
𝑑𝑉
2(a
.u.)
12𝑇𝐻𝑧 12𝑇𝐻𝑧 0
Vibrational Mode Frequency
~4 mV
~35 mV

16
and the molecule changes. This changes the confining potential of the molecule which changes
the spacing between the quantized vibrational energy levels of the molecule (Figure 13). Thus,
by tracking the change in the frequency of the vibrational modes, the change in force between
the tip and adsorbed molecule can be tracked for THz force spectroscopy.
Figure 12: Analysis of the CO on Cu(111) Vibrational Modes as a Function of Tip-Sample Distance. a) The 𝑑2𝐼/𝑑𝑉2 spectra at different tip-sample heights are stacked up together and the peak centers (red crosses) are tracked by fitting Gaussians to the individual peaks. b) The vibrational mode frequency as a function of height for the 4 meV (1 THz) mode. As the tip moves inwards, the frequency shows a surprising non-monotonic shift. c) The vibrational mode frequency as a function of height for the 35 meV (8.5 THz) mode. The frequency decrease monotonically showing a
change of ~100 GHz over the 1 Å distance moved by the tip towards the adsorbed CO molecule.
Sample Bias (mV)
𝑑2𝐼/
𝑑𝑉
2(a
.u.)
Track modes Moving into
sample
Vibrational Mode Frequency (THz) Vibrational Mode Frequency (THz)
Dis
tan
ce t
ow
ard
s m
ole
cule
(Å
)
Dis
tan
ce t
ow
ard
s m
ole
cule
(Å
)
a)
.
b)
.
c)
1.1 Å
0 Å

17
From these observations, it can be proposed that a CO molecule attached to the end of a
metal tip will have similar vibrational modes that can be observed using IETS. Moreover, the
frequency of any given vibrational mode will depend on the interacting force between the CO
molecule attached to the tip and the sample. Therefore, IETS can be used to probe the small-
range forces between the molecule on the tip and a molecule on the surface.
6. A CO Terminated STM tip
A unique capability of the STM is to manipulate a single atom or molecule to engineer matter
at the nano-scale. This is achieved by deliberately bringing the tip close to the sample such as to
exert forces on any atoms and molecules on the surface to move them. Atomic manipulation
using an STM was first demonstrated by Eigler et.al [24] at IBM and has played a central role in
studies in the Manoharan lab [14, 18]. It has also been observed that during the scanning of a
field of CO molecules, a molecule may spontaneously jump from the surface and bond to the
STM tip, producing strikingly different images [25].
With most STM measurements, it is assumed that the STM tip is a metal atom. However, as
described above, it is possible for CO molecule to bond to the end of the tip. This can also be
achieved deliberately as was first shown by Bartels et.al [25]. The process (Figure 14) used in
this thesis to obtain a CO terminated tip is derived from the process used by Hahn et. al [26] and
involves using a high voltage bias as the tip is moved inwards towards the CO molecule:
1. Initial tip-sample bias: 𝑉 = −50 mV, Initial tunneling current: 𝐼 = 1 nA
2. Center tip over CO molecule and change tip-sample bias to 𝑉 = −2.5 V
3. Move tip inwards by 0.5 Å
Figure 13: Confining Potential of an Adsorbed Molecule. The confining potential is approximated as a simple harmonic potential with quantized energy levels (𝑓). One scenario for the change in frequency is shown above. As the tip moves inwards, the confining potential for the 35 meV changes from the green plot to the blue plot, thereby decreasing the vibrational frequency.
Energy
q
Decreasing 𝑓

18
4. Move tip outwards by 1.0 Å
5. Return to initial conditions of 𝑉 and 𝐼
If the CO molecule has been picked up by the tip, then a rescan of the area will not show the
CO molecule. Moreover, a CO molecule images quite differently with a CO terminated tip than
with a metal tip. As shown before, a metal tip images a CO molecule as a roughly Gaussian dip.
However, with a CO terminated tip, CO molecules appear as “fringed whorls” [14]. This can be
seen in Figure 15. As discussed earlier, the CO molecule bonds to Cu(111) with the carbon end
attached to a Cu atom. Therefore, the CO molecule rotates by 180° as it is picked by the STM tip.
It is interesting to note that the exact structure of a CO molecule imaged by a CO terminated tip
depends on the tip-sample bias. This indicates that above certain biases, tunneling between the
tip and the sample may be exciting vibrational modes of the CO molecule on the tip.
Figure 15: CO on Cu(111) imaged with a CO tip. Instead of imaging as a depression, the CO molecule appears as a “fringed whorl”.
Å
5Å
Figure 14: Functionalizing an STM tip with a CO molecule. There are four basic steps to attach a CO molecule to the STM tip. a) The tip is first centered over the adsorbed molecule and the
tip-sample bias is changed to −2.5 V. b) The tip is then moved inwards by 0.5 Å. c) A sudden change in current is observed as the tip picks up the CO molecule. d) The tip is moved outwards
by 1 Å and a rescan of the area is taken to confirm the molecule has been picked up
a) b) c) d)

19
7. Vibrational Properties of a CO-Terminated Tip
As noted earlier, it is expected that the CO molecule attached at the end of an STM tip will
have vibrational modes similar to the vibrational modes of a CO molecule on Cu(111). These
modes can be excited by IETS between the CO-terminated tip and a Cu(111) surface. First, the
STM Ir tip is functionalized with a CO molecule as described in Section 6. Then both the 𝑑𝐼/𝑑𝑉
and the 𝑑2𝐼/𝑑𝑉2 spectra are measured over a bare Cu(111) surface. These are shown in Figure
16. Both the spectra show vibrational modes at around ±2 meV (~0.5 THz) and around
±31 meV (~7.5 THz). These correspond to the FT and FR modes of CO on Cu(111)
respectively. Note that the energies of these two modes are slightly different than those for CO
on Cu(111). Since the CO molecule is bonded to an Ir atom at the end of a conically shaped tip
instead of being bonded to a Cu atom on atomically flat Cu(111), the confining potential is
different from before.
8. The CO tip as an AFM Cantilever
As discussed in Section 2, changing the height between an AFM cantilever and the sample
surface changes the force between the tip and the sample which in turn changes the vibrational
Figure 16: 𝒅𝟐𝑰/𝒅𝑽𝟐 spectrum of a CO molecule on the STM tip over bare Cu(111). Similar to Figure 11, both the FT and the FR mode are observed. The FT mode has a peak center at 2 mV (~0.5 THz) while the FR mode has a peak center at 31 mV (~7.5 THz).
Sample Bias (mV)
12𝑇𝐻𝑧 12𝑇𝐻𝑧 0 Vibrational Mode
Frequency
~2mV
~31mV 𝑑2𝐼/
𝑑𝑉
2(a
.u.)

20
frequency of the cantilever. The resulting frequency shift can be measured and is used to image
the underlying substrate. As shown before (Section 5), experiments in the Manoharan lab reveal
that the vibrational frequency of a CO molecule on Cu(111) depends on the height of the tip
above the CO molecule. Thus, the LT-STM in the Manoharan lab is able to observe frequency
shifts in the THz vibrational modes of CO on Cu(111). It is hypothesized that the frequency of
the THz vibrational modes of a CO molecule on the tip will also depend on the height between
the tip and the sample. If the resulting frequency shifts can be measured for small changes in the
tip height, then the CO terminated tip can effectively be used as an AFM cantilever to probe
short-range chemical forces that excite vibrational modes in the THz regime rather than in the
kHz regime. This can allow the hybrid AFM/STM system to measure force gradients several
orders of magnitude lower than what is possible using current AFM systems.
To test this hypothesis, the CO-terminated STM tip is positioned above a bare, atomically flat
Cu(111) surface. The 𝑑2𝐼/𝑑𝑉2 spectrum is measured at a setpoint current and voltage. The tip is
then moved inwards with known steps in height (∆𝑧) and at each ∆𝑧, the 𝑑2𝐼/𝑑𝑉2 spectrum is
measured. The centers of the peaks at ±4 meV and at ±35 meV are determined by fitting
Gaussian profiles to the spectra. The vibrational mode energies/frequencies are then analyzed as
a function of height. The results are presented in Figure 17. As seen in the figure, the frequency
of the FT mode decreases by about 0.3 THz as the tip moves towards the sample by 1 Å. On the
other hand the frequency of the frequency of the FR mode first decreases and then increases
showing a maximum change of 0.6 THz.
As discussed in Section 2, the minimum force gradient measured by an AFM goes as 1/𝑓𝑜 .
Since current AFM cantilevers operate in the KHz regime, the ability to probe changes in the
THz vibrational modes of a single molecule opens up the possibility of measuring extremely
short-range forces. As shown before, the minimum force gradient resolved by current AFM’s is
to the order of 10 pn/nm. The results in this section prove that STM IETS provides a useful
technique to use a single molecule as an AFM cantilever to probe force gradients several orders
of magnitude smaller (~10−6 pn/nm) than what is currently possible.

21
9. CO-STM Tip Line Scan over a CO Molecule
So far, the work in this thesis has studied the vibrational frequency of a CO functionalized
STM tip with the tip being positioned over an atomically flat bare Cu(111) surface. For a Cu(111)
surface, it is hard to image individual atoms within the metal lattice; making it difficult to
position the tip directly above a single atom. Also, since the Cu(111) was flat, the STM tip had to
Figure 17: Analysis of the Vibrational Modes of a CO-terminated STM tip as a function of the Tip-Sample Distance. a) The 𝑑2𝐼/𝑑𝑉2 spectra at different tip-sample heights are stacked up together and the peak centers (red crosses) are tracked by fitting Gaussians to the individual peaks. b) The vibrational mode frequency as a function of height for the 2 meV (0.5 THz)
mode. As the tip moves inwards, the frequency decreases by about 0.3 THz over the 1 Å distance moved by the tip towards the CO molecule. c) The vibrational mode frequency as a function of height for the 31 meV (7.5 THz) mode. The frequency
first decreases and then increases showing a maximum change of ~0.6 THz over the 1 Å distance moved by the tip.
Vibrational Mode Frequency (THz) Vibrational Mode Frequency (THz)
Dis
tan
ce t
ow
ard
s m
ole
cule
(Å
)
Dis
tan
ce t
ow
ard
s m
ole
cule
(Å
)
Sample Bias (mV)
𝑑2𝐼/
𝑑𝑉
2(a
.u.)
Track modes Moving into sample
a)
.
b)
. c)
1 Å
0 Å
22
be brought inwards to the sample with known step sizes in order to study the frequency shift with
height. During this process, the STM tip was above the same point on the Cu(111) surface.
Ideally, the CO functionalized tip should be able to scan across a surface and be able to detect
the change in surface topography by changing the vibrational frequency of the CO molecule on
the tip. Notice that similar to AFM imaging, as the surface topography changes, the force
between the CO functionalized tip and the sample changes which in turn changes the vibrational
frequency of the CO molecule on the tip. In this way, the CO molecule at the end of an STM tip
can be made to behave as an AFM cantilever with a mass of the simplest organic molecule and a
vibrational frequency in the THz regime.
To achieve this, the STM tip is functionalized with a CO molecule and an “open loop line cut”
is taken over an adsorbed CO molecule on Cu(111). For the “open loop line cut”, the CO
functionalized tip is first positioned over the center of an adsorbed CO molecule on Cu(111)
using atom locking techniques2. The 𝑑2𝐼/𝑑𝑉2 spectrum is obtained at the center. With an open
feedback loop3, the tip is then moved radially outwards from the center in steps of 𝑑𝑟 with the
𝑑2𝐼/𝑑𝑉2 spectrum taken at each step. In this way the evolution of the 𝑑2𝐼/𝑑𝑉2 spectra can be
traced as a function of 𝑟, the radial distance from the center of the adsorbed CO molecule (Figure
18).
The most interesting observation in Figure 18 is a peak at a sample bias of ~10 mV. This
mode has not been observed before and corresponds to a vibrational frequency of ~2.4 THz. As
seen in the figure, the peak center (i.e. the frequency) of the novel mode decreases as the tip
moves outwards from the center of the molecule and eventually the mode disappears completely.
The novel mode can be clearly seen in the 𝑑2𝐼/𝑑𝑉2 spectrum taken over the center of the CO
molecule (Figure 19a). In contrast, the novel mode is missing for the spectrum taken at a point at
the edge of the adsorbed CO molecule. (Figure 19b). This suggests that the novel mode is most
likely due to coupling between the CO molecule on the tip and the CO molecule on the surface.
This novel mode could be due to a specific interaction between two CO molecules and warrants
more theoretical work.
2 This consists of finding the local minimum in the value of the tunneling current in a small region surrounding the
rough center of the CO molecule. Since the CO molecule is imaged as a dip, the local minimum. 3 An open feedback loop moves the STM tip radially outwards at a constant tip-sample height.

23
Figure 19: 𝒅𝟐𝑰/𝒅𝑽𝟐 spectrum of a CO molecule on Cu(111) with a CO STM Tip. a) Spectrum taken at the center of the CO molecule (marked by the red cross in inset figure). The spectrum shows a three vibrational modes, the FT mode, the FR mode and a novel vibrational mode at 10 mV. b) Spectrum taken at the edge of the CO molecule (red cross in inset). Spectrum shows only the FT and the FR mode. This suggests that the novel 10 meV mode is likely due to a coupling between the two CO molecules.
Sample Bias (mV) Sample Bias (mV)
𝑑2𝐼/
𝑑𝑉
2(a
.u.)
𝑑2𝐼/
𝑑𝑉
2(a
.u.)
~2mV
~34mV ~10mV
~3mV
~32mV
b)
.
a)
.
Figure 18: Evolution of the 𝒅𝟐𝑰/𝒅𝑽𝟐 spectra of a CO molecule with a CO STM Tip. The tip is positioned above the center of a CO molecule (inset) and moved radially outwards at a constant tip-sample height in steps of 𝑑𝑟 =
0.25 Å for a total distance of 5 Å. At each step the 𝑑2𝐼/𝑑𝑉2 spectrum is obtained. The spectra at each 𝑟 are plotted on the color plot in which the red/yellow shades correspond to a vibrational mode. The frequency of the 31 mV mode decreases as the tip is moved outwards. A novel mode is observed at 10 mV which transitions into the 4 mV mode as the tip moves away from the center of the CO molecule.
5Å
Sample Bias (mV)
𝑑2𝐼/
𝑑𝑉
2(a
.u.)
𝒓
Moving away from center
0 Å
5 Å
24
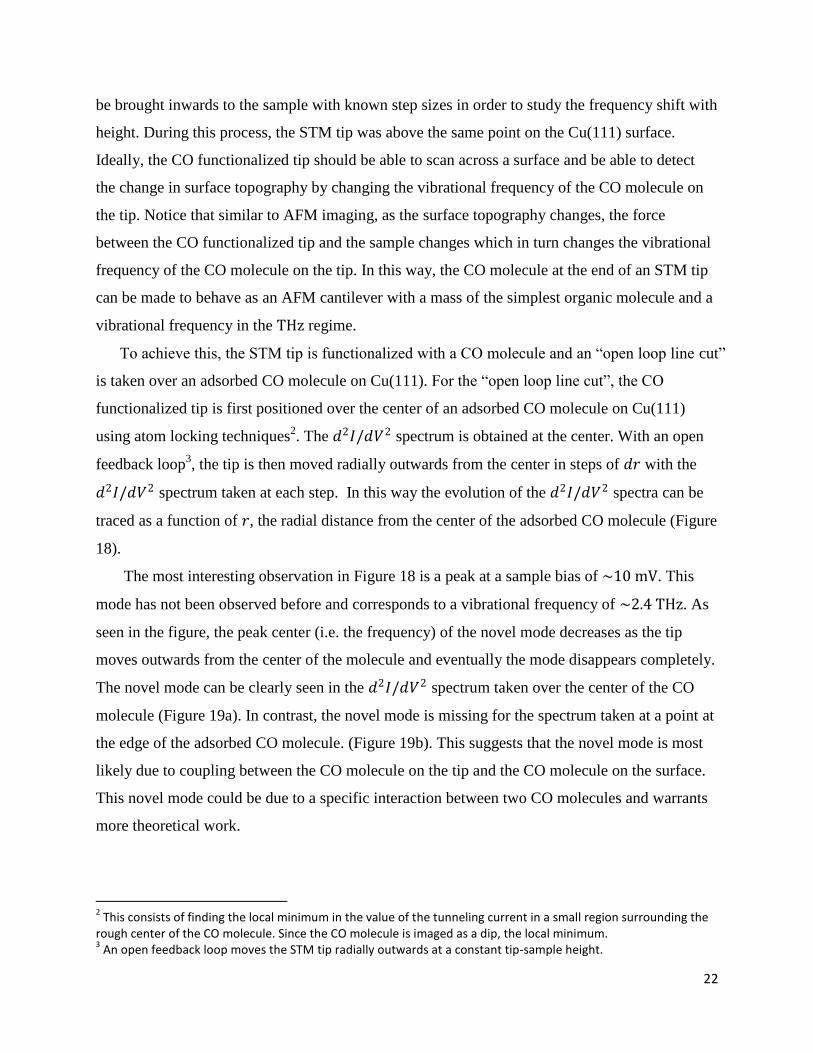
As seen in the Figure 18, the peak center (i.e. the frequency) of the FR mode decreases as the
tip moves outwards. To quantify this change, Gaussian curves are fitted to the peaks at
~ ± 33 mV and the shift in vibrational mode frequency is plotted as a function of 𝑟 (Figure 20).
As the tip moves outwards, the distance between the tip and the sample increases, decreasing the
vibrational frequency. This behavior is different from the one observed in Figure 17c. For the
spectrum over bare Cu(111), the vibrational frequency of the CO molecule on the tip for the FR
mode first decreased and then increased as the tip moved inwards to the sample. However, for
the spectrum over bare Cu(111), the vibrational frequency decreases as the tip moves radially
outwards.
10. Conclusion
In summary, the experiments in this thesis have, first, mapped out shifts in the THz
vibrational modes of a single CO molecule on Cu(111) demonstrating the ability of the STM to
measure changes in vibrational frequency. Second, the experiments have tracked shifts in the
THz vibrational modes of a single CO molecule attached to the end of the STM tip showing the
possibility of using this CO-STM tip as an AFM cantilever with THz frequency. Third, the line
scan over an adsorbed CO molecule reveals a novel 10 meV mode which is likely due to a
specific interaction between two CO molecules and warrants theoretical study. Lastly, the line
Figure 20: Vibrational Frequency of the FR Mode as a function of 𝒓 for CO-CO Interaction. The vibrational frequency decreases by about 0.5 THz as the tip moves radially outwards from the center of the CO molecule at a constant tip-sample height
Vib
rati
on
al M
od
e Fr
equ
ency
(T
Hz)
Radial distance from the center, 𝑟 (Å)
𝒓

25
scan shows the ability of the STM to track the vibrational frequencies of a CO molecule on STM
tip as it moves across a surface.
Overall the results serve as a proof-of principle of realizing a hybrid AFM/STM system in
which a single molecule acts as an AFM cantilever with THz vibration and STM inelastic
spectroscopy is used to detect changes in vibrational frequency.
11. Future Work & Challenges
In the short-run, the most useful approach would be to apply Density Functional Theory
(DFT) to inelastic-tunneling between a CO-STM tip and the Cu(111) surface. DFT calculations
can already accurately predict the vibrational frequencies of a CO molecule on the Cu(111)
surface with STM in-elastic tunneling. This calculation needs to be reversed with the CO
molecule on the STM tip and the frequencies calculated as a function of the tip-sample distance.
Moreover, DFT calculations should also be applied to study the novel 10 meV mode observed
with tunneling from a CO-STM tip to an adsorbed CO molecule. However, there are known
issues with DFT describing Van der Waal and molecular interactions [27], limiting an accurate
theoretical description of the novel 10 meV mode.
Another short-term goal should be to accurately predict the tip-sample force from these
frequency shifts. An approach that has been considered is to treat the CO molecule on the STM
tip as a classical harmonic oscillator similar to an AFM cantilever. Then the force as a function
of 𝑧 can be found by integrating the force gradient (eq.1) over the range the tip moves inwards to
the sample in the experiment described in section 8. The main difficulty is finding 𝑘, the
effective spring constant of the CO molecule. As 𝑘 is given by 𝑚𝑒𝑓𝑓 𝜔𝑜2, an approximate
expression for force is:
𝐹(𝑧) = −4𝜋𝑓𝑜 𝑚𝑒𝑓𝑓 ∆𝑓(𝑧′)𝑑𝑧′𝑧
𝑧𝑜
(12)
Here 𝑚𝑒𝑓𝑓 is the effective mass of the molecule due to the confining potential. Since the
confining potential for the CO molecule on the tip has not been studied theoretically, it is
difficult to solve for 𝑘. However, it is known that 𝑚𝑒𝑓𝑓 will be different for each of the two
vibrational modes (FT and FR) and in general will be smaller than the mass of a free CO
molecule (28𝑢). Thus, eq.11 is used along with the data in fig.17 to calculate an approximate
upper limit on the force function. This gives a force change of about 0.18pN over the 1 Å
distance moved by the tip towards the sample. While this is a rough calculation, it is much less

26
than the force required to move a CO molecule on a Cu(111) surface using the STM tip
(~160 pN) as measured by Ternes M. et al. in [21]. Since the force between the CO-STM tip and
a Cu(111) surface should be substantially less than the force required to move an atom on the
surface, even this rough estimation indicates that the CO-STM tip can be capable of resolving
extremely small forces.
Another goal of the CO-STM tip is to image complex structures. Experiments in section 9
described the ability of the CO-STM tip to measure the 𝑑2𝐼/𝑑𝑉2 spectrum as the tip is moved
radially outwards during “open loop spectroscopy”. For the CO-STM tip to image structures
similar to an AFM cantilever, this process must be carried out over a 2D surface in an “open loop
spectral map”. The peak centers are then determined to find the frequency of the CO molecule at
each point (𝑥, 𝑦) on the surface. The resulting frequency shifts ∆𝑓(𝑥, 𝑦) give a map of the surface
topography. However, since the spectral map takes a substantial amount of time, a major
challenge is controlling the drift of the STM tip. During “open loop spectroscopy’, since the
feedback loop is open, the STM does not adjust the tip-sample distance to keep the tip within the
tunneling regime. This can cause the tip to either crash into the sample or move away from
tunneling in addition to preventing a constant tip-sample distance. The time for the spectral map
depends on the number of points (𝑥, 𝑦) at which the spectrum is measured, averaging during each
spectrum measurement and the lock-in time constant. As a start, to avoid drift a “closed loop
spectral map” was taken using a CO-STM tip over adsorbed CO molecules. Because of problems
with the lock-in amplifier the results have not been discussed before. However, a brief analysis is
presented in Appendix 1 to help future measurements.
Once the measurement settings for the spectral map have been optimized, an ideal system to
study would be CO dimmers and trimers on Cu(111). In general CO molecules do not bond to
one another. When two CO molecules are placed on neighboring sites on the Cu(111) lattice, the
STM images a raised bump between the two CO “dips”. This is called a CO dimer. A similar
behavior is observed at the center of three CO molecules on nearest neighboring sites on the
triangular Cu(111) lattice (CO trimer). Since the “bump” observed is due to the STM imaging
electron density of states, by using a CO-STM tip additional structure for a CO dimer or trimer
may be revealed. Another long term goal is to take a 4D data set over constructed structures such
as dimmers or trimers in which the frequency shift map is measured at different tip-sample
heights. In this way ∆𝑓 can be obtained as a function of (𝑥, 𝑦, 𝑧). By connecting points of

27
constant ∆𝑓, 3D objects can be constructed revealing structures localized around the relevant
bonds between the tip and the sample. In this way, STM measurements can be extended into the
third dimension. Lastly, this measurement technique can also be used to image complex
adsorbed molecules (such as pentacene) to reveal the molecule’s chemical structure.
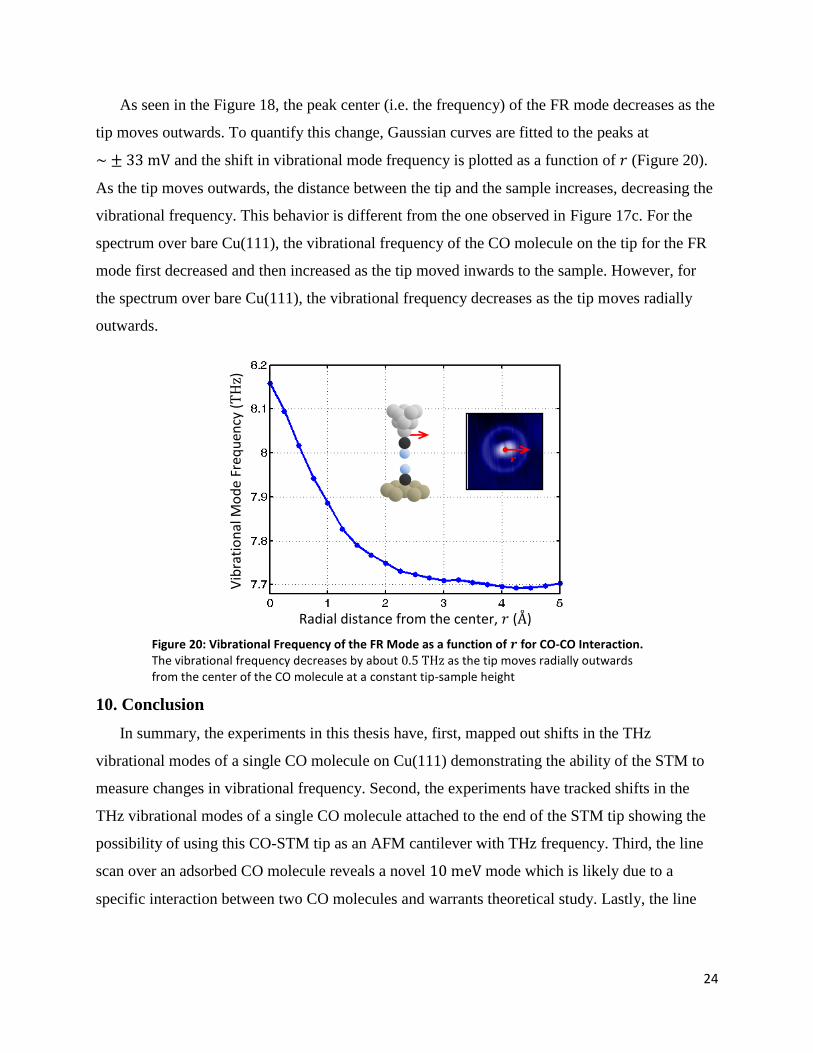
Appendix 1: CO-STM Tip Spectral Map over Adsorbed CO Molecules.
In order to help with future measurements, the results for a “closed loop spectral map” are
presented below. The CO-STM tip is used to take a spectral map over a (30 Å x 30 Å) region on
a Cu(111) surface with adsorbed CO molecules. The topograph before the measurement is shown
in Figure 21a. The region contains roughly three CO molecules and they are imaged as a
corrugation using the CO-STM tip. The CO-STM tip is then moved across the topograph line by
line taking the 𝑑2𝐼/𝑑𝑉2 spectrum at each point with the feedback loop closed. To save time, the
spectrum is only taken around the FR mode (𝑉 is varied from 25 mV to 40 mV). Overall, the
𝑑2𝐼/𝑑𝑉2 spectrum is measured at 51 x 51 points. Each spectrum (with averaging) takes about
20 s, giving a total run time of about 14 hrs. The lock-in measuring 𝑑2𝐼/𝑑𝑉2 had a sensitivity
of 3 mV and a time-constant of 30 ms.
Figure 21b shows the simultaneous topograph of the region as the spectral map is being taken.
Since this is a “closed loop spectral map”, the change in the tip-sample distance (𝑧) is also
measured as the spectral map is taken. This gives a simultaneous topograph of the region. As
seen in the figure, the z-values are clearly not calibrated properly. Moreover, the simultaneous
topograph shows that one of the CO molecules moved during the measurement making it
difficult to properly image it.
Once the spectral map is obtained, Gaussian peaks are fitted to the spectra and the peak
centers are determined to obtain the vibrational frequencies for the FR mode. The frequency
shifts are then plotted at each (𝑥, 𝑦) to obtain a map of the surface (Figure 21c). As seen, the
frequency map corresponds quite well to the both the topographs, confirming the possibility of
using frequency shifts in the CO-STM tip to image surfaces.
28
Acknowledgments
I would first like to thank Professor Manoharan for his tremendous support and guidance
throughout my undergraduate career. Secondly, I thank Professor Moler for making Quantum
Mechanics understandable! I also owe a lot to Warren Mar who inspired the ideas behind this
project and helped me to understand the workings of the LT-STM (Mota). Wonhee Ko helped
me throughout the summer as we worked on the room-temperature STM “mini-mota”. That
project gave me the necessary background to work on this thesis. I would also like to thank
Kenjiro Gomes for teaching me a number of tricks in MATLAB.
Å Å
GHz
b) Simultaneous Topograph a) Topograph after Spectral Map
c) Image using Frequency Shifts
CO moved during scan
30 Å
Figure 21: CO-STM Tip Spectral Map over Adsorbed Molecules. a) STM topograph of the region with the CO molecule on tip. This is taken after the spectral map. b) Simultaneous topograph of the region using the z-position of the tip during “closed loop spectroscopy”. c) Image of the region by plotting ∆𝑓 at each (𝑥, 𝑦).
29
References
1. Giessibl, F.J. and C.F. Quate, Exploring the Nanoworld with Atomic Force Microscopy.
Physics Today, 2006. 59(12): p. 44.
2. Toumey, C., 35 atoms that changed the nanoworld. Nat Nano. 5(4): p. 239.
3. Weiss, P.S. and D.M. Eigler, Site dependence of the apparent shape of a molecule in
scanning tunneling micoscope images: Benzene on Pt{111}. Physical Review Letters, 1993.
71(19): p. 3139.
4. Gross, L., et al., The Chemical Structure of a Molecule Resolved by Atomic Force
Microscopy. Science, 2009. 325(5944): p. 1110.
5. Sandler, U. and A. Wyler, Phase transitions in fiber materials. Physical Review B, 2000.
61(1): p. 16.
6. Kawakatsu, H., et al., High-Frequency Low Amplitude Atomic Force Microscopy, in
Noncontact Atomic Force Microscopy. 2009. p. 347.
7. Persson, M., Theory of Elastic and Inelastic Tunnelling Microscopy and Spectroscopy: CO
on Cu Revisited. Philosophical Transactions: Mathematical, Physical and Engineering
Sciences, 2004. 362(1819): p. 1173.
8. Binnig, G., C.F. Quate, and C. Gerber, Atomic Force Microscope. Physical Review Letters,
1986. 56(9): p. 930.
9. Giessibl, F.J., Advances in atomic force microscopy. Reviews of Modern Physics, 2003.
75(3): p. 949.
10. Kawakatsu, H., et al., Towards atomic force microscopy up to 100 MHz. Review of Scientific
Instruments, 2002. 73(6): p. 2317.
11. Binnig, G., et al., Tunneling through a controllable vacuum gap. Applied Physics Letters,
1982. 40(2): p. 178.
12. Bardeen, J., Tunnelling from a Many-Particle Point of View. Physical Review Letters, 1961.
6(2): p. 57.
13. Tersoff, J. and D.R. Hamann, Theory of the scanning tunneling microscope. Physical Review
B, 1985. 31(2): p. 805.
14. Moon, C., Designing electron wave functions in assembled nanostructures, in Physics. 2009,
Stanford University: Stanford. p. 304.
15. Persson, B.N.J. and A. Baratoff, Inelastic electron tunneling from a metal tip: The
contribution from resonant processes. Physical Review Letters, 1987. 59(3): p. 339.
30
16. Persson, B.N.J. and H. Ueba, Theory of inelastic tunneling induced motion of adsorbates on
metal surfaces. Surface Science, 2002. 502-503: p. 18.
17. Stipe, B.C., M.A. Rezaei, and W. Ho, Single-Molecule Vibrational Spectroscopy and
Microscopy. Science, 1998. 280(5370): p. 1732-1735.
18. Foster, B.K., Carbon isotope controlled molecular switches, in Physics. 2009, Stanford
University: Stanford. p. 117.
19. Heinrich, A.J., et al., Molecule Cascades. Science, 2002. 298(5597): p. 1381-1387.
20. Lauhon, L.J. and W. Ho, Single-molecule vibrational spectroscopy and microscopy: CO on
Cu(001) and Cu(110). Physical Review B, 1999. 60(12): p. R8525.
21. Ternes, M., et al., The Force Needed to Move an Atom on a Surface. Science, 2008.
319(5866): p. 1066-1069.
22. Fohlisch, A., et al., The bonding of CO to metal surfaces. The Journal of Chemical Physics,
2000. 112(4): p. 1946.
23. Föhlisch, A., et al., How Carbon Monoxide Adsorbs in Different Sites. Physical Review
Letters, 2000. 85(15): p. 3309.
24. Eigler, D.M. and E.K. Schweizer, Positioning single atoms with a scanning tunnelling
microscope. Nature, 1990. 344(6266): p. 524.
25. Bartels, L., G. Meyer, and K.H. Rieder, Controlled vertical manipulation of single CO
molecules with the scanning tunneling microscope: A route to chemical contrast. Applied
Physics Letters, 1997. 71(2): p. 213.
26. Hahn, J.R. and W. Ho, Single Molecule Imaging and Vibrational Spectroscopy with a
Chemically Modified Tip of a Scanning Tunneling Microscope. Phys.Rev.Lett., 2001. 87(19):
p. 196102.
27. David S. Sholl, J.A.S., Density Functional Theory - A Practical Introduction. 2009, New
Jersey: John Wiley & Sons.