single-molecule fluorescence in situ hybridization (smfish ... · pbsm buffer (see recipes) 35....
TRANSCRIPT

Copyright © 2018 The Authors; exclusive licensee Bio-protocol LLC. 1
www.bio-protocol.org/e3070 Vol 8, Iss 21, Nov 05, 2018
DOI:10.21769/BioProtoc.3070
55555111112000
Single-molecule Fluorescence in situ Hybridization (smFISH) for
RNA Detection in Adherent Animal Cells
Gal Haimovich* and Jeffrey E. Gerst
Dept. of Molecular Genetics, Weizmann Institute of Science, Rehovot 7610001, Israel
*For correspondence: [email protected]
[Abstract] Transcription and RNA decay play critical roles in the process of gene expression and the
ability to accurately measure cellular mRNA levels is essential for understanding this regulation. Here,
we describe a single-molecule fluorescent in situ hybridization (smFISH) method (as performed in
Haimovich et al., 2017) that detects single RNA molecules in individual cells. This technique employs
multiple single-stranded, fluorescent labeled, short DNA probes that hybridize to target RNAs in fixed
cells, allowing for both the quantification and localization of cytoplasmic and nuclear RNAs at the single-
cell level and single-molecule resolution. Analyzing smFISH data provides absolute quantitative data of
the number of cytoplasmic (“mature”) mRNAs, the number of nascent RNA molecules at distinct
transcription sites, and the spatial localization of these RNAs in the cytoplasm and/or nucleoplasm.
Keywords: mRNA, Transcription, Fluorescence in situ hybridization, Single molecule resolution,
Fluorescence microscopy, Adherent cells
[Background] Regulation of gene expression is one of the key determinants of cell fate and behavior.
A major parameter of gene expression is mRNA level, which is determined by the rates of transcription
and degradation. Therefore, measuring mRNA levels, as well as transcription and decay rates for
particular transcripts (or all transcripts) has been the focus of numerous research projects.
Common molecular biology techniques, such as reverse transcription-PCR (RT-PCR), Northern blot
analysis or RNA sequencing (RNA-Seq), typically require RNA extraction from the entire cell population.
However, the results provide only a relative measure of mRNA content for the entire cell population, with
a loss of single cell information. Single-cell RNA-Seq can provide more insight on the cell-to-cell
variability of transcript levels. However, the current lower limit of detection is ~10 molecules/cell for a
given RNA transcript (Svensson et al., 2017). RNA localization studies have shown that the spatial
distribution of RNA in the cell can play a pivotal role in its function (Buxbaum et al., 2015), but the above-
described methods lose that information in the process.
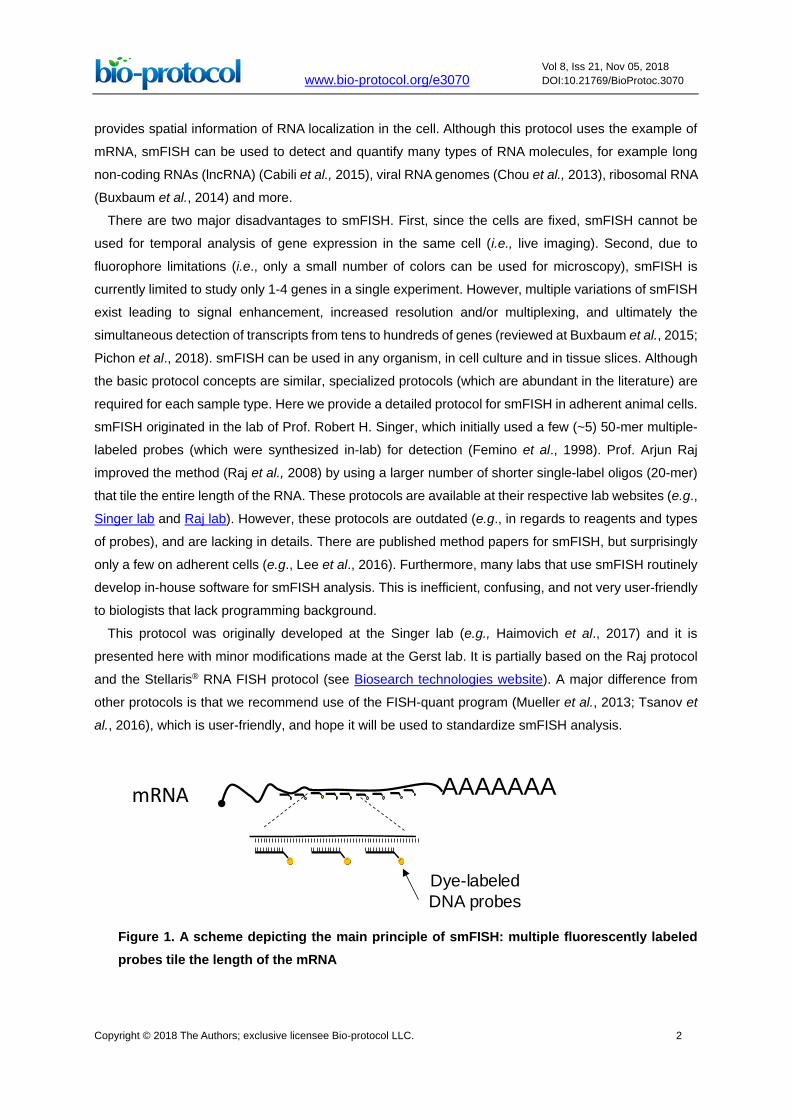
Single-molecule Fluorescence in situ Hybridization (smFISH) overcomes these limitations. In this
method, the cells are first fixed and permeabilized. Then the cells are hybridized with a set of probes
consisting of multiple short fluorescently labeled DNA oligonucleotides, which tile the length of the mRNA
(Figure 1). The multiplicity of probes on a single RNA molecule increases the signal-to-noise ratio and
allows for their detection by microscopy as diffraction-limited spots of similar intensity and dimensions.
A 3D Gaussian fitting algorithm is used in image analysis tools to detect the spots in the images. smFISH
can detect as little as a single RNA molecule and as much as several thousands. Importantly, smFISH
Copyright © 2018 The Authors; exclusive licensee Bio-protocol LLC. 2
www.bio-protocol.org/e3070 Vol 8, Iss 21, Nov 05, 2018
DOI:10.21769/BioProtoc.3070
55555111112000
provides spatial information of RNA localization in the cell. Although this protocol uses the example of
mRNA, smFISH can be used to detect and quantify many types of RNA molecules, for example long
non-coding RNAs (lncRNA) (Cabili et al., 2015), viral RNA genomes (Chou et al., 2013), ribosomal RNA
(Buxbaum et al., 2014) and more.
There are two major disadvantages to smFISH. First, since the cells are fixed, smFISH cannot be
used for temporal analysis of gene expression in the same cell (i.e., live imaging). Second, due to
fluorophore limitations (i.e., only a small number of colors can be used for microscopy), smFISH is
currently limited to study only 1-4 genes in a single experiment. However, multiple variations of smFISH
exist leading to signal enhancement, increased resolution and/or multiplexing, and ultimately the
simultaneous detection of transcripts from tens to hundreds of genes (reviewed at Buxbaum et al., 2015;
Pichon et al., 2018). smFISH can be used in any organism, in cell culture and in tissue slices. Although
the basic protocol concepts are similar, specialized protocols (which are abundant in the literature) are
required for each sample type. Here we provide a detailed protocol for smFISH in adherent animal cells.
smFISH originated in the lab of Prof. Robert H. Singer, which initially used a few (~5) 50-mer multiple-
labeled probes (which were synthesized in-lab) for detection (Femino et al., 1998). Prof. Arjun Raj
improved the method (Raj et al., 2008) by using a larger number of shorter single-label oligos (20-mer)
that tile the entire length of the RNA. These protocols are available at their respective lab websites (e.g.,
Singer lab and Raj lab). However, these protocols are outdated (e.g., in regards to reagents and types
of probes), and are lacking in details. There are published method papers for smFISH, but surprisingly
only a few on adherent cells (e.g., Lee et al., 2016). Furthermore, many labs that use smFISH routinely
develop in-house software for smFISH analysis. This is inefficient, confusing, and not very user-friendly
to biologists that lack programming background.
This protocol was originally developed at the Singer lab (e.g., Haimovich et al., 2017) and it is
presented here with minor modifications made at the Gerst lab. It is partially based on the Raj protocol
and the Stellaris® RNA FISH protocol (see Biosearch technologies website). A major difference from
other protocols is that we recommend use of the FISH-quant program (Mueller et al., 2013; Tsanov et
al., 2016), which is user-friendly, and hope it will be used to standardize smFISH analysis.
Figure 1. A scheme depicting the main principle of smFISH: multiple fluorescently labeled
probes tile the length of the mRNA
AAAAAAA
Dye-labeled
DNA probes
mRNA

Copyright © 2018 The Authors; exclusive licensee Bio-protocol LLC. 3
www.bio-protocol.org/e3070 Vol 8, Iss 21, Nov 05, 2018
DOI:10.21769/BioProtoc.3070
55555111112000
Materials and Reagents
1. Pipette tips
2. Microscope Glass slides 25 x 75 mm x 1 mm thick (e.g., Thermo Scientific, catalog number:
421-004T or equivalent)
3. Glass coverslips, round, 18 mm, #1 (e.g., Thermo Scientific, catalog numbers: 11709875 or
equivalent)
4. 1.7 ml plastic tubes
5. 15 ml plastic tubes
6. Nuclease-free Barrier tips (10 µl, 200 µl, 1,000 µl)
7. Hybridization chamber (e.g., closed plastic box, 15 cm tissue culture dish, Petri dish)
8. Parafilm (Bemis, catalog number: PM996)
9. Kimwipes (e.g., KCWW, Kimberly-Clark, catalog number: 34120 or equivalent)
10. 12-well plates (e.g., Costar, catalog number: 3513 or equivalent)
11. Aluminum foil
12. Adherent cells of interest (e.g., mouse embryonic fibroblasts [MEFs], Gastric carcinoma NCI-
N87 cells)
13. Suitable culture media and supplements (e.g., DMEM supplemented with 10% FBS and
penicillin/streptavidin)
14. (Optional) Extracellular matrix substrate, e.g., Fibronectin (Sigma-Aldrich, catalog number:
F1141-5mg)
15. 70% ethanol
16. Sterile PBS x1 pH 7.4, no calcium, no magnesium (e.g., Thermo Fisher Scientific, GibcoTM,
catalog number: 10010-015 or equivalent)
17. 10x PBS, no calcium, no magnesium (e.g., Thermo Fisher Scientific, GibcoTM, catalog number:
14200-067 or equivalent)
18. MgCl2 (e.g., Sigma-Aldrich, catalog number: M8266-100G or equivalent)
19. Glycine (e.g., Sigma-Aldrich, catalog number: G8898-500G or equivalent)
20. 32% paraformaldehyde (PFA) (Electron Microscopy Sciences)
21. Surfact-AmpsTM X-100 (Triton X-100) 10% solution (Thermo Scientific, catalog number: 28314)
Note: This high-purity Triton X-100 gives the best results, but other Triton X-100 products will
provide satisfactory results.
22. 20x Saline-sodium citrate (SSC) buffer (e.g., Sigma-Aldrich, catalog number: S6639-1L or
equivalent)
23. Formamide (Sigma-Aldrich, catalog number: 47671-250ml or equivalent) (keep at 4 °C)
24. Dextran sulfate (Sigma-Aldrich, catalog number: D6001 or equivalent)
25. E. coli tRNA (100 mg) (Roche, catalog number: 10109541001) (keep at -20 °C)
26. Bovine serum albumin (BSA) (20 mg/ml) (Roche, catalog number: 10711454001) (keep at
-20 °C)

Copyright © 2018 The Authors; exclusive licensee Bio-protocol LLC. 4
www.bio-protocol.org/e3070 Vol 8, Iss 21, Nov 05, 2018
DOI:10.21769/BioProtoc.3070
55555111112000
27. Vanadyl ribonucleoside complex (VRC) 200 mM (e.g., Sigma-Aldrich, catalog number: 94742-
1 ml or equivalent) (keep at -20 °C)
28. Nuclease-free water
29. DAPI (nuclear stain) (e.g., Sigma-Aldrich, catalog number: D9542-1mg or equivalent)
30. Fluorescent oligo probe set (e.g., Stellaris probes against human HER2-Quasar570 (Biosearch
technologies, DesignReady catalog number: VSMF-2102-5) (see Procedure A for design and
production of probes) (keep at -20 °C)
31. Anti-fade reagent (e.g., ProLong anti-fade series from Thermo scientific)
32. (Optional) High-quality nail polish (e.g., Electron Microscopy Sciences, catalog number: 72180)
33. Immersion oil 1.518, suitable for the microscope/objective
34. PBSM buffer (see Recipes)
35. Fixation buffer (see Recipes)
36. Quenching buffer (see Recipes)
37. Permeabilization buffer (see Recipes)
38. Pre-hybridization (Pre-hyb) buffer (see Recipes)
39. Hybridization buffer (see Recipes) (keep at -20 °C)
40. Hybridization chamber (see Recipes)
41. DAPI stain solution (see Recipes) (keep at 4 °C)
Equipment
1. Pipet aid (recommended: S1 pipet filler, Thermo Fisher Scientific, catalog number: 9501)
2. Tweezer, straight, pointed, stainless steel tip (e.g., Ideal-Tek, catalog number: 4 SA or equivalent)
3. (Optional) Vacuum trap
4. Chemical (fume) hood
5. Biological hood/biosafety cabinet (for cell culture work)
6. Cell culture incubator suitable for cell culture of your choice (e.g., 37 °C, 5% CO2)
7. 37 °C incubator (e.g., an incubator that is used to culture bacterial plates)
8. Cardboard tray for slides (e.g., Thermo Fisher Scientific, catalog number: 12-587-10)
9. Wide-field fluorescent microscope (e.g., Olympus, model: BX-61; Nikon, model: Eclipse Ti-E
inverted fluorescence microscope or Zeiss, model: AxioObserver Z1) equipped with the
following:
a. Fluorescent light source [e.g., Illuminator HXP 120 V light source (Carl Zeiss, model:
Illuminator HXP 120 V) or X-cite 120 PC lamp (Excelitas Technologies, X-Cite® 120PC)]
b. Filter sets suitable for the fluorophores used + DAPI (blue) filter
c. Automated motorized stage for sub-micron movement in X, Y, and Z axes [e.g., MS 2000
XYZ automated stage (ASI, model: MS 2000) or motorized XYZ scanning stage, 130x100
PIEZO (Zeiss, catalog number: 432027-9001-000)]
d. Plan-Apo 100x (preferred) or 63x oil immersion objective with high NA (1.35 NA or more)
Copyright © 2018 The Authors; exclusive licensee Bio-protocol LLC. 5
www.bio-protocol.org/e3070 Vol 8, Iss 21, Nov 05, 2018
DOI:10.21769/BioProtoc.3070
55555111112000
e. CCD or sCMOS high-resolution digital camera [e.g., Flash 4 sCMOS (Hamamatsu) or Pixis
1024 CCD camera (Photometrics)]
f. Software suitable to control the microscope (according to manufacturer) for automated
imaging of multiple channels, multiple z-stacks and multiple fields (e.g., MetaMorph, ZEN2,
µmanager)
10. Computer capable of image processing (strong CPU, at least 32 GB RAM)
11. Computer for data storage
Data storage on computer or external drive to allow for storage of 10’s of GBs and up to TB’s of
cumulative image data.
Software
1. MATLAB–R2015a version or higher
2. FISH-quant (Mueller et al., 2013; Tsanov et al., 2016)
(free software https://bitbucket.org/muellerflorian/fish_quant)
3. ImageJ/FIJI (Schindelin et al., 2012) (free software https://imagej.net/Fiji)
4. Stellaris FISH probe designer (https://www.biosearchtech.com/support/tools/design-
software/stellaris-probe-designer); requires a user account (free)
5. Excel or equivalent program
Procedure
A. Design and labeling of oligonucleotide probes
1. Probes are 18-22 mer DNA oligonucleotides that are fluorescently labeled with a fluorescent
organic dye at one or both ends. The most common dyes used are the cyanine (Cy), Alexa, and
Atto dye series. To design the probes, first obtain the RNA sequence of interest.
Note: For good signal-to-noise (SNR) ratio that will allow detection of the FISH spots over the
background, it is recommended to use at least 25 probes (best = ~48 probes) per transcript,
which means that a short transcript (i.e., < ~500 nt) may not be suitable for this version of
smFISH. Alternative methods such as smiFISH (Tsanov et al., 2016), RNAscope (Wang et al.,
2012) or clampFISH (Rouhanifard et al., 2018; preprint), which enhance the FISH signal, might
be more suitable for short RNAs.
2. We recommend using the Stellaris probe design web tool. Insert the sense strand sequence
and choose the required parameters (i.e., organism, specificity level, number of probes, probe
length, and minimal spacing). We recommend choosing the highest level of specificity, i.e., 5,
and 48 probes of 20 nt with 2 nt spacing as default. If there are < 25 probes, parameters can be
changed until you are satisfied.
3. There are multiple protocols to label the probes. The simplest solution, which we recommend
for consistency and ease, is to order the Stellaris RNA FISH probes from Biosearch technologies

Copyright © 2018 The Authors; exclusive licensee Bio-protocol LLC. 6
www.bio-protocol.org/e3070 Vol 8, Iss 21, Nov 05, 2018
DOI:10.21769/BioProtoc.3070
55555111112000
(https://www.biosearchtech.com/). However, these are relatively expensive. One alternative is
to order DNA oligos with amine ends and label with an amine reactive dye (Singer, 1998). Note
that this protocol is for 50 nt oligos, but can be utilized for 20 nt oligos. This method works well,
but is still relatively expensive. A cheaper option is to enzymatically label the probes (Gáspár et
al., 2017 and 2018).
4. The oligo probe set should be suspended in nuclease-free water (for Stellaris probes, prepare
a 25 µM solution) and kept at -20 °C in the dark. Probes can be divided into aliquots of 10-20 µl
to avoid multiple freeze-thaw cycles (although in our experience we did not detect any noticeable
deterioration after multiple freeze-thaw cycles).
B. Cell culture
General comments:
1. Work in a bio-safety cabinet (biological hood) for sterile cell culture work.
2. This protocol is designed for adherent cells. For non-adherent cells, it is required to add
additional steps to adhere the cells to the coverslip. Users who plan such steps need to consider
these points:
a. How to adhere the cells to the glass (e.g., by poly-lysine coating)?
b. Decide whether to adhere the cells to the glass before fixation or after the final wash step.
Each case could necessitate different protocol steps (e.g., either to perform the washes on
coverslips or in tubes, or perform fixation either before or after adherence) and might even
yield different results.
c. Calibrate the number of cells per coverslip.
3. If possible, it is recommended to add an additional cell line as a negative control for the FISH
probes used (e.g., knockout cells, cells of a different species that express the RNA of interest,
but with a nucleotide sequence that has low homology, etc.). This is helpful both for calibrating
the FISH signals for the specific probes, as well as for FISH spot analysis. It is preferable to
verify that the knockout cell line does not express the RNA of interest. We note that truncated
RNAs might be expressed from knockout cells and these can be detected by FISH.
1. Pre-warm 1x PBS and culture media to 37 °C.
2. (Optional) If coating the coverslips, prepare a coating solution (e.g., dilute fibronectin 1:100 in
1x PBS).
3. For each sample, place a coverslip in a well of 12-well plate.
4. Wash briefly with 1 ml of 70% ethanol. Aspirate ethanol.
5. Wash briefly with 1 ml sterile 1x PBS.
6. (Optional) Add 1 ml of coating solution and incubate as required (e.g., for fibronectin, incubate
for 10-20 min in a cell culture incubator). Remove coating solution and wash with 1 ml PBS (x1).
7. Place 1 ml culture media per well.
8. Seed adherent cells of choice.
Copyright © 2018 The Authors; exclusive licensee Bio-protocol LLC. 7
www.bio-protocol.org/e3070 Vol 8, Iss 21, Nov 05, 2018
DOI:10.21769/BioProtoc.3070
55555111112000
9. Culture the cells in a cell culture incubator for required time of the experiment; do not let the
culture become confluent. Aim for a maximum of ~80%-90% confluence at the time of fixation.
C. FISH
General comments:
a. To avoid RNase contamination of samples, wear gloves, use barrier tips and avoid working on
surfaces where there is regular use of RNases (e.g., from plasmid prep kits).
b. For safety, work with PFA and formamide solutions should be performed in a chemical (fume)
hood.
c. All steps except “hybridization” are performed while the coverslips remain in the well, with 1 ml
of solution added per well.
d. It is recommended to pipet liquids on the wall of the well and not directly onto the cells. For cells
with delicate structures (e.g., dendrites, membrane nanotubes), it is recommended to use a
pipet aid at the slowest setting and not to use vacuum aspirator.
e. There is no need to shake the 12-well plate during wash steps.
1. Wash cells with PBSM (3 quick rinses).
2. Fix cells by incubating with fixation buffer (prepared fresh) for 10 min (not longer, see Note 1) at
room temperature (RT).
3. Wash with quenching buffer, 10 min at RT.
4. Wash with PBSM for 10 min at RT. Repeat this step. Cells can be left overnight at 4 °C at this
point.
5. Permeabilize cells by incubating with permeabilization buffer for 10 min (not longer, see Note 1)
at RT.
6. Wash with PBSM for 10 min at RT. Repeat this step.
7. Incubate with Pre-hyb buffer for 30 min at RT.
8. While waiting (Step C7), mix the pre-made hybridization buffer with the probes, and prepare the
hybridization chamber (see Recipes and Note 2).
9. Place 45 µl of hybridization buffer at each intended coverslip position in the hybridization
chamber. There is no need to remove large bubbles, but avoid small foam-like bubbles.
10. With the tweezers, gently lift each coverslip from the well, remove excess liquid by touching the
edge on a Kimwipe and place the coverslips with the cells facing down on the hybridization
buffer (see Video 1 and Note 3).

Copyright © 2018 The Authors; exclusive licensee Bio-protocol LLC. 8
www.bio-protocol.org/e3070 Vol 8, Iss 21, Nov 05, 2018
DOI:10.21769/BioProtoc.3070
55555111112000
Video 1. Transferring coverslips from 12-well plate to hybridization chamber
11. Seal the hybridization chamber with Parafilm, wrap with aluminum foil, and place in a 37 °C
incubator for 3 h to overnight.
12. Prepare a new (or same) 12-well plate with Pre-hyb buffer.
13. Use the tweezers to transfer the coverslips back to the 12-well plate, cells facing up.
14. Cover the plate with aluminum foil and incubate in the 37 °C incubator for 15 min.
15. Wash again in Pre-hyb buffer, 15 min at 37 °C.
16. Quick rinse with 2x SSC at RT (3 quick rinses).
17. Stain in DAPI stain solution (pre-warmed to RT) for 1 min at RT.
18. Wash for 5 min with 2x SSC.
19. During this final wash step, prepare microscope slides in the cardboard tray:
a. Label the slide(s).
b. Just before lifting the coverslips, add 20 µl of Pro-Long anti-fade solution for each cover slip
(there can be two per slide). Remove any air bubbles. See also Note 4.
20. Use tweezers to lift coverslips, remove excess liquid and place cell-side facing down, on the
Pro-Long anti-fade drop.
21. Let dry at RT in the dark for at least several hours (for best images, wait > 24 h).
22. (Optional) For long-term storage, seal with nail polish around the edges of the coverslip after
the Pro-Long dries.
23. Slides can be stored at RT for several days (at least, we have not checked longer than a week).
Keep at -20 °C for long-term storage (months to years).
D. Imaging
Important: All slides from the same experiment should be imaged using the same exact conditions.
1. Imaging can be performed on any wide-field microscope, as detailed in the Equipment section.
2. Do not use a confocal microscope for smFISH imaging. The higher light intensity of the lasers
can cause rapid bleaching of the FISH signal. Since the smFISH signal is relatively weak and
requires long exposure times to collect enough light, photobleaching limits the total amount of

Copyright © 2018 The Authors; exclusive licensee Bio-protocol LLC. 9
www.bio-protocol.org/e3070 Vol 8, Iss 21, Nov 05, 2018
DOI:10.21769/BioProtoc.3070
55555111112000
light collected. This is particularly problematic when taking multiple z sections in order to create
a 3D image stack.
3. Images should be taken at the relevant channels with descending color order [e.g., Cy5 (670
nm, far-red), Cy3 (570 nm, yellow-orange), Alexa488 (520, green), and DAPI (460 nm, blue)].
This is particularly important when imaging with DAPI, since we have noticed that in some cell
types (e.g., MEFs, HEK293T cells), imaging through the DAPI channel may cause the
appearance of granular autofluorescence in other channels. This was infrequent (i.e., it did not
happen every time) but it was reproduced using several microscopes.
4. Exposure time: For FISH, it is recommended to use maximum (100%) power of the light source
and an exposure time of 1-3 s for each FISH channel. For DAPI, use a low power setting and
very short exposure time (e.g., 30% power, 20-40 ms).
5. For FISH spot detection, more photons (i.e., longer exposure time) means better detection, but
also increased background fluorescence. Therefore, the user should adjust the time and
exposure parameters accordingly.
6. Z-sections: In order to detect RNA spots throughout the volume of the cell, multiple z-sections
should be collected. It is recommended to use 0.2-0.3 µm steps and collect at least 30 sections
(i.e., for flat cells, like fibroblasts) or more (e.g., for HEK293T or N87 cells we use 41 z-sections).
When imaging, choose the option to image all z-sections in one channel before switching to the
next channel.
7. Binning: For better resolution, use pixel binning 1 x 1. However, sometimes for the benefit of
signal enhancement over resolution, a 2 x 2 binning may be used.
8. For examples of FISH images and z-stacks, see Figure 2 and Videos 2-5.

Copyright © 2018 The Authors; exclusive licensee Bio-protocol LLC. 10
www.bio-protocol.org/e3070 Vol 8, Iss 21, Nov 05, 2018
DOI:10.21769/BioProtoc.3070
55555111112000
Figure 2. Examples of unfiltered and filtered FISH images produced by FISH-quant.
smFISH on human NCI-N87 gastric carcinoma cells (top row) and immortalized MEFs (bottom
row) were performed using Stellaris probes against human HER2 mRNA. Imaging was
performed on a Zeiss AxioObserver Z1 DuoLink dual camera imaging system equipped with
Illuminator HXP 120 V light source, PlanApo 100x 1.4 NA oil immersion objective and
Hamamatsu Flash 4 sCMOS cameras. For both cell types, 41 steps of 0.2 μm z-stack images
were taken using a motorized XYZ scanning stage 130 x 100 PIEZO, and ZEN2 software at
0.0645 μm/pixel. Images show a maximum projection of middle z-sections. Note that the
brightness of the MEFs FISH image (lower left) was increased compared to that of N87, to allow
better visualization of the cells. See Videos 2-5 for the full z-stack of each image. Scale bars =
10 µm.

Copyright © 2018 The Authors; exclusive licensee Bio-protocol LLC. 11
www.bio-protocol.org/e3070 Vol 8, Iss 21, Nov 05, 2018
DOI:10.21769/BioProtoc.3070
55555111112000
Video 2. 3D FISH image of N87 cell with human HER-Q570 probes
Video 3. 3D filtered image of the cell in Video 2
Video 4. 3D FISH image of MEF cell with human HER-Q570 probes

Copyright © 2018 The Authors; exclusive licensee Bio-protocol LLC. 12
www.bio-protocol.org/e3070 Vol 8, Iss 21, Nov 05, 2018
DOI:10.21769/BioProtoc.3070
55555111112000
Video 5. 3D filtered image of the cell in Video 4
Data analysis
FISH spot analysis is performed by programs that fit the diffraction-limited spots using a 3D
Gaussian fitting algorithm. Many labs produce their own software/scripts. We recommend FISH-
quant (Mueller et al., 2013; Tsanov et al., 2016) since it is user-friendly and can perform multiple
analyses (i.e., mature mRNA, transcription site analysis, co-localization). The images for FISH-
quant need to be in TIFF format as a separate file of multiple z-sections obtained for each channel.
If the microscope does not save files in TIFF format, convert the images by using another program
(e.g., FIJI). Follow the instructions for FISH-quant to perform analysis.
Briefly:
1. Install MATLAB and then install FISH-quant.
2. In the main interface of FISH-quant:
a. Choose the folders (main folder, images folder, outlines folder, results folder).
b. Insert the experimental parameters: XY pixel size (based on camera and binning), Z pixel
size, refractive index of the oil, NA of the objective, excitation and emission wavelengths of
the FISH probe fluorophore.
c. Under Tools outline designer: draw outlines for cells, nuclei and transcription sites (TS)
(hint: use the automatic “detect nucleus” and “TS auto detect” based on the DAPI and
TS/FISH staining, respectively).
d. Upload outline of image.
e. Filter the background (try different modes and parameters for best filtering). For examples
of filtered images and z-stacks, see Figure 2 and Videos 3 and 5.
f. Perform pre-detection according to instructions.
g. Fit spots using the Gaussian algorithm.
h. Use thresholding parameters to achieve the best results.
i. Save the detection settings.
Copyright © 2018 The Authors; exclusive licensee Bio-protocol LLC. 13
www.bio-protocol.org/e3070 Vol 8, Iss 21, Nov 05, 2018
DOI:10.21769/BioProtoc.3070
55555111112000
3. From Tools Batch processing it is possible to perform analysis of multiple images. The
thresholding parameters can be modified after batch analysis to fine-tune the results. It is
recommended to set the parameters so that a negative control will give close to 0 spots.
4. Use Tools Spot inspector to eliminate obvious false positives (e.g., areas of high
autofluorescence).
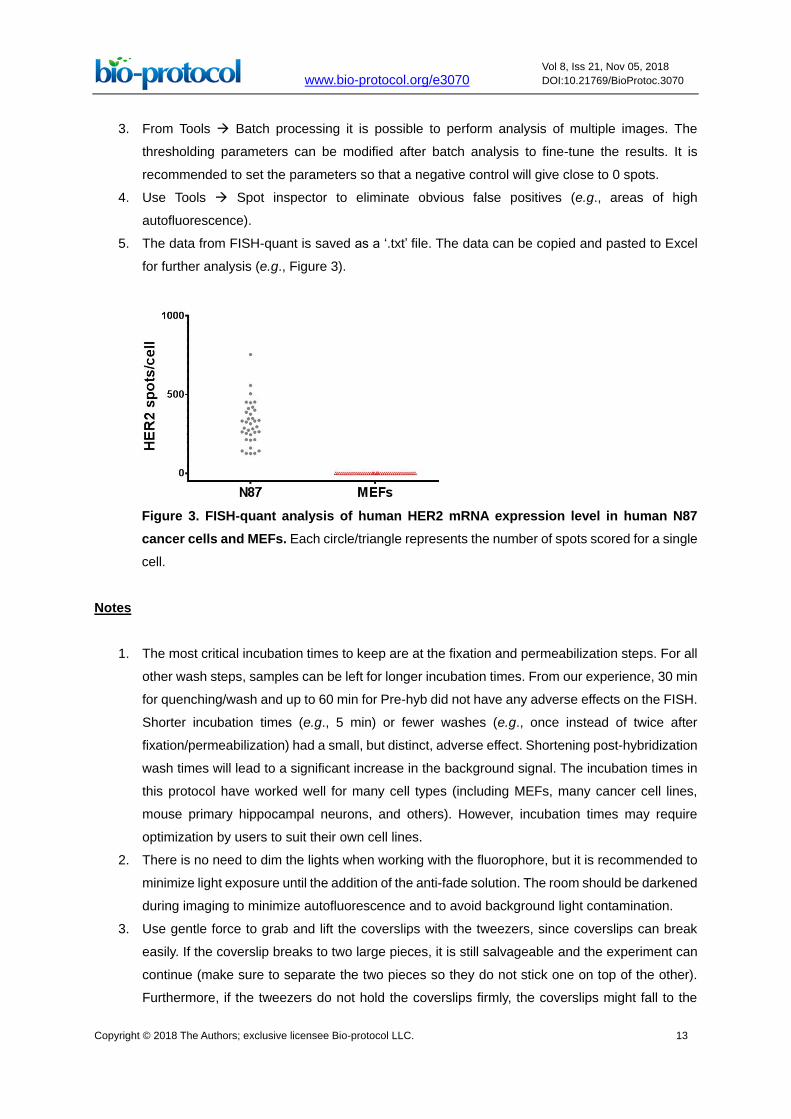
5. The data from FISH-quant is saved as a ‘.txt’ file. The data can be copied and pasted to Excel
for further analysis (e.g., Figure 3).
Figure 3. FISH-quant analysis of human HER2 mRNA expression level in human N87
cancer cells and MEFs. Each circle/triangle represents the number of spots scored for a single
cell.
Notes
1. The most critical incubation times to keep are at the fixation and permeabilization steps. For all
other wash steps, samples can be left for longer incubation times. From our experience, 30 min
for quenching/wash and up to 60 min for Pre-hyb did not have any adverse effects on the FISH.
Shorter incubation times (e.g., 5 min) or fewer washes (e.g., once instead of twice after
fixation/permeabilization) had a small, but distinct, adverse effect. Shortening post-hybridization
wash times will lead to a significant increase in the background signal. The incubation times in
this protocol have worked well for many cell types (including MEFs, many cancer cell lines,
mouse primary hippocampal neurons, and others). However, incubation times may require
optimization by users to suit their own cell lines.
2. There is no need to dim the lights when working with the fluorophore, but it is recommended to
minimize light exposure until the addition of the anti-fade solution. The room should be darkened
during imaging to minimize autofluorescence and to avoid background light contamination.
3. Use gentle force to grab and lift the coverslips with the tweezers, since coverslips can break
easily. If the coverslip breaks to two large pieces, it is still salvageable and the experiment can
continue (make sure to separate the two pieces so they do not stick one on top of the other).
Furthermore, if the tweezers do not hold the coverslips firmly, the coverslips might fall to the

Copyright © 2018 The Authors; exclusive licensee Bio-protocol LLC. 14
www.bio-protocol.org/e3070 Vol 8, Iss 21, Nov 05, 2018
DOI:10.21769/BioProtoc.3070
55555111112000
bench. Again, the coverslip is still salvageable, but the user needs to guess the correct side of
the cells.
4. There are other commercially available anti-fade solutions, as well as lab-made anti-fade
solutions that can be used (e.g., by using glucose oxidase). However, we have no experience
with those, and these might not be suitable for FISH or long-term storage.
Recipes
1. PBSM buffer (500 ml)
50 ml 10x PBS
2.5 ml MgCl2 1 M
475 ml nuclease-free water
Store at RT
2. Fixation buffer (8 ml)
7 ml PBSM
1 ml PFA 32%
Prepare fresh
3. Quenching buffer (10 ml)
9.5 ml PBSM
0.5 ml 2 M glycine
Prepare fresh as it tends to get microorganism contaminations
Prepare stock solutions in advance:
a. PBSM buffer (Recipe 1)
b. 2 M glycine stock solution in water, filter sterilize (store at RT)
4. Permeabilization buffer (100 ml)
10 ml 10x PBS
1 ml Surfact-AmpsTM X-100 10%
89 ml nuclease-free water
Store at RT
5. Pre-hybridization (Pre-hyb) buffer (10 ml)
1 ml 20x SSC
1 ml Formamide (warm to room temperature before use)
8 ml nuclease-free water
Prepare fresh

Copyright © 2018 The Authors; exclusive licensee Bio-protocol LLC. 15
www.bio-protocol.org/e3070 Vol 8, Iss 21, Nov 05, 2018
DOI:10.21769/BioProtoc.3070
55555111112000
6. Hybridization buffer
Reagent For 1 ml final volume (store at -20 °C) Final Concentration
Formamide 0.1 ml 10%
Competitor (10 mg/ml E.
coli tRNA
0.1 ml 1 mg/ml
20% Dextran Sulfate 0.5 ml 10%
20 mg/ml BSA 10 µl 0.2 mg/ml
20x SSC 0.1 ml 2x
VRC 200 mM 10 µl 2 mM
Nuclease-free water 0.18 ml
Total Volume 1 ml
Add probes fresh to hybridization buffer. It is recommended to calibrate probe concentration
when using probes for the first time (default: 250 nM or 10 ng/sample).
Prepare stock solutions in advance:
1) 10 mg/ml E. coli tRNA solution in nuclease-free water. Store at -20 °C.
2) 20% Dextran sulfate in water (viscous, takes 30-60 min to dissolve completely). Store at RT.
7. Hybridization chamber
a. Plastic box or plastic dish (e.g., Petri dish, 15 cm tissue culture dish). The size of the
chamber should accommodate all the coverslips allowing for at least a few millimeters
between the coverslips
b. Place parafilm on the bottom of the chamber. Avoid wrinkles where the coverslips will be
placed
c. (Optional) Draw a grid (each square should fit a single coverslip) and label the squares
d. Take the cap of a 15 ml conical tube and place it at the edge of the chamber. Fill the cap
with 1 ml of water or buffer (this is required to maintain humidity in the chamber)
e. Prepare a piece of parafilm to seal the chamber after coverslips are placed
f. Prepare aluminum foil to cover the chamber to protect from light
g. The plastic chamber can be re-used multiple times
8. DAPI stain solution (200 ml)
20 ml 20x SSC
10 µl of 10 mg/ml DAPI (final concentration: 0.5 µg/ml)
180 ml nuclease-free water
Store at 4 °C in the dark
Prepare DAPI stock solution in advance:
10 mg/ml DAPI solution in water. Store at -20 °C in the dark
Acknowledgments
G.H. is a recipient of the Koshland Foundation and McDonald-Leapman Grant Senior Post-doctoral
fellowship. This work was funded by grants from the Joel and Mady Dukler Fund for Cancer
Copyright © 2018 The Authors; exclusive licensee Bio-protocol LLC. 16
www.bio-protocol.org/e3070 Vol 8, Iss 21, Nov 05, 2018
DOI:10.21769/BioProtoc.3070
55555111112000
Research (WIS), a Proof-of-Principle Grant from the Moross Integrated Cancer Center, Weizmann
Institute, and US-Israel Binational Science Foundation-National Science Foundation (#2015846) to
J.E.G.
Competing interests
The authors declare that there are no conflicts of interest or competing interests.
References
1. Buxbaum, A. R., Haimovich, G. and Singer, R. H. (2015). In the right place at the right time:
visualizing and understanding mRNA localization. Nat Rev Mol Cell Biol 16(2): 95-109.
2. Buxbaum A. R., Wu B. and Singer R. H. (2014). Single β-actin mRNA detection in neurons
reveals a mechanism for regulating its translatability. Science 343(6169):419-422.
3. Cabili, M. N., Dunagin, M. C., McClanahan, P. D., Biaesch, A., Padovan-Merhar, O., Regev, A.,
Rinn, J. L. and Raj, A. (2015). Localization and abundance analysis of human lncRNAs at single-
cell and single-molecule resolution. Genome Biol 16: 20.
4. Chou, Y. Y., Heaton, N. S., Gao, Q., Palese, P., Singer, R. H. and Lionnet, T. (2013).
Colocalization of different influenza viral RNA segments in the cytoplasm before viral budding
as shown by single-molecule sensitivity FISH analysis. PLoS Pathog 9(5): e1003358.
5. Femino, A. M., Fay, F. S., Fogarty, K. and Singer, R. H. (1998). Visualization of single RNA
transcripts in situ. Science 280(5363): 585-590.
6. Gáspár, I., Wippich, F. and Ephrussi, A. (2017). Enzymatic production of single-molecule FISH
and RNA capture probes. RNA 23(10): 1582-1591.
7. Gáspár, I., Wippich, F. and Ephrussi, A. (2018). Terminal deoxynucleotidyl transferase mediated
production of labeled probes for single-molecule FISH or RNA capture. Bio-protocol 8(5): e2750.
8. Haimovich, G., Ecker, C. M., Dunagin, M. C., Eggan, E., Raj, A., Gerst, J. E. and Singer, R. H.
(2017). Intercellular mRNA trafficking via membrane nanotube-like extensions in mammalian
cells. Proc Natl Acad Sci U S A 114(46): E9873-E9882.
9. Lee, C., Roberts, S. E. and Gladfelter, A. S. (2016). Quantitative spatial analysis of transcripts
in multinucleate cells using single-molecule FISH. Methods 98: 124-133.
10. Mueller, F., Senecal, A., Tantale, K., Marie-Nelly, H., Ly, N., Collin, O., Basyuk, E., Bertrand, E.,
Darzacq, X. and Zimmer, C. (2013). FISH-quant: automatic counting of transcripts in 3D FISH
images. Nat Methods 10(4): 277-278.
11. Pichon, X., Lagha, M., Mueller, F., and Bertrand, E. (2018). A growing toolbox to image gene
expression in single cells: sensitive approaches for demanding challenges. Mol Cell 71(3): 468-
480.
12. Raj, A., van den Bogaard, P., Rifkin, S. A., van Oudenaarden, A. and Tyagi, S. (2008). Imaging
individual mRNA molecules using multiple singly labeled probes. Nat Methods 5(10): 877-879.

Copyright © 2018 The Authors; exclusive licensee Bio-protocol LLC. 17
www.bio-protocol.org/e3070 Vol 8, Iss 21, Nov 05, 2018
DOI:10.21769/BioProtoc.3070
55555111112000
13. Rouhanifard, S. H., Mellis, I. A., Dunagin, M., Bayatpour, S., Symmons, O., Cote, A. and Raj, A.
(2018). Exponential fluorescent amplification of individual RNAs using clampFISH probes.
bioRxiv 222794.
14. Schindelin, J., Arganda-Carreras, I., Frise, E., Kaynig, V., Longair, M., Pietzsch, T., Preibisch,
S., Rueden, C., Saalfeld, S., Schmid, B., Tinevez, J. Y., White, D. J., Hartenstein, V., Eliceiri,
K., Tomancak, P. and Cardona, A. (2012). Fiji: an open-source platform for biological-image
analysis. Nat Methods 9(7): 676-682.
15. Singer, R. H. (1998). Preparation of probes for in situ hybridization.
https://www.einstein.yu.edu/uploadedFiles/LABS/robert-singer-lab/probe_prep.pdf.
16. Svensson, V., Natarajan, K. N., Ly, L. H., Miragaia, R. J., Labalette, C., Macaulay, I. C., Cvejic,
A. and Teichmann, S. A. (2017). Power analysis of single-cell RNA-sequencing experiments.
Nat Methods 14(4): 381-387.
17. Tsanov, N., Samacoits, A., Chouaib, R., Traboulsi, A. M., Gostan, T., Weber, C., Zimmer, C.,
Zibara, K., Walter, T., Peter, M., Bertrand, E. and Mueller, F. (2016). smiFISH and FISH-quant
- a flexible single RNA detection approach with super-resolution capability. Nucleic Acids Res
44(22): e165.
18. Wang, F., Flanagan, J., Su, N., Wang, L. C., Bui, S., Nielson, A., Wu, X., Vo, H. T., Ma, X. J.
and Luo, Y. (2012). RNAscope: a novel in situ RNA analysis platform for formalin-fixed, paraffin-
embedded tissues. J Mol Diagn 14(1): 22-29.