single muscle fiber discharge transformations: fibrillation potential to positive sharp wave
TRANSCRIPT
ABSTRACT: It is presently believed that a fibrillation potential (FP) cantransform into a positive sharp wave (PSW) by displaying a number of in-dividual transitional potentials with a high degree of morphological variationbetween different sets of independent transformations. Clinically obtainedexamples of FP-to-PSW transformations and a myotonic discharge trans-formation are simulated by a finite fiber computer model. The simulationsdemonstrate that the two clinical FP-to-PSW examples may well be theresult of two independent muscle fibers synchronously firing for a shortperiod of time such that their separate waveforms summate at the electrodeto create a false impression of one potential changing into another througha specific series of transitional waveforms. The transition characterized bythe myotonic discharge is substantiated through modeling to define the mostreasonable transitional series of waveform morphologies for a single musclefiber. The combination of clinical examples, histological needle electrodemuscle penetration studies, and simulations of single muscle fiber dischargetransitions support the hypothesis that a needle recording electrode is ca-pable of inducing a variable degree of mechanical compression with a com-mensurate amount of action potential blockade. The degree of action po-tential blockade directly contributes to the clinically observed configurationfor the single muscle fiber discharge in both innervated and denervatedtissues.
© 1998 John Wiley & Sons, Inc. Muscle Nerve 21: 1759–1768, 1998
SINGLE MUSCLE FIBER DISCHARGETRANSFORMATIONS: FIBRILLATIONPOTENTIAL TO POSITIVESHARP WAVE
DANIEL DUMITRU, MD,1 JOHN C. KING, MD,1 and
ROGER J.M. McCARTER, PhD 2
1 University of Texas Health Science Center at San Antonio, Department ofRehabilitation Medicine, 7703 Floyd Curl Drive,San Antonio, Texas 78284-7798, USA2 University of Texas Health Science Center at San Antonio, Department ofPhysiology, 7703 Floyd Curl Drive, San Antonio, Texas 78284-7798, USA
Accepted 17 July 1998
Fibrillation potentials (FPs) and positive sharpwaves (PSWs) are spontaneous single muscle fiberdischarges detected in muscle tissue deprived of itsneural innervation, or that has otherwise acquiredan unstable resting membrane potential.2,3,23 Thesetwo waveforms each possess a unique configurationand frequency content making it relatively easy tovisually and acoustically differentiate between them.6
A FP’s triphasic appearance and hence etiology iseasily explained by volume conductor theory as anaction potential propagating toward (initial positivedeflection), reaching (negative spike), and travelingaway from (terminal positive phase) the recordingelectrode.6 The PSW, however, is not so easily ex-plained. Until such time as a fully developed volumeconductor explanation for the PSW is available, thepresently held belief that a PSW represents a FP re-corded from an ill-defined ‘‘damaged’’ portion ofmuscle membrane must suffice.5
During the needle electromyographic examina-tion of denervated muscle tissue, it is common toobserve a combination of independently dischargingFPs and PSWs. From time to time a rather uniquesequence of events can be detected. A prototypical
Abbreviations: CT, cut termination; FP, fibrillation potential; FT, fiber ter-mination; IAP, intracellular action potential; PSW, positive sharp wave; TF,triphasic fiberKey words: fibrillation potential; positive sharp wave; myotonic dis-charge; needle electromyography; computer modelingCorrespondence to: Dr. Daniel Dumitru
CCC 0148-639X/98/121759-10© 1998 John Wiley & Sons, Inc.
Single Muscle Fiber Transformation MUSCLE & NERVE December 1998 1759
FP will occasionally be observed to transform into aPSW.4,15 It is the transition of a short-duration (3–5ms) triphasic FP into a biphasic long-duration (20–100 ms) PSW at an apparent constant discharge ratethat appears to link these two potentials as arisingfrom the same muscle fiber.
In this study, a finite fiber computer simulationin combination with clinically observed potentials isused to investigate the FP-to-PSW transformation.Simulating this transformation provides insight intothe possible biophysical and physiological mecha-nisms responsible for the observed waveform mor-phologies. Further, it is hypothesized that a needleelectromyographic recording electrode adversely af-fects the muscle fiber by inducing either total orpartial action potential blockade at the electrode–muscle fiber interface, thereby influencing FPpropagation. The electrical events associated withthis transition from conduction to presumed actionpotential blockade are manifest as a FP apparentlytransforming to a PSW.
MATERIALS AND METHODS
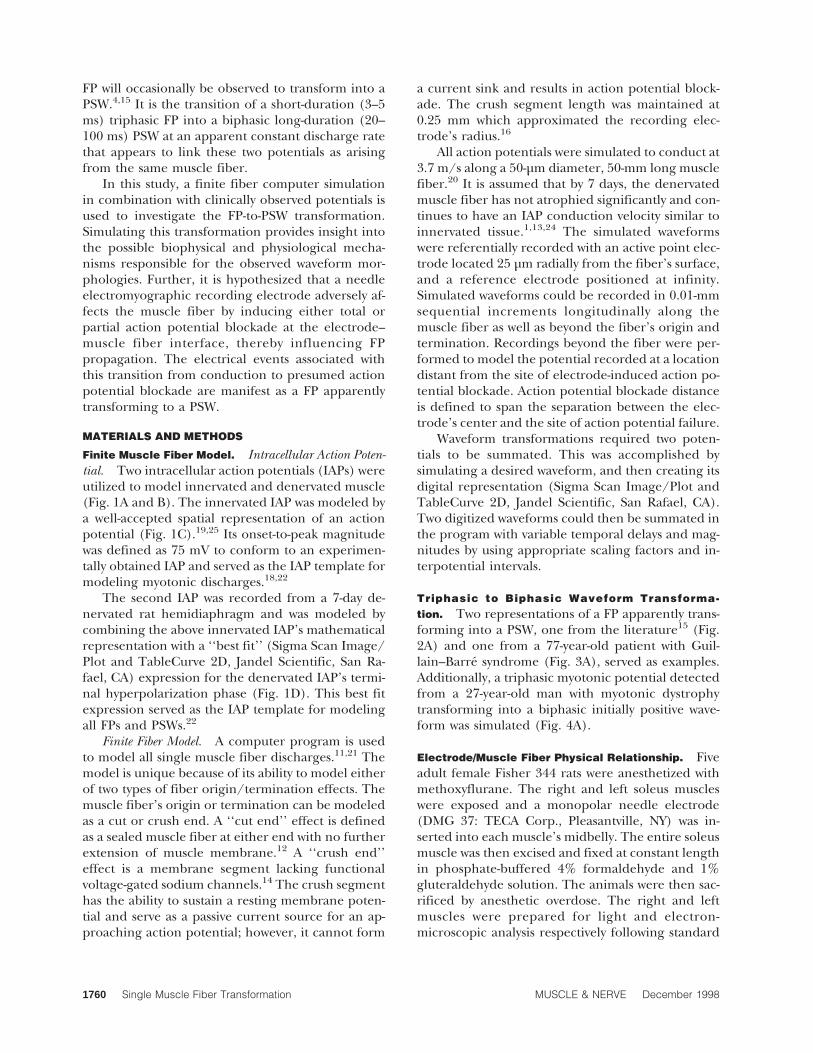
Finite Muscle Fiber Model. Intracellular Action Poten-tial. Two intracellular action potentials (IAPs) wereutilized to model innervated and denervated muscle(Fig. 1A and B). The innervated IAP was modeled bya well-accepted spatial representation of an actionpotential (Fig. 1C).19,25 Its onset-to-peak magnitudewas defined as 75 mV to conform to an experimen-tally obtained IAP and served as the IAP template formodeling myotonic discharges.18,22
The second IAP was recorded from a 7-day de-nervated rat hemidiaphragm and was modeled bycombining the above innervated IAP’s mathematicalrepresentation with a ‘‘best fit’’ (Sigma Scan Image/Plot and TableCurve 2D, Jandel Scientific, San Ra-fael, CA) expression for the denervated IAP’s termi-nal hyperpolarization phase (Fig. 1D). This best fitexpression served as the IAP template for modelingall FPs and PSWs.22
Finite Fiber Model. A computer program is usedto model all single muscle fiber discharges.11,21 Themodel is unique because of its ability to model eitherof two types of fiber origin/termination effects. Themuscle fiber’s origin or termination can be modeledas a cut or crush end. A ‘‘cut end’’ effect is definedas a sealed muscle fiber at either end with no furtherextension of muscle membrane.12 A ‘‘crush end’’effect is a membrane segment lacking functionalvoltage-gated sodium channels.14 The crush segmenthas the ability to sustain a resting membrane poten-tial and serve as a passive current source for an ap-proaching action potential; however, it cannot form
a current sink and results in action potential block-ade. The crush segment length was maintained at0.25 mm which approximated the recording elec-trode’s radius.16
All action potentials were simulated to conduct at3.7 m/s along a 50-µm diameter, 50-mm long musclefiber.20 It is assumed that by 7 days, the denervatedmuscle fiber has not atrophied significantly and con-tinues to have an IAP conduction velocity similar toinnervated tissue.1,13,24 The simulated waveformswere referentially recorded with an active point elec-trode located 25 µm radially from the fiber’s surface,and a reference electrode positioned at infinity.Simulated waveforms could be recorded in 0.01-mmsequential increments longitudinally along themuscle fiber as well as beyond the fiber’s origin andtermination. Recordings beyond the fiber were per-formed to model the potential recorded at a locationdistant from the site of electrode-induced action po-tential blockade. Action potential blockade distanceis defined to span the separation between the elec-trode’s center and the site of action potential failure.
Waveform transformations required two poten-tials to be summated. This was accomplished bysimulating a desired waveform, and then creating itsdigital representation (Sigma Scan Image/Plot andTableCurve 2D, Jandel Scientific, San Rafael, CA).Two digitized waveforms could then be summated inthe program with variable temporal delays and mag-nitudes by using appropriate scaling factors and in-terpotential intervals.
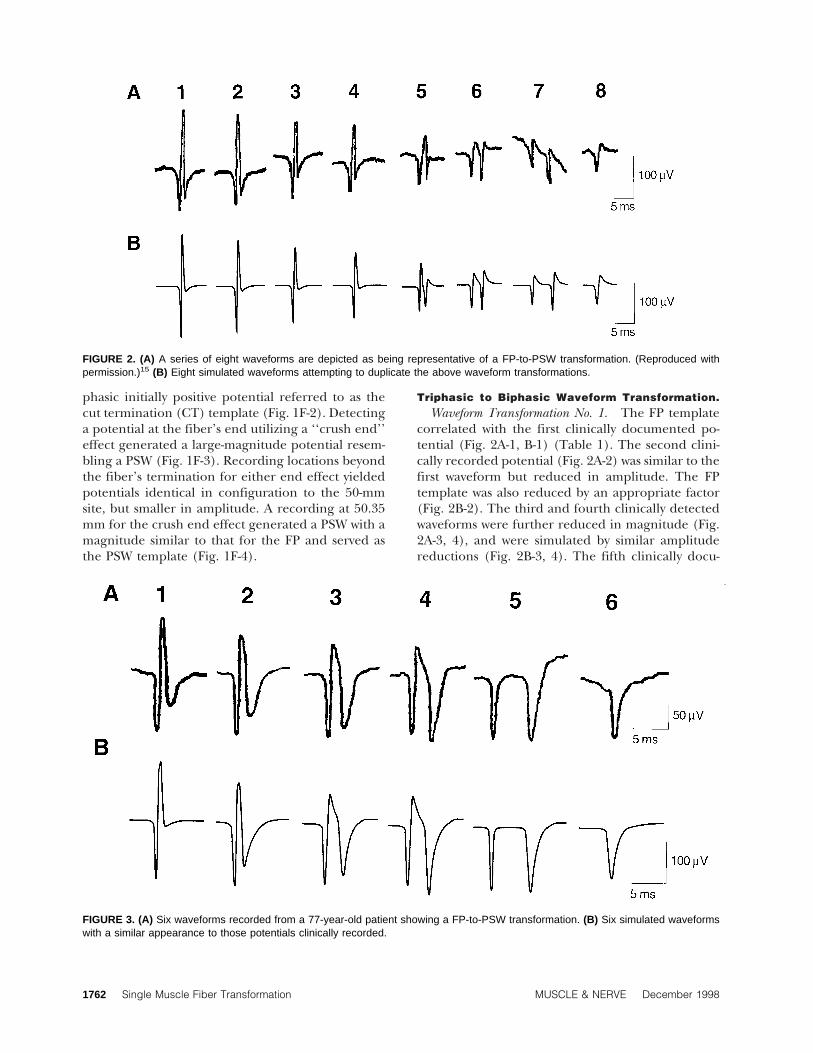
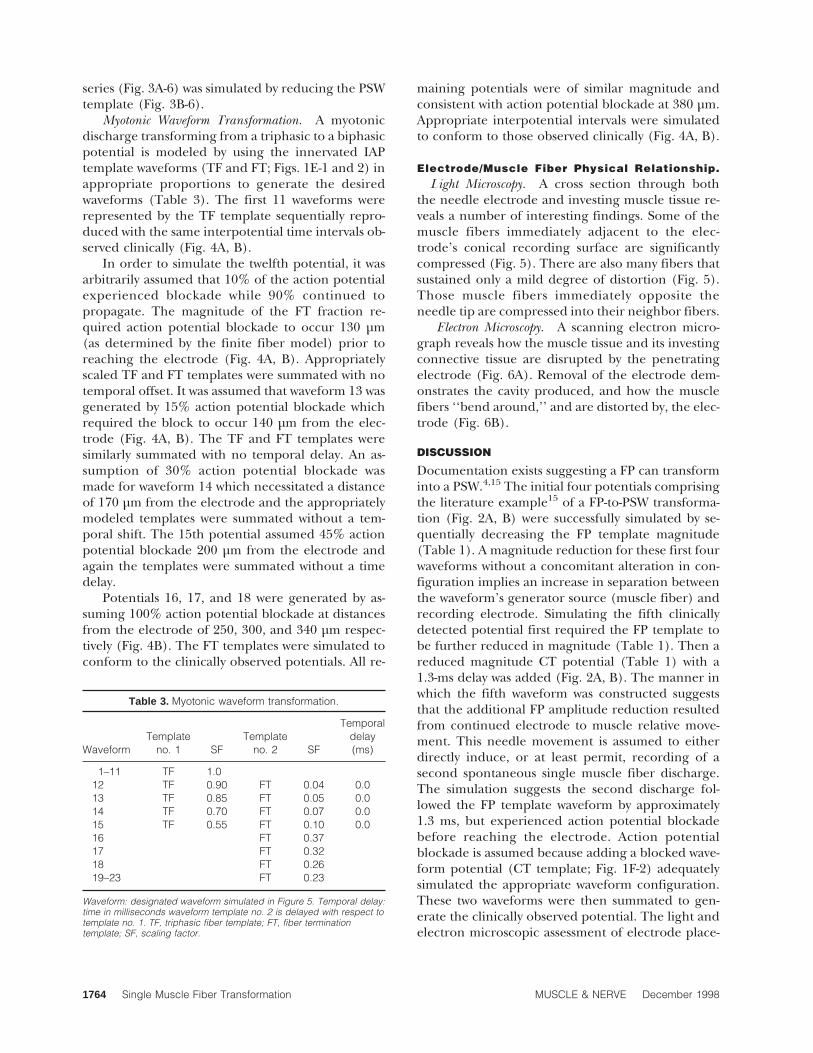
Triphasic to Biphasic Waveform Transforma-tion. Two representations of a FP apparently trans-forming into a PSW, one from the literature15 (Fig.2A) and one from a 77-year-old patient with Guil-lain–Barre syndrome (Fig. 3A), served as examples.Additionally, a triphasic myotonic potential detectedfrom a 27-year-old man with myotonic dystrophytransforming into a biphasic initially positive wave-form was simulated (Fig. 4A).
Electrode/Muscle Fiber Physical Relationship. Fiveadult female Fisher 344 rats were anesthetized withmethoxyflurane. The right and left soleus muscleswere exposed and a monopolar needle electrode(DMG 37: TECA Corp., Pleasantville, NY) was in-serted into each muscle’s midbelly. The entire soleusmuscle was then excised and fixed at constant lengthin phosphate-buffered 4% formaldehyde and 1%gluteraldehyde solution. The animals were then sac-rificed by anesthetic overdose. The right and leftmuscles were prepared for light and electron-microscopic analysis respectively following standard
1760 Single Muscle Fiber Transformation MUSCLE & NERVE December 1998

procedures.17 All experimental animals werehandled according to approved procedures of thelocal Institutional Animal Care and Use Committee.
RESULTS
Finite Muscle Fiber Model. Innervated TemplateWaveforms. The waveform detected from the fiber’smiddle (25 mm) was consistent with a single musclefiber discharge and served as the triphasic fiber (TF)
template (Fig. 1E-1). A potential recorded from thefiber’s end (50 mm) was biphasic, initially positiveand represented the fiber termination (FT) tem-plate (Fig. 1E-2).
Denervated Template Waveforms. Recordings fromthe muscle fiber’s midportion (25 mm) revealed atriphasic waveform (Fig. 1F-1) and served as the FPtemplate. A potential recorded from the muscle fi-ber’s end using a ‘‘cut end’’ effect generated a bi-
FIGURE 1. An intracellular action potential recorded from an innervated (A) and 7-day denervated (B) rat hemidiaphragm. Spatialrepresentations of the innervated (C) and 7-day denervated (D) rat intracellular action potentials used in the simulations. (E-1, 2)Innervated muscle template waveforms recorded at 25 mm and 50 mm (cut end effect) respectively. (F-1–4) Denervated templatewaveforms recorded from 25 mm, 50 mm (cut termination), 50 mm (crush termination), and 50.35 mm (crush termination) respectively.
Single Muscle Fiber Transformation MUSCLE & NERVE December 1998 1761
phasic initially positive potential referred to as thecut termination (CT) template (Fig. 1F-2). Detectinga potential at the fiber’s end utilizing a ‘‘crush end’’effect generated a large-magnitude potential resem-bling a PSW (Fig. 1F-3). Recording locations beyondthe fiber’s termination for either end effect yieldedpotentials identical in configuration to the 50-mmsite, but smaller in amplitude. A recording at 50.35mm for the crush end effect generated a PSW with amagnitude similar to that for the FP and served asthe PSW template (Fig. 1F-4).
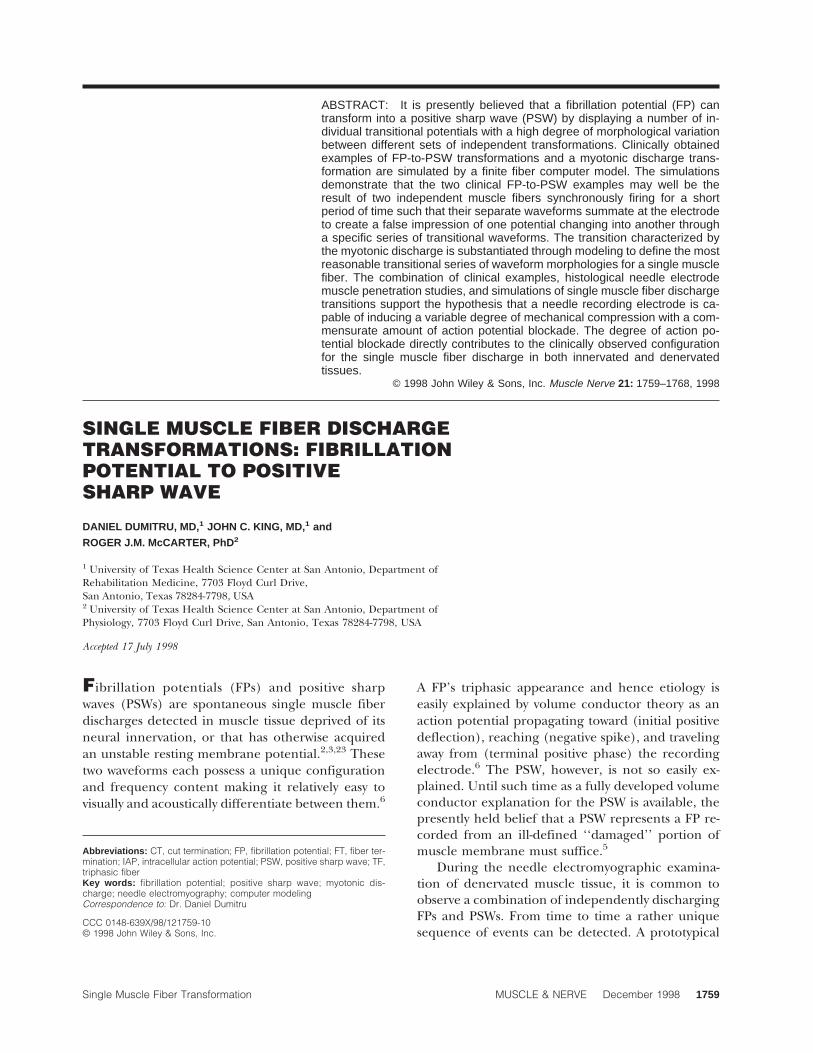
Triphasic to Biphasic Waveform Transformation.Waveform Transformation No. 1. The FP template
correlated with the first clinically documented po-tential (Fig. 2A-1, B-1) (Table 1). The second clini-cally recorded potential (Fig. 2A-2) was similar to thefirst waveform but reduced in amplitude. The FPtemplate was also reduced by an appropriate factor(Fig. 2B-2). The third and fourth clinically detectedwaveforms were further reduced in magnitude (Fig.2A-3, 4), and were simulated by similar amplitudereductions (Fig. 2B-3, 4). The fifth clinically docu-
FIGURE 3. (A) Six waveforms recorded from a 77-year-old patient showing a FP-to-PSW transformation. (B) Six simulated waveformswith a similar appearance to those potentials clinically recorded.
FIGURE 2. (A) A series of eight waveforms are depicted as being representative of a FP-to-PSW transformation. (Reproduced withpermission.)15 (B) Eight simulated waveforms attempting to duplicate the above waveform transformations.
1762 Single Muscle Fiber Transformation MUSCLE & NERVE December 1998

mented potential was simulated by further reducingthe FP template and adding a cut end template (Fig.1F-2) reduced in magnitude as well as delayed 1.3 mswith respect to the FP template. This yielded a wave-form similar to that observed clinically (Fig. 2A-5,B-5). The sixth observed waveform (Fig. 2A-6) re-quired two representations of the CT template ap-propriately reduced in magnitude. The second po-tential was then delayed 2.8 ms with respect to thefirst waveform and added to it (Fig. 2A-6, B-6). Theseventh waveform was simulated by summating twoappropriately reduced CT templates with an inter-potential delay of 5.7 ms (Fig. 2A-7, B-7). The verticalperspective between the two positive peaks observedin the clinically obtained waveform is believed tohave resulted from baseline drift. The eighth andfinal documented potential (Fig. 2A-8) was simu-lated as solely the CT template (Fig. 2B-8).
Waveform Transformation No. 2. As with the otherwaveform series, the FP template served as the firstsimulated waveform (Fig. 3A-1, B-1) (Table 2). Thesecond recorded waveform (Fig. 3A-2) was simulatedby adding a reduced PSW template to the FP tem-plate delayed by 1.1 ms (Fig. 3B-2). Simulating thethird observed waveform (Fig. 3A-3) required a re-duced magnitude CT template to be added to a re-duced PSW template and delayed 0.9 ms (Fig. 3B-3).A fourth documented waveform (Fig. 3A-4) was gen-erated by using the CT template simulated for theprevious waveform and adding it to a reduced PSWtemplate delayed 1.3 ms (Fig. 3B-4). The fifth de-tected potential (Fig. 3A-5) was modeled by usingonly the CT template’s initial positive phase, but re-duced in magnitude. This waveform was added to areduced amplitude PSW template and delayed 4.1ms (Fig. 3B-5). The final waveform in the observed
Table 1. FP-to-PSW transformation no. 1.
WaveformTemplate
no. 1 SFTemplate
no. 2 SF
Temporaldelay(ms)
1 FP 1.02 FP 0.893 FP 0.734 FP 0.645 FP 0.46 CT 0.22 1.36 CT 0.22 CT 0.25 2.87 CT 0.19 CT 0.25 5.78 CT 0.19
Waveform: designated waveform simulated in Figure 2. Temporal delay:time in milliseconds waveform template no. 2 is delayed with respect totemplate no. 1. FP, fibrillation potential template; SF, scaling factor; CT,cut termination template.
FIGURE 4. (A) A series of potentials recorded from a patient with myotonic dystrophy. (B) Simulated series attempting to reproduce theclinically detected waveforms.
Table 2. FP-to-PSW transformation no. 2.
WaveformTemplate
no. 1 SFTemplate
no. 2 SF
Temporaldelay(ms)
1 FP 1.02 PSW 0.38 FP 1.0 1.13 CT 0.51 PSW 0.5 0.94 CT 0.51 PSW 0.65 1.35 CT* 0.51 PSW 0.57 4.16 PSW 0.47
Waveform: designated waveform simulated in Figure 4. Temporal delay:time in milliseconds waveform template no. 2 is delayed with respect totemplate no. 1. FP, fibrillation potential; PSW, positive sharp wavetemplate; SF, scaling factor; CT, cut termination template.*Only the initial depolarization phase of the CT was used.
Single Muscle Fiber Transformation MUSCLE & NERVE December 1998 1763
series (Fig. 3A-6) was simulated by reducing the PSWtemplate (Fig. 3B-6).
Myotonic Waveform Transformation. A myotonicdischarge transforming from a triphasic to a biphasicpotential is modeled by using the innervated IAPtemplate waveforms (TF and FT; Figs. 1E-1 and 2) inappropriate proportions to generate the desiredwaveforms (Table 3). The first 11 waveforms wererepresented by the TF template sequentially repro-duced with the same interpotential time intervals ob-served clinically (Fig. 4A, B).
In order to simulate the twelfth potential, it wasarbitrarily assumed that 10% of the action potentialexperienced blockade while 90% continued topropagate. The magnitude of the FT fraction re-quired action potential blockade to occur 130 µm(as determined by the finite fiber model) prior toreaching the electrode (Fig. 4A, B). Appropriatelyscaled TF and FT templates were summated with notemporal offset. It was assumed that waveform 13 wasgenerated by 15% action potential blockade whichrequired the block to occur 140 µm from the elec-trode (Fig. 4A, B). The TF and FT templates weresimilarly summated with no temporal delay. An as-sumption of 30% action potential blockade wasmade for waveform 14 which necessitated a distanceof 170 µm from the electrode and the appropriatelymodeled templates were summated without a tem-poral shift. The 15th potential assumed 45% actionpotential blockade 200 µm from the electrode andagain the templates were summated without a timedelay.
Potentials 16, 17, and 18 were generated by as-suming 100% action potential blockade at distancesfrom the electrode of 250, 300, and 340 µm respec-tively (Fig. 4B). The FT templates were simulated toconform to the clinically observed potentials. All re-
maining potentials were of similar magnitude andconsistent with action potential blockade at 380 µm.Appropriate interpotential intervals were simulatedto conform to those observed clinically (Fig. 4A, B).
Electrode/Muscle Fiber Physical Relationship.Light Microscopy. A cross section through both
the needle electrode and investing muscle tissue re-veals a number of interesting findings. Some of themuscle fibers immediately adjacent to the elec-trode’s conical recording surface are significantlycompressed (Fig. 5). There are also many fibers thatsustained only a mild degree of distortion (Fig. 5).Those muscle fibers immediately opposite theneedle tip are compressed into their neighbor fibers.
Electron Microscopy. A scanning electron micro-graph reveals how the muscle tissue and its investingconnective tissue are disrupted by the penetratingelectrode (Fig. 6A). Removal of the electrode dem-onstrates the cavity produced, and how the musclefibers ‘‘bend around,’’ and are distorted by, the elec-trode (Fig. 6B).
DISCUSSION
Documentation exists suggesting a FP can transforminto a PSW.4,15 The initial four potentials comprisingthe literature example15 of a FP-to-PSW transforma-tion (Fig. 2A, B) were successfully simulated by se-quentially decreasing the FP template magnitude(Table 1). A magnitude reduction for these first fourwaveforms without a concomitant alteration in con-figuration implies an increase in separation betweenthe waveform’s generator source (muscle fiber) andrecording electrode. Simulating the fifth clinicallydetected potential first required the FP template tobe further reduced in magnitude (Table 1). Then areduced magnitude CT potential (Table 1) with a1.3-ms delay was added (Fig. 2A, B). The manner inwhich the fifth waveform was constructed suggeststhat the additional FP amplitude reduction resultedfrom continued electrode to muscle relative move-ment. This needle movement is assumed to eitherdirectly induce, or at least permit, recording of asecond spontaneous single muscle fiber discharge.The simulation suggests the second discharge fol-lowed the FP template waveform by approximately1.3 ms, but experienced action potential blockadebefore reaching the electrode. Action potentialblockade is assumed because adding a blocked wave-form potential (CT template; Fig. 1F-2) adequatelysimulated the appropriate waveform configuration.These two waveforms were then summated to gen-erate the clinically observed potential. The light andelectron microscopic assessment of electrode place-
Table 3. Myotonic waveform transformation.
WaveformTemplate
no. 1 SFTemplate
no. 2 SF
Temporaldelay(ms)
1–11 TF 1.012 TF 0.90 FT 0.04 0.013 TF 0.85 FT 0.05 0.014 TF 0.70 FT 0.07 0.015 TF 0.55 FT 0.10 0.016 FT 0.3717 FT 0.3218 FT 0.2619–23 FT 0.23
Waveform: designated waveform simulated in Figure 5. Temporal delay:time in milliseconds waveform template no. 2 is delayed with respect totemplate no. 1. TF, triphasic fiber template; FT, fiber terminationtemplate; SF, scaling factor.
1764 Single Muscle Fiber Transformation MUSCLE & NERVE December 1998
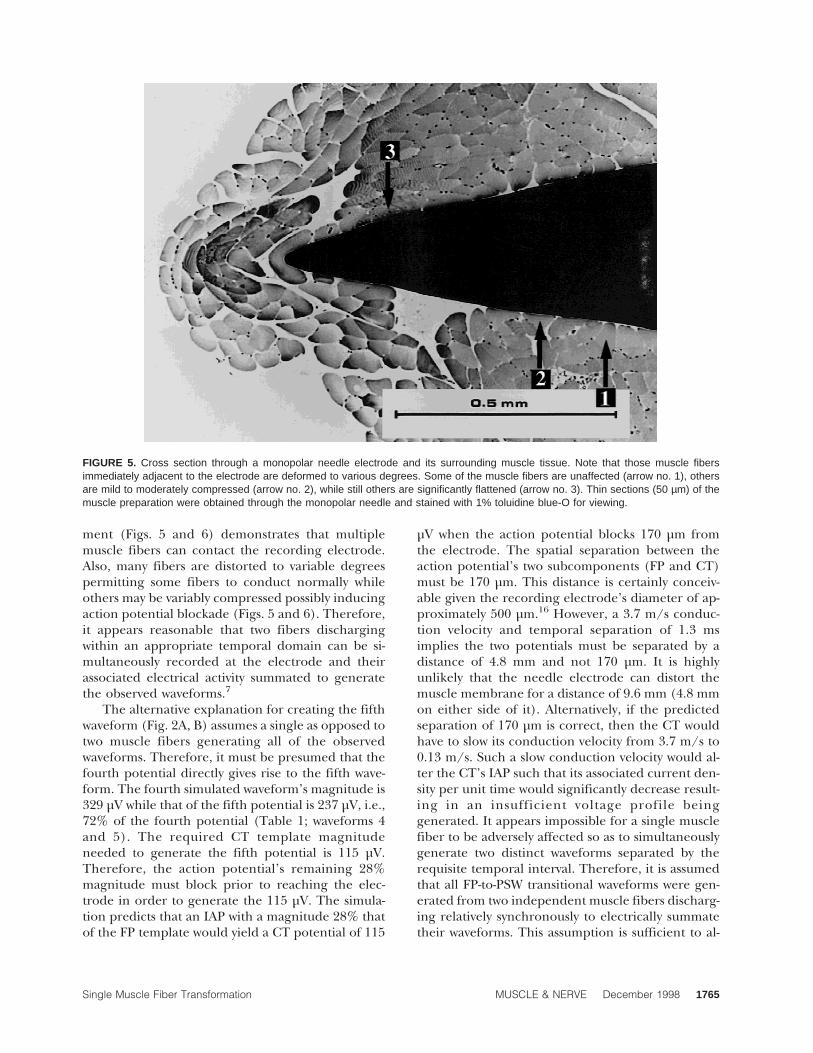
ment (Figs. 5 and 6) demonstrates that multiplemuscle fibers can contact the recording electrode.Also, many fibers are distorted to variable degreespermitting some fibers to conduct normally whileothers may be variably compressed possibly inducingaction potential blockade (Figs. 5 and 6). Therefore,it appears reasonable that two fibers dischargingwithin an appropriate temporal domain can be si-multaneously recorded at the electrode and theirassociated electrical activity summated to generatethe observed waveforms.7
The alternative explanation for creating the fifthwaveform (Fig. 2A, B) assumes a single as opposed totwo muscle fibers generating all of the observedwaveforms. Therefore, it must be presumed that thefourth potential directly gives rise to the fifth wave-form. The fourth simulated waveform’s magnitude is329 µV while that of the fifth potential is 237 µV, i.e.,72% of the fourth potential (Table 1; waveforms 4and 5). The required CT template magnitudeneeded to generate the fifth potential is 115 µV.Therefore, the action potential’s remaining 28%magnitude must block prior to reaching the elec-trode in order to generate the 115 µV. The simula-tion predicts that an IAP with a magnitude 28% thatof the FP template would yield a CT potential of 115
µV when the action potential blocks 170 µm fromthe electrode. The spatial separation between theaction potential’s two subcomponents (FP and CT)must be 170 µm. This distance is certainly conceiv-able given the recording electrode’s diameter of ap-proximately 500 µm.16 However, a 3.7 m/s conduc-tion velocity and temporal separation of 1.3 msimplies the two potentials must be separated by adistance of 4.8 mm and not 170 µm. It is highlyunlikely that the needle electrode can distort themuscle membrane for a distance of 9.6 mm (4.8 mmon either side of it). Alternatively, if the predictedseparation of 170 µm is correct, then the CT wouldhave to slow its conduction velocity from 3.7 m/s to0.13 m/s. Such a slow conduction velocity would al-ter the CT’s IAP such that its associated current den-sity per unit time would significantly decrease result-ing in an insufficient voltage profile beinggenerated. It appears impossible for a single musclefiber to be adversely affected so as to simultaneouslygenerate two distinct waveforms separated by therequisite temporal interval. Therefore, it is assumedthat all FP-to-PSW transitional waveforms were gen-erated from two independent muscle fibers discharg-ing relatively synchronously to electrically summatetheir waveforms. This assumption is sufficient to al-
FIGURE 5. Cross section through a monopolar needle electrode and its surrounding muscle tissue. Note that those muscle fibersimmediately adjacent to the electrode are deformed to various degrees. Some of the muscle fibers are unaffected (arrow no. 1), othersare mild to moderately compressed (arrow no. 2), while still others are significantly flattened (arrow no. 3). Thin sections (50 µm) of themuscle preparation were obtained through the monopolar needle and stained with 1% toluidine blue-O for viewing.
Single Muscle Fiber Transformation MUSCLE & NERVE December 1998 1765

low reasonable simulations for all the clinically re-corded FP-to-PSW transitions (Figs. 2 and 3).
The sixth waveform in the first transformationseries (Fig. 2A and B) required the summation oftwo CT potentials (Table 1). In this instance, we as-sume the same cut termination potential comprisinga portion of the fifth waveform (0.22 CT; Table 1)continues to be recorded by the electrode. Also, weassume the previously detected FP (0.46 FP; Table 1)in part generating the fifth waveform now experi-ences complete action potential blockade so as togenerate the second required CT waveform (0.25CT; Table 1). The simulation predicts that the de-sired CT waveform magnitude would be achieved ifIAP blockade occurred at 160 µm. However, as pre-viously discussed, the temporal separation of 2.8 ms
argues for two independently firing waveforms. Theseventh waveform in this series (Fig. 2A, B) is formu-lated with similar assumptions to that of the sixthpotential with the exception of a temporal separa-tion of 5.7 ms and a further decline in the initial CTtemplate waveform (Table 1). This CT template re-duction suggests that the blocked membrane seg-ment increased in length. It is presumed that theelectrical activity from the two independently firingmuscle fibers is summating less synchronously. Fi-nally, the eighth waveform is generated solely by the0.19 CT magnitude waveform (Table 1). The previ-ously detected potential (0.25 CT template) eitherceased firing, or is too temporally separated from thefirst potential to continue to be observed. An addi-tional reported FP-to-PSW transformation4 was mod-eled with findings similar to those reported for thetwo previously detailed waveform transformationsabove with similar conclusions of requiring two in-dependently discharging fibers.
It is important to note that the simulated wave-forms are not identical to the clinically observedwaveforms. The potentials’ simulated magnitudesare primarily dependent upon the IAP parameterschosen. The amplitudes of simulated potentials areconsistent with each other within a particular seriesand correlate well to sequential potentials clinicallydetected. The exact configuration of the potentialscan be anticipated to vary somewhat from clinicalpotentials since there may be slight differences inactual versus simulated IAPs, lack of tissue filteringand environmental noise in the simulated record-ings, as well as a simulated point compared to anactual recording electrode. Despite these differ-ences, it is the process required to model the clinicalpotentials that represents the model’s relevance toproviding clinical insights.
The second transitional waveform series demon-strates yet another mechanism of apparently gener-ating a PSW from a FP. As before, the first clinicallyobserved FP is commensurate with the FP template(Fig. 3A, B; Table 2). All transitional potentials werecomprised of different magnitude FPs and PSWsagain with interpotential intervals precluding theelectrode from spatially distorting the muscle fibersufficiently to produce both subcomponent wave-forms. Of note, only the initial positive phase of a CTtemplate was used for one of the subcomponentwaveforms in simulating the fifth potential (Fig. 3A,B; Table 2). The justification for using only the ini-tial positive phase of the cut template potential isthat the cut termination effect may have changed sothat it can still permit a normal passive current flow,but its voltage-gated sodium channels are adversely
FIGURE 6. (A) Electron micrograph of a monopolar needle withinthe muscle tissue. (B) Removal of the electrode reveals a cavitywith muscle fibers demonstrating the needle-induced fiber distor-tion. The muscle was appropriately buffered and fixed in 1% os-mium tetroxide and dehydrated in graded tert-butylalcohol fol-lowed by a second dehydration and coated with gold–palladium.
1766 Single Muscle Fiber Transformation MUSCLE & NERVE December 1998
affected such that they respond very slowly and takeconsiderably longer to open. This slow openingwould result in a very low-amplitude long-durationnegative sink which cannot be observed on the am-plitude and time scale used to display its initial,briefer and larger depolarization phase. As notedabove, a time delay of 4.1 ms implies a differentialeffect of action potential spatial separation of 15.2mm if one wishes to consider a single fiber somehowresponsible for both potentials observed, whichstretches credibility. The last potential (Fig. 3A, B) issimply a PSW. It is assumed that the previously de-scribed distorted CT potential ceased firing withinthe same temporal domain as the PSW leaving onlythe previously firing PSW to be observed (Table 2).
In the above examples, the most reasonable con-clusion is that a single FP is first observed. Theneither through slight needle movement or coinci-dentally, a second discharge occurs from a nearbyfiber, firing within a relatively synchronous temporaldomain permitting electrical summation of the twopotentials. This second fiber experiences action po-tential blockade in the electrode’s vicinity so as togenerate a transient hybrid waveform. Finally, one ofthe two potentials within this temporal domain ei-ther stops firing, or no longer temporally coincideswith the first waveform. The net results appears to bea FP transforming into a PSW. This phenomena isobserved for normal appearing motor unit actionpotentials which transiently summate creating theappearance of polyphasic potentials.6 Although notobserved in this investigation, it is entirely conceiv-able that a PSW could be the first potential observedwhich then coincidentally fires within an appropri-ate temporal domain with a FP to generate a series ofsummated transitional potentials. The PSW couldthen cease firing leaving only the FP to be observed.
These examples, however, do not completelyeliminate the possibility of a single muscle fiber trulytransforming from one type of configuration intoanother. An interesting disease, myotonic dystro-phy,10 typically generates potentials that routinelychange from an initially positive triphasic to initiallypositive biphasic potential with similar durations of3–5 ms.18 A typical series of myotonic potentials isclinically recorded and successfully simulated whichincludes a region where a triphasic potential transi-tions to a biphasic waveform (Fig. 4A, B). It is highlyplausible that a single muscle fiber generated bothof these waveforms displaying a more likely series oftransitional waveforms than observed for the FP-to-PSW transformation. The myotonic simulation sug-gests that a single fiber can progressively block inboth magnitude and distance from the electrode to
yield a series of transitional waveforms (Fig. 4A, B;Table 3) but these are quite unlike those FP-to-PSWtransitions observed in the denervated tissues.
The FP or PSW can reasonably transition intoeach other given reversible electrode-induced me-chanical fiber blockade, but only displaying mor-phologies consistent with those observed for themyotonic potential. It is proposed that the prototypi-cal single muscle fiber waveform transition conformsto those potentials observed for myotonic dischargesand not the previously suggested FP-to-PSW transfor-mations. Based on the findings of this investigation,the FP-to-PSW transformations described in the lit-erature and in this study are considered by the in-vestigators to arise from two independently discharg-ing fibers that transiently generate summatedelectrical activity within a temporal domain condu-cive to mistakenly identifying one waveform as‘‘transforming’’ into another. The configuration ofbiphasic initially positive waveforms required tosimulate the various transitional waveforms suggeststhat the needle electrode can induce either a partialor a total action potential blockade. The histologicalexamples of a monopolar needle penetrating muscletissue provide support for this assumption (Fig. 5and 6). Despite the fact that complex and variableapparently ‘‘single’’ muscle fiber discharges can beobserved during the needle electromyographic ex-amination, these waveforms are considered to becomposite or hybrid potentials and consist of com-binations of more familiar single muscle fiber dis-charges, i.e., FP and PSWs.7–9
We are grateful to Dick F. Stegeman, PhD for his developmentand direction regarding the single muscle fiber simulation pro-gram.
REFERENCES
1. Buchthal F, Rosenfalck P: Rate of impulse conduction in de-nervated human muscle. Electroencephalogr Clin Neurophysiol1958;10:521–526.
2. Buchthal F, Rosenfalck P: Spontaneous electrical activity ofhuman muscle. Electroencephalogr Clin Neurophysiol 1966;20:321–336.
3. Buchthal F: Fibrillations: clinical electrophysiology, in CulpWJ, Ochoa J (eds): Abnormal Nerve and Muscle Generators. NewYork, Oxford University Press, 1982, pp 632–662.
4. Daube J: AAEM Minimonograph #11: Needle examination inclinical electromyography. Muscle Nerve 1991;14:685–700.
5. Dumitru D, DeLisa JA: Volume conduction. Muscle Nerve1991;14:605–624.
6. Dumitru D: Electrodiagnostic Medicine. Philadelphia, Hanley &Belfus, 1995, pp 29–64, 211–248.
7. Dumitru D, King JC, Stegeman DF: Varied morphology ofspontaneous single muscle fiber discharges. Am J Phys MedRehabil 1998;77:128–139.
8. Dumitru D, King JC, Stegeman DF: Endplate spike morphol-ogy: a clinical and simulation study. Arch Phys Med Rehabil1998;79:634–640.
Single Muscle Fiber Transformation MUSCLE & NERVE December 1998 1767

9. Dumitru D, King JC, Stegeman DF: Normal needle electro-myographic insertional activity morphology: a clinical andsimulation study. Muscle Nerve 1998;21:910–920.
10. Franke CH, Hatt H, Iaizzo PA, Lehmann-Horn F: Character-istics of Na+ channels and Cl- conductance in resealed musclefiber segments from patients with myotonic dystrophy. J Phys-iol (Lond) 1990;425:391–405.
11. Gootzen THJM, Stegeman DF, Van Oosterom A: Finite limbdimensions and finite muscle length in a model for the gen-eration of electromyographic signals. Electroencephalogr ClinNeurophysiol 1991;81:152–162.
12. Gydikov A, Gerilovsky L, Radicheva N, Trayanova N: Influ-ence of the muscle fibre end geometry on the extracellularpotentials. Biol Cybern 1986;54:1–8.
13. Jarcho LW, Berman B, Dowben RM, Lilienthal JL: Site oforigin and velocity of conduction of fibrillary potentials indenervated skeletal muscle. Am J Physiol 1954;178:129–134.
14. Jewett DL, Deupree DL: Far-field potentials recorded fromaction potentials and from a tripole in a hemicylindrical vol-ume. Electroencephalogr Clin Neurophysiol 1989;72:439–449.
15. Kimura J: Electrodiagnosis in Diseases of Nerve and Muscle: Prin-ciples and Practice, 2nd ed. Philadelphia, F.A. Davis, 1989, pp249–274.
16. King JC, Dumitru D, Stegeman D: Monopolar needle elec-trode spatial recording characteristics. Muscle Nerve 1966;19:1310–1319.
17. McCarter R, Maxwell LC: Structure and function of the de-veloping diaphragm, in Brans Y, Kuchl TJ (eds): Non-human
Primates in Perinatal Research. New York, Wiley, 1988, pp321–331.
18. Moxley RT: Myotonic muscular dystrophy, in Rowland LP,DiMauro S (eds): Handbook of Clinical Neurology. Vol 18 (62):Myopathies. Amsterdam, Elsevier, 1992, pp 209–259.
19. Rosenfalck P: Intra- and extracellular potential fields of activenerve and muscle fibers. A physico-mathematical analysis ofdifferent models. Acta Physiol Scand 1969(suppl 321):1–168.
20. Stalberg EV: Propagation velocity in human muscle fibers insitu. Acta Physiol Scand 1966;70(suppl 287):1–112.
21. Stegeman DF, Linssen WHJP: Muscle fibre membrane elec-trophysiology and surface EMG: a simulation study. J Electro-myogr Kinesiol 1992;2:130–140.
22. Thesleff S: Spontaneous electrical activity in denervated ratskeletal muscle, in Gutmann E, Hnik P (eds): The Effect of Useand Disuse on Neuromuscular Functions. Prague, PublishingHouse Of The Czechoslovak Academy Of Sciences, 1963, pp41–51.
23. Thesleff S, Ward MR: Studies on the mechanism of fibrillationpotentials in denervated muscle. J Physiol (Lond) 1975;244:313–323.
24. Van der Hoeven JH, Zwarts MJ, Van Weerden TW: Musclefiber conduction velocity in amyotrophic lateral sclerosis andtraumatic lesions of the plexus brachialis. ElectroencephalogrClin Neurophysiol 1993;89:304–310.
25. Van Veen BK, Wolters H, Wallinga W, Rutten WL, Boom HB:The bioelectric source in computing single muscle fiber ac-tion potentials. Biophys J 1993;64:1492–1498.
1768 Single Muscle Fiber Transformation MUSCLE & NERVE December 1998