single technology appraisal dacomitinib for untreated egfr
TRANSCRIPT

© National Institute for Health and Care Excellence 2019. All rights reserved. See Notice of Rights. The content in this publication is owned by multiple parties and may not be re-used without the permission of the relevant copyright owner.
Single Technology Appraisal
Dacomitinib for untreated EGFR-positive non-small-cell lung cancer [ID1346]
Committee Papers

© National Institute for Health and Care Excellence 2019. All rights reserved. See Notice of Rights. The content in this publication is owned by multiple parties and may not be re-used without the permission of the relevant copyright owner.
NATIONAL INSTITUTE FOR HEALTH AND CARE EXCELLENCE
SINGLE TECHNOLOGY APPRAISAL
Dacomitinib for untreated EGFR-positive non-small-cell lung cancer [ID1346]
Contents: 1. Pre-Meeting Briefing
2. Final Scope and Final Matrix of Consultees and Commentators
3. Company submission summary from Pfizer
4. Clarification letters
NICE request to the company for clarification on their submission Company response to NICE’s request for clarification Follow up company response to NICE’s request for clarification
5. Patient group, professional group and NHS organisation submission
from: Roy Castle Lung Foundation British Thoracic Oncology Group
6. Expert personal perspectives from:
Alistair Greystoke – clinical expert, nominated by Pfizer Carol Davies – patient expert, nominated by National Lung Cancer
Forum for Nurses (NLCFN Peter Clark – CDF clinical lead
7. Evidence Review Group report prepared by Warwick Evidence
8. Evidence Review Group report – factual accuracy check 9. Evidence Review Group report- addendum
10. Evidence Review Group report – erratum
Any information supplied to NICE which has been marked as confidential, has been
redacted. All personal information has also been redacted.

© NICE 2019. All rights reserved. Subject to notice of rights. The content in this publication is owned by multiple parties and may not be re-used without the permission of the relevant copyright owner.
Pre-meeting briefing
Dacomitinib for untreated EGFR-positive non-small-cell lung cancer (ID1346)
This slide set is the pre-meeting briefing for this appraisal. It has been prepared by the technical team with input from the committee lead team and the committee chair. It is sent to the appraisal committee before the committee meeting as part of the committee papers. It summarises:
– the key evidence and views submitted by the company, the consultees and their nominated clinical experts and patient experts and
– the Evidence Review Group (ERG) report
It highlights key issues for discussion at the first appraisal committee meeting and should be read with the full supporting documents for this appraisal
Please note that this document includes information from the ERG before the company has checked the ERG report for factual inaccuracies
The lead team may use, or amend, some of these slides for their presentation at the Committee meeting

KM Kaplan Meier
NMA Network meta-analysis
NSCLC Non-small-cell lung cancer
ORR Objective response rate
OS Overall survival
PAS Patient access scheme
PFS Progression-free survival
PRO Patient-reported outcome
QALY Quality-adjusted life year
RCT Randomised controlled trial
SST Subsequent systemic therapy
TA Technology appraisal
TKI Tyrosine kinase inhibitor
TTF Time to treatment failure
Abbreviations
2
AE Adverse event
CDF Cancer Drugs Fund
CNS Central nervous system
CS Company submission
CSR Clinical study report
DoR Duration of response
ECOG PS
Eastern Cooperative Oncology Group performance status
EGFR Epidermal growth factor receptor
ERG Evidence review group
FP Fractional polynomial
HR Hazard ratio
HRQoL Health-related quality of life
IRC Independent review committee

CONFIDENTIAL
Key issues – clinical effectiveness
3
• Are the results from ARCHER 1050 generalisable to clinical practice?
– The trial included no UK centres and only XXX of participants were from European countries
– The trial included people with EGFR positive NSCLC specifically with exon 19 deletion (del19) and exon 21 L858 substitutions (L858R) only and ECOG performance score 0 or 1 and excluded people with brain metastases
– The trial has a high proportion of people with an Asian family origin
• Is the ARCHER 1050 bias in favour of dacomitinib because the dacomitinib treatment arm had more females, and ECOG performance score of 0?
• Is the company’s fractional polynomial (FP) model appropriate for decision making?
– Are the patients in ARCHER 1050 and LUX-lung 7 similar?
– The ERG considers that the transitivity assumption may be violated
– The company does not present results of the indirect comparison between dacomitinib and afatinib
– The ERG had concerns over the use of the FP analysis with respect to the extrapolations for the survival outcomes.
• Is it reasonable to assume equal efficacy between erlotinib and gefitinib?

CONFIDENTIAL
Key issues – cost effectiveness
4
• Does the generalised gamma (company) or log-normal (ERG) parametric curve for gefitinib give more clinically plausible PFS estimates?
• Does the generalised gamma (company) or log-logistic (ERG) parametric curve for gefitinib give more clinically plausible OS estimates?
• Is it reasonable to assume equal efficacy between dacomitinib and the comparators from month 36 onwards for OS?
• Is it clinically plausible that dacomitinib provides both pre- and post-progression benefit?
• Is the utility value of 0.64 from literature (company) or XXX from ARCHER 1050 (ERG) a more clinically plausible post-progression utility value?
• Is it reasonable to include disutilities associated with adverse events?
• Does the modelling of the proportion of patients receiving subsequent therapy after a first line TKI and the subsequent therapies received reflect clinical practice?
• Should the cost for rebiopsy for osimertinib (currently the CDF) be included in the model?

BackgroundNon-small-cell lung cancer (NSCLC)
5
• Lung cancer → more than 45,000 people were diagnosed in England in 2016
• Mostly diagnosed at an advanced stage → cancer has spread to lymph nodes and other organs in the chest (locally advanced disease; stage III) or to other parts of the body (metastatic disease; stage IV)
• NSCLC = estimated up to 85 to 90% of lung cancer cases
• In 2016, approximately 32,500 people were diagnosed with NSCLC in England, and around 61% had stage IIIB or stage IV disease
• 1-year survival for stage III NSCLC is 42.5%, for stage IV it is 15.5%
• Approximately 70% of NSCLC are of non-squamous histology and can be either large-cell undifferentiated carcinoma or adenocarcinoma
• Approximately 5–50% of NSCLC cases are characterised by del19 and L858R EGFR alterations, depending on ethnicity, sex, smoking status and histological subtype
• Prognosis for people with EGFR positive NSCLC is slightly better than general NSCLC → outcomes are still poor

Treatment pathway in the UK: EGFR positive NSCLC
6
Erlotinib (TA258) Gefitinib (TA192) Afatinib (TA310)
If T790M positive, osimertinib (TA422, CDF)
Pemetrexed plus cisplatin (TA181) or carboplatin +/- pemetrexed
maintenance (TA190 & TA402)
Chemotherapy plus platinum drug or single agent chemotherapy
(CG121) +/- pemetrexed maintenance (TA190 & TA402)
Dacomitinib
Confirmed EGFR positive NSCLC

CONFIDENTIAL
Dacomitinib
7
Mechanism of action
Second generation tyrosine kinase inhibitor (TKI) → selective and irreversible TKI that has activity against 3 members of the ErbBfamily of proteins (EGFR/HER-1, HER2 and HER4)
CHMP positive opinion
Dacomitinib as monotherapy for the first-line treatment of adult patients with locally advanced or metastatic NSCLC with EGFR-activating mutations
Administration & dosage
One oral 45mg dose daily (available in three dose strengths –45mg, 30mg and 15mg) until disease progression or unacceptable toxicity
Cost (list price) List price: XXXX for 30 x 15mg or 30 x 30mg or 30 x 45mg capsules
Average cost of treatment course (list price)
Based on the mean treatment duration of XXX months in the economic model, the average cost of treatment is XXXX list price and XXXX (with PAS)
Patient access scheme (PAS)
PAS application has been approved by NHS England for dacomitinib. This provides a simple discount to the list price

Decision problem
8
Final Scope Company
Population People with untreated locally advanced or metastatic NSCLC with EGFR activating mutation(s)
✓ - only included del19 and L858R EGFR mutations
Intervention Dacomitinib ✓Outcomes Overall survival
Progression-free survival Overall response rate Duration of response Adverse events of treatment, Health-related quality-of-life
✓
Comparators Afatinib, erlotinib, gefitinib ✓Subgroups None ✓
ERG comment: Trial population is narrower than the scope. Approx. 90% of EGFR+ mutations are del19 & L858R.

Clinical expert perspective
9
• There is an unmet need → comparators can control the disease but progression occurs on average within 12 months
• Repeat biopsy is taken on progression → receive osimertinib if tumour is T790M positive. If not T790M positive, receive platinum doublet chemotherapy or continue initial therapy beyond progression
• People are reluctant to change to chemotherapy in this setting
• Dacomitinib is the 1st EGFR inhibitor to show survival benefit → improved OS and PFS over the 1st and 2nd generation EGFR inhibitors in use in current clinical practice
• Toxicity profile similar to afatinib → diarrhoea and skin toxicity can impact on a patient quality of life but shouldn't cause too many problems if managed appropriately
• Dacomitinib requires dose adjustments in a number of patients, as does afatinib → gefitinib and erlotinib do not
• Real world data from EGFR inhibitors matches relatively well to trial data except people with poorer ECOG performance status and active bran metastases do worse than trial population
• Third generation TKIs such as osimertinib now have data available → improved safety profile compared with dacomitinib → likely use 3rd generation TKIs instead of 2nd generation

Patient expert perspective
10
• There is an need for treatments with better outcomes than currently available
• People with EGFR positive NSCLC tend to be younger, female and have never smoked when compared with the overall NSCLC population
• People tend to have a poor outlook on disease progression → impacting family and carers
• Life extension is of paramount importance to people with EGFR positive NSCLC and their families
• Side effects are similar to other TKIs → rashes and diarrhoea most common grade 3 to 4 adverse events but anecdotal experience reports that dacomitinib relatively well tolerated
• Easy administration as dacomitinib is an oral therapy
Submission received from Roy Castle Lung Foundation

Professional organisation perspective
11
• The second generation drug dacomitinib adds a further first line alternative treatment for untreated EGFR positive NSCLC
• The ARCHER 1050 trial demonstrated a PFS, and importantly OS, advantage over current standard of care, gefitinib
• People with brain metastases were excluded from the ARCHER 1050 trial → outcomes in the real world may differ from the trial evidence
• Longer-term impact of dacomitinib may be limited as 3rd generation TKIs (e.g. osimertinib) may replace its use if they are approved
Submission received from British Thoracic Oncology Group

12
Clinical effectiveness

Summary of sources of evidence
13
Evidence type Comparison Source of evidence
RCT Dacomitinib compared with gefitinib
ARCHER 1050
NMA Dacomitinib compared with afatinib
LUX-Lung 7ARCHER 1050
Assumption Assumed equal clinical efficacy between erlotinib and gefitinib
Based on committee conclusion in NICE appraisal of afatinib TA310

Design Phase III, randomised, multicentre, open-label study
Population • People with locally advanced or metastatic newly diagnosed, treatment-naïve NSCLC or with recurrent NSCLC
• All eligible patients had tumours that tested positive for at least one EGFR-activating mutation (either the del19 or L858R)
Intervention, dose Dacomitinib (n=227), 45 mg orally, once daily
Comparator, dose Gefitinib (n=224), 250 mg orally, once daily
1∘ outcome PFS (IRC assessment)
2∘ outcomesPFS (investigator assessment), OS, ORR, DoR, AEs of treatment, TTF (IRC and investigator assessment), HRQoL
Pre-specifiedsubgroups
• Age (<65 years vs >65 years)• Sex• ECOG PS (0 vs 1)• Race (Asian vs non-Asian)• Smoking history (never vs former or current)• EGFR mutation (del19 vs L858R)
PFS = progression-free survival, OS = overall survival, ORR = objective response rate, DoR = duration of response, AE = adverse event, TTF = time-to-treatment failure, IRC = independent review committee, ECOG PS = Eastern Cooperative Oncology Group performance status, HRQoL = Health-related quality of life
Company’s main clinical evidence: ARCHER 1050
14

ARCHER 1050 study design
15
People received treatment for a maximum of 48 months
*

Archer 1050: Baseline characteristics
16
PopulationDacomitinib
N=227GefitinibN=225
Sex, n (%) Male 81 (35.7) 100 (44.4)Family origin, n (%) White 56 (24.7) 49 (21.8)
Black 1 (0.4) 0Asian 170 (74.9) 176 (78.2)
Smoking status, n (%) Never smoked 147 (64.8) 144 (64.0)Ex-smoker 65 (28.6) 62 (27.6)Smoker 15 (6.6) 19 (8.4)
ECOG performance status n, (%)
0 75 (33) 62 (28)1 152 (67) 163 (72)
Disease stage at screening, n (%)
Stage IIIB 18 (8) 16 (7)Stage IV 184 (81) 183 (81)Unknown 25 (11) 26 (12)
Mutation type, n (%) del19 134 (59) 133 (59)L858R 93 (41) 92 (41)
ERG comment: Trial imbalance with sex, and ECOG PS → all potentially favouring the reported effectiveness of dacomitinib. High proportion of Asians and people with brain metastases excluded → may impact generalisability
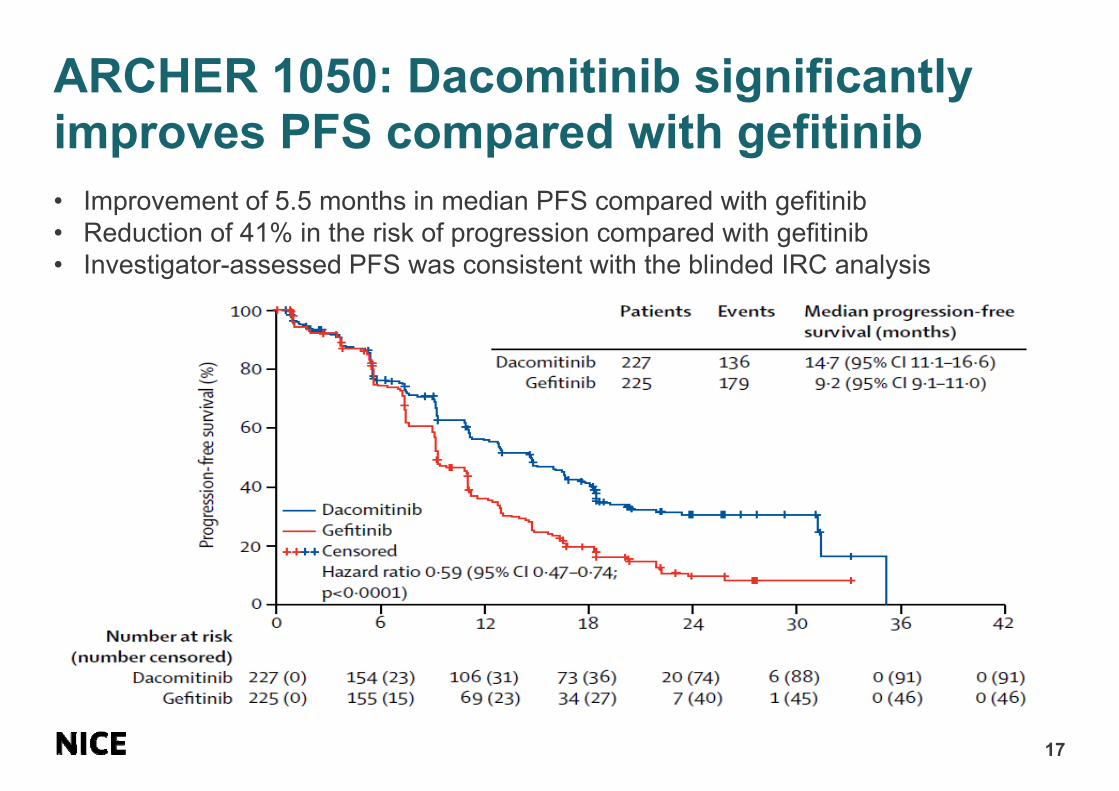
ARCHER 1050: Dacomitinib significantly improves PFS compared with gefitinib
17
• Improvement of 5.5 months in median PFS compared with gefitinib• Reduction of 41% in the risk of progression compared with gefitinib• Investigator-assessed PFS was consistent with the blinded IRC analysis

ARCHER 1050: Dacomitinib significantly improves OS compared with gefitinib
18
• Improvement of 7.3 months in median OS compared with gefitinib• Reduction of 24% in the risk of death compared with gefitinib

CONFIDENTIAL
ARCHER 1050 : Subsequent systemic therapies (SST, from CSR)
19
•Dacomitinib (N=227)
n (%)Gefitinib (N=224)
n (%)
Any SST XXXX XXXX
Number (%) of patients with SST; 2 or more patients in dacomitinib treatment arm
pemetrexed XXXX XXXX
carboplatin XXXX XXXX
cisplatin XXXX XXXX
osimertinib XXXX XXXX
gefitinib XXXX XXXX
docetaxel XXXX XXXX
gemcitabine XXXX XXXX
erlotinib XXXX XXXX
paclitaxel XXXX XXXX
Others XXXX XXXX

CONFIDENTIAL
ARCHER 1050: Health Related Quality of Life
20
Dacomitinib (n=224) Gefitinib (n=221) Difference
VAS Baseline: 73.1 (SD 19.6) End of studya: XXXX
Baseline: 74.7 (SD 17.6)End of studya: XXXX
Baseline: -1.6End of studya: XXXXXX
Utility index Baseline: XXXXXXEnd of studya: XXXX
Baseline: XXXXXXEnd of studya: XXXX
Baseline: XXXXEnd of studya: XXXXXX
EQ-5D = European Quality of Life-5 Dimensions; PRO = patient-reported outcome; VAS =
visual analogue scale; aAssumed by ERG.
EQ-5D-3L absolute score (PRO population)

ARCHER 1050: Dose reductions were higher with dacomitinib than gefitinib
21
• Dose reductions were required in 66.1% and 8.0% of patients in the dacomitinib and gefitinib treatment arms, respectively.
AE categoryDacomitinib
N=227Gefitinib N=224
Any AEs, n (%) 150 (66.1) 18 (8.0)
Gastrointestinal disorders, n (%) 27 (11.9) 3 (1.3)
Skin and subcutaneous tissue disorders, n (%) 91 (40.1) 4 (1.8)
Infections and infestations, n (%) 53 (23.3) 2 (0.9)
Investigations, n (%) 4 (1.8) 7 (3.1)
Dose reductions (for 2% or more of patients in either treatment arm (safety population)

CONFIDENTIAL
ARCHER 1050: Treatment-emergent AEs leading to permanent discontinuation were similar for both treatment arms
22
• Although more patients in the dacomitinib arm than gefitinib arm discontinued treatment temporarily due to AEs, rates of permanent discontinuations due to treatment-related AEs were similar between the treatment arms (XXXX versus XXXX, respectively)
AE, n (%)Dacomitinib
N=227GefitinibN=224
All causality AEsAny AEs XXXXXX XXXXXXTreatment-related AEsAny AEs XXXXXX XXXXXX

Clinical trials of EGFR-TKIs: dacomitiniband afatinib have a higher incidence of common AEs than other TKIs
23
Drug DiarrhoeaStomatitis / Mucositis
ParonychiaDermatitis acneiform
Dacomitinib 85% 41% 62% 49%
Gefitinib (TA192) 34 to 54% 15 to 40% 14 to 32% 15 to 66%
Erlotinib (TA258) 25 to 57% 13% 4% NR
Afatinib (TA310) 88 to 95% 52 to 72% 33 to 57% 81 to 89%
• Data from first-line clinical trials of EGFR-TKIs in patients with advanced NSCLC

Company’s network meta-analysis comparing dacomitinib with afatinib and erlotinib
24
• No direct evidence comparing dacomitinib to UK standard of care therapies, other than gefitinib
• Systematic literature review conducted to identify relevant studies• Gefitinib & erlotinib assumed to be clinically equivalent → based on committee
conclusion for NICE appraisal of afatinib (TA310)• NMA included two studies: LUX-Lung 7 and ARCHER 1050
Afatinib Gefitinib Dacomitinib
Erlotinib
LUX-Lung 7 ARCHER 1050
Equivalent

Comparison of key baseline characteristics in ARCHER 1050 and LUX-LUNG 7
25
Trial Name ARCHER 1050 LUX-Lung 7Arm Dacomitinb Gefitinib Afatinib Gefitinib
N 227 225 160 159Median Age, years 62 61 63 63Males, % 36 44 43 33Asian, % 75 78 59 55ECOG 0, % 33 28 32 30ECOG 1, % 67 72 68 70Brain Metastases, % 0 0 16 15Stage IV, % 81a 81a 95 98Never smoker, % 65 64 66 67Del 19, % 59 59 58 58L858R, % 41 41 42 42a Proportion at screening; in addition, 11% of dacomitinib and 12% of gefitinib were
classified as ‘unknown’ but were newly diagnosed with stage IV a time of study entry.

Company conducted a fractional polynomial analysis as proportional hazards do not hold
26
• Proportional hazards assumption tested and found to not hold for PFS and OS
• Fractional polynomial model used to allow for time-varying hazards to be incorporated into the analysis
• Traditional indirect treatment comparison was explored in scenario analysis
• First and second order fractional polynomial models were explored
• Models were applied to the base-case survival functions for gefitinib then analysed for clinical plausibility

How the company selected the models
27
• DIC was used to compare the goodness-of-fit of different fixed effect models with first- and second-order FPs of different powers P1 and P2. The model with the lowest deviance information criteria (DIC) was considered as the model providing the ‘best’ fit to the observed data.
• The final model was selected after also considering the clinical plausibility of the curves
• For PFS, the lowest DIC model (second-order, P1=1, P2=1.5) overfitted the tail of the KM curve, and the next lowest (P1=0.5, P2=1.5) was considered more clinically plausible
• For OS, the lowest DIC model (P1=1, P2=1.5) similarly overfitted the tail of the KM. None of the second-order FP models were clinically plausible and so the first-order model P1=0 was selected, with P=0.5 applied in scenario analysis

CONFIDENTIAL
Fractional polynomial results for PFS and OS (months):
Means & medians compared with observed data
28
PFS (IRC)Model Geftinib/Erlotinib Dacomitinib Afatinib
Median Mean Median Mean Median MeanP1=0.5; P2=1.5* (company base
case)XXXX XXXX
XXXX XXXX XXXX XXXX
P1=0.5; P2=1*(company scenario
analysis)XXXX XXXX XXXX XXXX
ARCHER 1050 9.23 - 14.65 - - -
*Generated with ‘base’ gefitinib generalised gamma curve
OS
Model Geftinib/Erlotinib Dacomitinib AfatinibMedian Mean Median Mean Median Mean
P1=-0.5* (company base case)
XXXX XXXXXXXX XXXX XXXX XXXX
P1=0* (company scenario analysis)
XXXX XXXX XXXX XXXX
ARCHER 1050 26.84 - 34.07 - - -

ERG comments on fractional polynomial NMA
29
• It is unclear whether the company has concluded that there is a statistically significant difference between any of the comparators or not based on this analysis.
• Whilst they appear to be implemented correctly, fractional polynomials ay not be suitable for extrapolating because of their tendency to over-fit, as well as to be influenced by tail data. This is supported by the large number of models that the company was forced to exclude due to the implausible hazard ratios estimated.
• It is unclear whether the fractional polynomial analysis is suitable for extrapolation of PFS and OS in this appraisal.
• Given differences in baseline characteristics of included RCTs, the ERG considers that there is the potential that transitivity assumption is violated.

Additional analyses conducted by ERG
30
• Company does not present the results of the indirect treatment comparison between dacomitinib and afatinib, so the ERG conducted a fixed-effect NMA using surface under the cumulative ranking curve (SUCRA) to rank interventions
• For PFS: analyses based on SUCRA values suggest higher probability that dacomitinib is superior to afatinib but there is no significant difference between the two drugs (PFS HR 0.80; 95% CI 0.57-1.12).
• For OS: analyses based on SUCRA values suggest higher probability thatdacomitinib is superior to afatinib but there is no significant difference between the two drugs (OS HR 0.88; 95% CI 0.61-1.29).
• Caution required because of potential transitivity assumption violation and proportional hazard assumption violation, so results are exploratory

31
Cost effectiveness

Company’s 3 state partitioned survival model
32
ERG comment: The model does not capture survival following second and third-line treatment directly or separately. Instead, time in post-progression survival was derived using the area under the curve approach; the difference in the survival between overall and progression-free survival
Time horizon 15 years
Cycle length 28 days
Half cycle correction Yes
Duration of treatment effect Continued across model time horizon
Discount rate 3.5% per year
Perspective NHS and Personal social services

CONFIDENTIAL
Company used generalised gamma to extrapolate the gefitinib curve from ARCHER 1050 for PFS
33
ERG comment: Extrapolation with generalised gamma may be too pessimistic beyond two years. ERG considered the log-normal and log-logistic models, and alternatively using a two-phase piecewise model (e.g. KM data followed by a parametric extrapolation), in later analyses.
DistributionProportion PF at2 years 3 years 5 years
Exponential XXXX XXXX XXXX
Weibull XXXX XXXX XXXX
Gompertz XXXX XXXX XXXX
Log-logistic XXXX XXXX XXXX
Log-normal XXXX XXXX XXXX
Generalised gamma XXXX XXXX XXXX

CONFIDENTIAL
Company generated PFS curves for dacomitinib, afatinib & erlotinib by applying time-varying hazard ratios to gefitinib curve
34
The extrapolated curve of dacomitinib follows the survival observed in ARCHER 1050 closely (the median PFS in the trial and the model are 14.7 and 14.5 months, respectively)

CONFIDENTIAL
Company used generalised gamma to extrapolate the gefitinib curve from ARCHER 1050 for OS
35
ERG comment: Extrapolation with generalised gamma may be too pessimistic beyond two years. ERG considered the log-normal and log-logistic models, and alternatively using a two-phase piecewise model (e.g. KM data followed by a parametric extrapolation), in later analyses.
DistributionProportion alive at3 years 5 years 10 years
Exponential XXXX XXXX XXXX
Weibull XXXX XXXX XXXX
Gompertz XXXX XXXX XXXX
Log-logistic XXXX XXXX XXXX
Log-normal XXXX XXXX XXXX
Generalised gamma XXXX XXXX XXXX
CONFIDENTIAL
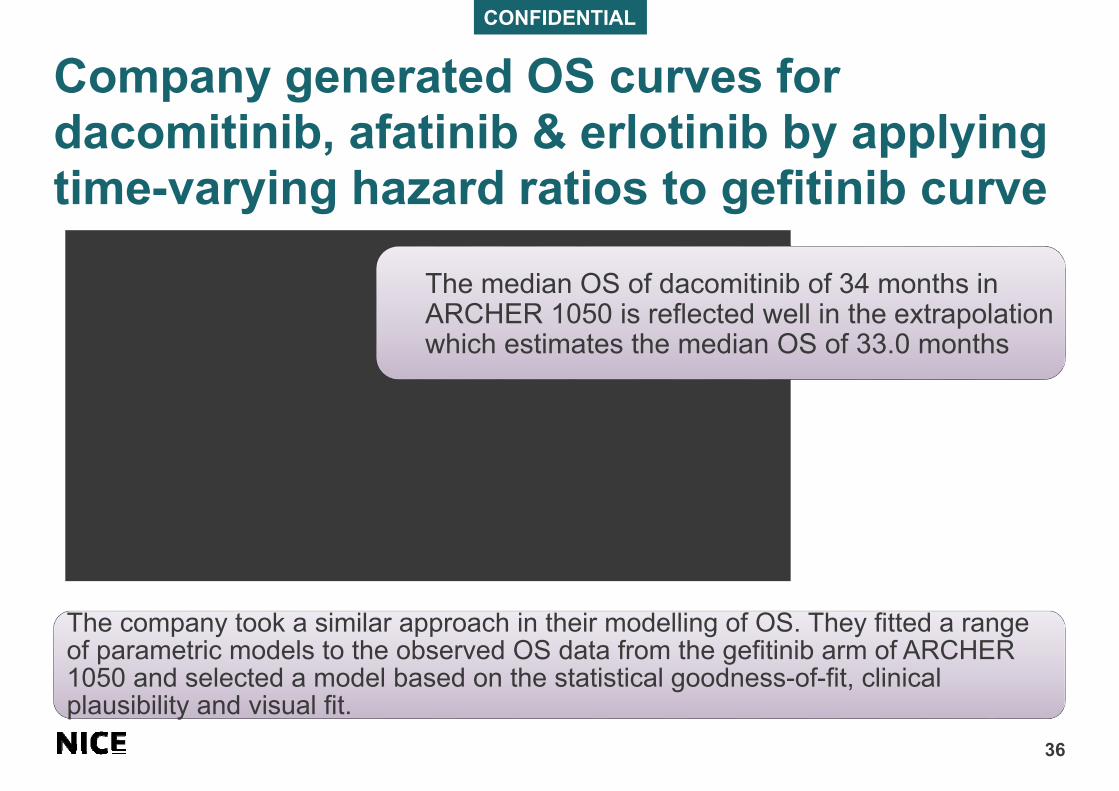
Company generated OS curves for dacomitinib, afatinib & erlotinib by applying time-varying hazard ratios to gefitinib curve
36
The company took a similar approach in their modelling of OS. They fitted a range of parametric models to the observed OS data from the gefitinib arm of ARCHER 1050 and selected a model based on the statistical goodness-of-fit, clinical plausibility and visual fit.
The median OS of dacomitinib of 34 months in ARCHER 1050 is reflected well in the extrapolation which estimates the median OS of 33.0 months

ERG’s approach to extrapolating PFS
37
• The ERG considered company’s approach to PFS pessimistic for all considered first-line treatments
• The ERG chose a different parametric curve (log-normal) for gefitinib that predicts more patients to be progression-free at 5 years than under the company’s assumptions.
• The ERG chose a different fractional polynomial (P1=0.5, P2= 1) which improved the dacomitinib PFS extrapolation, but may still be pessimistic in the tail.
• The afatinib extrapolation remained implausible, and so the ERG resorted to modelling the proportion of progression-free afatinib patients as the mean of the proportions from the dacomitinib and gefitinib progression-free populations.

ERG’s approach to extrapolating OS
38
• The company’s OS modelling was thought to be too pessimistic for all interventions. ERG preferred not to rely on the fractional polynomial NMA extrapolation, and instead assumed a HR=1 from 36 months for OS across all comparators.
• The company’s base-case assumptions suggests both pre-progression and post-progression benefit for dacomitinib. The ERG considered this unlikely to be plausible
• With the ERG’s preferred PFS and OS assumptions, dacomitinib provides an OS and PFS benefit over the comparators, but has a shorter post-progression survival time

Company included subsequent therapies as a one-off cost in their base case
39
• Included as the lowest cost per mg of any vial and complete vial sharing was assumed
Subsequent treatmentProportion of people receiving second- and third-
line treatment
Second-line (%)a Third-line (%)b
Osimertinib 56% -
Platinum doublet chemotherapy
44% 56%
Docetaxel - 44%
a model assumed that 71% of people who progressed received second-line treatmentb model assumed that 48% of original cohort received third-line treatment
ERG comment: ERG considered that the subsequent treatments following first-line treatment are appropriate. However, it was not clear what strategy/methods that were used to identify the EGFR-T790M mutation to guide subsequent treatment decisions (cost of biopsy not included)

CONFIDENTIAL
Company inputs: utility values
40
Mean utility (95% CI)
Source
Progression-free
DacomitinibXXX
XXXXXXEQ-5D from ARCHER 1050
GefitinibXXX
XXXXXXEQ-5D from ARCHER 1050
AfatinibXXX
XXXXXXAssumed equal to dacomitinib based on similarity
of safety profile
ErlotinibXXX
XXXXXXAssumed equal to gefitinib based on similarity of
safety profile
Progressed disease
All treatments 0.64 Based on the results of the SLR the study by
Labbé provided the most appropriate values for this analysis
• Non-treatment specific PF values from ARCHER 1050 XXX and one-off disutility for adverse events explored in sensitivity analysis

ERG included disutilities for AEs and age
41
• The company didn't include disutilities for AEs or for aging
• The ERG did not accept that the inclusion of disutility decrements in the base-case would constitute ‘double counting’ because EQ-5D data only collected on one day of 28-day cycle so a large proportion of AEs would not have been captured
• The ERG supported the use of progression free utility value data from the trial, but felt that the progressed disease utility values should also be from the trial rather than the literature
• The ERG used all values from the trial and included disutility for aging and AEs

Resource use omissions
42
The ERG had concerns relating to costs that might have been excluded from the analysis:
• resource use and costs associated with unscheduled hospital admissions
• MRI scans for suspected brain metastases or cord compression
• costs associated with the diagnosis of T790M
The ERG considered that the costs included in the model are likely to be an underestimate of the true costs associated with managing/treating NSCLC.

43
Cost effectiveness results

Available cost-effectiveness results44
Analysis Results Document or slide(s) in PMB
Company base case & scenario analyses
Dacomitinib with confidential PAS discount versus comparators (erlotinib, afatinib and gefitinib) with PAS discounts assumed by the company
PMB slides 45-48
Additional analyses from company
Dacomitinib and comparators (erlotinib, afatinib and gefitinib) all at list prices
Appendix M in appendix to the company submission
ERG base case & scenario analyses
Dacomitinib (with PAS discount) versus comparators (at list prices)
PMB slides 52-59
Additional analyses, applying ERG’s suggested changes to company’s base case
Dacomitinib with confidential PAS discount versus comparators (erlotinib, afatinib and gefitinib) with PAS discounts assumed by the company
PMB slides 50-51
Additional analyses, applying ERG’s suggested changes to company’s additional analyses
Dacomitinib and comparators (erlotinib, afatinib and gefitinib) all at list prices
ERG report, Section 6.1.2, Tables 59 to 61, pages 136 to 138

CONFIDENTIAL
Company’s deterministic results: dacomitinib (with PAS) versus comparators (with company assumed PAS)
45
Abbreviations: ICER: incremental cost-effectiveness ratio; QALYs: quality-adjusted life years
Treatment Expected
mean costs
(£)
Incremental
costs (£)
Expected
mean QALY
Incremental
QALY
ICER (£)
Gefitinib XXXXXX XXXXXX XXXXXX XXXXXX XXXXXX
Erlotinib XXXXXX XXXXXX XXXXXX XXXXXX XXXXXX
Afatinib XXXXXX XXXXXX XXXXXX XXXXXX XXXXXX
Dacomitinib XXXXXX XXXXXX XXXXXX XXXXXX XXXXXX
Definitions: dominated: both more expensive and results in the same or poorer outcomes than the comparator; extendedly dominated: a treatment that is not cost-effective because another available treatment provides more units of benefit at a lower cost per unit benefit

CONFIDENTIAL
Company’s probabilistic results: dacomitinib (with PAS) versus comparators (with company assumed PAS)
46
Abbreviations: ICER: incremental cost-effectiveness ratio; QALYs: quality-adjusted life years
Treatment Expected
mean costs
(£)
Incremental
costs (£)
Expected
mean QALY
Incremental
QALY
ICER (£)
Gefitinib XXXXXX XXXXXX XXXXXX XXXXXX XXXXXX
Erlotinib XXXXXX XXXXXX XXXXXX XXXXXX XXXXXX
Afatinib XXXXXX XXXXXX XXXXXX XXXXXX XXXXXX
Dacomitinib XXXXXX XXXXXX XXXXXX XXXXXX XXXXXX
Definitions: dominated: both more expensive and results in the same or poorer outcomes than the comparator; extendedly dominated: a treatment that is not cost-effective because another available treatment provides more units of benefit at a lower cost per unit benefit

CONFIDENTIAL
Company’s scenario analyses
47
Parameter Company base case Company scenario analysis
Progression free survival for gefitinib
• Curve for gefitinib: Generalised gamma
• Survival for the other comparators from the FP NMA (P1=0.5; P2=1.5)
• Curve for gefitinib: Log-normal• Treatment effect based on
conventional NMA
Overall survival for gefitinib
• Curve for gefitinib: Generalised gamma
• Survival for the other comparators from the FP NMA (P1=0.5; P2=1.5)
• Curve for gefitinib: Log-logistic• Treatment effect based on
conventional NMA
Progression-free survival utility value (1)
Treatment specific utility based on ARCHER 1050 and assumption (XXXXXX)
Non-treatment specific PFS utility value (XXX) based on ARCHER 1050. Progressed disease (0.64) from Labbé with AE disutilities
Progression-free survival utility value (2)
Treatment specific utility based on ARCHER 1050 and assumption (XXXXXX)
Non-treatment specific PFS utility value (0.77) based on Labbé. Progressed disease (0.64) from Labbé with AE disutilities.
Treatment beyond disease progression
No Including treatment beyond disease progression

CONFIDENTIAL
Company’s scenario analysis results: dacomitinib (with PAS) versus comparators (with company assumed PAS)
48
Scenarioversus gefitinib versus erlotinib versus afatinib
ICER % change ICER % change ICER % change
Base-case XXXXXX XXXX XXXXXX XXXX XXXXXX XXXX
Gefitinib survival projection (PFS)
XXXXXX XXXX XXXXXX XXXX XXXXXX XXXX
Gefitinib survival projection (OS)
XXXXXX XXXX XXXXXX XXXX XXXXXX XXXX
FP model (PFS) XXXXXX XXXX XXXXXX XXXX XXXXXX XXXXFP model (OS) XXXXXX XXXX XXXXXX XXXX XXXXXX XXXXNMA methodology (PFS and OS)
XXXXXX XXXX XXXXXX XXXX XXXXXX XXXX
Utility (PF - ARCHER) with AEs
XXXXXX XXXX XXXXXX XXXX XXXXXX XXXX
Utility (PF - Labbé) with AEs
XXXXXX XXXX XXXXXX XXXX XXXXXX XXXX
Treatment beyond progression
XXXXXX XXXX XXXXXX XXXX XXXXXX XXXX

CONFIDENTIAL
ERG’s preferred base case assumptions
49
Parameter Company base case ERG base case
Progression free survival for gefitinib
• Curve for gefitinib: Generalised gamma
• Survival for the other comparators from the FP NMA (P1=0.5; P2=1.5)
• Curve for gefitinib: Log-normal• Survival for the other comparators
from the FP NMA (P1=0.5; P2=1)• Assumed PFS equal to mean
PFS for dacomitinib and gefitinib from 36 months
Overall survival for gefitinib
• Curve for gefitinib: Generalised gamma
• Survival for the other comparators from the FP NMA (P1=0.5; P2=1.5)
• Curve for gefitinib: Log-logistic• Survival for the other comparators
from the FP NMA (P1=0.5;P2=1)• Assumed equal efficacy, on the
hazard scale, from 36 months onwards
Post-progression utility value
0.64 from Labbé et al Weighted-mean utility value from the ARCHER 1050 trial = XXX
Disutilities due to adverse events
Not included in the model • Diarrhoea: -0.15 • Fatigue: -0.18 • ALT increased: 0
• Paronychia: -0.20 • Rash: -0.20
Age-related disutilities No age-adjustment applied Included from the study published by Ara and colleagues
Gefitinib PAS discount Applied in Cycle 2 Applied in Cycle 3
49

CONFIDENTIAL
Impact of ERG’s preferred assumptions on company’s base case (1): dacomitinib (with PAS)
versus comparators (with company assumed PAS)
compaePAS)
50
Scenarioversus gefitinib versus erlotinib versus afatinib
ICER % change ICER % change ICER % change
Base-case XXXX XXXX XXXX XXXX XXXX XXXX
Gefitinib survival projection (PFS)
using log-normalXXXX XXXX XXXX XXXX XXXX XXXX
Gefitinib survival projection (PFS)
using log-normal and P1=0.5; P2=1XXXX XXXX XXXX XXXX XXXX XXXX
Gefitinib survival projection (OS)
using log-logisticXXXX XXXX XXXX XXXX XXXX XXXX
Gefitinib survival projection (OS)
using log-logistic and HR=1 from
36 months
XXXX XXXX XXXX XXXX XXXX XXXX

CONFIDENTIAL
Impact of ERG’s preferred assumptions on company’s base case (2): dacomitinib (with PAS)
versus comparators (with company assumed PAS)
51
Scenarioversus gefitinib versus erlotinib versus afatinib
ICER % change ICER % change ICER % change
Disutilities associated with AEs XXXX XXXX XXXX XXXX XXXX XXXX
Post-progression utility from
ARCHER 1050 XXXX XXXX XXXX XXXX XXXX XXXX
Age-related disutilities XXXX XXXX XXXX XXXX XXXX XXXX
Correction of the PAS applied to
gefitinibXXXX XXXX XXXX XXXX XXXX XXXX

CONFIDENTIAL
Company’s deterministic base-case results (run by ERG): dacomitinib (with PAS) versus comparators (list price)
52
Treatment Expected
mean costs
(£)
Incremental
costs (£)
Expected
mean QALY
Incremental
QALY
ICER (£)
Erlotinib XXXX XXXX XXXX XXXX XXXX
Dacomitinib XXXX XXXX XXXX XXXX XXXX
Gefitinib XXXX XXXX XXXX XXXX XXXX
Afatinib XXXX XXXX XXXX XXXX XXXX
Abbreviations: ICER: incremental cost-effectiveness ratio; QALYs: quality-adjusted life years

CONFIDENTIAL
ERG’s deterministic base-case results: dacomitinib (with PAS) versus comparators (list price)
53
Treatment Expected
mean costs
(£)
Incremental
costs (£)
Expected
mean QALY
Incremental
QALY
ICER (£)
Erlotinib XXXX XXXX XXXX XXXX XXXX
Dacomitinib XXXX XXXX XXXX XXXX XXXX
Gefitinib XXXX XXXX XXXX XXXX XXXX
Afatinib XXXX XXXX XXXX XXXX XXXX
Abbreviations: ICER: incremental cost-effectiveness ratio; QALYs: quality-adjusted life years

CONFIDENTIAL
ERG’s probabilistic base-case results: dacomitinib (with PAS) versus comparators (list price)
54
Treatment Expected
mean costs
(£)
Incremental
costs (£)
Expected
mean QALY
Incremental
QALY
ICER (£)
Erlotinib XXXX XXXX XXXX XXXX XXXX
Dacomitinib XXXX XXXX XXXX XXXX XXXX
Gefitinib XXXX XXXX XXXX XXXX XXXX
Afatinib XXXX XXXX XXXX XXXX XXXX
Abbreviations: ICER: incremental cost-effectiveness ratio; QALYs: quality-adjusted life years

CONFIDENTIAL
ERG’s additional scenario analyses
55
Parameter ERG base case ERG scenario analysis
Progression free survival
• Curve for gefitinib: Log-normal• Survival for the other comparators from
the FP NMA (P1=0.5; P2=1)• Assumed afatinib PFS equal to mean
PFS for dacomitinib and gefitinib from 36 months
Assumed afatinib PFS equal to mean PFS for dacomitinib and gefitinib from 55 months
Overall survival • Curve for gefitinib: Log-logistic• Survival for the other comparators from
the FP NMA (P1=-0.5)• Assumed equal efficacy, on the hazard
scale, from 36 months onwards
Assumed dacomitinib OS equal to that of afatinib
Post-progression utility value
Weighted-mean utility value from the ARCHER 1050 trial = XXX
0.64 from Labbé et al
NMA method for OS Company’s FP NMA, including:• Curve for gefitinib: Log-logistic• Survival for the other comparators from
the FP NMA (P1=-0.5)• Assumed equal efficacy, on the hazard
scale, from 36 months onwards
Company’s traditional proportional hazards NMA

CONFIDENTIAL
ERG’s scenario analysis results (1): dacomitinib (with PAS) versus comparators (list price)
56
Treatment Expected
mean costs
(£)
Incremental
costs (£)
Expected
mean QALY
Incremental
QALY
ICER (£)
Erlotinib XXXX XXXX XXXX XXXX XXXX
Dacomitinib XXXX XXXX XXXX XXXX XXXX
Gefitinib XXXX XXXX XXXX XXXX XXXX
Afatinib XXXX XXXX XXXX XXXX XXXX
Abbreviations: ICER: incremental cost-effectiveness ratio; QALYs: quality-adjusted life years
• Log-normal parametric curve for progression-free survival for gefitinib and equal efficacy assumed from month 55

CONFIDENTIAL
ERG’s scenario analysis results (2): dacomitinib (with PAS) versus comparators (list price)
57
Treatment Expected
mean costs
(£)
Incremental
costs (£)
Expected
mean QALY
Incremental
QALY
ICER (£)
Erlotinib XXXX XXXX XXXX XXXX XXXX
Dacomitinib XXXX XXXX XXXX XXXX XXXX
Gefitinib XXXX XXXX XXXX XXXX XXXX
Afatinib XXXX XXXX XXXX XXXX XXXX
Abbreviations: ICER: incremental cost-effectiveness ratio; QALYs: quality-adjusted life years
• Log-logistic parametric curve for progression-free survival for gefitinib and equal efficacy assumed from month 55

CONFIDENTIAL
ERG’s scenario analysis results (3): dacomitinib (with PAS) versus comparators (list price)
58
Treatment Expected
mean costs
(£)
Incremental
costs (£)
Expected
mean QALY
Incremental
QALY
ICER (£)
Erlotinib XXXX XXXX XXXX XXXX XXXX
Dacomitinib XXXX XXXX XXXX XXXX XXXX
Gefitinib XXXX XXXX XXXX XXXX XXXX
Afatinib XXXX XXXX XXXX XXXX XXXX
Abbreviations: ICER: incremental cost-effectiveness ratio; QALYs: quality-adjusted life years
• Using utility values from Labbe et al.

CONFIDENTIAL
ERG’s scenario analysis results (4): dacomitinib (with PAS) versus comparators (list price)
59
Treatment Expected
mean costs
(£)
Incremental
costs (£)
Expected
mean QALY
Incremental
QALY
ICER (£)
Erlotinib XXXX XXXX XXXX XXXX XXXX
Dacomitinib XXXX XXXX XXXX XXXX XXXX
Gefitinib XXXX XXXX XXXX XXXX XXXX
Afatinib XXXX XXXX XXXX XXXX XXXX
Abbreviations: ICER: incremental cost-effectiveness ratio; QALYs: quality-adjusted life years
• Using results from the NMA for overall survival (HR constant)
End of life
60
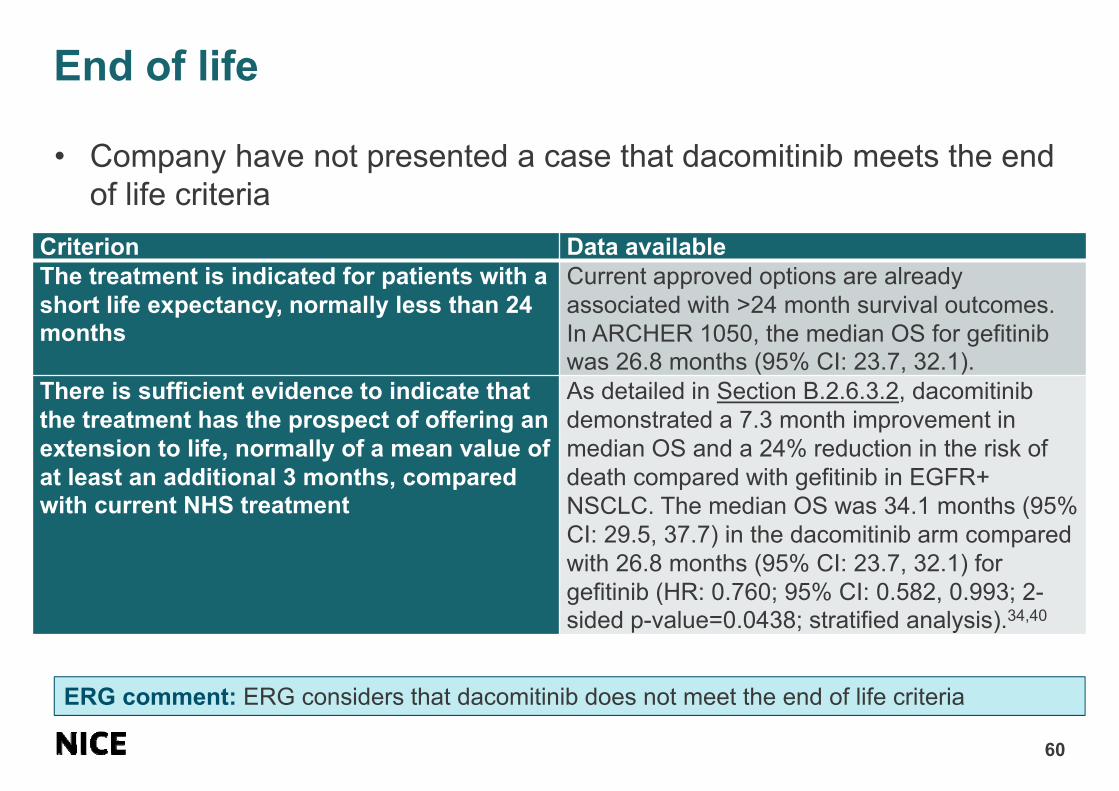
• Company have not presented a case that dacomitinib meets the end of life criteria
ERG comment: ERG considers that dacomitinib does not meet the end of life criteria
Criterion Data availableThe treatment is indicated for patients with a short life expectancy, normally less than 24 months
Current approved options are already associated with >24 month survival outcomes. In ARCHER 1050, the median OS for gefitinib was 26.8 months (95% CI: 23.7, 32.1).
There is sufficient evidence to indicate that the treatment has the prospect of offering an extension to life, normally of a mean value of at least an additional 3 months, compared with current NHS treatment
As detailed in Section B.2.6.3.2, dacomitinib demonstrated a 7.3 month improvement in median OS and a 24% reduction in the risk of death compared with gefitinib in EGFR+ NSCLC. The median OS was 34.1 months (95% CI: 29.5, 37.7) in the dacomitinib arm compared with 26.8 months (95% CI: 23.7, 32.1) for gefitinib (HR: 0.760; 95% CI: 0.582, 0.993; 2-sided p-value=0.0438; stratified analysis).34,40

Equality & innovation
61
Equality
• The company, experts & professional organisation identified no equality issues
Innovation
• Company claim that dacomitinib is innovative → improves survival compared with gefitinib with a longer duration of effect with indirect treatment comparison further supporting survival improvement compared with other TKIs

Authors
62
Luke CowieTechnical Lead
Nicola HayTechnical Adviser
with input from the Lead Team (Bernard Khoo, David Meads, Malcolm Oswald)

Company evidence submission for dacomitinib for untreated EGFR-positive non-small-cell lung cancer (ID1346)
© Pfizer (2018). All rights reserved Page 1 of 388
NATIONAL INSTITUTE FOR HEALTH AND CARE EXCELLENCE
Single technology appraisal
Dacomitinib for untreated EGFR-positive non-small-cell lung cancer (ID1346)
Document B
Company evidence submission
7th December 2018
File name Version Contains confidential information
Date
ID1346_Dacomitinib_EGFR_NSCLC_ DocumentB_07DEC18.docx
Final No 7th December 2018

Company evidence submission for dacomitinib for untreated EGFR-positive non-small-cell lung cancer (ID1346)
© Pfizer (2018). All rights reserved Page 2 of 388
Contents
Contents ..................................................................................................................... 2 Figures ....................................................................................................................... 4 Tables ........................................................................................................................ 8 B.1 Decision problem, description of the technology and clinical care pathway ....... 14
B.1.1 Decision problem ......................................................................................... 14 B.1.2 Description of the technology being appraised ............................................ 16 B.1.3 Health condition and position of the technology in the treatment pathway .. 18 B.1.4 Equality considerations ............................................................................... 22
B.2 Clinical effectiveness ......................................................................................... 23 B.2.1 Identification and selection of relevant studies ............................................ 23 B.2.2 List of relevant clinical effectiveness evidence ......................................... 23 B.2.3 Summary of methodology of the relevant clinical effectiveness evidence 24 B.2.4 Statistical analysis and definition of study groups in the relevant clinical effectiveness evidence ......................................................................................... 40 B.2.5 Quality assessment of the relevant clinical effectiveness evidence ............. 46 B.2.6 Clinical effectiveness results of the relevant trials .................................... 47 B.2.7 Subgroup analysis ................................................................................... 60 B.2.8 Meta-analysis ........................................................................................... 63 B.2.9 Indirect and mixed treatment comparisons .............................................. 64 B.2.10 Adverse reactions ................................................................................. 74 B.2.11 Ongoing studies .................................................................................... 86 B.2.12 Innovation ............................................................................................. 86 B.2.13 Interpretation of clinical effectiveness and safety evidence .................. 87
B.3 Cost effectiveness .............................................................................................. 94 B.3.1 Published cost-effectiveness studies ........................................................... 94 B.3.2 Economic analysis ................................................................................... 94 B.3.3 Clinical parameters and variables ............................................................... 99 B.3.4 Measurement and valuation of health effects ............................................ 108 B.3.5 Cost and healthcare resource use identification, measurement and valuation............................................................................................................................ 113 B.3.6 Summary of base-case analysis inputs and assumptions ...................... 122 B.3.7 Base-case results .................................................................................. 124 B.3.8 Sensitivity analyses ................................................................................ 125 B.3.9 Subgroup analysis ................................................................................. 134 B.3.10 Validation ............................................................................................ 134 B.3.11 Interpretation and conclusions of economic evidence ........................ 137
B.4 References ...................................................................................................... 141 B.5 Appendices ...........................................................Error! Bookmark not defined. XXXXXXXXXXXXXXXXXXXXXXXXXXXXXXXXXXXXXXXXXXXXXXXXXXXXXXXXXXXXXXXXXXXXXXXXXXXXXXXXXXXXXXXXXXXXXXXXXX ..... Error! Bookmark not defined.
XXXXXXXXXXXXXXXXXXXXXXXXXXXXXXXXXXXXXXX .. Error! Bookmark not defined. XXXXXXXXXXXXXXXXXXXXXXXXXXXXXXXXXXXXXX .... Error! Bookmark not defined.

Company evidence submission for dacomitinib for untreated EGFR-positive non-small-cell lung cancer (ID1346)
© Pfizer (2018). All rights reserved Page 3 of 388
Appendix D: Identification, selection and synthesis of clinical evidence ............. Error! Bookmark not defined.
D.1 Identification and selection of relevant studies ..Error! Bookmark not defined. D.2 Participant flow in the relevant randomised control trials Error! Bookmark not defined. D.3 Quality assessment for each trial ......................Error! Bookmark not defined. D.4 Patient-reported outcomes ................................Error! Bookmark not defined. D.5. Proportional hazards assessments ..................Error! Bookmark not defined. D.6 Fractional polynomial analysis ..........................Error! Bookmark not defined. D.7 Proportional hazards network meta-analysis ....Error! Bookmark not defined.
Appendix E: Subgroup analysis ..................................Error! Bookmark not defined. Appendix F: Adverse reactions ...................................Error! Bookmark not defined. Appendix G: Published cost-effectiveness studies ......Error! Bookmark not defined.
G.1 Identification and selection of relevant studies ..Error! Bookmark not defined. Appendix H: Health-related quality-of-life studies ........Error! Bookmark not defined.
H.1 Identification and selection of relevant health-related quality of life studies.................................................................................Error! Bookmark not defined. H.2 Results of prior systematic literature reviews ....Error! Bookmark not defined.
Appendix I: Cost and healthcare resource identification, measurement and valuation ....................................................................................Error! Bookmark not defined.
I.1 Identification and selection of relevant studies reporting on cost and healthcare resource identification, measurement and valuation Error! Bookmark not defined. I.2 Results of prior systematic literature reviews ......Error! Bookmark not defined.
Appendix J: Clinical outcomes and disaggregated results from the model ......... Error! Bookmark not defined. Appendix K: Checklist of confidential information ........Error! Bookmark not defined. Appendix L: Base-case analysis inputs .......................Error! Bookmark not defined. Appendix M: Base-case results at list price .................Error! Bookmark not defined.

Company evidence submission for dacomitinib for untreated EGFR-positive non-small-cell lung cancer (ID1346)
© Pfizer (2018). All rights reserved Page 4 of 388
Figures
Figure 1. Lung cancer segmentation (percentage of incident cases)5-8 .................... 18
Figure 2. Proposed position of dacomitinib in the treatment pathway ...................... 22
Figure 3. ARCHER 1050 study design ..................................................................... 27
Figure 4. Kaplan-Meier plot of progression-free survival based on blinded,
independent review committee analysis (ITT Population)*33 .................................... 49
Figure 5. Kaplan-Meier plot of progression-free survival based on investigator
assessment (ITT Population)*33 ............................................................................... 51
Figure 6. Kaplan-Meier plot of overall survival (ITT Population)34 ............................ 52
XXXXXXXXXXXXXXXXXXXXXXXXXXXXXXXXXXXXXXXXXXXXXXXXXXXXXXXX
XXXXXXXXXXXXXXXXXXXXXXXXXXXXXXXXXXXXXXXXXXXXXXXXXXXXXXXX
XXXXXXXXXXXXXXXXXXXXXXXXXXXXXX ........................................................... 54
XXXXXXXXXXXXXXXXXXXXXXXXXXXXXXXXXXXXXXXXXXXXXXXXXXXXXXXX
XXXXXXXXXXXXXXXXXXXXXXXXXXXXXXXXXXXXXXXXXXXXXXXXXXXXXXXX
XXXXXXX .................................................................................................................. 55
XXXXXXXXXXXXXXXXXXXXXXXXXXXXXXXXXXXXXXXXXXXXXXXXXXXXXXXX
XXXXXXXXXXXXXXXXXXXXXXXXXXXXXXXXXXXXXXXXXXXXXXXXXXXXXXXX
XXXXXXXXXXXXXXXXXXX ..................................................................................... 56
XXXXXXXXXXXXXXXXXXXXXXXXXXXXXXXXXXXXXXXXXXXXXXXXXXXXXXXX
XXXXXXXXXXXXXXXXXXXXXXXXXXXXXXXXXXXXXXXXXXXXXXXXXXXXXX .. 57
Figure 11. Mean change from baseline in disease-related symptoms, treatment-
related symptoms and global quality-of-life in participants from the ARCHER 1050
trial (as assessed by EORTC-QLQ-C30 and EORTC-QLQ-LC13; PRO Population)33
................................................................................................................................. 58
XXXXXXXXXXXXXXXXXXXXXXXXXXXXXXXXXXXXXXXXXXXXXXXXXXXXXXXX
XXXXXXXXXXXXXXXXXXXXXXXXXXXXXXXXXXXXXXXXXXXXXXXXXXXXXXXX
XXXXXXXXXXXXXXXXXXXXXXXXXXXXXXXXXXXXXXXX ................................... 61
XXXXXXXXXXXXXXXXXXXXXXXXXXXXXXXXXXXXXXXXXXXXXXXXXXXXXXXX
XXXXXXXXXXXXXXXXXXXXXXXXXXXXXXXXXXXXXXXXXXXXXXXXXXXXXXXX
XXXXXXXXXXXXXXXXXX ........................................................................................ 62
Figure 14. Forest plot of overall survival (stratified by subgroups; ITT population)* . 63

Company evidence submission for dacomitinib for untreated EGFR-positive non-small-cell lung cancer (ID1346)
© Pfizer (2018). All rights reserved Page 5 of 388
Figure 15. Feasibility assessment network diagram of the 11 trails included in the
network ..................................................................................................................... 64
Figure 16. Network diagram ..................................................................................... 66
XXXXXXXXXXXXXXXXXXXXXXXXXXXXXXXXXXXXX ......................................... 69
XXXXXXXXXXXXXXXXXXXXXXXXXXXXXXXXXXXXXXXXXXXXXXXXXXXXXXXX
XXXXXXXXXXXXXXXXXXXXXXXXXXX ....................Error! Bookmark not defined.
XXXXXXXXXXXXXXXXXXXXXXXXXXXXXXXXXXXXXXX .................................... 71
XXXXXXXXXXXXXXXXXXXXXXXXXXXXXXXXXXXXXXXXXXXXXXXXXXXXXXXX
XXXXXXXXXXXXXXXXXXXXXXXXXXXXX ............................................................ 71
XXXXXXXXXXXXXXXXXXXXXXXXXXXXXXXXXXXXX ......................................... 72
XXXXXXXXXXXXXXXXXXXXXXXXXXXXXXXXXXXXXXXXXXXXXXXXXXXXXXXX
XXXXXXXXXXXXXXXXXXXXXXXXXXX ................................................................. 73
XXXXXXXXXXXXXXXXXXXXXXXXXXXXXXX ....................................................... 74
XXXXXXXXXXXXXXXXXXXXXXXXXXXXXXXXXXXXXXXXXXXXXXXXXXXXXXXX
XXXXXXXXXXXXXXXXXXXXX ............................................................................... 74
Figure 25. Incidence of common adverse events in the ARCHER 1050 trial before
and after dacomitinib dose reductions60 ................................................................... 83
Figure 26. Median progression-free survival per blinded independent review
committee analysis for dacomitinib in all patients versus with patients with dose
reduction60 ................................................................................................................ 84
Figure 27. Median overall survival for dacomitinib in all patients versus patients with
dose reduction60 ....................................................................................................... 84
Figure 28. Three Health State Model ....................................................................... 95
XXXXXXXXXXXXXXXXXXXXXXXXXXXXXXXXXXXXXXXXXXXXXXXXXXXXXXXX
XXXXXXXXXXXXXXXXXXXXXXXXXXXXXXX ..................................................... 102
XXXXXXXXXXXXXXXXXXXXXXXXXXXXXXXXXXXXXXXXXXXXXXXXXXXXXXXX
XXXXXXXXXXXXXXXXXXXXXXXXXXXXXXXXXXXXXXXXXXX ......................... 104
XXXXXXXXXXXXXXXXXXXXXXXXXXXXXXXXXXXXXXXXXXXXXXXXXXXXXXXX
XXXXXXXXXXXX .................................................................................................. 105
XXXXXXXXXXXXXXXXXXXXXXXXXXXXXXXXXXXXXXXXXXXXXXXXXXXXXXXX
XXXXXXXXXXXXXXXXXXXXXXXXXXXXXXXXXXXX ......................................... 107
XXXXXXXXXXXXXXXXXXXXXXXXXXXXXXXXXXX ............................................ 126
Figure 34. Cost-effectiveness acceptability curve .................................................. 127

Company evidence submission for dacomitinib for untreated EGFR-positive non-small-cell lung cancer (ID1346)
© Pfizer (2018). All rights reserved Page 6 of 388
Figure 35. Tornado diagram: dacomitinib versus gefitinib ...................................... 128
Figure 36. Tornado diagram: dacomitinib versus erlotinib ...................................... 128
Figure 37. Tornado diagram: dacomitinib versus afatinib ....................................... 129
Figure 38. PRISMA diagram of updated RCT search..Error! Bookmark not defined.
Figure 39. Patient disposition diagram of the ARCHER 1050 trial ... Error! Bookmark
not defined.
XXXXXXXXXXXXXXXXXXXXXXXXXXXXXXXXXXXXXXXXXXXXXXXXXXXXXXXX
XXXXXXXXXXXXXXXXXXXXXXXXXXXXXXXXXXXXXXXXXXXXXXXXXXXXXXXX
XXXXXXXXXXXXXXXXXXXXXXXXXXXXXXXXXXXXXXXXXXXXXXXX .......... Error!
Bookmark not defined.
XXXXXXXXXXXXXXXXXXXXXXXXXXXXXXXXXXXXXXXXXXXXXXXXXXXXXXXX
XXXXXXXXXXXXXXXXXXXXXXXXXXXXXXXXXXXXXXXXXXXXXXXXXXXXXXXX
XXXXXXXXXXXXXXXXXXXXXXXXXXXXXXXXXXXXXXXXXXXXXXXXXXXXXXX
....................................................................................Error! Bookmark not defined.
Figure 42. Log Cumulative Hazard Plot of OS for Dacomitinib vs. Gefitinib in
ARCHER 1050 ............................................................Error! Bookmark not defined.
Figure 43. Smoothed Schoenfeld Residuals vs. Time for OS—Dacomitinib vs.
Gefitinib in ARCHER 1050 ..........................................Error! Bookmark not defined.
Figure 44. Log Cumulative Hazard Plot of PFS for Dacomitinib vs. Gefitinib in
ARCHER 1050 ............................................................Error! Bookmark not defined.
Figure 45. Smoothed Schoenfeld residuals vs. Time for PFS—Dacomitinib vs.
Gefitinib in ARCHER 1050 ..........................................Error! Bookmark not defined.
Figure 46. Log Cumulative Hazard Plot of OS for Afatinib vs. Gefitinib in LUX-Lung 7
....................................................................................Error! Bookmark not defined.
Figure 47. Smoothed Schoenfeld Residuals vs. Time for OS—Afatinib vs. Gefitinib in
LUX-Lung 7 .................................................................Error! Bookmark not defined.
Figure 48. Log Cumulative Hazard Plot of PFS for Afatinib vs. Gefitinib in LUX-Lung
7 ..................................................................................Error! Bookmark not defined.
Figure 49. Smoothed Schoenfeld Residuals vs. Time for PFS—Afatinib vs. Gefitinib
in LUX-Lung 7 .............................................................Error! Bookmark not defined.
XXXXXXXXXXXXXXXXXXXXXXXXXXXXXXXXXXX .Error! Bookmark not defined.
XXXXXXXXXXXXXXXXXXXXXXXXXXXXXXXXXXXXX .......... Error! Bookmark not
defined.

Company evidence submission for dacomitinib for untreated EGFR-positive non-small-cell lung cancer (ID1346)
© Pfizer (2018). All rights reserved Page 7 of 388
XXXXXXXXXXXXXXXXXXXXXXXXXXXXXXXXXXXXXXX ..... Error! Bookmark not
defined.
XXXXXXXXXXXXXXXXXXXXXXXXXXXXXXXXXXXXX .......... Error! Bookmark not
defined.
XXXXXXXXXXXXXXXXXXXXXXXXXXXXXXXXXXXXX .......... Error! Bookmark not
defined.
XXXXXXXXXXXXXXXXXXXXXXXXXXXXXXXXXXX .Error! Bookmark not defined.
XXXXXXXXXXXXXXXXXXXXXXXXXXXXXXXXXXXXXXX ..... Error! Bookmark not
defined.
XXXXXXXXXXXXXXXXXXXXXXXXXXXXXXXXXXXXX .......... Error! Bookmark not
defined.
XXXXXXXXXXXXXXXXXXXXXXXXXXXXXXXXXXXXX .......... Error! Bookmark not
defined.
XXXXXXXXXXXXXXXXXXXXXXXXXXXXXXXXXXX .Error! Bookmark not defined.
XXXXXXXXXXXXXXXXXXXXXXXXXXXXXXXXXXXXX .......... Error! Bookmark not
defined.
XXXXXXXXXXXXXXXXXXXXXXXXXXXXXXXXXXXXXXX ..... Error! Bookmark not
defined.
XXXXXXXXXXXXXXXXXXXXXXXXXXXX .................Error! Bookmark not defined.
XXXXXXXXXXXXXXXXXXXXXXXXXXXXXXXXXXXXXX ........ Error! Bookmark not
defined.
Figure 64. PRISMA flow diagram for current systematic literature review .......... Error!
Bookmark not defined.
Figure 65. PRISMA flow diagram for update SLR .......Error! Bookmark not defined.
Figure 66: PRISMA flow diagram for TA529 ...............Error! Bookmark not defined.
Figure 67. PRISMA flow diagram for TA406 ...............Error! Bookmark not defined.
Figure 68: PRISMA flow diagram for TA296 ...............Error! Bookmark not defined.
Figure 69:PRISMA flow diagram for TA258 ................Error! Bookmark not defined.
Figure 70. PRISMA flow diagram for the updated SLR ............. Error! Bookmark not
defined.
Figure 71. PRISMA flow diagram for TA529 ...............Error! Bookmark not defined.
Figure 72. PRISMA flow diagram for TA406 ...............Error! Bookmark not defined.
Figure 73. PRISMA flow diagram for TA296 ...............Error! Bookmark not defined.

Company evidence submission for dacomitinib for untreated EGFR-positive non-small-cell lung cancer (ID1346)
© Pfizer (2018). All rights reserved Page 8 of 388
Figure 74. PRISMA flow diagram for TA258 ...............Error! Bookmark not defined.
Figure 75. Probability density function for PFLYs from 10,000 iterations ........... Error!
Bookmark not defined.
Figure 77. Probability density function for LYs from 10,000 iterations ................ Error!
Bookmark not defined.
XXXXXXXXXXXXXXXXXXXXXXXXXXXXXXXXXXXXXXXXXXXXXXXXXXXX Error!
Bookmark not defined.
Figure 79. Cost-effectiveness acceptability curve (at list prices) Error! Bookmark not
defined.
Figure 80. Tornado diagram: dacomitinib versus gefitinib (at list prices) ............ Error!
Bookmark not defined.
Figure 81. Tornado diagram: dacomitinib versus erlotinib (at list prices) ............ Error!
Bookmark not defined.
Figure 82. Tornado diagram: dacomitinib versus afatinib (at list prices)............. Error!
Bookmark not defined.
Company evidence submission for dacomitinib for untreated EGFR-positive non-small-cell lung cancer (ID1346)
© Pfizer (2018). All rights reserved Page 9 of 388
Tables
Table 1. The decision problem1 ................................................................................ 14
Table 2. Technology being appraised ...................................................................... 16
Table 3. Clinical effectiveness evidence for ARCHER 1050 .................................... 24
Table 4. ARCHER 1050 trial overview33,34,40 ............................................................ 25
Table 5. ARCHER 1050 eligibility criteria ................................................................. 28
Table 6. Dacomitinib dose reduction levels .............................................................. 31
Table 7 Approach to resuming dacomitinib or gefitinib treatment after dose
interruption ............................................................................................................... 31
Table 8. Prior and concomitant medications and procedures ................................... 32
Table 9. Outcomes included in the economic model or specified in the submission
scope ........................................................................................................................ 35
Table 10. Baseline characteristics of participants in the ARCHER 1050 trial (ITT
Population) ............................................................................................................... 38
Table 11. Primary objective, sample size and analysis sets of the ARCHER 1050
trial40 ......................................................................................................................... 40
Table 12. Censorship for primary and secondary outcomes in the ARCHER 1050
trial48 ......................................................................................................................... 41
Table 13. Missing data management overview ........................................................ 42
Table 14. Stopping boundary for overall survival expressed as hazard ratios, Z
scales, and p-values ................................................................................................. 45
Table 15. Summary of ARCHER 1050 quality appraisal .......................................... 46
Table 16. Summary of clinical effectiveness results in the ARCHER 1050 trial (ITT
Population)33,34,40 ...................................................................................................... 47
Table 17. Summary of response rates based on independent review committee
analysis (ITT population)33,40 .................................................................................... 52
Table 18. Absolute scores in EQ-5D (PRO Population)40 ........................................ 60
Table 19. Goodness-of-fit estimates for fractional polynomial models of different
powers p1 and p2 – PFS (IRC) ................................................................................ 68
Table 20. Means and medians from fractional polynomial models compared to
observed data – PFS(IRC) ....................................................................................... 70

Company evidence submission for dacomitinib for untreated EGFR-positive non-small-cell lung cancer (ID1346)
© Pfizer (2018). All rights reserved Page 10 of 388
Table 21. Goodness-of-fit estimates for fractional polynomial models of different
powers p1 and p2 – OS ............................................................................................ 71
Table 22. Means and medians from fractional polynomial models compared to
observed data – OS ................................................................................................. 73
Table 23. Summary of adverse events in the ARCHER 1050 trial (Safety
Population)*40 ........................................................................................................... 75
Table 24. Most common AEs (≥10% in any group) from any cause in participants
from the ARCHER 1050 trial (Safety Population)*33 ................................................. 77
Table 25: Most common treatment-related adverse events occurring in XXXX of
patients from the ARCHER 1050 trial (Safety Population)40 ..................................... 79
Table 26: Adverse events (all-cause) resulting dose reductions (reported for ≥2% of
patients in any treatment arm) in the ARCHER 1050 trial (Safety Population)*33,40 . 80
Table 27: Adverse events (all-cause) that resulted in temporary discontinuations
reported for ≥2% of patients in any treatment arm of the ARCHER 1050 trial (Safety
Population)40 ............................................................................................................ 81
Table 28: Treatment-emergent adverse events leading to permanent discontinuation
of treatment in patients from the ARCHER 1050 trial (Safety Population)40 ............. 82
Table 29. Incidence of common AEs reported in first-line clinical trials of EGFR-TKIs
in patients with advanced NSCLC*33,61 ..................................................................... 85
Table 30. Summary of end-of-life criteria ................................................................. 93
Table 31. Features of the economic analysis ........................................................... 97
Table 32. Goodness-of-Fit Statistics (PFS) - Gefitinib ............................................ 101
Table 33. Goodness-of-Fit Statistics (OS) .............................................................. 104
Table 34. EQ-5D-3L PFS utility values by treatment from ARCHER 1050 ............. 109
Table 35. List of adverse events included in the model .......................................... 111
Table 36. Adverse event utility decrements and durations ..................................... 111
Table 37. Summary of utility values for cost-effectiveness analysis ....................... 113
Table 38. Unit costs of interventions and comparators ........................................... 115
Table 39. Second- and third-line treatment basket compositions ........................... 116
Table 40 Median duration in cycles of second-line and third-line treatment ........... 116
Table 41 Acquisition cost of subsequent therapies ................................................ 117
Table 42 Administration cost of subsequent therapies ........................................... 117
Table 43. List of health states and associated costs in the economic model ......... 119

Company evidence submission for dacomitinib for untreated EGFR-positive non-small-cell lung cancer (ID1346)
© Pfizer (2018). All rights reserved Page 11 of 388
Table 44. Details of terminal care cost calculation ................................................. 120
Table 45. Cost of treating adverse events .............................................................. 121
Table 46. Total cost of treating adverse events by treatment ................................. 121
Table 47. Summary of assumptions applied in the economic model ...................... 122
Table 48. Base-case results ................................................................................... 125
Table 49. Probabilistic results ................................................................................ 126
Table 50. Details of scenario analyses ................................................................... 130
Table 51. Results of base-case scenario analysis versus gefitinib ......................... 131
Table 52. Results of base-case scenario analysis versus erlotinib ........................ 132
Table 53. Results of base-case scenario analysis versus afatinib ......................... 133
Table 54. Comparison of gefitinib outcomes against previous studies (PFS) ......... 135
Table 55. Comparison of gefitinib outcomes against previous studies (OS) .......... 135
Table 56. List of conference proceedings searched ....Error! Bookmark not defined.
Table 57: Search strategy for MEDLINE® (Ovid) .........Error! Bookmark not defined.
Table 58: Search strategy for Embase (Ovid) .............Error! Bookmark not defined.
Table 59: Search strategy for Cochrane Library (Ovid) ............. Error! Bookmark not
defined.
Table 60: Search strategy for MEDLINE® (PubMed) ...Error! Bookmark not defined.
Table 61: Search strategy for Embase (Ovid) .............Error! Bookmark not defined.
Table 62: Search strategy for Cochrane Library (Ovid) ............. Error! Bookmark not
defined.
Table 63. Search terms for use in Embase search for conference abstracts
(searched via the Ovid SP platform)............................Error! Bookmark not defined.
Table 64: Eligibility criteria for RCT evidence ..............Error! Bookmark not defined.
Table 65. Primary studies and companion publications included in SLR ........... Error!
Bookmark not defined.
Table 66. Summary of study characteristics: trial information from all studies included
in the SLR* ..................................................................Error! Bookmark not defined.
Table 67. List of studies excluded based on population ............ Error! Bookmark not
defined.
Table 68. List of studies excluded based on study design ........ Error! Bookmark not
defined.
Table 69. List of studies excluded based on outcome .Error! Bookmark not defined.

Company evidence submission for dacomitinib for untreated EGFR-positive non-small-cell lung cancer (ID1346)
© Pfizer (2018). All rights reserved Page 12 of 388
Table 70. Characteristics of participants in the trials across treatment groups ... Error!
Bookmark not defined.
Table 71. Median follow-up and data analysis cut-off points in the trials ............ Error!
Bookmark not defined.
Table 72. Assessment of treatment effect modification within trial ... Error! Bookmark
not defined.
Table 73.Treatment schedules in the trials* ................Error! Bookmark not defined.
Table 74. Methods of analysis of studies included in indirect or mixed treatment
comparisons ................................................................Error! Bookmark not defined.
Table 75: Risk of Bias Assessment for studies included in indirect or mixed treatment
comparisons ................................................................Error! Bookmark not defined.
Table 76. Quality assessment for ARCHER 105033,40 .Error! Bookmark not defined.
Table 77. Number of treatment cycles* showing improvement from baseline in lung
cancer symptoms in participants from the ARCHER 1050 trial (as assessed by the
EORTC-QLQ-C30 or EORTC-QLQ-LC13)50 ...............Error! Bookmark not defined.
Table 78. Goodness-of-fit estimates for fractional polynomial models of different
powers p1 and p2 – PFS (IRC) ...................................Error! Bookmark not defined.
Table 79. Goodness-of-fit estimates for fractional polynomial models of different
powers p1 and p2 – OS ...............................................Error! Bookmark not defined.
Table 80. Observed hazard ratios and 95% confidence intervals for progression-free
survival based on IRC review, from included trials ......Error! Bookmark not defined.
Table 81. Observed hazard ratios and 95% confidence intervals for overall survival
analysis, from included trials .......................................Error! Bookmark not defined.
Table 82. Search terms for use in MEDLINE, MEDLINE In-Process and MEDLINE
Epub Ahead of Print (searched via the PubMed platform) ........ Error! Bookmark not
defined.
Table 83. Search terms for use in Embase (searched via the Ovid SP platform)
....................................................................................Error! Bookmark not defined.
Table 84. Search terms for use Cochrane Library (searched via the Wiley Online
platform) ......................................................................Error! Bookmark not defined.
Table 85. Search strategies used in EconLit (searched via the EBSCO platform)
....................................................................................Error! Bookmark not defined.

Company evidence submission for dacomitinib for untreated EGFR-positive non-small-cell lung cancer (ID1346)
© Pfizer (2018). All rights reserved Page 13 of 388
Table 86. Search terms for use in Embase search for conference abstracts
(searched via the Ovid SP platform)............................Error! Bookmark not defined.
Table 87. Eligibility criteria for the economic evaluation SLR .... Error! Bookmark not
defined.
Table 88. Details of the studies included in the systematic review ... Error! Bookmark
not defined.
Table 89. Summary of published UK economic evaluations ..... Error! Bookmark not
defined.
Table 90. Search terms for use in MEDLINE, MEDLINE In-Process, MEDLINE Epub
Ahead of Print (searched via the Ovid SP platform) ....Error! Bookmark not defined.
Table 91. Search terms for Embase (searched via the Ovid SP platform) ......... Error!
Bookmark not defined.
Table 92: Search terms for use in the Cochrane Library (via the Wiley Online
platform) ......................................................................Error! Bookmark not defined.
Table 93. Search strategies used in EconLit (searched via the EBSCO platform)
....................................................................................Error! Bookmark not defined.
Table 94. Search terms for use in Embase search for conference abstracts
(searched via the Ovid SP platform)............................Error! Bookmark not defined.
Table 95. Eligibility criteria for the HRQoL SLR update ............. Error! Bookmark not
defined.
Table 96. Details of the studies included in the systematic review ... Error! Bookmark
not defined.
Table 97. Summary of studies included in the systematic review .... Error! Bookmark
not defined.
Table 98. New studies and publications included in TA529 ...... Error! Bookmark not
defined.
Table 99. New studies and publications included in TA406 ...... Error! Bookmark not
defined.
Table 100. New studies and publications included in TA296 .... Error! Bookmark not
defined.
Table 101. New studies and publications included in TA258 .... Error! Bookmark not
defined.

Company evidence submission for dacomitinib for untreated EGFR-positive non-small-cell lung cancer (ID1346)
© Pfizer (2018). All rights reserved Page 14 of 388
Table 102. Summary of studies included in the TA258 systematic review which have
been used in the current submission ...........................Error! Bookmark not defined.
Table 103. Search terms for use in MEDLINE, MEDLINE In-Process and MEDLINE
Epub Ahead of Print (searched via the Ovid SP platform) ......... Error! Bookmark not
defined.
Table 104. Search terms for use in Embase (searched via the Ovid SP platform)
....................................................................................Error! Bookmark not defined.
Table 105. Search terms for use Cochrane Library (searched via the Wiley Online
platform) ......................................................................Error! Bookmark not defined.
Table 106. Search strategies used in EconLit (searched via the EBSCO platform)
....................................................................................Error! Bookmark not defined.
Table 107. Search terms for use in Embase search for conference abstracts
(searched via the Ovid SP platform)............................Error! Bookmark not defined.
Table 108. Eligibility criteria for the costs and resource use SLR ..... Error! Bookmark
not defined.
Table 109. Details of the studies included in the systematic review update ....... Error!
Bookmark not defined.
Table 110. Summary of studies included in the systematic review update ......... Error!
Bookmark not defined.
Table 111. New studies and publications included in TA529 .... Error! Bookmark not
defined.
Table 112. New studies and publications included in TA406 .... Error! Bookmark not
defined.
Table 113. New studies and publications included in TA296 .... Error! Bookmark not
defined.
Table 114. New studies and publications included in TA258 .... Error! Bookmark not
defined.
Table 115. Summary of QALY gain by health state (dacomitinib vs gefitinib) .... Error!
Bookmark not defined.
Table 116. Summary of LY gain by health state (dacomitinib vs gefitinib) ......... Error!
Bookmark not defined.
Table 117. Summary of QALY gain by health state (dacomitinib vs afatinib) ..... Error!
Bookmark not defined.

Company evidence submission for dacomitinib for untreated EGFR-positive non-small-cell lung cancer (ID1346)
© Pfizer (2018). All rights reserved Page 15 of 388
Table 118. Summary of LY gain by health state (dacomitinib vs afatinib) .......... Error!
Bookmark not defined.
Table 119. Summary of QALY gain by health state (dacomitinib vs erlotinib) .... Error!
Bookmark not defined.
Table 120. Summary of LY gain by health state (dacomitinib vs erlotinib) ......... Error!
Bookmark not defined.
Table 121. Summary of cost breakdown (dacomitinib vs gefitinib) ... Error! Bookmark
not defined.
Table 122. Summary of cost breakdown (dacomitinib vs gefitinib; list prices) .... Error!
Bookmark not defined.
Table 123. Summary of cost breakdown (dacomitinib vs afatinib) ... Error! Bookmark
not defined.
Table 124. Summary of cost breakdown (dacomitinib vs afatinib; list prices) ..... Error!
Bookmark not defined.
Table 125. Summary of cost breakdown (dacomitinib vs erlotinib;) . Error! Bookmark
not defined.
Table 126. Summary of cost breakdown (dacomitinib vs erlotinib; list prices) .... Error!
Bookmark not defined.
Table 127. Summary of variables applied in the economic model ... Error! Bookmark
not defined.
Table 128. Generated PFLYs in the PSA with FP models included compared to
determistic PFLYs .......................................................Error! Bookmark not defined.
Table 129. Generated LYs in the PSA with FP models included compared to
determistic LYs ............................................................Error! Bookmark not defined.
Table 130. Base-case results (at list prices) ................Error! Bookmark not defined.
Table 131. Probabilistic results (at list prices) .............Error! Bookmark not defined.
Table 132. Results of base-case scenario analysis versus gefitinib (at list prices)
....................................................................................Error! Bookmark not defined.
Table 133. Results of base-case scenario analysis versus erlotinib (at list price)
....................................................................................Error! Bookmark not defined.
Table 134. Results of base-case scenario analysis versus afatinib (at list price) Error!
Bookmark not defined.

Company evidence submission for dacomitinib for untreated EGFR-positive non-small-cell lung cancer (ID1346)
© Pfizer (2018). All rights reserved Page 16 of 388
B.1 Decision problem, description of the technology and clinical care
pathway
B.1.1 Decision problem The submission covers the technology’s full marketing authorisation for this indication.
Table 1. The decision problem1 Final scope issued by the NICE Decision problem
addressed in the company submission
Rationale if different from the final NICE scope
Population People with untreated locally advanced or metastatic NSCLC with EGFR activating mutation(s).
As per final scope Not applicable
Intervention Dacomitinib As per final scope Not applicable Comparator(s) Afatinib, Erlotinib, Gefitinib As per final scope Not applicable Outcomes The outcome measures to be considered include:
Overall survival Progression-free survival Overall response rate Duration of response Adverse events of treatment, Health-related quality-of-life
As per final scope Not applicable
Economic analysis
The reference case stipulates that the cost-effectiveness of treatments should be expressed in terms of incremental cost per QALY.
If the technology is likely to provide similar or greater health benefits at similar or lower cost than technologies recommended in published NICE technology appraisal guidance for the same indication, a cost-comparison may be carried out.
The reference case stipulates that the time horizon for estimating clinical
The economic analysis does not include the cost of testing for EGFR status.
EGFR testing is standard UK clinical practice and all comparators require EGFR testing. Therefore, testing would

Company evidence submission for dacomitinib for untreated EGFR-positive non-small-cell lung cancer (ID1346)
© Pfizer (2018). All rights reserved Page 17 of 388
Final scope issued by the NICE Decision problem addressed in the company submission
Rationale if different from the final NICE scope
and cost effectiveness should be sufficiently long to reflect any differences in costs or outcomes between the technologies being compared. Costs will be considered from an NHS and Personal Social Services perspective.
The availability of any patient access schemes for the intervention or comparator technologies will be taken into account.
The use of dacomitinib is conditional on the presence of EGFR mutation status. The economic modelling should include the costs associated with diagnostic testing for EGFR-TK mutation in people with NSCLC who would not otherwise have been tested. A sensitivity analysis should be provided without the cost of the diagnostic test.
continue irrespective of the outcome of this appraisal, and as it is required for all treatments in the decision problem, including the testing cost would not have any impact on the incremental results.
Subgroups to be considered
None As per final scope Not applicable
Special considerations including issues related to equity or equality
None As per final scope Not applicable
Abbreviations: AE = adverse event; del19 = exon 19 deletion; DoR = duration of response; EGFR = epidermal growth factor receptor; EGFR-TK = epidermal growth factor receptor tyrosine kinase; HRQoL = health-related quality of life; L858R = exon 21 Leu858Arg substitution; NHS = National Health Service; NICE = National Institute for Health and Care Excellence; NSCLC = non-small-cell lung cancer; ORR = objective response rate; OS = overall survival; PFS = progression-free survival; QALY = quality-adjusted life year.

Company evidence submission template for dacomitinib for untreated EGFR-positive non-small-cell lung cancer (ID1346)
© Pfizer (2018). All rights reserved Page 18 of 152
B.1.2 Description of the technology being appraised A summary of the mechanism of action, marketing authorisation status, costs and
administration requirements associated with dacomitinib for epidermal growth factor
receptor tyrosine kinase (EGFR-TK) mutation-positive advanced non-small-cell lung
cancer (NSCLC) is presented in Table 2. The summary of product characteristics
(SmPC) and European public assessment report for dacomitinib are presented in
Appendix C.
Table 2. Technology being appraised UK approved name and brand name
Dacomitinib (Vizimpro®, Pfizer)
Mechanism of action
Dacomitinib is a second generation, selective and irreversible TKI that has activity against three members of the ErbB family of proteins (EGFR/HER-1, HER2 and HER4), providing improved efficacy compared with reversible first-generation TKIs.2
Similar to first-generation TKIs, dacomitinib competes with ATP in the kinase domain of EGFR; however, dacomitinib covalently binds at the edge of the ATP binding site on Cys773 of EGFR via the Michael mechanism (addition of nucleophile to an α, β unsaturated carbonyl).3 This results in dacomitinib irreversibly blocking ATP from binding to the kinase, rendering it inactive (thereby irreversibly inhibiting HER tyrosine kinase activity).3
Dacomitinib is active against mutated EGFR, including the activating mutations in the kinase domain of EGFR that increase its activity. The two most common EGFR mutations are del19 and L858R substitution,4 which account for approximately 85% of all EGFR mutations. Additionally, these EGFR mutations have been identified in approximately 5–50% of NSCLC cases, with marked variation in frequency depending on smoking history, gender, ethnicity and histological subtype.2,5-9 Their presence can make the NSCLC cells more dependent on EGFR for growth and more sensitive to TKIs, and as a result, dacomitinib has demonstrated potent inhibitory activity in cell lines harbouring both of these.3,4,10
Marketing authorisation/CE mark status
A marketing authorisation submission to the European Medicines Agency was conducted in February 2018, for “XXXXXXXXXXXXXXXXXXXXXXXXXXXXXXXXXXXXXXXXXXXXXXXXXXXXXXXXXXXXXXXXXXXXXXXXXXXXXXXXXXXXXXXXXXXXXXXXXXXXXXXXXXXXXXXXXXXXXXXXXXXXXXXXXXXXXXXXXXXXXXXXXX”.
The expected decision date from the Committee for Human Medicinal Products is XXXXXXXXXXXXX.
Indications and Dacomitinib (Vizimpro®) is expected to be indicated

Company evidence submission for dacomitinib for untreated EGFR-positive non-small-cell lung cancer (ID1346)
© Pfizer (2018). All rights reserved Page 19 of 388
UK approved name and brand name
Dacomitinib (Vizimpro®, Pfizer)
any restriction(s) as described in the SmPC
“XXXXXXXXXXXXXXXXXXXXXXXXXXXXXXXXXXXXXXXXXXXXXXXXXXXXXXXXXXXXXXXXXXXXXXXXXXXXXXXXXXXXXXXXXXXXXXXXXXXXXXXXXXXXXXXXXXXXXXXXXXXXXXXXXXXXXX”, aligned with the indication in this appraisal.
Method of administration and dosage
Dacomitinib has a convenient once-daily oral 45mg dose and is recommended until disease progression or unacceptable toxicity occurs. The tablets should be swallowed whole with water and can be taken with or without food at approximately the same time every day.
Dacomitinib is available in three dose strengths – 45mg, 30mg and 15mg – making dose modifications to individualise treatment straightforward.
Additional tests or investigations
For the indication currently under consideration, patients need to be routinely tested for the presence of EGFR mutations. At present, EGFR testing is standard practice in England and Wales when making decisions about the first-line treatment of locally advanced or metastatic NSCLC.11
List price and average cost of a course of treatment
List price: XXXXXXXXX for 30 x 15mg or 30 x 30mg or 30 x 45mg capsules Average cost of a course of treatment: Based on the mean treatment duration of XXXX months in the economic model the average cost of treatment is XXXXXXX at list price and XXXXXXX with the PAS applied.
Patient access scheme (if applicable)
A simple discount of XX on the list price has been submitted to NHS England.
Abbreviations: ATP = adenosine triphosphate; del19 = exon 19 deletion; EGFR = epidermal growth factor receptor; HER = human EGFR related; L858R = exon 21 Leu858Arg substitution; NHS = National Health Service; NSCLC = non-small-cell lung cancer; SmPC = summary of product characteristics; TKI = tyrosine kinase inhibitor; UK = United Kingdom.

Company evidence submission for dacomitinib for untreated EGFR-positive non-small-cell lung cancer (ID1346)
© Pfizer (2018). All rights reserved Page 20 of 388
B.1.3 Health condition and position of the technology in the treatment pathway
B.1.3.1 Disease background
Lung cancer is the leading cause of cancer death worldwide and is responsible for over
35,000 deaths annually in the UK (2016).12 Lung cancer is divided into two main groups:
small-cell lung cancer (SCLC) and NSCLC, with the latter comprising approximately
85% of all lung cancer cases (Figure 1).13 There are three main subtypes on NSCLC,
including squamous cell carcinoma (25% of lung cancers), adenocarcinoma (40% of
lung cancers), and large cell carcinoma (10% of lung cancers).14
Figure 1. Lung cancer segmentation (percentage of incident cases)5-8
*Variation in the rate of mutation reflects differences in smoking history, ethnicity, gender and histological subtype of the study population. ALK = ALK receptor tyrosine kinase; EGFR = epidermal growth factor receptor; KRAS = KRAS proto-oncogene; NSCLC = non-small-cell lung cancer; SCLC = small-cell lung cancer.
Despite advances in the care of patients with advanced lung cancer, survival rates are
poor. Patients diagnosed with lung cancer in England and Wales between 2010–2011
had one-year survival rates of 32.1% and five-year survival rates of 9.5%.12 According
to the 2017 National Lung Cancer Audit annual report from the Royal College of
Physicians, patients with stage IV NSCLC, the 1-year survival rate for patients with
distant metastatic disease (i.e. stage IV) in England and Wales was 15.5% compared
with 81.7% for stage I.15 Furthermore, despite advances in early detection,
approximately 75% of patients with NSCLC still present with advanced disease at the
time of diagnosis (stage III or IV).16 Thereby, making extension of overall survival in
these patients a key goal of current treatments.

Company evidence submission for dacomitinib for untreated EGFR-positive non-small-cell lung cancer (ID1346)
© Pfizer (2018). All rights reserved Page 21 of 388
The burden of symptoms among patients with advanced lung cancer is also
considerable, with patients commonly experiencing disease-related symptoms at
diagnosis such as cough, dyspnoea, pain, weight loss and night sweats.17 Among
patients with NSCLC, the symptomatic burden results in poor quality of life that
deteriorates with disease progression.18 Moreover, treatment with chemotherapy also
has a negative impact on quality of life in this patients group, and is associated with an
increase in symptoms such as neutropenia, fatigue, nausea and vomiting, appetite loss
and constipation.19 This highlights the importance of delaying disease progression for as
long as possible in order to relieve symptoms, delay the use of chemotherapy and
maintain quality of life.
The identification of mutations in lung cancer has led to the development of molecularly
targeted therapy in order to improve survival outcomes in patients with advanced
disease.14 For example, a subgroup of patients with NSCLC have specific mutations in
the epidermal growth factor receptor (EGFR) gene. Approximately 5–50% of NSCLC
cases being characterised by EGFR alterations, depending on ethnicity, gender,
smoking status and histological subtype (Figure 1),5-8,20 with the highest rates of EGFR
mutations observed in patients of Asian descent, female gender, non-smokers and
patients with adenocarcinoma.5,7
Reported prevalence of EGFR mutations in adenocarcinoma (the most common lung
cancer subtype), based on ethnicity, have ranged from approximately 11% in a study of
French patients to 50% in a study of Japanese patients.21,22 Based on a study of
European patients, EGFR mutations were identified in approximately 14.1% of NSCLC
cancer patients.23 Prognosis for patients diagnosed with EGFR+ NSCLC is slightly
better than general NSCLC, however outcomes are still extremely poor with a five-year
survival rate of approximately 15% among patients with stage IV disease. 24
The most common EGFR mutations are exon 19 deletion (del19) and exon 21 L858R
substitutions (L858R), with these comprising 45–82% and 30% of EGFR mutations,
respectively. Commonly referred to as ‘sensitising mutations’ as they confer sensitivity
to TKIs.25 These two mutations alone constitute approximately 80–90% of EGFR

Company evidence submission for dacomitinib for untreated EGFR-positive non-small-cell lung cancer (ID1346)
© Pfizer (2018). All rights reserved Page 22 of 388
mutations in adenocarcinomas. As a result of these mutations causing structural
changes in the adenosine triphosphate (ATP) binding site of the intracellular domain of
EGFR, TKIs such as dacomitinib have increased affinity to EGFRs.25,26
B.1.3.2 Clinical pathway and current guidelines
The most significant paradigm change of the past decade for NSCLC management was
signalled by the use of TKIs in the first-line treatment of patients with targetable EGFR
mutations.27
B.1.3.2.1 First-line therapy
In adult patients diagnosed with Stage III/IV NSCLC who test positive for EGFR
mutation, NICE currently recommends the TKIs afatinib, erlotinib and gefitinib as first-
line treatment options (Figure 2) according to technology appraisal (TA) guidance 192
(gefitinib), 258 (erlotinib), and 310 (afatinib).11,28,29 Due to delayed confirmation of their
EGFR status, patients diagnosed with Stage III/IV NSCLC may also receive non-
targeted chemotherapy in the form of platinum-based doublet chemotherapy (this is
comprised of a single, third-generation drug [docetaxel, gemcitabine, paclitaxel or
vinorelbine], plus a platinum drug [either carboplatin or cisplatin]).30 Furthermore, NICE
recommends pemetrexed in combination with cisplatin as an option for the first-line
treatment if the histology of the tumour has been confirmed as adenocarcinoma or
large-cell carcinoma.31
B.1.3.2.2 Second-line therapy
In adult patients diagnosed with Stage III/IV NSCLC with EGFR mutations, osimertinib
is recommended by NICE as an option for use within the Cancer Drugs Fund in those
whose disease has progressed after first-line treatment with a TKI and are T790M
mutation-positive (Figure 2).32 Patients that progress on TKIs but do not develop a
T790M mutation may receive chemotherapy in the second-line (pemetrexed in
combination with either cisplatin or carboplatin, or single agent chemotherapy
[docetaxel, gemcitabine, paclitaxel or vinorelbine]; Figure 2).

Company evidence submission for dacomitinib for untreated EGFR-positive non-small-cell lung cancer (ID1346)
© Pfizer (2018). All rights reserved Page 23 of 388
B.1.3.3 Position of technology in the clinical pathway
The current licensed therapies for the first-line treatment of EGFR+ NSCLC are limited
to first-generation TKIs erlotinib and gefitinib, and the second-generation TKI afatinib.
As a new second-generation TKI, dacomitinib provides an important alternative to
currently available therapies for first-line treatment of patients with EGFR+ NSCLC
(Figure 2) and contributes to maintaining innovation in EGFR+ NSCLC to improve
outcomes for patients. In particular, dacomitinib offers a new treatment option that
improves efficacy and has a longer duration of effect versus gefitinib.33,34 Additionally,
network meta-analysis (NMA) results indicate that dacomitinib exhibits a consistent
trend toward improved time to disease progression and survival when compared with
current standard-of-care TKIs. Dacomitinib may therefore be a more suitable choice
versus current standard-of-care TKIs for prolonging time on targeted treatment in first-
line and delaying progression to second-line treatments such as chemotherapy or
osimertinib.
Besides extending the armamentarium available for the first-line treatment of EGFR+
NSCLC beyond gefitinib, afatinib and erlotinib, NICE approval of dacomitinib in first-line
setting is expected to not restrict treatment options in subsequent lines (Figure 2).

Company evidence submission for dacomitinib for untreated EGFR-positive non-small-cell lung cancer (ID1346)
© Pfizer (2018). All rights reserved Page 24 of 388
Figure 2. Proposed position of dacomitinib in the treatment pathway
*PFS values included from: EURTAC and OPTIMAL(erlotinib);35,36 IPASS (gefitinib);37 LUX-Lung 3 and LUX-Lung 6 (afatinib);38,39 platinum-based doublet chemotherapy (EURTAC);35 dacomitinib (ARCHER 1050).33 †Patients with delayed confirmation of their EGFR-TK mutation-positive status may receive a platinum based doublet chemotherapy regimen in the first-line. ‡Chemotherapy treatment with pemetrexed in combination with either cisplatin or carboplatin is commonly used in clinical practice. For those people for whom treatment with a platinum drug is not appropriate, NICE clinical guidelines recommend single agent therapy with either docetaxel, gemcitabine, paclitaxel or vinorelbine. Abbreviations: PFS = progression-free survival; T790M = secondary point mutation at amino acid position 790 that substitutes methionine for threonine.
B.1.4 Equality considerations
There are no known equality issues relating to the use of dacomitinib in patients with
EGFR+ NSCLC.

Company evidence submission for dacomitinib for untreated EGFR-positive non-small-cell lung cancer (ID1346)
© Pfizer (2018). All rights reserved Page 25 of 388
B.2 Clinical effectiveness
B.2.1 Identification and selection of relevant studies
B.2.1.1 Search strategy
A de novo systematic literature review (SLR) was conducted in October 2017, with an
update conducted in August of 2018, to identify all relevant clinical data from the
published literature regarding the clinical effectiveness of first-line treatments in EGFR+
NSCLC. The SLR was performed in accordance with the methodological principles of
conduct for systematic reviews as detailed in the University of York Centre for Reviews
and Dissemination’s (CRD) “Guidance for Undertaking Reviews in Health Care” and is
described in Appendix D.1.
B.2.1.2 Study selection
The SLR search was originally conducted from a global perspective with interventions
wider that those in the scope of this appraisal. The total number of included studies was
then refined to the subset relevant to the decision problem of this appraisal.
B.2.2 List of relevant clinical effectiveness evidence The SLR for clinical evidence identified two full peer-reviewed publications and three
conference proceedings, from one randomised controlled trial (RCT) of dacomitinib in
the population relevant to the decision problem, ARCHER 1050 (NCT01774721).
ARCHER 1050 studied adult patients with EGFR mutation-positive advanced NSCLC
that had not been previously treated. A summary of the clinical effectiveness data from
ARCHER 1050 is presented in Table 3. A summary of the other studies identified by the
SLR is presented in Appendix D.1.

Company evidence submission template for dacomitinib for untreated EGFR-positive non-small-cell lung cancer (ID1346)
© Pfizer (2018). All rights reserved Page 26 of 152
Table 3. Clinical effectiveness evidence for ARCHER 1050
Abbreviations: del19 = exon 19 deletion; DoR = duration of response; EGFR = epidermal growth factor receptor; EGFR+ = epidermal growth factor receptor mutation positive; EORTC QLQ-C30 = European Organisation for Research and Treatment of Cancer Core Quality of Life Questionnaire; EORTC QLQ-LC13 = European Organisation for Research and Treatment of Cancer Quality of Life Questionnaire‐Lung Cancer 13; EQ-5D-3L = European Quality of Life-5 Dimensions 3-level; IRC= Independent Review Committee; L858R = EGFR-TK mutation with an amino acid substitution at position 858 from a Leucine to an Arginine; NSCLC = non-small-cell Lung Cancer; ORR = objective response rate; OS = overall survival; PFS = progression-free survival; RECIST= Response Evaluation Criteria in Solid Tumours; TTF = time-to-treatment failure.
B.2.3 Summary of methodology of the relevant clinical effectiveness evidence The pivotal trial ARCHER 1050 compared the efficacy and safety of first-line treatment
with dacomitinib versus gefitinib in patients with newly diagnosed advanced or recurrent
Study ARCHER 1050 (2017) Study design Phase III, randomised, multicentre, open-label, efficacy and safety
study. Population Subjects with locally advanced or metastatic newly diagnosed,
treatment-naïve NSCLC or with recurrent NSCLC. All eligible patients had tumours that tested positive for at least one EGFR-activating mutation (either the del19 or L858R).
Intervention(s) Dacomitinib (N=227) Comparator(s) Gefitinib (N=224) Indicate if trial supports application for marketing authorisation
Yes X Indicate if trial used in the economic model
Yes X
No No
Rationale for use/non-use in model
ARCHER 1050 is the pivotal trial for dacomitinib as a first line treatment for advanced EGFR+ NSCLC. It therefore provides the most appropriate evidence which can be used in the model.
Reported outcomes specified in the decision problem
Primary outcome PFS (IRC assessment)
Secondary outcomes PFS (investigator assessment) OS ORR DoR AEs of treatment TTF (IRC and investigator assessment)
Patient reported outcomes EQ-5D-3L EORTC QLQ-C30 EORTC QLQ-LC13
All other reported outcomes specified in the scope
Not applicable

Company evidence submission for dacomitinib for untreated EGFR-positive non-small-cell lung cancer (ID1346)
© Pfizer (2018). All rights reserved Page 27 of 388
(minimum of 12 months disease-free interval between completion of systemic therapy
and recurrence of NSCLC required; patients with recurrent NSCLC must have only
completed neoadjuvant/adjuvant therapy previously) EGFR+ NSCLC.33,34,40 It is the only
phase III head-to-head study to compare a second-generation TKI with a standard-of-
care first-generation TKI in this disease indication in the first-line setting. In the pivotal
phase III trials of other currently licensed TKIs, chemotherapy was the comparator in the
first-line setting.9,35,36,38,39,41-45 Results from ARCHER 1050 have been reported for the
primary endpoint, PFS, key secondary endpoints, OS, overall response rate (ORR) and
duration of response (DoR), patient-reported outcomes (PRO) and safety.33,34 The
sections below provide a detailed description of the study design and methodology of
the pivotal trial ARCHER 1050 (see Table 4 for overview).
Table 4. ARCHER 1050 trial overview33,34,40 Trial number (acronym) NCT01774721, DP312804 (ARCHER 1050) Trial design Randomised, open-label, head-to-head, phase III trial Method of randomisation Patients were randomised 1:1 to either dacomitinib or gefitinib
according to a computer-generated code assigned by an interactive web response system. The randomisation procedure was stratified by race and EGFR mutation status.
Eligibility criteria Inclusion criteria: ≥18 years old (≥20 years in Japan and South Korea) Newly diagnosed Stage IIIB/IV or recurrent NSCLC Presence of EGFR mutation (del19 or L858R mutation),
with or without concurrent T790M mutation ECOG PS of 0-1 EGFR mutation status testing prior to randomisation Adequate renal, hepatic, and haematological function
Exclusion criteria: Mixed histology that included elements of small cell or
carcinoid lung cancer Mutation status other than del19 or L858R, with or
without T790M mutation History of brain metastases or leptomeningeal
metastases History of, or currently suspected, diffuse non-infectious
pneumonitis or interstitial lung disease Prior anti-cancer systemic treatment of early, locally
advanced, or metastatic NSCLC Uncontrolled medical conditions
Settings and locations where the data were
Multicentre (71 sites worldwide)

Company evidence submission for dacomitinib for untreated EGFR-positive non-small-cell lung cancer (ID1346)
© Pfizer (2018). All rights reserved Page 28 of 388
Trial number (acronym) NCT01774721, DP312804 (ARCHER 1050) collected Trial drugs and concomitant medications
Trial drugs Dacomitinib 45 mg orally, once daily* Gefitinib 250 mg orally, once daily
Concomitant medications CYP2D6 substrates Strong amines P-glycoprotein Supportive care
Disallowed medications Drugs with a narrow therapeutic index and dependent
on CYP2D6 metabolism Previous anti-cancer systemic treatment of locally
advanced, or metastatic NSCLC Surgery
Outcomes used in the economic model or specified in the scope, including primary outcome
Primary outcome PFS (IRC assessment)
Secondary outcomes PFS (investigator assessment) OS ORR DoR AEs of treatment
Pre-specified subgroup analyses
Age (<65 years vs >65 years) Sex ECOG PS (0 vs 1) Race (Asian vs non-Asian) Smoking history (never vs former or current) EGFR mutation (exon 19 deletion vs Leu858Arg)
*Dose modifications were allowed to manage treatment-related toxicity that was not controlled by optimal supportive care, or not tolerated due to symptoms or interference with normal daily activities, regardless of severity. Abbreviations: AE = adverse event; del19 = exon 19 deletion; CYP2D6 = cytochrome P450 2D6; DoR= duration of response; EGFR = epidermal growth factor receptor; ECOG = Eastern Cooperative Oncology Group; IRC = independent review committee; L858R = exon 21 Leu858Arg substitution; NSCLC = non-small-cell lung cancer; ORR = objective response rate; OS = overall survival; PS = performance status; T790M = secondary point mutation at amino acid position 790 that substitutes methionine for threonine.
B.2.3.1 Trial design
ARCHER 1050 was an international, randomised, phase III, open-label, multicentre
study comparing the efficacy and safety of first-line treatment with dacomitinib versus
gefitinib in patients with newly diagnosed advanced or recurrent EGFR+ NSCLC.33,34,40
It is the only phase III head-to-head study that compared a second-generation TKI
(dacomitinib) with a standard-of-care first-generation TKI (gefitinib) for first-line

Company evidence submission for dacomitinib for untreated EGFR-positive non-small-cell lung cancer (ID1346)
© Pfizer (2018). All rights reserved Page 29 of 388
treatment in this disease indication. An overview of the study design is provided in
Figure 3.
Figure 3. ARCHER 1050 study design
Abbreviations: del19 = exon 19 deletion; DoR = duration of response; ECOG PS 0-1 = Eastern Cooperative Oncology Group Performance Status 0 or 1; EGFR = epidermal growth factor receptor; INV = investigator assessment; IRC = independent review committee; L858R = exon 21 Leu858Arg substitution; NSCLC = non-small-cell lung cancer; ORR = objective response rate; OS = overall survival; PFS = progression-free survival; R = ratio; TKI = tyrosine kinase inhibitor; TTF = time to treatment failure.
Patients were randomised 1:1 to either dacomitinib or gefitinib and were treated up to a
maximum duration of 48 months until disease progression, intolerable toxicities,
withdrawal, death, or investigator decision dictated by protocol compliance, whichever
occurred first. The randomisation procedure was stratified by race (Japanese versus
mainland Chinese versus other East Asian versus non-Asian) and EGFR mutation
status (del19 versus the L858R). A central Interactive Web Response System (IWRS)
was used for patient enrolment at the time of informed consent and randomisation, as
well as for drug management. Once patient eligibility was confirmed, patients were
randomised by the IWRS according to a computer-generated random code to ensure
that approximately an equal number of patients would be assigned to each treatment
arm in the stratification categories of race and EGFR mutation status, based on their
values as determined at randomisation.

Company evidence submission template for dacomitinib for untreated EGFR-positive non-small-cell lung cancer (ID1346)
© Pfizer (2018). All rights reserved Page 30 of 152
B.2.3.2 Eligibility criteria
The ARCHER 1050 eligibility criteria are summarised in Table 5.
Table 5. ARCHER 1050 eligibility criteria Inclusion criteria Exclusion criteria 1. Patient consent
2. ≥18 years in age (≥20 years in Japan and Korea)
3. Presence of EGFR mutation (del19 or L858R) +/- concomitant T790M mutation
4. Newly diagnosed Stage IIIB/IV* or recurrent† NSCLC of adenocarcinoma histopathology and/or cytopathology or its variants
5. ECOG PS of 0 or 1
6. No prior treatment with systemic therapy for locally advanced or metastatic NSCLC
7. Radiologically measurable disease (RECIST version 1.1 criteria)
8. Adequate organ function, including: a. Estimated creatinine clearance ≥30 mL/min b. Urinary protein <3+ by urine dipstick c. Absolute neutrophil count ≥1500 cells/mm3 d. Platelets ≥100,000 cells/mm3 e. Haemoglobin ≥10.0 g/dL f. Bilirubin ≤1.5 x ULN g. AST and ALT ≤2.5 x ULN (≤5.0 x ULN if hepatic
metastases)
9. Patients must have fulfilled one of the following (where applicable):
a. Postmenopausal b. They or their partners were surgically sterile
1. Evidence of mixed histology and/or cytology that included elements of small cell or carcinoid lung cancer. Diagnosis of “NSCLC not otherwise specified”, squamous, or mixed adeno-squamous lung carcinomas
2. Any other mutation other than del19 or L858R (presence of both concurrently was exclusionary)
3. History or evidence of brain metastases or leptomeningeal metastases
4. Any previous anti-cancer systemic treatment of locally advanced, or metastatic NSCLC (including EGFR-TKI or other TKIs)‡
5. Any surgery (not including minor procedures), palliative radiotherapy, or pleurodesis ≤2 weeks of baseline
6. Any clinically significant gastrointestinal abnormalities that may have impaired intake, transit, or absorption of the study drug
7. Current enrolment in another therapeutic clinical study
8. Any psychiatric or cognitive disorder that would have limited the understanding or rendering of informed consent and/or compromise compliance with study requirements; or known drug abuse/alcohol abuse
9. History of, or currently suspected, diffuse non-infectious pneumonitis or ILD
10. Any history of galactose intolerance, Lapp lactase deficiency or glucose-galactose malabsorption
11. Uncontrolled or significant cardiovascular disease

Company evidence submission for dacomitinib for untreated EGFR-positive non-small-cell lung cancer (ID1346)
© Pfizer (2018). All rights reserved Page 31 of 388
Inclusion criteria Exclusion criteria c. Agreed to use effective contraception d. Those with reproductive potential must have had
a negative pregnancy test prior to starting study treatment
10. Willing and able to comply with study scheduled visits, treatment plans, laboratory tests, and other study procedures
12. Severely impaired (defined as Child-Pugh class C) hepatic dysfunction
13. Prior malignancy or evidence of another concurrent malignancy
14. Other severe acute or chronic medical condition that may have increased the risk associated with study participation or may have interfered with the interpretation of study results
15. Use of narrow therapeutic index drugs that were CYP2D6 substrates or a product with known effects on PK of gefitinib in reference to package insert from screening to randomisation.
*Based on Union for International Cancer Control staging system version 7 and the WHO/IASCLHistologic Classification of Lung Cancer Criteria. †Minimum of 12 months disease-free interval between completion of systemic therapy and recurrence of NSCLC required. ‡Exceptions included: palliative radiotherapy to lesions that were not followed for tumour assessment on this study (i.e. non-target lesions); completed neoadjuvant/adjuvant chemotherapy and/or combined modality chemotherapy/radiation therapy where there was ≥12-month disease-free interval between completion of systemic therapy and recurrence of NSCLC. Abbreviations: ALT = alanine aminotransferase. AST = aspartate aminotransferase; CYP2D6 = cytochrome P450 2D6; del19 = exon 19 deletion; ECOG PS = Eastern Cooperative Oncology Group Performance Status; IASCL = International Association of Study of Lung Cancer; ILD = interstitial lung disease; L858R = exon 21 Leu858Arg substitution; NSCLC = non-small-cell lung cancer; PK = pharmacokinetic; RECIST = Response Evaluation Criteria in Solid Tumours; T790M = secondary point mutation at amino acid position 790 that substitutes methionine for threonine; ULN= upper limit of normal; WHO = World Health Organisation.
Company evidence submission template for dacomitinib for untreated EGFR-positive non-small-cell lung cancer (ID1346)
© Pfizer (2018). All rights reserved Page 32 of 152
B.2.3.3 Settings and locations where the data were collected
The study was conducted at 71 study sites worldwide.33 Countries with study sites that
randomised patients into the study were China (21 sites), Hong Kong (2 sites), Italy (13
sites), Japan (10 sites), Poland (3 sites), Republic of Korea (5 sites), and Spain (17
sites).
B.2.3.4 Trial drugs and concomitant medications
B.2.3.2.1 Treatments administered
Patients received open-label study treatment and were randomized in a 1:1 ratio to one
of the following two treatment arms:
Investigational treatment: dacomitinib 45 mg orally once daily
Comparator treatment: gefitinib 250 mg orally once daily.
Randomised patients received continuous daily oral dosing of study treatment for up to
48 months from the date of first dosing or until one of the following criteria was met
(whichever occurred first):
Disease progression
Initiation of a new anti-cancer therapy
Unacceptable toxicities
Global deterioration of health-related symptoms
Pregnancy
Withdrawal of consent
Loss to follow-up

Company evidence submission for dacomitinib for untreated EGFR-positive non-small-cell lung cancer (ID1346)
© Pfizer (2018). All rights reserved Page 33 of 388
Death
Investigator decision dictated by protocol compliance
Study termination or patient completion of 48 months from first dosing date.
B.2.3.2.2 Dose modifications
Dacomitinib dose reductions could take place to manage treatment-related toxicity that
was not controlled by optimal supportive care, or not tolerated due to symptoms or
interference with normal daily activities, regardless of severity. Three dosage strengths
were available to accommodate two levels of dose reduction (Table 6).
If, after a dose reduction, a patient subsequently tolerated treatment well at that level in
the judgment of the investigator, the dose could be increased to the next dose level. If a
patient could not tolerate treatment after dose reduction to 15 mg, treatment was
discontinued.
Table 6. Dacomitinib dose reduction levels Dose Level Dose (once daily) Recommended starting dose 45 mg First dose reduction 30 mg Second dose reduction 15 mg
For patients in either treatment arm, study treatment could be interrupted for Grade 3,
Grade 4, or intolerable Grade 2 toxicity (using National Cancer Institute [NCI] Common
Terminology Criteria for Adverse Events [CTCAE] version 4.0). Upon recovery to Grade
2 or baseline, and in the clinical judgment of the investigator with the agreement of the
patient, the treatment could be resumed as in Table 7.
Table 7 Approach to resuming dacomitinib or gefitinib treatment after dose interruption Medication Dose modifications Dacomitinib For interruption due to Grade 3 or intolerable Grade 2 toxicity,
treatment could be resumed at the same dose level or reduced per protocol.
For episodes of Grade 4 toxicity, reduction to the next dose level was mandated.
Gefitinib For interruption due to Grade 3, Grade 4, or intolerable Grade 2

Company evidence submission for dacomitinib for untreated EGFR-positive non-small-cell lung cancer (ID1346)
© Pfizer (2018). All rights reserved Page 34 of 388
Medication Dose modifications toxicity, treatment could be resumed with daily or every other day dosing.
If gefitinib dosing was resumed with every other day dosing after interruption, all attempts were made to return the patient to once-daily dosing, if possible.
If dose was interrupted due to treatment-related toxicity, the dosing could be resumed at a temporarily reduced frequency (i.e. every other day dosing rather than daily dosing). If the patient was tolerating gefitinib at the every other day dosing, the investigator could determine whether to re-escalate the dosing back to daily dosing.
For patients whose study treatment (in either arm) had been interrupted due to
treatment-related toxicity as described above, treatment was permanently discontinued
if they failed to recover within 2 weeks of dose interruption, unless it was agreed with
the sponsor that the patient could resume treatment after a lapse of >2 weeks.
B.2.3.2.3 Prior and concomitant medications
Table 8 provides an overview of the procedures undertaken for prior and concomitant
medications.
Table 8. Prior and concomitant medications and procedures Medication Procedure description CYP2D6 substrates
For the dacomitinib arm, the use of concomitant medications that were highly dependent on CYP2D6 for metabolism required consideration of both the therapeutic index and the degree of CYP2D6 metabolism (list not exhaustive):
For drugs highly dependent on CYP2D6 metabolism, dose reduction was based on substrate sensitivity to CYP2D6 metabolism.
For drugs partly dependent on CYP2D6-mediated metabolism, with a high likelihood of supratherapeutic exposure (i.e. exposure levels greater than would be used in actual treatment of a medical condition) in combination with dacomitinib; clinical monitoring was required and dose-reduction was necessary.
Prodrugs, or drugs with highly active metabolites were replaced by an alternative within the therapeutic class which produces metabolites with lower or no activity.
Lidocaine Lidocaine exposures could significantly increase in the presence of strong amines, such as dacomitinib. Lidocaine could be used systemically, but clinical monitoring (including telemetry) was recommended.
P-glycoprotein Concurrent administration of drugs that were P-glycoprotein substrates (e.g. digoxin) and had a narrow therapeutic index were monitored for exaggerated effect and/or toxicities.

Company evidence submission for dacomitinib for untreated EGFR-positive non-small-cell lung cancer (ID1346)
© Pfizer (2018). All rights reserved Page 35 of 388
Medication Procedure description Acid-reducing agents
Concomitant use of proton pump inhibitors and H2 antagonists with dacomitinib were avoided, if possible. The use of short-acting antacids was permitted.
Supportive care
Subjects who were receiving bisphosphonates to control pain/bone metastases as recommended in current guidelines for bone-targeted therapy could continue while on the study.
However, initiation of bisphosphonate therapy after randomisation was considered progression of disease unless otherwise previously agreed.
Palliative radiotherapy for painful bony lesions was permitted providing that:
Lesions were known to be present at the time of study entry. Clear indication that palliative radiotherapy was needed for better
palliation than alternative analgesic options and not due to disease progression.
Abbreviations: CYP2D6 = cytochrome P450 2D6; H2 = Histamine 2.
B.2.3.2.4 Disallowed medications
Subjects who previously received any of the following treatments were not included in
the trial:
Drugs dependent on cytochrome P450 2D6 (CYP2D6) metabolism with narrow
therapeutic index including:
o Procainamide
o Pimozide
o Thioridazine.
Any previous anti-cancer systemic treatment of locally advanced, or metastatic
NSCLC were not allowed (including EGFR-TKI or other TKIs). Exceptions
included:
o Palliative radiotherapy to lesions that were not followed for tumour
assessment on this study (i.e. non-target lesions).

Company evidence submission for dacomitinib for untreated EGFR-positive non-small-cell lung cancer (ID1346)
© Pfizer (2018). All rights reserved Page 36 of 388
o Completed neoadjuvant/adjuvant chemotherapy and/or combined modality
chemotherapy/radiation therapy where there was ≥12-month disease-free
interval between completion of systemic therapy and recurrence of
NSCLC.
Any surgery (not including minor procedures e.g. lymph node biopsy), palliative
radiotherapy or pleurodesis within 2 weeks of baseline assessments.
B.2.3.5 Outcomes used in the economic model or specified in
the scope
Table 9 provides an overview of all the outcomes used in the economic model and/or
specified in the scope of this submission.

Company evidence submission template for dacomitinib for untreated EGFR-positive non-small-cell lung cancer (ID1346)
© Pfizer (2018). All rights reserved Page 37 of 152
Table 9. Outcomes included in the economic model or specified in the submission scope Outcome Definition Primary outcome PFS (IRC) Time from randomisation to the date of disease progression (per RECIST version 1.1 criteria) as determined by
blinded IRC review or death due to any cause, whichever occurred first.
The length of PFS was calculated as follows: PFS (months) = [(progression/death date [censor date] – randomization date) + 1] /30.4375
Documentation of progression must have been by objective disease assessment. Objective disease assessments were based on RECIST version 1.1 guidelines.
Secondary outcomes PFS (IA) Defined in the same way as the primary endpoint, except that the objective disease assessment was based on
investigator assessment. OS Time from randomisation to the date of death from any cause.
The length of OS was calculated as follows: OS (month) = [death date or last known alive date – randomisation date + 1]/30.4375.
ORR ORR was defined as the proportion of patients with a BOR* characterised as either a CR or PR (per RECIST version 1.1 criteria) relative to the total number of patients. ORR analysis was conducted by both blinded, IRC analysis and investigator assessment.
DoR Time from the first documentation of objective response (CR or PR, whichever occurred first) to the date of disease progression or death from any cause, whichever occurred first. DoR was calculated for the subgroup of patients with an objective tumour response. DoR analysis was conducted by both blinded, IRC analysis and investigator assessment.
DoR was calculated as follows: DoR (months) = [progression/death date (censor date) – date of first documentation of CR or PR +
1]/30.4375. PRO outcomes EORTC QLQ-C30 and EORTC QLQ-LC13
Evaluated using the EORTC QLQ-C30† questionnaire and its corresponding module for lung cancer, EORTC QLQ-LC13‡. For the EORTC QLQ-C30, higher scores for the five functional scales and the global QoL scale indicated higher level of functioning or global QoL, whereas for symptom scales/single items, a higher score indicated a higher level of symptoms or problems. The EORTC QLQ-C30 was scored according to its scoring manual. The scoring approach for the EORTC QLQ-LC13 was identical to that for the symptom scales/single items of the QLQ-C30.46
Each scale of the EORTC QLQ-C30 and the EORTC QLQ-LC13 were transformed so that scale scores ranged

Company evidence submission for dacomitinib for untreated EGFR-positive non-small-cell lung cancer (ID1346)
© Pfizer (2018). All rights reserved Page 38 of 388
Outcome Definition from 0 to 100.
Patients were classified as “improved,” “stable,” or “deteriorated” according to a 10-point change (threshold perceived as being clinically meaningful).
EQ-5D Assessed using the EQ-5D questionnaire which was collected day 1 of cycle 1 which provided the baseline assessment of PROs, days 8 and 15 of cycle 1 and at the beginning of each cycle afterwards (up to a total of 41 cycles), at the end of treatment and at a single post-progression follow-up.. The EQ-5D instrument consists of the following:
EQ-5D descriptive system: measures a subject’s health state on five dimensions which include: mobility, self-care, usual activities, pain/discomfort, and anxiety/depression. Each of these dimensions is scored by the patient on a 3-level scale (1=no problem, 2=some problem, and 3=extreme problem).
EQ-VAS: assesses the respondent’s self-rated health on a scale from 0 (worst imaginable health state) to 100 (best imaginable health state).
The EQ-5D was scored according to its scoring manual. Each dimension of the health state profiles included the proportion of patients reporting each of the levels noted above. A health utility index score was calculated using the standard algorithm provided in the manual.
Time to deterioration
Time to deterioration was a composite endpoint defined as the time from randomisation to the first time the subject’s score shows a 10 point or higher increase in several symptoms based on assessment by the EORTC QLQ-C30 and EORTC QLQ-LC13 instruments. These included:
Pain in chest; arm/shoulder (EORTC QLQ-LC13) Dyspnoea (EORTC QLQ C30) Dyspnea sub-scale (EORTC QLQ-LC13) Fatigue (EORTC QLQ-C30) Cough (EORTC QLQ-LC13).
Symptom deterioration was defined as a score increase of 10 points or higher (threshold that subjects perceive as being clinically significant) held for at least two consecutive cycles.
Safety outcomes AEs Characterised by type, frequency, severity (as graded by NCI CTCAE version 4.0 criteria), timing and relationship
to treatment on each arm, laboratory abnormalities observed, and left ventricular imaging observed. AEs were coded and classified using the MedDRA version 19.1 classification system.
TEAE An AE was considered treatment-emergent if: The event occurred after the start of study treatment and <28 days after final dose of study treatment and
was not seen prior to the start of treatment. The event was seen prior to the start of treatment but increased in NCI CTCAE version 4.0 grade after the

Company evidence submission for dacomitinib for untreated EGFR-positive non-small-cell lung cancer (ID1346)
© Pfizer (2018). All rights reserved Page 39 of 388
Outcome Definition start of treatment but <28 days after final dose of study treatment.
Disease progression was not considered a TEAE unless the subject died of disease <28 days after discontinuation of treatment.
Treatment-related AEs
Treatment-related AEs were defined as TEAE with cause possibly, probably or definitely related to treatment as judged by the investigator.
*BOR per RECIST version 1.1 was defined as the best response recorded from the time of randomisation until disease progression. †The EORTC QLQ-C30 consists of 30 questions which assess five functional domains (physical, role, cognitive, emotional, and social), global health status/quality of life, disease/treatment-related symptoms (fatigue, pain, nausea/vomiting, dyspnoea, appetite loss, sleep disturbance, constipation, and diarrhoea), and the perceived financial impact of disease. ‡The EORTC QLQ-LC13 module includes questions specific to the disease associated symptoms (dyspnea, cough, haemoptysis, and site specific pain), treatment-related symptoms (sore mouth, dysphagia, neuropathy, and alopecia), and analgesic use of lung cancer subjects. Abbreviation: AE = adverse event; BOR = best overall response; CR = complete response; DoR = duration of response; EORTC QLQ-C30 = European Organisation for Research and Treatment of Cancer Core Quality of Life Questionnaire; EORTC QLQ-LC13 = European Organisation for Research and Treatment of Cancer Quality of Life Questionnaire‐Lung Cancer 13; EQ-5D = European Quality of Life-5 Dimensions; EQ-VAS = European Quality of Life visual analogue scale; HRQoL = health-related quality of life; IRC = independent review committee; MedDRA = Medical Dictionary for Regulatory Activities; NCI CTCAE = National Cancer Institute Common Terminology Criteria for Adverse Events; ORR = objective response rate; OS = overall survival; PFS = progression-free survival; PR = partial response; PRO = patient-reported outcome; RECIST = Response Evaluation Criteria in Solid Tumours; TEAE = treatment-emergent adverse event; TTF = time to treatment failure.
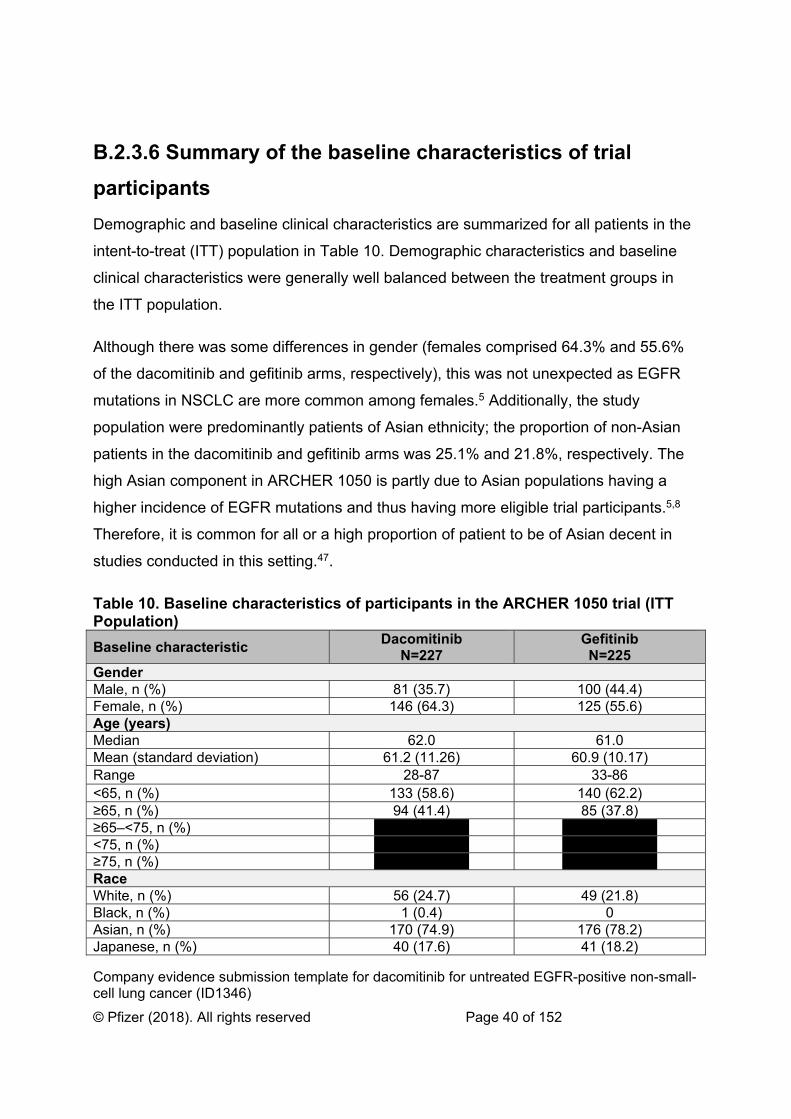
Company evidence submission template for dacomitinib for untreated EGFR-positive non-small-cell lung cancer (ID1346)
© Pfizer (2018). All rights reserved Page 40 of 152
B.2.3.6 Summary of the baseline characteristics of trial
participants
Demographic and baseline clinical characteristics are summarized for all patients in the
intent-to-treat (ITT) population in Table 10. Demographic characteristics and baseline
clinical characteristics were generally well balanced between the treatment groups in
the ITT population.
Although there was some differences in gender (females comprised 64.3% and 55.6%
of the dacomitinib and gefitinib arms, respectively), this was not unexpected as EGFR
mutations in NSCLC are more common among females.5 Additionally, the study
population were predominantly patients of Asian ethnicity; the proportion of non-Asian
patients in the dacomitinib and gefitinib arms was 25.1% and 21.8%, respectively. The
high Asian component in ARCHER 1050 is partly due to Asian populations having a
higher incidence of EGFR mutations and thus having more eligible trial participants.5,8
Therefore, it is common for all or a high proportion of patient to be of Asian decent in
studies conducted in this setting.47.
Table 10. Baseline characteristics of participants in the ARCHER 1050 trial (ITT Population)
Baseline characteristic Dacomitinib
N=227 Gefitinib N=225
Gender Male, n (%) 81 (35.7) 100 (44.4) Female, n (%) 146 (64.3) 125 (55.6) Age (years) Median 62.0 61.0 Mean (standard deviation) 61.2 (11.26) 60.9 (10.17) Range 28-87 33-86 <65, n (%) 133 (58.6) 140 (62.2) ≥65, n (%) 94 (41.4) 85 (37.8) ≥65–<75, n (%) XXXXXXXXXX XXXXXXXXXX <75, n (%) XXXXXXXXXX XXXXXXXXXX ≥75, n (%) XXXXXXXXXX XXXXXXXXXX Race White, n (%) 56 (24.7) 49 (21.8) Black, n (%) 1 (0.4) 0 Asian, n (%) 170 (74.9) 176 (78.2) Japanese, n (%) 40 (17.6) 41 (18.2)

Company evidence submission for dacomitinib for untreated EGFR-positive non-small-cell lung cancer (ID1346)
© Pfizer (2018). All rights reserved Page 41 of 388
Baseline characteristic Dacomitinib
N=227 Gefitinib N=225
Mainland Chinese, n (%) 114 (50.2) 117 (52.0) Other East Asian, n (%) 16 (7.0) 18 (8.0) Weight (kg) Median 59.50 60.00 Mean (standard deviation) 60.13 (12.841) 61.20 (10.784) Range 30.0-130.0 36.9-93.5 Smoking status Never smoked, n (%) 147 (64.8) 144 (64.0) Ex-smoker, n (%) 65 (28.6) 62 (27.6) Smoker, n (%) 15 (6.6) 19 (8.4) ECOG performance status 0, n (%) 75 (33) 62 (28) 1, n (%) 152 (67) 163 (72) Disease stage at screening Stage IIIB, n (%) 18 (8) 16 (7) Stage IV, n (%) 184 (81) 183 (81) Unknown*, n (%) 25 (11) 26 (12) EGFR mutation† del19‡, n (%) 134 (59) 133 (59) L858R§, n (%) 93 (41) 92 (41) *Newly diagnosed with Stage IV at time of study entry. †EGFR mutations (at randomisation) were identified from tumour specimens. ‡At randomisation, two patients in the gefitinib group (and none in the dacomitinib group) had the Thr790Met mutation. §At randomisation, two patients in the dacomitinib group (and none in the gefitinib group) had the Thr790Met mutation. Abbreviations: del19 = exon 19 deletion; ECOG = Eastern Cooperative Oncology Group; L858R = exon 21 Leu858Arg substitution.

Company evidence submission template for dacomitinib for untreated EGFR-positive non-small-cell lung cancer (ID1346)
© Pfizer (2018). All rights reserved Page 42 of 152
B.2.4 Statistical analysis and definition of study groups in the relevant clinical effectiveness evidence
B.2.4.1 Objective, sample size and analysis sets
Table 11. Primary objective, sample size and analysis sets of the ARCHER 1050 trial40 Objective /
hypothesis Sample size Analysis sets
ARCHER 1050
The primary objective of the ARCHER 1050 trial was to demonstrate that dacomitinib is superior to gefitinib with respect to PFS (determined by blinded IRC review), in patients with EGFR+ advanced NSCLC.
The primary endpoint of the study was PFS as determined by blinded IRC review. It was estimated that approximately 440 randomised patients and ≥256 PFS events would be required to achieve a 90% power to detect a ≥50% improvement in PFS (i.e. improvement in median PFS from 9.5 to at ≥14.3 months) in patients randomised to receive dacomitinib versus those randomised to receive gefitinib (i.e. HR ≤0.667, 1-sided stratified log-rank test α=0.025; 1:1 randomization; and censoring rate ~42%).
At the end of the study, the primary analysis tested the HR (dacomitinib/gefitinib) ≥1 versus <1 using a 1-sided stratified log-rank test. The study was considered a positive study if at the time of the final PFS the 1-sided stratified log-rank test was significant at the 0.025 level.
Final OS analysis was pre-specified to occur after ≥201 deaths.34
ITT Population Treatment assignment designated according to initial randomisation, regardless of whether patients received study treatment or received a different treatment from that to which they were randomised.
Primary population for evaluating efficacy endpoints and patient characteristics.
AT and Safety Population All patients who received ≥1 dose of study treatment.
Patients were analysed in the treatment group according to study treatment received.
Primary population for evaluating treatment administration and safety.
PRO Analysis Set Patients from the AT Population who started treatment, completed a baseline PRO assessment, and completed ≥1 post-baseline PRO assessment after the first dose.
Abbreviations: AT = as-treated; EGFR+ = epidermal growth factor receptor mutation positive; HR = hazard ratio; IRC = independent review committee; ITT = intent-to-treat; NSCLC = non-small-cell lung cancer; PFS = progression-free survival; PRO = patient-reported outcome; OS = overall survival.

Company evidence submission for dacomitinib for untreated EGFR-positive non-small-cell lung cancer (ID1346)
© Pfizer (2018). All rights reserved Page 43 of 388
B.2.4.2 Censorship and missing data management
The censorship methodology for the primary and secondary outcomes of ARCHER 1050 are summarised in Table 12.
Table 12. Censorship for primary and secondary outcomes in the ARCHER 1050 trial48 Outcome Censorship description Primary outcomes PFS (IRC) Patients last known to be alive, progression-free, and who had a baseline and ≥1 on-study disease assessment were
censored to new (non-protocol) anti-cancer treatment status as follows: Did not start a new anti-cancer treatment: censored at the date of the last objective disease assessment that
verified lack of disease progression. Started new anti-cancer treatment: censored at the date of the last objective disease assessment documenting
no progression prior to the start of the new treatment.
Patients with inadequate baseline disease assessment were censored at the date of randomisation. Patients with no on-study disease assessments were censored at the date of randomisation unless death occurred prior to the first planned assessment.
Patients who progressed after starting a new anti-cancer treatment were censored at the date of the last objective disease assessment documenting no progression prior to the start of the new treatment.
Patients with documentation of progression or death after an unacceptably long interval (>16 weeks, usually ≥2 missed or indeterminate assessments) since the last tumour assessment were censored at the time of the last objective assessment documenting no progression.
Secondary outcomes OS In the absence of confirmation of death, survival time was censored at the last date the subject was known to be alive.
Subjects who lacked data beyond enrolment had their survival times censored at randomisation.
PFS (IA) Approach to censorship was the same as outlined for primary endpoint. DoR Approach to censorship was the same as outlined for primary endpoint. TTF Patients last known not to have failed treatment were censored at the date of the last objective disease assessment
documenting no progression. Patients last known not to have failed treatment and with no on-study disease assessments were censored at the date of randomisation.
PRO outcomes
For time to deterioration in PRO symptoms, subjects were censored at the last time when they completed an assessment for pain, dyspnoea, fatigue or cough if they have not deteriorated.
Abbreviations: AT = as-treated; EGFR+ = epidermal growth factor receptor mutation positive; HR = hazard ratio; IRC = independent review committee; ITT = intent-to-treat; NSCLC = non-small-cell lung cancer; OS = overall survival; PFS = progression-free survival; PRO = patient-reported outcome.

Company evidence submission for dacomitinib for untreated EGFR-positive non-small-cell lung cancer (ID1346)
© Pfizer (2018). All rights reserved Page 44 of 388
The approach to managing missing data is summarised in Table 13.
Table 13. Missing data management overview Category Missing data management Missing data in efficacy endpoints Baseline tumour assessment
If baseline tumour assessment was inadequate the subject was unable to be assessed for RECIST response. If there were no assessments after dosing, response was indeterminate unless progression was documented or determined by blinded IRC review or investigator assessment ≤12 weeks.
Inadequate baseline assessment included: Not all required baseline assessments were done. Assessments were done outside the required window. Measurements were not provided for one or more target lesions. One or more lesions designated as targeted were not measurable.
Objective status at each tumour assessment
If measurements for ≥1 target lesions were missing and disease did not qualify as progression or symptomatic deterioration, the objective status for that evaluation was indeterminate.
If non-target disease was not assessed, then a subject who qualified for an objective status of CR based on target disease was classified as PR. Otherwise, missing non-target disease assessments generally did not affect response determination, subject to review by blinded IRC review or investigator assessment.
If a target lesion was documented as too small to measure without unequivocal complete disappearance of the lesion, a default value of 5mm was assigned and the objective status was assigned accordingly.
BOR/ORR Subjects without a response in whom treatment failed (death, symptomatic deterioration, discontinuation of treatment for other reason) prior to objective progression were assumed to be non-responders. An exception was made for subjects who discontinued treatment with objective stable disease and, subsequently, had assessment documenting response prior to starting a new treatment. These subjects were classified as responders.
Subjects with unknown best response (all objective statuses prior to progression were indeterminate and progression >12 weeks after randomisation) were assumed to be non-responders.
For subjects with indeterminate objective status prior to progression, but progression occurred ≥12 weeks after randomisation, best response was “progressive disease”.
Time-to-event endpoints
For time-to-event endpoints, missing dates were handled as described in the “Missing data in dates” section of this table. Subjects who did not experience the event of interest were censored.
PRO outcomes
Subjects with missing baseline scores or with baseline scores, but with no follow-up scores, were not assessable for change from baseline and time to deterioration analyses. For the EORTC QLQ-C30, EORTC QLQ-LC13, and EQ-5D assessments, in cases where two answers were given to one item, the more severe answer was counted.

Company evidence submission for dacomitinib for untreated EGFR-positive non-small-cell lung cancer (ID1346)
© Pfizer (2018). All rights reserved Page 45 of 388
Category Missing data management If less than half of the constituent items on the EORTC QLQ-C30 and EORTC QLQ-LC13 were answered for a multi-item subscale, that subscale was considered missing. Single item subscales were considered missing if the constituent item was incomplete. On the EQ-5D, questions not answered were considered as missing items, and were neither imputed nor utilised.
Missing data in safety endpoints Safety endpoints
The percentage of subjects with an AE were calculated using the number of AT subjects as the denominator. Therefore, no subjects in the AT population were excluded from AE displays. The denominator for summary tables for each laboratory parameter were all subjects in the AT population with at least one evaluable cycle for that parameter. Different laboratory parameters had different denominators, depending on the number of evaluable subjects for each parameter. An evaluable cycle was any cycle with at least one assessment of that parameter. Therefore, subjects with no assessments of a particular laboratory parameter were not included in the analysis of that parameter.
Missing data in dates Efficacy analyses
The following conventions for partial dates was applied for efficacy analyses: If the day of the month was missing for any date used in a calculation, the first day of the month was used to
replace the missing date unless the calculation resulted in a negative time duration (e.g. date of onset cannot be prior to day one date). In this case, the date resulting in 0 time duration was used.
If the day of the month and the month was missing for any date used in a calculation, the 1st of January was used to replace the missing data.
For OS and PFS, if these conventions produced a date that resulted in a negative time to event, then the time to event was re-set to 1 day.
AEs Missing dates in AEs were inputted using the following approach: For the start date, if the day of the month was missing, the first day of the month was used to replace the
missing date. If both day and month were missing, the 1st of January of the non-missing year was used. For the stop date, if the day of the month was missing, the last day of the month was used to replace the
missing date. If both day and month were missing, December 31 of the non-missing year was used. If the start date was missing for an AE, the AE was considered to be treatment-emergent unless the collection date was prior to the treatment start date.
Abbreviations: AE = adverse event; AT = as-treated; BOR = best overall response; CR = complete response; EORTC QLQ-C30 = European Organisation for Research and Treatment of Cancer Core Quality of Life Questionnaire; EORTC QLQ-LC13 = European Organisation for Research and Treatment of Cancer Quality of Life Questionnaire‐Lung Cancer 13; EQ-5D = European Quality of Life-5 Dimensions; IRC = independent review committee; ORR = objective response rate; OS = overall survival; PFS= progression-free survival; PR = partial response; PRO = patient-reported outcome; RECIST = Response Evaluation Criteria in Solid Tumours.

Company evidence submission for dacomitinib for untreated EGFR-positive non-small-cell lung cancer (ID1346)
© Pfizer (2018). All rights reserved Page 46 of 388
B.2.4.3 Statistical analysis
B.2.4.3.1 Primary outcome
PFS based on blinded, IRC review were summarised in the ITT population.
Estimates of the PFS curves obtained from the Kaplan-Meier method were displayed
graphically. The median (and other quartiles) event time and corresponding 2-sided
95% CI for the median were provided for each treatment arm. Probability of PFS at
clinical meaningful time points were estimated and presented with 95% CI based on
the Greenwood method.
Differences in PFS between treatment arms were analysed by the Cox Regression
(i.e. for estimated HR and its 95% CI) and log rank test (1-sided, α=0.025) for 1-
sided p-value, both stratified by race and EGFR mutation status based on their
values at randomisation.
HRs and p-values for PFS in subgroups were estimated from the unstratified Cox
regression model and the unstratified log-rank test, respectively. The proportions of
patients achieving objective responses were compared between groups using
Pearson’s χ² test.
B.2.4.3.2 Secondary outcomes
A log-rank test, stratified by EGFR mutation status at randomisation and race, was
used to assess PFS based on investigator assessment, OS, TTF, and DoR. A Cox
proportional hazards model, stratified by EGFR mutation status and race as used in
the log-rank test, was used to calculate HRs and 95% CI for OS and TTF in the ITT
population and DoR among the objective responders in the ITT population. P-values
were determined by the log-rank test with adjustment for the same stratification
factors. All p values were 2-sided.
ORR was summarised along with the corresponding exact 2-sided 95% CI using a
method based on the Binomial distribution. The Cochran-Mantel-Haenszel test
stratified by race and EGFR mutation status were used to compare ORR between
the 2 treatment arms. The relative risk ratio estimator were used to contrast the
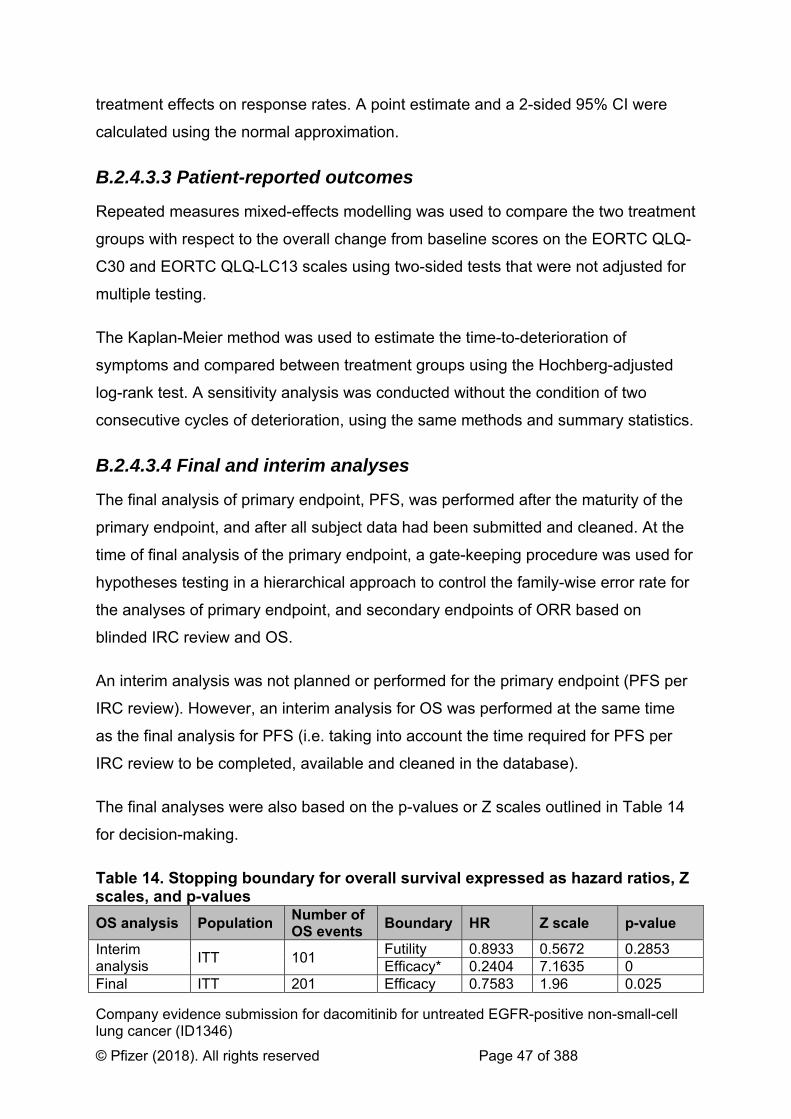
Company evidence submission for dacomitinib for untreated EGFR-positive non-small-cell lung cancer (ID1346)
© Pfizer (2018). All rights reserved Page 47 of 388
treatment effects on response rates. A point estimate and a 2-sided 95% CI were
calculated using the normal approximation.
B.2.4.3.3 Patient-reported outcomes
Repeated measures mixed-effects modelling was used to compare the two treatment
groups with respect to the overall change from baseline scores on the EORTC QLQ-
C30 and EORTC QLQ-LC13 scales using two-sided tests that were not adjusted for
multiple testing.
The Kaplan-Meier method was used to estimate the time-to-deterioration of
symptoms and compared between treatment groups using the Hochberg-adjusted
log-rank test. A sensitivity analysis was conducted without the condition of two
consecutive cycles of deterioration, using the same methods and summary statistics.
B.2.4.3.4 Final and interim analyses
The final analysis of primary endpoint, PFS, was performed after the maturity of the
primary endpoint, and after all subject data had been submitted and cleaned. At the
time of final analysis of the primary endpoint, a gate-keeping procedure was used for
hypotheses testing in a hierarchical approach to control the family-wise error rate for
the analyses of primary endpoint, and secondary endpoints of ORR based on
blinded IRC review and OS.
An interim analysis was not planned or performed for the primary endpoint (PFS per
IRC review). However, an interim analysis for OS was performed at the same time
as the final analysis for PFS (i.e. taking into account the time required for PFS per
IRC review to be completed, available and cleaned in the database).
The final analyses were also based on the p-values or Z scales outlined in Table 14
for decision-making.
Table 14. Stopping boundary for overall survival expressed as hazard ratios, Z scales, and p-values
OS analysis Population Number of OS events
Boundary HR Z scale p-value
Interim analysis
ITT 101 Futility 0.8933 0.5672 0.2853 Efficacy* 0.2404 7.1635 0
Final ITT 201 Efficacy 0.7583 1.96 0.025

Company evidence submission for dacomitinib for untreated EGFR-positive non-small-cell lung cancer (ID1346)
© Pfizer (2018). All rights reserved Page 48 of 388
OS analysis Population Number of OS events
Boundary HR Z scale p-value
analysis * The interim analysis is for futility only; the trial was not stopped for efficacy based on comparison of OS at the interim analysis. Abbreviations: HR = hazard ratio; ITT = intent-to-treat; OS = overall survival.
B.2.4.5 Patient withdrawals
All patients who received at ≥1 dose of study drug were included in the safety
analysis. Patients could withdraw from treatment at any time at their own request or
could be withdrawn at any time for safety, behavioural, or administrative reasons.
Reasons for withdrawal are outlined in section B.2.3.2.1.
Patients who withdrew from the study and also withdrew consent for disclosure of
future information had no further evaluations, and no additional data were collected
(see Appendix D for patient disposition details).
B.2.5 Quality assessment of the relevant clinical effectiveness evidence Critical appraisal of the included clinical trial (ARCHER 1050) was conducted using
the NICE Quality Appraisal Checklist for quantitative intervention studies (Table
15).49 A summary of the quality assessment is presented below in Table 15, while
the complete quality assessment is available in Appendix D (Error! Reference
source not found.).
Table 15. Summary of ARCHER 1050 quality appraisal Assessment criteria ARCHER 1050 Was the method used to generate random allocations adequate? Yes
Was allocation adequately concealed? Not applicable (open label study)
Were the groups similar at the outset of the study in terms of prognostic factors, for example severity of disease?
Yes
Were the care providers, participants and outcome assessors blind to treatment allocation? If any of these people were not blinded, what might be the likely impact on the risk of bias (for each outcome)?
Not applicable (open label study)
Were there any unexpected imbalances in drop-outs between groups? If so, were they explained or adjusted for?
No
Is there any evidence to suggest that the authors measured more outcomes than they reported?
No
Were the statistical analyses undertaken appropriate? Yes

Company evidence submission for dacomitinib for untreated EGFR-positive non-small-cell lung cancer (ID1346)
© Pfizer (2018). All rights reserved Page 49 of 388
B.2.6 Clinical effectiveness results of the relevant trials Clinical efficacy summary
First-line treatment with dacomitinib resulted in a statistically and clinically meaningful improvement in PFS compared with gefitinib in patients with EGFR+ NSCLC (Section 2.6.2 and Section 2.6.3.1).
First-line treatment with dacomitinib resulted in a significant improvement in OS compared with gefitinib in patients with EGFR+ NSCLC (Section 2.6.3.2).
First-line treatment with dacomitinib was associated with a high ORR comparable to gefitinib in patients with EGFR+ NSCLC (Section 2.6.3.3).
First-line treatment with dacomitinib resulted in significant improvements in DoR (Section 2.6.3.4) and TTF (Section 2.6.3.5) compared with gefitinib in patients with EGFR+ NSCLC.
Dacomitinib helps patients with EGFR-mutation positive NSCLC reduce key disease-related symptoms and maintain overall HRQoL (Section 2.6.4).
Abbreviations: DoR = duration of response; EGFR+ = epidermal growth factor receptor mutation positive; HRQoL = health-related quality of life; NSCLC = non-small-cell lung cancer; ORR = objective response rate; OS = overall survival; TTF = time to treatment failure.
B.2.6.1 Overview of clinical effectiveness results
Table 16 presents an overview of the clinical effectiveness results from ARCHER
1050.
Table 16. Summary of clinical effectiveness results in the ARCHER 1050 trial (ITT Population)33,34,40
Outcome Dacomitinib
N=227 Gefitinib N=225
PFS (based on blinded IRC) Patients with PFS event, n (%) 136 (59.9) 179 (79.6) Median PFS, months (95% CI)* 14.7 (11.1, 16.6) 9.2 (9.1, 11.0) HR (95% CI)† 0.589 (0.469, 0.739) P-value (1-sided)† <0.0001 PFS (based on investigator assessment) Patients with PFS event, n (%) 140 (61.7) 177 (78.7) Median PFS, months (95% CI)* 16.6 (12.9, 18.4) 11.0 (9.4, 12.1) HR (95% CI)† 0.622 (0.497, 0.779) P-value (1-sided)† <0.0001 OS Deaths, n (%)‡ 103 (45.4) 117 (52.0)
Median months (95% CI) 34.1 (29.5, 37.7) 26.8 (23.7,
32.1) HR (95% CI)† 0.760 (0.582, 0.993) P-value (2-sided)† 0.0438 BOR (based on blinded IRC) Complete response, n (%) 12 (5.3) 4 (1.8) Partial response, n (%) 158 (69.6) 157 (69.8) Stable, n (%) 30 (13.2) 27 (12.0) Progressive disease, n (%) 12 (5.3) 15 (6.7)

Company evidence submission for dacomitinib for untreated EGFR-positive non-small-cell lung cancer (ID1346)
© Pfizer (2018). All rights reserved Page 50 of 388
Outcome Dacomitinib
N=227 Gefitinib N=225
Intermediate, n (%) 15 (6.6) 22 (9.8) Objective response rate (CR plus PR), n (%) 170 (74.9) 161 (71.6) 95% exact CI§ (68.7, 80.4) (65.2, 77.4) BOR (based on investigator assessment) Complete response, n (%) XXXXX XXXXX Partial response, n (%) XXXXX XXXXX Stable, n (%) XXXXX XXXXX Progressive disease, n (%) XXXXX XXXXX Intermediate, n (%) XXXXX XXXXX Objective response rate (CR plus PR), n (%) XXXXX XXXXX 95% exact CI§ XXXXX XXXXX DoR (based on blinded IRC) Number with a response (CR or PR), n (%) 170 (74.9) 161 (71.6) Median duration of response, months (95% CI)₸ 14.8 (12.0, 17.4) 8.3 (7.4, 9.2) Descriptive summary of response duration (months), n 170 161 Mean (standard deviation) 12.78 (7.681) 9.17 (5.549) Median 12.02 8.11 Range 0.0-34.3 0.0-32.2 DoR in responders (based on investigator assessment) Number with a response (CR or PR), n (%) XXXXX XXXXX Median duration of response, months (95% CI)₸ XXXXX XXXXX Descriptive summary of response duration (months), n XXXXX XXXXX Mean (standard deviation) XXXXX XXXXX Median XXXXX XXXXX Range XXXXX XXXXX *Kaplan-Meier estimates of time to event (months) 50% quartile (95% CI). Based on the Brookmeyer-Crowley Method. †This is based on stratified analysis. ‡Per the statistical analysis plan, the final OS analysis was to occur after a pre-specified minimum of 201 deaths. Data cut-off on February 17, 2017, with 220 deaths observed. §Using exact method based on binomial distribution. ₸Kaplan-Meier estimates of response duration (months) quartiles (95% CI); Based on the Brookmeyer-Crowley method. Abbreviations: BOR = best overall response; CI = confidence interval; CR = complete response; DoR = duration of response; HR = hazard ratio; INV = investigator assessment; IRC = independent review committee; ITT = intent-to-treat; PFS = progression-free survival; PR = partial response.
B.2.6.2 Primary endpoint
First-line treatment with dacomitinib resulted in a statistically and clinically
meaningful improvement in PFS compared with gefitinib in patients with EGFR+
NSCLC. The ARCHER 1050 trial met its primary objective by demonstrating that
dacomitinib was superior to gefitinib in prolonging PFS as determined by blinded IRC
review.33,40
Overall, a total of 315 patients (69.7%) in ARCHER 1050 had a PFS event as of the
data cut-off date, after application of all the censoring rules. Of the 315 PFS events,
136 patients (59.9%) were from the dacomitinib arm and 179 patients (79.6%) from

Company evidence submission for dacomitinib for untreated EGFR-positive non-small-cell lung cancer (ID1346)
© Pfizer (2018). All rights reserved Page 51 of 388
the gefitinib arm. Dacomitinib demonstrated a 5.5 month improvement in median
PFS and a 41% reduction in the risk of progression compared with gefitinib; median
PFS was 14.7 months (95% CI: 11.1, 16.6) for dacomitinib versus 9.2 months (95%
CI: 9.1, 11.0) for gefitinib (HR: 0.589; 95% CI: 0.469, 0.739; 1-sided p-value<0.0001;
unstratified log-rank test).33,40
The Kaplan-Meier plot for PFS based on blinded IRC review is shown in Figure 4.
The median duration of PFS follow-up using reverse Kaplan-Meier method in the ITT
population was 22.1 months. The probability of being event-free at 12 months was
55.7% (95% CI: 48.5, 62.3) for the dacomitinib arm versus 35.9 (95% CI: 29.3, 42.4)
for the gefitinib arm. At 24 months, the probability of being event-free was 30.6%
(95% CI: 23.8, 37.5) versus 9.6% (95% CI: 5.6, 15.0), respectively.33,40
Figure 4. Kaplan-Meier plot of progression-free survival based on blinded, independent review committee analysis (ITT Population)*33
*Stratified HR and its CI were obtained from the stratified Cox Regression and stratified p-value was based on the stratified log-rank test with race (Japanese vs mainland Chinese and other East Asian versus non-Asian) and EGFR mutation status at randomisation as the stratification factors. Abbreviations: CI = confidence interval; EGFR = epidermal growth factor receptor; HR = hazard ratio; ITT = Intent-to-treat.

Company evidence submission for dacomitinib for untreated EGFR-positive non-small-cell lung cancer (ID1346)
© Pfizer (2018). All rights reserved Page 52 of 388
B.2.6.3 Secondary endpoints
B.2.6.3.1 Progression-free survival based on investigator assessment
Investigator-assessed PFS was consistent with the blinded IRC analysis and also
showed significantly prolonged PFS in the dacomitinib arm compared to gefitinib.
Median PFS was 16.6 months (95% CI: 12.9, 18.4) in patients treated with
dacomitinib compared with 11.0 months (95% CI: 9.4, 12.1) for the gefitinib
treatment arm (HR: 0.625; 95% CI: 0.500, 0.782; 1-sided p-value<0.0001;
unstratified log-rank test). The difference in median PFS between treatment arms
was 5.6 months, consistent to that determined by blinded IRC analysis (5.5
months).33,40
The Kaplan-Meier plot for PFS based on investigator assessment is shown in Figure
5. The median duration of PFS follow-up using reverse Kaplan-Meier method in the
ITT population was 23.9 months. The probability of being event-free at 12 months
was 63.8 (95% CI: 56.8, 69.9) for the dacomitinib arm versus 43.7 (95% CI: 36.9,
50.3) for the gefitinib arm. At 24 months, the probability of being event-free was 25.4
(95% CI: 18.7, 32.6) versus 9.6% 10.5 (95% CI: 6.3, 16.1), respectively.33,40

Company evidence submission for dacomitinib for untreated EGFR-positive non-small-cell lung cancer (ID1346)
© Pfizer (2018). All rights reserved Page 53 of 388
Figure 5. Kaplan-Meier plot of progression-free survival based on investigator assessment (ITT Population)*33
*HR and its CIs are obtained from the stratified Cox Regression and other p-values are based on the stratified log-rank and Wilcoxon test with Race [merging mainland Chinese and other East Asian] and EGFR mutation status at randomisation as the stratification factors. Abbreviations: CI = confidence interval; EGFR = epidermal growth factor receptor; HR = hazard ratio; ITT = intent-to-treat.
B.2.6.3.2 Overall survival
Dacomitinib is the first TKI to show an OS benefit in a phase III study (ARCHER
1050) against an active comparator in patients with locally advanced or metastatic
EGFR+ NSCLC.34,40
In ARCHER 1050, dacomitinib demonstrated a 7.3 month improvement in median
OS and a 24% reduction in the risk of death compared with gefitinib in EGFR+
NSCLC. The median OS was 34.1 months (95% CI: 29.5, 37.7) in the dacomitinib
arm compared with 26.8 months (95% CI: 23.7, 32.1) for gefitinib (HR: 0.760; 95%
CI: 0.582, 0.993; 2-sided p-value=0.0438; stratified analysis).34,40
The final overall survival analysis was planned to occur after ≥201 deaths. 220
deaths were observed at the data-off date on February 17, 2017 (103 [45.4%] and
117 [52%] in the dacomitinib and gefitinib arms, respectively). Median follow-up for
OS for the whole study population was 31.3 months, with median follow-up at 31.1

Company evidence submission for dacomitinib for untreated EGFR-positive non-small-cell lung cancer (ID1346)
© Pfizer (2018). All rights reserved Page 54 of 388
and 31.4 months in the dacomitinib and gefitinib arms, respectively. The Kaplan-
Meier plot for OS is shown in Figure 6.34,40
Figure 6. Kaplan-Meier plot of overall survival (ITT Population)34
Abbreviations: CI = confidence interval; CNS = central nervous system; HR = hazard ratio; ITT = intent-to-treat; OS = overall survival.
B.2.6.3.3 Objective response rate
In ARCHER 1050, treatment with dacomitinib was associated with a high response
rate comparable to gefitinib.33 The objective response rate (ORR; complete response
[CR] and partial response [PR]) for ITT patients in the dacomitinib and gefitinib arms
was 74.9% (95% CI: 68.7, 80.4 and 71.6% (95% CI: 65.2, 77.4), respectively; 1-
sided p-value=0.1942 based on the Cochran-Mantel-Haenszel test, stratified by
EGFR mutation status and race.33,40
Response rates based on blinded IRC review are summarised in Table 17. Of the
227 patients randomised to the dacomitinib arm, 158 patients (69.6%) achieved PR
and 12 patients (5.3%) achieved CR. A similar number of patients achieved PR
(n=157; 69.8%) in the gefitinib arm; however, a smaller proportion of patients
reported CR (n=4; 1.8%).33,40
Table 17. Summary of response rates based on independent review committee analysis (ITT population)33,40
Response outcomes Dacomitinib
N=227 Gefitinib N=225

Company evidence submission for dacomitinib for untreated EGFR-positive non-small-cell lung cancer (ID1346)
© Pfizer (2018). All rights reserved Page 55 of 388
Response outcomes Dacomitinib
N=227 Gefitinib N=225
Responses CR, n (%) 12 (5.3) 4 (1.8) PR, n (%) 158 (69.6) 157 (69.8) Stable disease, n (%) 30 (13.2) 27 (12.0) Progressive disease, n (%) 12 (5.3) 15 (6.7) Indeterminate, n (%) 15 (6.6) 22 (9.8) ORR (CR plus PR), n (%) 170 (74.9) 161 (71.6) 95% exact CI* (68.7, 80.4) (65.2, 77.4) P-value versus gefitinib 1-sided p-value (stratified)† 0.1942 NA 1-sided p-value (unstratified)‡ 0.2117 NA *Using exact method based on binomial distribution. †p-value is from the Cochran-Mantel-Haenszel test stratified by EGFR mutation status (exon 19 deletion vs the L 858R mutation in exon 21) based on their values at randomization and by race (Japanese vs mainland Chinese and other East Asian vs non-Asian). ‡p-value is from a Pearson χ2 test. When the number in at least one cell is too small (<5), an exact test was used. Abbreviations: χ2 = chi-square; CI = confidence interval; CR = complete response; EGFR = epidermal growth factor receptor; ITT = intent-to-treat; L858R = EGFR-TK mutation with an amino acid substitution at position 858 from a Leucine to an Arginine; N = number of patients; n = number of patients meeting pre-specified criteria; ORR = objective response rate; PR = partial response.
B.2.6.3.4 Duration of response
Treatment with dacomitinib resulted in significant improvements in DoR compared
with gefitinib in patients with EGFR+ NSCLC. The median DoR based on blinded
IRC review for the dacomitinib arm was 14.8 months (95% CI: 12.0, 17.4) versus 8.3
months (95% CI: 7.4, 9.2) in those who received gefitinib (HR: 0.40; 95% CI: 0.31,
0.53; 2-sided p-value<0.0001; stratified Cochran-Mantel-Haenszel test). This
corresponds to a 6.5 month improvement in patients who received dacomitinib
versus gefitinib. The Kaplan-Meir plot of DoR based on blinded IRC review is
presented in XXXXXXX7.33,40

Company evidence submission for dacomitinib for untreated EGFR-positive non-small-cell lung cancer (ID1346)
© Pfizer (2018). All rights reserved Page 56 of 388
XXXXXXX7XXXXXXXXXXXXXXXXXXXXXXXXXXXXXXXXXXXXXXXXXXXXXXXXXXXXXXXXXXXXXXXXXXXXXXXXXXXXXXXXXXXXXXXXXXXXXXXXXXXXXXXXX
*HR and its CIs are obtained from the stratified Cox Regression and other p-values are based on the stratified log-rank and Wilcoxon test with Race [merging mainland Chinese and other East Asian] and EGFR mutation status at randomisation as the stratification factors. Abbreviations: CI = confidence interval; HR = hazard ratio; IRC = independent review committee; N = total number.
The median DoR based on investigator assessment for the dacomitinib arm was
15.9 months (95% CI: 13.8, 17.6) versus 9.2 months (95% CI: 8.2, 11.0) in the
gefitinib arm (HR: 0.55; 95% CI: 0.42, 0.71; 2 sided p-value<0.0001; stratified
Cochran-Mantel-Haenszel test). This corresponds to a 6.7 month improvement in
patients who received dacomitinib versus gefitinib, similar to 6.5 month improvement
determined by the blinded IRC review. The Kaplan-Meir plot of DoR based on
investigator assessment is presented in XXXXXXX8.33,40

Company evidence submission for dacomitinib for untreated EGFR-positive non-small-cell lung cancer (ID1346)
© Pfizer (2018). All rights reserved Page 57 of 388
XXXXXXX8XXXXXXXXXXXXXXXXXXXXXXXXXXXXXXXXXXXXXXXXXXXXXXXXXXXXXXXXXXXXXXXXXXXXXXXXXXXXXXXXXXXXXXXXXXX
*HR and its CIs are obtained from the stratified Cox Regression and other p-values are based on the stratified log-rank and Wilcoxon test with race [merging mainland Chinese and other East Asian] and EGFR mutation status at randomisation as the stratification factors. Abbreviations: CI = confidence interval; EGFR = epidermal growth factor receptor; HR = hazard ratio; ITT = intent-to-treat.
B.2.6.3.5 Time-to-treatment failure
In addition to the significantly longer DoR, treatment with dacomitinib is also
associated with a significantly longer TTF compared to gefitinib.33,40
In total, 168 (74.0%) patients in the dacomitinib treatment arm and 197 (87.6%)
patients in the gefitinib arm had a treatment failure event. The median TTF based on
blinded IRC review was 11.1 months (95% CI: 9.2, 14.6) and 9.2 months (95% CI:
7.6, 9.4) in patients treated with dacomitinib versus gefitinib, respectively (HR: 0.67;
95% CI: 0.54, 0.83; 1-sided p-value<0.0001; stratified analysis). The Kaplan-Meir
plot for TTF based on blinded IRC review is presented in XXXXXXX9.33,40

Company evidence submission for dacomitinib for untreated EGFR-positive non-small-cell lung cancer (ID1346)
© Pfizer (2018). All rights reserved Page 58 of 388
XXXXXXX9XXXXXXXXXXXXXXXXXXXXXXXXXXXXXXXXXXXXXXXXXXXXXXXXXXXXXXXXXXXXXXXXXXXXXXXXXXXXXXXXXXXXXXXXXXXXXXXXXXXXXXXXX
*HR and its CIs are obtained from the stratified Cox Regression and other p-values are based on the stratified log-rank and Wilcoxon test with race [merging mainland Chinese and other East Asian] and EGFR mutation status at randomisation as the stratification factors. Abbreviations: CI = confidence interval; HR = hazard ratio; IRC = independent review committee; ITT = intent-to-treat.
Investigator-assessed TTF results were consistent with the blinded IRC analysis.
Median TTF based on investigator assessment was 13.0 months (95% CI: 11.1,
16.6) for patients treated with dacomitinib compared to 11.0 months (95 CI: 9.3,
11.1) for patients treated with gefitinib (HR: 0.70; 95% CI: 0·56, 0·86; 1-sided p-
value=0.0003; stratified log-rank test). The Kaplan-Meir plot for TTF based on
investigator assessment is presented in XXXXXXX10.33,40

Company evidence submission for dacomitinib for untreated EGFR-positive non-small-cell lung cancer (ID1346)
© Pfizer (2018). All rights reserved Page 59 of 388
XXXXXXX10XXXXXXXXXXXXXXXXXXXXXXXXXXXXXXXXXXXXXXXXXXXXXXXXXXXXXXXXXXXXXXXXXXXXXXXXXXXXXXXXXXXXXXXXXXXXXXXXXXXXXX
*HR and its CIs are obtained from the stratified Cox Regression and other p-values are based on the stratified log-rank and Wilcoxon test with race [merging mainland Chinese and other East Asian] and EGFR mutation status at randomisation as the stratification factors. Abbreviations: CI = confidence interval; EGFR = epidermal growth factor receptor; HR = hazard ratio; INV = investigators assessment; ITT = intent-to-treat.
Additionally, dacomitinib was associated with a longer treatment duration; median
treatment duration was 66.6 weeks (range: 0.3, 162.7) with dacomitinib and 52.1
weeks (range: 0.3, 148.3) with gefitinib.40
B.2.6.4 Patient-reported outcomes and health-related quality-of-life
In ARCHER 1050, PRO measures for both dacomitinib and gefitinib treatment
groups had high completion rates, with >90% completion for the European
Organisation for Research and Treatment of Cancer Core Quality of Life
Questionnaire (EORTC QLQ-C30), European Organisation for Research and
Treatment of Cancer Quality of Life Questionnaire‐Lung Cancer 13 (EORTC QLQ-
LC13) and European Quality of Life-5 Dimensions (EQ-5D) questionnaires for most
treatment cycles.
B.2.6.4.1 EORTC QLQ-C30 and EORTC QLQ-LC13
In ARCHER 1050, disease-related (i.e. cough, dyspnoea, pain in chest, pain in arm
or shoulder, pain in other parts, fatigue) and treatment-related (i.e. diarrhoea and
sore mouth) symptoms were assessed using EORTC QLQ-C30 and EORTC QLQ-

Company evidence submission for dacomitinib for untreated EGFR-positive non-small-cell lung cancer (ID1346)
© Pfizer (2018). All rights reserved Page 60 of 388
LC13. Additionally, a global quality-of-life (QoL) assessment was conducted using
EORTC QLQ-C30.
Treatment with dacomitinib or gefitinib was associated with improvements in
disease-related symptoms.33 The repeated-measures mixed model analysis of
disease-related symptoms showed that improvement from baseline in the key lung
cancer symptoms of cough, dyspnoea, pain in arm or shoulder and fatigue was
similar in both treatment groups. The same was observed in the majority of treatment
cycles in both the dacomitinib and gefitinib arms (Error! Reference source not
found. in Appendix D). Dacomitinib treatment was associated with significantly
greater and clinically meaningful overall improvement from baseline in pain in chest
versus gefitinib (mean improvement: -10.24 versus -7.44 for dacomitinib and
gefitinib, respectively; p=0.0235; Figure 11).33
Figure 11. Mean change from baseline in disease-related symptoms, treatment-related symptoms and global quality-of-life in participants from the ARCHER 1050 trial (as assessed by EORTC-QLQ-C30 and EORTC-QLQ-LC13; PRO Population)33
Abbreviations: EORTC QLQ-C30 = European Organisation for Research and Treatment of Cancer Core Quality of Life Questionnaire; EORTC QLQ-LC13 = European Organisation for Research and Treatment of Cancer Quality of Life Questionnaire‐Lung Cancer 13; PRO = patient-reported outcome.

Company evidence submission for dacomitinib for untreated EGFR-positive non-small-cell lung cancer (ID1346)
© Pfizer (2018). All rights reserved Page 61 of 388
Although clinically meaningful improvements (≥10 point change in score from
baseline) were observed in cough for both patients with dacomitinib (-13.61) and
patients treated with gefitinib (-12.28),33 these improvements were maintained for
longer for both cough and pain in chest symptoms in the dacomitinib arm (28/30
cycles and 23/30 cycles, respectively) compared with the gefitinib treatment arm
(cough: 22/30 and pain in chest: 12/30; Error! Reference source not found. in
Appendix D).50 In addition, these scores were worse on average at the end of
treatment and post discontinuation follow-ups, further demonstrating the important of
prolonged time on treatment in reducing symptom burden (Error! Reference source
not found. in Appendix D).
With regards to treatment-related symptoms, the repeated-measures mixed effect
model showed that dacomitinib was associated with clinically meaningful worsening
in diarrhoea and sore mouth and the worsening was significantly greater compared
with gefitinib (Figure 11).33 However, the difference between treatment groups in
treatment-related symptoms generally occurred early, and declined over the course
of treatment, with the mean score reported in the range of
XXXXXXXXXXXXXXXXXXXXXXXXXXXXXX (EORTC QLQ-C30 and EORTC QLQ-
LC13 score of XXXXXXXXX; Error! Reference source not found. in Appendix D).40
Additionally, despite an increase from baseline in the treatment-related symptoms of
diarrhoea and sore mouth in the dacomitinib treatment arm, global QoL was
maintained (Figure 11) with dacomitinib.33 There was a non-clinically meaningful
improvement in global QoL for gefitinib and although the difference from baseline
compared with dacomitinib was statistically in favour of gefitinib, the difference
between groups was small (improvement from baseline: 0.20 for dacomitinib versus
4.94 for gefitinib; p=0.0002). The improvement from baseline in global QoL for
patients treated with dacomitinib was not statistically significant.
B.2.6.4.2 Time-to-deterioration
Time-to-deterioration was used to assess the change in patient-reported symptoms
(defined as time from randomisation to the first time a patient’s score showed a ≥10
point increase from baseline). An increase of ≥10 points was considered a clinically

Company evidence submission for dacomitinib for untreated EGFR-positive non-small-cell lung cancer (ID1346)
© Pfizer (2018). All rights reserved Page 62 of 388
significant deterioration in the symptom and the primary assesmement required that
the deterioration occurred for at least two consecutive cycles.33 There was no
statistically significant difference between treatment groups in time-to-deterioration in
the composite endpoint of pain (chest, arm/shoulder), dyspnoea, fatigue and cough,
or in the individual symptom items. The HR for the composite endpoint favoured
gefitinib (HR: 1.17; 95% CI: 0.93, 1.48; Hochberg-adjusted p-value=0.5327) and was
driven primarily by fatigue. The HRs for pain, dyspnoea and cough were in favour of
dacomitinib.
B.2.6.4.3 EQ-5D
EQ-5D-3L assessments were made at the following time points as per the ARCHER
1050 trial protocol: day 1 – cycle 1 which provided the baseline assessment of
PROs, days 8 and 15 of cycle 1 and at the beginning of each cycle afterwards (up to
a total of 41 cycles), at the end of treatment and at a single post progression follow-
up. Changes from baseline in the EQ-5D visual analogue scale (VAS) were small
and not clinically meaningful in either treatment group, although gefitinib was
associated with a significantly greater change from baseline than dacomitinib in VAS
and utility index scores (Table 18)40 Further details of the EQ-5D results are
presented in section B.3.4.
Table 18. Absolute scores in EQ-5D (PRO Population)40 Dacomitinib Gefitinib Difference Absolute score VAS XXXXX XXXXX XXXXXX Utility index XXXX XXXX XXXXXX *p<0.05. Abbreviations: EQ-5D = European Quality of Life-5 Dimensions; PRO = patient-reported outcome; VAS = visual analogue scale.
B.2.7 Subgroup analysis
B.2.7.1 Progression-free survival
Several subgroup analyses based on pre-specified patient baseline characteristics
were conducted. Overall, the subgroup analyses for PFS based on blinded IRC
review were largely consistent with the results of the primary analysis with HR<1. An
exception to this was seen in the ≥75 age group where the HR=1.137 (CI: 0.586,

Company evidence submission for dacomitinib for untreated EGFR-positive non-small-cell lung cancer (ID1346)
© Pfizer (2018). All rights reserved Page 63 of 388
2.207). . However, the sample size consisted of only 28 and 21 patients for the
dacomitinib and gefitinib arms, respectively. A forest plot presenting the pre-specified
subgroup analyses for PFS based on blinded IRC review is presented in
XXXXXXX12.
XXXXXXX12XXXXXXXXXXXXXXXXXXXXXXXXXXXXXXXXXXXXXXXXXXXXXXXXXXXXXXXXXXXXXXXXXXXXXXXXXXXXXXXXXXXXXXXXXXXXXXXXXXXXXXXX
*p-values are from 1-sided unstratified log-rank test. Abbreviations: +/- = with/without/unknown T790M mutation; - = without T790M mutation; CI = confidence interval; CRF = case report form; ECOG = Eastern Cooperative Oncology Group; EGFR = epidermal growth factor receptor; HR = hazard ratio; ITT = intent-to-treat; L858R = EGFR-TK mutation with an amino acid substitution at position 858 from a leucine to an arginine; N = number of patients; PS = performance status; T790M = secondary point mutation at amino acid position 790 that substitutes methionine for threonine.
Subgroup analyses for PFS based on investigator assessment also demonstrated a
reduced risk of progression in the majority of categories, consistent with the results
of the blinded IRC review. As with the blinded IRC review,
XXXXXXXXXXXXXXXXXXXXXXXXXXXXXXXXXXXXXXXXXXXXXXXXXXXXXXXX
XXXXXXXXXXXXXXXXXXXXXXXXXXXXXXXXXXXXXXXXXXXXXXXXXXXXXXXX
XXXXXXXXXXXXXXXXXX). A forest plot of subgroup of these analyses for PFS
based on investigator assessment is presented in XXXXXXX13.

Company evidence submission for dacomitinib for untreated EGFR-positive non-small-cell lung cancer (ID1346)
© Pfizer (2018). All rights reserved Page 64 of 388
XXXXXXX13XXXXXXXXXXXXXXXXXXXXXXXXXXXXXXXXXXXXXXXXXXXXXXXXXXXXXXXXXXXXXXXXXXXXXXXXXXXXXXXXXXXXXXXXXXXXXXXXXXXXXXXX
*p-values are from 1-sided unstratified log-rank test. Abbreviations: +/-, with/without/unknown T790M mutation; -, without T790M mutation; CI, confidence interval; CRF, case report form; ECOG, Eastern Cooperative Oncology Group; EGFR, epidermal growth factor receptor; HR, hazard ratio; ITT, intent-to-treat; L858R, EGFR-TK mutation with an amino acid substitution at position 858 from a leucine to an arginine; N, number of patients; PS, performance status; T790M, secondary point mutation at amino acid position 790 that substitutes methionine for threonine.
B.2.7.2 Overall survival
Dacomitinib is the first drug to show an OS benefit in a phase III study against an
active comparator in a NSCLC patient population that included patients with EGFR
del19 or L858R substitution.34 A forest plot of subgroup of these analyses for OS is
presented in Figure 14.

Company evidence submission for dacomitinib for untreated EGFR-positive non-small-cell lung cancer (ID1346)
© Pfizer (2018). All rights reserved Page 65 of 388
Figure 14. Forest plot of overall survival (stratified by subgroups; ITT population)*
*P interaction. Abbreviations: CI = confidence interval; ECOG PS = Eastern Cooperative Oncology Group Performance Status; EGFR = epidermal growth factor receptor; HR = hazard ratio; L858R = EGFR-TK mutation with an amino acid substitution at position 858 from a Leucine to an Arginine; T790M = secondary point mutation at amino acid position 790 that substitutes methionine for threonine.
Treatment with dacomitinib was shown to improve OS in patients in the del19
mutation subgroup and L858R substitution. Additionally, in the OS analyses
pertaining to the ethnicity, dacomitinib demonstrated OS benefits compared with
gefitinib in both the non-Asian and Asian subgroups. Although, the ARCHER 1050
trial was not powered for subgroup analyses, the results were all aligned and
numerically in favour of dacomitinib (with the exception of ECOG PS 0).
B.2.8 Meta-analysis This section is not applicable for the current submission as no meta-analysis was
conducted. ARCHER 1050 is the only clinical trial available for dacomitinib for the
first-line treatment of EGFR+ NSCLC.

Company evidence submission for dacomitinib for untreated EGFR-positive non-small-cell lung cancer (ID1346)
© Pfizer (2018). All rights reserved Page 66 of 388
B.2.9 Indirect and mixed treatment comparisons
B.2.9.1 Systematic literature review and trial network
A SLR was conducted (as described in section B.2.1 and Appendix D.1) to identify
relevant studies providing evidence for the efficacy and safety of interventions
relevant to the decision problem of this appraisal.
The full set of 11 RCTs included in the refined SLR formed a network with several
loose ends (i.e. connections between TKIs and chemotherapies that did not connect
back into the network), presented in Figure 15.9,33,35,36,38,39,41,42,44,45,51
Figure 15. Feasibility assessment network diagram of the 11 trails included in the network
Abbreviations: AFA = afatinib; CAR = carboplatin; CIS = cisplatin; DAC = dacomitinib; DOC = docetaxel; ERL = erlotinib; GEF = gefitinib; GEM = gemcitabine; PAC = paclitaxel; PEM = pemetrexed.

Company evidence submission for dacomitinib for untreated EGFR-positive non-small-cell lung cancer (ID1346)
© Pfizer (2018). All rights reserved Page 67 of 388
In the NICE appraisal of afatinib for untreated EGFR+ NSCLC the committee
concluded that gefitinib and erlotinib had equal clinical benefit:52
‘The Appraisal Committee noted the advice provided by clinical experts, that erlotinib
and gefitinib were similar treatments with similar efficacy and levels of adverse
reactions, and concluded that an assumption of equal clinical benefit for erlotinib and
gefitinib was appropriate.’
This assumption was also accepted by the SMC during the appraisal of gefitinib
(SMC 615/10) where a cost-minimisation analysis was submitted which assumed
equal efficacy between EGFR TKIs.53
Following these appraisals, further evidence of equivalence has been demonstrated
in a phase III RCT (CTONG 0901) comparing erlotinib versus gefitinib in first- and
second-line EGFR+ NSCLC.54 The study did not include treatment line as a
stratification factor and was therefore not included in the NMA. Nonetheless, the
study presented a first-line subgroup analysis (gefitinib n=84; erlotinib n=81) which
reported the following: PFS HR=0.96 (95% CI: 0.69, 1.35; p=0.827) and OS
HR=0.98 (95% CI: 0.67, 1.42; p=0.902). Although this did not represent fully
randomised data, it was the best available evidence for erlotinib versus gefitinib in
untreated EGFR+ NSCLC and demonstrated that the assumption of equivalence
holds in practice.
In line with previous NICE and SMC committee conclusions and the supporting data
from the recent RCT subgroup analysis, it was assumed that erlotinib was equivalent
to gefitinib in this NMA. This assumption was also reflected in discussions with UK
clinical experts.55 Therefore, the network included two studies, ARCHER 1050 and
LUX-Lung 7, presented in Figure 16.

Company evidence submission for dacomitinib for untreated EGFR-positive non-small-cell lung cancer (ID1346)
© Pfizer (2018). All rights reserved Page 68 of 388
Figure 16. Network diagram
Abbreviations: AFA = afatinib; DAC = dacomitinib; ERL = erlotinib; GEF = gefitinib.
Further details of the two studies in the final network are presented in Appendix
D.1.8, including patient characteristics, follow-up time, treatment effect modification,
treatment schedules and risk of bias.
B.2.9.2 Proportional hazards assumption
Traditional indirect treatment comparison (ITC) techniques rely on the assumption of
constant HRs and, if violated, can produce results that are not robust. In cost-
effectiveness evaluations based on comparisons of expected survival where the tail
of the survival function can have an impact on the expected survival, violations of the
constant hazard ratio can lead to biased estimates.56
The proportional hazards assumption was assessed through the use of log
cumulative hazard plots (parallel line suggested proportional hazards held) and
Schoenfeld residual (flat line with no systematic trend suggested proportional
hazards held) in ARCHER 1050 and LUX-Lung 7 to determine the most appropriate
approach for the NMA. In ARCHER 1050 there was some crossing of the curves in
the log cumulative hazard plots for OS whilst there was a systematic downward trend
in the Schoenfeld residuals for PFS. Therefore, it was concluded there was
insufficient evidence that proportional hazards was not violated in ARCHER 1050 for
both PFS and OS. In LUX-Lung 7 there was no clear violation of proportional
hazards in OS given that the log cumulative hazard plot showed reasonably parallel
line and the Schoenfeld residuals were flat. However, the Schoenfeld residuals for
PFS showed an increasing trend, demonstrating a potential violation of proportional
hazards assumption for PFS. Error! Reference source not found. to Error!

Company evidence submission for dacomitinib for untreated EGFR-positive non-small-cell lung cancer (ID1346)
© Pfizer (2018). All rights reserved Page 69 of 388
Reference source not found. in Appendix D.5 present log cumulative hazards and
Schoenfeld residuals plots for both PFS and OS.
Given the potential violations of proportional hazard for PFS and OS in at least one
of the trials included in the network, a fractional polynomial (FP) analysis was
conducted based on Jansen (2011) and Dias (2018) which allowed time-varying
hazards to be incorporated into the analysis.56,57 A traditional ITC akin to the Bucher
method was also explored in scenario analysis (Appendix D.7) to demonstrate the
impact of the assumption.58
B.2.9.3 Fractional polynomial analysis
The FP analysis was conducted for the overall population using KM curves for PFS
(based on blinded IRC review) and OS from the relevant trials included in the
network. Only a fixed-effects analysis was considered due to the lack of multiple
trials for each comparison within the network resulting in between trial heterogeneity
not being applicable.
For the FP analysis, the number of patients at risk and the number of events were
calculated for a pre-defined number of time intervals. For PFS (IRC) and OS, time
intervals of 0.5 month and 1 month were used, respectively.
FP models of first- and second-order were explored in the analysis. The application
of the fractional polynomial model included the following steps:
1. The first step included fitting a large number of first- (9 models) and second-
order (45 models) models
2. The “best fitting models” based on the deviance information criteria (DIC)
were then plotted for further consideration
3. These model were then applied to estimated survival functions and were
compared graphically for clinical plausibility. If no plausible model was
identified the “best fitting model” criteria was expanded.

Company evidence submission for dacomitinib for untreated EGFR-positive non-small-cell lung cancer (ID1346)
© Pfizer (2018). All rights reserved Page 70 of 388
D.2.9.3.1 Model specification
The FP model analysis was performed under a Bayesian framework. Uninformative
priors were used for the d and μ parameters: normal distribution with mean 0 and
variance 92 and 102 respectively. The parameters of the different models were
estimated using a Markov Chain Monte Carlo (MCMC) method and implemented in
the R and JAGS 4.0 software. Furthermore, each FP model fitting used:
Four chains
400,000 iterations as ‘burn-in’
A total of 800,000 iterations (including burn-in) for final estimates
The convergence of the chains was assessed by the Gelman-Rubin statistic. A
Gelman-Rubin statistics less than 1.1 implies convergence of the parameter. In
addition, other model diagnostics (n.eff and MCMC trace-plots) were investigated to
ensure proper convergence.
See Appendix D.6.1 for further details on the FP analysis specification.
D.2.9.3.2 Model selection
DIC was used to compare the goodness-of-fit of different fixed effect models with
first- and second-order FPs of different powers P1 and P2. The model with the
lowest DIC was considered as the model providing the ‘best’ fit to the observed data.
To ensure a sufficient number of models were explored whilst still remaining
practical, all models with DIC<+5 of the best fitting model were included for further
consideration. The final model was selected after also considering the clinical
plausibility of the curves.
Progression-free survival
The model fit statistics for PFS (IRC) are presented in Table 19, where the lowest
DIC (1173.2) was a second-order fractional polynomial P1=1, P2=1.5. All models
with DIC less than 1778 (Table 3) were plotted to assess the clinical plausibility.

Company evidence submission for dacomitinib for untreated EGFR-positive non-small-cell lung cancer (ID1346)
© Pfizer (2018). All rights reserved Page 71 of 388
Table 19. Goodness-of-fit estimates for fractional polynomial models of different powers p1 and p2 – PFS (IRC)
Power P1 Power P2 Dbar Dhat pD DIC 1 1.5 1161.67 1150.11 11.56 1173.23
0.5 1.5 1162.91 1151.60 11.31 1174.21 1 1 1162.49 1150.57 11.92 1174.41
0.5 2 1163.15 1151.59 11.56 1174.71 1.5 1.5 1163.34 1151.43 11.91 1175.26 0.5 1 1165.12 1153.39 11.73 1176.86 1.5 2 1165.73 1154.55 11.18 1176.92
Abbreviations: DIC = Deviance information criterion.
All these FP models were explored for the most plausible baseline (geftinib)
parametric model (generalised gamma) as determined in section B.3.3.1.2
(presented in Appendix D.6.3.1).
Despite p1=1, p2=1.5 providing the lowest DIC value, the model over fitted the tail of
the dacomitinib KM curve
(XXXXXXXXXXXXXXXXXXXXXXXXXXXXXXXXXXXXXXXXXX), which therefore
resulted in clinically implausible extrapolations due to dacomitinib crossing all other
comparators (XXXXXXX17). There was no clinical rational to suggest why there
would be a significant higher rate of progression for dacomitinib compared to
comparators beyond 2-years (Error! Reference source not found.).
XXXXXXX17XXXXXXXXXXXXXXXXXXXXXXXXXXXXX
Abbreviations: KM = Kaplan-Meier.

Company evidence submission for dacomitinib for untreated EGFR-positive non-small-cell lung cancer (ID1346)
© Pfizer (2018). All rights reserved Page 72 of 388
XXXXXXX18XXXXXXXXXXXXXXXXXXXXXXXXXXXXX
The next best fitting second-order model provided a plausible estimate which was in
line with the observed data (XXXXXXX19) and provided more clinical plausible
instantaneous HRs between dacomitinib and gefitinib up to around 50 months
(XXXXXXX20). Therefore, in the base-case analysis, the second-order P1=0.5,
P2=1.5, was applied, with the other most clinically plausible model within DIC<+5
applied in sensitivity analysis (P1=0.5, P2=1, [see Error! Reference source not
found.; Appendix D.6.3.1]). The projected means for the base-case and scenario
analysis are presented in Table 21 along with the medians compared to the
observed data from ARCHER 1050, which demonstrate the face validity of the
dacomitinib projection.
Table 20. Means and medians from fractional polynomial models compared to observed data – PFS(IRC)
Model Geftinib/Erlotinib Dacomitinib Afatinib Median Mean Median Mean Median Mean
P1=0.5; P2=1.5* XXXXX XXXXX
XXXXX XXXXX XXXXX XXXXX P1=0.5; P2=1* XXXXX XXXXX XXXXX XXXXX ARCHER 1050 9.23 - 14.65 - - -
*Generated with ‘base’ gefitinib generalised gamma curve

Company evidence submission for dacomitinib for untreated EGFR-positive non-small-cell lung cancer (ID1346)
© Pfizer (2018). All rights reserved Page 73 of 388
XXXXXXX19XXXXXXXXXXXXXXXXXXXXXXXXXXXXXXX
Abbreviations: KM = Kaplan-Meier.
XXXXXXX20XXXXXXXXXXXXXXXXXXXXXXXXXXXXXXXXXXXXXXXXXXXXXXXXXXXXXXXXXXXXXXXXXXXXXX
Overall survival
The model fit statistics for OS are presented in Table 21, where the lowest DIC
(603.1) was a second-order fractional polynomial P1=1, P2=1.5. All models with DIC
less than 608 were then plotted to assess the clinical plausibility.
Table 21. Goodness-of-fit estimates for fractional polynomial models of different powers p1 and p2 – OS
Power P1 Power P2 Dbar Dhat pD DIC

Company evidence submission for dacomitinib for untreated EGFR-positive non-small-cell lung cancer (ID1346)
© Pfizer (2018). All rights reserved Page 74 of 388
Power P1 Power P2 Dbar Dhat pD DIC 1 1.5 591.37 579.66 11.72 603.09
1 1 591.23 578.79 12.44 603.67
0.5 1.5 591.80 579.29 12.51 604.31
0 1.5 593.81 581.32 12.49 606.31
0.5 1 594.15 580.04 14.10 608.25
0 1 595.93 583.07 12.86 608.78
0 0.5 597.91 585.48 12.43 610.34
-0.5 - 603.39 595.91 7.48 610.87
1.5 1.5 600.06 588.51 11.55 611.61
0 - 604.15 596.25 7.91 612.06
-0.5 0 602.98 593.28 9.70 612.68 Abbreviations: DIC = Deviance information criterion.
The second-order model p1=1, p2=1.5 provided the lowest DIC value, however the
model did not provide clinically plausible extrapolations as the additional flexibility of
the second-order model lead to significant over fitting of the tail of the KM, which was
subject to censoring and thus associated with greater uncertainty. This trend was
observed in all models with DIC<+5 (see models presented with baseline
generalised gamma in Appendix 6.3.2). Therefore, models with less accurate fit to
the observed data were explored (DIC<+10).
XXXXXXX21XXXXXXXXXXXXXXXXXXXXXXXXXXXXX
Abbreviations: KM = Kaplan-Meier.

Company evidence submission for dacomitinib for untreated EGFR-positive non-small-cell lung cancer (ID1346)
© Pfizer (2018). All rights reserved Page 75 of 388
XXXXXXX22XXXXXXXXXXXXXXXXXXXXXXXXXXXXXXXXXXXXXXXXXXXXXXXXXXXXXXXXXXXXXXXXXXXXXXXXXXX
The same pattern was observed with all the additional second-order models.
However, the first-order models provided plausible estimates (XXXXXXX23) and
instantaneous hazards over time (XXXXXXX24) which were in line with the observed
data. Therefore, in the base-case analysis, the best fitting first order P1=-0.5 was
applied with P1=0 (Error! Reference source not found., Appendix D.6.3.2) applied
in scenario analysis. The projected means for the base-case and scenario analysis
are presented in Table 22 along with the medians compared to the observed data
from ARCHER 1050, which provide face validity for the applied FP model.
Table 22. Means and medians from fractional polynomial models compared to observed data – OS
Model Geftinib/Erlotinib Dacomitinib Afatinib Median Mean Median Mean Median Mean
P1=-0.5* XXXXX XXXXX
XXXXX XXXXX XXXXX XXXXX P1=0* XXXXX XXXXX XXXXX XXXXX
ARCHER 1050 26.84 - 34.07 - - - *Generated with ‘base’ gefitinib generalised gamma curve

Company evidence submission for dacomitinib for untreated EGFR-positive non-small-cell lung cancer (ID1346)
© Pfizer (2018). All rights reserved Page 76 of 388
XXXXXXX23XXXXXXXXXXXXXXXXXXXXXXX
Abbreviations: KM = Kaplan-Meier.
XXXXXXX24XXXXXXXXXXXXXXXXXXXXXXXXXXXXXXXXXXXXXXXXXXXXXXXXXXXXXXXXXXXXXXXXXXXXX
B.2.10 Adverse reactions
B.2.10.1 Overall adverse events
Overall safety data from ARCHER 1050 are summarised in Table 23. Most patients
experienced an all-cause AE, with proportions comparable between dacomitinib and
gefitinib (99.6% and 98.2%, respectively).33,40 A higher number of patients in the
dacomitinib arm reported Grade 3 AEs (any cause) versus those who received

Company evidence submission for dacomitinib for untreated EGFR-positive non-small-cell lung cancer (ID1346)
© Pfizer (2018). All rights reserved Page 77 of 388
gefitinib (XXXXX versus XXXXX, respectively); however, the number of patients with
Grade 4 events was low and comparable between treatment arms (XXXX versus
XXXX for dacomitinib and gefitinib, respectively).40 More patients required a dose
reduction due to an AE (any cause) with dacomitinib than with gefitinib (66.1%
versus 8.0%, respectively).33 However, dose reductions are not recommended in the
approved license for gefitinib59 therefore every other day dosing was classed as a
dose reduction. The frequency of all causality serious adverse events (SAEs) was
similar in both treatment groups (27.3% versus 22.3%, respectively).40
The overall frequency of treatment-related AEs was comparable between the two
treatment arms (XXXXX versus XXXXX for dacomitinib and gefitinib, respectively),
whereas the frequency of SAEs attributed to treatment was low, occurring in just XX
(XXXX) patients treated with dacomitinib and XX (XXXX) patients treated with
gefitinib.33 Discontinuation rates due to treatment-related AEs were also low in both
dacomitinib- and gefitinib-treated patients (XXXX and XXXX of patients,
respectively).33
Table 23. Summary of adverse events in the ARCHER 1050 trial (Safety Population)*40
Adverse event Dacomitinib
N=227 Gefitinib N=224
All-causality AEs Patients with any AE, n (%) 226 (99.6) 220 (98.2) Patients with any SAE, n (%) 62 (27.3) 50 (22.3) Patients with any AE Grade 3/4, n (%) XXXXXXX XXXXXXX Patients with any AE Grade 3, n (%) XXXXXXX XXXXXXX Patients with any AE Grade 4, n (%) XXXXXXX XXXXXXXX Patients with any AE leading to dose reduction,† n (%)
150 (66.1) 18 (8.0)
Patients with any AE leading to temporary discontinuation, n (%)
XXXXXXX XXXXXXX
Treatment-related AEs Treatment-related AEs, n (%) XXXXXXX XXXXXXX Treatment-related SAE, n (%) XXXXXXX XXXXXXX Treatment-related AE Grade 3/4, n (%) XXXXXXX XXXXXXX Treatment-related AE Grade 3, n (%) XXXXXXX XXXXXXX Treatment-related AE Grade 4, n (%) XXXXXXX XXXXXXX Treatment-related AE Grade 5, n (%) XXXXXXX XXXXXXX Treatment-related fatal AE, n (%) XXXXXXX XXXXXXX Treatment-related AEs leading to discontinuation, n (%)
XXXXXXX XXXXXXX
*MedDRA (version 19.1) coding dictionary applied. †Dose reduction to manage toxicity due to AE(s) is described in the protocol as every other day dosing for gefitinib.

Company evidence submission for dacomitinib for untreated EGFR-positive non-small-cell lung cancer (ID1346)
© Pfizer (2018). All rights reserved Page 78 of 388
‡Dacomitinib: two (one related to untreated diarrhoea, one related to untreated cholelithiasis/liver disease). §Gefitinib: one (related to sigmoid colon diverticulitis/rupture complicated by pneumonia). Abbreviations: AE = adverse event; MedDRA = Medical Dictionary for Regulatory Activities; SAE = serious adverse event.
B.2.10.2 Common adverse events
AEs (any cause) reported by ≥10% of patients in either treatment arm by treatment
arm are summarised in Table 24. Although the pattern of AEs showed some
differences between the treatment arms, overall, the majority of AEs in patients
treated with dacomitinib or gefitinib were mild or moderate in severity (classed as
Grades 1 or 2, respectively).33
In the dacomitinib arm, the most common (reported in ≥30% of patients) Grade 1/2
AEs from any cause were diarrhoea (78%), paronychia (54%), stomatitis (40%) and
dermatitis acneiform (35%), while the most common Grade 3 AEs were dermatitis
acneiform (14%), diarrhoea (8%) and paronychia (7%)33 In comparison, the most
common AEs in patient treated with gefitinib were diarrhoea (56%), and those
associated with liver toxicity, including an increase in alanine transaminase (ALT;
39%) and aspartate transaminase (AST; 36%).33 The most common grade 3 AEs
were raised ALT levels (8%), AST increase (4%) and dyspnoea (2%).33 The rate of
Grade 4 AEs was low, (2% for both treatment groups).33

Company evidence submission for dacomitinib for untreated EGFR-positive non-small-cell lung cancer (ID1346)
© Pfizer (2018). All rights reserved Page 79 of 388
Table 24. Most common AEs (≥10% in any group) from any cause in participants from the ARCHER 1050 trial (Safety Population)*33
Adverse event
Dacomitinib N=227
Gefitinib N=224
Grade(s) Grade(s) 1–2 3 4 5 1–2 3 4 5
Any adverse event, n (%) 83 (37) 116 (51) 5 (2) 22 (10) 128 (57) 67 (30) 5 (2) 20 (9) Diarrhoea, n (%) 178 (78) 19 (8) 0 1 (<1%) 123 (55) 2 (1) 0 0 Paronychia, n (%) 123 (54) 17 (7) 0 0 42 (19) 3 (1) 0 0 Dermatitis acneiform, n (%) 80 (35) 31 (14) 0 0 64 (29) 0 0 0 Stomatitis, n (%) 91 (40) 8 (4) 0 0 39 (17) 1 (<1) 0 0 Decreased appetite, n (%) 63 (28) 7 (3) 0 0 54 (24) 1 (<1) 0 0 Dry skin, n (%) 60 (26) 3 (1) 0 0 38 (17) 0 0 0 Weight decreased, n (%) 53 (23) 5 (2) 0 0 36 (16) 1 (<1) 0 0 Alopecia, n (%) 52 (23) 1 (<1) 0 0 28 (13) 0 0 0 Cough, n (%) 48 (21) 0 0 0 41 (18) 1 (<1) 0 0 Pruritus, n (%) 44 (19) 1 (<1) 0 0 28 (13) 3 (1) 0 0 ALT increased, n (%) 42 (19) 2 (1) 0 0 69 (31) 19 (8) 0 0 Conjunctivitis, n (%) 43 (19) 0 0 0 9 (4) 0 0 0 Nausea, n (%) 40 (18) 3 (1) 0 0 48 (21) 1 (<1) 0 0 AST increased, n (%) 42 (19) 0 0 0 72 (32) 9 (4) 0 0 Rash, n (%) 30 (13) 10 (4) 0 0 24 (11) 0 0 0 Palmar-plantar erythrodysesthesia syndrome, n (%) 31 (14) 2 (1) 0 0 7 (3%) 0 0 0 Pain in extremity, n (%) 31 (14) 0 0 0 26 (12) 0 0 0 Dyspnoea, n (%) 25 (11) 4 (2) 1 (<1) 0 24 (11) 4 (2) 0 2 (1) Asthenia, n (%) 24 (11) 5 (2) 0 0 25 (11) 3 (1) 0 0 Constipation, n (%) 29 (13) 0 0 0 31 (14) 0 0 0 Mouth ulceration, n (%) 28 (12) 0 0 0 13 (6) 0 0 0 Maculopapular rash, n (%) 18 (8) 10 (4) 0 0 26 (12) 1 (<1) 0 0 Upper respiratory tract infection, n (%) 25 (11) 3 (1) 0 0 28 (13) 0 0 0 Musculoskeletal pain, n (%) 24 (11) 2 (1) 0 0 28 (13) 0 0 0 Dermatitis, n (%) 21 (9) 4 (2) 0 0 8 (4) 1 (<1) 0 0 Insomnia, n (%) 23 (10) 1 (<1) 0 0 33 (15) 0 0 0 Anaemia, n (%) 20 (9) 2 (1) 0 0 11 (5) 5 (2) 0 0

Company evidence submission for dacomitinib for untreated EGFR-positive non-small-cell lung cancer (ID1346)
© Pfizer (2018). All rights reserved Page 80 of 388
Adverse event
Dacomitinib N=227
Gefitinib N=224
Grade(s) Grade(s) 1–2 3 4 5 1–2 3 4 5
Chest pain, n (%) 22 (10) 0 0 0 32 (14) 0 0 0 Hypokalaemia, n (%) 11 (5) 9 (4) 2 (1) 0 9 (4) 4 (2) 0 0 Vomiting, n (%) 18 (8) 2 (1) 0 0 29 (13) 0 0 0 Back pain, n (%) 18 (8) 0 0 0 34 (15) 1 (<1) 0 0 Pustular rash, n (%) 6 (3) 8 (4) 0 0 3 (1) 0 0 0 Hypertension, n (%) 10 (4) 3 (1) 0 0 6 (3) 4 (2) 0 0 Disease progression, n (%) 0 0 0 8 (4) 0 0 0 11 (5) Pleural effusion, n (%) 1 (<1) 5 (2) 0 0 4 (2) 1 (<1) 0 1 (<1) Lymphocyte count decreased, n (%) 0 5 (2) 0 0 2 (1) 0 0 0 Abnormal hepatic function, n (%) 2 (1) 0 0 0 3 (1) 4 (2) 0 0 *The table lists all-cause, maximum grade adverse events reported in at least 10% of patients in either treatment group at grades 1–2, and adverse events reported at grade 3–5 in at least 2% of patients in either treatment group. Abbreviations: AE = adverse event; ALT = alanine aminotransferase. AST = aspartate aminotransferase.

Company evidence submission for dacomitinib for untreated EGFR-positive non-small-cell lung cancer (ID1346)
© Pfizer (2018). All rights reserved Page 81 of 388
Common treatment-related AEs that that were reported in XXX of patients in both
treatment arms included diarrhoea (dacomitinib: XXXX; gefitinib: XXXXX), dermatitis
acneiform (dacomitinib: XXXXX; gefitinib: XXXX) and paronychia (dacomitinib:
XXXX; gefitinib: XXXX).33,40 In addition, stomatitis, dry skin, decreased appetite and
alopecia were reported in XXXX patients treated with dacomitinib, while increased
ALT and AST levels were commonly reported in the gefitinib treatment arm (Table
25).33,40 The majority of treatment-related AEs were mild or moderate in severity.33
Table 25: Most common treatment-related adverse events occurring in XXXX of patients from the ARCHER 1050 trial (Safety Population)40
Adverse event*
Dacomitinib N=227
Gefitinib N=224
Grade(s) Grade(s) 1–2 3 4 5 1–2 3 4 5
Diarrhoea, n (%)
XXXX XXXX XXXX XXXX XXXX XXXX XXXX XXXX
Paronychia, n (%)
XXXX XXXX XXXX XXXX XXXX XXXX XXXX XXXX
Dermatitis acneiform, n (%)
XXXX XXXX XXXX XXXX XXXX XXXX XXXX XXXX
Stomatitis, n (%)
XXXX XXXX XXXX XXXX XXXX XXXX XXXX XXXX
Decreased appetite, n (%)
XXXX XXXX XXXX XXXX XXXX XXXX XXXX XXXX
Dry skin, n (%)
XXXX XXXX XXXX XXXX XXXX XXXX XXXX XXXX
Alopecia, n (%)
XXXX XXXX XXXX XXXX XXXX XXXX XXXX XXXX
ALT increased, n (%)
XXXX XXXX XXXX XXXX XXXX XXXX XXXX XXXX
AST increased, n (%)
XXXX XXXX XXXX XXXX XXXX XXXX XXXX XXXX
*Arranged in descending order of frequency in the dacomitinib treatment group. Abbreviations: AE = adverse event; ALT = alanine aminotransferase; AST = aspartate aminotransferase; NR = not reported.
B.2.10.3 Exposure to study drug and dose adjustments due
to adverse events
The median duration of treatment in ARCHER 1050 was longer in the dacomitinib
treatment arm (XXXX weeks; range: XXXXXXX) versus the gefitinib arm (XXXX
weeks; range: XXXXXX).40 However, frequency of AE data were not adjusted for the

Company evidence submission for dacomitinib for untreated EGFR-positive non-small-cell lung cancer (ID1346)
© Pfizer (2018). All rights reserved Page 82 of 388
increased length of exposure in patients treated with dacomitinib, indicating that
comparative assessment may be biased against dacomitinib.40
Dose reductions were required in 66.1% and 8.0% of patients in the dacomitinib and
gefitinib treatment arms, respectively.40 For dacomitinib-treated patients, the median
time-to-dose reduction was 2.8 months (IQR: 1.3–4.2 months) and the median
duration of the dose reduction was 11.3 months (IQR: 4.8–18.9 months).33 Overall,
38.3% (87/227) of patients required a dose reduction to 30mg daily, while 27.8%
(63/227) of patients required a dose reduction to 15mg daily.33 Gefitinib dose
reductions (every other day dosing) occurred in 8% (18/224) of patients. Among
gefitinib-treated patients, the median time to dose reduction was 3.3 months (IQR:
2.4–4.2 months) and the median duration of the dose reduction was 5.2 months
(IQR: 2.5–7.9 months).33 Table 26 provides a summary for AEs that resulted in a
dose reduction in ≥2% of patients.40
Table 26: Adverse events (all-cause) resulting dose reductions (reported for ≥2% of patients in any treatment arm) in the ARCHER 1050 trial (Safety Population)*33,40
AE category† Dacomitinib
N=227 Gefitinib N=224
Any AEs, n (%) 150 (66.1) 18 (8.0) Gastrointestinal disorders, n (%) 27 (11.9) 3 (1.3) Diarrhoea, n (%) 19 (8.4) 3 (1.3) Stomatitis, n (%) 6 (2.6) 0 Skin and subcutaneous tissue disorders, n (%) 91 (40.1) 4 (1.8) Dermatitis acneiform, n (%) 46 (20.3) 3 (1.3) Rash maculo-papular, n (%) 11 (4.8) 0 Rash, n (%) 10 (4.4) 0 Dermatitis, n (%) 7 (3.1) 0 Dry skin, n (%) 7 (3.1) 0 Palmar-plantar erythrodysaesthesia syndrome, n (%) 5 (2.2) 0 Infections and infestations, n (%) 53 (23.3) 2 (0.9) Paronychia, n (%) 38 (16.7) 2 (0.9) Rash pustular, n (%) 9 (4.0) 0 Investigations, n (%) 4 (1.8) 7 (3.1) ALT increased, n (%) 0 6 (2.7) AST increased, n (%) 0 5 (2.2)

Company evidence submission for dacomitinib for untreated EGFR-positive non-small-cell lung cancer (ID1346)
© Pfizer (2018). All rights reserved Page 83 of 388
*Dacomitinib was managed by dose reductions of the daily dose whereas gefitinib was managed by dosing every other day. Patient 04802003 had an AE (Acne of skin of arms) that was not coded as per MedDRA and therefore was not reported in this table. †AEs are sorted by descending frequency in the dacomitinib arm. Abbreviations: AE = adverse event; ALT = alanine aminotransferase; AST = aspartate aminotransferase.
More patients in the dacomitinib arm than the gefitinib arm discontinued treatment
temporarily due to AEs (XXXXX versus XXXXX, respectively; Table 27).40 Most AEs
leading to temporary treatment discontinuation were considered related to the study
treatment and therefore the frequencies of treatment-related AEs associated with
temporary discontinuations are very similar to the all causality AEs.40
Table 27: Adverse events (all-cause) that resulted in temporary discontinuations reported for ≥2% of patients in any treatment arm of the ARCHER 1050 trial (Safety Population)40
AE category* Dacomitinib†
N=227 Gefitinib N=224
Any AEs, n (%) XXXXXX XXXXXX Skin and subcutaneous tissue disorders, n (%) XXXXXX XXXXXX Dermatitis acneiform, n (%) XXXXXX XXXXXX Rash, n (%) XXXXXX XXXXXX Rash maculo-papular, n (%) XXXXXX XXXXXX Dermatitis, n (%) XXXXXX XXXXXX Pruritus, n (%) XXXXXX XXXXXX Dry skin, n (%) XXXXXX XXXXXX Acne, n (%) XXXXXX XXXXXX Infections and infestations , n (%) XXXXXX XXXXXX Paronychia, n (%) XXXXXX XXXXXX Rash pustular, n (%) XXXXXX XXXXXX Gastrointestinal disorders, n (%) XXXXXX XXXXXX Diarrhoea, n (%) XXXXXX XXXXXX Stomatitis, n (%) XXXXXX XXXXXX Vomiting, n (%) XXXXXX XXXXXX General disorders and administration site conditions, n (%) XXXXXX XXXXXX Asthenia, n (%) XXXXXX XXXXXX Mucosal inflammation, n (%) XXXXXX XXXXXX Metabolism and nutrition disorders, n (%) XXXXXX XXXXXX
Decreased appetite, n (%) XXXXXX XXXXXX
Investigations, n (%) XXXXXX XXXXXX ALT increased, n (%) XXXXXX XXXXXX AST increased, n (%) XXXXXX XXXXXX Hepatobiliary disorders, n (%) XXXXXX XXXXXX Hepatic function abnormal, n (%) XXXXXX XXXXXX

Company evidence submission for dacomitinib for untreated EGFR-positive non-small-cell lung cancer (ID1346)
© Pfizer (2018). All rights reserved Page 84 of 388
*AEs are sorted by descending frequency in the dacomitinib arm. †Dacomitinib was managed by dose reductions of the daily dose whereas gefitinib was managed by dosing every other day. Patient 04802003 had an AE (Acne of skin of arms) that was not coded as per MedDRA and therefore was not reported in this table. Abbreviations: AE = adverse event; ALT = alanine aminotransferase; AST = aspartate aminotransferase.
Although more patients in the dacomitinib arm than gefitinib arm discontinued
treatment temporarily due to AEs, rates of permanent discontinuations due to
treatment-related AEs were similar between the treatment arms (XXXX versus
XXXX, respectively; Table 28).40
Table 28: Treatment-emergent adverse events leading to permanent discontinuation of treatment in patients from the ARCHER 1050 trial (Safety Population)40
TEAE, n (%) Dacomitinib
N=227 Gefitinib N=224
All causality TEAEs Any TEAEs XXXXXXX XXXXXXX Pneumonia XXXXXXX XXXXXXX Disease progression XXXXXXX XXXXXXX Dermatitis acneiform XXXXXXX XXXXXXX Alanine aminotransferase increased XXXXXXX XXXXXXX Treatment-related TEAEs Any TEAEs XXXXXXX XXXXXXX Dermatitis acneiform XXXXXXX XXXXXXX Diarrhoea XXXXXXX XXXXXXX Alanine aminotransferase increased XXXXXXX XXXXXXX Abbreviations: TEAE = treatment-emergent adverse event.
B.2.10.3.1 Effect of dose adjustments on safety and efficacy outcomes
In the ARCHER 1050 trial, patients who started treatment with dacomitinib 45 mg
once daily and required dose reductions (to either 30 mg or 15 mg once daily)
experienced lower incidences of adverse events with no impact on efficacy. For
instance, grade 3 and 4 events of dermatitis acneiform, paronychia, diarrhoea and
stomatitis were substantially decreased following dose reductions (Figure 25). The
most pronounced reductions occurred for dermatitis acneiform and diarrhoea, where
the number of patients with grade 3 and 4 events decreased from 15.3% to 6.7%
and 11.3% to 4.0%, respectively.60
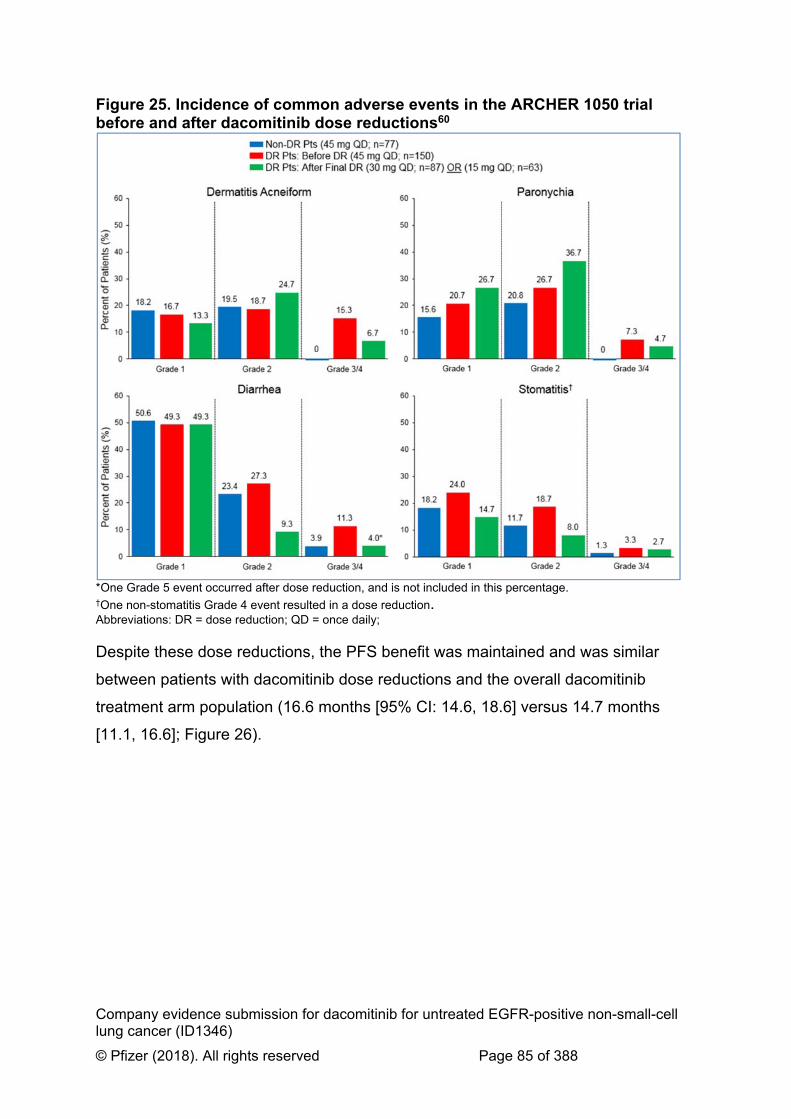
Company evidence submission for dacomitinib for untreated EGFR-positive non-small-cell lung cancer (ID1346)
© Pfizer (2018). All rights reserved Page 85 of 388
Figure 25. Incidence of common adverse events in the ARCHER 1050 trial before and after dacomitinib dose reductions60
*One Grade 5 event occurred after dose reduction, and is not included in this percentage. †One non-stomatitis Grade 4 event resulted in a dose reduction. Abbreviations: DR = dose reduction; QD = once daily;
Despite these dose reductions, the PFS benefit was maintained and was similar
between patients with dacomitinib dose reductions and the overall dacomitinib
treatment arm population (16.6 months [95% CI: 14.6, 18.6] versus 14.7 months
[11.1, 16.6]; Figure 26).

Company evidence submission for dacomitinib for untreated EGFR-positive non-small-cell lung cancer (ID1346)
© Pfizer (2018). All rights reserved Page 86 of 388
Figure 26. Median progression-free survival per blinded independent review committee analysis for dacomitinib in all patients versus with patients with dose reduction60
Abbreviations: CI = confidence interval; IRC = independent review committee; PFS = progression-free survival.
Similar to PFS, the OS benefit was also maintained in patients with dacomitinib dose
reductions compared to the overall dacomitinib treatment arm population: 36.7
months (95% CI: 32.6, NR) versus 34.1 months (29.5, 37.7; Figure 27).60
Figure 27. Median overall survival for dacomitinib in all patients versus patients with dose reduction60
Abbreviations: CI = confidence interval; IRC = independent review committee; NR = not reported; OS = overall survival.

Company evidence submission for dacomitinib for untreated EGFR-positive non-small-cell lung cancer (ID1346)
© Pfizer (2018). All rights reserved Page 87 of 388
B.2.10.4 Safety of dacomitinib in relation to the decision problem
The incidence of AEs reported for dacomitinib in the ARCHER 1050 trial was
consistent with other clinical studies of dacomitinib, with no new safety signals
identified.33
As indicated in previous sections, the most common AEs experience during
treatment with dacomitinib were diarrhoea, paronychia, stomatitis and dermatitis
acneiform.33 According to a consensus meeting of UK-based multidisciplinary panel
of medical and clinical oncologists, these AEs are typical of treatment with EGFR-
TKIs and vary widely from first- to second-generation TKIs.61 Based on naïve
comparisons, dacomitinib appears to have a safety profile consistent with currently
licensed TKIs in the UK, particularly afatinib (however, with numerically lower rates
of diarrhoea, stomatitis and dermatitis acneiform; Table 29). Given that the most
common AEs associated with dacomitinib are also typical of the TKI treatment class
(e.g. diarrhoea, stomatitis, paronychia and dermatitis), its approval is unlikely to
change current clinical practice as clinicians may be already familiar with managing
these AEs.33,61
Table 29. Incidence of common AEs reported in first-line clinical trials of EGFR-TKIs in patients with advanced NSCLC*33,61
Drug Diarrhoea Stomatitis / Mucositis
ParonychiaDermatitis acneiform‡
Dacomitinib 85% 41% 61.7% 48.9% Gefitinib† 34.2–54% 15.2–40.2% 13.5–32% 15.2–66.2% Erlotinib 25–57% 13% 4% NR Afatinib 88.3–95% 51.9–72.1% 32.6–56.8% 80.8–89.1% *Incidence ranges reported for treatments with data available from multiple trials: IPASS,37 First-SIGNAL,62 NEJ00242,43 and WJTOG340544 (gefitinib); OPTIMAL36 and EURTAC35 (erlotinib); LUX-Lung 338, LUX-Lung 639 and LUX-Lung 763(afatinib); ARCHER 105033 (dacomitinib). †Includes data from ARCHER 1050; some studies also enrolled patients with EGFR wild-type tumours. ‡Reported as “acneiform rash” for gefitinib and afatinib. Abbreviations: AE = adverse event; EGFR = epidermal growth factor receptor; NR = not reported; NSCLC = non-small-cell lung cancer; TKI = tyrosine kinase inhibitor.
In ARCHER 1050, although more patients in the dacomitinib treatment arm required
a dose reduction versus the gefitinib arm (66.1% versus 8.0%, respectively),40
efficacy outcomes for dacomitinib-treated patients were consistently improved
compared with the gefitinib treatment arm. Dacomitinib is available in three dose
strengths – 45 mg, 30 mg and 15 mg – making dose modifications to individualise
treatment straightforward (while also maintaining efficacy). Dacomitinib offers an

Company evidence submission for dacomitinib for untreated EGFR-positive non-small-cell lung cancer (ID1346)
© Pfizer (2018). All rights reserved Page 88 of 388
advantage over gefitinib as dose reductions are not recommended in the approved
license for the latter; this would therefore be expected to impact the dose reductions,
discontinuations and AE profile achieved in real-world clinical practice with gefitinib.59
Additionally, despite a higher number of dacomitinib patients requiring dose
reductions, a similar proportion of patients in both the dacomitinib and gefitinib arms
experienced a treatment-related AE leading to treatment discontinuation (22 [10%]
and 15 [7%] patients in the dacomitinib and gefitinib arms, respectively).33
B.2.11 Ongoing studies There are no additional, ongoing Phase III trials in the public domain for dacomitinib
for the first-line treatment of EGFR-positive NSCLC.
B.2.12 Innovation Dacomitinib is a second generation, selective and irreversible EGFR-TKI that has
activity against all three members of the ErbB family (EGFR/HER1, HER2 and
HER4), providing improved efficacy compared with reversible first-generation TKIs.
Irreversible binding of an agent is believed to help extend its efficacy and delay the
development of resistance, whereas targeting more than one family member of the
ErbB family may improve efficacy and overcome redundancy associated with
receptor crosstalk.
As a second-generation TKI, dacomitinib also offers a new and important alternative
for treatment of patients with EGFR+ NSCLC in first-line treatment setting alongside
afatinib.
In patients with EGFR+ advanced NSCLC, dacomitinib is the first and only EGFR-
TKI to show significant OS benefit in a phase III randomised trial (ARCHER 1050)
against an active comparator. The median OS was 34.1 months (95% CI: 29.5, 37.7)
with dacomitinib versus 26.8 months (95% CI: 23.7, 32.1) with gefitinib ((HR,
0.760).34
Additionally, of the current approved treatments for EGFR+ NSCLC, dacomitinib has
the numerically longest PFS data. Median PFS based on blinded IRC analysis was
14.7 months (95% CI: 11.1, 16.6) in the dacomitinib arm and 9.2 months (95% CI:

Company evidence submission for dacomitinib for untreated EGFR-positive non-small-cell lung cancer (ID1346)
© Pfizer (2018). All rights reserved Page 89 of 388
9.1, 11.0) in the gefitinib arm (HR 0.59). Investigator-assessed median PFS was
16.6 months (95% CI: 12.9, 18.4) in the dacomitinib arm and 11 months (95% CI:
9.4, 12.1) in the gefitinib arm (HR 0.62).33
B.2.13 Interpretation of clinical effectiveness and safety evidence
B.2.13.1 Summary of clinical evidence
In the ARCHER 1050 trial, treatment with dacomitinib was associated with a
significant improvement in the primary endpoint, PFS based on blinded IRC analysis,
when compared to gefitinib.33,40 Patients who received dacomitinib were associated
with a median PFS of 14.7 months (95% CI: 11.1, 16.6) compared to 9.2 months
(95% CI: 9.1, 11.0) in patients treated with gefitinib.33,40 This translated to a 5.5
month median improvement in PFS and, based on a HR of 0.589, indicated a 41%
reduction in the risk of progression (p<0.0001).33,40 These findings were further
supported by the results of the PFS based on investigator assessment, where
dacomitinib was associated with a median PFS of 16.6 months [95% CI: 12.9, 18.4]
compared to 11.0 months [95% CI: 9.4, 12.1] with gefitinib (HR: 0.62; 95% CI: 0.50,
0.78; p<0.0001). Given the detrimental effect of symptoms associated with EGFR+
NSCLC (as outlined in section B.1.3.1), the PFS improvements of dacomitinib
relative to gefitinib may have a positive impact on patients by delaying disease
progression and potentially reducing the burden of symptoms, such as cough,
dyspnoea and pain.
Treatment with dacomitinib demonstrated significant improvements in OS, a key
secondary outcome. Patients treated with dacomitinib reported median OS of 34.1
months (95% CI: 29.5, 37.7) compared to 26.8 months (95% CI: 23.7, 32.1) with
gefitinib (HR: 0.760; 95% CI: 0.582, 0.993; 2-sided p-value=0.0438; stratified
analysis).34,40 This translated into a 7.3 month improvement in median OS and 24%
reduction in the risk of death compared with gefitinib.
The significant improvements in PFS and OS associated with dacomitinib are further
supported by results from the NMA, which indicated that dacomitinib is associated
with superior PFS and OS when compared to both erlotinib and afatinib.

Company evidence submission for dacomitinib for untreated EGFR-positive non-small-cell lung cancer (ID1346)
© Pfizer (2018). All rights reserved Page 90 of 388
First-line treatment with dacomitinib resulted in significant improvements versus
gefitinib in the secondary endpoints of DoR (median 14.8 months versus 8.3 months
for dacomitinib and gefitinib, respectively; p<0.0001) and TTF (median 11.1 months
versus 9.2 months, respectively; p=0.0001).33,40 These clinically meaningful64
improvements in PFS, DoR and TTF compared to gefitinib further highlight the
potential role of dacomitinib in delaying the use of subsequent treatments thereby
increasing the total time on active therapy in currently available treatment
sequences.19
Treatment with dacomitinib was also shown to significantly reduce key disease-
related symptoms based on a self-reported QoL assessment with the EORTC QLQ-
C30 and EORTC QLQ-LC13 questionnaires. In particular, clinically meaningful
improvements (≥10 point change in score from baseline)64 were observed in more
treatment cycles for cough and chest pain symptoms in patients treated with
dacomitinib arm (28/30 and 23/30 treatment cycles, respectively) compared with the
gefitinib arm (22/30 and 12/30 treatment cycles, respectively).33,50 Additionally, chest
pain was significantly improved in patients treated with dacomitinib compared with
gefitinib (mean improvement: -10.24 versus -7.44; p=0.0235).33 Given the significant
burden of symptoms among patients with NSCLC,17 this indicates the importance of
dacomitinib maintaining global QoL in NSCLC patients, which is subsequently
maintained for longer than gefitinib given the difference in TTF.
Most patients in the ARCHER 1050 trial experienced an all-causality AE, with
proportions comparable between dacomitinib and gefitinib (99.6% and 98.2%,
respectively).33,40 Although, a higher number of patients in the dacomitinib arm
reported Grade 3 AEs of any cause versus those who received gefitinib (XXXXX
versus XXXXX, respectively), the number of patients with Grade 4 events was low
and comparable between treatment arms (XXXX versus XXXX).40 In patients treated
with dacomitinib in ARCHER 1050, the most common all-cause AEs (of any grade)
were diarrhoea (87.2%), paronychia (61.7%), dermatitis acneiform (48.9%) and
stomatitis (43.6% of patients), whereas for gefitinib the most common all-cause AEs
were diarrhoea (55.8%), increase in ALT (39.3%), increase in AST (36.2%) and
dermatitis acneiform (28.6%). The safety profile of dacomitinib appears consistent
with that of other TKIs. Additionally, the majority of treatment-related AEs associated

Company evidence submission for dacomitinib for untreated EGFR-positive non-small-cell lung cancer (ID1346)
© Pfizer (2018). All rights reserved Page 91 of 388
with dacomitinib were mild to moderate in severity33 and managed using dose
interruption, dose reduction and/or supportive measures, without compromising
efficacy.60 As such, dacomitinib is expected to provide an important alternative
treatment option to EGFR+ NSCLC patients without impacting the current treatment
paradigm in the UK. Given that currently licensed TKIs have been available for
several years, it is anticipated that clinical practitioners may be familiar with the
adverse events associated with this therapy class. For instance, the most common
AEs associated with dacomitinib were those typically associated with TKI treatment
(e.g. diarrhoea, stomatitis, paronychia and dermatitis),33,61 which may already be
readily managed within the UK clinical setting. Dacomitinib is therefore unlikely to
change current clinical practice as clinicians may be familiar to the typical AEs
associated with current standard-of-care treatments. Discontinuation rates due to
treatment-related AEs were also low in both dacomitinib- and gefitinib-treated
patients (9.7% and 6.7% of patients, respectively).33
B.2.13.2 Strengths and limitations of clinical evidence
B.2.13.2.1 Strengths of the evidence
The ARCHER 1050 trial is the only phase III head-to-head study to compare a
second-generation TKI with a standard-of-care first-generation TKI in patients with
locally advanced or metastatic EGFR+ NSCLC in the first-line setting.
When compared using to evidence from a NMA, ARCHER 1050’s head-to-head
design provides a clearer indication of dacomitinib’s clinical benefits compared with
other TKIs, in addition to having increased certainty in its results. Furthermore, TKIs
are the standard of care for EGFR+ NSCLC in the first-line in the current UK
treatment pathway. As such, the head-to-head design of the ARCHER 1050 trial
directly comparing dacomitinib against an approved TKI in first-line is more reflective
of the current treatment pathway than trials comparing a TKI against chemotherapy.
Comparators in the phase III trials of afatinib, gefitinib and erlotinib were limited to
chemotherapy (although afatinib was more recently compared with gefitinib in LUX-
Lung 7, this was a phase II study).

Company evidence submission for dacomitinib for untreated EGFR-positive non-small-cell lung cancer (ID1346)
© Pfizer (2018). All rights reserved Page 92 of 388
The efficacy outcomes assessed in the ARCHER 1050 trial are relevant to UK
clinical practice and are consistent with those reported in previous EGFR+ NSCLC
submissions (i.e. afatinib, gefitinib, erlotinib and osimertinib).65-68 Although ARCHER
1050 was an open-label trial, in addition to investigator assessments, it used a third-
party blinded IRC review which comprised of ≥2 independent radiologic experts and
a third radiologic expert acting as an adjudicator. Trials which utilise open-label
designs and IRC review of efficacy outcomes are well-established in NSCLC and
have been used for other TKIs already assessed in other submissions (afatinib –
LUX-Lung 3 and LUX-Lung 6; erlotinib – EURTAC and OPTIMAL).35,36,39,69,70
The ARCHER 1050 trial also included assessments of the effect of treatment on
patients’ health-related quality-of-life (HRQoL), disease/treatment-related symptoms
and general health status through various PRO instruments. In addition to the
widely-used generic cancer instrument EORTC QLQ-C30, patient symptoms were
also assessed using the lung cancer-specific EORTC QLQ-LC13. The EQ-5D was
also used in the ARCHER 1050 trial, the instrument preferred by NICE, for eliciting
utility values for economic modelling. PRO assessments were conducted regularly
(every 28 days) and the rates of completion were high for the majority of cycles
(>90% of patients answered all questions).
Additionally, the ARCHER 1050 trial was prospectively powered to show a difference
on a single primary endpoint. It was estimated that 440 randomised patients with a
minimum of 256 observed PFS events would be required to achieve a 90% power to
detect a ≥50% improvement in PFS in the dacomitinib group versus the gefitinib
group in the ITT population (i.e. HR: ≤0.667).33 This is in contrast to other head-to-
head studies of TKIs, such as LUX-Lung 7, which had no specific statistical power
for its three co-primary endpoints.9 The improvement in PFS with dacomitinib versus
gefitinib in the ARCHER 1050 trial (5.5 months) was numerically greater than that
with afatinib versus gefitinib in LUX-Lung 7 (0.1 months).33 Additionally, the
estimated PFS at 24 months with dacomitinib (30.6%) in ARCHER 1050 was also
numerically higher than that with afatinib (17.6%) in LUX-Lung 7.9,33

Company evidence submission for dacomitinib for untreated EGFR-positive non-small-cell lung cancer (ID1346)
© Pfizer (2018). All rights reserved Page 93 of 388
B.2.13.2.2 Limitations of the evidence
As mentioned previously, one limitation of the ARCHER 1050 trial was that the study
consisted of an open-label design, where investigators and patients were not
masked to treatment assignment. However, the results for PFS, objective responses,
and DoR by investigator assessment were consistent with those based on blinded
IRC analysis, thereby supporting the validity of these findings.33
The dacomitinib group had a higher proportion of female patients and proportions of
patients with an ECOG performance status of 0 than the gefitinib group. These
artefacts of randomisation were not considered limitations to the study or the results
because gender is not considered a prognostic factor of PFS in patients with EGFR+
NSCLC and generally there is no difference in outcomes between ECOG
performance status of 0 and 1.33 This was also evident for OS where non-significant
interaction terms were observed for both gender and ECOG performance status
(Figure 14).
An additional limitation pertaining to baseline characteristics revolves around the
exclusion of patients with brain metastases from the study as the extent of CNS
penetration of dacomitinib was not known at the time of the study design. This may
have limited the full extent to which the activity of dacomitinib was investigated.
However, given the lack of adequate CNS penetration (1% rate) associated with
gefitinib,71 the efficacy results are unlikely to have been affected by the exclusion of
this patient population.
The trial network did not contain a ‘closed loop’ of evidence, meaning that
comparison between dacomitinib and afatinib was entirely dependent on the gefitinib
arm of each study, thereby increasing uncertainty. This was a result of sparse
evidence, which paradoxically highlights the importance of ARCHER 1050 trial
design and the inclusion of a clinically active and relevant comparator to tackle the
lack of head-to-head evidence in trials comparing TKIs.
B.2.13.3 Relevance of the evidence base to the decision problem
ARCHER 1050 is relevant to the decision problem in regards to the patient
population, comparators and outcomes considered.

Company evidence submission for dacomitinib for untreated EGFR-positive non-small-cell lung cancer (ID1346)
© Pfizer (2018). All rights reserved Page 94 of 388
ARCHER 1050 consisted of patients with confirmed locally advanced or metastatic
EGFR+ NSCLC, the population defined within the decision problem. Patient
demographic and baseline characteristics were representative of the intended
patient population for dacomitinib in the first-line setting. All patients enrolled in
ARCHER 1050 had tumours of adenocarcinoma histology with the vast majority of
patients having stage IIIb or IV disease, which is consistent with the disease profile
of patients with EGFR+ NSCLC treated in the NHS.
ARCHER 1050 shared similar baseline characteristics to the studies utilised in the
most recent previous EGFR appraisal68 (AURA extension, AURA2 and IMPRESS).
In the appraisal ‘experts highlighted that these trials were more generalisable than
most other lung cancer trials because people with EGFR mutation-positive NSCLC
tended to be diagnosed at a younger age, were fitter and not necessarily smokers
compared with other types of lung cancer’ and therefore, the committee concluded
that the trials used ‘were broadly generalisable to clinical practice’. Therefore, the
patient population in ARCHER 1050 can be considered generalisable to UK clinical
practice.
The ethnic mix typically treated in the NHS would differ to that of ARCHER 1050,
where approximately 25% of patients were described as non-Asian and 75% were
described as Asian. As indicated previously, there is a high focus on Asian
populations in clinical trials within this disease indication,47 and previous submissions
for TKIs in the treatment of EGFR+ NSCLC included trials which comprised a major
Asian component. Although members of the Appraisal Committee have
acknowledged the association between Asian patients and increased response to
lung cancer treatment,72,73, current evidence around the impact of ethnicity is not
definitive. Furthermore, clinical expert opinion suggested that studies with a
predominately Asian population tend to mirror what is seen in Caucasian patients.
With regards to currently approved therapies in the UK, the decision problem also
highlights the limited treatment options available for patients with EGFR+ NSCLC,
whereby only three TKIs (afatinib, erlotinib, gefitinib) are currently approved in the
first-line setting. There may therefore be an unmet need for new treatments that can

Company evidence submission for dacomitinib for untreated EGFR-positive non-small-cell lung cancer (ID1346)
© Pfizer (2018). All rights reserved Page 95 of 388
provide prolonged PFS and survival, improve disease symptoms and maintain
patient QoL.
B.2.13.4 End-of-life-criteria
Dacomitinib provides an extension to life in excess of 3 months; however patients on
current standard-of-care have life expectancies that exceed 24 months. Therefore,
dacomitinib does not meet the end-of-life criteria (Table 30).
Table 30. Summary of end-of-life criteria Criterion Data available The treatment is indicated for patients with a short life expectancy, normally less than 24 months
Current approved options are already associated with >24 month survival outcomes. In ARCHER 1050, the median OS for gefitinib was 26.8 months (95% CI: 23.7, 32.1).
There is sufficient evidence to indicate that the treatment has the prospect of offering an extension to life, normally of a mean value of at least an additional 3 months, compared with current NHS treatment
As detailed in Section B.2.6.3.2, dacomitinib demonstrated a 7.3 month improvement in median OS and a 24% reduction in the risk of death compared with gefitinib in EGFR+ NSCLC. The median OS was 34.1 months (95% CI: 29.5, 37.7) in the dacomitinib arm compared with 26.8 months (95% CI: 23.7, 32.1) for gefitinib (HR: 0.760; 95% CI: 0.582, 0.993; 2-sided p-value=0.0438; stratified analysis).34,40
Abbreviations: CI = confidence interval; EGFR+ = epidermal growth factor receptor mutation positive; HR = hazard ratio; NHS = National Health Service; NSCLC = non-small-cell lung cancer; OS = overall survival.
Company evidence submission for dacomitinib for untreated EGFR-positive non-small-cell lung cancer (ID1346)
© Pfizer (2018). All rights reserved Page 96 of 388
B.3 Cost effectiveness
B.3.1 Published cost-effectiveness studies A SLR was conducted to inform the present submission. A detailed description of the
search, its methods, and results (including the relevant results of the previous SLR)
are provided in Appendix G.
B.3.1.1 Summary of identified studies and results
No previously published cost-effectiveness studies of dacomitinib were identified.
The systematic review identified 31 unique publications from 28 studies that met the
inclusion criteria for the broader set of comparators, none of which were economic
evaluations relevant to decision making in the UK. However, six HTA appraisals
were identified; three were conducted by NICE (TA192, TA258 and TA310) and
three were conducted by the SMC (ID 920/13, ID 615/10, and ID 749/11). These are
summarised in Appendix G.
B.3.2 Economic analysis Given that no published cost effectiveness studies relevant to the technology
appraisal were identified in the SLR, a de novo economic evaluation was included in
the submission.
B.3.2.1 Patient population
The population considered in the economic evaluation is identical to the trial
population recruited in the ARCHER 1050 phase III clinical study
XXXXXXXXXXXXXXXXXXXXXXXXXXXXXXXXX, i.e. treatment-naïve patients with
advanced NSCLC and activating mutations in EGFR (see Section B.2.3).33Inclusion
and exclusion criteria for ARCHER 1050 are described in Section B.2.3.2.33
B.3.2.2 Model structure
The cost-effectiveness (cost-utility) model was developed in Microsoft Excel® using
an area under the curve (partitioned survival analysis [PartSa]) model structure.

Company evidence submission for dacomitinib for untreated EGFR-positive non-small-cell lung cancer (ID1346)
© Pfizer (2018). All rights reserved Page 97 of 388
The model structure (depicted in Figure 28), comprised three health states;
progression-free (PF), progressed disease (PD) and death. All patients enter the
model in the PF state and are at risk of progression or death. Upon progression
patients enter the PD state where they remain until death. Death is an absorbing
state.
The PFS curve dictated the proportion of patients remaining in the PF state; the OS
curve informed the percentage of patients that were alive, and the remaining patients
(alive minus progression-free) were in the PD state.
Figure 28. Three Health State Model
The three-state model structure was chosen for several reasons:
The structure captures two of the key objectives of treatment in NSCLC,
namely avoiding disease progression and prolonging life;
The data requirement for the model (PFS and OS) are aligned with the
endpoints of ARCHER 1050;
The model structure and health states are common for metastatic oncology
models, and have been used in previous National Institute for Health and
Care Excellence (NICE) NSCLC appraisals.67,74-77
The cost of second- and third-line subsequent treatments were applied as one-off
costs upon discontinuation of first- and second-line treatment, respectively. The
model design did not explicitly capture the efficacy of subsequent treatment after
progression from the initial therapy. The clinical impact of the subsequent treatments
on survival received by patients in the trial was captured between PFS and OS and

Company evidence submission for dacomitinib for untreated EGFR-positive non-small-cell lung cancer (ID1346)
© Pfizer (2018). All rights reserved Page 98 of 388
was thereby inherently captured under the PartSA framework. Therefore, varying the
composition of subsequent treatments only alters costs and not survival.
B.3.2.2.1 Features of the economic analysis
The analysis was constructed from the perspective of the NHS and the personal
social services (PSS) in England and Wales. Costs were based on 2016/2017 prices
(which are the latest available publication sources at the time of submission). A
discount rate of 3.5% per annum was applied for costs and benefits in line with the
NICE reference case.78
A lifetime time horizon of 15 years was applied in the base-case given that it was
aligned with the maximum life expectancy of the cohort predicted by the base-case
parametric survival analysis (<1% alive at 15 years). Therefore, this was considered
long enough to capture the long-term clinical and economic impacts of advanced
NSCLC, an incurable disease requiring treatment until end of life.
The model cycle-length was 28-days which was believed short enough to capture
the granularity of disease progression and matched the assessment schedule of
ARCHER 1050. Aligned with previous appraisals in NSCLC, costs and outcomes
were half-cycle corrected by averaging the number of patients at the start and end of
each cycle, with the exception of drug acquisition costs in the PF state in which it
was assumed that administration would occur at the beginning of the cycle,
eliminating the need for half cycle correction.29,65,66
A summary of the model features is presented in Table 31, alongside a comparison
with models included in previous NICE appraisals of treatments for newly diagnosed
advanced NSCLC.

Company evidence submission for dacomitinib for untreated EGFR-positive non-small-cell lung cancer (ID1346)
© Pfizer (2018). All rights reserved Page 99 of 388
Table 31. Features of the economic analysis
Factor Previous appraisals Current
appraisal Justification
TA258 (erlotinib)66 TA310 (afatinib)29 TA192 (gefitinib)65
Summary of analytic methods
Semi-Markov method*
Partitioned survival method
Markov state transition model
Partitioned survival method
Allows best use of available data (PFS/OS) - primary and
secondary outcomes of ARCHER 1050.
Captures two of the key objectives of treatment in NSCLC, namely avoiding disease progression and
prolonging life.
Commonly used in previous oncology NICE appraisals,
including NSCLC.
Patient population
EGFR+ aNSCLC EGFR+ aNSCLC EGFR+ aNSCLC EGFR+
aNSCLC
Population aligned with the ARCHER 1050 population,
the final scope and the expected EMA marketing
authorisation.
Time horizon 10 years 10 years 5 years 15 years
Aligned with the maximum life expectancy of the cohort predicted by the base-case parametric survival analysis
(<1% alive at 15 years).
Perspective NHS/PSS NHS/PSS NHS/PSS NHS/PSS Aligns with the NICE
reference case78
Discount 3.5% health benefits
and costs 3.5% health benefits
and costs 3.5% health benefits
and costs
3.5% health benefits and
costs
Aligns with the NICE reference case78
Cycle length 1 month 1 month 21-day Four-week (28-
day) Aligns with the schedule of
the ARCHER 1050 trial Half-cycle correction
Yes – Where appropriate (i.e. not
Yes Yes Yes – Where
appropriate (i.e. N/A

Company evidence submission for dacomitinib for untreated EGFR-positive non-small-cell lung cancer (ID1346)
© Pfizer (2018). All rights reserved Page 100 of 388
Factor Previous appraisals Current
appraisal Justification
TA258 (erlotinib)66 TA310 (afatinib)29 TA192 (gefitinib)65 when assessing the
cost of an oral therapy)
not when assessing the cost of an oral
therapy)
Treatment waning effect?
No No No No N/A
Source of utilities
Nafees et al 2008 LUX-Lung trial,
Chouaid et al. 2012, Nafees et al. 2008
Nafees et al. 2008
ARCHER 1050 (EQ-5D-3L; UK
tariff); LUME-Lung 1
(TA347)
Value from ARCHER 1050 aligned with NICE reference
case.78 LUME-Lung 1 accepted by
ERG in TA347 and recommended by ERG in
TA416.68,79
Source of costsBNF
PSSRU
BNF NHS Reference costs
PSSRU
BNF NHS Reference costs
BNF eMIT
NHS Reference costs
PSSRU
N/A
*An extrapolated area under the curve approach was used in order to determine the proportion of patients in PFS at each month of the model. All other transitions in the model were estimated using a Markov framework Abbreviations: aNSCLC = advanced non-small-cell lung cancer; BNF = British National Formulary; EGFR+ = epidermal growth factor receptor mutation positive; eMit = Drugs and pharmaceutical electronic market information tool; NHS = National Health Service; OS = overall survival; PFS = progression-free survival; PSSRU = Personal Social Services Research Unit.

Company evidence submission for dacomitinib for untreated EGFR-positive non-small-cell lung cancer (ID1346)
© Pfizer (2018). All rights reserved Page 101 of 388
B.3.2.2.2 Intervention technology and comparators
The intervention, dacomitinib, was implemented within the model as per its expected
marketing authorisation, and according to the recommended dosing regimen, i.e.
45mg/day. The comparative treatments were also implemented as per their
respective marketing authorisations and licensed dosing regimens.
Aligned with the NICE scope for first-line EGFR+ patients, the following comparators
were included in the base-case:
Gefitinib
Afatinib
Erlotinib
B.3.3 Clinical parameters and variables
B.3.3.1 Incorporation of clinical data into the economic model
The primary data source for the model was ARCHER 1050. ARCHER 1050 was a
randomised, head-to-head trial comparing dacomitinib versus gefitinib (see Section
B.2.2 and B.2.3 for further details). However, as discussed in Section 2.9.1, a NMA
was required to allow comparison against afatinib, and erlotinib was assumed
equivalent to gefitinib following previous committee conclusions and observed
clinical data.29 Due to the potential violations of the proportional hazards assumption,
which was assessed in Section 2.9.2 prior to conducting the NMA, a FP NMA was
used to allow hazard ratios to vary over time.
Fractional polynomials are an alternative to regular polynomials that provide flexible
parameterization for continuous variables.80The entirety of the available KM data are
used to indirectly compare interventions. Following the selection of the most
appropriate FP model, comparator curves are then constructed in the model using
the gefitinib curve as a reference by applying the time dependent hazard ratios (i.e.,
non-proportional hazards). As such, the FP framework removes the need for
separate parameterisation for each comparator.

Company evidence submission for dacomitinib for untreated EGFR-positive non-small-cell lung cancer (ID1346)
© Pfizer (2018). All rights reserved Page 102 of 388
The following sections provide justification for the selected extrapolations for the
time-to-event data (PFS and OS) for the reference treatment in the network (geftinib
from ARHCER 1050).
The PFS and OS curves were calculated in ARCHER 1050 using the KM estimation
method. PFS assessed by the IRC was included in the base-case analysis given that
it was the primary outcome of ARCHER 1050. Six parametric distributions were
considered following guidance from the NICE Decision Support Unit (DSU): the
exponential, Weibull, Gompertz, log-logistic, log-normal, and generalised gamma.81
This was conducted using the streg procedure in STATA.
For each endpoint, the distributions for the base-case and scenario analyses
reference arm were selected following the guidance inform the NICE DSU .81 The
model selection process included the following considerations:
Ranking distributions based on statistical goodness-of-fit to the observed data
according to Akaike Information Criterion (AIC) and Bayesian Information
Criterion (BIC)
A visual inspection consisting of an analysis of the “Observed vs Predicted”
plot. The KM and parametric survival curves were plotted to assess the fit
during the trial period, and the long-term extrapolation.
Comparison of predicted median values and higher quantiles of the
distributions
Consultation with clinical experts to assess the plausibility of the
extrapolations
Comparison of fitted curves to external data
B.3.3.2 Progression-free survival
B.3.3.2.1 Gefitinib
In the network gefitinib was the ‘base’ curve against which comparative estimates for
the other treatments in the analysis (dacomitinib, afatinib and erlotinib) were
generated.

Company evidence submission for dacomitinib for untreated EGFR-positive non-small-cell lung cancer (ID1346)
© Pfizer (2018). All rights reserved Page 103 of 388
AIC and BIC values (Table 32) showed the best fit for PFS was the log-logistic for
gefitinib closely followed by the Weibull and generalised gamma. The relatively
higher AIC/BIC for the log-normal, Gompertz and exponential suggest these are less
preferable.
Table 32. Goodness-of-Fit Statistics (PFS) - Gefitinib
Distribution AIC BIC Mean MedianProportion PF at 2 years 3 years 5 years
Exponential 550.92 554.33 XXXXX XXXXX XXXXX XXXXX XXXXX
Weibull 514.46 521.29 XXXXX XXXXX XXXXX XXXXX XXXXX
Gompertz 532.35 539.18 XXXXX XXXXX XXXXX XXXXX XXXXX
Log-logistic 513.38 520.21 XXXXX XXXXX XXXXX XXXXX XXXXX
Log-normal 529.33 536.16 XXXXX XXXXX XXXXX XXXXX XXXXX
Generalised gamma 514.65 524.90 XXXXX XXXXX XXXXX XXXXX XXXXX
ARCHER 1050 - - - 9.23 9.6% - - Abbreviations: AIC = Akaike Information Criterion; BIC = Bayesian Information Criterion; PF = progression-free.
All distributions provided similar visual fits to the observed KM data (XXXXXXX29)
with predicted medians close to the observed data, with the exception of the
exponential which substantially underestimated the observed data for approximately
the first 8 months. However, beyond the end of the observed data the logarithmic
distributions (log-logistic and log-normal) produced much higher tails than the other
distributions which questioned their suitability.
Clinical expert feedback indicated that the distributions with higher tails (the
exponential, log-logistic and log-normal) predicted long-term (5-year) PFS estimates
that were appropriate. However, the 3-year rates were considered slightly high for
these distributions, although the predictions from the Weibull and generalised
gamma distributions were considered to potentially underestimate survival at 3
years. Clinicians suggested they would expect the true survival to fall somewhere
between the upper and lower models (indicating the highest and lowest distributions
could be excluded as too extreme) but noted several of the projected curves were
relatively similar to one another (see XXXXXXX29).

Company evidence submission for dacomitinib for untreated EGFR-positive non-small-cell lung cancer (ID1346)
© Pfizer (2018). All rights reserved Page 104 of 388
XXXXXXX29XXXXXXXXXXXXXXXXXXXXXXXXXXXXXXXXXXXXXXXXXXXXXXXXXXXXXXXXXXXXXXXXXXXXXXXXXXXXXX
Abbreviations: KM = Kaplan-Meier.
Given the low number of patient at risk beyond 24 months (7 patients), external data
was considered to provide further evidence for the most appropriate extrapolation.
Two studies identified in the SLR reported median follow-up greater than ARCHER
1050. Two-year and three-year rates of 5% and 1-2% were observed for gefitinib,
respectively in LUX-Lung 7 in contrast to 12% and 6% in WJTOG 3405.63,82 One
additional study was identified in a targeted literature search.24 It was a single arm
observational study from one centre so was potentially subject to bias and only
included 67% first line patients. However, it required a minimum follow-up of 5 years
if patients were alive at the time of analysis. Therefore, it provided the only fully
complete gefitinib/erlotinib EGFR+ NSCLC KM data up to 5 years. The three-, four-
and five-year PFS rates were 8%, 3% and 0% respectively. Therefore, considering
the data from LUX-Lung 7 which was the most relevant study as it was included in
the NMA the generalised gamma was the most appropriate distibution. This was also
reinforced by the Lin study.24 Nonetheless, the WJTOG 3405 study demonstrated
that a very small proportion of patients can experience prolonged PFS, which
provided some evidence that the long tails of the log-logistic and log-normal were
potentially plausible.82

Company evidence submission for dacomitinib for untreated EGFR-positive non-small-cell lung cancer (ID1346)
© Pfizer (2018). All rights reserved Page 105 of 388
Based on the above considerations, the generalised gamma was applied in the
base-case analysis as it had one of the best statistical fits; it had a good visual fit to
the observed data; it produced a mean PFS in the middle of the range of the
distributions, aligning with clinician feedback and it predicted three, four and five year
landmark rates aligned with the best available external literature (relevance to the
decision problem and lack of censoring). The log-normal was considered in scenario
analysis, as it provided the lowest mean of the logarithmic distribution which had
plausible visual fits to the observed data and predicted 5 year rates in line with
clinician opinion and one of the external studies.
The remaining four distributions were considered to provide inferior predictions for
the following reasons:
Weibull: very similar prediction to the generalised gamma, however, it had a
slightly lower mean which was not reflective of the clinician feedback
Log-logistic: despite providing the best statistical fit to the observed data it
was not included as it predicted a higher mean than the log-normal
Gompertz: second worst statistical fit and predicted the lowest mean
Exponential: worst statistical fit and very poor visual fit
B.3.3.2.2 Comparators (dacomitinib, afatinib, erlotinib)
As previously discussed, curves for dacomitinib, afatinib and erlotinib were
generated by taking the gefitinib extrapolation and applying the time-varying hazard
ratios estimated from the FP model. These comparative curves are presented
against the base-case gefitinib curve in XXXXXXX30. A scenario analysis is also
presented against the log-normal curve fitted to gefitinib (XXXXXXX30). Details of
the FP approach are provided in Section B.2.9 and Appendix D.

Company evidence submission for dacomitinib for untreated EGFR-positive non-small-cell lung cancer (ID1346)
© Pfizer (2018). All rights reserved Page 106 of 388
XXXXXXX30XXXXXXXXXXXXXXXXXXXXXXXXXXXXXXXXXXXXXXXXXXXXXXXXXXXXXXXXXXXXXXXXXXXXXXXXXXXXXXXXXXXXXXXXXXX
Abbreviations: KM = Kaplan-Meier.
The extrapolated curve of dacomitinib follows the survival observed in ARCHER
1050 closely (the median PFS in the trial and the model are 14.7 and 14.5 months,
respectively).
B.3.3.3 Overall Survival
B.3.3.3.1 Gefitinib
The steps taken to identify the preferred distribution for PFS (Section B.3.3.1.2) were
repeated for OS. As with PFS, distributions were fitted to gefitinib as the ‘base’
curve, against which comparative estimates for the other treatments were generated.
The AIC/BIC (Table 33) indicated the log-logistic and generalised gamma provided
the best fits the observed data. However, given the maturity of the observed OS
data, the statistical fit may not be as informative as it was for PFS, noting it may be
more reliable to judge best fit based on the clinical plausibility of the extrapolation.
Table 33. Goodness-of-Fit Statistics (OS)
Distribution AIC BIC Mean MedianProportion PF at 2 years 3 years 5 years
Exponential 488.64 492.06 XXXXX XXXXX XXXXX XXXXX XXXXX
Weibull 461.29 468.12 XXXXX XXXXX XXXXX XXXXX XXXXX

Company evidence submission for dacomitinib for untreated EGFR-positive non-small-cell lung cancer (ID1346)
© Pfizer (2018). All rights reserved Page 107 of 388
Gompertz 474.30 481.14 XXXXX XXXXX XXXXX XXXXX XXXXX
Log-logistic 455.76 462.59 XXXXX XXXXX XXXXX XXXXX XXXXX
Log-normal 463.23 470.06 XXXXX XXXXX XXXXX XXXXX XXXXX
Generalised gamma 460.69 470.94 XXXXX XXXXX XXXXX XXXXX XXXXX
ARCHER 1050 - - - 26.84 41.7% - - Abbreviations: AIC = Akaike Information Criterion; BIC = Bayesian Information Criterion
All distributions provided similar visual fits to the observed KM data (XXXXXXX31)
with predicted medians close to the observed data, with the exception of the
exponential which substantially underestimated the observed data for approximately
the first 18 months. Beyond the end of the observed data both the exponential and
logarithmic distributions (log-logistic and log-normal) produced much higher tails than
the other distributions.
Clinical expert opinion suggested that long-term predictions generated by the log-
logistic, log-normal, and exponential distributions were implausibly high. In contrast,
predictions with Weibull and Gompertz distributions were thought to underestimate
long-term survival. All the consulted clinical expert opinion centred on the
generalised gamma as providing the most plausible estimates, noting that only a
small proportion are expected to be alive beyond 10 years.
XXXXXXX31XXXXXXXXXXXXXXXXXXXXXXXXXXXXXXXXXXXXXXXXXXXXXXXXXXXXXXXXXXXX
Abbreviations: KM = Kaplan-Meier.

Company evidence submission for dacomitinib for untreated EGFR-positive non-small-cell lung cancer (ID1346)
© Pfizer (2018). All rights reserved Page 108 of 388
As with PFS, external data was also considered in the selection of the most plausible
model. LUX-Lung 7 only had 7 patients at risk beyond 45 months therefore; WJTOG
3405 and Lin 2016 provided the only long-term data for validation.24,63,82 Their
respective three-year rates of ~39% and ~48% were aligned with those observed in
ARCHER 1050 (42%). Five-year rates were ~21% and ~15% for WJTOG 3405 and
Lin 2016, respectively, suggesting the generalised gamma, log-logistic and log-
normal provided plausible five-year rates. The six- and seven-year rates were
identical 11% and 7% between the two studies and only Lin 2016 reported up to 8
years (0%). Therefore, the generalised gamma was deemed the most closely
aligned to the long-term external data.
Consequently, the generalised gamma was applied in the base-case analysis as it
had one of the best statistical fits; it had a good visual fit to the observed data;
consulted clinical expert opinion centred on the distribution and it predicted five to
eight rates aligned with the available external literature. The log-logistic was
considered in scenario analysis, as it provided the lowest mean of the logarithmic
distributions which had plausible visual fits to the observed data and predicted 5 year
rates in line with the external studies.
The remaining four distributions were considered to provide inferior predictions for
the following reasons:
Weibull: despite providing the best statistical fit it had a lower mean than the
generalised gamma which was not reflective of the external literature and
clinician feedback
Log-normal: it was not included as it predicted a higher mean than the log-
logistic
Gompertz: second worst statistical fit and predicted the lowest mean which
was considered implausible during clinician feedback
Exponential: worst statistical fit and very poor visual fit

Company evidence submission for dacomitinib for untreated EGFR-positive non-small-cell lung cancer (ID1346)
© Pfizer (2018). All rights reserved Page 109 of 388
B.3.3.3.2 Comparators (dacomitinib, afatinib, erlotinib)
As with PFS, comparator curves were generated using the gefitinib extrapolation for
OS (the generalised gamma) and applying the time-varying hazard ratios estimated
from the base-case FP model. These are presented for the base-case against the
observed dacomitinib and gefitinib from ARCHER 1050 in XXXXXXX32. As with
PFS, the efficacy of erlotinib was assumed to be equal to the efficacy of gefitinib (see
section B.2.9).
XXXXXXX32XXXXXXXXXXXXXXXXXXXXXXXXXXXXXXXXXXXXXXXXXXXXXXXXXXXXXXXXXXXXXXXXXXXXXXXXXXXXXXXXXXXX
Abbreviations: KM = Kaplan-Meier.
The median OS of dacomitinib of 34 months in ARCHER 1050 is reflected well in the
extrapolation which estimates the median OS of 33.0 months.
B.3.3.4 Treatment Discontinuation
Despite data being available from ARCHER 1050, time to treatment discontinuation
(TTD) was not used to determine treatment duration because it was not available for
all the other comparators. In order to address this inconsistency, all patients were
assumed to be treated until progression, with PFS being used as a proxy for
treatment duration. This assumption was supported by the minimal difference
observed in the 24 month restricted means between TTD and PFS (IRC) of XXXX
Company evidence submission for dacomitinib for untreated EGFR-positive non-small-cell lung cancer (ID1346)
© Pfizer (2018). All rights reserved Page 110 of 388
months for dacomitinib. In contrast, the restricted mean of TTD for gefitinib was
XXXX months greater than PFS (IRC); therefore it was conservative to assume that
PFS was a proxy for TTD. Despite the limitations associated with medians as a
proxy for the average, a scenario analysis was used to explore the impact of this
assumption which incorporated the difference between median PFS and TTD from
ARCHER 1050 and LUX-Lung 79 as a one-off cost upon progression.
B.3.4 Measurement and valuation of health effects Utility values were applied to both health states in the model (PFS, PD) to capture
patient QoL associated with treatment and disease outcomes. The recent NICE
position statement prefers utility values to be derived from EuroQoL Five-Dimension
Three Level (EQ-5D-3L)83 which is consistent with the measurement tool used in the
ARCHER 1050 trial; hence no mapping or cross-walk was required. Trial data were
preferred as a source of utility inputs given that this allowed utility and efficacy data
to be derived from the same population.
B.3.4.1 Health-related quality-of-life data from clinical trials
EQ-5D-3L assessments were made at the following time points as per the ARCHER
1050 trial protocol: day 1 – cycle 1 which provided the baseline assessment of
PROs, days 8 and 15 of cycle 1 and at the beginning of each cycle afterwards (up to
a total of 41 cycles), at the end of treatment and at a single post progression follow-
up. Treatment specific utilities were calculated using UK utility population weights.84
To account for the autocorrelation between repeated measures from individuals, a
repeated measures mixed-effects model was applied to the utility scores. The model
had an intercept term, a linear time trend term, a term for treatment group, a term for
baseline covariate and a term for treatment-by-time interaction. The intercept and
slope terms for time were random effects with an assumed unstructured
variance/covariance matrix. In addition, each observation was assumed to be
measured with error and the error terms are independent of each other. A sandwich
estimator was used to estimate the variance of the fixed effects terms. The Kenward-
Roger procedure was used to adjust for the degrees of freedom. All parameter
estimates were obtained using restricted maximum likelihood estimation.
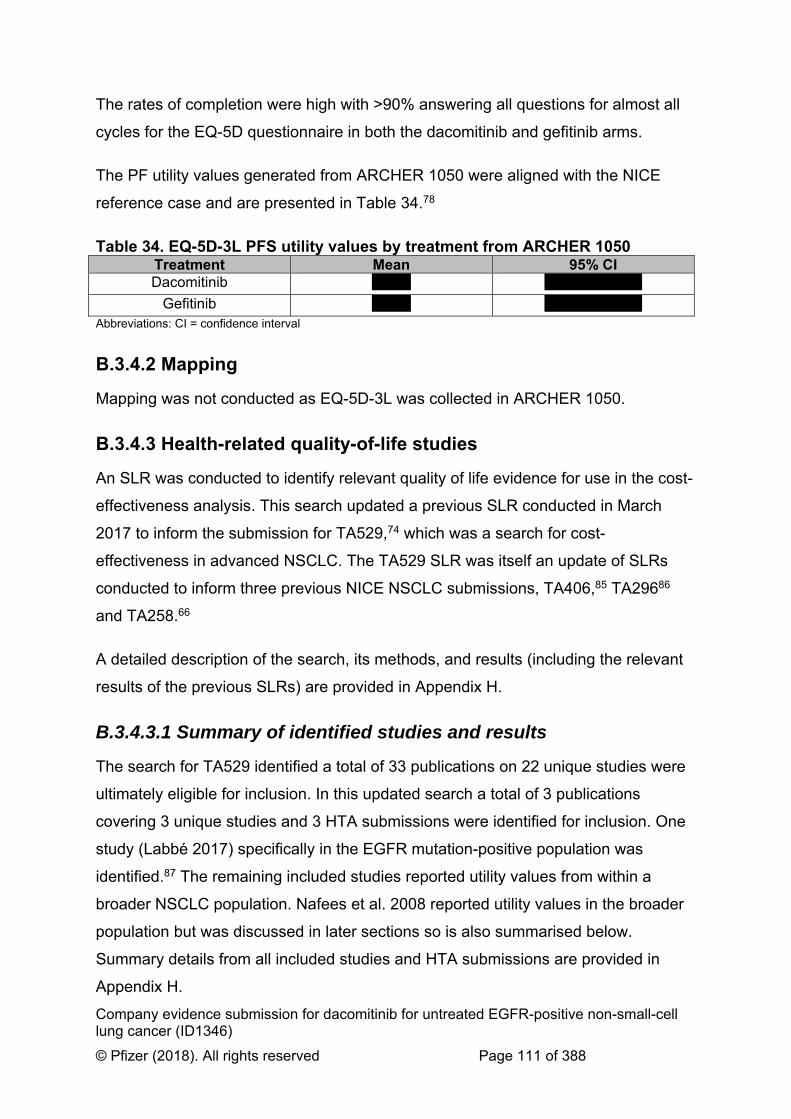
Company evidence submission for dacomitinib for untreated EGFR-positive non-small-cell lung cancer (ID1346)
© Pfizer (2018). All rights reserved Page 111 of 388
The rates of completion were high with >90% answering all questions for almost all
cycles for the EQ-5D questionnaire in both the dacomitinib and gefitinib arms.
The PF utility values generated from ARCHER 1050 were aligned with the NICE
reference case and are presented in Table 34.78
Table 34. EQ-5D-3L PFS utility values by treatment from ARCHER 1050 Treatment Mean 95% CI Dacomitinib XXXX XXXXXXXXXX
Gefitinib XXXX XXXXXXXXXX Abbreviations: CI = confidence interval
B.3.4.2 Mapping
Mapping was not conducted as EQ-5D-3L was collected in ARCHER 1050.
B.3.4.3 Health-related quality-of-life studies
An SLR was conducted to identify relevant quality of life evidence for use in the cost-
effectiveness analysis. This search updated a previous SLR conducted in March
2017 to inform the submission for TA529,74 which was a search for cost-
effectiveness in advanced NSCLC. The TA529 SLR was itself an update of SLRs
conducted to inform three previous NICE NSCLC submissions, TA406,85 TA29686
and TA258.66
A detailed description of the search, its methods, and results (including the relevant
results of the previous SLRs) are provided in Appendix H.
B.3.4.3.1 Summary of identified studies and results
The search for TA529 identified a total of 33 publications on 22 unique studies were
ultimately eligible for inclusion. In this updated search a total of 3 publications
covering 3 unique studies and 3 HTA submissions were identified for inclusion. One
study (Labbé 2017) specifically in the EGFR mutation-positive population was
identified.87 The remaining included studies reported utility values from within a
broader NSCLC population. Nafees et al. 2008 reported utility values in the broader
population but was discussed in later sections so is also summarised below.
Summary details from all included studies and HTA submissions are provided in
Appendix H.

Company evidence submission for dacomitinib for untreated EGFR-positive non-small-cell lung cancer (ID1346)
© Pfizer (2018). All rights reserved Page 112 of 388
Nafees et al. 200888 aimed to elicit UK-based societal utility values for various stages
of NSCLC and grade III-IV toxicities associated with treatment. The base
questionnaire was adapted from a previously existing metastatic breast cancer
health state questionnaire; revised to describe metastatic NSCLC patients receiving
second-line treatment and was validated by clinical experts. Standard gamble
interviews were used to derive health state utility scores in a sample of 100 members
of the general UK public. Utility values were associated with stable disease and no
side effects: 0.653; and with progressive disease: 0.473.
Labbé et al. 201787 aimed to evaluate EuroQol five dimensions (three level version;
EQ-5D-3L)-derived health state utility scores using a longitudinal cohort of Canadian
outpatients diagnosed with metastatic lung cancer across various disease states
(EGFR, anaplastic lymphoma kinase [ALK], SCLC, wild-type NSCLC). Follow-up
among patients varied, with a median of 12 months (range: 0-201 months) post-
diagnosis. Utility values for the EGFR population using UK preference weights were:
stable on most appropriate treatment (TKI): 0.77±0.02; progressive disease:
0.64±0.03.
B.3.4.4 Adverse reactions
In line with previous submissions, the impact on costs and HRQoL associated with
treatment-related AEs (of Grade 3 or higher that occurred in >5% of patients in at
least one treatment of interest) were considered in the model.77,85,89 It was assumed
that Grade 1/2 AEs had negligible impact on costs and HRQoL; these were therefore
excluded. The probability of incurring an AE for dacomitinib and geftinib (and
erlotinib) was taken from ARCHER 1050. For afatinib, the incidences of AEs were
taken from LUX-Lung 7.63 Table 35 includes the final list of AEs that meet the criteria
used and are applied in the model.

Company evidence submission for dacomitinib for untreated EGFR-positive non-small-cell lung cancer (ID1346)
© Pfizer (2018). All rights reserved Page 113 of 388
Table 35. List of adverse events included in the model
Adverse event Dacomitinib
(n=227)40 Gefitinib (n=224)40
Afatinib (n=160)63
Erlotinib*
ALT increased 2 (0.9%) 18 (8.0%) 0 (0.0%) 18 (8.0%) Diarrhoea 18 (7.9%) 1 (0.4%) 21 (13.1%) 1 (0.4%) Fatigue 0 (0.0%) 0 (0.0%) 9 (5.6%) 0 (0.0%) Paronychia 17 (7.5%) 3 (1.3%) 3 (1.9%) 3 (1.3%) Rash (grouped term) 55 (24.2%) 1 (0.4%) 15 (9.4%) 1 (0.4%) *Erlotinib assumed equivalent to gefitinib (see Section B.2.9.1)
Within the base-case, AE disutility’s were not included to avoid double counting as
the treatment specific PF values were assumed to already capture the effect of any
AEs as these were informed by the trial data. A scenario analysis was included to
explore the impact of including a one-off utility decrement which was calculated by
multiplying the disutility with the anticipated duration of the event and the probability
of the event occurring. The disutility was then summed across all AEs experienced
and applied in the first cycle of the model. A summary of these inputs is provided in
Table 36.
Table 36. Adverse event utility decrements and durations
Adverse event
Utility decrement
(SE) Source/assumption
Duration (days
[range])
Source/ assumption
ALT increased
0
Assumed zero; laboratory findings only with no hospitalisation or symptoms indicated90
- -
Diarrhoea -0.147 (0.045)
Derived from EQ-5D with UK values set from LUX-Lung 329
6.6 (5.95-7.25)
Derived from LUX-Lung 329
Fatigue -0.179 (0.053)
Derived from EQ-5D with UK values set from LUX-Lung 129
32.0 (27.76-36.24)
Derived from LUX-Lung 129
Paronychia -0.202 (0.028)
Assumed equal to rash 12.3
(11,51-13.09)
Assumed equal to rash
Rash (grouped term)
-0.202 (0.028)
Derived from EQ-5D with UK values set from LUX-Lung 329
12.3 (11,51-13.09)
Derived from LUX-Lung 329
Abbreviations: EQ-5D = European Quality of Life-5 Dimensions; SE = standard error.

Company evidence submission for dacomitinib for untreated EGFR-positive non-small-cell lung cancer (ID1346)
© Pfizer (2018). All rights reserved Page 114 of 388
B.3.4.5 Health-related quality-of-life data used in the cost-
effectiveness analysis
The PF utilities applied in the base-case model were from ARCHER 1050 given that
it conformed to the NICE reference case. There was a statistically significant
difference observed in EQ-5D between the dacomitinib and the gefitinib arms;
however the utility difference observed in ARCHER 1050 was smaller than minimally
important differences in EQ-5D reported in previous studies in oncology.40,91,92
Despite the insignificant clinical difference, treatment specific utilities were
considered in the analysis to avoid omitting the observed statistical difference and
therefore bias the results in favor of dacomitinib.
Given that treatment specific values have not been applied frequently in previous
NSCLC appraisals, a scenario was included which applied the non-treatment specific
PF values from ARCHER 1050 (XXXX) with one-off disutility’s for adverse events
applied.
Values derived from ARCHER 1050 were slightly higher than those observed in
LUX-Lung 7 (0.77 afatinib and 0.80 gefitinib) and LUX-Lung 3 (0.784) which
represents the only identified EQ-5D values derived in RCTs of EGFR+ NSCLC
patients.9,29 These values were also aligned with the only real world EGFR+ NSCLC
value identified in the SLR (Labbé et al. 2017 [0.77]), therefore this value was
applied in scenario analysis.
Assumptions were made for the utility value for the other comparators given that they
were not included in ARCHER 1050. The afatinib PF utility was assumed to be equal
to dacomitinib based on their similar safety profiles, while erlotinib was set to be
equal to the utility observed with gefitinib, given the assumption of equivalent efficacy
and safety (see Section B.2.9.1).
Given that EQ-5D was not collected beyond progression in ARCHER 1050, the PD
utility was sourced from the literature. Labbé et al. identified in the SLR (see section
B.3.4.3.1 for further detail) reported a PD utility value of 0.64 and was applied in the
base-case analysis. This value was also aligned with the PD value from the LUME-
Lung 1 study applied in TA347 and subsequently recommended by the ERG in

Company evidence submission for dacomitinib for untreated EGFR-positive non-small-cell lung cancer (ID1346)
© Pfizer (2018). All rights reserved Page 115 of 388
TA416.79,93 Although the LUME-Lung 1 study was not in EGFR+ NSCLC, it collected
EQ-5D in a RCT with NSCLC patients and derived the values with the UK utility
weights. Therefore, 0.64 was considered the most appropriate values for the PD
state. The Evidence Review Group (ERG) in TA416 also suggested the value from
Nafees 88(see section B.3.4.3.1 for further details). This study did not meet the NICE
reference case as it did not use EQ-5D or derive values from patients, so was not
considered a robust source. In addition, a recent repeated of this study by Nafees et
al.94 that was identified in the SLR, reported a PF value of 0.883 and PD of 0.166,
which further demonstrates the unreliability of the original Nafees study.
Table 37. Summary of utility values for cost-effectiveness analysis
State
Utility value: mean
(standard error)
95% confidence
interval
Reference in submission
Justification
Progression-free – Dacomitinib
XXXX XXXXXXX
B.3.4.1
Pre-progression utilities were sources from the pivotal trial in line with the NICE reference case.
For comparators values were assumed equal based on the similarity of safety profiles.
Progression-free – Gefitinib
XXXX XXXXXXX
Progression-free – Afatinib
XXXX XXXXXXX
Progression free – Erlotinib
XXXX XXXXXXX
Progressed disease
0.64 (0.03) NR B.3.4.3.1
Based on the results of the SLR (see section B.3.4.3) the study by Labbé provided the most appropriate values for this analysis.
Abbreviations: NICE = National Institute for Health and Care Excellence; NR = not reported; SLR =
systematic literature review.
B.3.5 Cost and healthcare resource use identification, measurement and valuation The following cost categories were included in the model:
First line treatment costs consisting of drug acquisition, drug administration,
and AE costs. All primary treatments were administrated orally; therefore, the
monthly treatment cost was based on unit price (per mg) and recommended
dosing regimen (mg), in addition to the associated administration cost.

Company evidence submission for dacomitinib for untreated EGFR-positive non-small-cell lung cancer (ID1346)
© Pfizer (2018). All rights reserved Page 116 of 388
Treatment related AE costs were included based on the impact of treatment-
related Grade 3 or higher AEs.
Subsequent treatment costs were applied upon progression and were
calculated assuming a basket of treatments. Akin to first line treatment costs,
they included drug acquisition costs and administration costs. However,
treatment-related AE costs were not included for subsequent treatments.
Disease management costs were equivalent across treatments and were
health state specific (PF and PD).
Terminal care costs were applied as a one-off cost upon death.
A relevant SLR was previously conducted in March 2017 to inform the submission
for TA529 which was to search for general costs and resource use from a UK NHS
perspective associated with advanced NSCLC. This update was conducted to
identify new relevant literature published since the last search (17 March 2017) on
01 August 2018, refer to Appendix I for more details.
B.3.5.1 Intervention and comparators’ costs and resource use
A summary of dosing information used to inform intervention and comparator costs is
presented in Table 38. Dosing information was derived from the respective SmPC for
each comparator.33,59,95,96
Drug acquisition costs in the base-case have been calculated assuming list prices for
all drugs (see Table 38 below).

Company evidence submission for dacomitinib for untreated EGFR-positive non-small-cell lung cancer (ID1346)
© Pfizer (2018). All rights reserved Page 117 of 388
Table 38. Unit costs of interventions and comparators
Treatment Dosing Schedule Strength Pack size
Package Price (£)
Cost per model
cycle (£)
Dacomitinib 45 mg once daily, orally33 45 mg 30 XXXXXXX XXXXXXX
Gefitinib 250 mg once daily,
orally59 250 mg 30 £2,167.71 £2,023.20
Afatinib 40 mg once daily, orally95 40 mg 28 £2,023.28 £2,023.28
Erlotinib 150 mg once daily,
orally96 150 mg 30 £1,631.53 £1,522.76
Source: BNF. Access date: Jun 20, 2018 Abbreviations: BNF = British National Formulary.
Dose intensity was not applied in the model as all first-line treatments in the model
were oral therapies, therefore missed doses would be unlikely to result in cost
savings. In addition, dose intensity data for comparator treatments were not
available.
All primary treatments were oral therapies and did not require hospital
administration. Therefore, administration costs consisted of a dispensing fee only. A
dispensing fee of £9.40 per administration was applied to each treatment which
included 12 minutes of hospital pharmacist time (Hospital pharmacist [Band 6];
radiographer cost per working hour [£47]) in line with previous NSCLC
appraisals.74,75,77,85,97,98
B.3.5.2 Subsequent treatment costs
The cost of second- and third-line treatments was applied upon progression. The
composition of subsequent treatments was informed by clinical expert opinion99 and
Sequist 2017.100 In the second-line it was assumed that approximately 60% of
patients would develop the T790M mutation when treated with first- or second-
generation TKIs.101 The majority of these patients would receive osimertinib;
however, a small proportion of patients would not be diagnosed as T790M positive
due to false negative tests or difficulties with obtaining a sample for biopsy. All other
patients would receive platinum doublet chemotherapy (PDC). For patients that
received third-line treatment, those that received osimertinib second-line would go on
to receive PDC and those that had PDC in the second-line would subsequently have
docetaxel. Given that some patients would be unable or unwilling to receive
subsequent therapy it was assumed that 71% and 48% of patients received second-

Company evidence submission for dacomitinib for untreated EGFR-positive non-small-cell lung cancer (ID1346)
© Pfizer (2018). All rights reserved Page 118 of 388
and third-line treatment, respectively.100 The second- and third-line treatment
proportions are presented in Table 39.
Table 39. Second- and third-line treatment basket compositions Second-line treatments Share of
patients Third-line treatments Share of
patients
Osimertinib 56% PDC 56%
PDC 44% Docetaxel 44%
Docetaxel 0% - -
Proportion receiving second-line treatment
71% Proportion receiving third-line treatment
48%
Abbreviations: PDC = platinum doublet chemotherapy.
The average duration of subsequent second- and third-line treatments was
converted to reflect the 28-day model cycle (reported in cycles, in Table 40). The
reported median duration of time on treatment for second-line treatment of PDC was
sourced from Sequist 2017 and the duration of osimertinib was derived from the
larger and more recent AURA3 trial.100,102 Third-line therapy durations for PDC and
docetaxel were sourced from Sequist 2017.100
Table 40 Median duration in cycles of second-line and third-line treatment
Treatments Duration (months)
Duration (# of model cycles)
Source
Second-line treatment Osimertinib 8.1 8.81 Mok 2017102
Platinum based CT 2.90 3.15 Sequist 2017100
Single agent CT 1.40 1.52 Sequist 2017100
Third-line treatment
Platinum based CT 2.50* 2.72 Sequist 2017100
Single agent CT 2.50 2.72 Sequist 2017100 *Assumed the same as single agent CT. Abbreviations: CT = chemotherapy.
The acquisition costs for subsequent treatments are presented in Table 41. Dosing
regimens were source from their respective SmPCs.103-105 Dose calculations for PDC
and docetaxel assumed a body surface area (BSA) of 1.75m2 (weighted average by
gender [from ARCHER 1050 40%/60%40] of males 1.89m2 and females 1.65m2 from
Sacco106 which was previously recommended by an ERG68). PDC consisted of a
combination of pemetrexed plus cisplatin or pemetrexed plus carboplatin. Cisplatin
was assumed to be given to 54% of the patients in combination with pemetrexed
while the remainder would receive carboplatin and pemetrexed.107

Company evidence submission for dacomitinib for untreated EGFR-positive non-small-cell lung cancer (ID1346)
© Pfizer (2018). All rights reserved Page 119 of 388
Osimertinib was administered orally; therefore the administration cost consisted of a
dispensing fee only. Administration costs for IV therapies were include in line with
infusion time from their respective SmPCs and are presented in Table 42. 103-105
Table 41 Acquisition cost of subsequent therapies
Table 42 Administration cost of subsequent therapies Treatment Administr
ation method
IV infusion time
Cost per administration
Source
Osimertinib Oral - £9.40 PSSRU 201797
PDC Pemetrexed with carboplatin
IV 15-60 minutes
£241.07 SB12Z; Deliver Simple Parenteral Chemotherapy at First Attendance110
Pemetrexed with cisplatin
IV 160 minutes
£355.54 SB14Z; Deliver Complex Chemotherapy, including Prolonged Infusional Treatment, at First Attendance110
Docetaxel IV 60 minutes
£241.07 SB12Z; Deliver Simple Parenteral Chemotherapy at First Attendance110
Abbreviations: IV = intravenous
B.3.5.3 Health-state unit costs and resource use
Resource usage for the disease management costs in the PF and PD states were
based on values from TA29686 (now TA422111) which used values from TA162112
and TA25866 (Table 43). These estimates were viewed as the best available
Treatment Dosing Schedule
Strength Package size
Package Price (£)
Cost per model cycle (£)
Osimertinib 80 mg once daily
80 mg 30 £5,770.00108 £5,385.33
Pemetrexed 500 mg/m2 every 21 days
500 mg 1 vial £800.00109 £1,866.67
Carboplatin 400 mg/m2
every 21 days
450 mg/45 ml
1 vial £18.73109 £38.85
Cisplatin 75 mg/m2 every 21 days
50 mg/50 ml 1 vial £4.48109 £15.68
Docetaxel 75 mg/m2 every 21 days
80 mg/4 ml 1 vial £14.74109 £32.34

Company evidence submission for dacomitinib for untreated EGFR-positive non-small-cell lung cancer (ID1346)
© Pfizer (2018). All rights reserved Page 120 of 388
estimates in the literature as they were informed by expert opinion (5 top UK
clinicians specialising in the treatment of NSCLC), have been subject to review by
NICE ERGs and appraisal committees on an additional four occasions74,85,89,98. Unit
costs were derived from the National Schedule of Reference Costs for 2016/2017
and PSSRU 2017.97,110
A one-off cost of £4,593 for terminal care was incurred at death to account for the
additional resource usage in the months prior to death. This cost was based on
resource usage from Brown et al. 2013113 (calculations are presented in Table 44),
which has been utilised during eight previous NSCLC appraisals68,70,75,76,114-117.

Company evidence submission for dacomitinib for untreated EGFR-positive non-small-cell lung cancer (ID1346)
© Pfizer (2018). All rights reserved Page 121 of 388
Table 43. List of health states and associated costs in the economic model
Abbreviations: CT = computerised tomography; GP = general practitioner.
Items Use in model Unit cost97,110
Progression-free survival Progressed disease
Frequency Frequency per model cycle
Frequency per cycle
% of patients
Outpatient visit Medical Oncology - Non-Admitted Face-to-Face Attendance, Follow-up
£172.67 0.75 visits per month
0.69 1 visit per month
0.92
GP visit GP per surgery consultation lasting 9.22 minutes
£38.00 10% patients; 1 per month
0.09 28% patients 1 per month
0.26
Cancer nurse
N10AF: Specialist Nursing, Cancer Related, Adult, Face to face
£82.09
20% of patients; receive 1 per month
0.18 10% patients 1 per month
0.09
Complete Blood Count
DAPS05: Haematology £3.06 0.75 per month 0.69 1 per month 0.92
Biochemistry DAPS04: Clinical Biochemistry £1.13 0.75 per month 0.69 1 per month 0.92
CT scan (other) RD26Z: Computerised Tomography Scan of Three Areas, with Contrast (outpatient)
£122.51 30% patients; 0.75 per month
0.21 5% patients 0.75 per month
0.03
Chest X-ray DAPF: Direct Access Plain Film
£29.78 0.75 per month 0.69 30% patients 0.75 per month
0.21
Total cost per 28 day cycle £186.53 £190.43

Company evidence submission for dacomitinib for untreated EGFR-positive non-small-cell lung cancer (ID1346)
© Pfizer (2018). All rights reserved Page 122 of 388
Table 44. Details of terminal care cost calculation Setting % of
patients in each care setting
Resource Unit cost Consumption of resource
Cost Assumptions/references
Home 27.3%
Community nurse visit
£67.00 28 hours
£5,285.96
PSSRU 2017: Cost per hour Band 8a97
GP Home visit
£93.60 7.00 visits PSSRU 2017: GP per minute of patient time £4.00;97PSSRU 2015: 11.4 minutes home visit and 12 minutes travel time per visit118
Macmillan nurse visit
£44.69 50 hours Cost assumed to be 66.7% of community nurse cost.113
Drugs and equipment
£520.31 Average drug and equipment
Cost from Brown et al. and uplifted using the PSSRU inflation indices.97,113
Hospital 55.80% £4,094.43 9.66 days £4,094.43
NHS reference costs 2016/2017 – non-elective long-stay weighted sum of HRG code DZ17S Respiratory Neoplasms without Interventions, with CC Score 13+. Assumed additional 0.92 excess days in line with Brown et al. 2013 using NHS reference cost weighted sum of non-elective excess days (DZ17S)110
Hospice 16.90% £5,118.04 £5,118.04 Assumption - 1.25 x hospital stay cost.113
Total cost per event £4,592.71 Abbreviations: PSSRU = Personal Social Services Research Unit.

Company evidence submission template for dacomitinib for untreated EGFR-positive non-small-cell lung cancer (ID1346)
© Pfizer (2018). All rights reserved Page 123 of 388
B.3.5.4 Adverse reaction unit costs and resource use
In line with previous submissions, costs associated with AEs (of Grade 3 or higher
that occurred in >5% of patients in at least one treatment of interest) are included
within the model (Table 35; Section B.3.4.4).77,85,89 These costs are applied as a
one-off cost in the first cycle of the model. Unit costs for each event were calculated
using HRG codes from previous appraisals and updated using the latest NHS
reference costs (Table 45).110 The total cost of AEs for each treatment is presented
in Table 46.
Table 45. Cost of treating adverse events
Adverse event Cost per
event Details/source
ALT increased £0 Assumed zero; laboratory findings only with no hospitalisation or symptoms indicated in CTCAE v4.03 guidelines90
Diarrhoea £462.08 FD01F-J Gastrointestinal Infections without Interventions, with CC Score 0-8+ (Non-elective, short stay [weighted average])
Fatigue £592.48 SA01G-K Acquired Pure Red Cell Aplasia or Other Aplastic Anaemia, with CC Score 0-8+ (Non-elective, short stay [weighted average])
Paronychia £436.17 Assumed same as rash
Rash (grouped term)
£436.17 JD07E-K Skin Disorders without Interventions, with CC Score 0-19+ (Non-elective, short stay [weighted average])
Table 46. Total cost of treating adverse events by treatment Treatments Management Cost
Dacomitinib £175
Gefitinib £10
Afatinib £143
Erlotinib £10
B.3.5.5 Miscellaneous unit costs and resource use
No additional costs were included in the model.

Company evidence submission template for dacomitinib for untreated EGFR-positive non-small-cell lung cancer (ID1346)
© Pfizer (2018). All rights reserved Page 124 of 388
B.3.6 Summary of base-case analysis inputs and assumptions
B.3.6.1 Summary of base-case analysis inputs
All model inputs applied in the base-case and sensitivity analyses are summarised
in Error! Reference source not found. (Appendix L).
B.3.6.2 Assumptions
A summary of key assumptions is provided in Table 47.
Table 47. Summary of assumptions applied in the economic model Area Assumption Justification
Model
Time horizon 15 years
Aligned with the maximum life expectancy of the cohort predicted by the base-case parametric survival analysis (<1% alive at 15 years) (see section B.3.3.1.3)
Population EGFR+ NSCLC
Population identical to the ARCHER 1050 phase III clinical study, in line with the scope of the current appraisal and with the expected EMA marketing authorisation.
Comparators Afatinib, erlotinib, gefitinib In line with the NICE scope
Model Structure Partitioned survival
Captures the chronic nature of the condition and two of the key objectives of treatment in NSCLC, namely avoiding disease progression and prolonging life. Commonly used in previous oncology NICE appraisals, including NSCLC
Cycle length Four-week (28-day)
Aligns with the schedule of the ARCHER 1050 trial, captures differences in dosing on a monthly basis.
Half cycle correction
Acquisition and administration costs of oral treatments are not half-cycle corrected
Oral treatments were assumed to be dispensed at the beginning of the cycle

Company evidence submission template for dacomitinib for untreated EGFR-positive non-small-cell lung cancer (ID1346)
© Pfizer (2018). All rights reserved Page 125 of 388
Survival
Erlotinib equivalent to gefitinib
Erlotinib was assumed to have equal efficacy (PFS and OS) and safety to geftinib
In line with previous NICE and SMC committee conclusions and the supporting data from the recent RCT subgroup analysis,.
Proportional hazards assumption
Proportional hazards was assumed to be potentially violated for PFS and OS
Given potential violation in at least one trial in the network (tested using log cumulative hazard plots and Schoenfeld residuals) a FP NMA was utilised to allow hazards to vary over time in the base-case analysis. A traditional ITC was also explored in a sensitivity analysis.
Utility
Progression-free health state utility value
PF utility values were assumed to be treatment specific
ARCHER 1050 collected EQ-5D aligned with the NICE reference case. There was a statistically significant difference observed between dacomitinib and gefitinib in EQ-5D, however it did not exceed a minimally important difference. Therefore, a conservative assumption was made to apply treatment specific utilities in the base-case and a single non-treatment value was explored in scenario analysis.
Disutility due to adverse events
Disutility due to adverse events was not included in the base-case model
Given that treatment specific values were applied in the base-case that are elicited from the EQ-5D on treatment (thus capturing disutilities on treatment), it was considered that including separate disutilities for adverse events would be double counting. A one-off disutility was explored in scenario analysis.
Costs
Duration of treatment
PFS was assumed a suitable proxy for TTD
Despite a post hoc analysis of TTD being available from ARCHER 1050, it was not available for all the other comparators. This was a conservative assumption given that TTD was observed to closely follow PFS for dacomitinib in

Company evidence submission template for dacomitinib for untreated EGFR-positive non-small-cell lung cancer (ID1346)
© Pfizer (2018). All rights reserved Page 126 of 388
Abbreviations: EMA = European Medicines Agency; FP = fractional polynomial; ITC = indirect treatment
comparison; NICE = National Institute for Health and Care Excellence; NMA = network meta-analysis; NSCLC =
non-small cell lung cancer; OS = overall survival; PDC = platinum doublet chemotherapy; PF = progression-free;
RCT = randomised controlled trial; RDI = relative dose intensity; SMC = Scottish Medicines Consortium; TTD =
time-to-treatment discontinuation
B.3.7 Base-case results
B.3.7.1 Base-case incremental cost-effectiveness analysis results
The base-case results are presented in Table 48. Gefitinib was the first EGFR TKI
to be appraised by NICE. The manufacturer offered a complex PAS (a cost of
£12,200 applied on receipt of the third monthly pack) which was considered in our
base-case. The manufacturers of erlotinib and afatinib offered simple PASs, which
are confidential. As such, the base-case assumes the PAS for each in order to
present the committee with a set of results more relevant to decision making than at
list price. Given the conclusion of the committee in the appraisal of afatinib with
respect to erlotinib’s assumed equivalence to gefitinib (Document B.2.9.1), parity
ARCHER 1050, in contrast to gefitinib, where TTD was observed to exceed PFS by a few months on average.
Relative dose intensity
RDI was not included in the model Given that all primary treatments were administered orally, RDI was not considered relevant.
Vial sharing Complete vial sharing was assumed
Only subsequent treatments were administered intravenously. Therefore, for simplicity these therapies were estimated using the lowest cost per mg of any vial.
Cost of adverse events
The cost of adverse events are applied as a one-off cost at the start of treatment
The majority of adverse events will occur within the first year of treatment and any adverse events occurred beyond the first year will only have a minimal difference due to discounting.
Cisplatin/ carboplatin mix in PDC regimen
The proportion of patients receiving cisplatin or carboplatin in PDC was assumed from PROFILE 1014
These values have been applied in a previous NSCLC appraisal and are therefore considering representative of UK clinical practice.

Company evidence submission template for dacomitinib for untreated EGFR-positive non-small-cell lung cancer (ID1346)
© Pfizer (2018). All rights reserved Page 127 of 388
costing was assumed between gefitinib and erlotinib; therefore, given the treatment
duration of gefitinib/erlotinib, a simple discount of XXX from the erlotinib list price of
£1,631 was assumed to achieve cost parity. For afatinib, given its slight benefit
versus the first generation TKIs, a PAS of XXX on the list price of £2,023 was
assumed. The results without PAS for all comparators are reported in Appendix L.
Table 48. Base-case results Technologies
Total costs (£)
Total LYG
Total QALYs
Incr. costs (£)
Incr. LYG
Incr. QALYs
ICER (£/
QALY)
ICER incremental (£/QALY)
Gefitinib XXXXx XXXX XXXX -- -- -- -- --
Erlotinib XXXXX XXXX XXXX XXXXXX XXX XXXX Dominated Dominated
Afatinib XXXXX XXXX XXXX XXXXXX XXX XXXX £30,038
Extendedly dominated
Dacomitinib XXXXX XXXX XXXX XXXXXX XXX XXXX £29,305 £29,305
Abbreviations: ICER: incremental cost-effectiveness ratio; Incr = incremental; LYG: life years gained; QALYs:
quality-adjusted life years
The modelled outcomes are aligned with the clinical inputs which show dacomitinib
has a longer survival than the three current TKIs. Dacomitinib was associated with
higher total LYs (XXXX) versus all comparators (XXXXXXXXX) and QALYs (XXXX
versus XXXXXXXXX). Dacomitinib was also associated with higher cost.
In the fully incremental analysis, and dacomitinib was associated with an ICER of
£29,305 versus gefitinib. These results indicate that dacomitinib is a cost-effective
treatment option to manage EGFR mutation-positive NSCLC patients.
B.3.8 Sensitivity analyses
B.3.8.1 Probabilistic sensitivity analysis
In order to o explore and quantify uncertainty in the outcomes of the analysis, a
probabilistic sensitivity analysis (PSA) was undertaken using 10,000 iterations of the
model, with values for key parameters sampled stochastically from assigned

Company evidence submission template for dacomitinib for untreated EGFR-positive non-small-cell lung cancer (ID1346)
© Pfizer (2018). All rights reserved Page 128 of 388
distributions to each parameter. The mean values, distributions around the means,
and sources used to estimate the parameters are detailed in Appendix L.
Probabilistic results are presented in Table 49 and the corresponding scatter plot
and cost-effectiveness acceptability curve are represented in XXXXXXX33 and
Figure 34, respectively.
Table 49. Probabilistic results Technologies
Total costs (£)
Total LYG
Total QALYs
Incr. costs (£)
Incr. LYG
Incr. QALYs
ICER (£/
QALY)
ICER incremental (£/QALY)
Gefitinib XXXXX XXXX XXXX -- -- -- -- --
Erlotinib XXXXX XXXX XXXX XXXXXX XXX XXXX Dominated Dominated
Afatinib XXXXX XXXX XXXX XXXXXX XXX XXXX £30,015
Extendedly dominated
Dacomitinib XXXXX XXXX XXXX XXXXXX XXX XXXX £29,381 £29,381
Abbreviations: ICER = incremental cost-effectiveness ratio; Incr = incremental; LYG: life years gained; QALYs:
quality-adjusted life years
XXXXXXX33XXXXXXXXXXXXXXXXXXXXXXXXXXXX
Abbreviations: QALY: quality-adjusted life year
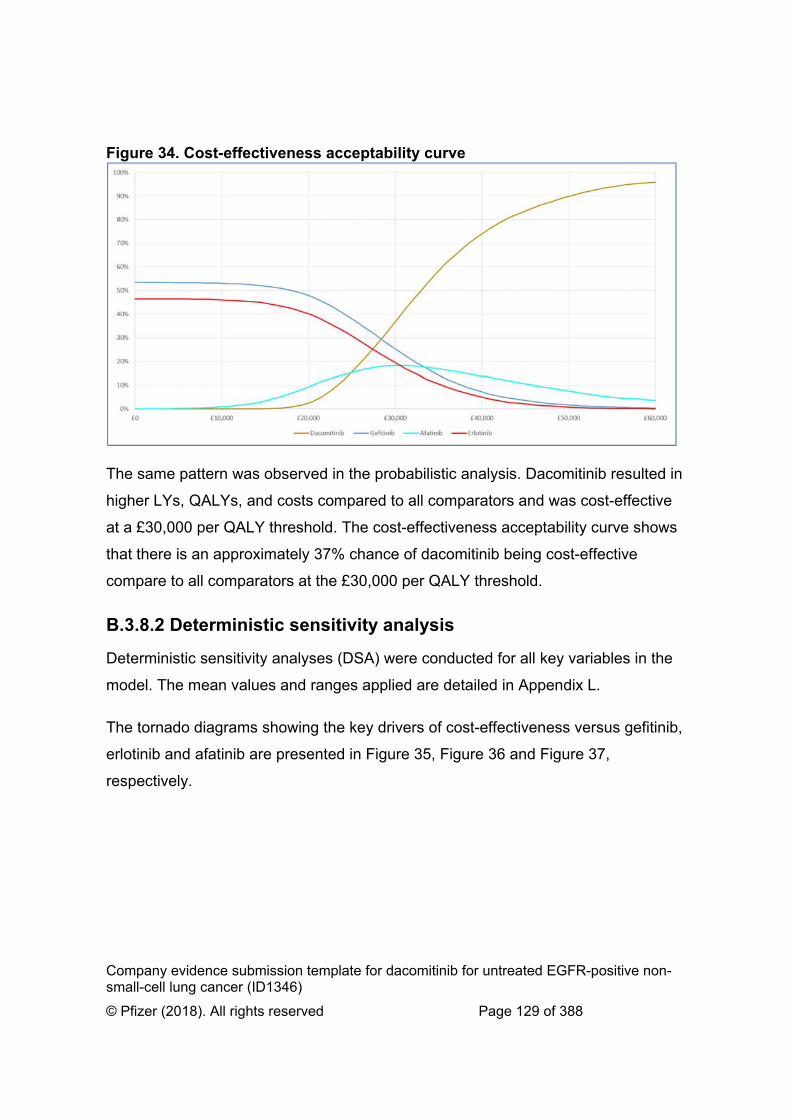
Company evidence submission template for dacomitinib for untreated EGFR-positive non-small-cell lung cancer (ID1346)
© Pfizer (2018). All rights reserved Page 129 of 388
Figure 34. Cost-effectiveness acceptability curve
The same pattern was observed in the probabilistic analysis. Dacomitinib resulted in
higher LYs, QALYs, and costs compared to all comparators and was cost-effective
at a £30,000 per QALY threshold. The cost-effectiveness acceptability curve shows
that there is an approximately 37% chance of dacomitinib being cost-effective
compare to all comparators at the £30,000 per QALY threshold.
B.3.8.2 Deterministic sensitivity analysis
Deterministic sensitivity analyses (DSA) were conducted for all key variables in the
model. The mean values and ranges applied are detailed in Appendix L.
The tornado diagrams showing the key drivers of cost-effectiveness versus gefitinib,
erlotinib and afatinib are presented in Figure 35, Figure 36 and Figure 37,
respectively.

Company evidence submission template for dacomitinib for untreated EGFR-positive non-small-cell lung cancer (ID1346)
© Pfizer (2018). All rights reserved Page 130 of 388
Figure 35. Tornado diagram: dacomitinib versus gefitinib
Abbreviations: ICER = incremental cost-effectiveness ratio
Figure 36. Tornado diagram: dacomitinib versus erlotinib
Abbreviations: ICER = incremental cost-effectiveness ratio
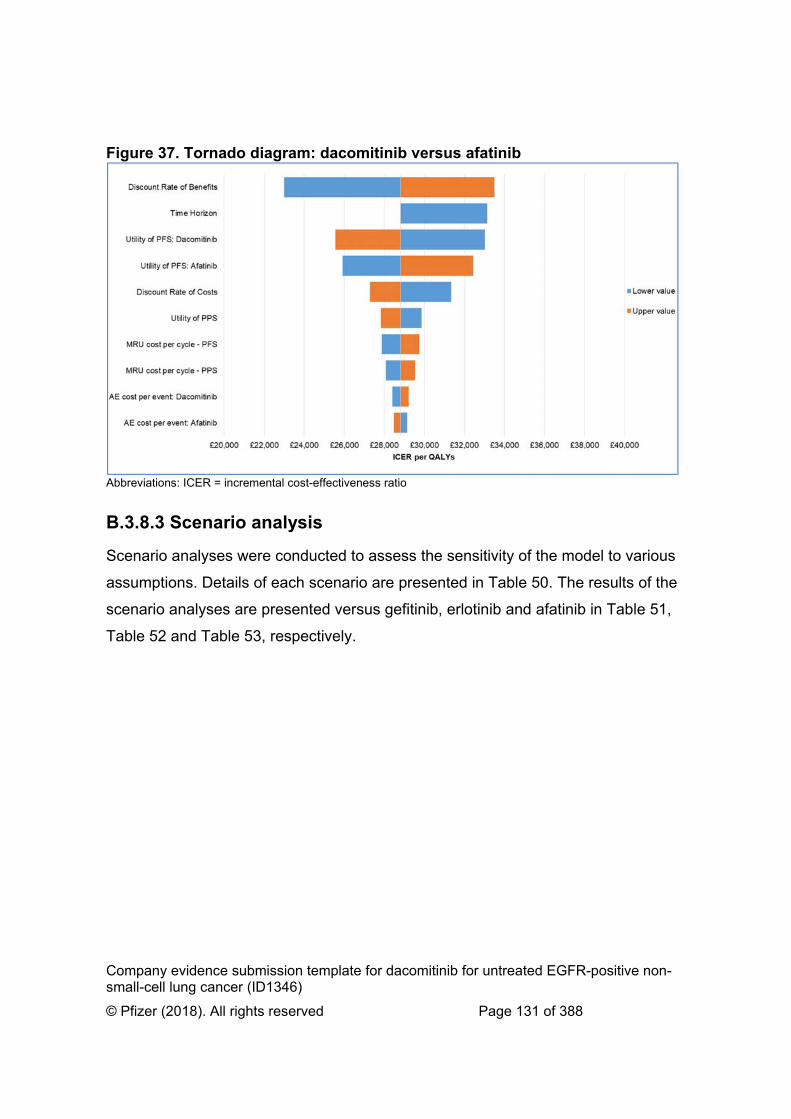
Company evidence submission template for dacomitinib for untreated EGFR-positive non-small-cell lung cancer (ID1346)
© Pfizer (2018). All rights reserved Page 131 of 388
Figure 37. Tornado diagram: dacomitinib versus afatinib
Abbreviations: ICER = incremental cost-effectiveness ratio
B.3.8.3 Scenario analysis
Scenario analyses were conducted to assess the sensitivity of the model to various
assumptions. Details of each scenario are presented in Table 50. The results of the
scenario analyses are presented versus gefitinib, erlotinib and afatinib in Table 51,
Table 52 and Table 53, respectively.

Company evidence submission template for dacomitinib for untreated EGFR-positive non-small-cell lung cancer (ID1346)
© Pfizer (2018). All rights reserved Page 132 of 388
Table 50. Details of scenario analyses
Scenario Base-case Scenario description
Reference to section in submission
Gefitinib survival projection (PFS)
Generalised gamma Log-normal B.3.3.1.2
Gefitinib survival projection (OS)
Generalised gamma Log-logistic B.3.3.1.3
FP model (PFS) FP model P1=0.5 and P2=1.5
FP model P1=0.5 P2=1
B.2.9.3.2
FP model (OS) FP model P1=-0.5 FP model P1=0 B.2.9.3.2
NMA methodology (PFS and OS)
FP NMA Traditional proportional hazards NMA
B.2.9.3.2
Utility (PF) with AEs
Treatment specific utility based on ARCHER 1050 and assumption (XXXXXXXXX)
Non-treatment specific utility based on ARCHER 1050 (XXXX) with AE disutility’s
B.3.4.5
Utility (PF) with AEs
Treatment specific utility based on ARCHER 1050 and assumption (XXXXXXXXX)
Non-treatment specific utility based on Labbé (0.77) with AE disutility’s
B.3.4.5
Treatment beyond progression
Discontinue treatment upon progression
Dacomitinib XXXX months (PFS 14.7 vs TTD XXXX)
Gefitinib/erlotinib
XXXX months (PFS 9.2 vs TTD XXXX)
Afatinib +2.7 month (PFS 11.0 vs TTD 13.7)
B.3.3.4
Abbreviations: FP = fractional polynomial; NMA = network meta-analysis; OS = overall survival; PD= progressed
disease; PF= progression-free; PFS = progression-free survival; PD= progressed disease; TTD = time to
treatment discontinuation

Company evidence submission template for dacomitinib for untreated EGFR-positive non-small-cell lung cancer (ID1346)
© Pfizer (2018). All rights reserved Page 133 of 388
Table 51. Results of base-case scenario analysis versus gefitinib
Scenario Total LYs Total QALYs
Total costs
Total LYs Total QALYs
Total costs
ICER % change
Base-case XXXXX XXXXX XXXXXXX XXXXX XXXXX XXXXXXX £29,305 -
Gefitinib survival projection (PFS)
XXXXX XXXXX XXXXXXX XXXXX XXXXX XXXXXXX £35,882 22%
Gefitinib survival projection (OS)
XXXXX XXXXX XXXXXXX XXXXX XXXXX XXXXXXX £22,344 -24%
FP model (PFS) XXXXX XXXXX XXXXXXX XXXXX XXXXX XXXXXXX £31,170 6%
FP model (OS) XXXXX XXXXX XXXXXXX XXXXX XXXXX XXXXXXX £27,711 -5%
NMA methodology (PFS and OS)
XXXXX XXXXX XXXXXXX XXXXX XXXXX XXXXXXX £30,659 5%
Utility (PF - ARCHER) with AEs
XXXXX XXXXX XXXXXXX XXXXX XXXXX XXXXXXX £25,195 -14%
Utility (PF - Labbé) with AEs
XXXXX XXXXX XXXXXXX XXXXX XXXXX XXXXXXX £26,108 -11%
Treatment beyond progression
XXXXX XXXXX XXXXXXX XXXXX XXXXX XXXXXXX £32,444 11%
Abbreviations: OS = overall survival; PD= progressed disease; PF = progression-free; PFS= progression-free survival

Company evidence submission template for dacomitinib for untreated EGFR-positive non-small-cell lung cancer (ID1346)
© Pfizer (2018). All rights reserved Page 134 of 388
Table 52. Results of base-case scenario analysis versus erlotinib
Scenario Total LYs Total QALYs
Total costs
Total LYs Total QALYs
Total costs
ICER % change
Base-case XXXXX XXXXX XXXXXXX XXXXX XXXXX XXXXXXX £29,084 -
Gefitinib survival projection (PFS)
XXXXX XXXXX XXXXXXX XXXXX XXXXX XXXXXXX £32,013 10%
Gefitinib survival projection (OS)
XXXXX XXXXX XXXXXXX XXXXX XXXXX XXXXXXX £22,180 -24%
FP model (PFS) XXXXX XXXXX XXXXXXX XXXXX XXXXX XXXXXXX £30,954 6%
FP model (OS) XXXXX XXXXX XXXXXXX XXXXX XXXXX XXXXXXX £27,503 -5%
NMA methodology (PFS and OS)
XXXXX XXXXX XXXXXXX XXXXX XXXXX XXXXXXX £30,451 5%
Utility (PF - ARCHER) with AEs
XXXXX XXXXX XXXXXXX XXXXX XXXXX XXXXXXX £25,004 -14%
Utility (PF - Labbé) with AEs
XXXXX XXXXX XXXXXXX XXXXX XXXXX XXXXXXX £25,911 -11%
Treatment beyond progression
XXXXX XXXXX XXXXXXX XXXXX XXXXX XXXXXXX £24,677 -15%
Abbreviations: OS = overall survival; PD= progressed disease; PF = progression-free; PFS= progression-free survival

Company evidence submission template for dacomitinib for untreated EGFR-positive non-small-cell lung cancer (ID1346)
© Pfizer (2018). All rights reserved Page 135 of 388
Table 53. Results of base-case scenario analysis versus afatinib
Scenario Total LYs Total QALYs
Total costs
Total LYs Total QALYs
Total costs
ICER % change
Base-case XXXXX XXXXX XXXXXXX XXXXX XXXXX XXXXXXX £28,808 -
Gefitinib survival projection (PFS)
XXXXX XXXXX XXXXXXX XXXXX XXXXX XXXXXXX £31,035 8%
Gefitinib survival projection (OS)
XXXXX XXXXX XXXXXXX XXXXX XXXXX XXXXXXX £21,371 -26%
FP model (PFS) XXXXX XXXXX XXXXXXX XXXXX XXXXX XXXXXXX £31,391 9%
FP model (OS) XXXXX XXXXX XXXXXXX XXXXX XXXXX XXXXXXX £25,441 -12%
NMA methodology (PFS and OS)
XXXXX XXXXX XXXXXXX XXXXX XXXXX XXXXXXX £33,319 16%
Utility (PF - ARCHER) with AEs
XXXXX XXXXX XXXXXXX XXXXX XXXXX XXXXXXX £28,188 -2%
Utility (PF - Labbé) with AEs
XXXXX XXXXX XXXXXXX XXXXX XXXXX XXXXXXX £29,089 1%
Treatment beyond progression
XXXXX XXXXX XXXXXXX XXXXX XXXXX XXXXXXX £20,735 -28%
Abbreviations: OS = overall survival; PD= progressed disease; PF = progression-free; PFS= progression-free survival

Company evidence submission template for dacomitinib for untreated EGFR-positive non-small-cell lung cancer (ID1346)
© Pfizer (2018). All rights reserved Page 136 of 388
B.3.8.4 Summary of sensitivity analyses results
The probability of dacomitinib being the most cost-effective treatment at a threshold
of £30,000 per QALY is 37%.
One-way sensitivity analysis showed that the inputs that most affect the ICERs were
those related to the discount rates for costs and outcomes and time horizon, none of
which are inputs considered to be uncertain. Following these was the PF utilities
which had a moderate effect as they were varied indvidually by treatment and thus
was not as plausible as the utility scenarios explored where all PFS values were
varied simultaneously. The model was relatively insensitive to the PD utility value as
the model predicted similar mean duration in PD for all treatments.
Scenarios looking at different OS projection, the cost of continuing treatment beyond
progression and applying non treatment specific utility values with AE disutility’s
resulted in significant changes in the cost-effectiveness estimates. All other scenario
resulted in marginal changes with the exception of the log-normal PFS which was
considered to slightly overestimate long-term PFS. Also of note, was the insensitivity
of the model to the use of the proportional hazards ITC.
In summary, the model is relatively insensitive to assumptions and dacomitinib
remained a cost-effective strategy when clincailly plausible scenarios were
considered.
B.3.9 Subgroup analysis No subgroup analyses were performed.
B.3.10 Validation
B.3.10.1 Validation of cost-effectiveness analysis
Comparison of clinical inputs to previous clinical studies
As discussed in Section 3.3.1.2-3 previous EGFR studies with median follow-up
greater than ARCHER 1050 were used to justify the base-case parametric models.

Company evidence submission template for dacomitinib for untreated EGFR-positive non-small-cell lung cancer (ID1346)
© Pfizer (2018). All rights reserved Page 137 of 388
Table 54 and Table 55 demonstrate that the PFS and OS base-case models
provided good fits to the observed data from ARHCER 1050 and the long-term
extrapolation were aligned with the external studies. For more detail refer to Section
3.3.1.2-3.
Table 54. Comparison of gefitinib outcomes against previous studies (PFS)
Median Proportion PF at 1 year 2 years 3 years 5 years
Base-case
(generalised gamma)
XXXX XXXXX XXXX XXXX XXXX
Scenario (Log-normal)
XXX XXXXX XXXXX XXXX XXXX
ARCHER 1050 XXX XXXXX XXXX X X
LUX-Lung 7 10.9 39.5% 5.6% 1.5% -
Lin 2016 12.1 54% 16.2% 8.4% 0.0%
WJTOG 3405 9.6 41.6% 12.4% 6.2% - Abbreviations: PF= progression-free; PFS = progression-free survival
Table 55. Comparison of gefitinib outcomes against previous studies (OS)
Median Proportion alive at 1 year 2 years 3 years 5 years 6 years 7 years 8 years
Base-case
(generalised gamma)
XXXX XXXXX XXXXX XXXXX XXXXX XXXX XXXX XXXX
Scenario (Log-logistic)
XXXX XXXXX XXXXX XXXXX XXXXX XXXXX XXXX XXXX
ARCHER 1050 XXXX XXXXX XXXXX XXXXX X X X X
LUX-Lung 7 24.5 84.6% 50.9% 32.7% -
Lin 2016 30.9 89.9% 66.3% 39.3% 14.6% 10.5% 6.6% 0.0%
WJTOG 3405 34.8 85.1% 64.3% 47.5% 21.0% 10.9% 6.8% - Abbreviations: OS = overall survival
Comparison of model outcomes to previous analyses
Comparison could not be drawn against previous EGFR appraisals given the
numerous limitations and lack of final base-case outcomes reported.

Company evidence submission template for dacomitinib for untreated EGFR-positive non-small-cell lung cancer (ID1346)
© Pfizer (2018). All rights reserved Page 138 of 388
Therefore, cost-effectiveness studies identified in the SLR (see Appendix G) were
utilised to validate the model outcomes. Two studies were identified which reported
LYs and utilised similar methodologies and clinical data:
XXXXXXXXXXXXXXXXXXXXXXXXXXXXXXXXXXXXXXXXXXXXXXXXXXXX
XXXXXXXXXXXXXXXXXXXXXXXXXXXXXXXXX
XXXXXXXXXXXXXXXXXXXXXXXXXXXXXXXXXXXXXXXXXXXXXXXXXXX
XXXXXXXXXXXXXXXXXXXXXXXXXXXXXXXXXXXXXXXXXXXXXXXXXXX
XXXXXXXXXXXXXXXXXXXXXXXXXXXXXXXXXXXXXXXXXXXXXXXXXXX
XXXXXXXXXXXXXXXXXXXXXXXXXXXXXXXXXXXXXXXXXXXXXXXXXXX
XXXXXXX
XXXXXXXXXXXXXXXXXXXXXXXXXXXXXXXXXXXXXXXXXXXXXXXXXXXX
XXXXXXXXXXXXXXXXXXXXXXXXXXXXXXXXXXXXXXXXXXXXXXXXXXX
XXXXXXXXXXXXXXXXXXXXXXXXXXXXXXXXXXXXXXXXXXXXXXXXXXX
XXXXXXXXXXXXXXXXXXXXXXXXXXXXXXXXXXXXXXXXXXXXXXXXXXX
XXXXXXXXXXXXXXXXXXXXX
Clinical expert opinion
Two UK clinician experts provided validation in separate one-to-one meetings on
key inputs in the cost-effectiveness analysis. For further details please see Section
3.3 (survival data) and Section 3.5 (subsequent treatments).
B.3.10.2 Quality control
Internal quality control of the economic model was undertaken by the developers of
the model on behalf of the manufacturer.

Company evidence submission template for dacomitinib for untreated EGFR-positive non-small-cell lung cancer (ID1346)
© Pfizer (2018). All rights reserved Page 139 of 388
B.3.11 Interpretation and conclusions of economic evidence
B.3.11.1 Comparison with published economic literature
To our knowledge this is the first economic evaluation comparing dacomitinib with
approved EGFR TKIs in patients with EGFR-positive NSCLC.
B.3.11.2 Relevance of the economic analysis to all patients who
could potentially use the technology in the decision problem
This evaluation considers all patients identified in the decision problem.
B.3.11.3 Generalisability of the analysis
ARCHER 1050 shared similar baseline characteristics to the studies utilised in the
most recent previous EGFR appraisal68 (AURA extension, AURA2 and IMRESS). In
the appraisal ‘experts highlighted that these trials were more generalisable than
most other lung cancer trials because people with EGFR mutation-positive NSCLC
tended to be diagnosed at a younger age, were fitter and not necessarily smokers
compared with other types of lung cancer’ and therefore, the committee concluded
that the trials used ‘were broadly generalisable to clinical practice’. Furthermore,
clinical expert opinion suggested that studies with a predominately Asian population
tend to mirror what is seen in Caucasian patients. Therefore, the patient population
in ARCHER 1050 applied in the economic analysis can also be considered
generalisable to UK clinical practice.
The model was developed using costs and resource usage from UK based sources
and from previous technology appraisals presented to NICE. Where UK resource
usage was not available (subsequent treatments) these were validated with UK
clinical experts.

Company evidence submission template for dacomitinib for untreated EGFR-positive non-small-cell lung cancer (ID1346)
© Pfizer (2018). All rights reserved Page 140 of 388
In summary, all steps have been taken to produce a robust and conservative
estimate of the clinical and cost-effectiveness of dacomitinib reflective of UK clinical
practice.
B.3.11.4 Strength of the economic analysis
The economic analysis has number of key strengths:
The PartSA model structure was simple and has been applied in numerous
previous NSCLC appraisals, utilises the available data from the pivotal trial
and comparator trial and captures the key outcomes of interest in NSCLC.
The relatively novel FP approach utilised in the NMA, is being increasingly
utilised in NICE appraisals. The FP method integrated time vary hazard ratios
which meant it did not rely on the arbitrary assumption of a constant and
maintained treatment effect, which has been a key criticism in previous NICE
appraisals.
EQ-5D was collected in the ARCHER 1050 study. This allowed the PF utility
to be aligned with the NICE reference case (EQ-5D; measured directly from
patients; valued using UK general population tariff). In addition, a repeated
measures mixed-effects model was used to calculate utility values which
accounted for the correlated between repeated measures, which avoided
patients with longer term follow-up biasing the estimated values.
All resource usage and costs (administration, PF and PD disease
management and terminal care costs) have been validated and accepted in
multiple previous NSCLC appraisals, providing an element of certainty in
these values.
DSA and scenario analysis demonstrated that the results are insensitive to a
large number of parameters and assumptions.

Company evidence submission template for dacomitinib for untreated EGFR-positive non-small-cell lung cancer (ID1346)
© Pfizer (2018). All rights reserved Page 141 of 388
B.3.11.5 Limitation of the economic analysis
A limitation of the analysis was that both PFS and OS data had to be extrapolated
as neither were complete (i.e. not all patients had experienced the corresponding
event) from ARCHER 1050. Despite this, by extrapolating based on the observed
data in ARCHER 1050, the best available evidence has been taken into account.
The modelled curves varied in their extrapolations, indicating that there was
uncertainty in the long-term outcomes for these patients. However, any uncertainty
around the long-term extrapolation was mitigated by the use of:
Long-term data from previous EGFR NSCLC studies with median follow-up
greater than ARCHER 1050 to provide expected land mark rates
UK clinical expert opinion on the most appropriate curves
Sensitivity analysis to demonstrate the impact of assuming alternative curves
A minor limitation was that EQ-5D was only collected prior to progression in
ARCHER 1050. Therefore, data from external literature was required to inform the
utility value for the PD state. However, the source identified in the SLR was aligned
with the NICE reference case directly in the population of interest and the value was
aligned with a previous ERG recommended value in NSCLC.
B.3.11.6 Conclusions
Dacomitinib is a novel, innovative treatment which is associated with improvements
in key outcomes for EGFR mutation-positive NSCLC patients. Dacomitinib is the
first TKI to show an increase to life expectancy in its phase III study against an
active comparator in patients with locally advanced or metastatic EGFR+ NSCLC
(Document B.2.6.3.2). In addition, dacomitinib has the longest PFS data (Document
B.2.6.2) compared to current approved treatments for EGFR+ NSCLC, which both
delays the onset of greater symptom burden and delay the use of subsequent
treatments thereby increasing the total time on active therapy in currently available
treatment sequences. It is expected that, as a result of improvements in efficacy,

Company evidence submission template for dacomitinib for untreated EGFR-positive non-small-cell lung cancer (ID1346)
© Pfizer (2018). All rights reserved Page 142 of 388
dacomitinib’s position in the clinical pathway alongside the three current standard-
of-care TKIs is an important step forward in improving patient outcomes.
The base-case analysis showed dacomitinib is a cost-effective treatment with ICERs
of dacomitinib versus gefitnib, erlotinib and afatinib of £29,305, £29,084 and
£28,808, respectively with the assumed PASs. The economic analysis had a
number of strengths, including a simple well accepted structure, an indirect
comparison that allowed for the exploration of non-proportional hazards assumption
on survival, utilities that were derived directly from patients and resource usage that
had been extensively utilised and accepted in previous appraisals. Minor limitations
associated with survival extrapolations and utilities were mitigated through the use
of the best available external data and clinical expert opinion. Sensitivity analyses
demonstrated minimal variation in cost-effectiveness outcomes when these key
areas of uncertainty were explored. In addition, the model projections were
consistent with the clinical data and previous economic analysis.
In summary, dacomitinib, a novel second-generation TKI, is a step forward for the
first-line management of EGFR+ NSCLC patients in England and Wales and
demonstrates value for money for the NHS.

Company evidence submission template for dacomitinib for untreated EGFR-positive non-small-cell lung cancer (ID1346)
© Pfizer (2018). All rights reserved Page 143 of 388
B.4 References
1. National Institute for Health and Care Excellence. Draft scope for dacomitinib for untreated EGFR-positive non-small-cell lung cancer. 2018; https://www.nice.org.uk/guidance/gid-ta10350/documents/draft-scope-post-referral.
2. Wang X, Batty KM, Crowe PJ, Goldstein D, Yang JL. The Potential of panHER Inhibition in Cancer. Front Oncol. 2015;5:2.
3. Carpenter RL, Lo HW. Dacomitinib, an emerging HER-targeted therapy for non-small cell lung cancer. J Thorac Dis. 2012;4(6):639-642.
4. Stewart EL, Tan SZ, Liu G, Tsao MS. Known and putative mechanisms of resistance to EGFR targeted therapies in NSCLC patients with EGFR mutations-a review. Transl Lung Cancer Res. 2015;4(1):67-81.
5. Zhang Y-L, Yuan J-Q, Wang K-F, et al. The prevalence of EGFR mutation in patients with non-small cell lung cancer: a systematic review and meta-analysis. Oncotarget. 2016;7(48):78985.
6. Dearden S, Stevens J, Wu Y-L, Blowers D. Mutation incidence and coincidence in non small-cell lung cancer: meta-analyses by ethnicity and histology (mutMap). Annals of oncology. 2013;24(9):2371-2376.
7. Werutsky G, Debiasi M, Sampaio FH, et al. P1.08: Updated Analysis of Global Epidemiology of EGFR Mutation in Advanced Non-Small Cell Lung Cancer: Track: Prevention, Early Detection, Epidemiology and Tobacco Control. J Thorac Oncol. 2016;11(10s):S184-s185.
8. Midha A, Dearden S, McCormack R. EGFR mutation incidence in non-small-cell lung cancer of adenocarcinoma histology: a systematic review and global map by ethnicity (mutMapII). Am J Cancer Res. 2015;5(9):2892-2911.
9. Park K, Tan E-H, O'Byrne K, et al. Afatinib versus gefitinib as first-line treatment of patients with EGFR mutation-positive non-small-cell lung cancer (LUX-Lung 7): a phase 2B, open-label, randomised controlled trial. Lancet Oncology. 2016;17(5):577-589.
10. Engelman JA, Zejnullahu K, Gale CM, et al. PF00299804, an irreversible pan-ERBB inhibitor, is effective in lung cancer models with EGFR and ERBB2 mutations that are resistant to gefitinib. Cancer Res. 2007;67(24):11924-11932.
11. National Institute for Health and Care Excellence (NICE). Erlotinib for the first line treatment of EGFR-TK mutation positive non-small-cell lung cancer; Technology appraisal guidance [TA258]. 2012; https://www.nice.org.uk/guidance/ta258.
12. Cancer Research UK. UK Lung Cancer Incidence Statistics. 2016; https://www.cancerresearchuk.org/health-professional/cancer-statistics/statistics-by-cancer-type/lung-cancer/mortality#heading-Zero. Accessed 13 August, 2018.
13. Blandin Knight S, Crosbie PA, Balata H, Chudziak J, Hussell T, Dive C. Progress and prospects of early detection in lung cancer. Open Biology.

Company evidence submission template for dacomitinib for untreated EGFR-positive non-small-cell lung cancer (ID1346)
© Pfizer (2018). All rights reserved Page 144 of 388
2017;7(9):170070. 14. National Cancer Institute (NIH). Non-Small Cell Lung Cancer Treatment
(PDQ®)–Health Professional Version. 2018; https://www.cancer.gov/types/lung/hp/non-small-cell-lung-treatment-pdq#section/_359.
15. Royal College of Physicians CQID. National Lung Cancer Audit annual report 2017 (for the audit period 2016), January 2018. 2018; https://www.hqip.org.uk/wp-content/uploads/2018/03/NLCA2017AnnualReport_web_FINAL.pdf. Accessed 4 October, 2018.
16. Walters S, Maringe C, Coleman MP, et al. Lung cancer survival and stage at diagnosis in Australia, Canada, Denmark, Norway, Sweden and the UK: a population-based study, 2004-2007. Thorax. 2013;68(6):551-564.
17. Kocher F, Hilbe W, Seeber A, et al. Longitudinal analysis of 2293 NSCLC patients: a comprehensive study from the TYROL registry. Lung Cancer. 2015;87(2):193-200.
18. Chouaid C, Agulnik J, Goker E, et al. Health-related quality of life and utility in patients with advanced non-small-cell lung cancer: a prospective cross-sectional patient survey in a real-world setting. J Thorac Oncol. 2013;8(8):997-1003.
19. Sztankay M, Giesinger JM, Zabernigg A, et al. Clinical decision-making and health-related quality of life during first-line and maintenance therapy in patients with advanced non-small cell lung cancer (NSCLC): findings from a real-world setting. BMC Cancer. 2017;17(1):565.
20. Lynch TJ, Bell DW, Sordella R, et al. Activating mutations in the epidermal growth factor receptor underlying responsiveness of non-small-cell lung cancer to gefitinib. N Engl J Med. 2004;350(21):2129-2139.
21. Barlesi F, Mazieres J, Merlio JP, et al. Routine molecular profiling of patients with advanced non-small-cell lung cancer: results of a 1-year nationwide programme of the French Cooperative Thoracic Intergroup (IFCT). Lancet. 2016;387(10026):1415-1426.
22. Kosaka T, Yatabe Y, Endoh H, Kuwano H, Takahashi T, Mitsudomi T. Mutations of the epidermal growth factor receptor gene in lung cancer: biological and clinical implications. Cancer Res. 2004;64(24):8919-8923.
23. Santis G, Angell R, Nickless G, et al. Screening for EGFR and KRAS mutations in endobronchial ultrasound derived transbronchial needle aspirates in non-small cell lung cancer using COLD-PCR. PLoS One. 2011;6(9):e25191.
24. Lin JJ, Cardarella S, Lydon CA, et al. Five-Year Survival in EGFR-Mutant Metastatic Lung Adenocarcinoma Treated with EGFR-TKIs. J Thorac Oncol. 2016;11(4):556-565.
25. Juan O, Popat S. Treatment choice in epidermal growth factor receptor mutation-positive non-small cell lung carcinoma: latest evidence and clinical implications. Ther Adv Med Oncol. 2017;9(3):201-216.
26. Shan Y, Eastwood MP, Zhang X, et al. Oncogenic mutations counteract

Company evidence submission template for dacomitinib for untreated EGFR-positive non-small-cell lung cancer (ID1346)
© Pfizer (2018). All rights reserved Page 145 of 388
intrinsic disorder in the EGFR kinase and promote receptor dimerization. Cell. 2012;149(4):860-870.
27. Chan BA, Hughes BG. Targeted therapy for non-small cell lung cancer: current standards and the promise of the future. Transl Lung Cancer Res. 2015;4(1):36-54.
28. National Institute for Health and Care Excellence (NICE). Gefitinib for the first-line treatment of locally advanced or metastatic non-small-cell lung cancer; Technology appraisal guidance [TA192]. 2010; https://www.nice.org.uk/guidance/ta192.
29. National Institute for Health and Care Excellence (NICE). Afatinib for treating epidermal growth factor receptor mutation-positive locally advanced or metastatic non-small-cell lung cancer; Technology appraisal guidance [TA310]. 2014; https://www.nice.org.uk/guidance/ta310.
30. National Institute for Health and Care Excellence (NICE). First-line systemic anticancer treatment for advanced or metastatic non-small-cell lung cancer. NICE Pathway 2018; https://pathways.nice.org.uk/pathways/lung-cancer#path=view%3A/pathways/lung-cancer/first-line-systemic-anticancer-treatment-for-advanced-or-metastatic-non-small-cell-lung-cancer.xml&content=view-index. Accessed 8 September, 2018.
31. National Institute for Health and Care Excellence (NICE). Pemetrexed for the first-line treatment of non-small-cell lung cancer; Technology appraisal guidance [TA181]. 2009; https://www.nice.org.uk/guidance/ta181.
32. National Institute for Health and Care Excellence (NICE). Osimertinib for treating locally advanced or metastatic EGFR T790M mutation-positive non-small-cell lung cancer; Technology appraisal guidance [TA416]. 2016; https://www.nice.org.uk/guidance/ta416.
33. Wu YL, Cheng Y, Zhou X, et al. Dacomitinib versus gefitinib as first-line treatment for patients with EGFR-mutation-positive non-small-cell lung cancer (ARCHER 1050): a randomised, open-label, phase 3 trial. Lancet Oncol. 2017;18(11):1454-1466.
34. Mok TS, Cheng Y, Zhou X, et al. Improvement in Overall Survival in a Randomized Study That Compared Dacomitinib With Gefitinib in Patients With Advanced Non-Small-Cell Lung Cancer and EGFR-Activating Mutations. J Clin Oncol. 2018;36(22):2244-2250.
35. Rosell R, Carcereny E, Gervais R, et al. Erlotinib versus standard chemotherapy as first-line treatment for European patients with advanced EGFR mutation-positive non-small-cell lung cancer (EURTAC): a multicentre, open-label, randomised phase 3 trial. Lancet Oncology. 2012;13(3):239-246.
36. Zhou C, Wu Y-L, Chen G, et al. Erlotinib versus chemotherapy as first-line treatment for patients with advanced EGFR mutation-positive non-small-cell lung cancer (OPTIMAL, CTONG-0802): a multicentre, open-label, randomised, phase 3 study. Lancet Oncology. 2011;12(8):735-742.
37. Mok TS, Wu YL, Thongprasert S, et al. Gefitinib or carboplatin-paclitaxel in pulmonary adenocarcinoma. N Engl J Med. 2009;361(10):947-957.
38. Sequist LV, Yang JC-H, Yamamoto N, et al. Phase III study of afatinib or

Company evidence submission template for dacomitinib for untreated EGFR-positive non-small-cell lung cancer (ID1346)
© Pfizer (2018). All rights reserved Page 146 of 388
cisplatin plus pemetrexed in patients with metastatic lung adenocarcinoma with EGFR mutations. Journal of Clinical Oncology. 2013;31(27):3327-3334.
39. Wu Y-L, Zhou C, Hu C-P, et al. Afatinib versus cisplatin plus gemcitabine for first-line treatment of Asian patients with advanced non-small-cell lung cancer harbouring EGFR mutations (LUX-Lung 6): an open-label, randomised phase 3 trial. Lancet Oncology. 2014;15(2):213-222.
40. Pfizer. ARCHER 1050 CSR: A randomized, open-label, Phase 3, efficacy and safety study of dacomitinib (pf-00299804) versus gefitinib for the first line treatment of locally advanced or metastatic non-small cell lung cancer in subjects with epidermal growth factor receptor (EGFR) activating mutation(s). 2017.
41. Wu YL, Zhou C, Liam CK, et al. First-line erlotinib versus gemcitabine/cisplatin in patients with advanced EGFR mutation-positive non-small-cell lung cancer: analyses from the phase III, randomized, open-label, ENSURE study. Annals of Oncology. 2015;26(9):1883-1889.
42. Maemondo M, Inoue A, Kobayashi K, et al. Gefitinib or chemotherapy for non-small-cell lung cancer with mutated EGFR. New England Journal of Medicine. 2010;362(25):2380-2388.
43. Inoue A, Kobayashi K, Maemondo M, et al. Updated overall survival results from a randomized phase III trial comparing gefitinib with carboplatin-paclitaxel for chemo-naive non-small cell lung cancer with sensitive EGFR gene mutations (NEJ002). Ann Oncol. 2013;24(1):54-59.
44. Mitsudomi T, Morita S, Yatabe Y, et al. Gefitinib versus cisplatin plus docetaxel in patients with non-small-cell lung cancer harbouring mutations of the epidermal growth factor receptor (WJTOG3405): an open label, randomised phase 3 trial. Lancet Oncology. 2010;11(2):121-128.
45. Patil VM, Noronha V, Joshi A, et al. Phase III study of gefitinib or pemetrexed with carboplatin in EGFR-mutated advanced lung adenocarcinoma. Esmo Open. 2017;2(1):e000168.
46. European Organisation for Research and Treatment of Cancer (EORTC). EORTC QLQ-C30 Scoring Manual. 2001.
47. Sebastian M, Schmittel A, Reck M. First-line treatment of EGFR-mutated nonsmall cell lung cancer: critical review on study methodology. Eur Respir Rev. 2014;23(131):92-105.
48. Pfizer. ARCHER 1050 Statiscal analysis plan; SFJ Protocol DP312804; Pfizer Data on File. 2016.
49. National Institute for Health and Care Excellence (NICE). NICE Process and Methods Guides. Methods for the Development of NICE Public Health Guidance. London: National Institute for Health and Care Excellence (NICE) unless otherwise stated. All rights reserved.; 2012.
50. Migliorino M, Mok T, Wu Y, et al. P3. 01-012 Symptom Impact of First-Line Dacomitinib versus Gefitinib in EGFR-Positive NSCLC: Results from a Randomized Phase 3 Study. Journal of Thoracic Oncology. 2017;12(11):S2204-S2205.
51. Han B, Jin B, Chu T, et al. Combination of chemotherapy and gefitinib as

Company evidence submission template for dacomitinib for untreated EGFR-positive non-small-cell lung cancer (ID1346)
© Pfizer (2018). All rights reserved Page 147 of 388
first-line treatment for patients with advanced lung adenocarcinoma and sensitive EGFR mutations: A randomized controlled trial. International Journal of Cancer. 2017;141(6):1249-1256.
52. National Institute for Health and Care Excellence (NICE). Afatinib for treating epidermal growth factor receptor mutation-positive locally advanced or metastatic non-small-cell lung cancer; Final appraisal determination. 2014; https://www.nice.org.uk/guidance/ta310.
53. Scottish Medicines Consortium (SMC). Gefitinib 250mg film-coated tablets (Iressa®) SMC No. (615/10); Second Re-submission. 2015; https://www.scottishmedicines.org.uk/files/advice/gefitinib__Iressa___2nd_Resub_FINAL_Nov_2015_for_website.pdf. Accessed 25 October, 2018.
54. Yang JJ, Zhou Q, Yan HH, et al. A phase III randomised controlled trial of erlotinib vs gefitinib in advanced non-small cell lung cancer with EGFR mutations. Br J Cancer. 2017;116(5):568-574.
55. Pfizer. Data on file. 2017. 56. Jansen JP. Network meta-analysis of survival data with fractional
polynomials. BMC medical research methodology. 2011;11(1):61. 57. S Dias AA, NJ Welton, JP Jansen, AJ Sutton. Network Meta-Analysis for
Decision-Making. Chichester, UK: John Wiley & Sons Ltd. Chapter 10: Network Meta-Analysis of Survival Outcomes. 2018.
58. Bucher HC, Guyatt GH, Griffith LE, Walter SD. The results of direct and indirect treatment comparisons in meta-analysis of randomized controlled trials. J Clin Epidemiol. 1997;50(6):683-691.
59. AstraZeneca. Gefitinib (IRESSA) Summary of Product Characteristics. 2014. 60. Tony S. Mok KN, Rafael Rosell, Ki Hyeong Lee, , Jesus Corral MRM, Adam
Pluzanski, Rolf Linke, , Geeta Devgan EIS, Susan Quinn, Tao Wang, Yi-Long Wu,. Effects of Dose Modifications on the Safety and Efficacy of Dacomitinib for EGFR Mutation-Positive NSCLC; Presented at the IASLC 19th World Conference on lung Cancer. 2018.
61. Califano R, Tariq N, Compton S, et al. Expert Consensus on the Management of Adverse Events from EGFR Tyrosine Kinase Inhibitors in the UK. Drugs. 2015;75(12):1335-1348.
62. Han JY, Park K, Kim SW, et al. First-SIGNAL: first-line single-agent iressa versus gemcitabine and cisplatin trial in never-smokers with adenocarcinoma of the lung. J Clin Oncol. 2012;30(10):1122-1128.
63. Paz-Ares L, Tan EH, O'Byrne K, et al. Afatinib versus gefitinib in patients with EGFR mutation-positive advanced non-small-cell lung cancer: overall survival data from the phase IIb LUX-Lung 7 trial. Ann Oncol. 2017;28(2):270-277.
64. Osoba D, Rodrigues G, Myles J, Zee B, Pater J. Interpreting the significance of changes in health-related quality-of-life scores. J Clin Oncol. 1998;16(1):139-144.
65. National Institute for Health and Care Excellence (NICE). Gefitinib for the first-line treatment of locally advanced or metastatic non-small-cell lung cancer; Committee Papers [TA192]. 2010; https://www.nice.org.uk/guidance/ta192.

Company evidence submission template for dacomitinib for untreated EGFR-positive non-small-cell lung cancer (ID1346)
© Pfizer (2018). All rights reserved Page 148 of 388
66. National Institute for Health and Care Excellence (NICE). Erlotinib for the first line treatment of EGFR-TK mutation positive non-small-cell lung cancer; Committee Papers [TA258]. 2012; https://www.nice.org.uk/guidance/ta258.
67. National Institute for Health and Care Excellence (NICE). Afatinib for treating epidermal growth factor receptor mutation-positive locally advanced or metastatic non-small-cell lung cancer; Committee Papers [TA310]. 2014; https://www.nice.org.uk/guidance/ta310.
68. National Institute for Health and Care Excellence (NICE). Osimertinib for treating locally advanced or metastatic EGFR T790M mutation-positive non-small-cell lung cancer; Committee Papers [TA416]. 2016; https://www.nice.org.uk/guidance/ta416.
69. Yang JC, Hirsh V, Schuler M, et al. Symptom control and quality of life in LUX-Lung 3: a phase III study of afatinib or cisplatin/pemetrexed in patients with advanced lung adenocarcinoma with EGFR mutations. J Clin Oncol. 2013;31(27):3342-3350.
70. National Institute for Health and Care Excellence (NICE). Erlotinib and gefitinib for treating non-small-cell lung cancer that has progressed after prior chemotherapy; Committee Papers [TA374]. 2015; https://www.nice.org.uk/guidance/ta374.
71. Kelly WJ, Shah NJ, Subramaniam DS. Management of Brain Metastases in Epidermal Growth Factor Receptor Mutant Non-Small-Cell Lung Cancer. Front Oncol. 2018;8:208.
72. National Institute for Health and Care Excellence (NICE). Erlotinib monotherapy for maintenance treatment of non-small-cell lung cancer; Final appraisal determination. 2011; https://www.nice.org.uk/guidance/ta227/documents/lung-cancer-nonsmallcell-advanced-or-metastatic-maintenance-treatment-erlotinib-monotherapy-final-appraisal-determination3.
73. National Institute for Health and Care Excellence (NICE). Erlotinib for the first-line treatment of locally advanced or metastatic EGFR-TK mutation-positive non-small-cell lung cancer; Final appraisal determination [TA258]. 2012; https://www.nice.org.uk/guidance/ta258.
74. National Institute for Health and Care Excellence (NICE). Crizotinib for treating ROS1-positive advanced non-small-cell lung cancer; Committee Papers [TA529]. 2018; https://www.nice.org.uk/guidance/ta529.
75. National Institute for Health and Care Excellence (NICE). Atezolizumab for treating locally advanced or metastatic non-small-cell lung cancer after chemotherapy; Committee Papers [TA520] 2018; https://www.nice.org.uk/guidance/ta520.
76. National Institute for Health and Care Excellence (NICE). Pembrolizumab for untreated PD-L1-positive metastatic non-small-cell lung cancer; Committee Papers [TA531]. 2018; https://www.nice.org.uk/guidance/ta531
77. National Institute for Health and Care Excellence (NICE). Alectinib for untreated ALK-positive advanced non-small-cell lung cancer; Committee Papers [TA536]. 2018; https://www.nice.org.uk/guidance/ta536.

Company evidence submission template for dacomitinib for untreated EGFR-positive non-small-cell lung cancer (ID1346)
© Pfizer (2018). All rights reserved Page 149 of 388
78. National Institute for Health and Care Excellence (NICE). Guide to the methods of technology appraisal 2013; https://www.nice.org.uk/process/pmg9/chapter/the-reference-case. Accessed 25 October, 2018.
79. National Institute for Health and Care Excellence (NICE). Nintedanib for previously treated locally advanced, metastatic, or locally recurrent non‐small‐cell lung cancer; Committee Papers [TA347]. 2015; https://www.nice.org.uk/guidance/ta347.
80. STATA. Fractional polynomials 2018; https://www.stata.com/features/overview/fractional-polynomials/. Accessed 25 October, 2018.
81. Latimer N. NICE DSU Technical Support Document 14: Survival analysis for economic evaluations alongside clinical trials - extrapolation with patient-level data 2011; http://nicedsu.org.uk/wp-content/uploads/2016/03/NICE-DSU-TSD-Survival-analysis.updated-March-2013.v2.pdf. Accessed 25 October, 2018.
82. Yoshioka H, Mitsudomi T, Morita S, et al. Final overall survival results of WJTOG 3405, a randomized phase 3 trial comparing gefitinib (G) with cisplatin plus docetaxel (CD) as the first-line treatment for patients with non-small cell lung cancer (NSCLC) harboring mutations of the epidermal growth factor receptor (EGFR). American Society of Clinical Oncology; 2014.
83. National Institute for Health and Care Excellence (NICE). Position statement on use of the EQ-5D-5L valuation set. 2017; https://www.nice.org.uk/Media/Default/About/what-we-do/NICE-guidance/NICE-technology-appraisal-guidance/eq5d5l_nice_position_statement.pdf. Accessed 25 October, 2018.
84. Dolan P, Gudex C, Kind P, Williams A. A social tariff for EuroQol: results from a UK general population survey. 1995.
85. National Institute for Health and Care Excellence (NICE). Crizotinib for untreated anaplastic lymphoma kinase-positive advanced non-small-cell lung cancer; Committee Papers [TA406]. 2016; https://www.nice.org.uk/guidance/ta406.
86. National institute for Health and Care Excellence (NICE). Crizotinib for previously treated non-small-cell lung cancer associated with an anaplastic lymphoma kinase fusion gene; Committee Papers [TA296]. 2013; https://www.nice.org.uk/guidance/ta296.
87. Labbe C, Leung Y, Silva Lemes JG, et al. Real-World EQ5D Health Utility Scores for Patients With Metastatic Lung Cancer by Molecular Alteration and Response to Therapy. Clin Lung Cancer. 2017;18(4):388-395.e384.
88. Nafees B, Stafford M, Gavriel S, Bhalla S, Watkins J. Health state utilities for non small cell lung cancer. Health Qual Life Outcomes. 2008;6:84.
89. National Institute for Health and Care Excellence (NICE). Ceritinib for previously treated anaplastic lymphoma kinase positive non-small-cell lung cancer; Committee Papers [TA395]. 2016; https://www.nice.org.uk/guidance/ta395.

Company evidence submission template for dacomitinib for untreated EGFR-positive non-small-cell lung cancer (ID1346)
© Pfizer (2018). All rights reserved Page 150 of 388
90. US Department of Health and Human Services. Common terminology criteria for adverse events (CTCAE) version 4.0. National Institutes of Health, National Cancer Institute. 2009;4(03).
91. Pickard AS, Neary MP, Cella D. Estimation of minimally important differences in EQ-5D utility and VAS scores in cancer. Health Qual Life Outcomes. 2007;5:70.
92. Kvam AK, Fayers PM, Wisloff F. Responsiveness and minimal important score differences in quality-of-life questionnaires: a comparison of the EORTC QLQ-C30 cancer-specific questionnaire to the generic utility questionnaires EQ-5D and 15D in patients with multiple myeloma. Eur J Haematol. 2011;87(4):330-337.
93. National Institute for Health and Care Excellence (NICE). Osimertinib for treating metastatic EGFR and T790M mutation-positive non-smallcell lung cancer [ID874] Single Technology Appraisal [TA416]; Committee Papers. 2016; https://www.nice.org.uk/guidance/ta416.
94. Nafees B, Lloyd AJ, Dewilde S, Rajan N, Lorenzo M. Health state utilities in non-small cell lung cancer: An international study. Asia Pac J Clin Oncol. 2017;13(5):e195-e203.
95. Boehringer Ingelheim. Afatinib (GIOTRIF) Summary of Product Characteristics. 2017; https://www.ema.europa.eu/documents/product-information/giotrif-epar-product-information_en.pdf. Accessed 26 October, 2018.
96. Roche. Erlotinib (TARCEVA) Summary of Product Characteristics. 2016; https://www.ema.europa.eu/documents/product-information/tarceva-epar-product-information_en.pdf. Accessed 26 October, 2018.
97. Curtis L, Burns A. Unit Costs of Health and Social Care 2017. 2017. 98. National Institute for Health and Care Excellence (NICE). Ceritinib for
untreated ALK-positive non-small-cell lung cancer; Committee Papers [TA500]. 2018; https://www.nice.org.uk/guidance/ta500.
99. Pfizer. Pfizer One-to-one interviews with UK clinical experts; Pfizer Data on File. 2018.
100. Sequist L, Wu Y-L, Schuler M, et al. 1349PSubsequent therapies post-afatinib among patients (pts) with EGFR mutation-positive (EGFRm+) NSCLC in LUX-Lung (LL) 3, 6 and 7. Annals of Oncology. 2017;28(suppl_5).
101. Yu HA, Arcila ME, Rekhtman N, et al. Analysis of tumor specimens at the time of acquired resistance to EGFR-TKI therapy in 155 patients with EGFR-mutant lung cancers. Clin Cancer Res. 2013;19(8):2240-2247.
102. Mok TS, Wu YL, Ahn MJ, et al. Osimertinib or Platinum-Pemetrexed in EGFR T790M-Positive Lung Cancer. N Engl J Med. 2017;376(7):629-640.
103. AstraZeneca. Osimeritinib (TAGRISSO) Summary of Product Characteristics. 2016.
104. Eli Lilly. Pemetrexed (ALIMTA) Summary of Product Characteristics. 2018; https://www.ema.europa.eu/documents/product-information/pemetrexed-pfizer-epar-product-information_en.pdf. Accessed 26 October, 2018.
105. Sanofi. Docetaxel (TAXOTERE) Summary of Product Characteristics. 2009;

Company evidence submission template for dacomitinib for untreated EGFR-positive non-small-cell lung cancer (ID1346)
© Pfizer (2018). All rights reserved Page 151 of 388
https://www.ema.europa.eu/documents/product-information/taxotere-epar-product-information_en.pdf. Accessed 26 October, 2018.
106. Sacco JJ, Botten J, Macbeth F, Bagust A, Clark P. The average body surface area of adult cancer patients in the UK: a multicentre retrospective study. PLoS One. 2010;5(1):e8933.
107. Solomon BJ, Kim DW, Wu YL, et al. Final Overall Survival Analysis From a Study Comparing First-Line Crizotinib Versus Chemotherapy in ALK-Mutation-Positive Non-Small-Cell Lung Cancer. J Clin Oncol. 2018;36(22):2251-2258.
108. (BNF); BNF. 2018; https://bnf.nice.org.uk/ Accessed 20 June, 2018. 109. Department of Health and Social Care. Drugs and pharmaceutical electronic
market information tool (eMIT). 2011; https://www.gov.uk/government/publications/drugs-and-pharmaceutical-electronic-market-information-emit. Accessed 25 October, 2018.
110. NHS. Reference costs; 2016/17 reference cost data. 2017; https://improvement.nhs.uk/resources/reference-costs/. Accessed 25 October, 2018.
111. National Institute for Health and Care Excellence (NICE). Crizotinib for previously treated anaplastic lymphoma kinase-positive advanced non-small-cell lung cancer; Committee Papers [TA422]. 2016; https://www.nice.org.uk/guidance/ta422.
112. National Institute for Health and Care Excellence (NICE). Erlotinib for the treatment of non-small-cell lung cancer [TA162]. 2012; https://www.nice.org.uk/guidance/ta162.
113. Brown T, Pilkington G, Bagust A, et al. Clinical effectiveness and cost-effectiveness of first-line chemotherapy for adult patients with locally advanced or metastatic non-small cell lung cancer: a systematic review and economic evaluation. Health Technol Assess. 2013;17(31):1-278.
114. National institute for Health and Care Excellence (NICE). Nivolumab for previously treated non-squamous non-small-cell lung cancer; Committee Papers [TA484]. 2017; https://www.nice.org.uk/guidance/ta484.
115. National Institute for Health and Care Excellence (NICE). Nivolumab for previously treated squamous non-small-cell lung cancer; Committee Papers [TA483]. 2017; https://www.nice.org.uk/guidance/ta483.
116. National Institute for Health and Care Excellence. Necitumumab for untreated advanced or metastatic squamous non-small-cell lung cancer; Committee Papers [TA411]. 2016; https://www.nice.org.uk/guidance/ta411.
117. National Institute for Health and Care Excellence. Pembrolizumab for treating PD-L1-positive non-small-cell lung cancer after chemotherapy; Committee Papers [TA428]. 2017; https://www.nice.org.uk/guidance/ta428.
118. Curtis L, Burns A. Unit Costs of Health and Social Care 2015. Vol 20182015. 119. Chouaid C, Luciani L, LeLay K, et al. Cost-Effectiveness Analysis of Afatinib
versus Gefitinib for First-Line Treatment of Advanced EGFR-Mutated Advanced Non-Small Cell Lung Cancers. J Thorac Oncol. 2017;12(10):1496-1502.

Company evidence submission template for dacomitinib for untreated EGFR-positive non-small-cell lung cancer (ID1346)
© Pfizer (2018). All rights reserved Page 152 of 388
120. Holleman M, Zaim R, Uyl-De Groot C. Cost-utility analysis of first-line gefitinib, erlotinib and afatinib in patients with non-small cell lung cancer Harboring EGFR mutations. Value in Health. 2016;19(7):A740-A741.
121. Centre for Reviews and Dissemination. Systematic Reviews: CRD’s guidance for undertaking reviews in health care. 2009; https://www.york.ac.uk/media/crd/Systematic_Reviews.pdf. Accessed 8 October, 2018.
122. Moher D, Liberati A, Tetzlaff J, Altman DG. Preferred reporting items for systematic reviews and meta-analyses: the PRISMA statement. PLoS Med. 2009;6(7):e1000097.
123. Pao W, Miller VA, Kris MG. 'Targeting' the epidermal growth factor receptor tyrosine kinase with gefitinib (Iressa) in non-small cell lung cancer (NSCLC). Semin Cancer Biol. 2004;14(1):33-40.
124. Shi YK, Wang L, Han BH, et al. First-line icotinib versus cisplatin/pemetrexed plus pemetrexed maintenance therapy for patients with advanced EGFR mutation-positive lung adenocarcinoma (CONVINCE): a phase 3, open-label, randomized study. Annals of Oncology. 2017;28(10):2443-2450.
125. Wu YL, Yang JJ, Zhou C, et al. PL03.05: BRAIN: A Phase III Trial Comparing WBI and Chemotherapy with Icotinib in NSCLC with Brain Metastases Harboring EGFR Mutations (CTONG 1201). Journal of Thoracic Oncology. 2017;12(1):S6.
126. Seto T, Kato T, Nishio M, et al. Erlotinib alone or with bevacizumab as first-line therapy in patients with advanced non-squamous non-small-cell lung cancer harbouring EGFR mutations (JO25567): an open-label, randomised, multicentre, phase 2 study. Lancet Oncology. 2014;15(11):1236-1244.
127. Rothman KJ, Greenland S. "The emergence of modern epidemiology" in Modern epidemiology. 2nd ed. ed. United States: Philadelphia : Lippincott-Raven; 1998.
128. Greenland S. Modeling and variable selection in epidemiologic analysis. Am J Public Health. 1989;79(3):340-349.
129. Phillippo D, Ades T, Dias S, Palmer S, Abrams KR, Welton N. NICE DSU Technical Support Document 18: Methods for population-adjusted indirect comparisons in submissions to NICE. 2016.
130. Lee CK, Davies L, Wu Y-L, et al. Gefitinib or Erlotinib vs Chemotherapy for EGFR Mutation-Positive Lung Cancer: Individual Patient Data Meta-Analysis of Overall Survival. Journal of the National Cancer Institute. 2017;109(6):01.
131. Higgins JP, Altman DG, Gotzsche PC, et al. The Cochrane Collaboration's tool for assessing risk of bias in randomised trials. Bmj. 2011;343:d5928.
132. ClinicalTrials.gov. Dacomitinib (PF-00299804) As A Single Oral Agent In Selected Patients With Adenocarcinoma Of The Lung. 2016; https://clinicaltrials.gov/ct2/show/NCT00818441?intr=Dacomitinib&phase=12&rank=9. Accessed 11 October, 2018.
133. Drummond MF, Jefferson TO. Guidelines for authors and peer reviewers of economic submissions to the BMJ. The BMJ Economic Evaluation Working Party. Bmj. 1996;313(7052):275-283.

Company evidence submission template for dacomitinib for untreated EGFR-positive non-small-cell lung cancer (ID1346)
© Pfizer (2018). All rights reserved Page 153 of 388
134. National Institute for Health and Care Excellence (NICE). Single technology appraisal: User guide for company evidence submission template. 2015; https://www.nice.org.uk/process/pmg24/chapter/instructions-for-companies. Accessed 2 October, 2018.

Company evidence submission template for dacomitinib for untreated EGFR-positive non-small-cell lung cancer (ID1346)
© Pfizer (2018). All rights reserved Page 154 of 388
B.5 Appendices
XXXXXXXXXXXXXXXXXXXXXXXXXXXXXXXXXXXXXXXXXXXXXXXXXXXXXXXXXX
XXXXXXXXXXXXXXXXXXXXXXXXXXXXXXXXXXXXXXXX
Appendix D: Identification, selection and synthesis of clinical evidence
Appendix E: Subgroup analysis
Appendix F: Adverse reactions
Appendix G: Published cost-effectiveness studies
Appendix H: Health-related quality-of-life studies
Appendix I: Cost and healthcare resource identification, measurement and valuation
Appendix J: Clinical outcomes and disaggregated results from the model
Appendix K: Checklist of confidential information
Appendix L: Base-case analysis inputs
Appendix M: Base-case results
Level 1A City Tower
Manchester M1 4BT
United Kingdom
+44 (0)300 323 0140
www.nice.org.uk
Single technology appraisal
Dacomitinib for untreated EGFR-positive non-small-cell lung cancer [ID1346] Dear [Insert name], The Evidence Review Group, Warwick Evidence, and the technical team at NICE have looked at the submission received on the 7th of December from Pfizer. In general they felt that it is well presented and clear. However, the ERG and the NICE technical team would like further clarification on the clinical and cost effectiveness data (see questions listed at end of letter). The ERG and the technical team at NICE will be addressing these issues in their reports. Please provide your written response to the clarification questions by 5pm on the 23rd of January 2019. Your response and any supporting documents should be uploaded to NICE Docs/Appraisals [embed NICE DOCS LINK]. Two versions of your written response should be submitted; one with academic/commercial-in-confidence information clearly marked and one with this information removed. Please underline all confidential information, and separately highlight information that is submitted as commercial in confidence in turquoise, and all information submitted as academic in confidence in yellow. If you present data that are not already referenced in the main body of your submission and that are academic/commercial in confidence, please complete the attached checklist for confidential information. Please do not embed documents (PDFs or spreadsheets) in your response because this may result in them being lost or unreadable. If you have any queries on the technical issues raised in this letter, please contact Luke Cowie, Technical Lead ([email protected]). Any procedural questions should be addressed to Kate Moore, Project Manager ([email protected]). Yours sincerely Nicola Hay Technical Adviser – Technology Appraisals, on behalf of Linda Landells Associate Director – Technology Appraisals Centre for Health Technology Evaluation

Level 1A City Tower
Manchester M1 4BT
United Kingdom
+44 (0)300 323 0140
www.nice.org.uk
NATIONAL INSTITUTE FOR HEALTH AND CARE EXCELLENCE
Single technology appraisal
Dacomitinib for untreated EGFR-positive non-small-cell lung cancer [ID1346]
Clarification questions
March 2019
File name Version Contains
confidential information
Date
Yes/no

Level 1A City Tower
Manchester M1 4BT
United Kingdom
+44 (0)300 323 0140
www.nice.org.uk
Notes for company
Highlighting in the template
Square brackets and grey highlighting are used in this template to indicate text that
should be replaced with your own text or deleted. These are set up as form fields,
so to replace the prompt text in [grey highlighting] with your own text, click
anywhere within the highlighted text and type. Your text will overwrite the
highlighted section.
To delete grey highlighted text, click anywhere within the text and press
DELETE.

Level 1A City Tower
Manchester M1 4BT
United Kingdom
+44 (0)300 323 0140
www.nice.org.uk
Section A: Clarification on effectiveness data
Literature searching
A1. Four publications from three studies initially included in the broad review are
excluded for this company submission (CS). Citations (reference numbers 124-126)
related to three of these publications are provided in the text (CS Appendix page 195).
Please provide citation details and a PDF of the publication that is not cited.
[Company: please enter your answer to this question here]
A2. Please provide citation details for all of the 339 + 40 publications excluded at full-
text review, as not all of them are listed in the CS Appendices (Sections 1.7.2.1-
1.7.2.3., page 209-234)
[Company: please enter your answer to this question here]
A3. Please provide the record of the search in Clinicaltrials.gov.
[Company: please enter your answer to this question here]
A4. Please provide references and underlying evidence in support of the statement
“These two mutations alone constitute approximately 80–90% of EGFR mutations in
adenocarcinomas.” (CS Document B, page19).
[Company: please enter your answer to this question here]
A5. In the update of the systematic reviews used to identify records reporting health-
related quality of life, and publications reporting information related to resource use
and costs, it appears that 64 records (Figure 65, CS Appendix, page.310) and 27

Level 1A City Tower
Manchester M1 4BT
United Kingdom
+44 (0)300 323 0140
www.nice.org.uk
records (Figure 70, CS Appendix, page.350) were excluded, respectively. Please
provide a list of the excluded records with the reasons for exclusion.
[Company: please enter your answer to this question here]
ARCHER 1050 trial
A6. Priority question: In the CS, it is stated that “clinical expert opinion suggested
that studies with a predominately Asian population tend to mirror what is seen in
Caucasian patients” (CS Document B, page92). Please elaborate on this claim and
explain whether these views are specific to non-small-cell lung cancer (NSCLC),
especially in light of evidence to the contrary in other NSCLC treatments?
[Company: please enter your answer to this question here]
A7. Priority question: In the CS, it is stated that “Patient demographic and baseline
characteristics [of ARCHER 1050 participants] were representative of the intended
patient population for dacomitinib in the first-line setting.” (CS Document B, page 92).
Please provide a simple comparison highlighting similarities and differences in patient
demographic characteristics, including race/ethnicity, between ARCHER 1050
participants and the intended patient population for dacomitinib in England.
[Company: please enter your answer to this question here]
A8. Priority question: Please provide Kaplan Meier (KM) plots of overall survival (OS)
and progression-free survival (PFS) for the Asian and non-Asian populations in the
ARCHER 1050 trial by treatment arm.
[Company: please enter your answer to this question here]
A9. Priority question: Figure 14 (CS Document B, page 63) presents the forest plot
of OS (stratified by subgroups; intention-to-treat (ITT) population). Please provide the
equivalent forest plot and information (i.e. HR and 95% CI, p-values for interactions)
for PFS.
[Company: please enter your answer to this question here]

Level 1A City Tower
Manchester M1 4BT
United Kingdom
+44 (0)300 323 0140
www.nice.org.uk
A10. The NICE scope for this appraisal is for people with ‘EGFR activating mutations’.
The ARCHER 1050 trial included only people with del19 or L858R mutation and
people with both of these mutations were excluded, (CS Document B Table 5, page
28). Please explain why these people were excluded from the trial.
[Company: please enter your answer to this question here]
A11. For the ARCHER 1050 trial, please provide details on how many participants
were randomised in European sites (Italy, Spain, Poland).
[Company: please enter your answer to this question here]
A12. Please clarify how the blinded Independent Review Committee (IRC) review of
PFS was carried out in ARCHER 1050.
[Company: please enter your answer to this question here]
A13. Please provide the definition for “global deterioration of health” (CS Appendix,
Section D.2, Figure 39), which is used as a reason for discontinuation.
[Company: please enter your answer to this question here]
A14. Please provide the definition for “adequate renal, hepatic and haematological
function” (CS Document B, Table 4), which is used as an inclusion criterion in
ARCHER 1050.
[Company: please enter your answer to this question here]
A15. Table 8 (CS Document B, page 32) lists prior and concomitant medications used
during the ARCHER 1050 trial. Please provide details of concomitant medications
given by study treatment arm.
[Company: please enter your answer to this question here]

Level 1A City Tower
Manchester M1 4BT
United Kingdom
+44 (0)300 323 0140
www.nice.org.uk
A16. In the CS Document B (page 92), it is stated that the “vast majority” of participants
had stage IIIb or IV disease. Please clarify if the remaining participants are those with
disease stage ‘unknown’ at study screening and stage IV at study entry (CS Table 10).
[Company: please enter your answer to this question here]
A17. Please clarify how ARCHER 1050 trial participants were diagnosed with the
T790M mutation and describe the treatment pathway for these patients.
[Company: please enter your answer to this question here]
A18. Figure 13 (CS Document B, page 62) gives forest plots for PFS, stratified by
subgroups. In the non-Asian population, median PFSl appears to be XXX months in
the dacomitinib group and XXX months in the gefitinib group (HR XXXX [95%CIXXX,
XXXX]; p=XXXXX). Please:
i) justify why one-sided p-values were used in this analysis and confirm whether
the p-value (XXXXX) above is correct.
ii) confirm the significance threshold for Figures 12 and 13 is 0.025 (from the
statistical analysis plan), and explain why this is not included in the figures.
[Company: please enter your answer to this question here]
Section B: Clarification on cost-effectiveness data
Literature searching
B1. In the PRISMA diagram in Figure 64 (CS Appendix, page. 288), it is indicated that
169 records were excluded at full-text stage. Please provide a list of the excluded
studies with the reasons for exclusion.
[Company: please enter your answer to this question here]

Level 1A City Tower
Manchester M1 4BT
United Kingdom
+44 (0)300 323 0140
www.nice.org.uk
ARCHER 1050 trial
B2. Priority question: Please provide a comparison of the gefitinib and dacomitinib
smoothed-hazard and cumulative hazard plots, with the company base case gen-
gamma and FP models overlaid. Please present these as two figures.
[Company: please enter your answer to this question here]
B3. Priority question: Please provide an updated economic model that allows:
i) a comparison between both treatment arms of the ARCHER 1050 trial to be
made with both treatment arms being modelled by independent parametric
models (i.e. no proportionality assumption and not using results from the
fractional polynomial (FP) network meta-analysis (NMA));
ii) the cost-effectiveness analysis to be undertaken separately for the ITT, Asian
and non-Asian population.
[Company: please enter your answer to this question here]
B4. Priority question: Please provide hazard and cumulative hazard plots against
time:
i) for both the gefitinib and dacomitinib treatment arms of ARCHER 1050 overlaid
with the fits of each parametric model (i.e. without using FP). Please present
these as four figures.
ii) with the parametric curves for both gefitinib and dacomitinib in the Asian and
non-Asian populations.
[Company: please enter your answer to this question here]
B5. Priority question: Please clarify how the parametric models fitted to the gefitinib
treatment arm of ARCHER 1050 were combined with the FP analysis. Were the
hazard ratios from the FP analysis applied to the parametric model? If so, please clarify

Level 1A City Tower
Manchester M1 4BT
United Kingdom
+44 (0)300 323 0140
www.nice.org.uk
why the gefitinib treatment arm was modelled using the parametric fit to the ARCHER
1050 trial data, rather than the FP model alone.
[Company: please enter your answer to this question here]
B6. Priority question: Figure 32 (CS Document B, page 108) presents the OS curves,
along with the company’s choice of the fully-fitted parametric curves applied to the
observed data. Data beyond 30 months are immature, with the KM curves appearing
to overlap at approximately 36 months. Please add an option to the economic model
that allows entering a hazard ratio of 1 for OS across all comparators after 36 months
(e.g. a waning effect).
[Company: please enter your answer to this question here]
B7. Priority question: In Figures 5 and 6 (CS Document B, page 52-53), the KM plots
for PFS and OS appear to overlap and cross. Please:
i) provide a justification for not applying a two-phase piecewise (KM plus
parametric) modelling approach to model survival outcomes used in the
economic model;
ii) add an option that allows implementing a two-phase piecewise model, using
KM data until 8 months for PFS and 12 months for OS, after which parametric
models are fitted and used to extrapolate.
[Company: please enter your answer to this question here]
B8. Priority question: Figure 14 (CS Document B, page.64) presents the forest plot
of OS (stratified by subgroups; ITT population). Please provide the equivalent forest
plot and information (i.e. HR and 95% CI, p-values for interactions) for PFS (IRC).
[Company: please enter your answer to this question here]

Level 1A City Tower
Manchester M1 4BT
United Kingdom
+44 (0)300 323 0140
www.nice.org.uk
B9. A table (‘Adverse Events’ worksheet; cells ‘E7:J14’) in the company’s economic
model reports the frequency of Adverse Events (AEs) by treatment. Please:
i) clarify whether these values represent the proportion of people who
experienced each of the listed AE or reflects the number of AEs that people
experienced (i.e. it captures recurrent events);
ii) provide a full list of incidences (first, second, and subsequent) of grade 3-5
AEs, by treatment.
[Company: please enter your answer to this question here]
B10. In the economic model, the progression-free states is assigned utility values
obtained from the ARCHER 1050 trial, while utility values for progressed disease are
taken from the study by Labbé and colleagues. Given that the ARCHER 1050 trial
methodology states that “Patient reported outcomes were assessed at days 1
(baseline), 8, and 15 of cycle one, on day 1 of subsequent cycles, at the end-of-
treatment visit, and at the posttreatment follow up visit” (Wu et al., 2017 p. 1456),
please provide summary statistics for the EQ-5D data collected at the end-of-
treatment/post treatment follow-up visits by trial treatment arm.
[Company: please enter your answer to this question here]
B11. In the CS (Document B, page 107) it is stated that time-to-treatment
discontinuation was not available for all the comparators. Please give information on
treatment duration for those comparators (afatinib and erlotinib) where such
information is available.
[Company: please enter your answer to this question here]
B12. Please provide the standard errors for the mean progression-free utility values
reported in Table 37 (CS, Document B, page113).
[Company: please enter your answer to this question here]

Level 1A City Tower
Manchester M1 4BT
United Kingdom
+44 (0)300 323 0140
www.nice.org.uk
B13. Please reproduce the FP NMA for the Asian and non-Asian populations.
[Company: please enter your answer to this question here]
B14. Please provide the digitised graph and resulting generated data for the FP NMA.
[Company: please enter your answer to this question here]
B15. Please provide the FP NMA code and data.
[Company: please enter your answer to this question here]
B16. There appears to be a discrepancy between the cost per cycle values in CS
Document B (Table 38, page116 ) and the equivalent values in the economic model
(sheet ‘Medical Costs, Drugs’, cells F26:F29). Please clarify whether the values in cells
F26:F29 are incorrect and confirm that these values have not been used in the
calculations underpinning any of the results presented in the submission.
[Company: please enter your answer to this question here]
B17. Please confirm whether monetary values related to health care use taken from
past analyses and literature (e.g. cost of terminal care) are appropriately adjusted for
differential timing.
[Company: please enter your answer to this question here]
B18. In CS Document B, page112, it is stated that “these values were also aligned
with the only real world EGFR+ NSCLC value identified in the SLR (Labbé et al. 2017
[0.77]), therefore this value was applied in scenario analysis.” Please clarify the
meaning of the expression ‘real world values’ in this particular context.
[Company: please enter your answer to this question here]
B19. Please confirm whether utility values used in the economic model calculations
have been adjusted over the time horizon to reflect the modelled patients’ age-related
decline in health-related quality of life.
[Company: please enter your answer to this question here]

Level 1A City Tower
Manchester M1 4BT
United Kingdom
+44 (0)300 323 0140
www.nice.org.uk
Section C: Textual clarification and additional points
C1. Please define the footnotes for adverse events in Figure 39 (CS Appendix D.2,
page 256).
[Company: please enter your answer to this question here]
C2. In CS Document A, page 20, the Incremental Cost Effectiveness Ratio (ICER) for
dacomitinib is reported to be £XXXXX per QALY gained. This result is not consistent
with the ICER value for dacomitinib reported in Table 6, page 20. Please confirm
whether £ XXXXX is a typographical error.
[Company: please enter your answer to this question here]
C3. Please provide all 134 references (related to CS Document B and Appendix) as
either a RIS. file or an archived EndNote library.
[Company: please enter your answer to this question here]
C4. Please provide a PDF for reference 55 ‘Pfizer. Data on file. 2017’, cited at the end
of page 65 (CS Document B, section B.2.9.1)
[Company: please enter your answer to this question here]
C5. Please provide a PDF for reference 99. ‘Pfizer. Pfizer One-to-one interviews with
UK clinical experts; Pfizer Data on File. 2018’, cited on page115 (CS Document B,
section B.3.5.2)
[Company: please enter your answer to this question here]

Level 1A City Tower
Manchester M1 4BT
United Kingdom
+44 (0)300 323 0140
1 www.nice.org.uk
NATIONAL INSTITUTE FOR HEALTH AND CARE EXCELLENCE
Single technology appraisal
Dacomitinib for untreated EGFR-positive non-small-cell lung cancer [ID1346]
Clarification questions
January 2019
File name Version Contains
confidential information
Date
ID1346_Dacomitinib_EGFR_NSCLC_Clarification_ Response_23JAN19.docx
Final Yes 23rd January 2019

Level 1A City Tower
Manchester M1 4BT
United Kingdom
+44 (0)300 323 0140
2 www.nice.org.uk
Dear Linda,
Pfizer would like to thank Warwick Evidence and the NICE technical team for the
clarification questions and opportunity to provide further detail to aid the evaluation of
our evidence submission. Please find below Pfizer’s response to the questions.
Please note that additional programming is being conducted for question B9 which is
not included in this current document.
We noted that in question A8 we are requested to provide KM plots of OS and PFS
for the Asian and non-Asian populations. Pfizer believes the ITT is the appropriate
population for decision making. There are significant limitations with using the non-
Asian subgroup from ARCHER 1050 because of the relatively small proportion of
patients (23% of ITT), the imbalance of older patients between treatment arms in this
subgroup, and the fact the study was not powered to show statistically significant
differences between treatments in this subgroup (more details are provided in A8).
The ERG have also requested additional scenarios that explore survival
extrapolations. However, Pfizer would like to highlight that it feels these could only
be considered exploratory given the evidence base and the recommendations in
NICE DSU guidelines. One such assumption is that the observed survival benefit
dissipates at 36 months. This is based on censored data (small numbers of patients
at risks) and is misaligned to the previously observed trends. Furthermore, such an
approach is not recommended in the NICE DSU guidelines.
Despite the limitations with these scenarios, Pfizer has responded to the ERG’s
requests and has provided an updated economic model along with related files
containing additional source data. Should the ERG require additional clarity we
welcome further opportunity to engage.
Sincerely,
XXXXXXXXXXXXXXXXXXXXXXXXXXXXXXXXXXXXXXXXXXXXXXX
Level 1A City Tower
Manchester M1 4BT
United Kingdom
+44 (0)300 323 0140
3 www.nice.org.uk
Section A: Clarification on effectiveness data
Literature searching
A1. Four publications from three studies initially included in the broad review are
excluded for this company submission (CS). Citations (reference numbers 124-126)
related to three of these publications are provided in the text (CS Appendix page 195).
Please provide citation details and a PDF of the publication that is not cited.
In addition to the primary publications included in the CS, please see the following
companion PDF publications attached with the response:
CONVINCE
o Shi 2017 (abstract only available online
http://ascopubs.org/doi/abs/10.1200/JCO.2016.34.15_suppl.9041)
o Shi 2016 First-line icotinib versus cisplatin/pemetrexed plus pemetrexed
maintenance therapy in lung adenocarcinoma patients with EGFR
mutation (CONVINCE) Annals of Oncology 27 (Supplement 6): vi416–
vi454
JO25567
o Zhang 2016 Efficacy and safety of bevacizumab plus erlotinib versus
bevacizumab or erlotinib alone in the treatment of non-small-cell lung
cancer: a systematic review and meta-analysis BMJ Open
2016;6:e011714.
o Kato 2018 Erlotinib Plus Bevacizumab Phase ll Study in Patients with
Advanced Non-small-Cell Lung Cancer (JO25567): Updated Safety
Results Drug Saf. 41(2):229-23

Level 1A City Tower
Manchester M1 4BT
United Kingdom
+44 (0)300 323 0140
4 www.nice.org.uk
A2. Please provide citation details for all of the 339 + 40 publications excluded at full-
text review, as not all of them are listed in the CS Appendices (Sections 1.7.2.1-
1.7.2.3., page 209-234)
Please see list of citation for those missing from CS in Appendix A (97 studies that did
not include intervention of interest and the 21 studies that were unavailable).
A3. Please provide the record of the search in Clinicaltrials.gov.
Please see details of the search strategy applied in Clinicaltrails.gov in Table 1 and
the respective data extraction excel file attached with the response
(Clinicaltrials.gov.xlsx).
Table 1: Clinicaltrials.gov search strategy for RCT/non-RCT SLR Field Search term
Condition or disease Non Small Cell Lung Cancer
Study type All studies
Study Results Studies with Results
Age Group Adult (18-64); Older Adult (65+)
Sex All
A4. Please provide references and underlying evidence in support of the statement
“These two mutations alone constitute approximately 80–90% of EGFR mutations in
adenocarcinomas.” (CS Document B, page19).
The relevant reference is Reference 25 from the CS:
Juan O, Popat S. Treatment choice in epidermal growth factor receptor
mutation-positive non-small cell lung carcinoma: latest evidence and clinical
implications. Therapeutic advances in medical oncology. 2017;9(3):201-216
There is also underlying evidence in the following publications:
Allan L, Dhananjay C, Gregory R, William P, Vincent M, Maureen Z, Valerie
R, Mark K, and Marc L. EGFR Mutations in Lung Adenocarcinomas: Clinical
Testing Experience and Relationship to EGFR Gene Copy Number and
Immunohistochemical Expression. J Mol Diagn. 2008 May; 10(3): 242–248.

Level 1A City Tower
Manchester M1 4BT
United Kingdom
+44 (0)300 323 0140
5 www.nice.org.uk
‘The two most common EGFR mutations are short in-frame deletions of exon 19 and
a point mutation (CTG to CGG) in exon 21 at nucleotide 2573, which results in
substitution of leucine by arginine at codon 858 (L858R). Together, these two
mutations account for ∼90% of all EGFR mutations in non-small cell lung cancer
(NSCLC)’ (page 242)
‘Seventy-eight (23%) of these tumors had an EGFR mutation, with 55 (71%) exon 19
deletions and 23 (29%) exon 21 L858R mutations.’ (page 242)
Shigematsu H, Lin L, Takahashi T, Nomura M, Suzuki M, Wistuba II, Fong
KM, Lee H, Toyooka S, Shimizu N, Fujisawa T, Feng Z, Roth JA, Herz J,
Minna JD, Gazdar AF. Clinical and Biological Features Associated With
Epidermal Growth Factor Receptor Gene Mutations in Lung Cancers. J Natl
Cancer Inst. 2005 Mar 2;97(5):339-46
‘Three types of mutations constituted 94% of the mutations that we detected:
deletions in exon 19, duplications and/or insertions in exon 20, and a single-point
mutation in exon 21.’
Of this 94%, Exon 19 was observed in 46% and Exon 21 L858R in 39% (Table 2).
A5. In the update of the systematic reviews used to identify records reporting health-
related quality of life, and publications reporting information related to resource use
and costs, it appears that 64 records (Figure 65, CS Appendix, page.310) and 27
records (Figure 70, CS Appendix, page.350) were excluded, respectively. Please
provide a list of the excluded records with the reasons for exclusion.
Please see lists of citation for excluded health-related quality-of-life studies in
Appendix B and resource usage and cost studies in Appendix C.
ARCHER 1050 trial
A6. Priority question: In the CS, it is stated that “clinical expert opinion suggested
that studies with a predominately Asian population tend to mirror what is seen in

Level 1A City Tower
Manchester M1 4BT
United Kingdom
+44 (0)300 323 0140
6 www.nice.org.uk
Caucasian patients” (CS Document B, page92). Please elaborate on this claim and
explain whether these views are specific to non-small-cell lung cancer (NSCLC),
especially in light of evidence to the contrary in other NSCLC treatments?
This initial statement was informed by various discussions with UK clinicians.
Following this clarification request, we have reached out again to UK clinical experts
for additional advice. Feedback is that there is no common consensus as to whether
ethnicity plays a role; advice suggests prognosis is more usually driven by mutation
type, age and performance status however, as opposed to geographic differences.
A number of the afatinib studies included Asian and non-Asian subgroups (LUX-Lung
3, LUX-Lung 7) however, given the higher prevalence of EGFR mutations in Asian
populations both these trials had predominantly Asian cohorts, therefore leading to a
lack of power in the non-Asian subgroup to detect significance. These studies have
however, demonstrated there is no common direction for the relative efficacy between
Asian versus non-Asian patient.
Table 2. Summary of progression-free survival results in Asian and Non-Asian patients
Trial Intervention Comparator N AsianAsian HR Non-Asian
HR
LUX-Lung 3
Afatinib Chemotherapy 345 72% 0.54 (0.38,
0.76) 0.68 (0.39,
1.19)
LUX-Lung 7
Afatinib Geftinib 319 60% 0.76 (0.54,
1.06) 0.72 (0.49,
1.06)
Abbreviation: HR = hazard ratio
A7. Priority question: In the CS, it is stated that “Patient demographic and baseline
characteristics [of ARCHER 1050 participants] were representative of the intended
patient population for dacomitinib in the first-line setting.” (CS Document B, page 92).
Please provide a simple comparison highlighting similarities and differences in patient

Level 1A City Tower
Manchester M1 4BT
United Kingdom
+44 (0)300 323 0140
7 www.nice.org.uk
demographic characteristics, including race/ethnicity, between ARCHER 1050
participants and the intended patient population for dacomitinib in England.
No UK specific demographic information for EGFR NSCLC patients was identified in
the CS and the company has not been made aware of UK EGFR demographic data
during clinical expert consultation.
It should be noted that, as discussed in CS Document B page 137, ARCHER 1050
shared similar baseline characteristics to the studies utilised in the most recent EGFR
appraisals (Table 3) where the committee acknowledged that these studies were
broadly generalisable to clinical practice.
Table 3. Summary of progression-free survival results in Asian and Non-Asian patients
Baseline characteristic
ARCHER 1050 AURA pooled
IMPRESS
Dacomitinib Gefitinib Osimertinib Platinum doublet
chemotherapy
Age Mean 62.0 61.0 62.2 57.0
Median 61.2 60.9 63.0 58.0
Gender Male 36% 44% 32% 36%
Female 64% 56% 68% 64%
EGFR Exon 19 deletion
59% 59% 68% 65%
L858R 41% 41% 29% 32%
ECOG 0 33% 28% 37% 40%
1 67% 72% 63% 60%
Smoking status
Never 65% 64% 69% 69%
Ever 29% 28% 28% NR
Current 7% 8% 2% NR Abbreviations: NR = Not reported. Source: TA416 Osimertinib NICE STA Submission – February 2016 Table 4.7 page 76
A8. Priority question: Please provide Kaplan Meier (KM) plots of overall survival (OS)
and progression-free survival (PFS) for the Asian and non-Asian populations in the
ARCHER 1050 trial by treatment arm.
Progression-free survival - Asian
Level 1A City Tower
Manchester M1 4BT
United Kingdom
+44 (0)300 323 0140
8 www.nice.org.uk
Overall, a total of XXX patients (XXXXX) in the Asian population from ARCHER 1050
had a PFS event as of the data cut-off date, after application of all the censoring
rules. Of the XXX PFS events, XX patients (XXXX%; n=170) were from the
dacomitinib arm and XXX patients (XXXX%; n=176) from the gefitinib arm.
Dacomitinib demonstrated a XXX month improvement in median PFS; median PFS
was xx.x months (95% CI: XXXXXXXXXX) for dacomitinib versus XXX months (95%
CI: XXXXXXXXX) for gefitinib (HR: XXXXX; 95% CI: XXXXXXXXXXXX; 1-sided p-
value<0.0001; unstratified log-rank test).
The Kaplan-Meier plot for PFS based on blinded IRC review for the Asian population
is shown in XXXXXXX1. The probability of being event-free at 12 months was
XXXX% (95% CI: XXXXXXXXXX) for the dacomitinib arm versus XXXX% (95% CI:
XXXXXXXXXX) for the gefitinib arm. At 24 months, the probability of being event-
free was XXXX% (95% CI: XXXXXXXXXX) versus XXX% (95% CI: XXXXXXXXX),
respectively.
XXXXXXX1XXXXXXXXXXXXXXXXXXXXXXXXXXXXXXXXXXXXXXXXXXXXXXXX
XXXXXXXXXXXXXXXXXXXXXXXXXXXXXXXXXXXXXXXXXXXXXXXXXXXXXXXX
zXXXXXXXXXXXXXXXXXXXXXXXXXXXXXXXXXXXXXXXXXXXXXXXXXXXXXXXXXXXXXXXXXXXXXXXXX
XXXXXXXXXX
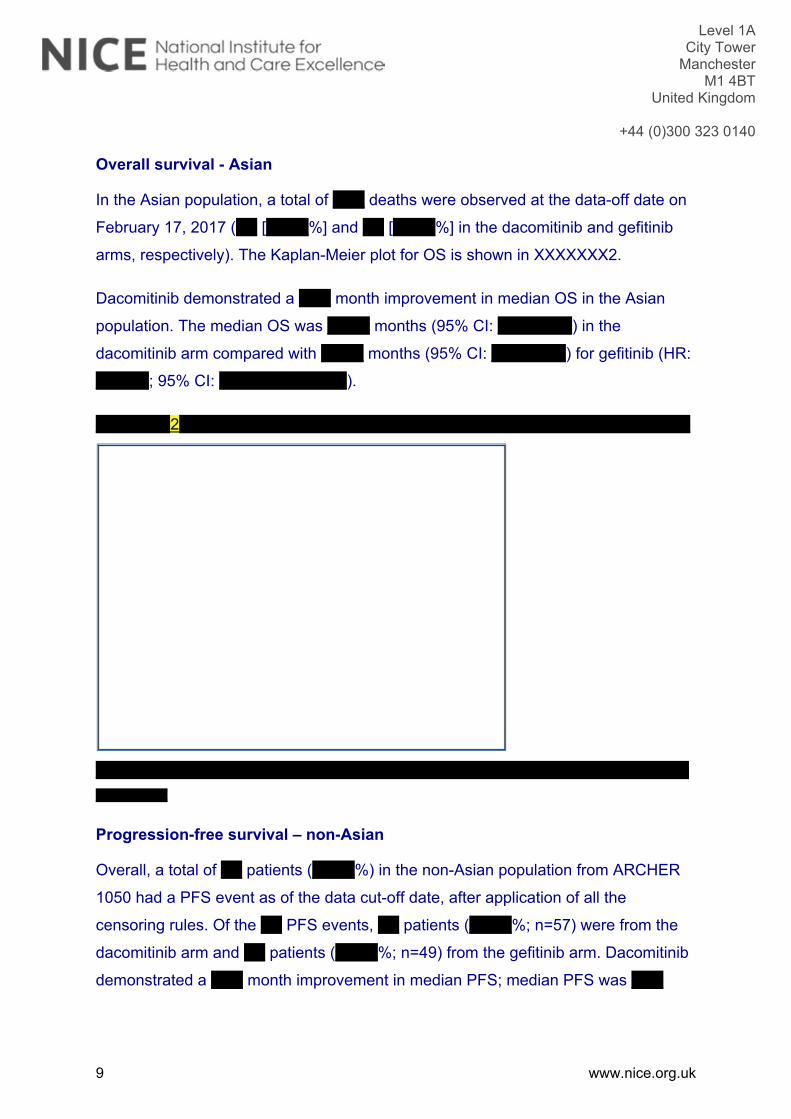
Level 1A City Tower
Manchester M1 4BT
United Kingdom
+44 (0)300 323 0140
9 www.nice.org.uk
Overall survival - Asian
In the Asian population, a total of XXX deaths were observed at the data-off date on
February 17, 2017 (XX [XXXX%] and XX [XXXX%] in the dacomitinib and gefitinib
arms, respectively). The Kaplan-Meier plot for OS is shown in XXXXXXX2.
Dacomitinib demonstrated a XXX month improvement in median OS in the Asian
population. The median OS was XXXX months (95% CI: XXXXXXX) in the
dacomitinib arm compared with XXXX months (95% CI: XXXXXXX) for gefitinib (HR:
XXXXX; 95% CI: XXXXXXXXXXXX).
XXXXXXX2XXXXXXXXXXXXXXXXXXXXXXXXXXXXXXXXXXXXXXXXXXXXXXXX
XXXXXXXXXXXXXXXXXXXXXXXXXXXXXXXXXXXXXXXXXXXXXXXXXXXXXXXXXXXXXXXXXXXXXXXXXX
XXXXXXXXX
Progression-free survival – non-Asian
Overall, a total of XX patients (XXXX%) in the non-Asian population from ARCHER
1050 had a PFS event as of the data cut-off date, after application of all the
censoring rules. Of the XX PFS events, XX patients (XXXX%; n=57) were from the
dacomitinib arm and XX patients (XXXX%; n=49) from the gefitinib arm. Dacomitinib
demonstrated a XXX month improvement in median PFS; median PFS was XXX

Level 1A City Tower
Manchester M1 4BT
United Kingdom
+44 (0)300 323 0140
10 www.nice.org.uk
months (95% CI: XXXXXXXXX) for dacomitinib versus XXX months (95% CI:
XXXXXXXXX) for gefitinib (HR: XXXXX; 95% CI: XXXXXXXXXXXX).
The Kaplan-Meier plot for PFS based on blinded IRC review for the non-Asian
population is shown in XXXXXXX3. The probability of being event-free at 12 months
was XXXX% (95% CI: XXXXXXXXXX) for the dacomitinib arm versus XXXX% (95%
CI: XXXXXXXXXX) for the gefitinib arm. At 24 months, the probability of being event-
free was XXXX% (95% CI: XXXXXXXXX) versus XXXX% (95% CI: XXXXXXXXX),
respectively.
XXXXXXX3XXXXXXXXXXXXXXXXXXXXXXXXXXXXXXXXXXXXXXXXXXXXXXXX
XXXXXXXXXXXXXXXXXXXXXXXXXXXXXXXXXXXXXXXXXXXXXXXXXXXXXXXX
XXXXXXXXXXXXXXXXXXXXXXXXXXXXXXXXXXXXXXXXXXXXXXXXXXXXXXXXXXXXXXXXXXXXXXXXXX
XXXXXXXXX
Overall survival – non-Asian
In the non-Asian population, a total of XX deaths were observed at the data-off date
on February 17, 2017 (XX [XXXX%] and XX [XXXX%] in the dacomitinib and gefitinib
arms, respectively). The Kaplan-Meier plot for OS is shown in XXXXXXX2.
Dacomitinib demonstrated an XXX month improvement in median OS in the non-
Asian population. The median OS was XXXX months (95% CI: XXXXXXX) in the
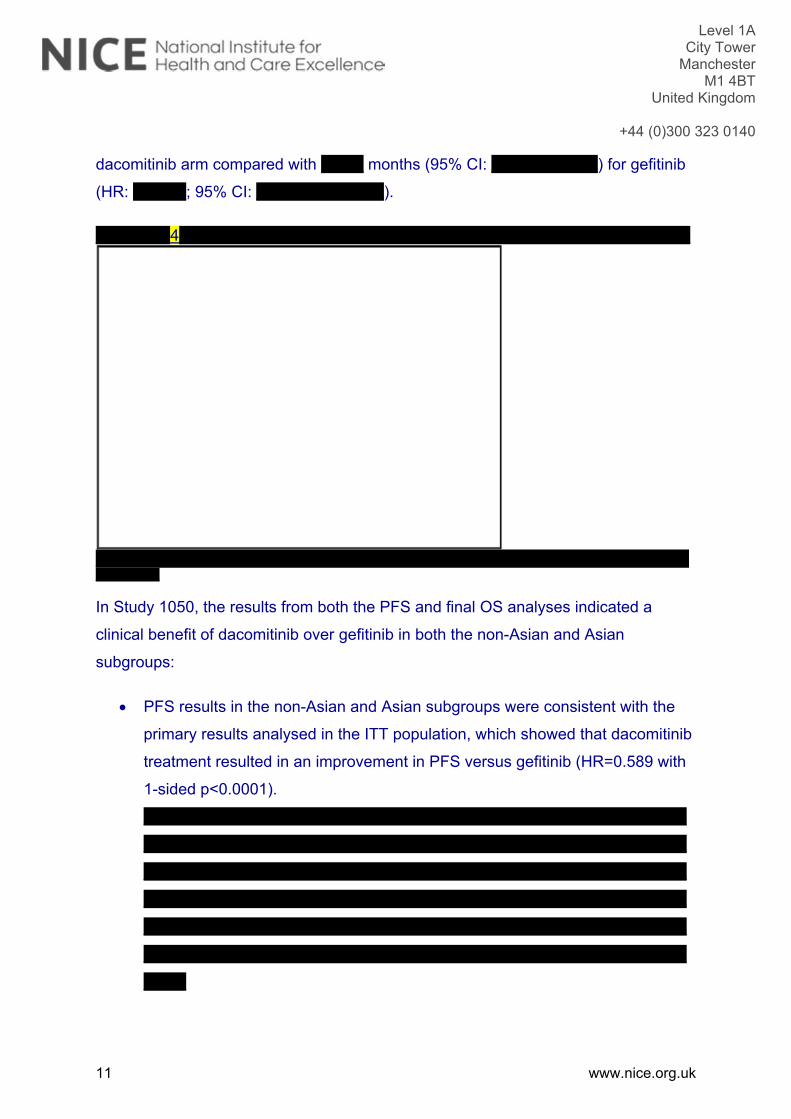
Level 1A City Tower
Manchester M1 4BT
United Kingdom
+44 (0)300 323 0140
11 www.nice.org.uk
dacomitinib arm compared with XXXX months (95% CI: XXXXXXXXXX) for gefitinib
(HR: XXXXX; 95% CI: XXXXXXXXXXXX).
XXXXXXX4XXXXXXXXXXXXXXXXXXXXXXXXXXXXXXXXXXXXXXXXXXXXXXXX
XXXXXXXXXXXXXXXXXXXXXXXXXXXXXXXXXXXXXXXXXXXXXXXXXXXXXXXXXXXXXXXXXXXXXXXXXXXXXXXXXX
In Study 1050, the results from both the PFS and final OS analyses indicated a
clinical benefit of dacomitinib over gefitinib in both the non-Asian and Asian
subgroups:
PFS results in the non-Asian and Asian subgroups were consistent with the
primary results analysed in the ITT population, which showed that dacomitinib
treatment resulted in an improvement in PFS versus gefitinib (HR=0.589 with
1-sided p<0.0001).
XXXXXXXXXXXXXXXXXXXXXXXXXXXXXXXXXXXXXXXXXXXXXXXXXXX
XXXXXXXXXXXXXXXXXXXXXXXXXXXXXXXXXXXXXXXXXXXXXXXXXXX
XXXXXXXXXXXXXXXXXXXXXXXXXXXXXXXXXXXXXXXXXXXXXXXXXXX
XXXXXXXXXXXXXXXXXXXXXXXXXXXXXXXXXXXXXXXXXXXXXXXXXXX
XXXXXXXXXXXXXXXXXXXXXXXXXXXXXXXXXXXXXXXXXXXXXXXXXXX
XXXXXXXXXXXXXXXXXXXXXXXXXXXXXXXXXXXXXXXXXXXXXXXXXXX
XXXX

Level 1A City Tower
Manchester M1 4BT
United Kingdom
+44 (0)300 323 0140
12 www.nice.org.uk
The pre-specified final analysis of OS demonstrated a significant improvement in OS
for dacomitinib versus gefitinib (HR=0.760 with 1-sided p=0.0219) in the ITT
population, representing a 24.0% lower risk of death in favour of dacomitinib
compared with gefitinib.
XXXXXXXXXXXXXXXXXXXXXXXXXXXXXXXXXXXXXXXXXXXXXXXXXXXXXXXX
XXXXXXXXXXXXXXXXXXXXXXXXXXXXXXXXXXXXXXXXXXXXXXXXXXXXXXXX
XXXXXXXXXXXXXXXXXXXXXXXXXXXXXXXXXXXXXXXXXXXXXXXXXXXXXXXX
XXXXXXXXXXXXXXXXXXXXXXXXXXXXXXXXXXXXXXXXXXXXXXXXXXXXXXXX
XXXXXXXXXXXXXXXXXXXXXXXXXXXXXXXXXXXXXXXXXXXXXXXXXXXXXXXX
XXXXXXXXXXXXXXXXXXXXXXXXXXXXXXXXXXXXXXXXXXXXXXXXXXXXXXXX
XXXXXXXXXXXXXXXXXXXXXXXXXXXXXXXXXXXXXXXXXXXXXXXXXXXXXXXX
XXXXXXXXXXXXXXXXXXXXXXXXXXXXXXXXXXXXXXXXXXXXXXXXXXXXXXXX
XXXXXXXXXXXXXXXXXXXXXXXXXXXXXXXXXXXXXXXXXXXXXXXXXXXXXXXX
XXXXXXXXXXXXXXXXXXXXXXXXXXXXXXXXXXXXXXXXXXXXXXXXXXXXXXXX
XXXXXXXXXXXXXXXXXXXXXXXXXXXXXXXXXXXXXXXXXXXXXXXXXXXXXXXX
XXXXXXXXXXXXXXXXXXXXXXXXXXXXXXXXXXXXXXXXXXXXXXXXXXXXXXXX
XXXXXXXXXXXXXXXXXXXXXXXXXXXXXXXXXXXXXXXXXXXXXXXXXXXXXXXX
XXXX
The data summarised above provide evidence that subgroup analyses of both PFS
and OS in non-Asian patients should be interpreted with caution, taking into account
how random chance could influence the results in a relatively small subgroup of
patients. Study 1050 was not powered to show a statistically significant difference
between the treatment arms of the non-Asian and Asian subgroups. However, the
positive trend (HR<1) in both PFS and OS in favour of dacomitinib seen in the non-
Asian subgroup, which was consistent with overall results in the ITT population,
provides reassurance of a positive clinical benefit in this population.
XXXXXXXXXXXXXXXXXXXXXXXXXXXXXXXXXXXXXXXXXXXXXXXXXXXXXXXX
XXXXXXXXXXXXXXXXXXXXXXXXXXXXXXXXXXXXXXXXXXXXXXXXXXXXXXXX
XXXXXXXXXXXXXXXXXXXXXXXXXXXXXXXXXXXXXXXXXXXXXXXXXXXXXXXX
XXXXXXXXXXXXXXXXXXXXXXXXXXXXXXXXXXXXXXXXXXXXXXXXXXXXXXXX

Level 1A City Tower
Manchester M1 4BT
United Kingdom
+44 (0)300 323 0140
13 www.nice.org.uk
XXXXXXXXXXXXXXXXXXXXXXXXXXXXXXXXXXXXXXXXXXXXXXXXXXXXXXXX
XXXXXXXXXXXXXXXXXXXXXXXXXXXXXXXXXXXXXXXXXXXXXXXXXXXXXXXX
XXXXXXXXXXXXXXXXXXXXXXXXXXXXXXXXXXXXXXXXXXXXXXXXXXXXXXXX
XXXXXXXXXXXXXXXXXXXXXXXXXXXXXXXXXXXXXXXXXXXXXXXXXXXXXXXX
XXXXXXXXXXXXXXXXXXXXXXXXXXXXXXXXXXXXXXXXXXXXXXXXXXXXXXXX
XXXXXXXXXXXXXXXXXXXXXXXXXXXXXXXXXXXXXXXXXXXXXXXXXXXXXXXX
XXXXXXXXXXXXXXXXXXXXXXXXXXXXXXXXXXXXXXXXXXXXXXXXXXXXXXXX
XXXXXXXXXXXXXXXXXXXXXXXXXXXXXXXXXXXXXXXXXXXXXXXXXXXXXXXX
XXXXXXXXXXXXXXXXXXXXXXXXXXXXXXXXXXXXXXXXXXXXXXXXXXXXXXXX
XXXXXXXXXXXXXXXXXXXXXXXXXXXXXXXXXXXXXXXXXXXXXXXXXXXXXXXX
XXXXXXXXXXXXXXXXXXXXXXXXXXXXXXXXXXXXXXXXXXXXXXXXXXXXXXXX
XXXXXXXXXXXXXXXXXXXXXXXXXXXXXXXXXXXXXXXXXXXXXXXXXXXXXXXX
XXXXXXXXXXXXXXXXXXXXXXXXXXXXXXXXXXXXXXXXXXXXXXXXXXXXXXXX
XXXXXXXXXXXXXXXXXXXXXXXXXXXXXXXXXXXXXXXXXXXXXXXXXXXXXXXX
XXXXXXXXXXXXXXXXXXXXXXXXXXXXXXXXXXXXXXXXXXXXXXXXXXXXXXXX
XXXXXXXXXXXXXXXXXXXXXXXXXXXXXXXXXXXXXXXXXXXXXXXXXXXXXXXX
XXXXXXXXXXXXXXXXXXXXXXXXXXXXXXXXXXXXXXXXXXXXXXXXXXXXXXXX
XXXXXXXXXXXXXXXXXXXXXXXXXXXXXXXXXXXXXXXXXXXXXXXXXXXXXXXX
XXXXXXXXXXXXXXXXXXXXXXXXXXXXXXXXXXXXXXXXXXXXXXXXXXXXXXXX
XXXXXXXXXXXXXXXXXXXXXXXXXXXXXXXXXXXXXXXXXXXXXXXXXXXXXXXX
XXXXXXXXXXXXXXXXXXXXXXXXXXXXXXXXXXXXXXXXXXXXXXXXXXXXXXXX
XXXXXXXXXXXXXXXXXXXXXXXXXXXXXXXXXXXXXXXXXXXXXXXXXXXXXXXX
XXXXXXXXXXXXXXXXXXXXXXXXXXXXXXXXXXXXXXXXXXXXXXXXXXXXXXXX
XXXXXXXXXXXXXXXXXXXXXXXXXXXXXXXXXXXXXXXXXXXXXXXXXXXXXXXX
XXXXXXXXXXXXXXXXXXXXXXXXXXXXXXXXXXXXXXXXXXXXXXXXXXXXXXXX
XXXXXXXXXXXXXXXXXXXXXXXXXXXXXXXXXXXXXXXXXXXXXXXXXXXXXXXX
XXXXXXXXXXXXXXXXXXXXXXXXXXXXXXXXXXXXXXXXXXXXXXXXXXXXXXXX
XXXXXXXXXXXXXXXXXXXXXXXXXXXXXXXXXXXXXXXXXXXXXXXXXXXXXXXX
XXXXXXXXXXXXXXXXXXXXXXXXXXXXXXXXXXXXXXXXXXXXXXXXXXXXXXXX
XXXXXXXXXXXXXXXXXXXXXXXXXXXXXXXXXXXXXXXXXXXXXXXXXXXXXXXX
XXXXXXXXXXXXXXXXXXXXXXXXXXXXXXXXXXXXXXXXXXXXXXXXXXXXXXXX

Level 1A City Tower
Manchester M1 4BT
United Kingdom
+44 (0)300 323 0140
14 www.nice.org.uk
XXXXXXXXXXXXXXXXXXXXXXXXXXXXXXXXXXXXXXXXXXXXXXXXXXXXXXXX
XXXXXXXXXXXXXXXXXXXXXXXXXXXXXXXXXXXXXXXXXXXXXXXXXXXXXXXX
XXXXXXXXXXXXXXXXXXXXXXXXXXXXXXXXXXXXXXXXXXXXXXXXXXXXXXXX
XXXXXXXXXXXXXXXXXXXXXXXXXXXXXXXXXXXXXXXXXXXXXXXXXXXXXXXX
XXXXXXXXXXXXXXXXXXXXXXXXXXXXXXXXXXXXXXXXXXXXXXXXXXXXXXXX
XXXXXXXXXXXXXXXXXXXXXXXXXXXXXXXXXXXXXXXXXXXXXXXXXXXXXXXX
XXXXXXXXXXXXXXXXXXXXXXXXXXXXXXXXXXXXXXXXXXXXXXXXXXXXXXXX
XXXXXXXXXXXXXXXXXXXXXXXXXXXXXXXXXXXXXXXXXXXXXXXXXXXXXXXX
XXXXXXXXXXXXXXXXXXXXXXXXXXXXXXXXXXXXXXXXXXXXXXXXXXXXXXXX
XXXXXXXXXXXXXXXXXXXXXXXXXXXXXXXXXXXXXXXXXXXXXXXXXXXXXXXX
XXXXXXXXXXXXXXXXXXXXXXXXXXXXXXXXXXXXXXXXXXXXXXXXXXXXXXXX
XXXXXXXXXXXXXXXXXXXXXXXXXXXXXXXXXXXXXXXXXXXXXXXXXXXXXXXX
XXXXXXXXXXXXXXXXXXXXXXXXXXXXXXXXXXXXXXXXXXXXXXXXXXXXXXXX
XXXXXXXXXXXXXXXXXXXXXXXXXXXXXXXXXXXXXXXXXXXXXXXXXXXXXXXX
XXXXXXXXXXXXXXXXXXXXXXXXXXXXXXXXXXXXXXXXXXXXXXXXXXXXXXXX
XXXXXXXXXXXXXXXXXXXXXXXXXXXXXXXXXXXXXXXXXXXXXXXXXXXXXXXX
XXXXXXXXXXXXXXXXXXXXXXXXXXXXXXXXXXXXXXXXXXXXXXXXXXXXXXXX
XXXXXXXXXXXXXXXXXXXXXXXXXXXXXXXXXXXXXXXXXXXXXXXXXXXXXXXX
XXXXXXXXXXXXXXXXXXXXXXXXXXXXXXXXXXXXXXXXXXXXXXXXXXXXXXXX
XXXXXXXXXXXXXXXXXXXXXXXXXXXXXXXXXXXXXXXXXXXXXXXXXX
A9. Priority question: Figure 14 (CS Document B, page 63) presents the forest plot
of OS (stratified by subgroups; intention-to-treat (ITT) population). Please provide the
equivalent forest plot and information (i.e. HR and 95% CI, p-values for interactions)
for PFS.
Please see Figure 12 (CS document B, page 61) for the forest plot for PFS IRC for
the ITT. The p-values for the interactions between subgroups were not included in
Figure 12 however, so are presented below in Table 4. PFS analyses by baseline
characteristic subgroups were generally consistent with the primary analysis of PFS.
It should be noted that the ARCHER 1050 study was not designed to have sufficient
power to test subgroup interactions.

Level 1A City Tower
Manchester M1 4BT
United Kingdom
+44 (0)300 323 0140
15 www.nice.org.uk
Table 4. P-value interaction terms for forest plots of progression-free based on blinded independent review committee analysis Subgroup P-value interaction Gender (male vs. female) XXXXXX Age group (<65 vs. ≥65) XXXXXX ECOG (0 vs. 1) XXXXXX Race (Asian vs. Non-Asian) XXXXXX Smoking status (never vs. ever) XXXXXX EGFR at randomisation (Exon 19 vs. L858R mutation) XXXXXX
Abbreviations: ECOG = Eastern Cooperative Oncology Group; EGFR = epidermal growth factor receptor; L858R = EGFR-TK mutation with an amino acid substitution at position 858 from a leucine to an arginine.
A10. The NICE scope for this appraisal is for people with ‘EGFR activating mutations’.
The ARCHER 1050 trial included only people with del19 or L858R mutation and
people with both of these mutations were excluded, (CS Document B Table 5, page
28). Please explain why these people were excluded from the trial.
At the time that the A7471050 study was being designed, established activating
mutations were EGFR exon 19 deletion and EGFR L858R mutation in exon 21 and
thus the study eligibility criteria were written based on the known knowledge at that
time (Mok TS, Wu YL, Thongprasert S, et al. Gefitinib or carboplatin-paclitaxel in
pulmonary adenocarcinoma. N Engl J Med 2009;361(10):947-57). It is extremely rare
for a patient to have both exon 19 deletion and the L858R mutation in exon 21 (indeed
a previous study reporting these mutually exclusive, Matsuo 2016). At the time of study
start, the potential implication of such EGFR double mutation on clinical outcomes was
not defined. Based on external expert discussion and the estimated very limited
incidence for patients presenting both mutations at the same time in this first-line
setting, it was decided from a clinical perspective to follow a conservative approach to
keep such patients excluded to ensure clear defined study population.
CITATION: Matsuo et al. Association of EGFR Exon 19 Deletion and EGFR-TKI Treatment Duration with Frequency of T790M
Mutation in EGFR-Mutant Lung Cancer Patients. Sci Rep. 2016; 6: 36458.
A11. For the ARCHER 1050 trial, please provide details on how many participants
were randomised in European sites (XXXXXXXXXXXXXXXXXXXX).
The summary of participants across European sites is listed in Table 5.

Level 1A City Tower
Manchester M1 4BT
United Kingdom
+44 (0)300 323 0140
16 www.nice.org.uk
Table 5. Summary of Patient Accrual by Country (XXXXXXXXXXXXXXXXXX) Country, n (%) Dacomitinib
(n=227) Gefitinib (n=225)
Total (n=452)
XXXXX XXXXXXXX XXXXXXXX XXXXXXXX XXXXXX XXXXXXX XXXXXXX XXXXXXXX XXXXX XXXXXXXXX XXXXXXXX XXXXXXXXX
A12. Please clarify how the blinded Independent Review Committee (IRC) review of
PFS was carried out in ARCHER 1050.
Digitization and blinding of image data
All electronic header information (e.g., subject identifiers) was blinded within the digital
data set. Data fidelity was fully maintained. As with every step in the process of
preparing imaging data for the read, a visual QC review of the overall quality of the
digital images was performed.
When saving data, a unique, subject-traceable file name was created for each masked
image file (regardless of imaging modality) using a specific coding system. Utilizing
this file name, all images were saved on a network. During the read process,
descriptive information about the images was allowed to be annotated in the
file/window title bar. The display of this information was needed to track the blinded
data; it was also be used in the displaying of images for the reader within the read
system.
Independent Review
A read session was defined as a read application code module that corresponds to
specific events within the review cycle (i.e., baseline assessment and follow-up
assessment). A radiologist must have committed to an assessment within a read
session before moving onto the next read session.
Two primary board-certified radiologists and a board-certified adjudicating radiologist
(all selected from a pool of radiologists) performed an independent review of response
and disease progression for each subject. The review comprised an assessment of

Level 1A City Tower
Manchester M1 4BT
United Kingdom
+44 (0)300 323 0140
17 www.nice.org.uk
radiographic images acquired during the study. The determination of response and
progression was based on RECIST 1.1 as specifically modified for this study. The
review process consisted of the steps in Figure 5.
Figure 5. Flowchart of Independent Read Sessions
Level 1A City Tower
Manchester M1 4BT
United Kingdom
+44 (0)300 323 0140
18 www.nice.org.uk
The results from these reviews were used to generate the primary endpoint of PFS
and derive other tumour control endpoints.
A13. Please provide the definition for “global deterioration of health” (CS Appendix,
Section D.2, Figure 39), which is used as a reason for discontinuation.
Global deterioration of health was defined as clinical progression causing
discontinuation of treatment without objective evidence of disease progression which
is not associated to an adverse event.
A14. Please provide the definition for “adequate renal, hepatic and haematological
function” (CS Document B, Table 4), which is used as an inclusion criterion in
ARCHER 1050.
Adequate organ function includes the following criteria:
a. Estimated creatinine clearance ≥30 mL/min (as determined by Cockcroft-Gault
formula or the study site’s standard formula);
b. Urinary protein <3+ by urine dipstick. If urine protein by dipstick is ≥3+, then a
urine protein/creatinine ratio (UPC) should be obtained. The patient may enter
only if UPC is <2.0;
c. Absolute neutrophil count (ANC) ≥1500 cells/mm3;
d. Platelets ≥100,000 cells/mm3;
e. Hemoglobin ≥10.0 g/dL;
f. Bilirubin 1.5 x upper limit of normal (ULN);
g. Aspartate aminotransferase (AST; also known as SGOT) and Alanine
aminotransferase (ALT; also known as SGPT) 2.5 x ULN (5.0 x ULN if
hepatic metastases).

Level 1A City Tower
Manchester M1 4BT
United Kingdom
+44 (0)300 323 0140
19 www.nice.org.uk
A15. Table 8 (CS Document B, page 32) lists prior and concomitant medications used
during the ARCHER 1050 trial. Please provide details of concomitant medications
given by study treatment arm.
On-study concomitant drug treatments are reported in Table 14.4.2.4.1 (Pfizer 2017
ARCHER 1050 CSR CONFIDENTIAL page 14252 provided in reference pack).
XXXXXXXXXXXXXXXXXXXXXXXXXXXXXXXXXXXXXXXXXXXXXXXXXXXXXXXX
XXXXXXXXXXXXXXXXXXXXXXXXXXXXXXXXXXXXXXXXXXXXXXXXXXXXXXXX
XXXXXXXXXXXXXXXXXXXXXXXXXXXXXXXXXXXXXXXXXXXXXXXXXXXXXXXX
XXXXXXXXXXXXXXXXXXXXXXXXXXXXXXXXXXXXXXXXXXXXXXXXXXXXXXXX
XXXXXXXXXXXXXXXXXXXXXXXXXXXXXXXXXXXXXXXXXXXXXXXXXXXXXXXX
XXXXXXXXXXXXXXXXXXXXXXXXXXXXXXXXXXXXXXXXXXXXXXXXXXXXXXXX
XXXXXXXXXXXXXXXXXXXXXXXXXXXXXXXXXXXXXXXXXXXXXXXXXXXXXXXX
XXXXXXXXXXXXXXXXXXXXXXXXXXXXXXXXXXXXXXXXXXXXXXXXXXXXXXXX
XXXXXXXXXXXXXXXXXXXXXXXXXXXXXXXXXXXXXXXXXXXXXXXXXXXXXXXX
XXXXXXXXXXXXXXXXXXXXXXXXXXXXXXXXXXXXXXXXXXXXXXXXXXXXXXXX
XXXXXXXXXXXXXXXXXXXXXXXXXXXXXXXXXXXXXXXXXXXXXXXXXXXXXXXX
XXXX
A16. In the CS Document B (page 92), it is stated that the “vast majority” of participants
had stage IIIb or IV disease. Please clarify if the remaining participants are those with
disease stage ‘unknown’ at study screening and stage IV at study entry (CS Table 10).
Table 10 in the CS Document B where it is presented that 89% of patients have either
Stage IIIB or Stage IV disease at the time of screening, with the remaining 11%
classed as ‘unknown’. All patients with ‘unknown’ current disease stage were newly
diagnosed stage IV at the time of study entry (<2 months interval from initial disease
stage) and were confirmed after the database snapshot (see footnote of Table 10
Pfizer 2017 ARCHER 1050 CSR CONFIDENTIAL page 134). The phrase “vast
majority” is used in the text in reference to these data and so reflects the known stage
of disease at study entry.
Level 1A City Tower
Manchester M1 4BT
United Kingdom
+44 (0)300 323 0140
20 www.nice.org.uk
A17. Please clarify how ARCHER 1050 trial participants were diagnosed with the
T790M mutation and describe the treatment pathway for these patients.
In ARCHER 1050, there was no pre-specified T790M test upon progression given that
the trial was initiated in 2013. Therefore, no information was available in the clinical
database for this study and thus, it can only be assumed that since XX patients
received osimertinib post-progression (XXXXXXXXXX patients in the dacomitinib arm
and XXXXXXXXXX patients in the gefitinib group as subsequent therapy) T790M
testing was performed given that use of osimertinib requires that a patient had a
T790M mutation.
Of note, patients who agreed to an optional research aspect of the study, whole blood
samples (10 mL; to be processed for plasma according to the Study Manual) were
collected at the end of treatment visit for a retrospective analysis for the presence of
circulating EGFR mutations including exon 20 T790M. This was only collected for a
small number of patients and was not centrally tested; therefore, it was not possible to
conduct a post hoc analysis of treatment pathways.
A18. Figure 13 (CS Document B, page 62) gives forest plots for PFS, stratified by
subgroups. In the non-Asian population, median PFSl appears to be XXXX months in
the dacomitinib group and XXXX months in the gefitinib group
(XXXXXXXXXXXXXXXXXXXXXXXXXXXX; p= XXXXX). Please:
i) justify why one-sided p-values were used in this analysis and confirm whether
the p-value (XXXXX) above is correct.
One-sided p-values were used for consistency with the testing applied for the ITT
primary endpoint analysis.
The p-value in the figure was incorrect and should be XXXXXX rather than XXXXX.
ii) confirm the significance threshold for Figures 12 and 13 is 0.025 (from the
statistical analysis plan), and explain why this is not included in the figures.

Level 1A City Tower
Manchester M1 4BT
United Kingdom
+44 (0)300 323 0140
21 www.nice.org.uk
The significance threshold of 0.025 in SAP refers to the analyses on the overall
population rather than subgroup analyses. For the subgroup analyses on the primary
endpoint or subgroup analyses on secondary endpoints, there were no formal testing
procedures or multiplicity adjustments associated with them; hence, there was no
significance threshold included in the figures.
Section B: Clarification on cost-effectiveness data
Literature searching
B1. In the PRISMA diagram in Figure 64 (CS Appendix, page. 288), it is indicated that
169 records were excluded at full-text stage. Please provide a list of the excluded
studies with the reasons for exclusion.
Please see lists of citations for excluded economic evaluation studies in Appendix D.
ARCHER 1050 trial
B2. Priority question: Please provide a comparison of the gefitinib and dacomitinib
smoothed-hazard and cumulative hazard plots, with the company base case gen-
gamma and FP models overlaid. Please present these as two figures.
The smoothed hazard and cumulative hazard plots for PFS are presented in
XXXXXXX6 and XXXXXXX7, respectively, and for OS in XXXXXXX8 and XXXXXXX9,
respectively. All plots demonstrate that the base-case generalised gamma curves for
gefitinib provide good fits to the observed data and the FP models applied to the
baseline generalised gamma models for dacomitinib provide good fits to the observed
data up until there are low number of patients at risk.

Level 1A City Tower
Manchester M1 4BT
United Kingdom
+44 (0)300 323 0140
22 www.nice.org.uk
XXXXXXX6XXXXXXXXXXXXXXXXXXXXXXXXXXXXXXXXXXXXXXXXXXXXXX
Abbreviations: FP = fractional polynomial; KM = Kaplan-Meier. Smoothing factor =0.85
XXXXXXX7XXXXXXXXXXXXXXXXXXXXXXXXXXXXXXXXXXXXXXXXXXXXXXXX
Abbreviations: FP = fractional polynomial; KM = Kaplan-Meier.

Level 1A City Tower
Manchester M1 4BT
United Kingdom
+44 (0)300 323 0140
23 www.nice.org.uk
XXXXXXX8XXXXXXXXXXXXXXXXXXXXXXXXXXXXXXXXXXXXXX
Abbreviations: FP = fractional polynomial; KM = Kaplan-Meier. Smoothing factor =0.75
XXXXXXX9XXXXXXXXXXXXXXXXXXXXXXXXXXXXXXXXXXXXXXXX
Abbreviations: FP = fractional polynomial; KM = Kaplan-Meier.
B3. Priority question: Please provide an updated economic model that allows:
i) a comparison between both treatment arms of the ARCHER 1050 trial to be
made with both treatment arms being modelled by independent parametric
models (i.e. no proportionality assumption and not using results from the
fractional polynomial (FP) network meta-analysis (NMA));

Level 1A City Tower
Manchester M1 4BT
United Kingdom
+44 (0)300 323 0140
24 www.nice.org.uk
This analysis was not included in the original model as it does not allow afatinib to be
included within the cost-effectiveness estimates. Therefore, in the CS the ‘best’ fitting
model was only discussed for the base curve, gefitinib, from which the other treatment
curves were estimated using the FP estimates. The fit of independent parametric
models to dacomitinib’s PFS and OS are presented below.
Progression-free survival
AIC and BIC values (Table 6) showed the best fit for PFS was the log-logistic for
dacomitinib closely followed by the Weibull and generalised gamma. The relatively
higher AIC/BIC for the log-normal, Gompertz and exponential suggest these are less
preferable.
Table 6. Goodness-of-Fit Statistics (PFS) - Dacomitinib
Distribution AIC BIC Mean MedianProportion PF at 2 years 3 years 5 years
Exponential 550.00 553.42 XXXX XXXX XXXXX XXXXX XXXX Weibull 545.20 552.04 XXXX XXXX XXXXX XXXXX XXXX Gompertz 549.48 556.33 XXXX XXXX XXXXX XXXXX XXXX Log-logistic 543.52 550.37 XXXX XXXX XXXXX XXXXX XXXX Log-normal 547.18 554.03 XXXX XXXX XXXXX XXXXX XXXXX Generalised gamma 545.26 555.54 XXXX XXXX XXXXX XXXXX XXXX ARCHER 1050 - - - 14.7 30.1% - -
Abbreviations: AIC = Akaike Information Criterion; BIC = Bayesian Information Criterion; PF = progression-free.

Level 1A City Tower
Manchester M1 4BT
United Kingdom
+44 (0)300 323 0140
25 www.nice.org.uk
XXXXXXX10XXXXXXXXXXXXXXXXXXXXXXXXXXXXXXXXXXXXXXXXXXXXXXXXXXXXXXXXXXXXXXXXXXXXXXXXXXXXXXXXX
Abbreviations: KM = Kaplan-Meier.
As with the gefitinib distributions, all distributions provided similar visual fits to the
observed data and beyond the observed period the two logarithmic distributions,
exponential and generalised gamma produced much higher tails (XXXXXXX10). Due
to the minimal difference in means between the remaining two distributions (Weibull,
Gompertz) either could be considered appropriate.
Given the guidance in NICE DSU TSD 14 that the same distribution should be fitted
unless there is ‘substantial justification’ otherwise (Latimer et al 2013, page 18), both
the Weibull and Gompertz are the plausible distributions in a scenario where
independent curves are fit, given these all have similar fits for gefitinib. However, the
use of independent models is not well aligned with the observed data; the CS base-
case uses a flexible time varying hazard to estimate the dacomitinib and afatinib
curves and is thus expectedly produces a model which better represents and
extrapolates the observed data.
Overall survival

Level 1A City Tower
Manchester M1 4BT
United Kingdom
+44 (0)300 323 0140
26 www.nice.org.uk
The AIC/BIC (Table 7) indicated the Gompertz and Weibull provide the best fits to
the observed data. However, given the maturity of the observed OS data, the
statistical fit may not be as informative as it was for PFS, hence it may be more
reliable to judge best fit based on the clinical plausibility of the extrapolation.
Table 7. Goodness-of-Fit Statistics (OS) - Dacomitinib
Distribution AIC BIC Mean MedianProportion alive at 3 years 5 years 10 years
Exponential 478.01 481.44 XXXX XXXX XXXXX XXXXX XXXXX Weibull 465.03 471.88 XXXX XXXX XXXXX XXXXX XXXX Gompertz 463.00 469.85 XXXX XXXX XXXXX XXXX XXXX Log-logistic 469.40 476.25 XXXX XXXX XXXXX XXXXX XXXXX Log-normal 480.04 486.89 XXXX XXXX XXXXX XXXXX XXXXX Generalised gamma 465.06 475.34 XXXX XXXX XXXXX XXXX XXXX ARCHER 1050 - - - 34.1 43.0% - -
Abbreviations: AIC = Akaike Information Criterion; BIC = Bayesian Information Criterion
XXXXXXX11XXXXXXXXXXXXXXXXXXXXXXXXXXXXXXXXXXXXXXXXXXXXXXXXXXXXXXXXXXXXXX
Abbreviations: KM = Kaplan-Meier.
All distributions provided similar visual fits to the observed KM data (XXXXXXX11)
with predicted medians close to the observed data, with the exception of the
exponential (which substantially underestimated the observed data for approximately
the first 18 months). Beyond the end of the observed data both the exponential and

Level 1A City Tower
Manchester M1 4BT
United Kingdom
+44 (0)300 323 0140
27 www.nice.org.uk
logarithmic distributions (log-logistic and log-normal) produced higher tails than the
other distributions. In contrast, the Gompertz and generalised gamma produced
conservatively implausible extrapolations with almost all patients dead after 7 years.
Therefore, the most plausible extrapolation is the Weibull, although the 10 year
survival rate compared to the 5 year survival rate could be considered slightly lower
than may be expected given clinician feedback suggesting the use of the generalised
gamma for gefitinib. In addition, as discussed for PFS, there is no clear rationale to
apply independent parametric distributions between treatment arms, therefore,
aligned with the preferred Weibull for dacomitinib, the Weibull should also be applied
for gefitinib. However, the use of the Weibull was dismissed due to clinician feedback
and external data discussed in CS Document B page 106. Therefore, the use of
independent models for OS is not clinically plausible.
As noted above for PFS, the CS base-case uses a flexible time varying hazard to
estimate the dacomitinib and afatinib curves and is thus expectedly produces a model
which better represents and extrapolates the observed data.
For completeness this functionality has been added, please exclude afatinib and
erlotinib from the model by selecting ‘No’ in ‘Settings’ cells G26 and G27 and the user
can then select ‘Independent models’ in cell G4 and G5 on the ‘Clinical Inputs’ sheet.
Coefficients for the new models are added on the Parameters PFS and Parameters
OS sheets.
ii) the cost-effectiveness analysis to be undertaken separately for the ITT, Asian
and non-Asian population.
Analyses of the non-Asian subgroup patients should be interpreted with caution
noting size of the sample (57 in the dacomitinib arm and 49 in the gefitinib arm) and
the fact that ARCHER 1050 was not powered to show statistically significant
differences between the treatment arms in the non-Asian and Asian subgroups. As
noted in the response to question A8,
XXXXXXXXXXXXXXXXXXXXXXXXXXXXXXXXXXXXXXXXXXXXXXXXXXXXXXXX

Level 1A City Tower
Manchester M1 4BT
United Kingdom
+44 (0)300 323 0140
28 www.nice.org.uk
XXXXXXXXXXXXXXXXXXXXXXXXXXXXXXXXXXXXXXXXXXXXXXXXXXXXXXXX
XXXXXXXXXXXXXXXXXXXXXXXXXXXXXXXXXXXXXXXXXXXXXXXXXXXXXXXX
XXXXXXXXXXXXXXXXXXXXXXXXXXXXXXXXXXXXXXXXXXXXXXXXXXXXXXXX
XXXXXXXXXXXXXXXXXXXXXXXXXXXXXXXXXXXXXXXXXXXXXXXXXXXXXXXX
XXXXXXXXXXXXXXXXXXXXXXXXXXXXXXXXXXXXXXXXXXXXXXXXXXXXXXXX
XXXXXXXXXXXXXXXXXXXXXXXXXXXXXXXXXXXXXXXXXXXXXXXXXXXXXXXX
XXXXXXXXXXXXXXXXXXXX
Despite the limitations listed above, in response to the request parametric models
were fitted, to PFS and OS data for the Asian and Non-Asian subgroups and included
in the cost-effectiveness model (the subgroup can be selected in ‘Settings’ G20).
Details of AIC/BIC are presented in Table 8 and Table 9 for PFS and OS, respectively.
Coefficients for the new models are added on the Parameters PFS and Parameters
OS sheets.
Table 8. Goodness-of-Fit Statistics - PFS
Distribution Dacomitinib Asian
Gefitinib Asian
Dacomitinib Non-Asian
Gefitinib Non-Asian
AIC BIC AIC BIC AIC BIC AIC BIC Exponential 405.76 408.90 430.46 433.63 138.61 140.65 122.38 124.27Weibull 402.51 408.78 403.35 409.69 137.08 141.17 114.73 118.52Gompertz 405.23 411.50 414.92 421.26 139.15 143.24 121.09 124.88Log-logistic 402.17 408.44 406.25 412.59 136.83 140.92 110.32 114.10Log-normal 405.80 412.07 418.02 424.36 137.46 141.55 114.70 118.48Generalised gamma
403.83 413.23 404.77 414.28 138.32 144.45 114.78 120.45
Abbreviations: AIC = Akaike Information Criterion; BIC = Bayesian Information Criterion
Table 9. Goodness-of-Fit Statistics - OS
Distribution Dacomitinib Asian
Gefitinib Asian
Dacomitinib Non-Asian
Gefitinib Non-Asian
AIC BIC AIC BIC AIC BIC AIC BIC Exponential 341.57 344.71 372.80 375.97 135.91 137.96 114.05 115.94Weibull 326.17 332.44 354.22 360.56 136.95 141.04 105.01 108.80Gompertz 326.37 332.64 364.05 370.39 136.22 140.31 107.66 111.44Log-logistic 328.22 334.49 350.06 356.40 138.47 142.56 104.60 108.38Log-normal 338.99 345.26 351.59 357.93 138.70 142.79 111.59 115.37Generalised gamma
327.58 336.99 352.82 362.33 137.80 143.93 107.01 112.68
Abbreviations: AIC = Akaike Information Criterion; BIC = Bayesian Information Criterion

Level 1A City Tower
Manchester M1 4BT
United Kingdom
+44 (0)300 323 0140
29 www.nice.org.uk
B4. Priority question: Please provide hazard and cumulative hazard plots against
time:
i) for both the gefitinib and dacomitinib treatment arms of ARCHER 1050 overlaid
with the fits of each parametric model (i.e. without using FP). Please present
these as four figures.
Please see PFS and OS hazard and cumulative hazard plots against time for
dacomitinib and gefitinib for the ITT population in XXXXXXX12 to XXXXXXX19.
XXXXXXX12 and XXXXXXX13 reflect the conclusions in CS Document B page 102,
that the generalised gamma provides a good fit to the observed data (hazards and
cumulative hazards) up to 24 months, beyond which hazards continue to steadily
increase up to 30 months which is reflective of the external data and clinician opinion.
XXXXXXX12XXXXXXXXXXXXXXXXXXXXXXXXXXXXXXXXXXXXXXXXXXXXXXX
Abbreviations: KM = Kaplan-Meier.

Level 1A City Tower
Manchester M1 4BT
United Kingdom
+44 (0)300 323 0140
30 www.nice.org.uk
XXXXXXX13XXXXXXXXXXXXXXXXXXXXXXXXXXXXXXXXXXXXXXXXXXXXXXX
Abbreviations: KM = Kaplan-Meier.
XXXXXXX14 and XXXXXXX15 show that all distributions provide good fits to the
observed data for the first 20 months, in line with the conclusion in B3. Beyond 20
months the gompertz and Weibull demonstrate increasing hazards, in contrast to the
others which plateau or decrease. This is aligned with the conclusion in B3 that either
Weibull or gompertz are appropriate distributions for the observed data.
XXXXXXX14XXXXXXXXXXXXXXXXXXXXXXXXXXXXXXXXXXXXXXXXXXXXXXXXXXXXXXXXXX
Abbreviations: KM = Kaplan-Meier.

Level 1A City Tower
Manchester M1 4BT
United Kingdom
+44 (0)300 323 0140
31 www.nice.org.uk
XXXXXXX15XXXXXXXXXXXXXXXXXXXXXXXXXXXXXXXXXXXXXXXXXXXXXXXXXXXXXXXXXXXXXXXXXXXXX
Abbreviations: KM = Kaplan-Meier.
XXXXXXX16 and XXXXXXX17 reflect the conclusions in CS Document B page 105
to 106, that the generalised gamma provides a good fit to the observed data (hazards
and cumulative hazards) up to 34 months, beyond which hazards continue to steadily
increase up to 40 months which is reflective of the external data and clinician opinion.
XXXXXXX16XXXXXXXXXXXXXXXXXXXXXXXXXXXXXXXXXXXXXXXXXXXXXXX
Abbreviations: KM = Kaplan-Meier.
XXXXXXX17XXXXXXXXXXXXXXXXXXXXXXXXXXXXXXXXXXXXXXXXXXXXXXXXXXXXXXXXXX

Level 1A City Tower
Manchester M1 4BT
United Kingdom
+44 (0)300 323 0140
32 www.nice.org.uk
Abbreviations: KM = Kaplan-Meier.
XXXXXXX18 and XXXXXXX19 show that all distributions provide good fits to the
observed data with the exception of the exponential, in line with the conclusions in B3.
Beyond 30 months only the Weibull demonstrates increasing hazards, in contrast to
the others which plateau or decrease. This is aligned with the conclusion in B3 that
the Weibull is the appropriate distribution for the observed data.
XXXXXXX18XXXXXXXXXXXXXXXXXXXXXXXXXXXXXXXXXXXXXXXXXXXXXXXXX
Abbreviations: KM = Kaplan-Meier.

Level 1A City Tower
Manchester M1 4BT
United Kingdom
+44 (0)300 323 0140
33 www.nice.org.uk
XXXXXXX19XXXXXXXXXXXXXXXXXXXXXXXXXXXXXXXXXXXXXXXXXXXXXXXXXXXXXXXXXXXX
Abbreviations: KM = Kaplan-Meier.
ii) with the parametric curves for both gefitinib and dacomitinib in the Asian and
non-Asian populations.
Please see the hazard and cumulative hazard plots for Asian and Non-Asian
subgroups in XXXXXXX20 to XXXXXXX35. As discussed in A8 and B3ii), the
Asian/Non-Asian subgroup analysis should be interpreted with caution due to small
sample sizes and as ARCHER 1050 was not powered to show a statistically significant
differences between the treatment arms in the non-Asian and Asian subgroups.
XXXXXXX20XXXXXXXXXXXXXXXXXXXXXXXXXXXXXXXXXXXXXXXXXXXXXXXXXXXXXXXXXXX
Level 1A City Tower
Manchester M1 4BT
United Kingdom
+44 (0)300 323 0140
34 www.nice.org.uk
Abbreviations: KM = Kaplan-Meier.
XXXXXXX21XXXXXXXXXXXXXXXXXXXXXXXXXXXXXXXXXXXXXXXXXXXXXXXXXXXXXXXXXXXXXXXXXXXXX
Abbreviations: KM = Kaplan-Meier.
XXXXXXX22XXXXXXXXXXXXXXXXXXXXXXXXXXXXXXXXXXXXXXXXXXXXXXXXXXXXXXXXXXXX
Level 1A City Tower
Manchester M1 4BT
United Kingdom
+44 (0)300 323 0140
35 www.nice.org.uk
Abbreviations: KM = Kaplan-Meier.
XXXXXXX23XXXXXXXXXXXXXXXXXXXXXXXXXXXXXXXXXXXXXXXXXXXXXXXXXXXXXXXXXXXXXXXXXXXXXXXX
Abbreviations: KM = Kaplan-Meier.
XXXXXXX24XXXXXXXXXXXXXXXXXXXXXXXXXXXXXXXXXXXXXXXXXXXXXXXXXX

Level 1A City Tower
Manchester M1 4BT
United Kingdom
+44 (0)300 323 0140
36 www.nice.org.uk
Abbreviations: KM = Kaplan-Meier.
XXXXXXX25XXXXXXXXXXXXXXXXXXXXXXXXXXXXXXXXXXXXXXXXXXXXXXXXXXXXXXXXXXXX
Abbreviations: KM = Kaplan-Meier.
XXXXXXX26XXXXXXXXXXXXXXXXXXXXXXXXXXXXXXXXXXXXXXXXXXXXXXXXXXXX

Level 1A City Tower
Manchester M1 4BT
United Kingdom
+44 (0)300 323 0140
37 www.nice.org.uk
Abbreviations: KM = Kaplan-Meier.
XXXXXXX27XXXXXXXXXXXXXXXXXXXXXXXXXXXXXXXXXXXXXXXXXXXXXXXXXXXXXXXXXXXXXX
Abbreviations: KM = Kaplan-Meier.
XXXXXXX28XXXXXXXXXXXXXXXXXXXXXXXXXXXXXXXXXXXXXXXXXXXXXXXXXXXXXXXXXXXXXXX

Level 1A City Tower
Manchester M1 4BT
United Kingdom
+44 (0)300 323 0140
38 www.nice.org.uk
Abbreviations: KM = Kaplan-Meier.
XXXXXXX29XXXXXXXXXXXXXXXXXXXXXXXXXXXXXXXXXXXXXXXXXXXXXXXXXXXXXXXXXXXXXXXXXXXXXXXXX
Abbreviations: KM = Kaplan-Meier.
XXXXXXX30XXXXXXXXXXXXXXXXXXXXXXXXXXXXXXXXXXXXXXXXXXXXXXXXXXXXXXXXXXXXXXXXX

Level 1A City Tower
Manchester M1 4BT
United Kingdom
+44 (0)300 323 0140
39 www.nice.org.uk
Abbreviations: KM = Kaplan-Meier.
XXXXXXX31XXXXXXXXXXXXXXXXXXXXXXXXXXXXXXXXXXXXXXXXXXXXXXXXXXXXXXXXXXXXXXXXXXXXXXXXXXXX
Abbreviations: KM = Kaplan-Meier.
XXXXXXX32XXXXXXXXXXXXXXXXXXXXXXXXXXXXXXXXXXXXXXXXXXXXXXXXXXXXXX
Level 1A City Tower
Manchester M1 4BT
United Kingdom
+44 (0)300 323 0140
40 www.nice.org.uk
Abbreviations: KM = Kaplan-Meier.
XXXXXXX33XXXXXXXXXXXXXXXXXXXXXXXXXXXXXXXXXXXXXXXXXXXXXXXXXXXXXXXXXXXXXXXXX
Abbreviations: KM = Kaplan-Meier.
XXXXXXX34XXXXXXXXXXXXXXXXXXXXXXXXXXXXXXXXXXXXXXXXXXXXXXXXXXXXXXXX

Level 1A City Tower
Manchester M1 4BT
United Kingdom
+44 (0)300 323 0140
41 www.nice.org.uk
Abbreviations: KM = Kaplan-Meier.
XXXXXXX35XXXXXXXXXXXXXXXXXXXXXXXXXXXXXXXXXXXXXXXXXXXXXXXXXXXXXXXXXXXXXXXXXXX
Abbreviations: KM = Kaplan-Meier.
B5. Priority question: Please clarify how the parametric models fitted to the gefitinib
treatment arm of ARCHER 1050 were combined with the FP analysis. Were the
hazard ratios from the FP analysis applied to the parametric model? If so, please clarify

Level 1A City Tower
Manchester M1 4BT
United Kingdom
+44 (0)300 323 0140
42 www.nice.org.uk
why the gefitinib treatment arm was modelled using the parametric fit to the ARCHER
1050 trial data, rather than the FP model alone.
Yes, the time varying hazard ratios for dacomitinib and afatinib were applied directly
to the base line (gefitinib) parametric model.
The FP analysis was not coded to provide gefitinib as a FP model. The approach taken
was to fit a wide range of first- and second- order models with varying powers (54
models in total) to explore the full range of possible alternatives. It was not practical to
consider the fit to the observed data and the extrapolation of each individual FP models
to all comparators simultaneously. Instead, the six standard parametric distributions
were explored to provide an anchor for the time varying hazard ratios to be applied.
The resulting base-case generalised gamma provided a good representation of the
observed data and the extrapolation reflected clinical expert opinion and was validated
through external data.
The approach was acceptable once the base-case FP model was applied, as it
provided plausible fits for dacomitinib (CS Document Figure 30 page 104 and Figure
32 page 107). This is further demonstrated in the hazards plots request for B2.
B6. Priority question: Figure 32 (CS Document B, page 108) presents the OS curves,
along with the company’s choice of the fully-fitted parametric curves applied to the
observed data. Data beyond 30 months are immature, with the KM curves appearing
to overlap at approximately 36 months. Please add an option to the economic model
that allows entering a hazard ratio of 1 for OS across all comparators after 36 months
(e.g. a waning effect).
The OS data from ARCHER 1050 are mature as medians are available. In the
observed data, there are approximately 10% more patients alive in the dacomitinib
arm versus the gefitinib arm at 24 and 30 months (66.9% versus 56.4% and 56.2%
versus 46.3%, respectively). The base-case uses the observed data, which
demonstrates dacomitinib’s superior efficacy, and extrapolates these data in line with
NICE DSU TSD 14. Beyond 30 months the data the data is subject to censoring and

Level 1A City Tower
Manchester M1 4BT
United Kingdom
+44 (0)300 323 0140
43 www.nice.org.uk
the numbers at risk at 36 months are very small (14 in the dacomitinib arm and 12 in
the gefitinib arm).
The assumption that the observed survival benefit disappears beyond 36 months can
be considered arbitrary and not evidence based given:
it is based on censored data that is driven by small patient numbers.
it disregards the trend seen in the observed data prior to this point.
it abandons the parametric curve fits that have been modelled in line with DSU
guidelines
Despite limitations with the plausibility of this analysis, the functionality has been
added to the cost-effectiveness model, please see switch in ‘Clinical Inputs’ J16. The
source for the time varying HRs up to 36 months, followed by HR=1 after, are included
in the model on the FP NMA HR sheet in columns K and L.
When the HR=1 is applied at 36 months in the model, the incremental survival for
dacomitinib versus comparators is reduced because the post-progression period for
dacomitinib becomes shorter; mean post-progression survival is XXXX years for
dacomitinib versus XXXX for other comparators. There is no known clinical rational to
suggest that upon progression patients would have a worse prognosis with
dacomitinib, hence the analysis is not considered to have external validity. The validity
of this analysis is further brought into question when considering ARCHER 1050
shows dacomitinib is associated with a statistically significant median gain in OS of
7.3 months versus gefitinib, whereas under the waning effect assumption the modelled
mean LY gain is considerably underestimated to 2.9 months.

Level 1A City Tower
Manchester M1 4BT
United Kingdom
+44 (0)300 323 0140
44 www.nice.org.uk
B7. Priority question: In Figures 5 and 6 (CS Document B, page 52-53), the KM plots
for PFS and OS appear to overlap and cross. Please:
i) provide a justification for not applying a two-phase piecewise (KM plus
parametric) modelling approach to model survival outcomes used in the
economic model;
The NICE DSU TSD14 (Latimer et al. 2013) was used to inform the company’s
modelling approach. During model selection, the DSU suggests that piecewise
modelling is only required when inadequate fits are provided by standard parametric
functional forms. The use of piecewise models can however be assessed primarily
through log-cumulative hazard plots which:
‘show where significant changes in the observed hazard occur, which can be useful
when considering the use of different parametric models for different time periods in
a piecewise modelling approach.’ (Latimer et al. 2013 pg. 20)
The log-cumulative hazard plots for OS from both ARCHER 1050 and LUX-Lung 7
show that there are no single time points where significant changes are observed in
the hazards (CS Appendix Figure 42 page 261 & Figure 46 page 263). The PFS
plots show a significant change in the hazards, however in both trials this occurs
around log time 0 (i.e. in the first month) so cannot be considered informative (CS
Appendix Figure 44 page 262 & Figure 48 page 264). From these plots it is evident
that the crossing of the curves was due to gradual fluctuations in the hazards.
Therefore, piecewise modelling was not considered for this dataset as the log-
cumulative hazard plots do not support it.
The current base-case was validated with the fitted curves providing good fits to the
observed data (CS Document B Figure 30 page 104 & Figure 32 page 107) with the
exception of the tail for OS. However, as mentioned in question B6, these are
subject to censoring and therefore not particularly informative for the extrapolation.
There will inherently be slight variations in the hazards, but such are not sufficient to
suggest piecewise models. However, to account for such small variations, the base-
case uses the flexible 3-parameter generalised gamma model. Further, this was

Level 1A City Tower
Manchester M1 4BT
United Kingdom
+44 (0)300 323 0140
45 www.nice.org.uk
applied with the additional of flexible first- and second- order fractional polynomial
models allowing time-varying hazards to estimate treatment curves.
ii) add an option that allows implementing a two-phase piecewise model, using
KM data until 8 months for PFS and 12 months for OS, after which parametric
models are fitted and used to extrapolate.
As noted above, there was no clear rational to conduct the analyses as a preferred
approach as there were no significant changes observed in the hazards. In addition,
removing 8/12 months of data reduces the sample size and creates additional
uncertainty in the extrapolations. However, as requested, the functionality has been
added to the model; please exclude afatinib and erlotinib from the model by selecting
‘No’ in ‘Settings’ cells G26 and G27 and the user can then select ‘KM plus
extrapolation’ in cell G4 and G5 on the ‘Clinical Inputs’ sheet. Coefficients for the new
models are added on the Parameters PFS and Parameters OS sheets.
Progression-free survival
There was no meaningful difference in statistical fit (Table 10) between the parametric
models fitted from 8 month and all distributions provided similar visual fits to the
observed KM data (XXXXXXX36). Beyond the observed period, the exponential and
the Weibull provided fits were aligned with the previously received clinical expert
feedback and external data, as discussed in CS Document B page 101. All the other
distributions (Gompertz, log-logistic, log-normal and generalised gamma) provided 3-
and 5-year rates that were considered high when compared to clinician opinion and
external data (LUX-Lung 7 and Lin).
Table 10. Goodness-of-Fit Statistics (PFS) - Gefitinib
Distribution AIC* BIC* Mean MedianProportion PF at 2 years 3 years 5 years
Exponential 376.43 379.26 XXXX XXX XXXX XXXX XXXX
Weibull 378.34 383.99 XXXX XXX XXXX XXXX XXXX
Gompertz 376.11 381.77 XXXX XXX XXXXX XXXX XXXX
Log-logistic 371.68 377.34 XXXX XXX XXXXX XXXX XXXX

Level 1A City Tower
Manchester M1 4BT
United Kingdom
+44 (0)300 323 0140
46 www.nice.org.uk
Log-normal 366.34 372.00 XXXX XXX XXXXX XXXX XXXX
Generalised gamma 365.59 374.07 XXXX XXX XXXXX XXXX XXXX
ARCHER 1050 - - - 9.2 XXXX - - Abbreviations: AIC = Akaike Information Criterion; BIC = Bayesian Information Criterion; PF = progression-free *AIC/BIC for parametric model fitted from 8.28 months (nearest model cycle to 8 months)
XXXXXXX36XXXXXXXXXXXXXXXXXXXXXXXXXXXXXXXXXXXXXXXXXXXXXXXXXXXXXXXXXXXXX
Abbreviations: KM = Kaplan-Meier.
As with gefitinib, there was no meaningful difference in statistical fit (Table 11) between
the parametric models fitted from 8 months and all distributions provided similar visual
fits to the observed dacomitinib KM data (XXXXXXX37). Beyond the observed data,
the Gompertz, log-logistic, log-normal and generalised gamma all predicted high 5
year rates. The tails of the exponential and Weibull could also be considered high but
are the most plausible of these models.
Table 11. Goodness-of-Fit Statistics (PFS) - Dacomitinib
Distribution AIC BIC Mean MedianProportion PF at 2 years 3 years 5 years
Exponential 363.25 366.19 XXXX XXXX XXXXX XXXXX XXXX
Weibull 365.21 371.10 XXXX XXXX XXXXX XXXXX XXXX
Gompertz 364.75 370.63 XXXX XXXX XXXXX XXXXX XXXX

Level 1A City Tower
Manchester M1 4BT
United Kingdom
+44 (0)300 323 0140
47 www.nice.org.uk
Log-logistic 363.68 369.56 XXXX XXXX XXXXX XXXXX XXXXX
Log-normal 361.09 366.97 XXXX XXXX XXXXX XXXXX XXXXX
Generalised gamma 362.92 371.75 XXXX XXXX XXXXX XXXXX XXXXX
ARCHER 1050 - - - 14.7 XXXXX - - Abbreviations: AIC = Akaike Information Criterion; BIC = Bayesian Information Criterion; PF = progression-free *AIC/BIC for parametric model fitted from 8.28 months (nearest model cycle to 8 months)
XXXXXXX37XXXXXXXXXXXXXXXXXXXXXXXXXXXXXXXXXXXXXXXXXXXXXXXXXXXXXXXXXXXXXXX
Abbreviations: KM = Kaplan-Meier.
In conclusion, the exponential or Weibull for PFS are the most appropriate models in
this scenario, however the visual fit of the models are not superior to the standard
parametric gefitinib models. Further, the dacomitinib models are similar to the
independent dacomitinib parametric models which have long tails and do not reflect
the observed data as discuss in B3. This, coupled with the lack of change in hazard
discussed in B7i), does not support the use of a piecewise analysis for PFS.
Overall survival
As with PFS there was no meaningful difference in statistical fit (Table 12) between
the parametric models fitted from 12 months and all distributions provided similar
visual fits to the observed KM data (XXXXXXX38). In line with the clinician opinion and

Level 1A City Tower
Manchester M1 4BT
United Kingdom
+44 (0)300 323 0140
48 www.nice.org.uk
external data from CS Document B page 105-106, only the exponential and Weibull
provide plausible extrapolation.
Table 12. Goodness-of-Fit Statistics (OS) - Gefitinib
Distribution AIC BIC Mean MedianProportion alive at 3 years 5 years 10 years
Exponential 459.82 463.04 XXXX XXXX XXXXX XXXXX XXXX
Weibull 461.52 467.97 XXXX XXXX XXXXX XXXXX XXXX
Gompertz 460.04 466.49 XXXX XXXX XXXXX XXXXX XXXXX
Log-logistic 459.49 465.94 XXXX XXXX XXXXX XXXXX XXXXX
Log-normal 459.22 465.67 XXXX XXXX XXXXX XXXXX XXXXX
Generalised gamma 460.97 470.65 XXXX XXXX XXXXX XXXXX XXXXX
ARCHER 1050 - - - 26.8 XXXXX - - Abbreviations: AIC = Akaike Information Criterion; BIC = Bayesian Information Criterion; PF = progression-free *AIC/BIC for parametric model fitted from 11.96 months (nearest model cycle to 12 months)
XXXXXXX38XXXXXXXXXXXXXXXXXXXXXXXXXXXXXXXXXXXXXXXXXXXXXXX
Abbreviations: KM = Kaplan-Meier.
Again, statistical fit (Table 13) was not informative and all distributions fitted the
observed data well (XXXXXXX39). All distributions apart from the exponential predict
lower mean survival for dacomitinib compared to gefitinib which is counter to the
observed data (considering the median PFS and OS are greater for dacomitinib than

Level 1A City Tower
Manchester M1 4BT
United Kingdom
+44 (0)300 323 0140
49 www.nice.org.uk
gefitinib) and implausible given no known clinical justification as to why; therefore the
exponential presents the only plausible piecewise model for OS.
Table 13. Goodness-of-Fit Statistics (OS) - Dacomitinib
Distribution AIC BIC Mean MedianProportion alive at 3 years 5 years 10 years
Exponential 359.24 362.48 XXXX XXXX XXXXX XXXXX XXXX
Weibull 352.09 358.57 XXXX XXXX XXXXX XXXXX XXXX
Gompertz 355.05 361.53 XXXX XXXX XXXXX XXXX XXXX
Log-logistic 352.10 358.58 XXXX XXXX XXXXX XXXXX XXXX
Log-normal 353.31 359.79 XXXX XXXX XXXXX XXXXX XXXXX
Generalised gamma 353.78 363.50 XXXX XXXX XXXXX XXXXX XXXX
ARCHER 1050 - - - 34.1 XXXXX - - Abbreviations: AIC = Akaike Information Criterion; BIC = Bayesian Information Criterion; PF = progression-free *AIC/BIC for parametric model fitted from 11.96 months (nearest model cycle to 12 months)
XXXXXXX39XXXXXXXXXXXXXXXXXXXXXXXXXXXXXXXXXXXXXXXXXXXXXXXXXXXXXX
Abbreviations: KM = Kaplan-Meier.
In conclusion, the piecewise exponential models provides a plausible scenario given
the lack of a viable independent model for OS, as discussed in B3.

Level 1A City Tower
Manchester M1 4BT
United Kingdom
+44 (0)300 323 0140
50 www.nice.org.uk
B8. Priority question: Figure 14 (CS Document B, page.64) presents the forest plot
of OS (stratified by subgroups; ITT population). Please provide the equivalent forest
plot and information (i.e. HR and 95% CI, p-values for interactions) for PFS (IRC).
Please see response to A9 which addresses this question.
B9. A table (‘Adverse Events’ worksheet; cells ‘E7:J14’) in the company’s economic
model reports the frequency of Adverse Events (AEs) by treatment. Please:
i) clarify whether these values represent the proportion of people who
experienced each of the listed AE or reflects the number of AEs that people
experienced (i.e. it captures recurrent events);
These values represent the proportion of people who experienced each of the listed
AEs.
ii) provide a full list of incidences (first, second, and subsequent) of grade 3-5
AEs, by treatment.
Typically, grade 3-5 adverse event (AE) incidences are reported by the number of
patients who have experienced an event as opposed to the number of individual grade
3-5 events. Indeed, the ARCHER 1050 data and LUX-LUNG 7 data both report AE
incidences as the number of patients experiencing an event. Providing data on the
number of events (grade 3-5) in order to look at AE recurrence cannot be done for
LUX-LUNG 7 as this is not the company’s trial; hence, bias would be introduced into
any comparative analysis.
The company have not provided a full list of grade 3-5 event incidences that reflects
recurrence of adverse events because of complexities in how this is defined
appropriately given the potential for the short term change in the grade of an AE. As a
single event can occur across sequential days, it can fluctuate up and down between
multiple grades during this time, recording the number of times an AE becomes grade
3 may not accurately reflect the number of independent events.

Level 1A City Tower
Manchester M1 4BT
United Kingdom
+44 (0)300 323 0140
51 www.nice.org.uk
However, in order to provide additional data to the ERG that allows a deeper
interpretation of grade 3-5 AEs beyond the currently reported patient incidences, the
company are re-analysing patient level data in ARCHER 1050 to provide a list of
patient incidences for grade 3-5 AEs by individual cycle. Although these data are not
event incidences but patient incidences, an examination on a cycle-by-cycle level will
allow insight into the recurrence of AEs. The economic model uses a cut off of >5%
but these data will be provided for AEs in which the grade 3 frequency is >2%.
B10. In the economic model, the progression-free states is assigned utility values
obtained from the ARCHER 1050 trial, while utility values for progressed disease are
taken from the study by Labbé and colleagues. Given that the ARCHER 1050 trial
methodology states that “Patient reported outcomes were assessed at days 1
(baseline), 8, and 15 of cycle one, on day 1 of subsequent cycles, at the end-of-
treatment visit, and at the posttreatment follow up visit” (Wu et al., 2017 p. 1456),
please provide summary statistics for the EQ-5D data collected at the end-of-
treatment/post treatment follow-up visits by trial treatment arm.
Please see summary statistics for EQ-5D collected at end-of-life/post-treatment in
Table 14.
Table 14. Summary of mean EQ-5D health index score Time point Dacomitinib Gefitinib
Median Mean 95% CI n Median Mean 95% CI n End of treatment
XXXX XXXX XXXXXXXXXX
121 XXXX XXXX XXXXXXXXXX
145
Post-treatment
XXXX XXXX XXXXXXXXXX
75 XXXX XXXX XXXXXXXXXX
107
Abbreviations: CI = confidence interval.
B11. In the CS (Document B, page 107) it is stated that time-to-treatment
discontinuation was not available for all the comparators. Please give information on
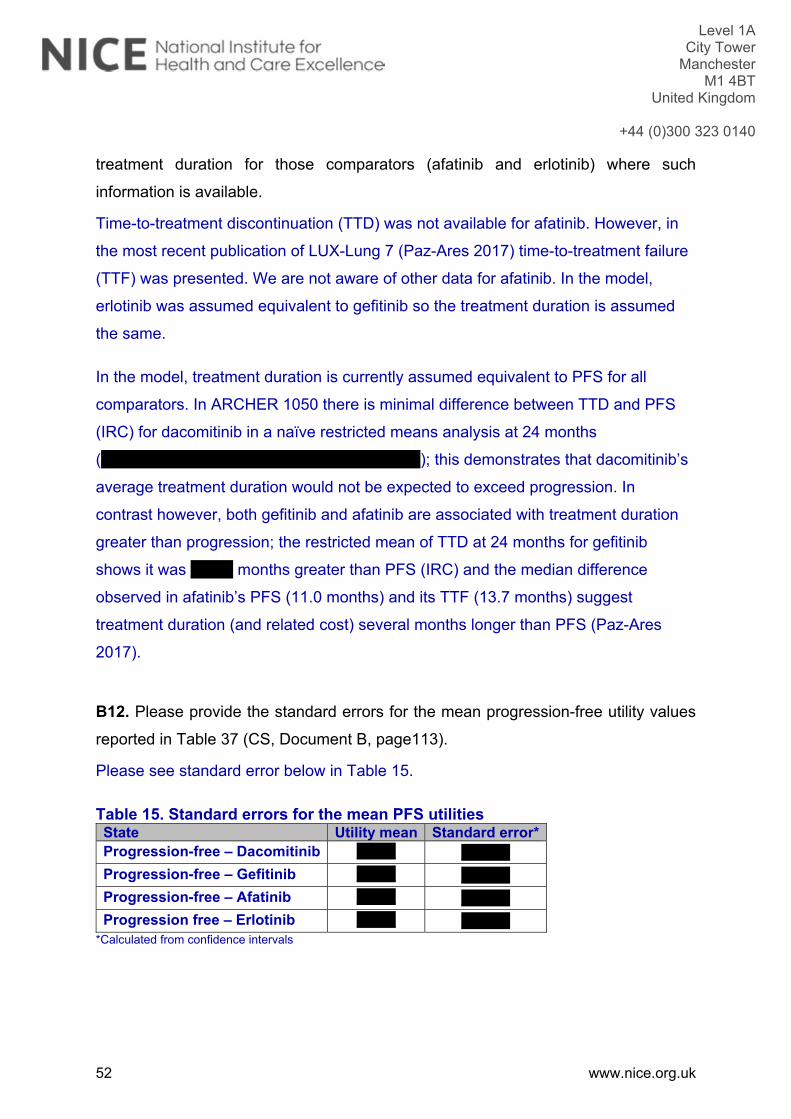
Level 1A City Tower
Manchester M1 4BT
United Kingdom
+44 (0)300 323 0140
52 www.nice.org.uk
treatment duration for those comparators (afatinib and erlotinib) where such
information is available.
Time-to-treatment discontinuation (TTD) was not available for afatinib. However, in
the most recent publication of LUX-Lung 7 (Paz-Ares 2017) time-to-treatment failure
(TTF) was presented. We are not aware of other data for afatinib. In the model,
erlotinib was assumed equivalent to gefitinib so the treatment duration is assumed
the same.
In the model, treatment duration is currently assumed equivalent to PFS for all
comparators. In ARCHER 1050 there is minimal difference between TTD and PFS
(IRC) for dacomitinib in a naïve restricted means analysis at 24 months
(XXXXXXXXXXXXXXXXXXXXXXXXXXXXXX); this demonstrates that dacomitinib’s
average treatment duration would not be expected to exceed progression. In
contrast however, both gefitinib and afatinib are associated with treatment duration
greater than progression; the restricted mean of TTD at 24 months for gefitinib
shows it was XXXX months greater than PFS (IRC) and the median difference
observed in afatinib’s PFS (11.0 months) and its TTF (13.7 months) suggest
treatment duration (and related cost) several months longer than PFS (Paz-Ares
2017).
B12. Please provide the standard errors for the mean progression-free utility values
reported in Table 37 (CS, Document B, page113).
Please see standard error below in Table 15.
Table 15. Standard errors for the mean PFS utilities State Utility mean Standard error*Progression-free – Dacomitinib XXXX XXXXX
Progression-free – Gefitinib XXXX XXXXX
Progression-free – Afatinib XXXX XXXXX
Progression free – Erlotinib XXXX XXXXX *Calculated from confidence intervals

Level 1A City Tower
Manchester M1 4BT
United Kingdom
+44 (0)300 323 0140
53 www.nice.org.uk
B13. Please reproduce the FP NMA for the Asian and non-Asian populations.
It is not possible to conduct the FP analysis for the Asian and non-Asian populations
as a network cannot be formed. The FP analysis is dependent on Kaplan-Meier plots
being available as these are used as input data in the analysis, and for LUX-LUNG 7
Kaplan-Meier plots are not available for Asian and non-Asian subgroups.
B14. Please provide the digitised graph and resulting generated data for the FP NMA.
Please see PFS (LUXLung7_PFS IRC.png) and OS (LUXLung7_OS.png) graphs
attached with the response along with the generated data (LUXLung7_Data.xlsx).
B15. Please provide the FP NMA code and data.
Please see code and data in NMA_FP_Data_Analysis_Code.zip attached in the
response.
B16. There appears to be a discrepancy between the cost per cycle values in CS
Document B (Table 38, page116 ) and the equivalent values in the economic model
(sheet ‘Medical Costs, Drugs’, cells F26:F29). Please clarify whether the values in cells
F26:F29 are incorrect and confirm that these values have not been used in the
calculations underpinning any of the results presented in the submission.
The hidden values on ‘Medical Costs_Drugs’ cells F26:F29 are not included in the
base case; this model functionality was included to allow a cost per cycle to be entered
directly into the model, should it be wished. These values are hardcoded (as noted in
cell I28) and are only applied when ‘Yes’ is selected in cell G5. This cell is set to ‘No’,

Level 1A City Tower
Manchester M1 4BT
United Kingdom
+44 (0)300 323 0140
54 www.nice.org.uk
therefore the values have not been used in any of the results presented in the CS
submission.
B17. Please confirm whether monetary values related to health care use taken from
past analyses and literature (e.g. cost of terminal care) are appropriately adjusted for
differential timing.
All unit cost (administration, disease management, terminal care and adverse events)
have been sourced from the National Schedule of Reference Costs for 2016/2017 and
PSSRU 2017 which were the most recent available at the time of submission (these
have not been inflated), with the exception of ‘Drug and equipment’ in the terminal
care cost, which was inflated to 2017 using the inflation indices from the PSSRU.
B18. In CS Document B, page112, it is stated that “these values were also aligned
with the only real world EGFR+ NSCLC value identified in the SLR (Labbé et al. 2017
[0.77]), therefore this value was applied in scenario analysis.” Please clarify the
meaning of the expression ‘real world values’ in this particular context.
The term “real world” is used in the CS in line with the title of the study from which
utilities were taken: “Real-World EQ5D Health Utility Scores for Patients With
Metastatic Lung Cancer by Molecular Alteration and Response to Therapy” (Labbe
2017). This is a longitudinal cohort study at Princess Margaret Cancer Centre in
Toronto evaluated EQ-5D-3L-derived health state utilities in 475 outpatients between
2014 and 2016 with metastatic lung cancer across various disease states, including
183 EGFR-positive patients. As these utilities are taken from a real-world setting as
opposed to a solely pre-license clinical trial setting, they are titled “real world” by the
study authors and have also been so in the CS.
B19. Please confirm whether utility values used in the economic model calculations
have been adjusted over the time horizon to reflect the modelled patients’ age-related
decline in health-related quality of life.
No, the estimates have not been adjusted over time.

Level 1A City Tower
Manchester M1 4BT
United Kingdom
+44 (0)300 323 0140
55 www.nice.org.uk
Section C: Textual clarification and additional points
C1. Please define the footnotes for adverse events in Figure 39 (CS Appendix D.2,
page 256).
Please see detail of footnote below:
*22 treatment-emergent adverse events related to study drug, 18 treatment-emergent
adverse events not related to study drug, and one non-treatment-emergent adverse
event. †15 treatment-emergent adverse events related to study drug and 12 treatment-
emergent adverse events not related to study drug. (Reference 33: Wu et al. 2017)
C2. In CS Document A, page 20, the Incremental Cost Effectiveness Ratio (ICER) for
dacomitinib is reported to be £XXXXXX per QALY gained. This result is not consistent
with the ICER value for dacomitinib reported in Table 6, page 20. Please confirm
whether £ XXXXXX is a typographical error.
Yes; the values should read £ XXXXXX in line with the table above the text.
C3. Please provide all 134 references (related to CS Document B and Appendix) as
either a RIS. file or an archived EndNote library.
Please see .RIS file attached with response.
C4. Please provide a PDF for reference 55 ‘Pfizer. Data on file. 2017’, cited at the end
of page 65 (CS Document B, section B.2.9.1)
The reference for this statement should read ‘99’ rather than ‘55’ (i.e. the same source
as cited in the below question C5. This is a reference to direct one-to-one clinical
expert consultation which have been conducted in order to seek advice around the
disease area, treatment pathway, and expected clinical benefit of treatments.

Level 1A City Tower
Manchester M1 4BT
United Kingdom
+44 (0)300 323 0140
56 www.nice.org.uk
C5. Please provide a PDF for reference 99. ‘Pfizer. Pfizer One-to-one interviews with
UK clinical experts; Pfizer Data on File. 2018’, cited on page115 (CS Document B,
section B.3.5.2)
One-to-one interviews with UK clinical experts is reference to direct telephone or face
to face consultations with clinical experts such as lung oncologists which have been
conducted in order to seek advice around the disease area, treatment pathway, and
expected clinical benefit of treatments. These consultations are not held in formal
advisory board settings and as such there is no internal report that can be provided.
Appendices
Appendix A
ReasonforExclusion:Interventions/Comparators Epidermal growth factor receptor mutation analysis in advanced non-small cell lung
cancer: review of economic evaluations and framework for economic analyses. Health Technology Assessment Database, 2010. http://onlinelibrary.wiley.com/o/cochrane/clhta/articles/HTA-32011001150/frame.html (accessed.
‐ This study compares EGFR testing strategy vs non-testing strategy.
Ahn MJ, Tsai CM, Hsia TC, et al. Cost-effectiveness of bevacizumab-based therapy versus cisplatin plus pemetrexed for the first-line treatment of advanced non-squamous NSCLC in Korea and Taiwan. Asia Pac J Clin Oncol, 2011. http://onlinelibrary.wiley.com/o/cochrane/cleed/articles/NHSEED-22011000969/frame.html (accessed.
‐ Examined bevacizumab (not in combination with erlotinib) in comparison to cisplatin and pemetrexed
Alimujiang S, Zhang T, Han ZG, et al. Epidermal growth factor receptor tyrosine kinase inhibitor versus placebo as maintenance therapy for advanced non- small-cell lung cancer: a meta-analysis of randomized controlled trials. Asian Pacific Journal of Cancer Prevention, 2013.
‐ Maintenance therapy with EGFR-TKIs vs. Placebo
Amit L, Ben-Aharon I, Vidal L, Leibovici L, Stemmer S. The impact of Bevacizumab (Avastin) on survival in metastatic solid tumors--a meta-analysis and systematic review. PLoS ONE 2013; 8(1): e51780.
Level 1A City Tower
Manchester M1 4BT
United Kingdom
+44 (0)300 323 0140
57 www.nice.org.uk
‐ Examined bevacizumab combination therapy vs chemotherapy
An C, Zhang J, Chu H, et al. Study of Gefitinib and Pemetrexed as First-Line Treatment in Patients with Advanced Non-Small Cell Lung Cancer Harboring EGFR Mutation. Pathol Oncol Res 2016; 22(4): 763-8.
‐ Examined gefitinib + pemetrexed vs gefitinib+ placebo
Arrieta O, Anaya P, Morales-Oyarvide V, Ramirez-Tirado LA, Polanco AC. Cost-effectiveness analysis of EGFR mutation testing in patients with non-small cell lung cancer (NSCLC) with gefitinib or carboplatin-paclitaxel. Eur J Health Econ 2016; 17(7): 855-63.
‐ Examined EGFR testing with gefitinib, vs no testing with standard chemotherapy
Banz K, Bischoff H, Brunner M, et al. Comparison of treatment costs of grade 3/4 adverse events associated with erlotinib or pemetrexed maintenance therapy for patients with advanced non-small-cell lung cancer (NSCLC) in Germany, France, Italy, and Spain. Lung Cancer 2011; 74(3): 529-34.
‐ Examined erlotinib or pemetrexed maintenance therapy
Barlesi F, Pujol JL. Combination of chemotherapy without platinum compounds in the treatment of advanced non-small cell lung cancer: a systematic review of phase III trials. Lung Cancer, 2005. http://onlinelibrary.wiley.com/o/cochrane/cldare/articles/DARE-12005001167/frame.html (accessed.
‐ Examined cisplatin, carboplatin, ifosfamide, gemcitabine, and vinorelbine
Bischoff, Hg,Ruckert, A,Reinmuth, N,Grohe, C,Bohnet, S,Zum, Buschenfelde Cm. Osimertinib (OSI) vs Standard of care (SoC) EGFR-TKI as first-line therapy in patients (pts) with EGFRm advanced NSCLC: FLAURA. Oncology research and treatment. Conference: 33. Deutscher krebskongress, DKK. Germany. 2018. 41:187
‐ Osimertinib used as intervention
Bongers ML, Coupe VMH, Jansma EP, Smit EF, Uyl-de Groot CA. Cost effectiveness of treatment with new agents in advanced non-small-cell lung cancer: a systematic review. Pharmacoeconomics 2012; 30(1): 17-34.
‐ Systematic review ‐ Examined first-line therapy trials with (gemcitabine+cisplatin) or (gemcitabine+
docetaxel) versus other platinum-based regimens (paclitaxel, docetaxel and vinorelbine).
Botrel TEA, Clark O, Clark L, Paladini L, Faleiros E, Pegoretti B. Efficacy of bevacizumab (Bev) plus chemotherapy (CT) compared to CT alone in previously untreated locally advanced or metastatic non-small cell lung cancer (NSCLC): systematic review and meta-analysis. Lung Cancer 2011; 74(1): 89-97.

Level 1A City Tower
Manchester M1 4BT
United Kingdom
+44 (0)300 323 0140
58 www.nice.org.uk
‐ Examined bevacizumab (not in combination with erlotinib) in combination with other agents
Carlson JJ, Veenstra DL, Ramsey SD. Pharmacoeconomic evaluations in the treatment of non-small cell lung cancer. Drugs 2008; 68(8): 1105-13.
‐ Examined chemotherapy, surgery, RT, best supportive care (no studies with TKIs)
Chang JWC, Hou M-M, Hsieh J-J, et al. Early radiographic response to epidermal growth factor receptor-tyrosine kinase inhibitor in non-small cell lung cancer patients with epidermal growth factor receptor mutations: A prospective study. Biomedical Journal 2015; 38(3): 221-8.
‐ Examined erlotinib and gefitinib ‐ Results for erlotinib and gefitinib are compiled and presented as "TKI therapy"
Chen J, Wu X, Shi T, Kang M. Efficacy of targeted agents in the treatment of elderly
patients with advanced non-small-cell lung cancer: A systematic review and meta-analysis. Onco Targets Ther 2016; 9: 4797-803.
‐ Examined different chemotherapies with or without Targeted therapies (no trial with interventions of interest was included).
Chen Y, Yang J, Li X, et al. First-line epidermal growth factor receptor (EGFR)-tyrosine kinase inhibitor alone or with whole-brain radiotherapy for brain metastases in patients with EGFR-mutated lung adenocarcinoma. Cancer Sci 2016; 107(12): 1800-5.
‐ Compared TKIs (erlotinib or gefitinib as one group) vs RT
Chen YJ, Chen LX, Han MX, Zhang TS, Zhou ZR, Zhong DS. The efficacy and safety of chemotherapy in patients with nonsmall cell lung cancer and interstitial lung disease: A PRISMA-compliant Bayesian meta-analysis and systematic review. Medicine (United States) 2015; 94 (36) (no pagination)(e1451).
‐ Examined carboplatin, docetaxel, gemcitabine, pemetrexed, cisplatin, vinorelbine, paclitaxel, bevacizumab (not in combination with erlotinib), carboplatin, and etoposide
Chien CR, Shih YCT. Economic evaluation of bevacizumab in the treatment of non-small cell lung cancer (NSCLC). ClinicoEconomics and Outcomes Research 2012; 4(1): 201-8.
‐ Bevacizumab containing regimens (not in combination with erlotinib)
Chouaid C, Atsou K, Hejblum G, Vergnenegre A. Economics of treatments for non-small cell lung cancer. Pharmacoeconomics 2009; 27(2): 113-25.
‐ Different regimens of chemotherapy, radiotherapy and best supportive care were compared with gefitinib and erlotinib in >1st line therapy trials

Level 1A City Tower
Manchester M1 4BT
United Kingdom
+44 (0)300 323 0140
59 www.nice.org.uk
Chouaid C, Le Caer H, Corre R, et al. Cost analysis of erlotinib versus chemotherapy for
first-line treatment of non-small-cell lung cancer in frail elderly patients participating in a prospective phase 2 study (GFPC 0505). Clin Lung Cancer 2013; 14(2): 103-7.
‐ Examined erlotinib followed by chemotherapy
Chouaid C, Le Caer H, Locher C, et al. Cost effectiveness of erlotinib versus chemotherapy for first-line treatment of non-small cell lung cancer (NSCLC) in fit elderly patients participating in a prospective phase 2 study (GFPC 0504). BMC Cancer 2012; 12: 301.
‐ Examined docetaxel/gemcitabine followed by erlotinib after progression vs erlotinib followed by docetaxel/gemcitabine after progression
Dae HL, Han JY, Heung TK, et al. Primary chemotherapy for newly diagnosed nonsmall cell lung cancer patients with synchronous brain metastases compared with whole-brain radiotherapy administered first: Result of a randomized pilot study. Cancer 2008; 113(1): 143-9.
‐ Examined gemcitabine and vinorelbine + radiotherapy
de Haas S, Delmar P, Bansal AT, et al. Genetic variability of VEGF pathway genes in six randomized phase III trials assessing the addition of bevacizumab to standard therapy. Angiogenesis 2014; 17(4): 909-20.
‐ Examined bevacizumab vs placebo
Eberhard DA, Johnson BE, Amler LC, et al. Mutations in the epidermal growth factor receptor and in KRAS are predictive and prognostic indicators in patients with non-small-cell lung cancer treated with chemotherapy alone and in combination with erlotinib. J Clin Oncol 2005; 23(25): 5900-9.
‐ Examined carboplatin and paclitaxel + erlotinib vs carboplatin and paclitaxel+ placebo
Gatzemeier U, Pluzanska A, Szczesna A, et al. Phase III study of erlotinib in combination with cisplatin and gemcitabine in advanced non-small-cell lung cancer: the Tarceva Lung Cancer Investigation Trial. J Clin Oncol 2007; 25(12): 1545-52.
‐ Examined erlotinib + cisplatin and gemcitabine vs placebo + cisplatin and gemcitabine
Gerber NK, Yamada Y, Rimner A, et al. Erlotinib versus radiation therapy for brain metastases in patients with EGFR-mutant lung adenocarcinoma. International Journal of Radiation Oncology Biology Physics 2014; 89(2): 322-9.
‐ Examined erlotinib either alone or in combination with cytotoxic chemotherapy vs WBRT, with or without the addition of erlotinib after completion of radiation vs stereotactic radiosurgery

Level 1A City Tower
Manchester M1 4BT
United Kingdom
+44 (0)300 323 0140
60 www.nice.org.uk
Giaccone G, Herbst RS, Manegold C, et al. Gefitinib in combination with gemcitabine
and cisplatin in advanced non-small-cell lung cancer: a phase III trial--INTACT 1. J Clin Oncol 2004; 22(5): 777-84.
‐ Examined gefitinib in combination with gemcitabine and cisplatin
Goeree R, Villeneuve J, Goeree J, Penrod JR, Orsini L, Tahami Monfared AA. Economic evaluation of nivolumab for the treatment of second-line advanced squamous NSCLC in Canada: a comparison of modeling approaches to estimate and extrapolate survival outcomes. J Med Econ 2016; 19(6): 630-44.
‐ This study is a CUA of nivolumab vs docetaxel and erlotinib as second-line therapy only.
Goffin J, Lacchetti C, Ellis PM, Ung YC, Evans WK, Lung Cancer Disease Site Group of Cancer Care Ontario's Program in Evidence-Based C. First-line systemic chemotherapy in the treatment of advanced non-small cell lung cancer: a systematic review. Journal of Thoracic Oncology 2010; 5(2): 260-74.
‐ Examined erlotinib + chemo (no trial with TKI monotherapy arm was included in the SLR )
Gray, J.,Okamoto, I.,Sriuranpong, V.,Vansteenkiste, J.,Imamura, F.,Lee, J. S.,Pang, Y.,Cobo, M.,Kasahara, K.,Hodge, R.,Lentrichia, B.,Dearden, S.,Ramalingam, S.. Osimertinib vs SoC EGFR-TKI as first-line treatment in patients with EGFRm advanced NSCLC (FLAURA): plasma ctDNA analysis. Journal of thoracic oncology. 2017. Conference: 18th world conference on lung cancer of the international association for the study of lung cancer, IASLC. 2017. Japan 12:S1754-S1755
‐ Examined osimertinib as intervention
Greer JA, Pirl WF, Jackson VA, et al. Effect of early palliative care on chemotherapy use and end-of-life care in patients with metastatic non-small-cell lung cancer. J Clin Oncol, 2012. http://onlinelibrary.wiley.com/o/cochrane/clcentral/articles/141/CN-00831141/frame.html (accessed.
‐ Palliative care integrated with standard oncology care or standard oncology care alone
‐ Only 6/151 patients received TKI as standard care, and drug was unspecified.
Gressett SM, Shah SR. Intricacies of bevacizumab-induced toxicities and their management. Ann Pharmacother 2009; 43(3): 490-501.
‐ Examined bevacizumab in combination with other agents (not with erlotinib)
Gridelli C, Ciardiello F, Gallo C, et al. First-line erlotinib followed by second-line cisplatin-gemcitabine chemotherapy in advanced non-small-cell lung cancer: the TORCH randomized trial. J Clin Oncol 2012; 30(24): 3002-11.

Level 1A City Tower
Manchester M1 4BT
United Kingdom
+44 (0)300 323 0140
61 www.nice.org.uk
‐ Compared first- line erlotinib + second-line (cisplatin + gemcitabine) vs first- line (cisplatin+gemcitabine) + second-line erlotinib
Gridelli C, Morgillo F, Favaretto A, et al. Sorafenib in combination with erlotinib or with gemcitabine in elderly patients with advanced non-small-cell lung cancer: a randomized phase II study. Ann Oncol 2011; 22(7): 1528-34.
‐ Compared (sorafenib + gemcitabine) vs (sorafenib + erlotinib)
Hapani S, Sher A, Chu D, Wu S. Increased risk of serious haemorrhage with bevacizumab in cancer patients: a meta-analysis. Oncology 2010; 79(1-2): 27-38.
‐ Examined bevacizumab only (not in combination with erlotinib)
Herbst RS, Giaccone G, Schiller JH, et al. Gefitinib in combination with paclitaxel and carboplatin in advanced non-small-cell lung cancer: a phase III trial--INTACT 2. J Clin Oncol 2004; 22(5): 785-94.
‐ Examined gefitinib in combination with paclitaxel and carboplatin
Herbst RS, Prager D, Hermann R, et al. TRIBUTE: a phase III trial of erlotinib hydrochloride (OSI-774) combined with carboplatin and paclitaxel chemotherapy in advanced non-small-cell lung cancer. J Clin Oncol 2005; 23(25): 5892-9.
‐ Examined carboplatin and paclitaxel + erlotinib vs carboplatin and paclitaxel+ placebo
Hirsch FR, Kabbinavar F, Eisen T, et al. A randomized, phase II, biomarker-selected study comparing erlotinib to erlotinib intercalated with chemotherapy in first-line therapy for advanced non-small-cell lung cancer.[Erratum appears in J Clin Oncol. 2011 Oct 10;29(29):3948 Note: Camidge, Ross [corrected to Camidge, D Ross]]. J Clin Oncol 2011; 29(26): 3567-73.
‐ Examined erlotinib vs erlotinib + chemo (paclitaxel+carboplatin)
Huang H, Zheng Y, Zhu J, Zhang J, Chen H, Chen X. An updated meta-analysis of fatal adverse events caused by bevacizumab therapy in cancer patients. PLoS ONE 2014; 9(3): e89960.
‐ Examined bevacizumab only (not in combination with erlotinib)
Janne PA, Wang X, Socinski MA, et al. Randomized phase II trial of erlotinib alone or with carboplatin and paclitaxel in patients who were never or light former smokers with advanced lung adenocarcinoma: CALGB 30406 trial. J Clin Oncol 2012; 30(17): 2063-9.
‐ Erlotinib/carboplatin/paclitaxel not a valid comparator
Jiang T, Min W, Li Y, Yue Z, Wu C, Zhou C. Radiotherapy plus EGFR TKIs in non-small cell lung cancer patients with brain metastases: an update meta-analysis. Cancer Med 2016; 5(6): 1055-65.

Level 1A City Tower
Manchester M1 4BT
United Kingdom
+44 (0)300 323 0140
62 www.nice.org.uk
‐ Radiotherapy + TKIs vs radiotherapy alone or radiotherapy + chemotherapy.
Kanarkiewicz M, Zaganczyk M, Zurawski B, Tujakowski J, Windorbska W, Krysinski J. Cost-effectiveness analysis of advanced stage non-small cell lung cancer treatment with cisplatin-vinorelbine and carboplatin-gemcytabine combination regimens. Nowotwory 2014; 64(3): 217-23.
‐ Examined cisplatin + vinorelbine vs carboplatin + gemcitabine
Kato T, Seto T, Nishio M, et al. Erlotinib Plus Bevacizumab Phase ll Study in Patients with Advanced Non-small-Cell Lung Cancer (JO25567): Updated Safety Results. Drug Saf 2018; 41(2): 229-37.
‐ Examined erlotinib plus bevacizumab versus erlotinib
Kim YH, Sumiyoshi S, Hashimoto S, et al. Expressions of insulin-like growth factor receptor-1 and insulin-like growth factor binding protein 3 in advanced non-small-cell lung cancer. Clin Lung Cancer 2012; 13(5): 385-90.
‐ Examined immunohistochemical expression of IGF receptors and response to chemotherapy (cytotoxic or TKIs as a single group) in NSCLC
Kimura H, Matsui Y, Ishikawa A, Nakajima T, Yoshino M, Sakairi Y. Randomized controlled phase III trial of adjuvant chemo-immunotherapy with activated killer T cells and dendritic cells in patients with resected primary lung cancer. Cancer Immunol Immunother 2015; 64(1): 51-9.
‐ Examined adjuvant chemo‐immunotherapy with activated killer T cells and dendritic cells vs chemotherapy
Koeppen H, Yu W, Zha J, et al. Biomarker analyses from a placebo-controlled phase II study evaluating erlotinib+/-onartuzumab in advanced non-small cell lung cancer: MET expression levels are predictive of patient benefit. Clin Cancer Res 2014; 20(17): 4488-98.
‐ Onartuzumab + erlotinib vs placebo + erlotinib
Kumar G, Woods B, Hess LM, et al. Cost-effectiveness of first-line induction and maintenance treatment sequences in non-squamous non-small cell lung cancer (NSCLC) in the U.S. Lung Cancer 2015; 89(3): 294-300.
‐ Erlotinib was considered maintenance therapy and wasn't included in the first line or induction therapy groups: (different chemotherapy regimens)
La Salvia A, Rossi A, Galetta D, et al. Intercalated Chemotherapy and Epidermal Growth Factor Receptor Inhibitors for Patients With Advanced Non-Small-cell Lung Cancer: A Systematic Review and Meta-analysis. Clin Lung Cancer 2017; 18(1): 23-33.e1.
‐ Examined chemotherapy intercalated with an EGFR-TKI versus chemotherapy

Level 1A City Tower
Manchester M1 4BT
United Kingdom
+44 (0)300 323 0140
63 www.nice.org.uk
Lacouture ME, Keefe DM, Sonis S, et al. A phase II study (ARCHER 1042) to evaluate
prophylactic treatment of dacomitinib-induced dermatologic and gastrointestinal adverse events in advanced non-small-cell lung cancer. Ann Oncol 2016; 27(9): 1712-8.
‐ Prophylactic treatment of GI and skin adverse events in dacomitinib therapy
Lai XX, Xu RA, Li YP, Yang H. Risk of adverse events with bevacizumab addition to therapy in advanced non-small-cell lung cancer: A meta-analysis of randomized controlled trials. Onco Targets Ther 2016; 9: 2421-8.
‐ Examined treatment with or without bevacizumab + concurrent chemotherapy and/or biological agent (no trial with TKI monotherapy vs erlotinib + bevacizumab was included)
LeCaer H, Barlesi F, Corre R, et al. A multicentre phase II randomised trial of weekly docetaxel/gemcitabine followed by erlotinib on progression, vs the reverse sequence, in elderly patients with advanced non small-cell lung cancer selected with a comprehensive geriatric assessment (the GFPC 0504 study). Br J Cancer 2011; 105(8): 1123-30.
‐ Examined (docetaxel/gemcitabine followed by erlotinib after progression) vs erlotinib followed by (docetaxel/gemcitabine after progression)
Lee SM, Lewanski CR, Counsell N, et al. Randomized trial of erlotinib plus whole-brain radiotherapy for NSCLC patients with multiple brain metastases. J Natl Cancer Inst 2014; 106(7).
‐ Examined whole brain RT+ placebo vs whole brain RT + erlotinib
Leighl NB, Rizvi NA, de Lima LG, Jr., et al. Phase 2 Study of Erlotinib in Combination With Linsitinib (OSI-906) or Placebo in Chemotherapy-Naive Patients With Non-Small-Cell Lung Cancer and Activating Epidermal Growth Factor Receptor Mutations. Clin Lung Cancer 2017; 18(1): 34-42.e2.
‐ Examined linsitinib + erlotinib vs erlotinib + placebo
Lester-Coll NH, Rutter CE, Bledsoe TJ, Goldberg SB, Decker RH, Yu JB. Cost-Effectiveness of Surgery, Stereotactic Body Radiation Therapy, and Systemic Therapy for Pulmonary Oligometastases. Int J Radiat Oncol Biol Phys 2016; 95(2): 663-72.
‐ Erlotinib was compared with RT and surgery
Li T, Piperdi B, Walsh WV, et al. Randomized Phase 2 Trial of Pharmacodynamic Separation of Pemetrexed and Intercalated Erlotinib Versus Pemetrexed Alone for Advanced Nonsquamous, Non-small-cell Lung Cancer. Clin Lung Cancer 2017; 18(1): 60-7.
‐ Pemetrexed/ Erlotinib not a valid comparator A1.

Level 1A City Tower
Manchester M1 4BT
United Kingdom
+44 (0)300 323 0140
64 www.nice.org.uk
Liang W, Wu X, Hong S, et al. Multi-targeted antiangiogenic tyrosine kinase inhibitors in advanced non-small cell lung cancer: Meta-analyses of 20 randomized controlled trials and subgroup analyses. PLoS ONE 2014; 9 (10) (no pagination)(e109757).
‐ Examined vandetanib, sunitinib, cediranib, sorafenib, motesanib and nintedanib containing regimens against other non-MATKI regimens (no subset analysis for study TKIs as controls).
Lister J, Stanisic S, Kaier K, Hagist C, Gultyaev D, Walzer S. Societal savings in patients with advanced non-squamous non-small-cell lung cancer receiving bevacizumab-based versus non-bevacizumab-based treatments in France, Germany, Italy, and Spain. ClinicoEconomics and Outcomes Research 2012; 4(1): 299-305.
‐ Compared bevacizumab-based chemotherapy vs standard chemotherapy
Luo S, Chen L, Chen X, Xie X. Evaluation on efficacy and safety of tyrosine kinase inhibitors plus radiotherapy in NSCLC patients with brain metastases. Oncotarget 2015; 6(18): 16725-34.
‐ Examined radiotherapy without TKIs vs TKIs + radiotherapy
Miller VA, Johnson DH, Krug LM, et al. Pilot trial of the epidermal growth factor receptor tyrosine kinase inhibitor gefitinib plus carboplatin and paclitaxel in patients with stage IIIB or IV non-small-cell lung cancer. J Clin Oncol, 2003. http://onlinelibrary.wiley.com/o/cochrane/clcentral/articles/903/CN-00437903/frame.html (accessed.
‐ Examined gefitinib in combination with carboplatin and paclitaxel
Mok T, Wu Y-L, Lee JS, et al. Detection and Dynamic Changes of EGFR Mutations from Circulating Tumor DNA as a Predictor of Survival Outcomes in NSCLC Patients Treated with First-line Intercalated Erlotinib and Chemotherapy. Clin Cancer Res 2015; 21(14): 3196-203.
‐ Interventions were gemcitabine/platinum plus sequential erlotinib or placebo
Mok TSK, Geater SL, Su WC, et al. A randomized phase 2 study comparing the combination of ficlatuzumab and gefitinib with gefitinib alone in asian patients with advanced stage pulmonary adenocarcinoma. Journal of Thoracic Oncology 2016; 11(10): 1736-44.
‐ Ficlatuzumab + gefitinib vs gefitinib
Mok TSK, Wu Y-L, Yu C-J, et al. Randomized, placebo-controlled, phase II study of sequential erlotinib and chemotherapy as first-line treatment for advanced non-small-cell lung cancer. J Clin Oncol 2009; 27(30): 5080-7.
‐ Examined erlotinib + gemcitabine + carboplatin/cisplatin vs placebo+ gemcitabine +carboplatin/cisplatin

Level 1A City Tower
Manchester M1 4BT
United Kingdom
+44 (0)300 323 0140
65 www.nice.org.uk
Morth C, Valachis A. Single-agent versus combination chemotherapy as first-line treatment for patients with advanced non-small cell lung cancer and performance status 2: a literature-based meta-analysis of randomized studies. Lung Cancer, 2014. http://onlinelibrary.wiley.com/o/cochrane/cldare/articles/DARE-12014025131/frame.html (accessed.
‐ Examined gemcitabine, carboplatin, cisplatin, pemetrexed, paclitaxel, vinorelbine, docetaxel
Nadeem H, Jayakrishnan TT, Rajeev R, Johnston FM, Gamblin TC, Turaga KK. Cost differential of chemotherapy for solid tumors. Journal of Oncology Practice 2016; 12(3): e299-e307.
‐ Examined cisplatin-based chemotherapies.
Neubauer MA, Hoverman JR, Kolodziej M, et al. Cost effectiveness of evidence-based treatment guidelines for the treatment of non-small-cell lung cancer in the community setting. Journal of Oncology Practice, 2010. http://onlinelibrary.wiley.com/o/cochrane/cleed/articles/NHSEED-22010000855/frame.html (accessed.
‐ Examined chemotherapy regimens
Ohe, Y.,Ramalingam, S.,Reungwetwattana, T.,Chewaskulyong, B.,Dechaphunkul, A.,Lee, K. H.,Imamura, F.,Nogami, N.,Cheng, Y.,Cho, B. C.,Cho, E. K.,Vansteenkiste, J.,Voon, P. J.,Zhou, C.,Gray, J.,Hodge, R.,Rukazenkov, Y.,Soria, J. C.. Osimertinib vs standard of care EGFR-TKI as first-line treatment in patients with EGFRm advanced NSCLC: FLAURA. Annals of oncology. 2017. Conference: 3rd european society for medical oncology asia congress, ESMO. 2017. Singapore 28:x125
‐ Examined osimertinib as intervention
Pan D, Wang B, Zhou X, Wang D. Clinical study on gefitinib combined with gamma-ray stereotactic body radiation therapy as the first-line treatment regimen for senile patients with adenocarcinoma of the lung (final results of JLY20080085). Mol 2013; 1(4): 711-5.
‐ Examined RT+gefitinib vs RT vs gefitinib
Penuel E, Li C, Parab V, et al. HGF as a circulating biomarker of onartuzumab treatment in patients with advanced solid tumors. Mol Cancer Ther 2013; 12(6): 1122-30.
‐ Onartuzumab + erlotinib vs placebo + erlotinib in 2nd and 3rd line therapy
Pesce GA, Klingbiel D, Ribi K, et al. Outcome, quality of life and cognitive function of patients with brain metastases from non-small cell lung cancer treated with whole brain radiotherapy combined with gefitinib or temozolomide. A randomised phase II trial of the Swiss Group for Clinical Cancer Research (SAKK 70/03). Eur J Cancer 2012; 48(3): 377-84.
‐ Examined whole brain radiotherapy in combination with gefitinib or temozolomide

Level 1A City Tower
Manchester M1 4BT
United Kingdom
+44 (0)300 323 0140
66 www.nice.org.uk
Petty WJ, Laudadio J, Brautnick L, et al. Phase II trial of dose-dense chemotherapy
followed by dose-intense erlotinib for patients with newly diagnosed metastatic non-small cell lung cancer. Int J Oncol 2013; 43(6): 2057-63.
‐ Examined cisplatin+ docetaxel followed by maintenance erlotinib
Ramalingam, S.,Reungwetwattana, T.,Chewaskulyong, B.,Dechaphunkul, A.,Lee, K. H.,Imamura, F.,Nogami, N.,Ohe, Y.,Cheng, Y.,Cho, B. C.,Cho, E. K.,Vansteenkiste, J. F.,Voon, P. J.,Zhou, C.,Gray, J.,Hodge, R.,Rukazenkov, Y.,Soria, J. C.. PR Osimertinib vs standard of care (SoC) EGFR-TKI as first-line therapy in patients (pts) with EGFRm advanced NSCLC: FLAURA. Annals of oncology. 2017. Conference: 42nd ESMO congress, ESMO. 2017. Spain 28:v635
‐ Examined osimertinib as intervention
Sangha R, Davies AM, Lara PN, Jr., et al. Intercalated erlotinib-docetaxel dosing schedules designed to achieve pharmacodynamic separation: results of a phase I/II trial. Journal of Thoracic Oncology 2011; 6(12): 2112-9.
‐ Examined intermittent erlotinib and docetaxel with different schedules in two arms
Santos Fábio N, de Castria Tiago B, Cruz Marcelo RS, Riera R. Chemotherapy for advanced non-small cell lung cancer in the elderly population. Cochrane Database Syst Rev, 2015. http://onlinelibrary.wiley.com/doi/10.1002/14651858.CD010463.pub2/abstract (accessed.
‐ Examined chemotherapy regimens exclusively
Schremser K, Rogowski WH, Adler-Reichel S, Tufman ALH, Huber RM, Stollenwerk B. Cost-Effectiveness of an Individualized First-Line Treatment Strategy Offering Erlotinib Based on EGFR Mutation Testing in Advanced Lung Adenocarcinoma Patients in Germany. Pharmacoeconomics 2015; 33(11): 1215-28.
‐ Examined platinum (cisplatin or carboplatin) and docetaxel or gemcitabine in EGFR - patients vs erlotinib (individualized therapy) in EGFR + patients
Schuler, M,Paz-Ares, L,Sequist, Lv,Tan, Eh,Mok, T,Hirsh, V,O'Byrne, K,Zhang, L,Yamamoto, N,Boyer, M,Shah, R,Bennouna, J,Dickgreber, Nj,Greve, J,Love, J,Marten, A,Fan, J,Ehrnrooth, E,Park, K,Yang, Jch. First-line afatinib for advanced EGFR mutation-positive (EGFRm+) NSCLC: analysis of long-term responders in the Phase III LUX-Lung 3, 6 and 7 trials. European journal of cancer. Conference: european cancer congress, ECCO 2017. Netherlands. 2017. 72:S176-s177
‐ Examined afatinib arms only
Seto T, Kato T, Nishio M, et al. Erlotinib alone or with bevacizumab as first-line therapy in patients with advanced non-squamous non-small-cell lung cancer harbouring EGFR

Level 1A City Tower
Manchester M1 4BT
United Kingdom
+44 (0)300 323 0140
67 www.nice.org.uk
mutations (JO25567): an open-label, randomised, multicentre, phase 2 study. Lancet Oncol 2014; 15(11): 1236-44.
‐ Examined erlotinib plus bevacizumab versus erlotinib
Shi Y, Wang L, Han B, et al. First-line icotinib versus cisplatine/pemetrexed plus pemetrexed maintenance therapy in lung adenocarcinoma patients with sensitizing EGFR mutation (CONVINCE). J Clin Oncol 2016; 34(no pagination).
‐ Examined icotinib versus cisplatine/pemetrexed plus pemetrexed
Shi YK, Wang L, Han B, et al. First-line icotinib versus cisplatine/pemetrexed plus pemetrexed maintenance therapy in lung adenocarcinoma patients with EGFR mutation (CONVINCE). Ann Oncol 2016; 27(no pagination).
‐ Examined icotinib versus cisplatine/pemetrexed plus pemetrexed
Shi YK, Wang L, Han BH, et al. First-line icotinib versus cisplatin/pemetrexed plus pemetrexed maintenance therapy for patients with advanced EGFR mutation-positive lung adenocarcinoma (CONVINCE): a phase 3, open-label, randomized study. Ann Oncol 2017; 28(10): 2443-50.
‐ Examined icotinib versus cisplatine/pemetrexed plus pemetrexed
Simon GR, Schell MJ, Begum M, et al. Preliminary indication of survival benefit from ERCC1 and RRM1-tailored chemotherapy in patients with advanced nonsmall cell lung cancer: evidence from an individual patient analysis. Cancer 2012; 118(9): 2525-31.
‐ Examined: trial a (carboplatin/gemcitabine) vs trial b (docetaxel and gefitinib) vs trial c (combination therapy with carboplatin/paclitaxel/atrasentan) vs trial d (double-agent personalized therapy)
Soo RA, Loh M, Mok TS, et al. Ethnic differences in survival outcome in patients with advanced stage non-small cell lung cancer: Results of a meta-analysis of randomized controlled trials. Journal of Thoracic Oncology 2011; 6(6): 1030-8.
‐ Examined cytotoxic chemotherapy
Souquet PJ, Chauvin F, Boissel JP, Bernard JP. Meta-analysis of randomised trials of systemic chemotherapy versus supportive treatment in non-resectable non-small cell lung cancer. Lung Cancer, 1995. http://onlinelibrary.wiley.com/o/cochrane/cldare/articles/DARE-11995001874/frame.html (accessed.
‐ Examined belustine, cisplatin, cyclophosphamide, doxorubicin, epirabicine, vindesine, vinblastine, etoposide, and other chemotherapies
Stanisic S, Bischoff HG, Heigener DF, et al. Societal cost savings through bevacizumab-based treatment in non-small cell lung cancer (NSCLC). Lung Cancer 2010; 69 Suppl 1: S24-30.

Level 1A City Tower
Manchester M1 4BT
United Kingdom
+44 (0)300 323 0140
68 www.nice.org.uk
‐ Examined bevacizumab-based treatments (not including erlotinib)
Takeda K, Hida T, Sato T, et al. Randomized phase III trial of platinum-doublet chemotherapy followed by gefitinib compared with continued platinum-doublet chemotherapy in Japanese patients with advanced non-small-cell lung cancer: results of a west Japan thoracic oncology group trial (WJTOG0203). J Clin Oncol 2010; 28(5): 753-60.
‐ Examined gefitinib in combination with chemotherapy
Tassinari D, Sartori S, Papi M, et al. Bevacizumab in the treatment of advanced, non-squamous non-small cell lung cancer: an evidence-based approach. Oncology 2011; 80(5-6): 350-8.
‐ Examined bevacizumab (not in combination with erlotinib) in combination with carboplatin-paclitaxel and cisplatin-gemcitabine
Temel JS, Greer JA, Muzikansky A, et al. Early palliative care for patients with metastatic non-small-cell lung cancer. N Engl J Med, 2010. http://onlinelibrary.wiley.com/o/cochrane/clcentral/articles/611/CN-00760611/frame.html http://www.nejm.org/doi/pdf/10.1056/NEJMoa1000678 (accessed.
‐ Examined early palliative care integrated with standard oncologic care or standard oncologic care alone (no subset analysis for TKIs)
Tran HT, Zinner RG, Blumenschein GR, Jr., et al. Pharmacokinetic study of the phase III, randomized, double-blind, multicenter trial (TRIBUTE) of paclitaxel and carboplatin combined with erlotinib or placebo in patients with advanced Non-small Cell Lung Cancer (NSCLC). Invest New Drugs 2011; 29(3): 499-505.
‐ Examined (erlotinib in combination with paclitaxel and carboplatin) vs (placebo in combination with paclitaxel and carboplatin)
Wacker B, Nagrani T, Weinberg J, Witt K, Clark G, Cagnoni PJ. Correlation between development of rash and efficacy in patients treated with the epidermal growth factor receptor tyrosine kinase inhibitor erlotinib in two large phase III studies. Clin Cancer Res 2007; 13(13): 3913-21.
‐ Erlotinib vs placebo in previously treated patients
Wang F, Ning F, Liu C, et al. Comparison of Gefitinib versus VMP in the combination with radiotherapy for multiple brain metastases from non-small cell lung cancer. Cell Biochem Biophys 2015; 71(2): 1261-5.
‐ Examined gefitinib + RT vs Chemo + RT
Wang J, Xia T-Y, Wang Y-J, et al. Prospective study of epidermal growth factor receptor tyrosine kinase inhibitors concurrent with individualized radiotherapy for patients with locally advanced or metastatic non-small-cell lung cancer. Int J Radiat Oncol Biol Phys 2011; 81(3): e59-65.

Level 1A City Tower
Manchester M1 4BT
United Kingdom
+44 (0)300 323 0140
69 www.nice.org.uk
‐ Examined concurrent oral EGFR-TKIs (gefitinib or erlotinib) + individualized thoracic RT
Wang M-z, Li L-y, Wang S-l, Zhang X-t, Zhong W, Zhang L. Efficacy and safety of gefitinib as monotherapy for Chinese patients with advanced non-small cell lung cancer. Chin Med J 2006; 119(1): 63-8.
‐ Gefitinib monotherapy
Wu Y-L, Lee JS, Thongprasert S, et al. Intercalated combination of chemotherapy and erlotinib for patients with advanced stage non-small-cell lung cancer (FASTACT-2): a randomised, double-blind trial. Lancet Oncol 2013; 14(8): 777-86.
‐ Examined gemcitabine with platinum in combination with erlotinib or placebo
Wu YL, Yang JJ, Zhou C, et al. Brain: A phase III trial comparing wbi and chemotherapy with icotinib in NSCLC with brain metastases harboring EGFR mutations (CTONG 1201). Journal of Thoracic Oncology 2017; 12 (1 Supplement 1): S6.
‐ Examined icotinib versus whole brain irradiation and chemotherapy
Yang JC-H, Srimuninnimit V, Ahn M-J, et al. First-Line Pemetrexed plus Cisplatin followed by Gefitinib Maintenance Therapy versus Gefitinib Monotherapy in East Asian Never-Smoker Patients with Locally Advanced or Metastatic Nonsquamous Non-Small Cell Lung Cancer: Final Overall Survival Results from a Randomized Phase 3 Study. Journal of Thoracic Oncology 2016; 11(3): 370-9.
‐ Pemetrexed+ cisplatin followed by maintenance gefitinib vs gefitinib monotherapy
Yang JC-H, Kang JH, Mok T, et al. First-line pemetrexed plus cisplatin followed by gefitinib maintenance therapy versus gefitinib monotherapy in East Asian patients with locally advanced or metastatic non-squamous non-small cell lung cancer: a randomised, phase 3 trial. Eur J Cancer 2014; 50(13): 2219-30.
‐ Gefitinib in both arms + gefitinib/ chemo not allowed
Yonesaka K, Hirotani K, von Pawel J, et al. Circulating heregulin level is associated with the efficacy of patritumab combined with erlotinib in patients with non-small cell lung cancer. Lung Cancer 2017; 105: 1-6.
‐ Examined high dose patritumab+ erlotinib vs low dose patritumab+ erlotinib vs erlotinib + placebo
Yu H, Zhang A. Gefitinib and docetaxel for the treatment of non-small cell lung cancer: A meta-analysis. Int J Clin Exp Med 2016; 9(11): 21057-65.
‐ Gefitinib vs docetaxel, however population was stage IIA-IV NSCLC
Yu H, Zhang J, Wu X, et al. A phase II randomized trial evaluating gefitinib intercalated with pemetrexed/platinum chemotherapy or pemetrexed/platinum chemotherapy alone

Level 1A City Tower
Manchester M1 4BT
United Kingdom
+44 (0)300 323 0140
70 www.nice.org.uk
in unselected patients with advanced non-squamous non-small cell lung cancer. Cancer Biol Ther 2014; 15(7): 832-9.
‐ Examined pemetrexed + cisplatin or carboplatin + gefitinib vs pemetrexed–platinum
Zhang H, Huang Z, Zou X, Liu T. Bevacizumab and wound-healing complications: A systematic review and meta-analysis of randomized controlled trials. Oncotarget 2016; 7(50): 82473-81.
‐ Compared bevacizumab in combination with different chemotherapy regimens in different types of cancers
Zhang L, Cao F, Wang Y, Wang S, Zhong D. Antiangiogenic agents combined with chemotherapy in the first-line treatment of advanced non-small-cell lung cancer: overall and histology subgroup-specific meta-analysis. Oncol Res Treat 2014; 37(12): 710-8.
‐ Included studies on bevacizumab not in combination with erlotinib
Zhang S, Mao X-D, Wang H-T, Cai F, Xu J. Efficacy and safety of bevacizumab plus erlotinib versus bevacizumab or erlotinib alone in the treatment of non-small-cell lung cancer: a systematic review and meta-analysis. BMJ Open 2016; 6(6): e011714.
‐ Examined erlotinib plus bevacizumab versus erlotinib
Zhao W, Liu X, Tian Q, Chang Y, Yang Z, Chen L. Randomized phase II study of erlotinib as first-line or second-line therapy for EGFR mutation-positive advanced lung adenocarcinoma patients. Biomedical Research (India) 2017; 28(4): 1917-21.
‐ Erlotinib as first-line therapy + docetaxel and cisplatin as second-line therapy vs docetaxel and cisplatin as first-line therapy plus erlotinib as second-line therapy
Zheng M-h, Sun H-t, Xu J-g, et al. Combining Whole-Brain Radiotherapy with Gefitinib/Erlotinib for Brain Metastases from Non-Small-Cell Lung Cancer: A Meta-Analysis. Biomed Res Int 2016; 2016: 5807346.
‐ Examined whole brain radiotherapy (WBRT) in combination with gefitinib or erlotinib against WBRT
Zhou J-G, Tian X, Wang X, et al. Treatment on advanced NSCLC: platinum-based chemotherapy plus erlotinib or platinum-based chemotherapy alone? A systematic review and meta-analysis of randomised controlled trials. Med Oncol 2015; 32(2): 471.
‐ Examined erlotinib + platinum-based chemotherapy vs platinum-based chemotherapy
Zhuang H, Yuan Z, Wang J, Zhao L, Pang Q, Wang P. Phase ii study of whole brain radiotherapy with or without erlotinib in patients with multiple brain metastases from lung adenocarcinoma. Drug Design, Development and Therapy 2013; 7: 1179-86.
‐ Examined WBRT vs WBRT + erlotinib

Level 1A City Tower
Manchester M1 4BT
United Kingdom
+44 (0)300 323 0140
71 www.nice.org.uk
ReasonforExclusion:Unavailableforreview Gefitinib and non-small cell lung cancer. Prescrire Int 2013; 22(143): 261-2. Epidermal growth factor receptor mutations and tyrosine kinase inhibitor therapy in
advanced non-small-cell lung cancer. Technol Eval Cent Asses Program Exec Summ 2011; 25(6): 1-5.
Iressa for non-small cell lung cancer - Early Warningon New Health Technology 2002 1(2). Danish Centre for Evaluation and Health Technology Assessment (DACEHTA), 2002. http://onlinelibrary.wiley.com/o/cochrane/clhta/articles/HTA-32005000554/frame.html (accessed.
Anonymous. Resectable non-small cell lung cancer Adjuvant chemotherapy: Slightly longer survival. Prescrire Int 2016; 25(177): 299-301.
Hayes, Inc. Bevacizumab (Avastin®) for non-small cell lung cancer. HAYES, Inc, 2011. http://onlinelibrary.wiley.com/o/cochrane/clhta/articles/HTA-32012000178/frame.html (accessed.
Hayes, Inc. Bevacizumab (Avastin) for non-small cell lung cancer. HAYES, Inc, 2007. http://onlinelibrary.wiley.com/o/cochrane/clhta/articles/HTA-32008000009/frame.html (accessed.
He H, Yang Z, Li Q. Prognostic analysisof advanced non-small cell lung cancer patientswith EGFR mutations in response to first-linetreatment with EGFR-TKIs. J Third Military Med Univ 2016; 38: 761–5.
LI R, Z Y, Ren S, Liang H, Sun J. Observation on efficacy of icotinib hydrochloride for treating advanced non-small cell lung cancer. J Mod Med Health 2013; 29: 2255-9.
Li Y, Li L, Lv E. Comparison of erlotinib andgefitinib in the treatment of non-small cell lungcancer with brain metastases. Chin J Clin Res 2015; 28: 1308–10.
1Liang S, HQ. Clinical observation of icotinibhydrochloride in the treatment of advanced non-small celllung cancer. J Tianjin Med Univ 2015; 21: 51–5.
Lin Q, Zhang Q, Zhen R. Efficacy of gefitinib and erlotinib in the treatment of EGFR gene sensitive mutations in patients with advanced NSCLC. Chin J Oncol Prev Treat 2016; 8: 171–3.
Ma X, MQ, Kou Y, Tang Y. Efficacy and safety of icotinib in patients with advanced non-small cell lung adenocarcinoma. Anhui Med Pharm J 2014; 18: 2174–7.
Moon MA. Bevacizumab does not prolong NSCLC survival in elderly. Oncology Report 2012; (MAY): 15.
Neville AJ, Kuruvilla MS. Lung cancer. Clin Evid (Online) 2010; 30: 30. Oberpichler-Schwenk H. First-line treatment of NSCLC: Significant survival advantage
with afatinib vs. chemotherapy for patients with the EGFR mutation Del19 NSCLC-Erstlinie: Signifikanter uberlebensvorteil mit afatinib* bei EGFR-Mutation Del19 vs. CT. Arzneimitteltherapie 2015; 33(11): 1-2.
Pang LRC J, Huang J, Xu C, H L, Zhen H. Icotinib hydrochloride monotherapy for patients with advanced nonsmall cell lung cancer. Zhejiang Med J 2015; 20: 1668–80.
Shi J, Zhu J. Health Resource Utilization in Patients with Advanced Non-Small Cell Lung Cancer Receiving Chemotherapy in China. Clin Drug Invest 2016; 36(1): 77-86.
Sun J, WuH X, Gu Y, Shu Y, Liu L. Clinical study of icotinib in treatment of advanced non-small cell lung cancer. China J Mod Dr 2014; 52: 116–9.
Wei F, Wang J, Zou Q, Z T. Effect of icotinib hydrochloride targeted therapy on non small cell lung cancer. J Haerbin Med Univ 2015; 49: 364–6.
Level 1A City Tower
Manchester M1 4BT
United Kingdom
+44 (0)300 323 0140
72 www.nice.org.uk
Yan Y, Liu Y, Lai C. Adverse events and nursing care of gefitinib and erlotinib therapies for nonsmall-cell lung cancer. Chin J Mod Nurs 2009; 15: 1066–7.
Zeng X, Li M, ZX Pu D. Efficacy of icotinib for advanced lung adenocarcinoma. Sichuan J Cancer Control 2013; 26: 12-5.
Appendix B
ReasonforExclusion:Population Milbury, K.,Malliah, S.,Liao, Z.,Yang, C.,Shannon, V.,Cohen, L. (2017). Randomized
controlled trial of a dyadic yoga program for lung cancer patients undergoing radiotherapy and their family caregivers Psycho-Oncology, 26 (Supplement 3)(#issue#), 8
Tan, O.,Shrestha, R.,Schofield, D. (2017). Review of the utility and the costeffectiveness of next-generation sequencing technology in cancer care Twin Research and Human Genetics, 20 (5)(#issue#), 479-480
Vicente Conesa, M. A.,Zafra Poves, M.,Ivars, M. A.,Ballester, I.,Carmona-Bayonas, A.,Ayala De La Pena, F. (2017). Health related quality of life and utility weights of medical oncology inpatients Annals of Oncology, 28 (Supplement 5)(#issue#), v397
ReasonforExclusion:Didnotreportrelevantoutcomes Brahmer, J. R.,Rodriguez-Abreu, D.,Robinson, A. G.,Hui, R.,Csoszi, T.,Fulop,
A.,Gottfried, M.,Peled, N.,Tafreshi, A.,Cuffe, S.,O'Brien, M.,Rao, S.,Hotta, K.,Zhang, J.,Lubiniecki, G. M.,Deitz, A. C.,Rangwala, R.,Reck, M. (2017). Health-related quality-of-life results for pembrolizumab versus chemotherapy in advanced, PD-L1-positive NSCLC (KEYNOTE-024): a multicentre, international, randomised, open-label phase 3 trial Lancet Oncology, 18(12), 1600-1609
Capaldi, D. P.,Sheikh, K.,Di Cesare, R.,Palma, D. A.,Parraga, G. (2017). Is ventilation heterogeneity related to quality of life scores post-radiation therapy in non-small cell lung cancer patients? American Journal of Respiratory and Critical Care Medicine. Conference: American Thoracic Society International Conference, ATS, 195(no pagination), #Pages#
Cheng, W.,Chen, W. (2017). Pharmacoeconomic systematic evaluation of bevacizumab treatment for advanced non-small cell lung cancer in China Value in Health, 20 (9)(#issue#), A446
De Pouvourville, G.,Luciani, L.,Le Lay, K.,Po, P.,Bennouna, J.,Perol, M.,Moro-Sibilot, D.,Vergnengre, A.,Chouaid, C. (2017). Cost-effectiveness analysis of afatinib versus gefitinib in EGFR-mutated population with advanced non-small-cell lung cancer in France Value in Health, 20 (9)(#issue#), A439
Gajra, A.,Karim, N. A.,Mulford, D. A.,Villaruz, L. C.,Matrana, M. R.,Ali, H. Y.,Santos, E. S.,Ong, T. J.,Sanford, A.,Amiri, K.,Spigel, D. R. (2017). Safety and efficacy of nab-paclitaxel (nab-P)-based therapy in patients (pts) with non-small cell lung cancer (NSCLC) and performance status (PS) 2: Results from ABOUND.PS2 Journal of Clinical Oncology. Conference, 35(15 Supplement 1), #Pages#
Kourkoulas, N.,Kyriopoulos, D.,Athanasakis, K. (2017). Cost-effectiveness analysis of atezolizumab compared to the standard of care for the treatment of adult patients with locally advanced or metastatic non-small cell lung cancer (NSCLC) after prior chemotherapy in Greece Value in Health, 20 (9)(#issue#), A439

Level 1A City Tower
Manchester M1 4BT
United Kingdom
+44 (0)300 323 0140
73 www.nice.org.uk
Laktionov, K.,Arzumanyan, A.,Bolotina, L.,Breder, V.,Buevich, N.,Danilova, A.,Filippova, E.,Kornietskaya, A.,Kramchaninov, M.,Kushniruk, E.,Latipova, D.,Moiseenko, F.,Nikitina, T.,Orlov, S.,Orlova, R.,Protsenko, S.,Sarantseva, K.,Stroyakovskiy, D.,Ionova, T. (2017). Multicenter observational study of the efficacy and safety of nivolumab (Nivo) as 21 line treatment and quality of life (QoL) in advanced refractory non-small cell lung cancer (NSCLC) patients: Interim analysis Annals of Oncology, 28 (Supplement 5)(#issue#), v470
Langer, C. J.,Anderson, E.,Jotte, R.,Goldman, J.,Haggstrom, D.,Modiano, M.,Socoteanu, M.,Smith, D.,Dahkil, C.,Konduri, K.,Kim, E.,Sanford, A.,Amiri, K.,Weiss, J. (2017). Quality of life (QoL) in elderly NSCLC patients (pts) treated with nabpaclitaxel/ carboplatin (nab-P/C) in the ABOUND.701 trial Annals of Oncology, 28 (Supplement 5)(#issue#), v488-v489
Matter-Walstra, K.,Schwenkglenks, M.,Aebi, S.,Dedes, K.,Diebold, J.,Pietrini, M.,Klingbiel, D.,Von Moos, R.,Gautschi, O. (2017). Nivolumab for patients with advanced non-squamous non-small cell lung cancer: A cost-effectiveness analysis including PD-L1 testing Journal of Thoracic Oncology, 12 (1 Supplement 1)(#issue#), S1430-S1431
Murray, Thomas A.,Thall, Peter F.,Yuan, Ying,McAvoy, Sarah,Gomez, Daniel R. (2017). Robust Treatment Comparison Based on Utilities of Semi-competing Risks in Non-Small-Cell Lung Cancer Journal of the American Statistical Association, 112(517), 11-23
Nankivell, M.,Mulvenna, P.,Barton, R.,Faivre-Finn, C.,Wilson, P.,McColl, E.,Moore, B.,Brisbane, I.,Ardron, D.,Stephens, R. (2017). Using proxy responses from carers to collect quality of life data on patients with brain metastases: An analysis from the UK MRC quartz trial Trials. Conference: 4th International Clinical Trials Methodology Conference , ICTMC and the 38th Annual Meeting of the Society for Clinical Trials. United Kingdom, 18(Supplement 1), #Pages#
Ponce Aix, S.,Villaflor, V.,Knoble, J.,Thomas, M.,Von Pawel, J.,Bailey, S.,Hussein, M. A.,Razaq, M. A.,Sabbath, K.,Staib, P.,Chen, T.,Trunova, N.,Spigel, D. R. (2017). Effect of nab-paclitaxel/carboplatin (nab-P/C) induction therapy on quality of life (QoL) of patients with squamous (SCC) non-small cell lung cancer (NSCLC) (ABOUND.sqm) Annals of Oncology, 28 (Supplement 5)(#issue#), v488
Purchase, J.,Paracha, N.,Abdulla, A. (2017). Health related quality of life in cancer immunotherapy: Previously treated, locally advanced or metastatic non-small-cell lung cancer Value in Health, 20 (9)(#issue#), A450
Taipale, K.,Winfree, K. B.,Boye, M.,Basson, M.,Sleilaty, G.,Eaton, J.,Evans, R.,Chouaid, C. (2017). A cost-effectiveness analysis of first-line induction and maintenance treatment sequences in patients with advanced nonsquamous non-small-cell lung cancer in France ClinicoEconomics and Outcomes Research, 9(#issue#), 505-518
Thomas, M.,Page, R.,Gressot, L.,Daniel, D.,Morgensztern, D.,Villaflor, V.,Aix, S.,Ong, T.,Trunova, N.,Spigel, D. (2017). Nab-paclitaxel/carboplatin induction therapy in squamous (SCC) NSCLC: Interim quality of life (QoL) results from ABOUND.sqm Journal of Thoracic Oncology, 12 (1 Supplement 1)(#issue#), S906
Wood, R.,Taylor-Stokes, G.,Malcolm, B.,Lees, M.,Chirita, O. (2017). The humanistic burden associated with caring for advanced NSCLC patients in europe-a real world survey of caregivers Journal of Thoracic Oncology, 12 (1 Supplement 1)(#issue#), S1182
Gonzalez, P.,Ortega-Joaquin, N.,Provencio Pulla, M.,Garrido, C.,Echave, M. (2017).

Level 1A City Tower
Manchester M1 4BT
United Kingdom
+44 (0)300 323 0140
74 www.nice.org.uk
Efficiency of nivolumab in the treatment of second-line advanced non-squamous non-small cell lung cancer (NSCLC) in Spain Annals of Oncology, 28 (Supplement 5)(#issue#), v471
Chisaki, Y.,Nakamura, N.,Yano, Y. (2017). Time-Series Modeling and Simulation for Comparative Cost-Effective Analysis in Cancer Chemotherapy: An Application to Platinum-Based Regimens for Advanced Non-small Cell Lung Cancer Biological & Pharmaceutical Bulletin, 40(1), 73-81
Ionova, T.,Arzumanyan, A.,Bolotina, L.,Breder, V.,Buevich, N.,Danilova, A.,Filippova, E.,Kornietskaya, A.,Kramchaninov, M.,Kushniruk, E.,Latipova, D.,Lipatova, D.,Malova, O.,Moiseenko, F.,Nikitina, T.,Orlov, S.,Orlova, R.,Protsenko, S.,Sarantseva, K.,Stroyakovsky, D.,Zinkovskaya, A.,Laktionov, K. (2017). Quality of life and clinical outcomes of nivolumab as 2+ line treatment in advanced refractory NSCLC PTS: Interim analysis Journal of Thoracic Oncology, 12 (11 Supplement 2)(#issue#), S1916
Borges, E. L.,Franceschini, J.,Costa, L. H.,Fernandes, A. L.,Jamnik, S.,Santoro, I. L. (2017). Family caregiver burden: the burden of caring for lung cancer patients according to the cancer stage and patient quality of life Jornal brasileiro de pneumologia : publicacao oficial da Sociedade Brasileira de Pneumologia e Tisilogia, 43(1), 18-23
Cormio, C.,Bafunno, D.,Catino, A.,Galetta, D.,Misino, A.,Montagna, E. S.,Ricci, D.,Petrillo, P.,Fabio, A. (2017). Psycho-social function and caregiver's burden in patients with advanced lung cancer Journal of Thoracic Oncology, 12 (1 Supplement 1)(#issue#), S1414-S1415
Kimman, M. L.,Jan, S.,Peters, S. A. E.,Ngelangel, C. A.,Orolfo-Real, I.,Bhoo-Pathy, N.,Woodward, M.,Arounlangsy, P.,Aung, S.,Balete, S. L.,Bounxouei, B.,Bui, D.,Datukan, J.,Gorospe, A. E.,Yip, C. H.,Htun, Y. Y.,Khopaibul, P.,Khuayjarernpanishk, T.,Khuhaprema, T.,Khin, M.,Naing, W. P. P.,Oo, K. M.,Shwe, S.,Win, L. L.,Kingston, D.,Klinwimol, T.,Lalitwongsa, S.,Lawbundis, D.,Lola, C.,Marbella, L.,Trong, K. M.,Maung, S. O.,Mon, S.,Nyein, H. L.,Ong-Cornel, A. B.,Xuan, D. P.,Pharin, S.,Pujianto,,Rattanavong, O.,Samnang, K.,Sangkittipaiboon, S.,Sangrajrang, S.,Santiago-Ferreras, C.,Sokha, E.,Sinthusake, T.,Suanplu, D.,Tanabodee, J.,Thabrany, H.,Thepsuwan, K.,Viroath, H.,Win, S. S.,Win, T. M.,Ashariati, A.,Atmakusuma, D.,Bakta, I. M.,Kim, L. D. T.,Ngoc, P. D. T.,Bao, T. D.,Djatmiko, A.,Fachruddin, A.,Kurnianda, J.,Monaghan, H.,Muthalib, A.,Thuy, T. N.,Hoang, T. N.,Hoai, N. N. T.,Quang, H. P.,Panigoro, S. S.,Pin, G. P.,Thanh, K. Q.,Sarnianto, P.,Suardi, D. R.,Subramaniam, S.,Sudoyo, A. W.,Dang, K. T.,Dinh, H. T.,Suharti, C.,Suyatno, (2017). Health-related quality of life and psychological distress among cancer survivors in Southeast Asia: Results from a longitudinal study in eight low- and middle-income countries BMC Medicine, 15 (1) (no pagination)(10), #Pages#
Roydhouse, J. K.,Gutman, R.,Keating, N. L.,Mor, V.,Wilson, I. B. (2018). Proxy and patient reports of health-related quality of life in a national cancer survey Health and quality of life outcomes, 16(1), 6
ReasonforExclusion:Full‐textunavailable Chandwani, S.,Vaghani, V.,Hirschmann, M.,Lacerda Landry, L.,Roarty, E.,Zhang, J.,Shi,
Q.,Rinsurnogkawong, W.,Lewis, J.,Williams, L.,Cleeland, C.,Burke, T.,Lee, J.,Roth, J.,Swisher, S.,Heymach, J.,Simon, G. (2017). Computing the impact of immunotherapy on NSCLC landscape: The advanced non-small cell lung cancer holistic registry (ANCHOR) Journal of Thoracic Oncology, 12 (11 Supplement 2)(#issue#), S2403

Level 1A City Tower
Manchester M1 4BT
United Kingdom
+44 (0)300 323 0140
75 www.nice.org.uk
Georgieva, M.,Aguiar, P.,Lima, J. P.,Haaland, B.,Lopes, G. (2017). Cost-effectiveness of pembrolizumab as first-line therapy for advanced non-small cell lung cancer Journal of Thoracic Oncology, 12 (11 Supplement 2)(#issue#), S2149-S2150
Hirsh, V.,Tan, E.,Wu, Y.,Sequist, L.,Zhou, C.,Schuler, M.,Geater, S.,Mok, T.,Hu, C.,Yamamoto, N.,Feng, J.,O'Byrne, K.,Lu, S.,Huang, Y.,Sebastian, M.,Okamoto, I.,Dickgreber, N.,Shah, R.,Palmer, M.,Marten, A.,Massey, D.,Samuelsen, C.,Yang, J. C. (2017). Afatinib dose adjustment: Effect on safety, efficacy and patient-reported outcomes in the LUX-Lung 3/6 Trials in EGFRm+ NSCLC Journal of Thoracic Oncology, 12 (11 Supplement 2)(#issue#), S2231
Hu, X.,Goldman, D. P. (2017). First-line pembrolizumab in PD-l1 positive non-small cell lung cancer: A cost-effectiveness analysis from a UK healthcare perspective Value in Health, 20 (9)(#issue#), A399
Karim, S.,Ding, K.,Bradbury, P.,Ellis, P.,Mittman, N.,Xiaoqun Sun, X.,Millward, M.,Liu, G.,Sun, S.,Stockler, M. R.,Cohen, V.,Blais, N.,Sangha, R.,Boyer, M.,Sasidharan, R.,Lee, C.,Shepherd, F. A.,Goss, G.,Seymour, L.,Leighl, N. B. (2017). Costs of dacomitinib versus placebo in pretreated unselected patients (pts) with advanced NSCLC: CCTG BR.26 Annals of Oncology, 28 (Supplement 5)(#issue#), v398
Kuhlmann, A.,Schmidt, T.,Treskova, M.,Golpon, H.,Welte, T.,Graf Von Der Schulenburg, J. (2017). Cost-effectiveness of immune checkpoint inhibitors in the treatment of advanced non-small cell lung cancer Journal of Thoracic Oncology, 12 (11 Supplement 2)(#issue#), S2302-S2303
Laktionov, K. K.,Arzumanyan, A. L.,Bolotina, L. V.,Breder, V. V.,Buevich, N. N.,Danilova, A.,Filippova, E. A.,Kornietskaya, A.,Kramchaninov, M. M.,Kushniruk, E. K.,Latipova, D. H.,Lipatova, D. A.,Moiseenko, F. V.,Nikitina, T. P.,Orlov, S.,Orlova, R.,Protsenko, S.,Sarantseva, K. A.,Stroyakovskiy, D.,Ionova, T. I. (2017). Observational study of the efficacy of nivolumab (Nivo) as 2+ line treatment and quality of life (QoL) in advanced refractory non-small cell lung cancer (NSCLC) patients: Interim analysis Journal of Clinical Oncology. Conference, 35(15 Supplement 1), #Pages#
Loong, H.,Huang, M.,Wong, C.,Leung, L.,Burke, T.,Chandwani, S.,Law, A.,Tan, S. C. (2017). Cost-effectiveness of PDL1 based test-and-treat strategy with pembrolizumab as the 1st line treatment for NSCLC in Hong Kong Journal of Thoracic Oncology, 12 (11 Supplement 2)(#issue#), S1913
Nguyen, T. T.,Grappasonni, I.,Nguyen, T. B.,Petrelli, F. (2017). A systematic review of pharmacoeconomic evaluation of erlotinib in the first-line treatment of advanced non-small cell lung cancer Value in Health, 20 (9)(#issue#), A438
Schuler, M.,Yang, J. C.,Sequist, L.,Wu, Y.,Zhou, C.,Geater, S.,Mok, T.,Tan, E.,Hu, C.,Yamamoto, N.,Feng, J.,O'Byrne, K.,Lu, S.,Hirsh, V.,Huang, Y.,Ellis, S.,Samuelsen, C.,Marten, A.,Fan, J.,Park, K.,Paz-Ares, L. (2017). Analysis of long-term response to first-line afatinib in the LUX-Lung 3, 6 and 7 trials in advanced EGFRm+ NSCLC Journal of Thoracic Oncology, 12 (11 Supplement 2)(#issue#), S2210
Tam, V.,Tse, B. C.,Tse, T.,Lu, L.,Tam, E.,Borean, M.,Labbe, C.,Doherty, M.,Bradbury, P. A.,Leighl, N. B.,Brown, M. C.,Xu, W.,Howell, D.,Liu, G.,O'Kane, G. (2017). Health utility scores (HUS) and health-related quality of life (HRQoL) in stage 4 lung cancer (S4LC) patients with brain metastases (BM) Journal of Clinical Oncology. Conference, 35(8 Supplement 1), #Pages#
Tan, D. S. W.,Soria, J. C.,De Castro, G.,Wu, Y. L.,Paz-Ares, L.,Wolf, J.,Geater, S.,Orlov, S.,Cortinovis, D.,Yu, C. J.,Hochmair, M.,Cortot, A.,Tsai, C. M.,Moro-Sibilot,

Level 1A City Tower
Manchester M1 4BT
United Kingdom
+44 (0)300 323 0140
76 www.nice.org.uk
D.,Campelo, R. G.,Branle, F.,Sen, P.,Struebbe, G.,McCulloch, T.,Crino, L. (2017). Pros with ceritinib versus chemotherapy in patients with previously untreated ALK-rearranged nonsquamous NSCLC (ascend-4) Journal of Thoracic Oncology, 12 (1 Supplement 1)(#issue#), S1176-S1177
Taylor-Stokes, G.,Wood, R.,Lees, M.,Chirita, O. (2017). Impact of brain metastases on the humanistic burden incurred by patients with advanced non-small cell lung cancer (A-nsclc) Journal of Thoracic Oncology, 12 (11 Supplement 2)(#issue#), S2073
Taylor-Stokes, G.,Wood, R.,Lees, M.,Malcolm, B.,Chirita, O. (2017). The humanistic burden of advanced non-small cell lung cancer on patients and their caregivers Journal of Clinical Oncology. Conference, 35(5 Supplement 1), #Pages#
ReasonforExclusion:Studydesignnotofinterest
Brown, J.,Cook, K.,Adamski, K.,Lau, J.,Bargo, D.,Breen, S.,Chawla, A. (2017). Utility values associated with advanced or metastatic non-small cell lung cancer: data needs for economic modeling Expert Review of Pharmacoeconomics and Outcomes Research, 17(2), 153-164
Carlson, J. J.,Canestaro, W.,Ravelo, A.,Wong, W. (2017). The cost-effectiveness of alectinib in anaplastic lymphoma kinase-positive (ALK+) advanced NSCLC previously treated with crizotinib Journal of Medical Economics, 20(7), 671-677
Chouaid, C.,Luciani, L.,LeLay, K.,Do, P.,Bennouna, J.,Perol, M.,Moro-Sibilot, D.,Vergnenegre, A.,de Pouvourville, G. (2017). Cost-Effectiveness Analysis of Afatinib versus Gefitinib for First-Line Treatment of Advanced EGFR-Mutated Advanced Non-Small Cell Lung Cancers Journal of Thoracic Oncology: Official Publication of the International Association for the Study of Lung Cancer, 12(10), 1496-1502
Field, J. (2017). UK lung screening trial cost effectiveness and current planning status of international lung cancer screening programs Journal of Thoracic Oncology, 12 (1 Supplement 1)(#issue#), S119
Inoue, A. (2017). The "value" of immune-checkpoint inhibitors for advanced lung cancer Respiratory Investigation, 55(4), 253-254
Kourkoulas, N.,Kyriopoulos, D.,Athanasakis, K. (2017). Cost-effectiveness analysis of alectinib compared to chemotherapy for the treatment of treatment-naive patients with alk positive locally advanced or metastatic non-small cell lung cancer (NSCLC) in Greece Value in Health, 20 (9)(#issue#), A433
Le, A. D.,Alzghari, S. K.,Jean, G. W.,La-Beck, N. M. (2017). Update on targeted therapies for advanced non-small cell lung cancer: Nivolumab in context Therapeutics and Clinical Risk Management, 13(#issue#), 223-236
Lu, S.,Ye, M.,Ding, L.,Tan, F.,Fu, J.,Wu, B. (2017). Cost-effectiveness of gefitinib, icotinib, and pemetrexed-based chemotherapy as first-line treatments for advanced non-small cell lung cancer in China Oncotarget, 8(6), 9996-10006
Morgan, P.,Woolacott, N.,Biswas, M.,Mebrahtu, T.,Harden, M.,Hodgson, R. (2017). Crizotinib for Untreated Anaplastic Lymphoma Kinase-Positive Non-Small-Cell Lung Cancer: An Evidence Review Group Perspective of a NICE Single Technology Appraisal Pharmacoeconomics, 35(9), 909-919
Pinheiro, B. A.,Alarcao, J.,Silva Miguel, L.,Huang, M.,Chandwani, S.,Vargas Lopes, F.,Borges, M. (2017). Cost-effectiveness of pembrolizumab for the first-line treatment of metastatic non-small cell lung carcinoma in Portugal Value in Health, 20 (9)(#issue#), A432

Level 1A City Tower
Manchester M1 4BT
United Kingdom
+44 (0)300 323 0140
77 www.nice.org.uk
Saramago, P.,Ines, M.,Saraiva, F. (2017). Cost-effectiveness analysis of crizotinib for untreated anaplastic lymphoma kinase-positive advanced non-small-cell lung cancer in Portugal Value in Health, 20 (9)(#issue#), A434
Zhu, J.,Ye, M.,Fu, J.,Wu, B.,Chu, Y.,Zhao, Y.,Zhang, Y.,Kuo, D.,Su, B. (2017). Cost-effectiveness of afatinib and erlotinib as second-line treatments for advanced squamous cell carcinoma of the lung in China Value in Health, 20 (9)(#issue#), A442
Zhu, J.,Ye, M.,Fu, J.,Wu, B.,Chu, Y.,Zhao, Y.,Zhang, Y.,Kuo, D.,Su, B. (2017). Cost-effectiveness of afatinib, gefitinib, erlotinib, and pemetrexed-based chemotherapy as first-line treatments for egfr mutation positive, advanced non-small cell lung cancer in China Value in Health, 20 (9)(#issue#), A440-A441
ReasonforExclusion:Didnotmeetdatelimitrequirements
Basson, M.,Sleilaty, G.,Taipale, K. L.,Boye, M.,Winfree, K. B.,Eaton, J.,Evans, R.,Chouaid, C. (2017). Effectiveness of pemetrexed in advanced non-squamous NSCLC and estimation of its impact on public health in France Journal of Thoracic Oncology, 12 (1 Supplement 1)(#issue#), S1431-S1432
Langer, C.,Goldman, J.,Amiri, K.,Anderson, E.,Dakhil, S.,Haggstrom, D.,Jotte, R.,Konduri, K.,Modiano, M.,Ong, T.,Sanford, A.,Smith, D.,Socoteanu, M.,Kim, E.,Weiss, J. (2017). Safety and efficacy results from ABOUND.70+: Nab-paclitaxel/ carboplatin in elderly patients with advanced NSCLC Journal of Thoracic Oncology, 12 (1 Supplement 1)(#issue#), S916-S917
Lehto, R.,Wyatt, G.,Sikorskii, A. (2017). Psychological distress and attrition in patients receiving computer-delivered supportive interventions for symptom management during treatment for advanced lung cancer Psycho-Oncology, 26 (Supplement 1)(#issue#), 83
O'Kane, G.,Labbe, C.,Su, S.,Tse, B.,Tam, V.,Tse, T.,Doherty, M.,Stewart, E.,Brown, C.,Cosio, A. P.,Patel, D.,Liang, M.,Gill, G.,Rett, A.,Leung, Y.,Naik, H.,Eng, L.,Mittmann, N.,Leighl, N.,Feld, R.,Bradbury, P.,Shepherd, F.,Xu, W.,Howell, D.,Liu, G. (2017). The impact of brain metastases and their treatment on health utility scores in molecular subsets of lung cancer patients Journal of Thoracic Oncology, 12 (1 Supplement 1)(#issue#), S937
Omori, Y.,Brnabic, A.,Rajan, N.,Park, J.,Enatsu, S.,Inoue, A. (2017). QOL and febrile neutropenia: Japanese phase 2 trial of docetaxel with/out antiangiogenic agent in 2nd line NSCLC Journal of Thoracic Oncology, 12 (1 Supplement 1)(#issue#), S901
Shi, Q.,Hu, S.,Furnback, W. E.,Guzauskas, G. F.,Shen, J.,Wang, B. C. (2017). The cost-effectiveness of a NSCLC patient assistance program for pemetrexed maintenance therapy in people's republic of China ClinicoEconomics and Outcomes Research, 9(#issue#), 99-106
Spigel, D.,Schwartzberg, L.,Waterhouse, D.,Chandler, J.,Hussein, M.,Jotte, R.,Stepanski, E.,McCleod, M.,Page, R.,Sen, R.,McDonald, J.,Bennett, K.,Korytowsky, B.,Aanur, N.,Reynolds, C. (2017). Is Nivolumab safe and effective in elderly and PS2 patients with non-small cell lung cancer (NSCLC)? results of checkmate 153 Journal of Thoracic Oncology, 12 (1 Supplement 1)(#issue#), S1287-S1288
Taylor-Stokes, G.,Wood, R.,Malcolm, B.,Lees, M.,Chirita, O. (2017). The humanistic burden of advanced non-small cell lung cancer patients in Europe - A real world survey Journal of Thoracic Oncology, 12 (1 Supplement 1)(#issue#), S685
Weiss, J.,Kim, E.,Amiri, K.,Anderson, E.,Dakhil, S.,Haggstrom, D.,Jotte, R.,Konduri, K.,Modiano, M.,Ong, T.,Sanford, A.,Smith, D.,Socoteanu, M.,Goldman, J. W.,Langer, C.

Level 1A City Tower
Manchester M1 4BT
United Kingdom
+44 (0)300 323 0140
78 www.nice.org.uk
(2017). ABOUND.70+: Interim quality of life (QoL) results of nab-paclitaxel/ carboplatin treatment of elderly patients with NSCLC Journal of Thoracic Oncology, 12 (1 Supplement 1)(#issue#), S911-S912
Zhou, J.,Lu, Y.,Chung, C. H.,Masters, E.,Wilner, K.,Tang, Y.,Wu, Y. L. (2017). Patient reported general health status in a study of crizotinib versus chemotherapy in patients with non-small cell lung cancer (NSCLC) Journal of Thoracic Oncology, 12 (1 Supplement 1)(#issue#), S1169
Zwitter, M. (2017). Endpoints in reports on clinical trials for advanced lung cancer Journal of Thoracic Oncology, 12 (1 Supplement 1)(#issue#), S1427-S1428
Appendix C
ReasonforExclusion:Population Field, J. K.,Gaynor, E. S.,Duffy, S. W.,Gardner, K.,Hubbert, C.,Tsintzos, D.,Marcus, M.
W.,Jones, L.,Avanitis, R.,Timoney, M.,Ledson, M. (2017). Liverpool healthy lung project: A primary care initiative to identify hard to reach individuals with a high risk of developing lung cancer Cancer Research. Conference: American Association for Cancer Research Annual Meeting, 77(13 Supplement 1), #Pages#
Sullivan, F. M.,Farmer, E.,Mair, F. S.,Treweek, S.,Kendrick, D.,Jackson, C.,Robertson, C.,Briggs, A.,McCowan, C.,Bedford, L.,Young, B.,Vedhara, K.,Gallant, S.,Littleford, R.,Robertson, J.,Sewell, H.,Dorward, A.,Sarvesvaran, J.,Schembri, S. (2017). Detection in blood of autoantibodies to tumour antigens as a case-finding method in lung cancer using the EarlyCDT-Lung Test (ECLS): study protocol for a randomized controlled trial BMC Cancer, 17(1), 187
Zhang, Y. Z.,Mauri, F.,Sandison, A.,Gupta, N. (2017). Changes in diagnostic practice of metastatic lung cancer over a 12-year period in a UK tertiary referral centre Journal of Pathology, 241 (Supplement 1)(#issue#), S6
Andreas, S.,Chouaid, C.,Danson, S.,Siakpere, O.,Benjamin, L.,Ehness, R.,Dramard-Goasdoue, M. H.,Barth, J.,Hoffmann, H.,Potter, V.,Barlesi, F.,Chirila, C.,Hollis, K.,Sweeney, C.,Price, M.,Wolowacz, S.,Kaye, J. A.,Kontoudis, I. (2018). Economic burden of resected (stage IB-IIIA) non-small cell lung cancer in France, Germany and the United Kingdom: A retrospective observational study (LuCaBIS) Lung Cancer., #volume#(#issue#), #Pages#
Salem, A.,Faivre-Finn, C. (2016). The feasibility of conducting radiotherapy trials in patients with stage II-III non-small cell lung cancer (NSCLC) not eligible for chemotherapy and/or surgery: Results of a clinical audit over an 18-month period Lung Cancer, 91 (Supplement 1)(#issue#), S55
ReasonforExclusion:StudyDesign Anonymous, (2017). ISPOR 20th Annual European Congress Research Abstracts Value
in Health. Conference: ISPOR 20th Annual European Congress. United Kingdom, 20(9), #Pages#
Bowden, J.,Macpherson, C.,Boyce, S.,Lyell, M.,Fenning, S.,Scragg, S. (2017). Turning best supportive care into active care. A service development for patients with advanced lung cancer in NHS Fife, Scotland Journal of Thoracic Oncology, 12 (1 Supplement 1)(#issue#), S328-S329
Campbell, S.,Erridge, S.,Ironside, J.,Little, F.,Evans, T.,Mackean, M.,Patrizio, A. (2017).

Level 1A City Tower
Manchester M1 4BT
United Kingdom
+44 (0)300 323 0140
79 www.nice.org.uk
How do we really treat patients with Stage III Non-Small Cell Lung Cancer (NSCLC)? Clinical outcome Allan price Journal of Thoracic Oncology, 12 (1 Supplement 1)(#issue#), S850-S851
Dorward, A.,Frances Mair, F.,Sullivan, F.,Vedhara, K.,Kendrick, D.,Treweek, S.,McCowan, C.,McConnachie, A.,Sproule, M.,Briggs, A.,Ritchie, L.,Milroy, R.,Taylor, T.,Littleford, R.,Brewster, D.,Schembri, S. (2016). A randomised controlled study of lung cancer screening in Scotland using the detection of autoantibodies to tumour antigens (earlycdt-lung test) Thorax, 71 (Supplement 3)(#issue#), A78-A79
Hall, C. J.,Umeweni, N.,Knight, H.,Smith, L. (2016). NICE guidance on ramucirumab for previously treated locally advanced or metastatic non-small-cell lung cancer Lancet Oncology, 17(10), 1357-1358
Hu, X.,Goldman, D. P. (2017). First-line pembrolizumab in PD-l1 positive non-small cell lung cancer: A cost-effectiveness analysis from a UK healthcare perspective Value in Health, 20 (9)(#issue#), A399
Landau, D.,Faivre-Finn, C.,Lester, J. F.,Maguire, J.,Paul, J.,McCartney, E.,Haswell, T.,Boyd, K.,Fenwick, J.,Parsons, E.,Taggart, D.,Hatton, M.,Lawless, C. A. (2016). ADSCaN: A randomised phase II study of Accelerated, Dose escalated, Sequential, Chemo-radiotherapy in Non-Small Cell Lung Cancer Lung Cancer, 91 (Supplement 1)(#issue#), S68
Mambetsariev, I.,Amanam, I.,Nam, A.,Salgia, R. (2017). KRAS-targeted therapy or angiogenesis: Still a viable target? Journal of Thoracic Oncology, 12 (11 Supplement 2)(#issue#), S1723-S1724
Matter-Walstra, K.,Schwenkglenks, M.,Aebi, S.,Dedes, K.,Diebold, J.,Pietrini, M.,Klingbiel, D.,Von Moos, R.,Gautschi, O. (2017). Nivolumab for patients with advanced non-squamous non-small cell lung cancer: A cost-effectiveness analysis including PD-L1 testing Journal of Thoracic Oncology, 12 (1 Supplement 1)(#issue#), S1430-S1431
Morgan, P.,Woolacott, N.,Biswas, M.,Mebrahtu, T.,Harden, M.,Hodgson, R. (2017). Crizotinib for Untreated Anaplastic Lymphoma Kinase-Positive Non-Small-Cell Lung Cancer: An Evidence Review Group Perspective of a NICE Single Technology Appraisal Pharmacoeconomics, 35(9), 909-919
Nafees, B.,Lloyd, A. J.,Dewilde, S.,Rajan, N.,Lorenzo, M. (2017). Health state utilities in non-small cell lung cancer: An international study Asia-Pacific Journal of Clinical Oncology, 13(5), e195-e203
Sullivan, F.,Dorward, A.,Mair, F.,Schembri, S.,Vedhara, K.,Kendrick, D.,Treweek, S.,McCowan, C.,McConnachie, A.,Sproule, M.,Briggs, A.,Ritchie, L.,Milroy, R.,Taylor, T.,Littleford, R.,Brewster, D. (2017). An RCT of the detection of autoantibodies to tumor antigens in lung cancer using the EarlyCDT-lung test in Scotland (ECLS) in 12 208 study subjects Journal of Thoracic Oncology, 12 (1 Supplement 1)(#issue#), S1095
Talbot, T.,Dangoor, A.,Shah, R.,Naik, J.,Talbot, D.,Lester, J. F.,Cipelli, R.,Patel, A.,Summerhayes, M.,Newsom-Davis, T. (2017). The rate of neutropenic sepsis (NS) and other haematological toxicities in patients with advanced nonsmall cell lung cancer (NSCLC) treated with docetaxel in the UK NHS: REVEAL-NS Lung Cancer, 103 (Supplement 1)(#issue#), S40-S41
Umeweni, N.,Knight, H.,McVeigh, G. (2016). NICE guidance on necitumumab for untreated advanced or metastatic squamous non-small-cell lung cancer Lancet Oncology, 17(11), 1483-1484

Level 1A City Tower
Manchester M1 4BT
United Kingdom
+44 (0)300 323 0140
80 www.nice.org.uk
Talbot, T.,Dangoor, A.,Shah, R.,Naik, J.,Lees, C.,Lester, J. F.,Cipelli, R.,Hodgson, M.,Patel, A.,Summerhayes, M.,Newsom-Davis, T. (2017). Resource use associated with the management of docetaxel-related haematological toxicities, including neutropenic sepsis (NS), in patients with advanced nonsmall cell lung cancer (NSCLC) in the UK NHS: REVEAL-NS Lung Cancer, 103 (Supplement 1)(#issue#), S41
ReasonforExclusion:Full‐textunavailable Anhorn, R.,Roberts, G.,Skovhus, M.,Khorshid, M. (2017). Impact of comprehensive
genomic profiling of patients with first line non-small cell lung cancer in the UK Value in Health, 20 (9)(#issue#), A575
Georgieva, M.,Aguiar, P.,Lima, J. P.,Haaland, B.,Lopes, G. (2017). Cost-effectiveness of pembrolizumab as first-line therapy for advanced non-small cell lung cancer Journal of Thoracic Oncology, 12 (11 Supplement 2)(#issue#), S2149-S2150
Gray, P.,Squirrell, D. (2017). Does CCG spending on cancer affect outcomes in breast and lung cancer? Value in Health, 20 (9)(#issue#), A430
Pulfer, A.,Hodgson, M.,Patel, A.,Purchase, J.,Summerhayes, M.,Newsom-Davis, T. (2017). Resource use and associated costs of managing docetaxel-related neutropenic sepsis in patients with advanced non-small cell lung cancer in the UK NHS: Reveal-NS Value in Health, 20 (9)(#issue#), A446-A447
Solem, C. T.,Penrod, J. R.,Lees, M.,Macahilig, C.,Luo, L.,Verleger, K.,Manley Daumont, M.,Hertel, N. (2017). Cost drivers of lung cancer care: Results from a retrospective chart review of pretreated advanced nsclc patients in europe Value in Health, 20 (9)(#issue#), A431-A432
Solem, C. T.,Penrod, J. R.,Lees, M.,Macahilig, C.,Luo, L.,Verleger, K.,Manley Daumont, M.,Hertel, N. (2017). Real-world health care resource utilization and related costs among patients who received at least two lines of treatment for advanced NSCLC in England, the Netherlands, and Sweden Value in Health, 20 (9)(#issue#), A431
ReasonforExclusion:Publishedoutsideofdatelimits
Field, J. (2017). UK lung screening trial cost effectiveness and current planning status of international lung cancer screening programs Journal of Thoracic Oncology, 12 (1 Supplement 1)(#issue#), S119
Appendix D
ReasonforExclusion:Populationnotofinterest
Abouzid, A. (2014). Is the drug cost the main driver for the high incremental cost utility ratios in oncology treatments? A systematic review and a meta-analysis Value in Health, 17 (7)(#issue#), A662
Aguiar, P.,Perry, L. A.,Lopes, G. L. (2016). Cost-effectiveness of immune checkpoint inhibitors in NSCLC according to PD-L1 expression Lung Cancer Management, 5(3), 119-122
Aissaoui, N.,Bin Sawad, A.,Turkistani, F. (2016). Continental comparison of innovative drugs prices, the case of oncology used for treatment of solid tumors in Germany and the United States Value in Health, 19 (7)(#issue#), A758
Ajmera, M. R.,Davis, K. L.,Li, L.,Huang, Y.,Price, G. L.,Goyal, R. K.,John, W. J.,Cuyun

Level 1A City Tower
Manchester M1 4BT
United Kingdom
+44 (0)300 323 0140
81 www.nice.org.uk
Carter, G.,Kaye, J. A.,Boye, M. E. (2016). Economic outcomes associated with tumor histology among elderly patients with metastatic non-small cell lung cancer Value in Health, 19 (3)(#issue#), A165
Alamo, A. M.,Mateos, E.,Nucete, B.,Lujan, M. E.,Lombardero, M.,Otero, C. (2018). An estimate of avoided costs for drugs in patients included in non-small lung cancer clinical trials European Journal of Hospital Pharmacy, 25 (Supplement 1)(#issue#), A91-A92
Alkadour, A.,Al-Marridi, W.,Al-Badriyeh, D. (2016). Pharmacoeconomic evaluations of oral anticancer agents: Thematic systematic review Value in Health, 19 (3)(#issue#), A150
Anonymous, (2015). Nivolumab approved for lung cancer Cancer discovery, 5(5), OF1 Arteaga, C. L.,Adamson, P. C.,Engelman, J. A.,Foti, M.,Gaynor, R. B.,Hilsenbeck, S.
G.,Limburg, P. J.,Lowe, S. W.,Mardis, E. R.,Ramsey, S.,Rebbeck, T. R.,Richardson, A. L.,Rubin, E. H.,Weiner, G. J.,Sweeney, S. M.,Honey, K.,Bachen, J.,Driscoll, P.,Hobin, J.,Ingram, J.,Kalamegham, R.,Lobb, R.,Retzlaff, J. G.,Watts, M. L.,Fuller, N. R. (2014). AACR Cancer Progress Report 2014 Clinical Cancer Research, 20(19), SI-S112
Azar, F. E.,Azami-Aghdash, S.,Pournaghi-Azar, F.,Mazdaki, A.,Rezapour, A.,Ebrahimi, P.,Yousefzadeh, N. (2017). Cost-effectiveness of lung cancer screening and treatment methods: a systematic review of systematic reviews BMC health services research, 17(1), 413
Banegas, M. P.,Hassett, M. J.,Fishman, P. A.,Hornbrook, M. C.,Carroll, N. M.,Cronin, A. M.,O'Keeffe-Rosetti, M. C.,Uno, H.,Ritzwoller, D. P. (2017). Differences in medical care costs for recurrent versus de novo stage IV cancer by age at diagnosis Journal of Clinical Oncology. Conference, 35(15 Supplement 1), #Pages#
Bastian, A.,Dua, D.,Kelly, S.,Asabere, A. (2016). An investigation of the correlation between price and eligible patient population size for lung cancer products available in the united states Value in Health, 19 (3)(#issue#), A148
Beauchemin, C.,Lapierre, M.,Letarte, N.,Yelle, L.,Lachaine, J. (2015). How to conduct economic evaluations of new treatments for advanced cancer when overall survival data are not available? Results from a systematic literature review Value in Health, 18 (7)(#issue#), A682
Bebell, L. M. (2016). Cough It Up: A Health Care Paradox Jama, 316(14), 1449-1450 Beckermann, K.,Horn, L. (2016). Immune checkpoint inhibition in lung cancer: The
good, the bad, and the ugly Oncology, 30(8), #Pages# Bhandari, N. R.,Kathe, N. J.,Martin, B. C. (2016). Cost of healthcare among metastatic
lung cancer patients receiving chemotherapy Value in Health, 19 (7)(#issue#), A624-A625
Bindman, A. (2015). JAMA forum: Lung cancer screening and evidence-based policy JAMA - Journal of the American Medical Association, 313(1), 17-18
Bongers, M. L.,Coupe, V. M.,Jansma, E. P.,Smit, E. F.,Uyl-de Groot, C. A. (2012). Cost effectiveness of treatment with new agents in advanced non-small-cell lung cancer: a systematic review Pharmacoeconomics, 30(1), 17-34
Borges, M.,Gouveia, M.,Alarcao, J.,Sousa, R.,Teixeira, E.,Barata, F.,Laranjeira, E.,Lopes, F.,Parente, B.,Pinheiro, L.,Vaz-Carneiro, A.,Costa, J. (2014). Cost and burden of non-small cell lung cancer's in Portugal Value in Health, 17 (7)(#issue#), A626
Borget, I.,Perol, M.,Perol, D.,Lavole, A.,Greillier, L.,Acya, B. T.,Westeel, V.,Berard, H.,Auliac, J. B.,Zalcman, G.,Dujon, C.,Robinet, G.,Fournel, P.,Thomas, P.,Margery, J.,Oster, J. P.,Chabaud, S.,Vergnenegre, A.,Chouaid, C. (2012). Cost-utility analysis of

Level 1A City Tower
Manchester M1 4BT
United Kingdom
+44 (0)300 323 0140
82 www.nice.org.uk
maintenance therapy with either gemcitabine or erlotinib versus observation with predefined second-line treatment after cisplatin-gemcitabine induction chemotherapy in advanced NSCLC: IFCT-GFPC 0502-eco phase III study Journal of Clinical Oncology. Conference, 30(15 SUPPL. 1), #Pages#
Camidge, D. R. (2017). Drinking not drowning: How to deal with the deluge of potential predictive biomarker approaches in non-small-cell lung cancer Journal of Oncology Practice, 13(4), 229-230
Casebeer, A. W.,Hopson, S.,Drzayich Antol, D.,Li, Y.,Khoury, R.,DeClue, R. W.,Parikh, A.,Michael, T.,Stemkowski, S.,Bunce, M. (2016). The association between initiation of guideline recommended first-line systemic therapy and healthcare costs and utilization in a metastatic non-small cell lung cancer (MNSCLC ) population Value in Health, 19 (7)(#issue#), A764
Chen, A. B.,Li, L.,Cronin, A. M.,Brooks, G. A.,Kavanagh, B. D.,Schrag, D. (2017). Estimating Costs of Care Attributable to Cancer: Does the Choice of Comparison Group Matter? Health Services Research., #volume#(#issue#), #Pages#
Cherny, N. I.,Sullivan, R.,Torode, J.,Saar, M.,Eniu, A. (2016). ESMO European Consortium Study on the availability, out-of-pocket costs and accessibility of antineoplastic medicines in Europe Annals of Oncology, 27(8), 1423-1443
Chien, C. R.,Shih, Y. C. T. (2012). Cost-effectiveness analysis of gefitinib for lung cancer: A population based study Value in Health, 15 (7)(#issue#), A657
Chouaid, C.,Le Caer, H.,Corre, R.,Crequit, J.,Locher, C.,Falchero, L.,Dujon, C.,Berard, H.,Monnet, I.,Vergnenegre, A. (2013). Cost analysis of erlotinib versus chemotherapy for first-line treatment of non-small-cell lung cancer in frail elderly patients participating in a prospective phase 2 study (GFPC 0505) Clin Lung Cancer, 14(2), 103-7
Christos, C,Herve, Lc,Chrystelle, L,Cecile, D,Pascal, T,Jean, Bernard A,Isabelle, M,Alain, V (2012). Cost effectivenes of erlotinib versus chemotherapy for first-line treatment of non small cell lung cancer (NSCLC) in fit elderly patients participating in a prospective phase 2 study (GFPC 0504) (Provisional abstract) BMC Cancer, 12:301(2), #Pages#
Chun, S. G.,Solberg, T. D.,Grosshans, D. R.,Nguyen, Q. N.,Simone, C. B.,Mohan, R.,Liao, Z.,Hahn, S. M.,Herman, J. M.,Frank, S. J. (2017). The potential of heavy-ion therapy to improve outcomes for locally advanced non-small cell lung cancer Frontiers in Oncology, 7 (SEP) (no pagination)(201), #Pages#
Cobo, M.,De Castro, J.,Isla, D.,Oyaguez, I.,Lozano, V.,Castro-Gomez, A. (2012). Cost-effectiveness of erlotinib as first-line maintenance therapy for advanced non-small-cell lung carcinoma in patients egfr wt and stable disease after four cycles of chemotherapy Value in Health, 15 (7)(#issue#), A422-A423
Corral, J.,Espinas, J. A.,Cots, F.,Pareja, L.,Sola, J.,Font, R.,Borras, J. M. (2015). Estimation of lung cancer diagnosis and treatment costs based on a patient-level analysis in Catalonia (Spain) BMC health services research, 15(#issue#), 70
Crenshaw, N. (2016). Perspectives in Oncology Drug Pricing JAMA oncology, 2(3), 401 De Geer, A.,Eriksson, J.,Finnern, H. W. (2013). A cross-country review of data collected
on non-small cell lung cancer (NSCLC) patients in cancer registries, databases, retrospective and non-randomized prospective studies J Med Econ, 16(1), 134-49
Djulbegovic, B. (2015). Value-Based Cancer Care and the Excessive Cost of Drugs JAMA oncology, 1(9), 1301-1302
Dotinga, R. (2016). Biosimilars for cancer treatment on the U.S. horizon Drug Topics,
Level 1A City Tower
Manchester M1 4BT
United Kingdom
+44 (0)300 323 0140
83 www.nice.org.uk
160(8), #Pages# Eaton, K. D.,Jagels, B.,Martins, R. G. (2016). Value-based care in lung cancer
Oncologist, 21(8), 903-906 Eijgelshoven, I.,Verduyn, S. C.,Bhatti, T.,Bexelius, C.,Jansen, J. P. (2013). Cost-
effectiveness of first-line treatment of advanced metastatic non small cell lung cancer-A systematic review of economic models Value in Health, 16 (7)(#issue#), A414-A415
Ferguson, G. (2017). Comment on Canine scent detection for the diagnosis of lung cancer in a screening-like situation Journal of Breath Research, 11 (3) (no pagination)(038001), #Pages#
Foster, A. E.,Reeves, D. J. (2017). Inpatient antineoplastic medication administration and associated drug costs: Institution of a hospital policy limiting inpatient administration P and T, 42(6), 388-393
Ganguly, D. (2012). Lung cancer - diagnostic problems Journal, Indian Academy of Clinical Medicine, 13(2), 127-130
Gao, T.,Chen, B.,Guan, H.,Liu, G. G. (2017). Cost analysis of lung cancer in China Value in Health, 20 (9)(#issue#), A432
Garrison, G. W. (2016). Lung cancer screening Cancer Cytopathology, 124(8), 533-534 Giuliani, J.,Bonetti, A. (2016). The Pharmacological Costs for the Management of Skin
Toxicity in Patients With Cancer Treated With Epidermal Growth Factor Receptor-Inhibitors Clin Lung Cancer, 17(6), 471-473
Godard, C.,Chouaid, C.,Angevin, E.,Loirat, D.,Ravonimbola, H.,Clay, E.,Millier, A. (2016). Costs of adverse events associated with cancer therapies in non-small cell lung cancer in France Value in Health, 19 (7)(#issue#), A743
Goeree, R.,Villeneuve, J.,Goeree, J.,Penrod, J. R.,Orsini, L.,Tahami Monfared, A. A. (2016). Economic evaluation of nivolumab for the treatment of second-line advanced squamous NSCLC in Canada: A comparison of modeling approaches to estimate and extrapolate survival outcomes Journal of Medical Economics, 19(6), 630-644
Goldstein, D. A.,Howard, D. H.,Flowers, C. R. (2016). Perspectives in Oncology Drug Pricing-Reply JAMA oncology, 2(3), 402-403
Guerin, A.,Sasane, M.,Dea, K.,Zhang, J.,Culver, K.,Nitulescu, R.,Wu, E. Q.,MacAlalad, A. R. (2016). The economic burden of brain metastasis among lung cancer patients in the United States Journal of Medical Economics, 19(5), 526-536
Guha, M. (2014). Novartis' lung cancer ALK inhibitor approved Nature biotechnology, 32(7), 607
Gyawali, B.,Prasad, V. (2017). Combining drugs and extending treatment-a PFS end point is not sufficient Nature Reviews Clinical Oncology, 14(9), 521-522
Haitsma, G.,Patel, H.,Parthasarathi, G.,Postma, M. J. (2016). Access to anti-cancer drugs in India: Is there a need to revise reimbursement policies? Value in Health, 19 (7)(#issue#), A893
Handorf, E. A.,McElligott, S.,Vachani, A.,Langer, C. J.,Bristol Demeter, M.,Armstrong, K.,Asch, D. A. (2012). Cost effectiveness of personalized therapy for first-line treatment of stage IV and recurrent incurable adenocarcinoma of the lung J Oncol Pract, 8(5), 267-74
Hecht, H. S.,Henschke, C.,Yankelevitz, D.,Fuster, V.,Narula, J. (2014). Combined detection of coronary artery disease and lung cancer European Heart Journal, 35(40), 2792-2796

Level 1A City Tower
Manchester M1 4BT
United Kingdom
+44 (0)300 323 0140
84 www.nice.org.uk
Hess, L. M.,Cinfio, F. N.,Wetmore, S.,Churchill, C.,Fausel, C.,Ale-Ali, A.,Gelwicks, S.,Bly, C. A.,Perk, S.,Klein, R. W. (2016). Enhancing the budget impact model for institutional use: A tool with practical applications for the hospital oncology pharmacy Hospital Pharmacy, 51(6), 452-460
Hess, L. M.,Cui, Z. L.,Li, X. I.,Oton, A. B.,Shortenhaus, S.,Watson, I. A. (2018). Drug wastage and costs to the healthcare system in the care of patients with non-small cell lung cancer in the United States Journal of Medical Economics, #volume#(#issue#), 1-7
Hirsch, F. R. (2017). Programmed death ligand 1 testing: Is there one best test? Clinical Advances in Hematology and Oncology, 15(6), 438-440
Howard, D. H.,Grabowski, D.,Abdelgawad, T.,Chernew, M.,Sollano, J.,Smith, G. (2016). The value of new anticancer drugs Value in Health, 19 (3)(#issue#), A150-A151
Huang, H. Y.,Shi, J. F.,Guo, L. W.,Zhu, X. Y.,Wang, L.,Liao, X. Z.,Liu, G. X.,Bai, Y. N.,Mao, A. Y.,Ren, J. S.,Sun, X. J.,Zhang, K.,He, J.,Dai, M. (2016). Expenditure and financial burden for common cancers in China: A hospital-based multicentre cross-sectional study The Lancet, 388 (SPEC.ISS 1)(#issue#), 10
Kagan, A. R.,Schulz, R. J. (2015). Treatment Modalities Should Be Based Upon Efficacy and Cost: Early Stage NSCLC, a Case in Point Int J Radiat Oncol Biol Phys, 93(1), 205-6
Karve, S. J.,Price, G. L.,Davis, K. L.,Pohl, G. M.,Smyth, E. N.,Bowman, L. (2014). Comparison of demographics, treatment patterns, health care utilization, and costs among elderly patients with extensive-stage small cell and metastatic non-small cell lung cancers BMC health services research, 14(#issue#), 555
Karweit, J.,Kotapati, S.,Wagner, S.,Shaw, J. W.,Wolfe, S. W.,Abernethy, A. P. (2017). An expanded portfolio of survival metrics for assessing anticancer agents Am J Manag Care, 23(1), 54-61
Kaur, S.,Mehta, D.,Kumar, A.,Kumar, M.,Maroules, M. (2016). Health care utilization and burden of lung cancer over the last decade: A nationwide analysis Journal of Thoracic Oncology, 1)(#issue#), S73
Kennedy, M. P. T.,Hall, P. S.,Callister, M. E. J. (2016). Healthcare costs associated with lung cancer diagnosed at emergency hospitalisation Lung Cancer, 91 (Supplement 1)(#issue#), S38-S39
Khan, I.,Baio, G.,Ahmed, S. (2013). A mixed treatment comparison of Erlotinib vs. placebo and Erlotinib vs. geftinib using bayesian approaches Trials, 1)(#issue#), 247DUMMY
Khan, I.,Morris, S.,Hackshaw, A.,Lee, S. M. (2015). Cost-effectiveness of first-line erlotinib in patients with advanced non-small-cell lung cancer unsuitable for chemotherapy BMJ Open, 5(7), e006733
Kim, J. W. (2015). Genomics and molecular biology: Is personal medicine cost-effective? Journal of Obstetrics and Gynaecology Research, 1)(#issue#), 91
Kish, J.,Feinberg, B. (2017). Rates of uptake of novel agents in cancer (Prostate, melanoma, and lung): Considerations for forecasting in economic evaluations Value in Health, 20 (9)(#issue#), A462
Knust, R. E.,Portela, M. C.,Pereira, C. C. A.,Fortes, G. B. (2017). Estimated costs of advanced lung cancer care in a public reference hospital Revista de saude publica, 51(#issue#), 53
Kumar, G.,Woods, B.,Hess, L. M.,Treat, J.,Boye, M. E.,Bryden, P.,Winfree, K. B. (2015). Cost-effectiveness of first-line induction and maintenance treatment sequences in non-

Level 1A City Tower
Manchester M1 4BT
United Kingdom
+44 (0)300 323 0140
85 www.nice.org.uk
squamous non-small cell lung cancer (NSCLC) in the U.S Lung Cancer, 89(3), 294-300 Kumar, G.,Woods, B.,Winfree, K. B.,Boye, M. E.,Hess, L. M.,Bryden, P. A.,Koustenis,
A.,Treat, J. (2014). A cost-effectiveness analysis of first line induction and maintenance treatment sequences in non-squamous non-small cell lung cancer (NSCLC) in the United States Value in Health, 17 (3)(#issue#), A82
Lam, M.,Burke, L. G.,Zheng, J.,Jha, A. (2017). Spending among cancer patients between aco and non-aco participants International Journal of Radiation Oncology Biology Physics, 99 (2 Supplement 1)(#issue#), S38
Lieberthal, Rd,Dudash, K,Axelrod, R,Goldfarb, Ni (2013). An economic model to value companion diagnostics in non-small-cell lung cancer (Provisional abstract) Personalized Medicine, 10(2), 139-147
Ma, F.,Cheng, X.,Aballea, S.,Toumi, M. (2016). Current trends in methods of pharmacoeconomic studies of cancer therapies in china Value in Health, 19 (7)(#issue#), A887
Macaulay, R.,Farrimond, B.,Ahuja, A.,Ademisoye, E.,Shaw, J.,Orsini, L. (2016). Relative value assessment: Characterizing the benefit of oncology therapies through diverse metrics Value in Health, 19 (3)(#issue#), A156
MacLean, E.,Louder, A.,Saverno, K.,Smith, G.,Mardekian, J.,Bruins, C.,Ward, M.,Sweetman, R.,Pasquale, M. (2016). Molecular Testing Patterns in Metastatic Nona "Small Cell Lung Cancer American Journal of Managed Care, 22(2), #Pages#
Mailankody, S.,Prasad, V. (2016). Implications of proposed medicare reforms to counteract high cancer drug prices JAMA - Journal of the American Medical Association, 316(3), 271-272
Mao, W.,Chen, W. (2016). Economic burden of gefitinib versus pemetrexed for insured patients with lung cancer in urban xinjiang province, china: A real world research Value in Health, 19 (7)(#issue#), A887
Mao, W.,Chen, W. (2016). Economic burden of the patients with lung cancer in xinjiang province, China: A real-world research Value in Health, 19 (3)(#issue#), A166
Marrone, K. A.,Brahmer, J. R. (2016). Using immune checkpoint inhibitors in lung cancer Oncology, 30(8), #Pages#
Migliorino, M. R.,Santo, A.,Romano, G.,Cortinovis, D.,Galetta, D.,Alabiso, O.,Carteni, G.,Vari, S.,Fasola, G.,Pazzola, A.,Giuffrida, D.,Zaniboni, A.,Caprioli, A.,Longo, F.,Acciai, V.,de Marinis, F. (2017). Economic burden of patients affected by non-small cell lung cancer (NSCLC): the LIFE study Journal of Cancer Research and Clinical Oncology, 143(5), 783-791
Miller, I. D. (2016). The evolution of high complexity companion testing for targeted and immuno-oncology Personalized Medicine, 13(5), 409-414
Mukherjee, S. C.,Latimer, N.,Richards, P.,Nixon, R. M.,Hall, P. S. (2015). Better reimbursement decision-making based on expected cost-effectiveness: Using value of information decision analysis to improve the design and efficacy of a phase III program for erlotinib Value in Health, 18 (7)(#issue#), A700
Mullard, A. (2017). 2016 FDA drug approvals Nature Reviews Drug Discovery, 16(2), 73-76
Newton, J. C.,Johnson, C. E.,Hohnen, H.,Bulsara, M.,Ives, A.,McKiernan, S.,Platt, V.,McConigley, R.,Slavova-Azmanova, N. S.,Saunders, C. (2018). Out-of-pocket expenses experienced by rural Western Australians diagnosed with cancer Supportive Care in Cancer, #volume#(#issue#), 1-10

Level 1A City Tower
Manchester M1 4BT
United Kingdom
+44 (0)300 323 0140
86 www.nice.org.uk
Nguyen, T. T.,Grappasonni, I.,Nguyen, T. B.,Petrelli, F. (2017). A systematic review of pharmacoeconomic evaluation of erlotinib in the first-line treatment of advanced non-small cell lung cancer Value in Health, 20 (9)(#issue#), A438
Nishikawa, A. M.,Castro, A. P.,Alves, A. F.,Medina, P.,Clark, L. G. (2015). Treatment patterns and budgetary impact of chemotherapy drugs in a Brazilian private health plan (PHP) Value in Health, 18 (7)(#issue#), A808-A809
Nuijten, M. J. C.,de Castro Carpeno, J.,Chouaid, C.,Vergnenegre, A.,Grossi, F.,Bischoff, H.,Heigener, D.,Walzer, S. (2012). A cross-market cost comparison of erlotinib versus pemetrexed for first-line maintenance treatment of patients with locally advanced or metastatic non-small-cell lung cancer Lung Cancer, 76(3), 465-471
Park, J. (2018). A letter to the editor referencing "Objective and subjective financial burden and its associations with health-related quality of life among lung cancer patients" Supportive Care in Cancer, #volume#(#issue#), 1-2
Patel, K.,Montouchet, C.,Cheynel, J.,Ruff, L. (2014). A cost-effectiveness analysis of EGFR-TK mutation status-guided 1st-and 2nd-line treatment of stage III/IV non-small cell lung cancer in the UK Value in Health, 17 (7)(#issue#), A635-A636
Printz, C. (2015). Analysis shows CT lung cancer screening is cost effective Cancer, 121(7), 971
Printz, C. (2015). Lung cancer alliance praises CMS decision to cover lung cancer screenings Cancer, 121(8), 1157
Printz, C. (2014). Researchers study implications of lung cancer screening Cancer, 120(19), 2940-2941
Radtchenko, J.,Korytowsky, B.,Bhor, M.,Tuell, K.,Feinberg, B. (2016). Total cost of care in real-world patients with advanced non-small cell lung cancer treated with antineoplastic therapy Value in Health, 19 (3)(#issue#), A13
Radtchenko, J.,Korytowsky, B.,Tuell, K.,Bhor, M.,Feinberg, B. (2016). Cost of care in first line advanced NSCLC patients: Chemotherapy vs targeted therapy Annals of Oncology. Conference: 41st European Society for Medical Oncology Congress, ESMO, 27(Supplement 6), #Pages#
Ridge, C. A.,Boiselle, P. M. (2016). Optimizing the lung cancer screening interval: The world is waiting Journal of Thoracic Disease, 8(10), E1369-E1370
Sanz-Granda, A.,Hidalgo, A.,del Llano, J. E.,Rovira, J. (2013). Analysis of economic evaluations of pharmacological cancer treatments in Spain between 1990 and 2010 Clin Transl Oncol, 15(1), 9-19
Schmidt, C. (2015). Lung cancer screening poised to expand Journal of the National Cancer Institute, 107(4), #Pages#
Shah, S.,Blanchette, C. M.,Coyle, J. C.,Kowalkowski, M.,Arthur, S. T.,Howden, R. (2018). Healthcare utilization and costs associated with COPD among SEER-Medicare beneficiaries with NSCLC Journal of Medical Economics, #volume#(#issue#), 1-8
Shapiro, S. D. (2017). Refining Lung Cancer Screening Criteria in the Era of Value-Based Medicine PLoS Medicine, 14 (2) (no pagination)(e1002226), #Pages#
Shiroiwa, T.,Miyoshi, Y.,Tsutani, K. (2012). Cost-effectiveness analysis of egfr testing and gefitinib for nonsmall-cell lung cancer (NSCLC) in Japan Value in Health, 15 (4)(#issue#), A67
Shyr, Y.,Horn, L.,Berry, L. (2015). Are We Making Progress in Lung Cancer Using Progression-Free Survival as a Surrogate End Point? JAMA oncology, 1(2), 202-203

Level 1A City Tower
Manchester M1 4BT
United Kingdom
+44 (0)300 323 0140
87 www.nice.org.uk
Smith, N.,Meletiche, D.,Beckerman, R. (2017). Impact of time to reimbursement of drug treatments for non-small cell lung on patient outcomes in Europe and Latin America Value in Health, 20 (9)(#issue#), A468
Soares, M.,Bento, M. J.,Rocha-Goncalves, F. N.,Sousa, J.,Rigor, H. (2016). Landscape of advanced NSCLC: The impact of upcoming therapies Value in Health, 19 (7)(#issue#), A755
Stevenson, J. P.,Kalaycio, M.,Bolwell, B. (2016). Perspectives in Oncology Drug Pricing JAMA oncology, 2(3), 402
Taipale, K.,Winfree, K. B.,Boye, M.,Basson, M.,Sleilaty, G.,Eaton, J.,Evans, R.,Chouaid, C. (2017). A cost-effectiveness analysis of first-line induction and maintenance treatment sequences in patients with advanced nonsquamous non-small-cell lung cancer in France ClinicoEconomics and Outcomes Research, 9(#issue#), 505-518
Ten Haaf, K.,de Koning, H. J. (2015). Overdiagnosis in lung cancer screening: why modelling is essential Journal of epidemiology and community health, 69(11), 1035-1039
Thongprasert, S.,Crawford, B.,Sakulbumrungsil, R.,Chaiyakunapruk, N.,Petcharapiruch, S.,Leartsakulpanitch, J.,Permsuwan, U. (2015). Willingness to pay for lung cancer treatment: Patient versus general public values International Journal of Technology Assessment in Health Care, 31(4), 264-270
Trudeau, M.,Hoskins, P.,Reiman, T.,Chambers, A.,Mai, H.,Wheatley-Price, P. (2017). Clinician participation in CADTH's pan-canadian oncology drug review: Contribution and impact on cancer drug funding recommendations Current Oncology, 24(2), 71-74
Van Nimwegen, K.,Nientker, K.,Boukouvalas, S. (2017). Health loss due to market access delays and reimbursement restrictions in first-line EGFR-positive non-small cell lung cancer in the eu5 countries Value in Health, 20 (9)(#issue#), A465
Voong, K. R.,Liang, S.,Dugan, P.,Torto, D.,Padula, W. V.,Senter, J.,Lang, M.,Hooker, C.,Khanna, K.,Feliciano, J.,Broderick, S.,Hales, R. K. (2017). Reducing unnecessary healthcare expenditure: Thoracic oncology multidisciplinary clinic reduces resources used in the diagnosis and staging of patients with non-small cell lung cancer International Journal of Radiation Oncology Biology Physics, 99 (2 Supplement 1)(#issue#), S9-S10
Walleser, S.,Ray, J.,Bischoff, H.,Vergnenegre, A.,Rosery, H.,Chouaid, C.,Heigener, D.,Carpeno, J. C.,Tiseo, M.,Walzer, S. (2012). Maintenance erlotinib in advanced nonsmall cell lung cancer: Cost-effectiveness in EGFR wild-type across Europe ClinicoEconomics and Outcomes Research, 4(1), 269-275
Walter, J.,Tufman, A.,Holle, R.,Schwarzkopf, L. (2017). Comparison of costs and care of lung cancer patient at the end-of-life in germany depending on the time of survival after diagnosis Value in Health, 20 (9)(#issue#), A511
Wood, R.,Taylor-Stokes, G.,Lees, M.,Chirita, O. (2017). Cost burden associated with advanced non-small cell lung cancer (A-NSCLC): Impact of disease stage Value in Health, 20 (9)(#issue#), A427
Woodhams, R.,Evans, J.,Edwards, J.,Metcalfe, S.,Murray, P.,Arnold, J.,Wyeth, J. (2017). Real world outcomes from funded cancer medicines in New Zealand (nz) compared with published clinical trials Clinical Therapeutics, 39 (8 Supplement 1)(#issue#), e45-e46
Xie, L.,Vaidya, N.,Xin, K.,Keshishian, A.,Yuce, H.,Ozenbas, D.,Baser, O. (2016). Evaluating the economic burden and health care utilization of lung cancer in the US

Level 1A City Tower
Manchester M1 4BT
United Kingdom
+44 (0)300 323 0140
88 www.nice.org.uk
medicare population Value in Health, 19 (7)(#issue#), A726 Yong, W. C.,Wee, B. B. K.,Lang, S. P.,Tan, D. S. P. (2016). Insertion of tunnelled intra-
abdominal catheters for the management of malignant ascites in advanced/palliative cancers-a clinical practice improvement program, national university cancer institute, Singapore Journal of Pain and Symptom Management, 52 (6)(#issue#), e121
Zhang, X.,Liu, S.,Liu, Y.,Du, J.,Fu, W.,Huang, W.,Zhao, X.,Liu, G.,Mao, Z.,Hu, T. W. (2017). Economic burden for lung cancer survivors in urban China International Journal of Environmental Research and Public Health, 14 (3) (no pagination)(308), #Pages#
Zhou, J.,Ma, F.,Cheng, X.,Millier, A.,Aballea, S.,Toumi, M. (2016). Systematic literature review and assessment of the reporting quality of economic evaluation studies in non-small cell lung cancer in China Value in Health, 19 (7)(#issue#), A851
Zhou, Z.,Bensimon, A.,Cheng, J.,Dalal, A. (2017). Budget impact analysis of dabrafenib and trametinib combination therapy in the treatment of BRAF V600E-mutant advanced non-small cell lung cancer in the United States Value in Health, 20 (9)(#issue#), A422
Anonymous, (2015). Gefitinib Approved for EGFR-Mutated NSCLC Cancer discovery, 5(9), 896
Culig, J.,Leppee, M.,Skaron-Jakobovic, N. (2012). A pharmacoeconomic analysis of the implementation of gefitinib in the treatment of metastasized non-small cell lung cancer (NSCLC) with proven EGFR-TK mutations Value in Health, 15 (7)(#issue#), A415
Huicochea-Bartelt, J. L.,Palacios, E.,Burbano, X.,Valencia, C.,Herran, S. (2015). Cost distribution analysis related to the use of tyrisine-kinase inhibitors (TKI) and the combination of pemetrexed/cisplatin in the treatment of non-small cell lung cancer (NSCLC) locally advanced or metastatic in presence of epidermal growth factor receptor (EGFR) mutations in a Mexican institutional context Value in Health, 18 (7)(#issue#), A819
Stewart, E. L.,Labbe, C.,Brown, C.,Perez-Cosio, A.,Vennettilli, A.,Patel, D.,Cheng, N.,Liang, M.,Gill, G.,Leung, Y.,Mittmann, N.,Naik, H.,Liu, G. (2015). Patient-reported health utility scores (HUS) in non-small cell lung cancer (NSCLC) patients with epidermal growth factor receptor (EGFR) mutations by drug therapy Pharmacoepidemiology and Drug Safety, 1)(#issue#), 52
Vergnenegre, A,Ray, Ja,Chouaid, C,Grossi, F,Bischoff, Hg,Heigener, Df,Walzer, S (2012). Cross-market cost-effectiveness analysis of erlotinib as first-line maintenance treatment for patients with stable non-small cell lung cancer (Structured abstract) ClinicoEconomics and Outcomes Research, 4(2), 31-37
Villa, S.,Brioschi, E.,Ravasio, R. (2016). Analysis of the costs associated with the management of adverse events compared through TKIs in the treatment of patients with non-small cells lung cancer EGFR mutated Value in Health, 19 (7)(#issue#), A723-A724
ReasonforExclusion:Interventionnotofinterest
Arrieta, O.,Anaya, P.,Morales-Oyarvide, V.,Ramirez-Tirado, L. A.,Polanco, A. C. (2016). Cost-effectiveness analysis of EGFR mutation testing in patients with non-small cell lung cancer (NSCLC) with gefitinib or carboplatin-paclitaxel Eur J Health Econ, 17(7), 855-63
Lim, E. A.,Lee, H.,Bae, E.,Lim, J.,Shin, Y. K.,Choi, S. E. (2016). Economic evaluation of companion diagnostic testing for EGFR mutations and first-line targeted therapy in advanced non-small cell lung cancer patients in South Korea PLoS ONE, 11 (8) (no pagination)(e0160155), #Pages#
Level 1A City Tower
Manchester M1 4BT
United Kingdom
+44 (0)300 323 0140
89 www.nice.org.uk
Lim, E. A.,Lee, H.,Bae, E.,Lim, J.,Shin, Y. K.,Choi, S. E. (2016). Economic Evaluation of Companion Diagnostic Testing for EGFR Mutations and First-Line Targeted Therapy in Advanced Non-Small Cell Lung Cancer Patients in South Korea PLoS One, 11(8), e0160155
Narita, Y.,Matsushima, Y.,Shiroiwa, T.,Chiba, K.,Nakanishi, Y.,Kurokawa, T.,Urushihara, H. (2015). Cost-effectiveness analysis of EGFR mutation testing and gefitinib as first-line therapy for non-small cell lung cancer Lung Cancer, 90(1), 71-7
Schremser, K.,Rogowski, W. H.,Adler-Reichel, S.,Tufman, A. L. H.,Huber, R. M.,Stollenwerk, B. (2015). Cost-Effectiveness of an Individualized First-Line Treatment Strategy Offering Erlotinib Based on EGFR Mutation Testing in Advanced Lung Adenocarcinoma Patients in Germany PharmacoEconomics, 33(11), 1215-1228
Schremser, K.,Rogowski, W. H.,Adler-Reichel, S.,Tufman, A. L.,Huber, R. M.,Stollenwerk, B. (2015). Cost-Effectiveness of an Individualized First-Line Treatment Strategy Offering Erlotinib Based on EGFR Mutation Testing in Advanced Lung Adenocarcinoma Patients in Germany Pharmacoeconomics, 33(11), 1215-28
Sharma, J.,Shum, E.,Chau, V.,Paucar, D.,Cheng, H.,Halmos, B. (2016). The Evolving Role of Biomarkers in Personalized Lung Cancer Therapy Respiration, 93(1), 1-14
Yu, T. M.,Morrison, C.,Gold, E. J.,Tradonsky, A.,Arnold, R. J. G. (2018). Budget Impact of Next-Generation Sequencing for Molecular Assessment of Advanced Non-Small Cell Lung Cancer Value in Health., #volume#(#issue#), #Pages#
Zhang, L. (2017). Lung cancer in China: Challenges and perspectives Journal of Thoracic Oncology, 12 (1 Supplement 1)(#issue#), S113-S114
Zhang, T.,Cai, S.,Wu, C.,Xu, J.,Lin, T.,Jiang, J. (2016). Comparison of cost-effectiveness between EGFR-TKIs therapy and chemotherapy for advanced NSCLC Value in Health, 19 (7)(#issue#), A887
ReasonforExclusion:Outcomenotofinterest
Anonymous, (2015). Afatinib (Gilotrif) for advanced non-small cell lung cancer The Medical letter on drugs and therapeutics, 57(1469), e82-e83
Chang, J.,Wang, C.,Lin, F. (2017). Changes in treatment patterns of tyrosine kinase inhibitors among non-small cell lung cancer patients under the national health insurance in Taiwan Value in Health, 20 (9)(#issue#), A463-A464
Giuliani, J.,Bonetti, A. (2016). TKIs in first-line for advanced NSCLC with activating EGFR-mutations: The european society for medical oncology magnitude of clinical benefit scale (ESMO-MCBS) applied to pivotal phase III randomized controlled trials Annals of Oncology. Conference: 41st European Society for Medical Oncology Congress, ESMO, 27(Supplement 6), #Pages#
Giuliani, J.,Remo, A.,Bonetti, A. (2017). The European Society for Medical Oncology Magnitude of Clinical Benefit Scale (ESMO-MCBS) applied to pivotal phase III randomized-controlled trials of tyrosine kinase inhibitors in first-line for advanced non-small cell lung cancer with activating epidermal growth factor receptor mutations Expert Review of Pharmacoeconomics and Outcomes Research, 17(1), 5-8
ReasonforExclusion:Studydesignnotofinterest
Aguiar, P.,Roitberg, F.,Tadokoro, H.,De Mello, R. A.,Del Giglio, A.,Lopes, G. (2017). How many years of life have we lost in Brazil due to the lack of access to anti-EGFR tkis

Level 1A City Tower
Manchester M1 4BT
United Kingdom
+44 (0)300 323 0140
90 www.nice.org.uk
in the national public health system? Journal of Thoracic Oncology, 12 (11 Supplement 2)(#issue#), S2129
Albaba, H.,Lim, C.,Leighl, N. B. (2017). Economic Considerations in the Use of Novel Targeted Therapies for Lung Cancer: Review of Current Literature Pharmacoeconomics, 35(12), 1195-1209
Bajaj, P. S.,Carlson, J. J.,Goertz, H. P.,Veenstra, D. L. (2013). Egfr test-guided erlotinib versus chemotherapy for first-line treatment of advanced non-small cell lung cancer: A budget impact analysis Value in Health, 16 (3)(#issue#), A131
Bajaj, P. S.,Veenstra, D. L.,Goertz, H. P.,Carlson, J. J. (2014). Targeted erlotinib for first-line treatment of advanced non-small cell lung cancer: a budget impact analysis J Med Econ, 17(8), 538-46
Brown, T.,Pilkington, G.,Bagust, A.,Boland, A.,Oyee, J.,Tudur-Smith, C.,Blundell, M.,Lai, M.,Martin Saborido, C.,Greenhalgh, J.,Dundar, Y.,Dickson, R. (2013). Clinical effectiveness and cost-effectiveness of first-line chemotherapy for adult patients with locally advanced or metastatic non-small cell lung cancer: a systematic review and economic evaluation Health Technol Assess, 17(31), 1-278
Cressman, S.,Browman, G. P.,Hoch, J. S.,Kovacic, L.,Peacock, S. J. (2015). A Time-Trend Economic Analysis of Cancer Drug Trials Oncologist, 20(7), 729-36
Dillon, B.,Naidoo, B.,Knight, H.,Clark, P. (2012). NICE guidance on erlotinib for first-line treatment of EGFR-TK mutation-positive advanced or metastatic non-small-cell lung cancer Lancet Oncol, 13(8), 764-5
Fernandes, A. W.,Wu, B.,Turner, R. M. (2017). Brain metastases in non-small cell lung cancer patients on epidermal growth factor receptor tyrosine kinase inhibitors: symptom and economic burden J Med Econ, 20(11), 1136-1147
Giuliani, J.,Bonetti, A. (2016). Pharmacologic Costs of Tyrosine Kinase Inhibitors in First-Line Therapy for Advanced Non-Small-Cell Lung Cancer With Activating Epidermal Growth Factor Receptor Mutations: A Review of Pivotal Phase III Randomized Controlled Trials Clin Lung Cancer, 17(2), 91-4
Hsu, J. C.,Wei, C. F.,Lu, C. Y. (2016). Impacts of reimbursement policy for targeted therapies utilization for lung cancer treatment in Taiwan Pharmacoepidemiology and Drug Safety, 25 (Supplement 3)(#issue#), 342-343
Hu, C.,Huang, L.,Zhao, D.,Xu, L. (2015). Systematic review of cost effectiveness of gefitinib in the treatment of non-small cell lung cancer in china Value in Health, 18 (7)(#issue#), A459
Isla, D.,De Castro, J.,Juan Vidal, O.,Grau, S.,Orofino, J.,Gordo, R.,Rubio-Terres, C.,Rubio-Rodriguez, D. (2015). Adverse events costs associated with erlotinib or afatinib in non-small cell lung cancer (NSCLC) patients with EGFR mutation-positive tumours Value in Health, 18 (7)(#issue#), A429
Isla, D.,De Castro, J.,Juan, O.,Grau, S.,Orofino, J.,Gordo, R.,Rubio-Terres, C.,Rubio-Rodriguez, D. (2017). Costs of adverse events associated with erlotinib or afatinib in first-line treatment of advanced EGFR-positive non-small cell lung cancer ClinicoEconomics and Outcomes Research, 9(#issue#), 31-38
Kamaruzaman, H. F.,Ku Abd Rahim, K. N.,Lee, S. W.,Mohd Darus, N.,Sabirin, J. (2016). A systematic review of tyrosine kinase inhibitors as first line treatment for advanced non small cell lung cancer Value in Health, 19 (7)(#issue#), A885
Lange, A.,Prenzler, A.,Frank, M.,Golpon, H.,Welte, T.,von der Schulenburg, J. M. (2014). A systematic review of the cost-effectiveness of targeted therapies for metastatic

Level 1A City Tower
Manchester M1 4BT
United Kingdom
+44 (0)300 323 0140
91 www.nice.org.uk
non-small cell lung cancer (NSCLC) BMC Pulmonary Medicine, 14 (1) (no pagination)(192), #Pages#
Simon, S.,Clopes, A.,Gasol-Boncompte, M.,Cajal, R.,Segu, J. L.,Crespo, R.,Mora-Ripoll, R.,Cordero, L.,Calle, C.,Gilabert-Perramon, A.,Germa, J. R. (2015). Evaluation of a payment by results scheme in a Catalan cancer center: Gefinitib in EGFR mutation-positive advanced non-small cell lung cancer Value in Health, 18 (7)(#issue#), A492
Tran, T. T.,Nguyen, T. (2016). Budget impact analysis of erlotib as the first-line therapy of advanced EGFR mutation-positive non-small cell lung cancer in Vietnam Value in Health, 19 (3)(#issue#), A142-A143
Yeung, K.,Carlson, J. J. (2012). Clinical and economic review of erlotinib in non-small-cell lung cancer Expert Rev Pharmacoecon Outcomes Res, 12(4), 411-23
ReasonforExclusion:Publishedoutsideofdatelimits
de Lima Lopes, G., Jr.,Segel, J. E.,Tan, D. S.,Do, Y. K.,Mok, T.,Finkelstein, E. A. (2012). Cost-effectiveness of epidermal growth factor receptor mutation testing and first-line treatment with gefitinib for patients with advanced adenocarcinoma of the lung Cancer, 118(4), 1032-9

Company evidence submission for dacomitinib for untreated EGFR-positive non-small-cell lung cancer (ID1346)
© Pfizer (2018). All rights reserved Page 1 of 2
Clarification question B9ii
B9. A table (‘Adverse Events’ worksheet; cells ‘E7:J14’) in the company’s economic
model reports the frequency of Adverse Events (AEs) by treatment. Please:
ii) provide a full list of incidences (first, second, and subsequent) of grade 3-5
AEs, by treatment.
Following on from the response to clarification question B9ii, the company have
completed the additional analysis. Please see the full list of incidences for grade 3-5
treatment-related AEs occurring at a frequency of >2% in either treatment arm in the
PDF attached with this response (Table 14.3.1.4.1.8 CONFIDENTIAL.pdf). As
previously discussed, the company have not provided a full list of grade 3-5 event
incidences because of complexities in how this is defined appropriately given the
potential for the short term change in the grade of an AE, however an examination
on a cycle-by-cycle level allows insight into the recurrence of AEs.
For all AEs included in this additional analysis, the incidences were similar to the
number of patients experiencing the events, demonstrating that there was a low rate
of reoccurrence. This was expected given the ability to dose reduce and appropriate
management of the conditions.
XXXXXXXXXXXXXXXXXXXXXXXXXXXXXXXXXXXXXXXXXXXXXXXXXXXXXXXX
XXXXXXXXXXXXXXXXXXXXXXXXXXXXXXXXXXXXXXXXXXXXXXXXXXXXXXXX
XXXXXXXXXXXXXXXXXXXXXXXXXXXXXXXXXXXXXXXXXXXXXXXXXXXXXXXX
XXXXXXXXXXXXXXXXXXXXXXXXXXXXXXXXXXXXXXXXXXXXXXXXXXXXXXXX
XXXXXXXXXXXXXXXXXXXXXXXXXXXXXXXXXXXXXXXXXXXXXXXXXXXXXXXX
XXXXXXXXXXXXXXXXXXXXXXXXXXXXXXXXXXXXXXXXXXXXXXXXXXXXXXXX
XXXXXXXXXXXXXXXXXX

Company evidence submission for dacomitinib for untreated EGFR-positive non-small-cell lung cancer (ID1346)
© Pfizer (2018). All rights reserved Page 2 of 2
LUX-Lung 7 PFS data updated CE model In response to the more recent data-cut for Progression Free Survival (PFS) in the
comparator trial LUX-Lung 7 that Pfizer identified, please see the model attached
with the updated fractional polynomial (FP) analysis
(ID1346_Dacomitinib_EGFR_NSCLC_CEmodel_04FEB19(ACiC).xlsb). The
following updates have been applied to the most recent CE model previously
provided in responses to clarification question on 23 January 2019:
FP NMA HR Y7:Y13 – named range updated
FP NMA HR rows 121 to 161 – PFS FP model parameters updated
The base-case PFS model (second-order P1=0.5, P2=1.5) remained in the DIC+5
criterion (CS Document B.2.9.3.2 page 68) and provided the most plausible fit of the
models. An update to CS Document B Table 19 page 68-69 is provided below.
Table 19. Goodness-of-fit estimates for fractional polynomial models of different powers p1 and p2 – PFS (IRC)
Power P1 Power P2 Dbar Dhat pD DIC 1 1.5 1234.62 1223.22 11.40 1246.02 1 1 1235.36 1223.60 11.75 1247.11
1.5 1.5 1236.49 1225.18 11.31 1247.81 0.5 1.5 1236.73 1224.81 11.92 1248.65 1 2 1237.37 1225.60 11.77 1249.15
Abbreviations: DIC = Deviance information criterion.
As discussed in CS Document B page 70 the second-order P1=0.5, P2=1 was
included in sensitivity analysis, but in the updated FP analysis it did not meet the
DIC+5 criterion. However, it was included in the updated model to allow this scenario
to be explored as it still provided a plausible fit.
The updated csv data file for FP PFS analysis is also attached
(Data_RBase_NMA_PFS_updated.csv).

Patient organisation submission Pembrolizumab with carboplatin and paclitaxel or nab-paclitaxel for untreated metastatic squamous non-small-cell lung cancer [ID1306] 1 of 7
Patient organisation submission – Roy Castle Lung Cancer Foundation
Dacomitinib for untreated, EGFR positive non-small-cell lung cancer [ID1346]
Thank you for agreeing to give us your organisation’s views on this technology and its possible use in the NHS.
You can provide a unique perspective on conditions and their treatment that is not typically available from other sources.
To help you give your views, please use this questionnaire with our guide for patient submissions.
You do not have to answer every question – they are prompts to guide you. The text boxes will expand as you type.
Information on completing this submission
Please do not embed documents (such as a PDF) in a submission because this may lead to the information being mislaid or make the submission unreadable
We are committed to meeting the requirements of copyright legislation. If you intend to include journal articles in your submission you must have copyright clearance for these articles. We can accept journal articles in NICE Docs.
Your response should not be longer than 10 pages.
About you
1.Your name xxxxxx

Patient organisation submission Pembrolizumab with carboplatin and paclitaxel or nab-paclitaxel for untreated metastatic squamous non-small-cell lung cancer [ID1306] 2 of 7
2. Name of organisation ROY CASTLE LUNG CANCER FOUNDATION
3. Job title or position xxxxxxxxx
4a. Brief description of the
organisation (including who
funds it). How many members
does it have?
Roy Castle Lung Cancer Foundation is a UK wide lung cancer charity. We fund lung cancer research, tobacco control initiatives and work in lung cancer patient care (information, support and advocacy activity). Our funding base is a broad mixture including community, retail, corporate, legacies and charitable trusts. Clearly, our patient group members and contacts are a self-selected group, who have taken the step to seek out information or have accessed specialist support services. As most lung cancer sufferers tend to be older, from lower social class groups and with the five year survival being around 15%, less physically well, we acknowledge that our patients are perhaps not representative of the vast majority of lung cancer patients, who are not so well informed. It is, however, important that the opinions expressed to us, be passed on to NICE, as it considers the place of this product in the management of EGFR positive Non Small Cell Lung Cancer (NSCLC).
4b. Do you have any direct or
indirect links with, or funding
from, the tobacco industry?
None
5. How did you gather
information about the
experiences of patients and
The Foundation has contact with patients/carers through its UK wide network of over 55 monthly Lung Cancer Patient Support Groups, patient/carer panel, online forums and its Lung Cancer Information Helpline.

Patient organisation submission Pembrolizumab with carboplatin and paclitaxel or nab-paclitaxel for untreated metastatic squamous non-small-cell lung cancer [ID1306] 3 of 7
carers to include in your
submission?
Living with the condition
6. What is it like to live with the
condition? What do carers
experience when caring for
someone with the condition?
A diagnosis of advanced NSCLC is devastating. Recent years have seen the emergence of target therapies, for segmented populations, including EGFR. These have provided hope for patients, significantly extending survival, as compared with traditional chemotherapy. To date, however, it would appear that such therapies, although providing significant benefit to these patients, are not curative and the cancer progresses. As such, there is a need for improved treatment options. Characteristics of EGFR positive lung cancer is that patients tend to be younger, more are female and more are never smokers, than we see in NSCLC overall – as such, patients tend to present late, having more advanced disease at diagnosis. As with other NSCLC patients, this group of patients, on disease progression will have a poor outlook. with an obvious impact on family and carers. Symptoms such as breathlessness, cough and weight loss are difficult to treat, without active anti-cancer therapy. Furthermore, these are symptoms which can be distressing for loved ones to observe.
Current treatment of the condition in the NHS
7. What do patients or carers
think of current treatments and
care available on the NHS?
Target therapies (Gefitinib, Erlotinib and Afatinib) have brought obvious benefit to this patient group. However, these therapies are not ‘curative’ and patients progress, despite these treatments. As such, there is a need for therapies with better outcomes than currently available.

Patient organisation submission Pembrolizumab with carboplatin and paclitaxel or nab-paclitaxel for untreated metastatic squamous non-small-cell lung cancer [ID1306] 4 of 7
8. Is there an unmet need for
patients with this condition?
Most definitely.
Advantages of the technology
9. What do patients or carers
think are the advantages of the
technology?
From the ARCHER 1050 study, benefit is seen by patients in the improvement over Gefiitinib. The overall survival was 34.1 months for Dacomitinib and 26.8 months for Gefitinib. Median Progression Free Survival was 14.7 months and 9,2 months in the Dacomitinib arm and Gefitinib arm respectively. The potential for extensions in life, is of paramount importance to this patient population and their families.
Disadvantages of the technology
10. What do patients or carers
think are the disadvantages of
the technology?
The side effects of the treatment. Side effects are similar to those with other TKIs. However, in the ARCHER 1050 study, more treatment- related serious adverse events were reported in the Dacomitinib arm (9%) than in the Gefitinib arm (4%). Rashes and diarrhoea are the most common grade 3-4 side effects seen with Dacomitinib. In the anecdotal experience reported to us, it appears to be relatively well tolerated. Dacomitinib is also an oral therapy – meaning ease of administration.

Patient organisation submission Pembrolizumab with carboplatin and paclitaxel or nab-paclitaxel for untreated metastatic squamous non-small-cell lung cancer [ID1306] 5 of 7
Patient population
11. Are there any groups of
patients who might benefit
more or less from the
technology than others? If so,
please describe them and
explain why.
Equality
12. Are there any potential
equality issues that should be
taken into account when
considering this condition and
the technology?

Patient organisation submission Pembrolizumab with carboplatin and paclitaxel or nab-paclitaxel for untreated metastatic squamous non-small-cell lung cancer [ID1306] 6 of 7
Other issues
13. Are there any other issues
that you would like the
committee to consider?
Key messages
15. In up to 5 bullet points, please summarise the key messages of your submission:
Despite the benefits of first generation TKIs , there remains unmet need in this EGFR patient population
Dacomitinib is a second generation, irreversible EGFR TKI and it has shown improvement in overall survival and progression free survival, as compared with a first generation, reversible TKIs (Gefitinib)
Therapy is oral and relatively well tolerated
Thank you for your time.
Please log in to your NICE Docs account to upload your completed submission.
………………………………………………………………………………………………….

Patient organisation submission Pembrolizumab with carboplatin and paclitaxel or nab-paclitaxel for untreated metastatic squamous non-small-cell lung cancer [ID1306] 7 of 7
Your privacy
The information that you provide on this form will be used to contact you about the topic above.
Please tick this box if you would like to receive information about other NICE topics.
For more information about how we process your personal data please see our privacy notice.
………………………………………………………………………………………………….

Professional organisation submission Dacomitinib for untreated EGFR-positive non-small-cell lung cancer [ID1346] 1 of 11
Professional organisation submission
Dacomitinib for untreated EGFR-positive non-small-cell lung cancer [ID1346] Thank you for agreeing to give us your organisation’s views on this technology and its possible use in the NHS.
You can provide a unique perspective on the technology in the context of current clinical practice that is not typically available from the published literature.
To help you give your views, please use this questionnaire. You do not have to answer every question – they are prompts to guide you. The text boxes will expand as you type.
Information on completing this submission
Please do not embed documents (such as a PDF) in a submission because this may lead to the information being mislaid or make the submission unreadable
We are committed to meeting the requirements of copyright legislation. If you intend to include journal articles in your submission you must have copyright clearance for these articles. We can accept journal articles in NICE Docs.
Your response should not be longer than 13 pages.
About you
1. Your name xxxxxxx
2. Name of organisation British Thoracic Oncology Group
3. Job title or position xxxxxxxxxxxxxxxxxxxxxxxxxxxxxxx

Professional organisation submission Dacomitinib for untreated EGFR-positive non-small-cell lung cancer [ID1346] 2 of 11
4. Are you (please tick all that
apply): an employee or representative of a healthcare professional organisation that represents clinicians?
a specialist in the treatment of people with this condition?
a specialist in the clinical evidence base for this condition or technology?
other (please specify):
5a. Brief description of the
organisation (including who
funds it).
BTOG is a self-funded group of healthcare professionals involved in the multidisciplinary care of patients with lung and other thoracic malignancies.
5b. Do you have any direct or
indirect links with, or funding
from, the tobacco industry?
No
The aim of treatment for this condition
6. What is the main aim of
treatment? (For example, to
stop progression, to improve
mobility, to cure the condition,
or prevent progression or
disability.)
To improve symptoms; to delay progression of symptoms; to improve survival

Professional organisation submission Dacomitinib for untreated EGFR-positive non-small-cell lung cancer [ID1346] 3 of 11
7. What do you consider a
clinically significant treatment
response? (For example, a
reduction in tumour size by
x cm, or a reduction in disease
activity by a certain amount.)
30% reduction
8. In your view, is there an
unmet need for patients and
healthcare professionals in this
condition?
This is debatable. There are several drugs already available, but based on the results of the ARCHER 1050 trial dacomitinib offers clinically meaningful improvement compared with first generation drugs (Wu et al. Lancet Oncology (2017) 18:1454, Mok et al J Clin Oncol (2018) 36:2244). However, a third generation drug has now shown very significant superiority in PFS compared to first generation drug in the FLAURA trial (Soria et al. New Engl J Med (2017)), and this is likely to replace the current standard of care.
What is the expected place of the technology in current practice?
9. How is the condition
currently treated in the NHS? First line therpy with gefitinib, erlotinib or afatinib. Followed by osimertinib on progression, in the 50% of patients who have a T790M somatic mutation as resistance mechanism
Are any clinical guidelines used in the treatment of the condition, and if so, which?
NICE; ESMO; ASCO; NCCN

Professional organisation submission Dacomitinib for untreated EGFR-positive non-small-cell lung cancer [ID1346] 4 of 11
Is the pathway of care well defined? Does it vary or are there differences of opinion between professionals across the NHS? (Please state if your experience is from outside England.)
It is well defined, although there is little data to support the choice of one of the other from current standards gefitinib, erlotinib & afatinib
What impact would the technology have on the current pathway of care?
It would provide an additional alternative drug. The results of the ARCHER 1050 trial suggest that dacomitinib may be associated with a clinically significant improvement in OS compared with the current standard of care
10. Will the technology be
used (or is it already used) in
the same way as current care
in NHS clinical practice?
Yes
How does healthcare resource use differ between the technology and current care?
No
In what clinical setting should the technology be used? (For example,
Specialist thoracic oncology clinics

Professional organisation submission Dacomitinib for untreated EGFR-positive non-small-cell lung cancer [ID1346] 5 of 11
primary or secondary care, specialist clinics.)
What investment is needed to introduce the technology? (For example, for facilities, equipment, or training.)
None
11. Do you expect the
technology to provide clinically
meaningful benefits compared
with current care?
Yes, as above
Do you expect the technology to increase length of life more than current care?
Yes, as above
Do you expect the technology to increase health-related quality of life more than current care?
No

Professional organisation submission Dacomitinib for untreated EGFR-positive non-small-cell lung cancer [ID1346] 6 of 11
12. Are there any groups of
people for whom the
technology would be more or
less effective (or appropriate)
than the general population?
No
The use of the technology
13. Will the technology be
easier or more difficult to use
for patients or healthcare
professionals than current
care? Are there any practical
implications for its use (for
example, any concomitant
treatments needed, additional
clinical requirements, factors
affecting patient acceptability
or ease of use or additional
tests or monitoring needed.)
No difference in ease of use compared with standard of care

Professional organisation submission Dacomitinib for untreated EGFR-positive non-small-cell lung cancer [ID1346] 7 of 11
14. Will any rules (informal or
formal) be used to start or stop
treatment with the technology?
Do these include any
additional testing?
No – standard response assessment with CT scans
15. Do you consider that the
use of the technology will
result in any substantial health-
related benefits that are
unlikely to be included in the
quality-adjusted life year
(QALY) calculation?
No
16. Do you consider the
technology to be innovative in
its potential to make a
significant and substantial
impact on health-related
benefits and how might it
This is an incremental improvement over current standard of care

Professional organisation submission Dacomitinib for untreated EGFR-positive non-small-cell lung cancer [ID1346] 8 of 11
improve the way that current
need is met?
Is the technology a ‘step-change’ in the management of the condition?
No
Does the use of the technology address any particular unmet need of the patient population?
No
17. How do any side effects or
adverse effects of the
technology affect the
management of the condition
and the patient’s quality of life?
In the ARCHER 1050 trial the burden of toxicity was in general a little greater with dacomitinib than for
gefitinib
Sources of evidence
18. Do the clinical trials on the
technology reflect current UK
clinical practice?
Yes, the control arm treatment of the ARCHER 1050 trial (gefitinib) is a standard of care in first line
treatment of EGFR+ NSCLC

Professional organisation submission Dacomitinib for untreated EGFR-positive non-small-cell lung cancer [ID1346] 9 of 11
If not, how could the results be extrapolated to the UK setting?
What, in your view, are the most important outcomes, and were they measured in the trials?
PFS; OS. Yes, reported in the Wu et al. and Mok et al. trials referenced above
If surrogate outcome measures were used, do they adequately predict long-term clinical outcomes?
N/A
Are there any adverse effects that were not apparent in clinical trials but have come to light subsequently?
No
19. Are you aware of any
relevant evidence that might
not be found by a systematic
review of the trial evidence?
No
Professional organisation submission Dacomitinib for untreated EGFR-positive non-small-cell lung cancer [ID1346] 10 of 11
20. How do data on real-world
experience compare with the
trial data?
The ARCHER 1050 trial excluded patients with brain metastases (a common finding in NSCLC). Therefore,
depending on relative CNS penetration of the experimental and control arm drugs, the difference in
outcomes for these 2 drugs may not be exactly the same in the real world as those reported in the trial
Equality
21a. Are there any potential
equality issues that should be
taken into account when
considering this treatment?
No
21b. Consider whether these
issues are different from issues
with current care and why.
Key messages

Professional organisation submission Dacomitinib for untreated EGFR-positive non-small-cell lung cancer [ID1346] 11 of 11
22. In up to 5 bullet points, please summarise the key messages of your submission.
The second generation drug dacomitinib adds a further first line alternative for EGFR-mutated NSCLC
The ARCHER 1050 trial demonstrated a PFS, and importantly OS, advantage over current standard of care
This trial evidence differs from the real-world population in that patients with disease metastatic to brain were excluded
The expected approval in the first line setting of osimertinib, a third generation drug in this class, may supplant first and second line drugs, so the longer-term impact of dacomitinib may be limited
Thank you for your time. Please log in to your NICE Docs account to upload your completed submission.
………………………………………………………………………………………………….
Your privacy
The information that you provide on this form will be used to contact you about the topic above.
Please tick this box if you would like to receive information about other NICE topics.
For more information about how we process your personal data please see our privacy notice.
………………………………………………………………………………………………….

Clinical expert statement Dacomitinib for untreated EGFR-positive non-small-cell lung cancer [ID1346] 1 of 12
Clinical expert statement
Dacomitinib for untreated EGFR-positive non-small-cell lung cancer [ID1346]
Thank you for agreeing to give us your views on this technology and its possible use in the NHS.
You can provide a unique perspective on the technology in the context of current clinical practice that is not typically available from the published literature.
To help you give your views, please use this questionnaire. You do not have to answer every question – they are prompts to guide you. The text boxes will expand as you type.
Information on completing this expert statement
Please do not embed documents (such as a PDF) in a submission because this may lead to the information being mislaid or make the submission unreadable
We are committed to meeting the requirements of copyright legislation. If you intend to include journal articles in your submission you must have copyright clearance for these articles. We can accept journal articles in NICE Docs.
Your response should not be longer than 13 pages.
About you
1. Your name Alastair Greystoke
2. Name of organisation Newcastle University
Clinical expert statement Dacomitinib for untreated EGFR-positive non-small-cell lung cancer [ID1346] 2 of 12
3. Job title or position Senior Lecturer
4. Are you (please tick all that
apply): an employee or representative of a healthcare professional organisation that represents clinicians?
a specialist in the treatment of people with this condition?
a specialist in the clinical evidence base for this condition or technology?
other (please specify):
5. Do you wish to agree with
your nominating organisation’s
submission? (We would
encourage you to complete
this form even if you agree with
your nominating organisation’s
submission)
yes, I agree with it
no, I disagree with it
I agree with some of it, but disagree with some of it
other (they didn‘t submit one, I don’t know if they submitted one etc.)
6. If you wrote the organisation
submission and/ or do not
have anything to add, tick
here. (If you tick this box, the
rest of this form will be deleted
after submission.)
yes

Clinical expert statement Dacomitinib for untreated EGFR-positive non-small-cell lung cancer [ID1346] 3 of 12
The aim of treatment for this condition
7. What is the main aim of
treatment? (For example, to
stop progression, to improve
mobility, to cure the condition,
or prevent progression or
disability.)
Palliate cancer related symptoms, shrink down cancer on radiological imaging and prevent progression as long as possible and extend survival.
8. What do you consider a
clinically significant treatment
response? (For example, a
reduction in tumour size by
x cm, or a reduction in disease
activity by a certain amount.)
An improvement in Progression free survival of more than 3 months, an improvement in radiological response rates by 10 % or a reduction in the development of central nervous metastases by 5%, an improvement in overall survival by more than 6 weeks.
9. In your view, is there an
unmet need for patients and
healthcare professionals in this
condition?
Yes. The 1st and 2nd generation EGFR inhibitors (gefitinib, erlotinib and afatinib) can control the cancer but progression occurs on average within 12 months.
What is the expected place of the technology in current practice?

Clinical expert statement Dacomitinib for untreated EGFR-positive non-small-cell lung cancer [ID1346] 4 of 12
10. How is the condition
currently treated in the NHS? With 1st/ 2nd EGFR inhibitors as 1st line treatment. In patients who progress on these a repeat biopsy is taken. If this shows the cancer has become resistant due to a 2nd mutation in EGFR (T790M) the patient will change therapy to osimertinib.
In the absence of a biopsy or the demonstration of T790M on the biopsy the options are to continue the 1st line therapy beyond progression or switch to platinum doublet chemotherapy. In practice many patients are reluctant to change to chemotherapy in this setting and will continue their initial therapy.
Are any clinical guidelines used in the treatment of the condition, and if so, which?
Yes.
ESMO clinical guidelines as to management of metastatic lung cancer Planchard et al. ESMO NSCLC Guidelines 2018 Ann Oncol (2018) 29 (suppl 4): iv192–iv237. NICE technology appraisals TA192, TA258, TA310,TA416
NICE guideline CG121 (being updated)
Is the pathway of care well defined? Does it vary or are there differences of opinion between professionals across the NHS? (Please state if your experience is from outside England.)
Yes. It is recommended that all patients with lung cancer with a sensitising mutation in EGFR receive a 1st and 2nd generation EGFR inhibitors (gefitinib, erlotinib and afatinib) as 1st line of therapy. There is variation across the country and between clinicians as to which of these are used as preferred therapy.
What impact would the technology have on the current pathway of care?
Dacomitinib would be another option that clinicians could use when choosing 1st line therapy
11. Will the technology be
used (or is it already used) in Yes. Dacomitinib would be given as an oral therapy in oncology clinics to patients at 1st presentation with local advanced or metastatic lung cancer with a sensitising EGFR mutation

Clinical expert statement Dacomitinib for untreated EGFR-positive non-small-cell lung cancer [ID1346] 5 of 12
the same way as current care
in NHS clinical practice?
How does healthcare resource use differ between the technology and current care?
There would not be any major differences except the longer time on therapy with dacomitinib compared to the other 1st/2nd generation EGFR inhibitors.
In what clinical setting should the technology be used? (For example, primary or secondary care, specialist clinics.)
Specialist oncology clinics
What investment is needed to introduce the technology? (For example, for facilities, equipment, or training.)
Minimal; doctors and nurses already well trained in the management of EGFR side-efefcts and they are very similar to afatinib which is in common practice
12. Do you expect the
technology to provide clinically
meaningful benefits compared
with current care?
Do you expect the technology to increase
Yes, The Archer study showed a significant improvement in survival compared to one of the current 1st generation EGFR inhibitors (gefitinib which is in common use) of approximately 6 months.

Clinical expert statement Dacomitinib for untreated EGFR-positive non-small-cell lung cancer [ID1346] 6 of 12
length of life more than current care?
Do you expect the technology to increase health-related quality of life more than current care?
Yes. Dacomitinib is associated with longer disease control. In lung cancer the main driver of health related quality of life is cancer symptoms. These will be reduced with dacomitinib treatment and the length of disease control should off-set the toxicity seen with this agent in most patients
13. Are there any groups of
people for whom the
technology would be more or
less effective (or appropriate)
than the general population?
No
The use of the technology
14. Will the technology be
easier or more difficult to use
for patients or healthcare
professionals than current
care? Are there any practical
implications for its use (for
example, any concomitant
Likely to be similar. Dacomiitnib does require dose adjustments in a number of patients. This is also the
case with afatinib although not with gefitinib and erlotinib. Likely to be the concurrent medications to
manage skin and gastro-intestinal toxicity such as topical antibiotics and lopermaide but will be similar to
afatinib.

Clinical expert statement Dacomitinib for untreated EGFR-positive non-small-cell lung cancer [ID1346] 7 of 12
treatments needed, additional
clinical requirements, factors
affecting patient acceptability
or ease of use or additional
tests or monitoring needed.)
15. Will any rules (informal or
formal) be used to start or stop
treatment with the technology?
Do these include any
additional testing?
No additional testing will be required; EGFR testing at 1st diagnosis is already well embedded in the NHS.
Patients will be monitored as previously with oncologist/ specialist nurse review to ensure clinical benefit
and tolerability with regular CT scans to document formal response to treatment as with present care.
16. Do you consider that the
use of the technology will
result in any substantial health-
related benefits that are
unlikely to be included in the
quality-adjusted life year
(QALY) calculation?
No
17. Do you consider the
technology to be innovative in
No. It is clear that dacomiitnib is an improvement in terms of PFS and OS over the 1st and 2nd generation
EGFR inhibitors in present use. However the emerging data in the 1st line setting with 3rd generation TKI

Clinical expert statement Dacomitinib for untreated EGFR-positive non-small-cell lung cancer [ID1346] 8 of 12
its potential to make a
significant and substantial
impact on health-related
benefits and how might it
improve the way that current
need is met?
inhibitors such as osimertinib is likely to supplant dacomitinib, particularly as it has an improved safety
profile.
Is the technology a ‘step-change’ in the management of the condition?
No; see above.
Does the use of the technology address any particular unmet need of the patient population?
No
18. How do any side effects or
adverse effects of the
technology affect the
management of the condition
and the patient’s quality of life?
Diarrhoea and skin toxicity can impact on a patient quality of life but shouldn't cause too many problems if
managed appropriately with dose reductions and supportive measures.
Sources of evidence

Clinical expert statement Dacomitinib for untreated EGFR-positive non-small-cell lung cancer [ID1346] 9 of 12
19. Do the clinical trials on the
technology reflect current UK
clinical practice?
Yes
If not, how could the results be extrapolated to the UK setting?
What, in your view, are the most important outcomes, and were they measured in the trials?
Overall survival
Progression Free Survival
Health Related quality of life
Toxicity
Development of CNS disease
Rates of subsequent treatment
If surrogate outcome measures were used, do they adequately predict long-term clinical outcomes?
N/A

Clinical expert statement Dacomitinib for untreated EGFR-positive non-small-cell lung cancer [ID1346] 10 of 12
Are there any adverse effects that were not apparent in clinical trials but have come to light subsequently?
No
20. Are you aware of any
relevant evidence that might
not be found by a systematic
review of the trial evidence?
No
21. How do data on real-world
experience compare with the
trial data?
We have yet to generate real world data with dacomiitnib. In general real world data from EGFR inhibitors
matches relatively well on trial data except that patients with poorer PS and active brain disease do worse
than the trial population
Equality
22a. Are there any potential
equality issues that should be
taken into account when
considering this treatment?
No

Clinical expert statement Dacomitinib for untreated EGFR-positive non-small-cell lung cancer [ID1346] 11 of 12
22b. Consider whether these
issues are different from issues
with current care and why.
Key messages
23. In up to 5 bullet points, please summarise the key messages of your statement.
Dacomitinib is the 1st EGFR inhibitor to show survival benefit
The toxicity profile and method of use are similar to afatinib
It represents and advance on present UK standard of Care
Its use is likely to be supplanted by the emerging data with 1st line 3rd generation EGFR inhibitors
Thank you for your time. Please log in to your NICE Docs account to upload your completed statement, declaration of interest form and consent form.
………………………………………………………………………………………………….
Your privacy
The information that you provide on this form will be used to contact you about the topic above.
Please tick this box if you would like to receive information about other NICE topics.
For more information about how we process your personal data please see our privacy notice.
………………………………………………………………………………………………….

Clinical expert statement Dacomitinib for untreated EGFR-positive non-small-cell lung cancer [ID1346] 12 of 12

Patient expert statement Dacomitinib for untreated EGFR-positive non-small-cell lung cancer [ID1346] 1 of 7
Patient expert statement
Dacomitinib for untreated EGFR-positive non-small-cell lung cancer [ID1346]
Thank you for agreeing to give us your views on this technology and its possible use in the NHS.
You can provide a unique perspective on conditions and their treatment that is not typically available from other sources.
To help you give your views, please use this questionnaire with our guide for patient submissions.
You do not have to answer every question – they are prompts to guide you. The text boxes will expand as you type.
Information on completing this expert statement
Please do not embed documents (such as a PDF) in a submission because this may lead to the information being mislaid or make the submission unreadable
We are committed to meeting the requirements of copyright legislation. If you intend to include journal articles in your submission you must have copyright clearance for these articles. We can accept journal articles in NICE Docs.
Your response should not be longer than 10 pages.
About you
1.Your name Carol A Davies
2. Are you (please tick all that
apply): a patient with the condition?
a carer of a patient with the condition?
a patient organisation employee or volunteer?

Patient expert statement Dacomitinib for untreated EGFR-positive non-small-cell lung cancer [ID1346] 2 of 7
other (please specify): Macmillan Lung Cancer Nurse Specialist and NLCFN committee member 3. Name of your nominating
organisation
4. Did your nominating
organisation submit a
submission?
yes, they did
no, they didn’t
I don’t know
5. Do you wish to agree with
your nominating organisation’s
submission? (We would
encourage you to complete
this form even if you agree with
your nominating organisation’s
submission)
yes, I agree with it
no, I disagree with it
I agree with some of it, but disagree with some of it
other (they didn‘t submit one, I don’t know if they submitted one etc.)

Patient expert statement Dacomitinib for untreated EGFR-positive non-small-cell lung cancer [ID1346] 3 of 7
6. If you wrote the organisation
submission and/ or do not
have anything to add, tick
here. (If you tick this box, the
rest of this form will be deleted
after submission.)
yes
7. How did you gather the
information included in your
statement? (please tick all that
apply)
I have personal experience of the condition
I have personal experience of the technology being appraised
I have other relevant personal experience. Please specify what other experience:
I am drawing on others’ experiences. Please specify how this information was gathered: I work with Patients (and carers) with lung cancer and keep myself up to date with relevant trial results
Living with the condition
8. What is it like to live with the
condition? What do carers
experience when caring for
someone with the condition?
An incurable lung cancer diagnosis comes with a variety of debilitating symptoms. These include breathlessness, fatigue, (both can impact on mobility) pain, loss of appetite & psychological concerns.
Carers often feel helpless

Patient expert statement Dacomitinib for untreated EGFR-positive non-small-cell lung cancer [ID1346] 4 of 7
Current treatment of the condition in the NHS
9. What do patients or carers
think of current treatments and
care available on the NHS?
Always hoping for new innovative treatments; in this patient group that will shrink the cancer (as cure is not possible),that will extend one’s life (but with minimal side effects) that preserve or improve performance status, and improve one’s quality of life.
10. Is there an unmet need for
patients with this condition? Definitely
Advantages of the technology
11. What do patients or carers
think are the advantages of the
technology?
No experience of this technology as such unable to answer this question
Disadvantages of the technology
12. What do patients or carers
think are the disadvantages of
the technology?
No experience of this technology as such unable to answer this question
Patient population
13. Are there any groups of
patients who might benefit Good PS patients with untreated EGFR-positive NSCLC.

Patient expert statement Dacomitinib for untreated EGFR-positive non-small-cell lung cancer [ID1346] 5 of 7
more or less from the
technology than others? If so,
please describe them and
explain why.
Trial data identifies that Dacomitinib comes with significant side effects as such not suitable for large proportion of patients who are diagnosed with PS 2 or 3
Equality
14. Are there any potential
equality issues that should be
taken into account when
considering this condition and
the technology?
Not to my knowledge
Other issues
15. Are there any other issues
that you would like the
committee to consider?
No
Topic-specific questions
16. [To be added by technical
team if required, after receiving
the company submission. For

Patient expert statement Dacomitinib for untreated EGFR-positive non-small-cell lung cancer [ID1346] 6 of 7
example, if the company has
deviated from the scope
(particularly with respect to
comparators) – check whether
this is appropriate. Ask
specific, targeted questions
such as “Is comparator X
[excluded from company
submission] considered to be
established clinical practice in
the NHS for treating [condition
Y]?”]
if not delete highlighted
rows and renumber below
Key messages
17. In up to 5 bullet points, please summarise the key messages of your statement:
Trial data suggests overall survival benefit when compared to Gefitinib.
A lung cancer treatment for this group of patients with a proven (trial data) overall survival benefit is a positive result for lung cancer patients

Patient expert statement Dacomitinib for untreated EGFR-positive non-small-cell lung cancer [ID1346] 7 of 7
Careful patient selection is essential – as comes with significant side effects. Careful monitoring of and prompt treatment of side effects essential
Likely not suitable for large proportion of untreated EGFR- positive NSCLC patients as many present PS 2 or 3
Thank you for your time.
Please log in to your NICE Docs account to upload your completed statement, declaration of interest form and consent form.
………………………………………………………………………………………………….
Your privacy
The information that you provide on this form will be used to contact you about the topic above.
Please tick this box if you would like to receive information about other NICE topics.
For more information about how we process your personal data please see our privacy notice.
………………………………………………………………………………………………….

NHS England submission for the 1st meeting of the NICE appraisal of dacomitinib in the
treatment of locally advanced/metastatic activating EGFR mutation positive non small cell
lung cancer
Indicates commercial in confidence
1. There are 3 NICE‐recommended monotherapy options for the 1st line treatment of
activating EGFR positive non small cell lung cancer (NSCLC): erlotinib, gefitinib and
afatinib. The greatest use in England of these 3 drugs is with afatinib although significant
market share remains with both erlotinib and gefitinib. Afatinib has the best pedigree in
relation to clinical evidence as it was compared at the time of the clinical trial with
optimal chemotherapy for NSCLC and also has since been shown to be superior (in
progression free survival) to gefitinib. Afatinib has the most side‐effects of these 3
agents and in NHS practice is probably offered to patients at the fitter end of the
spectrum of performance status.
2. Although trials of EGFR‐TKIs have generally been performed in patients of ECOG
performance status of 0 or 1, clinical use has extended to patients of lower performance
status, at least for gefitinib and erlotinib. The reason for this is that responses to EGFR‐
TKIs can be quick and thus patients can rapidly improve their performance status and
quality of life. The chronic side‐effects of EGFR‐TKIs are very important to patients,
hence the need for a balance to be achieved between the efficacy of therapy and the
side‐effects of treatment.
3. The most valid clinical comparator for dacomitinib is currently afatinib especially given
the considerable side‐effect profile of dacomitinib as its use is more likely to be in the
patients fit enough to receive afatinib. Erlotinib and gefitinib remain appropriate
comparators in theory but less so in practice as erlotinib and gefitinib have fewer side‐
effects and so are more likely to be given to patients who are less fit. NHS England.
4. NHS England notes that 76% of the ARCHER 1050 study were Asian. The intention to
treat (ITT) progression free survival (PFS) analysis showed a significant benefit with
dacomitinib over gefitinib (14.7 vs 9.2 months). Pre‐specified analyses showed that the
PFS difference for Asian patients was 18.2 vs 10.9 months (n=259) whereas for non‐
Asian patients was 10.9 vs 9.1 months (n=72). Whilst the number of non‐Asian patients
was small and NHS England is fully aware of the dangers of subgroup analysis, NHS
England has uncertainties as to whether the ITT benefit of dacomitinib would be fully
translated into outcomes for patients in England.
5. NHS England notes with concern the difference in side‐effects between dacomitinib and
gefitinib in ARCHER 1050 with dacomitinib associated with much higher rates of
diarrhoea and cutaneous toxicity. Dose reductions from the initial starting dose were
necessary in 66% of dacomitinib patients versus 8% for gefitinib patients. Of the
dacominitib dose reductions, 38% of all patients reduced to two thirds of the starting
dose and 28% of all patients reduced to one third of the starting dose of dacomitinib.
Dacomitinib is a drug with very significant toxicity.

6. The dacomitinib phase III trial included patients of ECOG performance status of 0 or 1
only. The much higher rates of dose reductions/interruptions seen with dacomitinib vs
gefitinib were in a fit population of patients and hence NHS England is concerned as the
toxicities of dacomitinib likely to be seen in practice in England.
7. Adverse toxicities for a chronic treatment such as dacomitinib are very important and
side‐effects of grades 1 and 2 are still significant daily issues for patients. NHS England
would therefore wish the effect of these chronic toxicities to be included in the utility
values employed in the cost effectiveness modelling.
8. NHS England notes that patients with brain metastases were excluded from ARCHER
1050 unlike Lux‐Lung 7 (afatinib vs gefitinib) in which 16% of patients had brain
secondaries. The proportions of Asian patients were also different (75% ARCHER 1050 vs
57% in Lux‐Lung‐7). The indirect comparison of dacomitinib vs afatinib therefore has
significant uncertainties.
9. NHS England observes that in the ARCHER 1050 trial, patients were treated for a
maximum of 4 years. If NICE recommends the use of dacomitinib, NHS England would
with the Appraisal Committee to address the issue as to whether this cap in treatment
duration would apply or not in its recommendations.
10. NHS England notes the subsequent treatments received so far by patients after
progression on dacomitinib/gefitinib in the ARCHER 1050 study. Osimertinib has been
used less than would be expected in England (8‐13%) and yet the company has modelled
a 2nd line treatment rate with osimertinib of 56% which is too high. NHS England
observes that 12‐13% in ARCHER 1050 received a further line of treatment with erlotinib
or gefitinib and neither of these are commissioned in England after failure of initial
EGFR‐TKI therapy. The company indicates that the 2nd line systemic treatment rate in
EGFR‐mutated NSCLC is 71% and the 3rd line treatment rate is 48%. Both these figures
are too high, the likely figures in NHS practice being 50‐60% and 25‐30%.
11. Given the toxicity of dacomitinib and that the NHS has to provide and pay for all the
monitoring of a drug such as dacomitinib plus the resources to treat and mitigate the
drug’s side‐effects, NHS England is surprised that Pfizer plans to charge the same
amount for a 45mg dose of dacomitinib as it does for a 15mg dose.
12. Whilst there is immaturity as to overall survival data in the ARCHER 1050 study, NHS
England does not view the Cancer Drugs Fund as being a worthwhile use of CDF
resources for a NICE recommendation to the CDF for treatment with dacomitinib. There
are already 3 NICE‐recommended drugs in this position in the treatment pathway, all of
which would be trumped by a NICE recommendation for 1st line osimertinib.
Prof Peter Clark
NHS England Chemotherapy Lead and National Clinical Lead for the Cancer Drugs Fund
March 2019

1
Dacomitinib for untreated EGFR-positive non-small-cell lung cancer (ID1346). Main Evidence Review Group Report.
Produced by: Warwick Evidence, University of Warwick, Coventry, CV4 7AL
Authors: Peter Auguste, Research Fellow in Health Economics1
Emma Loveman, Senior Researcher 2
Daniel Gallacher, Research Fellow in Statistics1 Mary Jordan, Research Associate in Health Economics1 Rachel Court, Information Specialist1
Jacoby Patterson, Honorary Clinical Research Fellow1 Jatinder Kaur, Academic Foundation Year Two Doctor3 John Green, Consultant in Medical Oncology4 Jill Colquitt, Senior Researcher2
Xavier Armoiry, Honorary Clinical Research Fellow1 and Professor of Pharmacy5
James Mason, Professor of Health Economics1 Lazaros Andronis, Senior Research Fellow in Health Economics1
1Warwick Evidence, Division of Health Sciences, Warwick Medical School, University of Warwick, Coventry, CV4 7AL, UK 2 Effective Evidence LPP, Waterlooville, PO8 9SE, UK 3University Hospitals Birmingham NHS Foundation Trust, Birmingham B15 2QU, UK 4The Clatterbridge Cancer Centre, Wirral, CH63 4JY, UK 5Claude Bernard University, Villeurbanne 69100, France
Correspondence to: Dr Lazaros Andronis, Division of Health Sciences, Warwick Medical
School, University of Warwick, Coventry, CV4 7AL. Tel: +44 (0) 24 765 74490. Email: [email protected].
Date completed: 20 February 2019
Source of funding: This report was commissioned by the NIHR HTA Programme as project number 127889.

2
Declared competing interests:
PA, EL, DG, MJ, RC, JP, JK, XA, JC, JG, JM and LA declare no competing interests.
LA declares a honorarium received from Pfizer for participation in a panel set up to provide expert opinion on aspects of an unrelated submission to NICE (Tofacitinib for moderately to severely active ulcerative colitis [TA574]).
Acknowledgements:
The ERG team are grateful to Dr John Green (BSc MBChB DM FRCPE FRCP) who acted as an expert clinical advisor throughout the course of this appraisal.
Rider on responsibility for report:
The views expressed in this report are those of the authors and not necessarily those of the NIHR HTA Programme. Any errors are the responsibility of the authors. Copyright belongs to The University of Warwick.
This report should be referenced as follows:
Auguste P., Loveman E., Gallacher, D., Jordan M., Court R, Patterson J., Kaur J., Green J., Colquit J., Armoiry X., Mason J and Andronis L. Dacomitinib for untreated EGFR-positive non-small-cell lung cancer (ID1346): A Single Technology Appraisal. Warwick Evidence, University of Warwick, February 2019.
Contributions of authors
Lazaros Andronis (Senior Research Fellow) led and co-ordinated the project; Peter Auguste (Research Fellow) co-ordinated and conducted the appraisal of the economic evidence; Emma Loveman (Senior Researcher) co-ordinated and conducted the appraisal of clinical effectiveness evidence; Daniel Gallacher (Research Fellow) conducted the appraisal of statistical elements in the submission; Mary Jordan (Research Associate) contributed to the appraisal of the economic evidence; Rachel Court (Information Specialist) conducted ERG searches and the critique of the company searches; Jacoby Patterson (Clinical Fellow) contributed to the appraisal of the clinical effectiveness evidence; Jatinder Kaur (Academic F2 Doctor) contributed to the appraisal of the clinical effectiveness evidence; John Green (Consultant in Oncology) contributed to the appraisal of the clinical effectiveness evidence; Jill Colquitt (Senior Researcher) contributed to the appraisal of the clinical effectiveness evidence; Xavier Armoiry (Professor of Pharmacology) contributed to the appraisal of statistical elements (Network Meta Analysis); James Mason (Professor of Health Economics) contributed to the appraisal of the economic evidence. All listed authors contributed to writing sections of the report, and reviewed and commented on the final version of the report.

3
TABLE OF CONTENT
TABLE OF CONTENT ................................................................................................................................ 3
LIST OF TABLES ........................................................................................................................................ 6
LIST OF FIGURES ....................................................................................................................................... 9
1 SUMMARY ...................................................................................................................................... 13
1.1 Critique of the decision problem in the company’s submission ................................................... 13
1.2 Summary of clinical effectiveness evidence submitted by the company ...................................... 13
1.3 Summary of the ERG’s critique of clinical effectiveness evidence submitted ............................. 14
1.4 Summary of cost-effectiveness evidence submitted by the company ........................................... 15
1.5 Summary of the ERG’s critique of cost-effectiveness evidence submitted .................................. 17
1.6 ERG commentary on the robustness of evidence submitted by the company .............................. 18
1.6.1 Strengths ........................................................................................................................ 18
1.6.2 Weaknesses and areas of uncertainty ............................................................................ 19
1.7 Summary of exploratory and sensitivity analyses undertaken by the ERG .................................. 20
1.7.1 Exploratory analyses related to clinical effectiveness ................................................... 20
1.7.2 Exploratory analyses related to cost-effectiveness ........................................................ 21
2 BACKGROUND ............................................................................................................................... 23
2.1 Critique of company’s description of underlying health problem. ............................................... 23
2.2 Critique of company’s overview of current service provision ...................................................... 23
3 Critique of company’s definition of decision problem ..................................................................... 25
3.1 Decision problem .......................................................................................................................... 25
4 CLINICAL EFFECTIVENESS ........................................................................................................ 28
4.1 Critique of the methods of review(s) ............................................................................................ 28
4.1.1 Searches ........................................................................................................................ 28
4.1.2 Inclusion criteria ........................................................................................................... 29
4.1.3 Critique of data extraction ............................................................................................. 31
4.1.4 Quality assessment ........................................................................................................ 31
4.1.5 Overall quality of the CS SR ......................................................................................... 33
4.2 Critique of trials of the technology of interest, their analysis and interpretation .......................... 33
4.2.1 Baseline characteristics of participants of ARCHER 1050 trial. .................................. 35
4.2.2 Trial analysis sets, outcomes and statistics. .................................................................. 38
4.2.3 Summary results from ARCHER 1050 ......................................................................... 40
4.2.4 Other dacomitinib trials................................................................................................. 47

4
4.3 Critique of trials identified and included in the indirect comparison and/or multiple treatment comparison .................................................................................................................................... 50
4.3.1 The LUX-Lung 7 trial ................................................................................................... 51
4.4 Critique of the indirect comparison and/or multiple treatment comparison ................................. 53
4.4.1 Methodology of the NMA ............................................................................................. 53
4.5 Additional work on clinical effectiveness undertaken by the ERG .............................................. 58
4.6 Conclusions of the clinical effectiveness section .......................................................................... 58
5 COST-EFFECTIVENESS ................................................................................................................ 60
5.1 ERG comment on company’s review of cost-effectiveness evidence .......................................... 60
5.1.1 Search strategy .............................................................................................................. 60
5.1.2 Inclusion criteria ........................................................................................................... 61
5.1.3 Included studies ............................................................................................................. 62
5.1.4 Systematic review of studies reporting resource use and costs. .................................... 64
5.1.5 Systematic review of HRQoL studies ........................................................................... 64
5.1.6 Results ........................................................................................................................... 66
5.1.7 Conclusions ................................................................................................................... 67
5.2 Summary and critique of company’s submitted economic evaluation by the ERG ...................... 67
5.2.1 NICE reference case checklist ...................................................................................... 67
5.2.2 Model structure ............................................................................................................. 69
5.2.3 Population ..................................................................................................................... 71
5.2.4 Intervention and comparators ........................................................................................ 71
5.2.5 Perspective, time horizon and discounting .................................................................... 72
5.2.6 Treatment effectiveness and extrapolation .................................................................... 73
5.2.7 ERG’s exploratory survival analysis ............................................................................. 90
5.2.8 Adverse events .............................................................................................................. 91
5.2.9 Mortality ........................................................................................................................ 93
5.2.10 Health-related quality of life ......................................................................................... 93
5.2.11 Resource use and costs .................................................................................................. 98
5.2.12 Overview of model assumptions and ERG critique .................................................... 104
5.3 Cost-effectiveness results ............................................................................................................ 107
5.3.1 Cost-effectiveness results: dacomitinib (with PAS) versus comparators (with company’s assumed PAS). ................................................................................................................................. 107
5.3.2 Cost-effectiveness results: dacomitinib (list price) versus comparators (list prices). . 118
5.3.3 Model validation and face validity check ................................................................... 125

5
5.4 Exploratory and sensitivity analyses undertaken by the ERG .................................................... 127
5.4.1 The ERG’s suggested amendments ............................................................................. 127
5.4.2 Probabilistic sensitivity analysis ................................................................................. 129
5.4.3 Additional deterministic analyses ............................................................................... 129
5.5 Conclusions of the cost-effectiveness section ............................................................................. 129
6 IMPACT OF ADDITIONAL CLINICAL AND ECONOMIC ANALYSES UNDERTAKEN BY THE ERG ........................................................................................................................................ 131
6.1 Impact of ERG changes on the company’s base-case results. .................................................... 131
6.1.1 Impact of ERG’s suggested changes on comparison between dacomitinib (PAS) versus comparators (company’s assumed PAS). ........................................................................................ 131
6.1.2 Impact of ERG’s suggested changes on the comparison between dacomitinib (PAS) versus erlotinib, gefitinib and afatinib (list prices). ......................................................................... 135
6.2 Results of ERG base-case analysis. ............................................................................................ 139
6.2.1 ERG base-case results (dacomitinib with PAS vs comparators at list prices) ............ 139
6.2.2 ERG’s sensitivity analyses (dacomitinib with PAS vs comparators at list prices) ..... 140
6.2.3 ERG scenario analysis (dacomitinib with PAS vs comparators at list prices) ............ 144
7 END OF LIFE ................................................................................................................................. 146
8 OVERALL CONCLUSION ........................................................................................................... 146
9 REFERENCES ................................................................................................................................ 148
10 APPENDICES ................................................................................................................................. 156
10.1.1 ERG’s individual parameter changes. ......................................................................... 156
10.1.2 Evidence on the equivalence of erlotinib and gefitinib ............................................... 165
10.1.3 ERG’s changes in the economic model ...................................................................... 170
6
LIST OF TABLES
Table 1: Differences between the decision problem and the evidence provided in the CS. ........................ 25
Table 2: Risk of bias assessment of ARCHER 1050. .................................................................................. 32
Table 3: ERG QA of the CS SR. ................................................................................................................. 33
Table 4: Baseline characteristics in ARCHER 1050 ................................................................................... 36
Table 5: Summary of ARCHER 1050 results. ............................................................................................ 40
Table 6: EQ-5D-3L absolute scores (PRO Population) ............................................................................... 43
Table 7: Summary of adverse events ........................................................................................................... 45
Table 8: Treatment-related adverse events occurring in **** of patients ................................................... 46
Table 9: Adverse events in other dacomitinib trials in NSCLC .................................................................. 49
Table 10: Risk of bias assessment of LUX-Lung 7. .................................................................................... 51
Table 11: Baseline characteristics in LUX-Lung 7. .................................................................................... 52
Table 12: Comparison of key results in ARCHER 1050 and LUX-Lung 7. ............................................... 53
Table 13: Comparison of key baseline characteristics in the two trials in the NMA .................................. 54
Table 14: Data included in the ERG NMA. ................................................................................................ 57
Table 15: ERG NMA league table .............................................................................................................. 57
Table 16: Eligibility criteria for cost-effectiveness searches. ...................................................................... 61
Table 17: Summary of the key characteristics of the cost-effectiveness studies identified ......................... 63
Table 18: Eligibility criteria for inclusion in the utility review. .................................................................. 65
Table 19: NICE reference case checklist ..................................................................................................... 68
Table 20: Second- and third-line treatments. ............................................................................................... 72
Table 21: Predictions for Gefitinib PFS ...................................................................................................... 74
Table 22: PFS Predictions for Dacomitinib and Afatinib ............................................................................ 80
Table 23: OS goodness of fit and predictions for gefitinib. ........................................................................ 82
Table 24: OS predictions for dacomitinib and afatinib ............................................................................... 85

7
Table 25: Comparison of pre-progression and post-progression survival gains ......................................... 90
Table 26: List of adverse events included in the model .............................................................................. 92
Table 27: Treatment-related adverse events occurring in >2% of patients ................................................. 92
Table 28: EQ-5D-3L PFS utility values by treatment from ARCHER 1050 .............................................. 93
Table 29: Summary of mean EQ-5D health index score. ............................................................................ 94
Table 30: Summary of utility values used in company’s cost-effectiveness analysis. ................................ 95
Table 31: Adverse event utility decrements and durations .......................................................................... 96
Table 32: Summary of HRQoL scenario analyses ...................................................................................... 97
Table 33: Units costs of intervention and comparators. .............................................................................. 99
Table 34: Units costs of intervention and comparators based on PAS and assumed PAS. ......................... 99
Table 35: Drug acquisition cost of subsequent treatment .......................................................................... 100
Table 36: Drug administration costs for subsequent treatment (obtained from CS) ................................. 100
Table 37: Total costs for routine monitoring and disease management by health state (obtained from the CS) ................................................................................................................................................ 102
Table 38: Costs of treating adverse events ................................................................................................ 103
Table 39: Total costs of treating adverse events, by treatment .................................................................. 103
Table 40: Model assumptions with ERG’s comments. ............................................................................. 104
Table 41: Deterministic results, company base-case using the assumed PAS for comparators (discounted) ...................................................................................................................................................... 108
Table 42: Deterministic results, company base-case using the assumed PAS for comparators (discounted). ...................................................................................................................................................... 108
Table 43: Probabilistic results, company base-case using the assumed PAS for comparators .................. 109
Table 44: Results of base-case scenario analysis for the comparison between dacomitinib and gefitinib. ...................................................................................................................................................... 115
Table 45: Results of base-case scenario analysis for the comparison between dacomitinib and erlotinib. ...................................................................................................................................................... 116
Table 46: Results of base-case scenario analysis for the comparison between dacomitinib and afatinib. 117
Table 47: Deterministic results, company base-case using the list prices. ................................................ 118

8
Table 48: Deterministic results, company base-case using the list prices. ................................................ 118
Table 49: Probabilistic results, company base-case using the list prices. .................................................. 119
Table 50: Results of base-case scenario analysis for the comparison between dacomitinib and gefitinib (using the list prices) .................................................................................................................... 123
Table 51: Results of base-case scenario analysis for the comparison between dacomitinib and erlotinib (using list prices) .......................................................................................................................... 124
Table 52: Results of base-case scenario analysis for the comparison between dacomitinib and afatinib (using list prices) .......................................................................................................................... 125
Table 53: PFS outcome for gefitinib versus previous published studies. .................................................. 126
Table 54: OS outcome for gefitinib versus previous published studies. ................................................... 126
Table 55. Values and assumptions used in the ERG’s base-case analysis. ............................................... 128
Table 56: Results of scenario analysis for the comparison between dacomitinib and gefitinib (dacomitinib PAS vs gefitinib assumed PAS). .................................................................................................. 132
Table 57: Results of scenario analysis for the comparison between dacomitinib and erlotinib (dacomitinib PAS vs erlotinib assumed PAS) ................................................................................................... 133
Table 58: Results of scenario analysis for the comparison between dacomitinib and afatinib. (dacomitinib PAS vs afatinib assumed PAS) ..................................................................................................... 134
Table 59: Results of scenario analysis for the comparison between dacomitinib and gefitinib (both at list prices) ........................................................................................................................................... 136
Table 60: Results of base-case scenario analysis for the comparison between dacomitinib and erlotinib (both at list prices) ........................................................................................................................ 137
Table 61: Results of base-case scenario analysis for the comparison between dacomitinib and afatinib (both at list prices) ........................................................................................................................ 138
Table 62. Deterministic results using the PAS for dacomitinib and the list prices for the comparators ... 139
Table 63: ERG base-case results (point estimates, dacomitinib with PAS vs comparators at list prices) . 140
Table 64: ERG probabilistic sensitivity analysis results, using the assumed the PAS for dacomitinib and list prices for comparators ............................................................................................................ 141
Table 65: ERG scenario analysis, using the log-normal parametric curve for gefitinib............................ 144
Table 66: ERG scenario analysis, using the log-logistic parametric curve for gefitinib ........................... 145
Table 67: ERG scenario analysis, using utility values reported in Labbé et al. ........................................ 145

9
Table 68: ERG scenario analysis, using results from the NMA for overall survival ................................ 145
LIST OF FIGURES
Figure 1: Proposed future position of dacomitinib in the treatment pathway of advanced EGFR+ NSCLC. ........................................................................................................................................................ 24
Figure 2: Evidence network for the indirect comparison. ........................................................................... 50
Figure 3: Illustrative survival model (obtained from the CS) ...................................................................... 69
Figure 4: Illustrative model structure (obtained from the submission) ....................................................... 70
Figure 5: Hazard plot of PFS for Gefitinib ARCHER 1050 ........................................................................ 75
Figure 6: Comparison of PFS Hazard Ratios vs Gefitinib from company FP NMA (P1=0.5, P2=1.5) ...... 76
Figure 7: Comparison of PFS KM Curves from Park 2016 and Paz-Ares 2017 for LUX-Lung 7 ............. 76
Figure 8: PFS curves under company base-case: generalised gamma and P1=0.5, P2=1.5 ........................ 77
Figure 9: PFS Curve of P1=0.5, P2=1 ......................................................................................................... 78
Figure 10: Comparison of Company (dashed) and ERG (solid) preferred PFS extrapolations. .................. 79
Figure 11: Hazard Ratios of Company (solid) and ERG (dashed) preferred PFS FP model. ...................... 79
Figure 12: Hazard ratios applied to gefitinib extrapolation comparators in company base-case (P1=-0.5) 83
Figure 13: OS Curves from company base-case ......................................................................................... 83
Figure 14: OS hazard ratio from spline model fitted to digitised data from ARCHER 1050 and LUX-Lung 7 ...................................................................................................................................................... 87
Figure 15: ERG preferred OS extrapolation (log-logistic and HR=1 from 36 months) .............................. 89
Figure 16: Scatterplot of strategies on the cost-effectiveness plane, company base-case using assumed PAS for comparators .................................................................................................................... 110
Figure 17: Cost-effectiveness acceptability curve, company base-case using assumed PAS for comparators .................................................................................................................................. 111
Figure 18: Tornado diagram for the comparison of dacomitinib versus gefitinib, using the assumed PAS for comparators ............................................................................................................................. 112
Figure 19: Tornado diagram for the comparison of dacomitinib versus erlotinib, using the assumed PAS for comparators ............................................................................................................................. 113

10
Figure 20: Tornado diagram for the comparison of dacomitinib versus afatinib, using the assumed PAS for comparators ............................................................................................................................. 113
Figure 21: Scatterplot of strategies on the cost-effectiveness plane, company base-case using list prices ...................................................................................................................................................... 119
Figure 22: Cost-effectiveness acceptability curve, company base-case using the list prices .................... 120
Figure 23: Tornado diagram for the comparison of dacomitinib versus gefitinib, using the list prices .... 121
Figure 24: Tornado diagram for the comparison of dacomitinib versus erlotinib, using the list prices .... 121
Figure 25: Tornado diagram for the comparison of dacomitinib versus afatinib, using the list prices ..... 122
Figure 26: Scatterplot of strategies on the cost-effectiveness plane, ERG base-case ................................ 142
Figure 27: Cost-effectiveness acceptability curve, ERG base-case ........................................................... 143

11
DEFINITION OF TERMS AND LIST OF ABBREVIATIONS
AE Adverse Event
AIC Akaike Information Criterion
AT As Treated
BIC Bayesian Information Criterion
BNF British National Formulary
CE plane Cost-Effectiveness plane
CEAC Cost-Effectiveness Acceptability Curve
CR Complete Response
CS Company Submission
CSR Clinical Study Report
DIC Deviance Information Criterion
DoR Duration of Response
ECOG Eastern Cooperative Oncology Group
EGFR Epidermal growth factor receptor
EMA European Medicines Agency
EQ-5D EuroQol 5-Dimensions Questionnaire
ER Oestrogen Receptor
ERG Evidence Review Group
FDA Food and Drug Administration
GP General Practitioner
HR Hazard Ratio
HRQoL Health-Related Quality of Life
HTA Health Technology Assessment
ICER Incremental Cost-effectiveness Ratio
IRC Independent Review Committee
ITT Intention-To-Treat
KM Kaplan-Meier
NHS National Health Service
NICE National Institute for Health and Care Excellence
NMA Network Meta-Analysis

12
NR Not Reported
NSCLC Non Small Cell Lung Cancer
OS Overall Survival
ORR Objective response rate
PAS Patient Access Scheme
PFS Progression-Free Survival
PH Proportional Hazards
PPS Post-progression survival
PR Partial Response
PRO Patient Reported Outcome
PS Performance Status
PSA Probabilistic sensitivity analysis
PSS Personal and Social Services
PSSRU Personal and Social Services Research Unit
QALY Quality-Adjusted Life Year
QoL Quality of Life
RCT Randomized Controlled Trial
RR Risk Ratio
SAP Statistical Analysis Plan
SD Standard Deviation
SmPC Summary of Product Characteristics
SLR Systematic Literature Review
TKIs Tyrosine Kinase Inhibitors
TTF Time to Treatment Failure
UK United Kingdom
WTP Willingness-To-Pay

13
1 SUMMARY
1.1 Critique of the decision problem in the company’s submission
The company’s decision problem is consistent with the NICE scope. However, the evidence
obtained from the ARCHER 1050 trial presents some deviations from the decision problem and the
ARCHER 1050 trial population is not wholly representative of the UK population.
1.2 Summary of clinical effectiveness evidence submitted by the company
The evidence for the clinical effectiveness of dacomitinib comes from a large multi-centre RCT
which has an active comparator with a tyrosine kinase inhibitor (TKI) (gefitinib), the ARCHER
1050 trial. Median follow-up was 22.1 months (dacomitinib) and 23.0 months (gefitinib) for
progression-free survival (PFS) based on blinded Independent Review Committee (IRC), and 31.1
months and 31.4 months, respectively, for overall survival (OS). A statistically significant
improvement was found in PFS assessed by blinded IRC (the primary outcome) with dacomitinib
compared with gefitinib: median 14.7 months vs 9.2 months, HR 0.59 (95% CI 0.47, 0.74),
p<0.0001.
Median survival improved significantly with dacomitinib compared with gefitinib: median 34.1
months vs 26.8 months, hazard ratio (HR) 0.76 (95% CI 0.58, 0.99), p=0.044. There was no
statistically significant difference in the objective response rate (complete response + partial
response) for dacomitinib (74.9%, 95% CI 68.7, 80.4) compared with gefitinib (71.6%, 95% CI
65.2, 77.4) assessed by blinded IRC, p=0.194. The median duration of response by blinded IRC
review was significantly longer in the dacomitinib arm compared with gefitinib [Kaplan-Meier
estimates of response duration quartiles 14.8 months vs 8.3 months, HR 0.40 (95% CI 0.31, 0.53),
p<0.0001].
Disease-related symptoms assessed by the EORTC QLQ-C30 and EORTC QLQ-LC13 (cough,
dyspnoea, pain in chest, pain in arm or shoulder, pain in other parts, fatigue) reduced in both groups;
only the reduction in chest pain was significantly greater with dacomitinib than gefitinib (-10.24 vs
-7.44, p=0.024).
Treatment-related symptoms were assessed by the EORTC QLQ-C30 and EORTC QLQ-LC13.
Both diarrhoea and sore mouth, worsened significantly more with dacomitinib compared with

14
gefitinib, and these changes were considered clinically meaningful (mean scores diarrhoea: 19.88
vs 7.32, p<0.0001; sore mouth: 15.09 vs 3.51, p<0.0001).
Statistically significant differences in the EQ-5D absolute VAS score and utility index were
observed in favour of gefitinib.
Rates of any all-cause and treatment-related adverse events were similar between dacomitinib and
gefitinib. There were slightly higher rates of any all-cause and any treatment-related grade 3
adverse event and serious adverse events with dacomitinib (based on observation of the proportions
only), and dose reductions or temporary discontinuations were more frequently observed with
dacomitinib.
1.3 Summary of the ERG’s critique of clinical effectiveness evidence submitted
The CS systematic review of clinical effectiveness was generally well executed. Two studies that
the CS excluded from their broader review may have been eligible, however, these omissions would
not have affected the results seen. Overall the ERG considered there to be a low chance of
systematic error in the findings of the review.
The main clinical evidence for dacomitinib was drawn from the ARCHER 1050 trial which was a
multi-centre study comparison with gefitinib. The trial had a high risk of performance bias (owing
to the open-label design) but low risks of detection and attrition bias.
The ARCHER 1050 trial presents a number of potential issues in terms of representativeness to the
population of England and Wales. There were no UK sites participating in the trial and only *** of
sites were from European countries. There was a high proportion of Asian participants, the
population was limited to two epidermal growth factor receptor (EGFR) mutations only (albeit the
most common ones), and the trial excluded people with brain metastases. In addition, there are
imbalances in potential prognostic factors between arms.
The ERG have no concerns about the analysis sets used in the ARCHER 1050 trial or with the
censorship and management of missing data used. The outcome measures appear appropriate. With
regard to the trial statistics, the CS did not justify why a one-sided p-value was used for PFS and a
two-sided p-value for OS and it is unclear to the ERG why there were different data time cut-off
points for these two key analyses. The company did not provide significance thresholds alongside
p-values presented throughout their submission, and it was unclear to the ERG whether formal
SUPERSEDED See erratum

15
hypotheses were being tested or whether conclusions should be drawn, particularly for the sub-
group analyses. The ERG considers that caution is required in the interpretation of the analysis of
OS, as the proportional hazards assumption was violated. For patient reported outcomes, there was
no adjustment for multiple comparisons.
The CS undertook a network meta-analysis (NMA) comparing dacomitinib with afatinib. The ERG
agrees that other than the LUX-Lung 7 trial of afatinib versus gefitinib, there were no other relevant
trials for the comparison. The CS adequately described the methods of their NMA approaches and
provides a reasonable justification for using the fractional polynomial (FP) analysis. Despite this,
the ERG has concerns over the use of the FP analysis with respect to the extrapolations for the
survival outcomes but also because there are no detailed results or interpretation of the findings of
the FP analysis.
In addition, the CS does not adequately assess the included study populations for transitivity and
the ERG considers that the transitivity assumption may be violated. Finally, the CS does not present
results of the indirect comparison between dacomitinib and afatinib. Although caution is
recommended in the interpretation of the ERG analyses, these show no significant differences
between the two respective treatments for PFS or OS.
1.4 Summary of cost-effectiveness evidence submitted by the company
The CS included a systematic review of economic evidence, a review of evidence on resource use
and costs, a separate review to identify studies that measure health-related quality of life (HRQoL)
in people with non-small-cell lung cancer (NSCLC) patients, and an electronic partitioned survival
model built in a widely available spreadsheet application (Microsoft Excel ®).
The search for cost-effectiveness studies comparing the use of dacomitinib against other treatments
did not identify any relevant references. The majority of the studies identified evaluated the cost-
effectiveness of other treatments. Few elevant studies reporting resource use and costs were
identified.
The company constructed a partitioned survival model to trace a cohort of treatment naïve patients
with locally advanced or metastatic EGFR-positive NSCLC who may undergo treatment with
dacomitinib compared to gefitinib, erlotinib or afatinib. Partitioned survival modelling considers
the PFS and the OS curve directly, with the time in post-progression calculated using the difference
SUPERSEDED See erratum

16
in area between the two curves. The company’s model comprised three health states: progression-
free, post-progression (progressed disease) (PD) and dead.
The model started from a hypothetical cohort of people reflective of the participants in the
ARCHER 1050 trial,1 all of whom began in the progression-free (PF) health state. Over time,
people were at risk of progression or death. Transitions between health states was unidirectional
and occurred at the end of each 28-day cycle, where people remained in the same health state or
progressed. In each cycle, people incurred costs and accrued benefits depending on the health state
they occupied. A half-cycle correction was applied in the base-case and the model concluded at a
15-year time horizon.
The company modelled PFS for gefitinib and erlotinib using a generalised gamma curve fitted to
the gefitinib arm of ARCHER 1050. They then performed a FP NMA to obtain time-varying hazard
ratios for afatinib and dacomitinib and apply these to the gefitinib extrapolation. The ERG found
the company’s predictions to be pessimistic and preferred a log-normal extrapolation and
alternative adjustments for the comparators.
Similarly, for OS the company used a generalised gamma curve for gefitinib and applied HR
obtained from FP NMA for the dacomitinib and afatinib. The ERG argues for a log-logistic
extrapolation for gefitinib and suggests assuming a HR of 1 from 3 years onwards for the
comparators.
Health-related quality of life values for the pre-progression health states were derived from the EQ-
5D collected from the ARCHER 1050 study,1 while utility values for the post-progression health
state were obtained from the literature.2 On clarification, the company provided utility values
collected from participants in ARCHER 1050 trial1 who were in the post-progression health state.
The ERG preferred the use of these utility values; hence they were included in the ERG’s base-
case. The impact of treatment related adverse events was not accounted for directly in the
company’s base-case analysis, as it was assumed that these would have been captured by EQ-5D
data collected in the trial. However, the ERG argues that it is unlikely that quality of life decrements
associated with treatment related AEs are captured by the EQ-5D, unless it is arranged for the
instrument to be administered at the same time of these events. Utility decrements (disutilities)
were included in the ERG’s base-case for treatment related adverse events.
SUPERSEDED See erratum

17
Total cost estimated in the model comprised of cost of treatments (drug acquisition and drug
administration), subsequent treatment and administration costs, resource use and costs associated
with each health state, treatment related to adverse events and terminal care costs. The company’s
base-case analysis (presented in the main CS report) was based on a proposed price discount in the
form of a PAS for dacomitinib and speculations on the PAS discounts for the comparators. The
costs included in the model were in line with the NHS and PSS perspective, were appropriately
discounted and were reported in current prices. Though there were no discrepancies in the costs
included in the analysis, there were concerns relating to costs that might have been excluded from
the analysis. Notably, resource use and costs associated with unscheduled hospital admissions,
magnetic resonance imaging scans for suspected brain metastases or cord compression and costs
associated with the diagnosis of T790M mutation (personal communication with clinical expert).
Excluding these costs may potentially lead to an underestimate of the true costs associated with
managing/treating people with NSCLC.
The company presented results for two comparisons: (i) dacomitinib with PAS discount versus
comparators with PAS discount calculated/assumed by the company (in the main CS document);
(ii) dacomitinib at list price versus comparators at list price (in the CS Appendix).
In relation to comparison (i), the company’s base-case deterministic results suggests that
dacomitinib was the most costly and most effective treatment option, with an incremental cost-
effectiveness ratio (ICER) of approximately ******* per quality-adjusted life year (QALY).
Results from the PSA indicated that at a willingness to pay (WTP) threshold of £30,000 per QALY
dacomitinib has a **** probability of being cost-effective. The company’s sensitivity analysis
results showed that the monthly discount rate applied to costs and benefits were the key drivers of
the cost-effectiveness analysis. With regards to comparison (ii) above, the ICER for the comparison
between dacomitinib versus erlotinib was approximately ******* per QALY gained, with a
probability of dacomitinib being cost-effective at £30,000 per QALY being ****.
1.5 Summary of the ERG’s critique of cost-effectiveness evidence submitted
The ERG did not identify any major errors in the company’s model. The results reported in the
company submission (CS) reflected those in the model submitted. However, the following concerns
and uncertainties were noted:

18
The modelling of PFS and OS of gefitinib was pessimistic, potentially underestimating the
number of QALYs and costs for all comparators.
The extrapolation of dacomitinib and afatinib was reliant on results from the FP NMA, the
majority of which were not considered plausible by the ERG.
We noted that there were some resource use and costs that have been excluded from the
analysis: unscheduled hospital admissions, MRI scans for suspected brain metastases or
spinal cord compression and costs associated with the diagnosis of T790M mutation.
Utility values obtained from the EQ-5D-3L instrument administered to ARCHER 1050
trial participants were appropriate for use in the model although the company only used
these for the PF state. Progressive disease (PD) values from the best alternative sources
found in the literature were used. However, as ARCHER 1050 trial utility data were
available for PD, the ERG considered these data more appropriate to use within the
company’s base-case, an approach that is more aligned with NICE DSU
recommendations.3
HRQoL reductions associated with AEs and ageing were not incorporated in the model for
the base-case analysis which the ERG believe is an important omission. The ERG believes
that it is appropriate to include these adjustments in the model. as well as using the utility
values obtained from the trial.
Errors and concerns were addressed in the ERG’s preferred base-case analysis, and uncertainties
were explored in various scenario analyses.
1.6 ERG commentary on the robustness of evidence submitted by the company
1.6.1 Strengths
The company conducted a systematic review of clinical effectiveness evidence, which is deemed
to be generally methodologically sound and is likely to have captured the evidence base adequately.
A single RCT was included that compared dacomitinib with an active comparator (gefitinib) of
relevance to the NICE scope. The trial was of reasonable size and quality and assessed key clinical
and safety outcomes and was appropriately summarised in the CS.

19
The company’s model is logical, in line with other models for this condition, and depicts the clinical
pathways for treating people with EGFR+ advance/metastatic NSCLC fairly accurately. In general,
the process of identifying and justifying the choice of key model inputs was transparent and
congruent with established methods. The economic analysis conforms to the NICE reference case
in that the perspective, discount and the lifetime horizon is considered to be long enough to capture
the costs and benefits of dacomitinib, gefitinib, erlotinib and afatinib. The majority of the
assumptions made in order to have a workable model appear to be appropriate. Finally, the results
presented in the CS report are consistent with the the results and graph outputs generated in the
company’s spreadsheet model.
1.6.2 Weaknesses and areas of uncertainty
Clinical effectiveness
There was no direct evidence for dacomitinib compared to the other scoped comparators erlotinib
or afatinib. The CS assumed equivalence for gefitinib and erlotinib which the ERG considers
reasonable given evidence seen but an indirect comparison was required to compare dacomitinib
with afatinib. This indirect comparison has a number of areas of uncertainty:
The CS does not adequately assess the included study populations for transitivity and the
ERG considers that the transitivity assumption may be violated.
A FP analysis is used in the CS as the main analysis and while this appears reasonable there
are no detailed results or interpretation of the findings of the analysis.
Outcomes were restricted to OS and PFS and no comparison was made on adverse events.
The CS does not present results of the indirect comparison between dacomitinib and
afatinib.
The ERG has concerns over the use of the FP analysis with respect to the extrapolations
for the survival outcomes.
The evidence presented in the CS may not be wholly applicable to the population in England and
Wales for a number of reasons. The population was limited to the two most common EGFR
mutations and excluded people with brain metastases and there is consequently an evidence gap

20
about the effects of dacomitinib in these groups. There was also high proportion of Asian
participants compared to European participants. Asian populations have higher rates of EGFR
mutations and while there is no consistent evidence for the influence of ethnicity on outcomes in
EGFR mutation positive NSCLC, including from the companies own sub-group analyses, the ERG
note uncertainty around the degree of generalisability in the evidence to the population seen in
clinical practice in the NHS.
Cost-effectiveness
The following weaknesses and limitations, which directly or indirectly feed into the economic analysis, were identified by the ERG:
The parametric models used to extrapolate progression-free and overall survival for
gefitinib were considered to be too pessimistic, thus underestimating the expected number
of QALYs and costs incurred for all treatments
The extrapolations for dacomitinib and afatinib were reliant on the results from the FP
NMA.
The negative impact on HRQoL (expressed in the form of disutilities) associated with AEs
have been under-represented in the base-case as specific decrements have not been
included and the rationale that trial data would have captured disutility is unfounded.
No adjustment for age-related disutilities in the company’s base-case analysis.
Resource use and costs may have potentially been underestimated.
1.7 Summary of exploratory and sensitivity analyses undertaken by the ERG
1.7.1 Exploratory analyses related to clinical effectiveness
The ERG has undertaken an exploratory indirect comparison of dacomitinib and afatinib via a
traditional network meta-analysis (NMA). Although caution is required in the interpretation of this
analysis (potential transitivity assumption violation and proportional hazards assumption violation)
the ERG undertook this analysis as no comparison was presented by the CS. The ERG undertook
a fixed-effect NMA using a frequentist framework and generated the surface under the cumulative
ranking curve (SUCRA) to rank each intervention. There were no statistically significant

21
differences between dacomitinib and afatinib for OS or PFS, although there were greater SUCRA
values for dacomitinib.
The ERG has also tabulated data for key adverse events for afatinib from the LUX-Lung 7 trial
which compared afatinib with gefitinib. The ERG considers that on balance there is no clear
distinction between the adverse event profiles for dacomitinib and afatinib.
1.7.2 Exploratory analyses related to cost-effectiveness
The critique of submitted evidence focuses on analyses presented in the CS submission, namely (i)
dacomitinib with PAS discount versus comparators with PAS discount calculated/assumed by the
company (in the main CS document); (ii) dacomitinib at list price versus comparators at list price
(in the CS Appendix). During communication with the NICE Technical Team overlooking this
appraisal, it was suggested that a further comparison should be carried out between dacomitinib
(applying the company’s PAS discount) versus the gefitinib, erlotinib and afatinib (at list prices).
The ERG undertook this comparison, which formed the basis for applying the ERG preferred values
and assumptions. These were:
For PFS, used the log-normal parametric curve for gefitinib with the results from the FP
NMA to derive the survival for the other comparators (P=0.5, P2=1). Assumed afatinib
PFS to be equal to the mean PFS of dacomitinib and gefitinib from 36 months onwards
For OS, used the log-logistic parametric curve for gefitinib with the results from the FP
NMA, and assumed equal efficacy, on the hazard scale, from 36 months onwards
Included disutilities associated with adverse events
Used the post-progression utility value from the ARCHER 1050 trial
Included age-related disutilities from the study published by Ara and colleagues4
Correction made to how the PAS for gefitinib had been applied
Under these assumptions, dacomitinib dominated gefitinib and afatinib. When compared to
erlotinib, dacomitinib had an ICER of approximately ******* per QALY. At a willingness-to-pay
threshold of £30,000 per QALY, dacomitinib had a ***** probability of being cost-effective.

22
Results from the ERG’s scenario analysis showed that using the results from the traditional NMA
for survival had the greatest impact to the ERG’s base-case ICER.
The company’s base-case deterministic results reported in the CS inevitably differ to those
estimated by the ERG in their base case analysis, given the fact that the ERG’s base-case results
relate to the comparison between dacomitinib with PAS discount versus prices for the comparators.
The ERG has also produced a Confidential Appendix comparing dacomitinib (with PAS discount
suggested in the CS) against erlotinib, gefitinib and afatinib (with confidential PAS discounts
ascertained by NICE).

23
2 BACKGROUND
2.1 Critique of company’s description of underlying health problem.
The CS presents evidence on the clinical effectiveness and cost-effectiveness of dacomitinib for
untreated locally advanced or metastatic non-small cell lung cancer (NSCLC) with epidermal
growth factor receptor (EGFR) mutations. The CS states EGFR mutations are prevalent in 5-50%
of NSCLC cases with rates depending on factors including ethnicity, gender and smoking status;
the ERG clinical advisor believes the upper limit would be 40%. The highest rates of EGFR
mutations are seen in people of Asian descent, female gender, non-smokers and with
adenocarcinoma histological subtype. The ERG clinical advisor notes that despite accumulating
data it is difficult to assess the precise contribution of these four factors and, with different methods
for the assessment of EGFR mutation status used, this is why there are wide estimates of prevalence.
In Caucasian populations rates are in the region of 10-20%. The ERG agrees that the most common
EGFR mutations are exon 19 deletion (del19) and exon 21 L858R substitutions (L858R). The CS
says these comprise 45-82% and 30% of EGFR mutations respectively (although the latter correctly
ranged from 29%-39% in clarification response A4) and that between them these two mutations
constituted approximately 80-90% of EGFR mutations in adenocarcinomas5(additional references
were provided in response to clarification A46, 7). Evidence identified by the ERG suggests this rate
may possibly be higher.8
The ERG has identified no concerns regarding the description of the prognosis of those with
advanced lung cancer or the description of the burden of symptoms and the impact on quality of
life of people with lung cancer. Prognosis in EGFR-positive NSCLC is slightly better than for
general NSCLC and this is in part due to factors such as differences in natural history and
characteristics of patients such as a younger age in this population.
2.2 Critique of company’s overview of current service provision
The CS briefly summarises the treatment pathway for people with EGFR mutation positive locally
advanced or metastatic NSCLC, discussing first line and subsequent lines of therapy. Dacomitinib
is being positioned as a first line treatment option and the ERG clinical expert agrees that the
summary in the CS is accurate. Currently NICE recommends the tyrosine kinase inhibitors (TKIs)
afatinib, erlotinib and gefitinib as first line treatment options, and these are relevant comparators in
the CS decision problem (see Section 1.1). In some instances when confirmation of EGFR mutation

24
status is delayed a platinum-based doublet chemotherapy is used. Figure 1 (cropped from CS Figure
2) illustrates the proposed position of dacomitinib in the treatment pathway. The ERG clinical
advisor confirmed that there is individual preference for which of the current TKIs to use in clinical
practice, but that erlotinib is still favoured in the UK by many clinicians and that afatinib is more
commonly used in Europe. Dacomitinib and afatinib are second-generation TKIs. The CS states
that as a second-generation TKI with irreversible binding to the receptor, dacomitinib has a longer
duration of effect than the first generation TKIs. It must be noted that, although osimertinib
(Tagrisso ®, AstraZeneca) is not a relevant comparator in the present appraisal, the ERG believes
that is potentially an alternative treatment option as it is also indicated as first line therapy in EGFR-
positive NSCLC patients.
Figure 1: Proposed future position of dacomitinib in the treatment pathway of advanced EGFR+ NSCLC.
†Patients with delayed confirmation of their EGFR-TK mutation-positive status may receive a platinum based doublet chemotherapy regimen in the first-line. ‡Chemotherapy treatment with pemetrexed in combination with either cisplatin or carboplatin is commonly
used in clinical practice. For those people for whom treatment with a platinum drug is not appropriate,
NICE clinical guidelines recommend single agent therapy with either docetaxel, gemcitabine, paclitaxel or
vinorelbine.

25
3 Critique of company’s definition of decision problem
3.1 Decision problem
The company’s decision problem is as follows:
Population: People with untreated locally advanced or metastatic NSCLC with EGFR activating mutation(s).
Intervention: dacomitinib
Comparators: afatinib, erlotinib, gefitinib
Outcomes: overall survival (OS); progression-free survival (PFS); overall response rate (ORR); duration of response (DoR); adverse events (AE); health-related quality-of-life (HRQoL).
There are no subgroups in the NICE scope or in the company decision problem, and there are no
special considerations. The company’s decision problem is consistent with the NICE scope. The
evidence presented from the ARCHER 1050 trial has some deviations from the decision problem
as summarised in Table 1.
Table 1: Differences between the decision problem and the evidence provided in the CS.
Issue ERG comments
Population
The ARCHER 1050 trial
population have either exon 19
deletion (del19) or exon 21
L858R (L858R) substitutions.
This is a narrower population than all EGFR mutations as covered
in the scope. Clarification A10 confirms that these were the
established activating mutations at the time of design of the
ARCHER 1050 trial. The ERG clinical advisor states this has been
a common eligibility criteria in clinical trials. These two mutations
make up approximately 90% of EGFR mutations (clarification
response A4) but it is possible that the other mutations have less
favourable responses to treatment. The European Medicines
Agency (EMA) have published a positive opinion in January 2018
for dacomininib monotherapy for the first-line treatment of adult
patients with locally advanced or metastatic NSCLC with EGFR
activating mutations.9 The ERG notes that the FDA approval for
dacomitinib is in EGFR del19 or L858R substitutions specifically.10
SUPERSEDED See erratum

26
The ARCHER 1050 trial
excluded people with brain
metastases.
Estimates vary but clinical advice to the ERG suggests that
approximately 15% of NSCLC EGFR mutation positive cases may
have been excluded from the trial because they had brain
metastases. Brain metastases can adversely affect prognosis and the
exclusion of these people may limit the generalisability of the
results of the trial to the population of England and Wales.
However, trials in other TKIs have also excluded participants with
brain metastases and these treatments are still used in some clinical
situations in people with brain metastases. The ERG clinical advisor
considers that this exclusion was reasonable; however as 20-30% of
patients have clinical or radiological evidence of central nervous
system disease the ERG notes this limitation in current evidence.
The ARCHER 1050 trial
population included a large
proportion of Asian participants
(77% of the total).
Results may not be wholly applicable to the population in England
and Wales. Asian populations have higher rates of EGFR mutations.
There is no consistent evidence for the influence of ethnicity on
outcomes in EGFR mutation positive NSCLC. This issue is
discussed in more detail below.
Comparators
There is no direct comparison
with afatinib or erlotinib.
Comparison with afatinib is via an
indirect comparison using
gefitinib as the common
comparator. Comparison with
erlotinib is made on the basis of
the assumption of similarity
between gefitinib and erlotinib.
Based on the known evidence the ERG considers the assumption of
equivalence to be reasonable for efficacy (case made by the CS and
see Section 4.4) and adverse events (ERG clinical advisor notes that
there are differences in profile but severity overall is similar).
The ERG considers the question over the generalisability of the population in the ARCHER 1050
trial to the population of England and Wales to be a central question. The difference in the ethnic
mix between the ARCHER 1050 trial and the likely NHS population was acknowledged in the CS
(CS B.2.13.3). The CS stated in B.2.7.2 that for OS results were ‘numerically’ in favour of
dacomitinib in both the Asian and non-Asian subgroups of ARCHER 1050, although the ERG notes

27
(see Section 4.2.3 for more details) that there were no statistically significant effects in either of
these subgroups. For PFS on the other hand, the effect was statistically significant in the Asian
subgroup but not the non-Asian subgroup. The CS acknowledged that these data were from small
and likely underpowered subgroup analyses.
The ERG asked a number of points of clarification with regard to this issue and in particular to
assess whether dacomitinib does have a different effect in Asian and non-Asian populations. This
was to allow the ERG to consider whether the non-Asian population (23% of the ARCHER 1050
population) would be more relevant to represent the population in England and Wales than the
predominantly Asian population in the trial.
The CS section B.2.13.3 states that “clinical expert opinion suggested that studies with a
predominately Asian population tend to mirror what is seen in Caucasian patients”. In response to
clarification question A6, the company qualified this statement by further discussion with UK
clinicians which clarified that there is no consensus as to whether ethnicity has a role in prognosis,
a view that is shared with the ERG clinical advisor. The company also summarised sub-group
analyses of PFS from two clinical trials of afatinib in which there was no clear direction of effect
in Asian and non-Asian subgroups.
To explore the sub-group analyses presented by the CS in more detail the ERG requested Kaplan-
Meier (KM) plots of OS and PFS in the Asian and non-Asian populations in ARCHER 1050. The
company provided these plots and the related median survival estimates and hazard ratios in
clarification response A8. These HRs concur with those in the CS Figures 12 and 14 respectively.
In both analyses there was a clinical benefit favouring dacomitinib but there was a larger point
estimate of HR (indicating less benefit) in non-Asian participants than Asian participants for PFS
and a larger point estimate in Asian participants than non-Asian participants for OS. Due to the
small patient numbers in these subgroups, the ERG concur with the company that the data should
therefore be interpreted with caution. However due to the ongoing debate of ethnicity and treatment
efficacy, the ERG notes that there is uncertainty as to whether the observed effectiveness of
dacomitinib compared to gefitinib could be expected to be repeated in the UK population.
The ERG reiterates that the population of the ARCHER 1050 trial lack generalisability to the
population included in the NICE scope, however, that there is no compelling evidence to suggest
that the non-Asian population subgroup data should be used instead of the entire trial population.

28
4 CLINICAL EFFECTIVENESS
4.1 Critique of the methods of review(s)
The CS includes a systematic review undertaken to identify published literature on the clinical
effectiveness of all first-line treatments in EGFR+ NSCLC (B.2.1.1 and appendix D.1).
4.1.1 Searches
Broad searches were undertaken in relevant databases and other appropriate sources, such as
reference lists of identified systematic reviews, relevant conferences and a trial register. No record
of the search of the trial register, Clinicaltrials.gov, was included, but this and a list of results prior
to selection was provided in response to clarification question A3, although no search date is given.
The CS (B.2.1.1) states that searches were undertaken on Oct 2017 and updated in Aug 2018. There
appears to be a very slight discrepancy in reporting search dates as the tables in Appendix D give
a date of 22 September 2017 for the original searches and no dates for the 2018 update searches.
Both the original and update searches were limited to documents published from 2004 onwards and
in the English language. Searches included appropriate search terms for the intervention and
comparators in the NICE scope (and other comparators), and for NSCLC. In the CS appendix, in
table 57 (Search strategy for MEDLINE (Ovid)), there appears to be a small error in reporting
relating to exactly which line numbers were combined at steps 26 to 29 (for example, line 27 says
‘23 not 27’, rather than ‘23 not 26’) and a line number is missing between steps 5 and 6. Other
tables do not include this reporting error. The use of the filter ‘Studies with Results’ and to a lesser
extent the condition term ‘Non Small Cell Lung Cancer’ in the search strategy for
ClinicalTrials.gov was not appropriate. The ERG undertook an independent targeted search of
ClinicalTrials.gov and checked the reference list of a recent NMA.11
ClinicalTrials.gov, searched by the ERG 7th February 2019
130 Studies found for: ( EGFR ) AND ( dacomitinib OR gefitinib OR erlotinib OR afatinib ) AND
(random OR randomized OR randomised ) | Active, not recruiting, Completed, Suspended,
Terminated, Withdrawn, Unknown status Studies | Lung Cancer OR NSCLC
The ERG identified four studies that should have been identified by the company’s searches but
were not listed in the submission (Lilenbaum,12 Chen,13 Xing,14 Soria15). Two of these would not
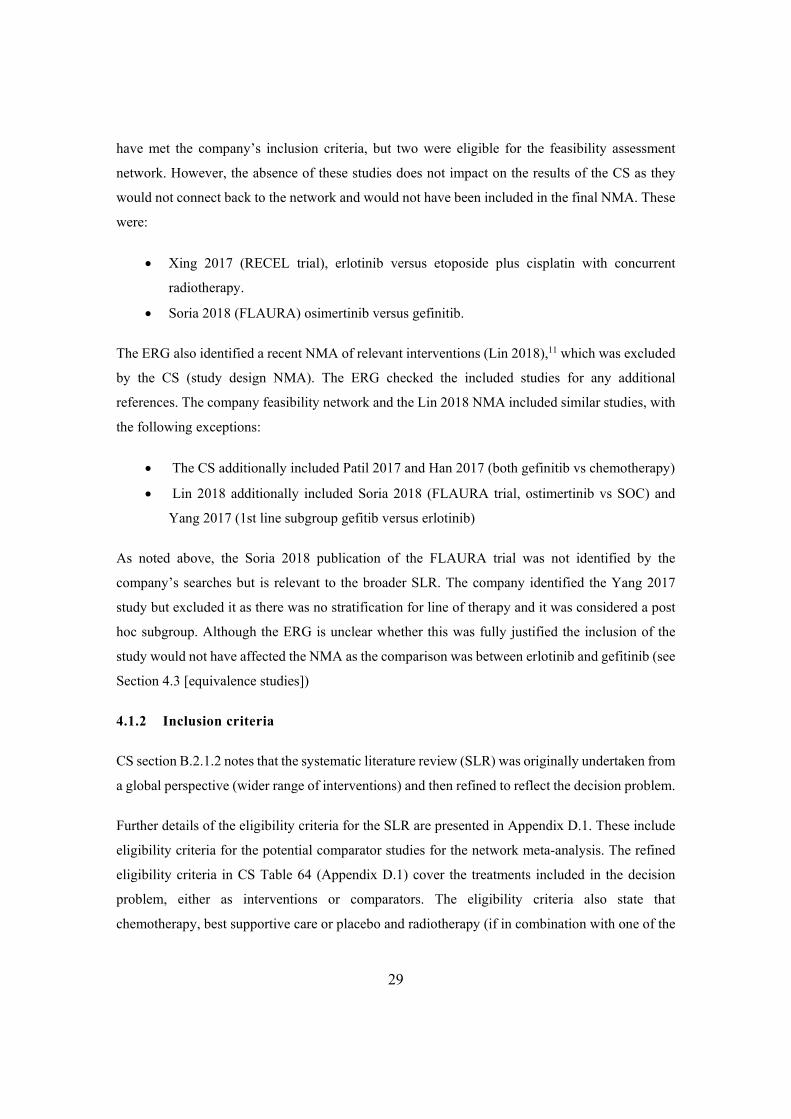
29
have met the company’s inclusion criteria, but two were eligible for the feasibility assessment
network. However, the absence of these studies does not impact on the results of the CS as they
would not connect back to the network and would not have been included in the final NMA. These
were:
Xing 2017 (RECEL trial), erlotinib versus etoposide plus cisplatin with concurrent
radiotherapy.
Soria 2018 (FLAURA) osimertinib versus gefinitib.
The ERG also identified a recent NMA of relevant interventions (Lin 2018),11 which was excluded
by the CS (study design NMA). The ERG checked the included studies for any additional
references. The company feasibility network and the Lin 2018 NMA included similar studies, with
the following exceptions:
The CS additionally included Patil 2017 and Han 2017 (both gefinitib vs chemotherapy)
Lin 2018 additionally included Soria 2018 (FLAURA trial, ostimertinib vs SOC) and
Yang 2017 (1st line subgroup gefitib versus erlotinib)
As noted above, the Soria 2018 publication of the FLAURA trial was not identified by the
company’s searches but is relevant to the broader SLR. The company identified the Yang 2017
study but excluded it as there was no stratification for line of therapy and it was considered a post
hoc subgroup. Although the ERG is unclear whether this was fully justified the inclusion of the
study would not have affected the NMA as the comparison was between erlotinib and gefitinib (see
Section 4.3 [equivalence studies])
4.1.2 Inclusion criteria
CS section B.2.1.2 notes that the systematic literature review (SLR) was originally undertaken from
a global perspective (wider range of interventions) and then refined to reflect the decision problem.
Further details of the eligibility criteria for the SLR are presented in Appendix D.1. These include
eligibility criteria for the potential comparator studies for the network meta-analysis. The refined
eligibility criteria in CS Table 64 (Appendix D.1) cover the treatments included in the decision
problem, either as interventions or comparators. The eligibility criteria also state that
chemotherapy, best supportive care or placebo and radiotherapy (if in combination with one of the

30
included interventions) were potential comparators. These are not scoped comparators but were
included to permit possible links within the evidence network.
Studies in adults with locally advanced or metastatic EGFR-positive NSCLC that had not
previously been treated were included. In CS Appendix D.1.8.1 it states that EGFR was required
to have been molecularly selected prior to randomisation. This resulted in exclusions of two
relevant trials, IPASS and First-SIGNAL, which reported post-hoc EGFR mutation positive
subgroup data. The ERG agrees with these exclusions: IPASS compared gefitinib with carboplatin
plus paclitaxel and First-SIGNAL compared gefitinib with gemcitabine plus cisplatin and the
EGFR-positive groups were subgroups in both studies. In addition, these studies would not have
connected to the network for the comparison of dacomitinib versus gefitinib, erlotinib or afatanib.
One relevant trial of dacomitinib versus gefitinib, ARCHER 1050, was included.1
As discussed in Section 4.1.1 the ERG notes that one study excluded by the company for
intervention (Zhao 2017: erlotinib as first-line therapy + docetaxel and cisplatin as second-line
therapy vs docetaxel and cisplatin as first-line therapy plus erlotinib as second-line therapy)16
actually reported overall response rates after first-line therapy. This would therefore have been
eligible for the broader SLR and feasibility assessment. In addition, the CS also excluded a study
comparing gefitinib with erlotinib (Yang 201717) because data for first line therapy was from a
post-hoc subgroup only. This subgroup may also have been of relevance in the broader SLR but
the ERG does not consider this omission will have affected the results or conclusions of the
company network meta-analysis (NMA).
Ten comparator trials were included to form a network (presented in CS Figure 15), although most
did not connect dacomitinib to the three other treatments of relevance to the decision problem.
These trials were summarised in CS Table 65 (Appendix D.1) and were:
Three trials (ENSURE, EURTAC and OPTIMAL18-20) of erlotinib vs. chemotherapy;
Four trials (Han 2017, NEJ002, Patil 2017 and WJTOG340521-24) of gefinitinb vs.
chemotherapy;
Two trials (LUX-Lung 3 and LUX-Lung 625, 26) of afatinib vs. chemotherapy
One trial (LUX-Lung 727, 28) of afatinib vs. gefitinib.
CS Table 66 (Appendix D.1) provides summary details of these trials, although their respective
population characteristics are not presented.

31
However, of these potential comparator studies only one study was actually used in the comparison
because there were no links between the other studies in the network (discussed in Section 4.3).
This study, the LUX-Lung 7 trial27, 28 included participants who would match the decision problem
of the current appraisal (previously untreated adults with stage IIIB or IV NSCLC and EGFR
mutation positive). Appendix D.1.7 lists reference details for included studies and excluded studies
with reasons.
A PRISMA style flow-diagram with numbers is presented. Not all excluded studies were available
in the original CS, but these were subsequently provided in response to clarification request A2. A
two-stage study selection process was undertaken (titles and abstract screening, full paper
screening) by two independent reviewers with arbitration from a third reviewer if necessary, for the
main SLR. The CS does not state how studies were screened out of the network but the exclusions
appear appropriate.
4.1.3 Critique of data extraction
The approach to the data extraction is appropriate (data extraction was by two independent, blinded
reviewers and after reconciling differences a third reviewer could be included to reach consensus
for any remaining discrepancies, data were extracted in to a pre-specified extraction form).
4.1.4 Quality assessment
The company assessed the quality of the ARCHER 1050 RCT using NICE recommended criteria
(CS Table 15) and the Cochrane risk of bias tool (CS Appendix Table 75). There were some
differences in the company’s responses between these tools, which are summarised in Table 2. The
ERG generally agrees with the company’s judgements, and notes the potential performance bias
(systematic differences in care or in exposure to other factors) that may arise from the open-label
design. The risk of detection bias was considered to be low due to blinded IRC review of PFS and
ORR (details of how blinding was achieved was provided in clarification response A12).
There was a higher proportion of women (64.3% vs 55.6%) and people with ECOG PS 0 (33% vs
28%) in the dacomitinib arm compared with the gefitinib arm (Section 4.2). The reason for these
imbalances is unclear and could be due to selection bias (despite appropriate procedures in place)
or could be due to chance. The CS states that the difference in gender was not unexpected given
the higher frequency of EGFR mutations among females than males. However, this does not explain
SUPERSEDED See erratum

32
the imbalance since EGFR mutations were required for inclusion and randomisation should have
ensured an even distribution between arms. Gender is a potential prognostic factor (see Section
4.2.1). The CS states that generally there is no difference in outcomes between ECOG PS 0 and 1,
citing ARCHER 1050 as evidence. The ERG’s clinical advisor noted that PS 0 and 1 are usually
grouped together in trials, however there is evidence overall that ECOG PS may be an independent
prognostic factor (see Section 4.2). The risk of selection bias is therefore uncertain.
The company gives the trial an overall judgement of high risk of bias due to the open-label design.
The ERG agrees with this as the trial has a high risk of performance bias (differences between
groups in care provided or in exposure to other factors), but notes that the risk of detection bias and
attrition bias is low.
Table 2: Risk of bias assessment of ARCHER 1050.
Assessment criteria Company response ERG response (Cochrane tool) NICE criteria
(CS Table 15)Cochrane tool (CS Appendix Table 75)
Method used to generate random allocations adequate?
Yes Low risk Low risk
Allocation adequately concealed?
Not applicablea Open label
study Low risk Low risk
Groups similar at the outset of the study in terms of prognostic factors?
Yes Low risk Imbalance in
gender and PSb
Care providers and participants blind to treatment allocation?
Not applicable Open label
study
High risk High risk
Outcome assessors blind to treatment allocation?
Low risk Low risk
Unexpected imbalances in drop-outs between groups?
No Low risk d
Low risk d Differences explained Were the statistical analyses
undertaken appropriate? c Yes
Evidence to suggest authors measured more outcomes than they reported?
No Low risk Low risk
Other bias NR Unclear Sponsored by pharmaceutical
company
Low risk No other bias
apparent
Overall judgement NR High risk
Open-label High risk
NR, not reported. aThe company’s response is referring to masking of treatment, rather than concealment of the allocation sequence, which the ERG considered appropriate as a central interactive web response system was used. b
Potential prognostic factors (although not an item on the Cochrane tool). cQuestion as worded in CS Table 15; the full question should be ‘Did the analysis include an intention to treat analysis? If so, was this appropriate and were
SUPERSEDED See erratum

33
appropriate methods used to account for missing data?’ dCochrane risk of bias criterion: Attrition bias due to amount, nature or handling of incomplete outcome data.
4.1.5 Overall quality of the CS SR
The ERG’s appraisal of the CS systematic review of clinical effectiveness is summarised in Table
3. The systematic review processes were well documented and appear reasonable. Although the
evidence presented deviates from the CS decision problem (Section 3), there is a low chance of
systematic error in the systematic review.
Table 3: ERG QA of the CS SR.
CRD Quality Item; score Yes/No/Uncertain with comments
ERG response
1. Are any inclusion/exclusion criteria reported relating to the primary studies which address the review question?
Yes. Eligibility criteria are presented and appear appropriate.
2. Is there evidence of a substantial effort to search for all relevant research?
Yes. Searches were reasonably comprehensive
3. Is the validity of included studies adequately assessed?
Yes. The ERG generally agrees with the company’s judgements
4. Is sufficient detail of the individual studies presented?
Yes. The CS presents sufficient detail.
5. Are the primary studies summarised appropriately?
The CS summarises key characteristics of the relevant trials and the results
adequately.
4.2 Critique of trials of the technology of interest, their analysis and interpretation
The evidence for dacomitinib is provided by a single pivotal RCT. ARCHER 1050 (NCT01774721)
is a company-sponsored phase III, multicentre, open-label RCT comparing dacomitinib with
gefitinib. Summary details of the trial are provided in CS section B2.3 to B2.5 and appendices D2
to D4. The trial is reported in two full publications (Wu 2017,1 Mok 201829) and the outcomes are
consistent with the NICE scope. The data cut-off for for PFS was July 2016 and for overall survival
was February 2017. It is not clear to the ERG why the PFS data cut was not updated at the time of
the OS analysis (see Section 5.2.6 for further details).
The trial was conducted across 71 sites in seven countries, but these did not include the UK (China,
Spain, Italy, Japan, Republic of Korea, Poland, Hong Kong). The proportion of participants from
European sites was provided in clarification response A11 (*****************). Over three-
quarters of the trial participants were of Asian ethnicity and therefore the trial was not representative

34
of the UK population in this regard (see Section 3, and clarification response A7). The prevalence
of EGFR mutations is influenced by ethnicity, with higher rates in Asian populations; the
implications of this are discussed further in Section 4.6.
The population included in the trial was people with locally advanced or metastatic newly
diagnosed, treatment-naïve NSCLC or with recurrent NSCLC. Those with recurrent disease were
required to have a minimum of 12 months disease-free interval between completion of systemic
therapy and recurrence of NSCLC and must have only completed neoadjuvant/adjuvant therapy
previously (prior anti-cancer systemic treatment of early, locally advanced, or metastatic NSCLC,
was a reason for exclusion). The trial clinical study report (CSR) shows that *** had recurrent
disease in each arm
(*****************************************************************************
*****************************************).
Previous radiotherapy for non-target lesions and systemic therapy completed with at least 12
months disease-free interval prior to recurrence was allowed.
Inclusion was limited to people with the del19 or L858R EGFR-activating mutations. People with
both mutations or with other EGFR mutations were excluded because the implication of double
mutation on clinical outcomes was not clear at the time the trial commenced (detail provided in
clarification response A10). Although these account for 80-90% of mutations (see Section 2.1), that
leaves a proportion of EGFR mutations for which there is no evidence on the effectiveness of
dacomitinib. Clinical expert advice to the ERG noted that these other mutations have variable
response to different TKIs in preclinical studies, and that del19 mutations have better outcomes and
possibly a better response to TKIs. Participants could have concurrent T790M mutations, although
this isn’t expected to influence outcomes as the proportion would likely be small (likely around 1%
at first line).
Other key eligibility criteria are reported in CS Table 5. People with history or evidence of brain
metastases were excluded. ERG expert opinion is that this was reasonable and in line with some
other trials of TKIs (however, see discussion in Section 3). The ERG clinical advisor also notes
that a significant number of patients in clinical practice have a performance status of 2, some 5-
15% have mutations other than del19 and L858R, and some have comorbidities such as chronic
obstructive pulmonary disaese or cardiac disease, all of which would not have been included in the

35
ARCHER 1050 trial. However, our clinical advisor notes that these are common exclusions in
clinical trials.
Participants were randomised to dacomitinib 45mg orally once daily or gefitinib 250mg orally once
daily in a 1:1 ratio. Treatment continued for a maximum of 48 months or until disease progression,
intolerable toxicities, withdrawal, death or investigator decision. Dose modifications for
dacomitinib to manage treatment-related toxicity were described in CS B.2.3.2.2.
The comparator, gefitinib, is a first-generation TKI and was recommended by NICE in TA192 for
first-line treatment of locally advanced or metastatic NSCLC in people with EGFR mutation. The
CS notes that this is the first trial to compare TKIs; chemotherapy was the comparator in the pivotal
trials of other licensed TKIs (gefitinib, erlotinib and afatinib).
A flow chart of participant numbers was provided in CS Appendix D2. Of 720 patients assessed
for eligibility, 63% did not meet inclusion criteria (no further details provided). A total of 452
people were randomised, of these one participant in the gefitinib arm withdrew consent and did not
receive treatment. The ITT population included all randomised participants (Section 4.2.2). Overall,
a lower proportion of the dacomitinib arm discontinued treatment (71% vs 83% gefitinib) and the
study (40.1% vs 46.7% gefinitib). A higher proportion of the dacomitinib arm discontinued
treatment due to adverse events (18.1% vs 12.1% see clarification response C1 for details of adverse
event by relation to study drug), but a lower proportion discontinued dacomitinib due to progression
or relapse (34.8% vs 50.4% gefitinib) or global deterioration of health (defined in clarification A13,
11.5% vs 14.7% gefitinib). The most common reasons for discontinuing the study were death
(dacomitinib 33.5% vs gefitinib 40.4%) and refusing further follow-up (dacomitinib 6.2% vs
gefitinib 4.4%).
4.2.1 Baseline characteristics of participants of ARCHER 1050 trial.
Table 4 shows the key baseline characteristics of the trial participants. The CS (B.2.3.6) states that
the demographic and clinical characteristics were generally similar between the arms of the trial.
When comparing the data presented in the trial publication and the CS, there are no errors or
differences noted. The ERG has noted that the groups are indeed well-balanced in terms of disease
stage at screening and EGFR mutation but note some imbalance in the following characteristics.

36
Table 4: Baseline characteristics in ARCHER 1050
Baseline characteristic Dacomitinib
N=227
Gefitinib
N=225
Male, n (%) 81 (35.7) 100 (44.4)
Female, n (%) 146 (64.3) 125 (55.6)
Age, years, median (range) 62 (28-87) 61 (33-86)
Age, years, mean (SD) 61.2 (11.26) 60.9 (10.17)
White, n (%) 56 (24.7) 49 (21.8)
Black, n (%) 1 (0.4) 0
Asian, n (%) 170 (74.9) 176 (78.2)
Japanese, n (%) 40 (17.6) 41 (18.2)
Mainland Chinese, n (%) 114 (50.2) 117 (52.0)
Other East Asian, n (%) 16 (7.0) 18 (8.0)
Never smoked, n (%) 147 (64.8) 144 (64.0)
Ex-smoker, n (%) 65 (28.6) 62 (27.6)
Smoker, n (%) 15 (6.6) 19 (8.4)
ECOG performance status 0, n (%) 75 (33) 62 (28)
ECOG performance status 1, n (%) 152 (67) 163 (72)
Stage IIIB at screening, n (%) 16 (7)
Stage IV at screening, n (%) 184 (81) 183 (81)
Unknown at screening a, n (%) 25 (11) 26 (12)
del19, n (%) 134 (59) 133 (59)
L858R, n (%) 93 (41) 92 (41) a Newly diagnosed with stage IV a time of study entry.
There are more female compared with male participants in both treatment groups. The company
has referred to this in their summary and have stated that this was to be expected, given the higher
proportion of ECFR mutations in NSCLC occurring in females. Nonetheless, 64.3% are female in
the dacomitinib group compared with 55.6% in the gefitinib group. The CS states in section
B.2.13.2.2 that gender is not a prognostic factor for PFS in EGFR+ NSCLC, citing the ARCHER
1050 trial as evidence. The ERG has identified evidence which suggests that female gender may be
an independent prognostic factor for NSCLC, including in those with EGFR-mutation positive
NSCLC, summarised below.30-33 In addition, evidence suggests that females respond better to
SUPERSEDED See erratum

37
treatment with EGFR TKIs, although the ERG clinical advisor notes the evidence is not clear that
female sex is a predictive factor.34
All participants were classified as either stage 0 or 1 in terms of ECOG performance status (PS).
More participants in the dacomitinib arm (33% vs 28%) were classified as better in terms of
performance status (PS 0) compared with the gefitinib group. Although the CS states in section
B.2.13.2.2 that ECOG PS is not a prognostic factor, citing the ARCHER 1050 trial, other evidence
suggests that the difference between ECOG PS 0 and 1 is significant in terms of patients’ overall
survival.33, 35
A reasonable quality NMA30 meta-analysed 39 studies that compared overall survival data for
women versus men with NSCLC. The populations were very heterogeneous and some studies used
univariate analysis whilst others used multivariate. An overall survival advantage was found for
women even after allowing for advanced stage disease, proportion with adenocarcinoma and
smoking status.
A second meta-analysis34 also found improved overall survival in women with NSCLC compared
with men when combining trials reporting multivariate analysis of overall survival. Moreover, the
meta-analysis of PFS from six EGFR TKIs trials found that women had an additional 10%
reduction in risk of progression, whereas the analysis of ALK inhibitor trials (n=4) found the benefit
was similar for men and women. In contrast, no PFS benefit from Anti-PD1 inhibitors was found
in women (5 trials). However, the analyses did not consider ethnicity or smoking status and it is
unclear whether all relevant studies were included.
Two primary studies from Taiwan that investigated the effect of gender were also identified by the
ERG.31, 32 Ethnicity was not reported by the studies but having an Asian population they could be
considered comparable to ARCHER 1050 and LUX-Lung 7 in this respect. Hsu and colleagues
compared stage, age, smoking history and histology between men and women in a prospective
cohort study of 695 patients with NSCLC. The study was 4 years duration but median follow-up
was not reported. In univariate analyses, younger patients, never-smokers and females had better
overall survival. However, in multivariate analysis only age and stage were independent prognostic
factors; the female survival advantage in the previous analysis could be attributed to younger age
and fewer smokers. Tseng and colleagues conducted a retrospective database review of 11,678
patients with adenocarcinoma to assess the impact of smoking. They found than female gender was

38
an independent prognostic factor in multivariate analysis in both EGFR-mutant and EGFR-wild
type groups.
A retrospective database analysis in Japan 33 included 26,957 NSCLC patients; 21,856 of these had
PS 0 or 1 and had a median follow-up of 13.6 years and 9.0 years, respectively. A significant
difference in median survival was found between PS 0 and 1 after adjusting for gender, age,
smoking status, histology, stage, period of diagnosis, use of radiotherapy, and chemotherapy. Never
smoker, early stage, female gender, squamous cell carcinoma histology, and treatment were all
independent favourable prognostic factors.
A retrospective case series35 in Turkey analysed 122 patients with T4 N0-3 M0 (nodule in different
lobes, no distant organ metastasis) local advanced NSCLC, 96 of which had PS 0 (n=10) or 1
(n=86). In multivariate analysis, ECOG PS at diagnosis was had a significant impact on overall
survival (but not event-free survival), as did age, stage and primary treatment.
Overall, the dacomitinib arm has a higher proportion of potentially favourable prognostic factors
in terms of gender and, to a lesser extent, ECOG PS. This could bias the trial in favour of
dacomitinib.
ERG summary
The clinical effectiveness evidence for dacomitinib comes from a large multi-centre RCT which
has an active comparator with a TKI (gefitinib). There are some potential issues with regard to the
generalisability of the trial participants including having no UK sites, a high proportion of Asian
participants, limited to two EGFR mutations only (albeit the most common) and the exclusion of
people with brain metastases. In addition, there are imbalances in potential prognostic factors
between arms.
4.2.2 Trial analysis sets, outcomes and statistics.
The analysis sets in ARCHER 1050 were an Intent-to-treat (ITT) population (dacomitinib N=227;
gefitinib N=225); an As-treated (AT) population and Safety Population (dacomitinib N=227;
gefitinib N=224) and the Patient-reported outcome (PRO) population (patients from the AT
population who started treatment, completed a baseline PRO assessment, and completed ≥1 post-
baseline PRO assessment after the first dose; dacomitinib N=226 gefitinib N=222 for baseline

39
completion of PRO questionnaire; >90% of patients answered all questions for almost all cycles in
both treatment groups).
The outcome measures considered were overall survival (OS), progression-free survival (PFS),
overall response rate (ORR), duration of response (DOR), adverse events (AE) of treatment and
health-related quality-of-life (HRQoL). Definitions were provided for each of these and the ERG
does not have any concerns about these outcomes.
The censorship methodology for the primary and secondary outcomes of ARCHER 1050 and the
approach to managing missing data were also presented. In terms of the trial statistics, the primary
outcome was PFS based on blinded IRC review in the ITT population. Estimates of the PFS curves
obtained from the Kaplan-Meier method were displayed graphically. The median (and other
quartiles) event time and corresponding 2-sided 95% CI for the median were provided for each
treatment arm. Probability of PFS at clinical meaningful time points were estimated and presented
with 95% CI based on the Greenwood method. Differences in PFS between treatment arms were
analysed by the Cox Regression (i.e. for estimated HR and its 95% CI) and log rank test (1-sided,
α=0.025) for 1-sided p-value, both stratified by race and EGFR mutation status based on their
values at randomisation. HRs and p-values for PFS in subgroups were estimated from the
unstratified Cox regression model and the unstratified log-rank test, respectively. The proportions
of patients achieving objective responses were compared between groups using Pearson’s χ² test.
For the secondary outcomes, a log-rank test, stratified by EGFR mutation status at randomisation
and race, was used to assess PFS based on investigator assessment, OS, TTF, and DoR. A Cox
proportional hazards model, stratified by EGFR mutation status and race as used in the log-rank
test, was used to calculate HRs and 95% CI for OS and TTF in the ITT population and DoR among
the objective responders in the ITT population. P-values were determined by the log-rank test with
adjustment for the same stratification factors. ORR was summarised along with the corresponding
exact 2-sided 95% CI using a method based on the Binomial distribution. The Cochran-Mantel-
Haenszel test stratified by race and EGFR mutation status were used to compare ORR between the
2 treatment arms. The relative risk ratio estimator were used to contrast the treatment effects on
response rates. A point estimate and a 2-sided 95% CI were calculated using the normal
approximation.
The ERG have identified no concerns about the analysis sets; with censorship and management of
missing data or the outcome measures used. With regard to the trial statistics, the CS did not justify

40
why a one-sided p-value was used for PFS and a two-sided p-values for OS and it is unclear to the
ERG why there were different data cut-offs for PFS and OS analyses..
For the patient-reported outcomes, repeated measures mixed-effects modelling was used to
compare the two treatment groups with respect to the overall change from baseline scores on the
EORTC QLQ-C30 and EORTC QLQ-LC13 scales using two-sided tests that were not adjusted for
multiple testing. The Kaplan-Meier method was used to estimate the time-to-deterioration of
symptoms and compared between treatment groups using the Hochberg-adjusted log-rank test. A
sensitivity analysis was conducted without the condition of two consecutive cycles of deterioration,
using the same methods and summary statistics.
It is unclear why the results of the PROs were not adjusted for multiple testing (the result of not
adjusting for multiple testing could be an increased likelihood of finding “significant” results which
are actually false positives, i.e. the null hypothesis is really true, and the significant result due to
chance). This issue was raised by the FDA reviews and they concluded that all PRO analyses were
considered exploratory since they did not have a prespecified multiplicity adjustment.
4.2.3 Summary results from ARCHER 1050
The ERG report summarises the blinded IRC results where reported (the ERG considers these to
be the most valid); investigator-assessed results can be viewed in the CS and are generally
consistent with the blinded IRC analyses except where noted. The key results are summarised in
Table 5.
Table 5: Summary of ARCHER 1050 results.
Outcome Dacomitinib N=227
Gefitinib N=225
PFS (blinded IRC) Patients with PFS event, n (%) 136 (59.9) 179 (79.6) Median PFS, months (95% CI) 14.7 (11.1, 16.6) 9.2 (9.1, 11.0) HR (95% CI), P-value (1-sided) 0.59 (0.47, 0.74), p<0.0001 OS Deaths, n (%) 103 (45.4) 117 (52.0) Median months (95% CI) 34.1 (29.5, 37.7) 26.8 (23.7, 32.1) HR (95% CI), P-value (2-sided) 0.76 (0.58, 0.99), p=0.044 BOR (blinded IRC) Complete response, n (%) 12 (5.3) 4 (1.8) Partial response, n (%) 158 (69.6) 157 (69.8)

41
Stable, n (%) 30 (13.2) 27 (12.0) Progressive disease, n (%) 12 (5.3) 15 (6.7) Intermediate, n (%) 15 (6.6) 22 (9.8) Objective response rate (CR plus PR), n (%) 170 (74.9) 161 (71.6) 95% exact CI (68.7, 80.4) (65.2, 77.4) DoR (blinded IRC) Number with a response (CR or PR), n (%) 170 (74.9) 161 (71.6) Median, months (95% CI)a 14.8 (12.0, 17.4) 8.3 (7.4, 9.2) Stratified HR (95% CI) 0.40 (0.31, 0.53) p<0.0001 Descriptive summary of response duration (months), n
170 161
Mean (standard deviation) 12.78 (7.68) 9.17 (5.55) Median (range) 12.02 (0.0-34.3) 8.11 (0.0-32.2) Time to treatment failure (blinded IRC) Median, months (95%CI) 11.1 (9.2, 14.6) 9.2 (7.6, 9.4) Stratified HR (95% CI), 1-sided p-value 0.67 (0.54, 0.83), p<0.0001 aKaplan-Meier estimates of response duration (months) quartiles (95% CI), based on the Brookmeyer-Crowley method. BOR = best overall response; CI = confidence interval; CR = complete response; DoR = duration of response; HR = hazard ratio; INV = investigator assessment; IRC = independent review committee; ITT = intent-to-treat; PFS = progression-free survival; PR = partial response.
Survival
Median follow-up for PFS based on blinded IRC review was 22.1 months (dacomitinib) and 23.0
months (gefitinib) (CS Table 71, CSR). A statistically significant improvement was found in the
primary outcome, PFS assessed by blinded IRC, with dacomitinib compared with gefitinib [median
14.7 months vs 9.2 months, HR 0.59 (95% CI 0.47, 0.74) p<0.0001] ( Table 5 ). PFS at 12 months
for dacomitinib vs gefitinib was 55.7% (95% CI 48.5, 62.3) vs 35.9% (95% CI 29.3, 42.4) and at
24 months was 30.6% (95% CI 23.8, 37.5) vs 9.6% (95% CI 5.6, 15.0). The Kaplan-Meier plot is
presented in CS Figure 4. Investigator-assessed PFS results were similar (CS Table 16, CS Figure
5).
Median follow-up for OS was 31.1 months (dacomitinib) and 31.4 months (gefitinib). Median
survival improved with dacomitinib compared with gefitinib [median 34.1 months vs 26.8 months,
HR 0.76 (95% CI 0.58, 0.99), p=0.044]. The Kaplan-Meier plot is presented in CS Figure 6. OS at
30 months for dacomitinib vs gefitinib was 56.2% (95% CI 49.0, 62.8) vs 46.3% (95% CI 39.3,
53.1).

42
The ERG notes discrepancies in the HRs reported for the ITT population between of the primary
and subgroup analyses in the CS, this is discussed in the subgroup analyses results below.
Response rate and duration
There was no statistically significant difference in the objective response rate (complete response
+ partial response) for dacomitinib compared with gefitinib [74.9% (95% CI 68.7, 80.4) vs 71.6%
(95% CI 65.2, 77.4), p=0.194] assessed by blinded IRC (Table xx). The investigator-assessed ORR
was similar (CS Table 16), although the proportion in the dacomitinib arm assessed by investigators
as having a complete response was slightly lower than by blinded IRC review (**** vs ****), and
the proportion with a partial response higher (***** vs ****).
The median duration of response by blinded IRC review was significantly longer in the dacomitinib
arm compared with gefitinib [Kaplan-Meier estimates of response duration quartiles 14.8 months
vs 8.3 months, HR 0.40 (95% CI 0.31, 0.53), p<0.0001]. The Kaplan-Meier plot is presented in CS
Figure 7, and in CS Figure 8 for investigator assessment.
Time to treatment failure
The median time to treatment failure according to blinded IRC review was statistically significantly
longer with dacomitinib compared with gefitinib [11.1 months (95% CI 9.2, 14.6) vs 9.2 months
(7.6, 9.4); HR 0.67 (95% CI 0.54, 0.83), 1-sided p-value <0.0001)]. Kaplan-Meier plots for blinded
IRC review and investigator assessment are presented in CS Figures 9 and 10, respectively.
Health-related quality of life
Response rates for the patient reported outcomes (PRO) were described as high, with over 90%
completion for most cycles. Results are reported for the PRO analysis set (Section 4.2.2). Disease-
related symptoms assessed by the EORTC QLQ-C30 and EORTC QLQ-LC13 (cough, dyspnoea,
pain in chest, pain in arm or shoulder, pain in other parts, fatigue) reduced in both groups (CS
Figure 11); only the reduction in chest pain was significantly greater with dacomitinib than gefitinib
(-10.24 vs -7.44, p=0.024). There was no adjustment to the significance level for multiple testing
(Section 4.2.2).
The treatment-related symptoms assessed by the EORTC QLQ-C30 and EORTC QLQ-LC13,
diarrhoea and sore mouth, both worsened significantly more with dacomitinib compared with

43
gefitinib, and these changes were considered clinically meaningful (diarrhoea: 19.88 vs 7.32,
p<0.0001; sore mouth 15.09 vs 3.51, p<0.0001; CS Figure 11).
There was a small improvement in global quality of life that was not clinically meaningful in either
group, although it was statistically significantly better with gefitinib than with dacomitinib (4.94
vs. 0.2, p=0.0002).
There were no differences between treatments in time to deterioration (time from randomisation to
the first time a patient’s score showed a ≥10 point increase from baseline) for individual disease-
related symptoms or the composite of symptoms [HR 1.17 (95% CI 0.93, 1.48), p=0.5327].
The CS presents absolute values for the EQ-5D-3L VAS and utility index and the difference
between treatments (CS Table 18). The ERG assumes that these are end of study values, however
this is not clearly stated. EQ-5D results are not reported in the trial publication 1 (and only the
baseline VAS scores are reported in its Appendix). The CS refers to changes from baseline:
“Changes from baseline in the EQ-5D visual analogue scale (VAS) were small and not clinically
meaningful in either treatment group, although gefitinib was associated with a significantly greater
change from baseline than dacomitinib in VAS and utility index scores”, however change scores
are not presented in CS Table 18. Statistically significant differences in the absolute VAS score and
utility index were observed in favour of gefitinib (Table 6).
Table 6: EQ-5D-3L absolute scores (PRO Population)
Dacomitinib (n=224) Gefitinib (n=221) Difference VAS
Baseline: 73.1 (SD 19.6) ********************
Baseline: 74.7 (SD 17.6)*********************
Baseline: -1.6 ****************************
Utility index
********************************************
********************************************
*******************************************
EQ-5D = European Quality of Life-5 Dimensions; PRO = patient-reported outcome; VAS = visual analogue scale. aAssumed by ERG.
ERG summary
Dacomitinib led to improvements in survival outcomes (PFS and OS) compared with gefitinib at
the latest data cuts, although this favourable effectiveness was not always mirrored in other

44
secondary outcomes (for example ORR, HRQoL) when ERG-preferred blinded IRC assessments
were used.
Subgroups
The NICE scope did not specify any relevant subgroups. The CS presents subgroup analyses based
on pre-specified baseline characteristics for PFS (blinded IRC: CS Figure 12, investigator
assessment: CS Figure 13) and overall survival (CS Figure 14).
A consistent effect was seen in most subgroups, with two exceptions where the hazard ratio
favoured gefitinib (but was not statistically significant): i) blinded IRC review and investigator
assessed PFS in the age category ≥75 years, although the very small sample size is noted. Overall
survival was not presented for this age category (< 65 years; ≥65 years only presented). ii) overall
survival for baseline ECOG PS 0. Tests of interaction for PFS were provided in clarification
response A9 and were non-significant with the exception of the Asian versus non-Asian subgroup.
The tests of interaction for overall survival were not statistically significant in all cases, although
the authors of the 2018 publication note that the study was not designed to have sufficient power
to test interaction.29 As discussed in Section 3 the Asian and non-Asian subgroups showed a
consistent effect for OS, and a statistically significant effect in the Asian subgroup, but not the non-
Asian subgroup, for PFS. These subgroups should therefore be viewed with caution.
The CS also presented blinded IRC review PFS and OS for the subgroup who received dacomitinib
dose reductions compared with the overall dacomitinib arm (CS Figures 26 and 27, respectively),
but not the dacomitinib subgroup without dose reductions. Both PFS and OS were slightly higher,
but not statistically significantly different, in the subgroup with dose reductions compared with the
overall dacomitinib arm [PFS: 16.6 months (95% CI 14.6, 18.6) vs 14.7 months (95% CI 11.1,
16.6); OS: 36.7 months (95% CI 32.6, NR) vs 34.1 months (95% CI 29.5, 37.7)]
The ERG notes discrepancies in the HRs for the whole population OS between CS Figure 6
(discussed above) and CS Figure 14, and between the HRs for the whole population IRC PFS in
CS Figure 4 (discussed above) and CS Figure 12. For investigator PFS, CS figures 5 and 13 match.
These differences may be due to stratification. For example, the footnotes to CS figures 4 and 5
refer to a stratified Cox Regression (although the stratification factor for race seems to differ) and
the text relating to CS figure 6 states stratified analysis (there is no footnote to CS figure 6).
However, the text relating to CS figure 4 and 5 states ‘unstratified log-rank test’, even though CS

45
figure 4 states ‘stratified p-value based on the stratified long-rank test’. CS figures 12 and 13 state
‘unstratified log-rank test’ but this was not stated for CS figure 14.
ERG summary: no subgroups were specified in the NICE scope. However, it would appear that
overall, the company’s subgroups showed similar results to the whole population analyses, although
caution is required given the small sample sizes of many of the subgroups.
Adverse events
The median duration of treatment was longer in the dacomitinib arm (*****weeks, range
*********) compared with the gefitinib arm (**** weeks, range ********); no adjustment was
made to adverse event frequency data.
The CS presents a summary of adverse events in CS Table 23 for all-cause adverse events and
treatment-related adverse events, although it omits treatment-related adverse events leading to dose
reductions and leading to temporary discontinuation. The ERG has sourced these from the CSR
(Table 7).
Table 7: Summary of adverse events
Adverse event DacomitinibN=227
Gefitinib N=224
Dacomitinib N=227
Gefitinib N=224
All-causality AEs, % Treatment-related AEs, % AE 99.6 98.2 **** **** SAE 27.3 22.3 *** *** AE Grade 3/4 **** **** **** **** AE Grade 3 **** **** **** **** AE Grade 4 *** *** *** *** AE Grade 5 **** ***** *** *** AE leading to dose reductionb 66.1 8.0 ****** ***** AE leading to temporary discontinuation
**** **** ****** ******
AE leading to permanent discontinuation
**** **** *** ***
a CSR Table 38. b Dose reduction to manage toxicity due to AE(s) is described in the protocol as every other day dosing for gefitinib. AE = adverse event; SAE = serious adverse event.
All-cause adverse events leading to permanent discontinuation were presented in CS Table 28. A
similar proportion of people in both groups experienced any all-cause (99.6% vs 98.2%) and
treatment-related adverse events ****************. Serious adverse events were slightly higher

46
in the dacomitinib group (all-cause: 27.3% vs 22%*********************************), and
a higher proportion of the dacomitinib group experienced grade 3 adverse events
**************************************************************. However, grade 4
adverse events were low and similar between groups
**********************************************************. There were *** deaths
due to treatment-related adverse events in each arm.
More people in the dacomitinib group experienced adverse events leading to a dose reduction (all-
cause: 66.1% vs 8.0%***********************************, temporary discontinuation
**************************************************************, or to a lesser extent,
permanent discontinuation
************************************************************. The protocol for dose
reduction differed between treatments: dacomitinib participants had dose reductions of the daily
dose whereas gefitinib participants had the dose maintained and the frequency reduced to every
other day. Treatment-related adverse events are summarised in Table 8.
Table 8: Treatment-related adverse events occurring in **** of patients
Adverse event, %
Dacomitinib N=227
Gefitinib N=224
Grade(s) Grade(s) 1–2 3 4 5 1–2 3 4 5
Diarrhoea **** *** * *** **** *** * * Paronychia **** *** * * **** *** * * Dermatitis acneiform
**** **** * * **** * * *
Stomatitis **** *** * * **** * * * Decreased appetite
**** *** * * **** * * *
Dry skin **** *** * * **** * * * Alopecia **** *** * * *** * * * ALT increased
**** *** * * **** *** * *
AST increased
**** * * * **** *** * *
AE = adverse event; ALT = alanine aminotransferase; AST = aspartate aminotransferase.

47
The most common grade 1-2 adverse events related to dacomitinib were diarrhoea (*****),
paronychia (nail infection, *****), stomatitis (mouth inflammation, *****) and dermatitis
acneiform (skin reaction, *****). For gefitinib these were diarrhoea (*****), increase in aspartate
transaminase (AST; *****) and alanine transaminase (ALT; *****) (associated with liver toxicity),
and dermatitis acneiform (*****). The most common grade 3 adverse events related to dacomitinib
were acneiform (*****), diarrhoea (****) and paronychia (****), while those related to gefitinib
were and increase in ALT (****) and AST (****). All-causality adverse events are presented in
CS Table 24 and follow a similar pattern.
Specific adverse events resulting in dose reductions, temporary discontinuation and permanent
discontinuation are presented in CS Tables 26, 27 and 28, respectively. The most common all-cause
adverse events leading to dose reduction were dermatitis acneiform (20.3%), paronchyia (16.7%)
and diarrhoea (8.4%) for dacomitinib and increased ALT (2.7%) and AST (2.2%) for gefitinib. The
median time to dose reduction was 2.8 months (Inter-quartile range, IQR, 1.3–4.2 months) for
dacomintib, with a median duration of 11.3 months (IQR 4.8–18.9 months). The median time to
dose reduction for gefitinib was 3.3 months (IQR 2.4–4.2 months); median duration 5.2 months
(IQR 2.5–7.9 months). Temporary discontinuation of dacomitinib resulted most commonly from
dermatitis acneiform (*****), paronchyia (*****) and diarrhoea (****), and of gefitinib due to
increased ALT (****) and AST (****). Treatment-related adverse events leading to permanent
discontinuation of dacomitinib included dermatitis acneiform (****) and diarrhoea (****), and
those leading to permanent discontinuation of gefitinib included increased ALT (****).
ERG summary: overall there were similar rates of all-cause and treatment-related adverse events
between dacomitinib and gefitinib. However, there were higher rates of any all-cause and any
treatment related Grade 3 adverse event and serious adverse events with dacomintinib (based on
observation of the proportions only), and dose reductions or temporary discontinuations were more
frequently observed with dacomitinib.
4.2.4 Other dacomitinib trials
The ERG identified five additional trials of dacomitinib 45 mg once daily in NSCLC to inform the
evidence base on adverse events (dose escalation studies were not considered). One of these36 was
undertaken in treatment naive patients, the rest were undertaken in previously treated patients
therefore a different patient population to the NICE scope (Table 9).
SUPERSEDED See erratum

48
Phase 2 single-arm study (NCT00818441) of dacomitinib in advanced NSCSC
(adenocarcinoma subtype) as first-line treatment.36
ARCHER 1009 (NCT01360554): Phase 3 RCT of dacomitinib vs erlotinib in locally
advanced or metastatic NSCLC, previously treated with one or two previous regimens of
chemotherapy.37
NCIC CTG BR.26 (NCT01000025): Phase 3 RCT of dacomitinib vs placebo in advanced
or metastatic NSLCC previously treated with up to three previous lines of chemotherapy
and either gefitinib or erlotinib.38
Phase 2 RCT (NCT00769067) of dacomitinib dacomitinib vs erlotinib in advanced NSLC
and one or two prior chemotherapy regimens for advanced disease.39
Phase 2 single-arm study (NCT00548093) of dacomitinib in advanced stage NSCLC after
failure of prior chemotherapy and erlotinib.40
Consistent with ARCHER 1050, dermatitis acneiform and diarrhoea were the most common grade
3 or higher adverse events across the trials, with rates varying slightly. Rates of grade 3 paronychia
were lower in these trials, ranging from 1-4%, compared with 7.5% in ARCHER 1050. Serious
adverse events, where reported, appeared more often in the phase 3 placebo-controlled trial of
dacomitinib, however these also occurred in 36% of the placebo group.38
In summary, adverse events in the wider evidence base of dacomitinib in NSCLC are consistent
with those in ARCHER 1050. This summary reflects that of the FDA risk review of dacomitinib
which concluded that dacomitinib’s adverse event profile is similar to other EGFR TKI agents used
to treat NSCLC.

49
Table 9: Adverse events in other dacomitinib trials in NSCLC
Phase 2
single-arma 36 ARCHER 100937
NCIC CTG BR.2638
Phase 2 RCT39 Phase 2
single arm 40
n=89 Dacomitinib
n=432 Erlotinib
n=436 Dacomitinib
n=477 Dacomitinib
n=93 Erlotinib
n=94 Dacomitinib
n=66
Adverse events, grade ≥3, %
NR Grade 3: 29 Grade 4: 2
Grade 5: <1
Grade 3: 21 Grade 4: <1 Grade 5: <1
NR NR NR Grade 3/4:
27
Most frequent AEs grade ≥3, %
Dermatitis acneiform: 18 Diarrhoea: 15
Diarrhoea: 11 Rash: 7
Stomatits: 3
Rash: 3 Decreased appetite: 3
Diarrhoea: 2
Diarrhoea: 12
Acneiform rash: 10
Diarrhoea: 12 Dermatitis
acneiform: 11 Paronychia: 3
Dermatitis acneiform
: 6 Diarrhoea:
4
Diarrhoea: 12
Dermatitis acneiform: 6
Serious AEs, %
NR 12 9 39 NR NR 18b
a 54 patients started on 30mg/day. bStates none was treatment related. NR: not reported.

50
4.3 Critique of trials identified and included in the indirect comparison and/or multiple
treatment comparison
As stated in Section 4.1.2 the ERG agrees that none of the other trials identified in the SLR and the
broader network are relevant to the current assessment. The NMA compared dacomitinib to afatinib.
The common comparator was gefitinib which had been the comparator treatment in the ARCHER 1050
and LUX-Lung 7 trials. The LUX-Lung 727, 28 trial compared of afatinib with gefitinib in previously
untreated EGFR mutation positive adults with stage IIIB or IV NSCLC.
No formal comparison with erlotinib was made as there was no trial that linked in the network and the
CS therefore made the assumption that erlotinib and gefitinib were clinically equivalent based on
previous NICE committee discussions. The ERG has identified five systematic reviews that despite
some differences in their included studies (related to differences in eligibility criteria) generally show
no significant differences between gefitinib and erlotinib (see Appendix Table 16 ). The ERG therefore
consider that the treatments are likely to be equivalent and that the assumption in the CS is therefore
reasonable. The resulting evidence network is presented in Figure 2 which is a reproduction of CS
Figure 16.
Abbreviations: AFA = afatinib; DAC = dacomitinib; ERL = erlotinib; GEF = gefitinib.
Figure 2: Evidence network for the indirect comparison.

51
4.3.1 The LUX-Lung 7 trial
The CS presents a risk of bias assessment of the LUX-Lung 7 trial in CS Appendix Table 75. The ERG
agrees with most of the company’s assessments (Table 10), but notes the absence of reporting of one of
the pre-specified outcomes (time to objective response) indicating potential reporting bias. The ERG
also notes the higher proportion of women in the gefitinib arm compared with afatinib (67% vs 57%).
This difference may be due to chance, but as discussed previously gender may be a prognostic factor,
therefore the risk of selection bias is uncertain. The company gives the trial an overall judgement of
high risk of bias due to the open-label design. The ERG agrees with this as the trial has a high risk of
performance bias (differences between groups in care provided or in exposure to other factors), but
notes that the risk of detection bias and attrition bias is low.
Table 10: Risk of bias assessment of LUX-Lung 7.
Company judgement ERG judgement Sequence generation Low risk Low risk Allocation concealment Low risk Low risk
Important baseline imbalance
Low risk No significant differences in
baseline characteristics between arms
Imbalance in gender. No statistical testing
Blinding of participants and researchers
High risk High risk
Blinding of outcome assessment
Low risk Low risk
Incomplete outcome data Low risk Low risk
Selective reporting Low risk
All outcomes measured were reported
High risk Time to objective response not
reported
Other bias Unclear risk
Trial sponsored by pharmaceutical company
Low risk No other bias apparent
OVERALL JUDGEMENT High risk This trial was open-label
High risk
Table 11 shows the key baseline characteristics of patients included in LUX-Lung 7. Overall, in terms
of age, race, smoking status, ECOG performance status, disease stage and EGFR mutation, the
characteristics of patients in each arm of the LUX-Lung 7 trial are balanced. There was a difference of
10 percentage points in the proportion of males and females, with fewer women in the afatinib group.
However, despite potential for better survival and response to EGFR tyrosine kinase inhibitors in
women as discussed above, the afatinib group still had improved outcomes compared with gefitinib.

52
Table 11: Baseline characteristics in LUX-Lung 7.
Baseline characteristic Afatinib N=160
Gefitinib N=159
Male, n (%) 69 (43) 53 (33)
Female, n (%) 91 (57) 106 (67)
Age, years, median (range) 63 (30-86) 63 (32-89)
White, n (%) 48 (30) 54 (34)
Black/African American, n (%) 1(1) 0
Asian, n (%) 94 (59) 88 (55)
Missinga, n (%) 17 (11) 17 (11)
Never smoked, n (%) 106 (66) 106 (67)
Light ex-smokerb, n (%) 21 (13) 19 (12)
Other current or ex-smokers, n (%) 33 (21) 34 (21)
ECOG performance status 0, n (%) 51 (32) 47 (30)
ECOG performance status 1, n (%) 109 (68) 112 (70)
Stage IIIB at screening, n (%) 8 (5) 3 (2)
Stage IV at screening, n (%) 152 (95) 156 (98)
Exon 19 deletionc, n (%) 93 (58) 93 (58)
Leu858Arg, n (%) 67 (42) 65 (41)
Leu858Arg + Exon 19 deletion, n (%)
0 1 (1)
aPatient recruited in French sites did not have their ethnic origin recorded. b Less than 15 pack years and stopped more than one year before diagnosis. cOne patient in the afatinib group with wild-type EGFR was erroneously included in the trial and was reported as exon 19 deletion at the time of randomisation by the investigator.
The ERG has summarised the key results from the LUX-Lung 7 trial in Table 12 alongside those of
ARCHER 1050 to allow an overview of the gefitinib results (as the common comparator in the indirect
comparison) from both trials. Median PFS and TTF in the gefitinib arm of ARCHER 1050 were less
than in LUX-Lung-7 giving a bigger difference between gefitinib and dacomitinib. However median
OS and ORR were higher in the gefitinib arm of ARCHER 1050 than in LUX-Lung 7.
The LUX-Lung 7 authors note that ORR in the gefitinib arm (56%) was somewhat lower than in
previous phase 3 trials (62% to 74%, investigator review) but do not provide an explanation. The
proportion of adverse events grade ≥ 3 were comparable in the gefitinib arms between trials, with both
trials finding increased ALT/AST the most common event. It is possible that these differences are in
part a reflection of differences in the participant characteristics, see discussion below on transitivity in
the NMA.

53
Table 12: Comparison of key results in ARCHER 1050 and LUX-Lung 7.
ARCHER 1050 LUX-Lung 7 Outcome Dacomitinib
n=227 Gefitinib
n=225 Gefitinib
n=160 Afatinib n=159
Median PFS, months (95% CI)
14.7 (11.1, 16.6)
9.2 (9.1, 11.0)
10.9 (9.1, 11.5)
11.0 (10.6, 12.9)
Median OS, months (95% CI)
34.1 (29.5, 37.7)
26.8 (23.7, 32.1)
24.5 27.9
Objective response rate (CR plus PR), %
74.9 71.6 56 70
Median DOR, months (95% CI)
14.8 (12.0, 17.4)
8.3 (7.4, 9.2)
8.4 (IQR 6.2,
13.1)
10.1 (IQR 5.6, 16.8)
Median TTF, months (95%CI)
11.1 (9.2, 14.6)
9.2 (7.6, 9.4)
11.5 (10.1, 13.1)
13.7 (11.9, 15.0)
Adverse events, grade ≥3, %
Grade 3/4: **** Grade 5: ****
Grade 3/4: **** Grade 5: *****
52 57
Most frequent AEs grade ≥3, %
Dermatitis acneiform: 14 Diarrhoea: 8
Paronychia: 7
ALT increase: 8 AST increase: 4
ALT/AST increase: 9
Rash/acne: 3
Diarrhoea: 13 Rash/acne: 9
Fatigue: 6
a CSR Table 38.
4.4 Critique of the indirect comparison and/or multiple treatment comparison
4.4.1 Methodology of the NMA
Although the NMA undertaken by the company has only included two RCTs, it represents a key
component of the present appraisal as it allows the indirect comparison of dacomitinib to one of the
comparators in the decision problem (afatinib). Hence, the ERG has critically appraised the
methodology of the NMA, in particular focusing on the assumptions of homogeneity, similarity, and
consistency.
The periods of enrolment for the two trials were December 2011-August 2013 and May 2013-March
2015 in Lux-Lung 7 and ARCHER respectively. The ERG considers these relatively similar. CS
Appendix Table 70 compares the key patient characteristics in the trials across all four treatment groups.
The CS states that characteristics were equally distributed both between trial arms within each trial and
across trials, and that there was no statistically significant difference in baseline characteristics within
any given trial.
The ERG agrees that the populations in ARCHER 1050 and LUX-Lung-7 trials are fairly comparable,
although there are differences in race [LUX-Lung-7 has a higher proportion of white participants (23%
vs 32%) and a lower proportion of Asian participants (77% vs 57%), with race unknown in 11%] and
LUX-Lung 7 did not exclude brain metastases (16% of participants had brain metastases at baseline).

54
There is a very slight imbalance in the proportions with stage IV disease (including at study entry, see
Table 13) between trials (approximately 92.5% in Archer 1050 and 96.6% in Lux-Lung 7). The
proportion of ‘never’ smokers was similar between trials, however current or ex-smokers were
categorised differently between the trials so cannot be compared.
Table 13: Comparison of key baseline characteristics in the two trials in the NMA
Trial Name ARCHER 1050 LUX-Lung 7
Arm Dacomitinb Gefitinib Afatinib Gefitinib
N 227 225 160 159
Median Age, years 62 61 63 63
Males, % 36 44 43 33
Asian, % 75 78 59 55
ECOG 0, % 33 28 32 30
ECOG 1, % 67 72 68 70
Brain Metastases, % 0 0 16 15
Stage IV, % 81a 81a 95 98
Never smoker, % 65 64 66 67
Del 19, % 59 59 58 58
L858R, % 41 41 42 42 a Proportion at screening; in addition, 11% of dacomitinib and 12% of gefitinib were classified as ‘unknown’ but were newly diagnosed with stage IV a time of study entry.
Transitivity assumption
The CS did not explicitly assess the transitivity assumption and whether it was violated. If this
assumption is compromised or does not hold, the consistency assumption can also be violated, which
can lead to biased estimates from the NMA.
There is no formal test to determine whether the transitivity assumption does hold. However, this can
be examined looking at the distribution of population characteristics that are effect modifiers across the
treatment comparisons of a network.
As previously indicated, the included RCTs had populations with notable differences in terms of
proportion with the presence of brain metastases and the proportion of Asians and a very slight
imbalance in terms of severity. In the example of the proportion of Asians across the two trials, in the
ARCHER 1050 trial, subgroup analyses by ethnicity (Asians vs non-Asians) suggest potential
differences of effect in the dacomitinib versus gefinitib comparison for PFS. Given these differences in
baseline characteristics the ERG considers that there is the potential that transitivity assumption is
violated.
55
Consistency assumption
In the absence of any closed loops formed in the network, the consistency between direct and indirect
comparisons cannot be assessed.
Proportional hazards
The CS assessed the proportional hazards assumption through log cumulative hazard plots and
Schoenfeld residual analysis for PFS and OS in the ARCHER 1050 and LUX-Lung 7 trials. The CS
concluded that the proportional hazards assumption was violated for OS in ARCHER 1050 and was
potentially violated for PFS in LUX-Lung 7. As there was potential for violation in at least one of the
trials, the company undertook a fractional polynomial (FP) analysis which they considered that it
reduced the risk of bias in the NMA. This was described in CS B.2.9.2 and Appendix D.6. A traditional
indirect comparison was also undertaken as a scenario analysis. This was described in CS Appendix
D.7.
Fractional polynomial NMA
The FP NMA differs from a traditional NMA in that that it fits hazard ratios that can vary over time
rather than being constant. This approach was used to obtain relative effect estimates of PFS and OS
for afatinib and dacomitinib compared to gefitinib, which was modelled using a generalised gamma
curve to the data observed in ARCHER 1050.
FPs are able to model behaviour that traditional parametric approaches may not be able to capture.
However, there is danger that FPs will over-fit and as a result, any extrapolations made may be
implausible.
The company explored fitting first and second order FP models to the PFS and OS outcome data for the
relevant trials, in line with the methodology suggested by Jansen 201141. The company digitised graphs
to recreate IPD from the LUX-Lung 7 trial, and analysed this alongside the data from ARCHER 1050.
They fitted models in a Bayesian framework, with suitably vague priors and compared model goodness-
of-fit using the deviance information criterion (DIC), where a difference of more than 5 units from the
lowest scoring model as initially used to reduce the number of models taken into further consideration.
For PFS, the company presented the survival curves from the seven FP models that had DIC scores
within 5 units of the lowest DIC, all of which were applied to a generalised gamma fitted to the gefitinib
arm of ARCHER 1050. The best fitting FP model to the PFS data resulted in a pessimistic extrapolation
for dacomitinib, resulting from a sharply increasing hazard ratio from around 2 years. The company
then chose the second best fitting model and concluded that these results were plausible.

56
For OS, the company applied a similar approach, but found that none of the models within 5 DIC of the
best fitting model provided a plausible extrapolation for dacomitinib and afatinib. This was reportedly
the case for all second-order FP models used and so the company focused on the single order FP models.
The company chose the best fitting single order model as they felt it provided plausible estimates.
The company does not provide detailed results from their FP-NMA nor any interpretation, only
presenting goodness-of-fit statistics, estimates of mean and median survival, and graphs of survival and
hazard ratios. It is unclear whether the company has concluded that there is a statistically significant
difference between any of the comparators or not based on this analysis.
The ERG has concerns over the use of FP by the company. Whilst they appear to be implemented
correctly, FPs may not be suitable for extrapolating due to their tendency to over-fit, as well as to be
influenced by tail data. This is supported by the large number of models that the company was forced
to exclude due to the implausible hazard ratios estimated.
While the FP analysis may be suitable for drawing inference on the observed period of the trials, caution
should be taken due to the possibility of overfitting to tail data. It is, thus, unclear whether the FP
analysis is suitable for extrapolation of PFS and OS in this appraisal.
Traditional NMA
As noted above, the CS undertook a traditional NMA using the Bucher method42 using gefitinib as the
common comparator. This preserves the randomisation within the included trials. The CS states that the
baselines characteristics between the two included trials were generally well balanced. As noted above
the ERG considers there is a potential for the transitivity assumption to be violated. The CS hazard
ratios from the NMA for PFS (independent review) and OS are presented in CS Tables 80 and 81
respectively. While the CS states that an indirect treatment comparison was undertaken, the ERG has
noted that the findings from this indirect comparison were neither presented in the main report, nor in
the CS Appendix. In addition, no HR (for OS or PFS) of afatinib relative to dacomitinib were visible in
the cost-effectiveness model. In order to bring more clarity, the ERG has therefore undertaken an
indirect treatment comparison for PFS and OS. The data used for the indirect comparison can be seen
in Table 14.

57
Table 14: Data included in the ERG NMA.
Trial name Treatment Comparator PFS OS HR 95%CI HR 95%CI
ARCHER 1050
Dacomitinib Gefitinib 0.59 0.47 0.74 0.76 0.58 0.99
Lux-Lung 7 Afatanib Gefitinib 0.741 0.57 0.95 0.86 0.66 1.12 1In the original submission the CS used HR of 0.73 from an earlier data cut of the Lux-Lung trial; 0.74 is available in the supplementary files of the most recent publication.28.
The ERG undertook a fixed-effect NMA using the network package on STATA (frequentist
framework). We generated the surface under the cumulative ranking curve (SUCRA) to rank each
intervention. The SUCRA denotes the probability of an intervention being superior in effectiveness,
here expressed in terms of diminishing the risk of progression or death (PFS), and the risk of death
(OS).
Results for the indirect comparison between dacomitinib and afatinib are shown in the league table
(Table 15) with regards to PFS and OS. In the absence of closed loops within the network (no mixed
direct and indirect evidence), the results from the comparisons for afatinib versus gefitinib and
dacomitinib versus gefitinib are unchanged compared to those reported in the previous table (pairwise
comparisons).
Table 15: ERG NMA league table
PFS HR (95%CI) Drug SUCRA Dacomitinib Afatinib Gefitinib Dacomitinib 0.95 0.80 (0.57-1.12) 0.59 (0.47-0.74) Afatinib 0.55 0.74 (0.57-0.95) Gefitinib 0.00
OS HR with 95%CI Drug SUCRA Dacomitinib Afatinib Gefitinib Dacomitinib 0.86 0.88 (0.61-1.29) 0.76 (0.58-0.99) Afatinib 0.58 0.86 (0.66-1.12) Gefitinib 0.06
For PFS, analyses based on SUCRA values suggest higher probability that dacomitinib is superior to
afatinib but there is no significant difference between the two drugs (PFS HR 0.80; 95% CI 0.57-1.12).
As for PFS, OS analyses based on SUCRA values suggest higher probability that dacomitinib is superior
to afatinib but there is no significant difference between the two drugs (OS HR 0.88; 95% CI 0.61-
1.29).

58
In summary, there were greater SUCRA values for dacomitinib with respect to both survival outcomes,
however there was no statistically significant difference between dacomitinib and afatinib.
Given the potential violation of transitivity assumption which was previously emphasized, these
analyses must be viewed as exploratory.
ERG summary
The CS adequately describes the methods of their NMA approaches and provides a justification for
using the FP analysis which the ERG considers to be reasonable. However, the ERG has concerns over
the use of the FP analysis, in particular with respect to the extrapolations (see Section 5.2.6 below) but
also because there are no detailed results or interpretation of the findings. In addition, the CS does not
adequately assess the included study populations for transitivity and the ERG considers that the
transitivity assumption may be violated. Finally, the CS does not present results of the indirect
comparison between dacomitinib and afatinib. Although caution is recommended in the interpretation
of the ERG analyses these show no significant differences between the two respective treatments.
4.5 Additional work on clinical effectiveness undertaken by the ERG
Additional work carried out by the ERG has been described under the relevant subheadings above (see
Section 4.2.3 for ERG summary of adverse events from other dacomitinib trials; Table 12 for
comparison of key results between ARCHER 1050 and LUX-Lung 7 trials; and Section 4.4 for ERG’s
indirect comparison of dacomitinib and afatinib via the traditional NMA).
4.6 Conclusions of the clinical effectiveness section
A reasonable quality systematic review identified a single relevant trial which compared dacomitinib
with gefitinib in EGFR-positive NSCLC. The ERG did not identify any other trials of relevance to the
decision problem for effectiveness but did identify other trials of dacomitinib for safety outcomes. The
included trial, ARCHER 1050, had a high risk of performance bias owing to the open label design and
there are imbalances in potential prognostic factors between arms. A statistically significant
improvement in the primary outcome of PFS was found in favour of dacomitinib and some, but not all,
secondary outcomes also favoured dacomitinib. There were higher rates of some adverse events with
dacomitinib. The ERG has raised some issues with the trial statistics that should be considered when
interpreting the results of the trial.
As there was no trial evidence comparing dacomitinib to either erlotinib or afatinib, an NMA was
undertaken to compare dacomitinib to afatinib. The CS made a reasonable assumption that erlotinib is
equivalent to gefitinib. There are a number of areas of uncertainty in the NMA including whether the

59
populations in the two trials were homogeneous enough to be compared and the suitability of the results
to the extrapolations required for the cost-effectiveness analysis.
The CS stated that patient characteristics of the ARCHER 1050 trial were representative of the intended
population, however, the ERG believes the trial population may not be generalisable to the population
in England and Wales. The ERG requested further details to allow a comparison of the demographic
characteristics from ARCHER 1050 and the intended population to be made (clarification A7). The
company responded that no UK specific information was identified, and noted that patient
characteristics were similar to those in other clinical trial populations and these had been acknowledged
at recent [NICE technology appraisal] committees as being broadly generalisable. The ERG notes that
the population of ARCHER 1050 was limited to the two most common EGFR mutations and excluded
people with brain metastases, who would make up a reasonable proportion of EGFR-positive NSCLC
cases in first-line clinical practice. There was also a high proportion of Asian participants. There is no
consistent evidence for the influence of ethnicity on outcomes in EGFR mutation positive NSCLC,
including from the company’s own subgroup analyses, but the ERG notes uncertainty as to whether the
observed effectiveness of dacomitinib compared to gefitinib could be expected to be repeated in the UK
population.

60
5 COST-EFFECTIVENESS
This section describes and critiques the following comparisons, which were presented in the CS:
Dacomitinib with confidential PAS discount put forward by the company versus comparators
(afatinib, erlotinib and gefitinib) with PAS discounts calculated and assumed to be true by the
company (presented in the main body of the Company Submission (CS) and appraised below,
in Section 5.3.1.)
Dacomitinib at list price versus comparators at list price (presented in the CS Appendix M and
appraised in Section 5.3.2. below)
During communication with the NICE Technical Team for this appraisal, it was requested and agreed
that a further comparison should be carried out and presented in the ERG report:
Dacomitinib with the company’s PAS discount versus the gefitinib, erlotinib and afatinib at list
prices (not presented in the CS, reported in Section 5.4 below).
In addition, the ERG has prepared a Confidential Appendix, which is provided as a separate document
and focuses on the comparison between:
Dacomitinib with confidential PAS discount applied by Pfizer versus comparators with
confirmed confidential PAS discounts provided by NICE.
In the ERG’s opinion, the latter comparison—reported in the Confidential Appendix accompanying this
report—is likely to be the most relevant and informative for decision making.
5.1 ERG comment on company’s review of cost-effectiveness evidence
The company undertook a systematic review of the cost-effectiveness literature to identify studies post
2012 that reported the results of economic analyses for people receiving treatment for EGFR mutation-
positive advanced/metastatic NSCLC.
The company provided an appropriate description of the cost-effectiveness systematic review, which
included the search strategy, inclusion/exclusion criteria, and a synopsis of the studies included in the
review. On clarification the company also provided with reason those studies excluded from the review.
5.1.1 Search strategy
Searches were conducted on 1 August 2018 in a range of relevant databases (MEDLINE (PubMed),
Embase (Ovid), The HTA Database and NHSEED via the Cochrane Library (Wiley), EconLIT

61
(EBSCO)). The methods used were similar to those used in a previous submission for the same
condition.43 Searches were limited to records identified as published after 1 January 2012, in English.
Certain publication types (editorials, letters and commentaries) and records with terms for animals
(unless they also included terms for humans) were excluded.
In addition, five relevant conferences, NICE and the Scottish Medicines Consortium websites and
reference lists of relevant systematic reviews were searched. No record of a search of Clinicaltrials.gov
is included, although searches in this source are mentioned in CS appendix G (section G.1.3). Database
search terms were optimised for sensitivity, combining a suitable range of terms for NSCLC and cost-
effectiveness.
5.1.2 Inclusion criteria
A summary of the inclusion criteria used to identify potentially relevant studies is presented in Table
16 below.
Table 16: Eligibility criteria for cost-effectiveness searches.
Category Definition Patient population Adults (≥18) with locally advanced (stage IIIb) or metastatic (stage IV)
EGFR+ NSCLC previously untreated with systemic cancer therapies (i.e. receiving first-line therapy)
Interventions Dacomitinib Comparator Erlotinib
Gefitinib Afatinib
Outcomes QALYs/DALYs/LYG (total and incremental) Costs: total, drug costs, other costs (per arm) ICERs: cost per QALY/DALY/LYG, cost per event avoided
Study type Cost-effectiveness analyses Cost-utility analyses Cost-benefit analyses Cost-minimisation analyses Cost-consequence analyses Systematic reviews of any of the above (included at the abstract
review stage, then excluded following hand-searching of their reference lists at the full-text review stage)
Language of publication
English language
Limitations Studies published before 6 March 2012 DALY, disability life-years; EGFR, epidermal growth factor receptor; ICERs, incremental cost-effectiveness ratio; LYG, life years gained; NSCLC, non-small cell lung cancer; QALY, quality adjusted life-years.
62
5.1.3 Included studies
Of the 6714 titles/abstracts screened, 31 publications representing 28 unique studies were included in
the review, with three studies being health technology assessment (HTA) monographs and three being
Scottish Medical Consortium (SMC) submissions, published after 2012. The majority of the
publications identified were abstracts, while one study44 was a full publication. All of the studies
identified assessed the cost-effectiveness of treatments for a population of patients with EGFR
mutation-positive NSCLC; however, none of the studies identified included dacomitinib as a
comparator. Table 17 reports the economic characteristics and results of the studies included in the
systematic review.
The company’s systematic review of the published cost-effectiveness studies describing dacomitinib as
a first-line treatment for EGFR M+ with advanced/metastatic NSCLC did not identify any relevant
references. The ERG are satisfied with the company’s systematic review and are confident that the
company has not missed any relevant cost-effectiveness studies that included dacomitinib.

63
Table 17: Summary of the key characteristics of the cost-effectiveness studies identified
Author Population Intervention
and comparator
Perspective and time horizon
Model type and cycle length
Health states Evidence synthesis
Source of preference
data Outcomes Results
Chouaid et al., 201744
EGFR positive with advanced/metastatic NSCLC
Afatinib compared to gefitinib
French National Health Authority; 10 years
Partitioned survival model with monthly cycle lengths
Progression-free, progressed and dead
Lux-Lung 7 trial
Chouaid et al. 2013
LYG and QALYs
ITT population: approximately €45,200 per QALY. PSA showed that afatinib compared to gefitinib had a probability of 1 of being cost-effective at WTP thresholds > €70,000 per QALY
TA25845 EGFR positive with advanced/metastatic NSCLC
Erlotinib compared to gefitinib
NHS and PSS; 10 years
Semi-Markov with monthly cycle lengths
Progression-free, progressed disease and dead
EURTAC trial
Nafees et al. 2008
LYG and QALY
The ICER for erlotinib compared to gefitinib is approximately £21,900 per QALY. PSA showed that erlotinib compared to gefitinib had a probability of 0.63 of being cost-effective at a WTP threshold of £30,000 per QALY
TA31043 EGFR positive with advanced/metastatic NSCLC
Afatinib compared to gefitinib and erlotinib
NHS and PSS; 10 years
Partitioned survival model with monthly cycle lengths
Progression-free, progressed and dead
LUX-Lung 3 trial, and mixed treatment comparison
LUX-Lung trial, Chouaid et al. 2012, Nafees et al. 2008
LYG and QALYs
The ICER for afatinib compared to erlotinib was approximately £10,100 per QALY gained, whilst it was approximately £17,800 per QALY for the comparison between afatinib and gefitinib. PSAs were redacted.
TA19246 EGFR positive with advanced/metastatic NSCLC
Gefitinib compared to chemotherapy
NHS and PSS; 5 years
Markov state transition model with 21-day cycles
Progression-free (stable disease), progression-free (treatment response), disease progression (2nd line docetaxel or erlotinib or BSC) and dead
Mixed treatment comparison
Nafees et al. 2008
QALYs The ICER for gefitinib compared to gemcitabine/cisplatin was approximately £28,600 per QALY. At a WTP threshold of £30,000 per QALY, there was a 0.18 probability of gefitinib likely to be cost-effective when compared to gemcitabine/carboplatin
EGFR, epidermal growth factor receptor; NHS, National Health Service; LYG, life years gained; NSCLC, non-small cell lung cancer; PSA, probabilistic sensitivity analysis; PSS, personal social services; QALY, quality adjusted life-years; WTP, willingness-to-pay

64
5.1.4 Systematic review of studies reporting resource use and costs.
The company’s systematic review of relevant studies reporting information on resource use and
costs is in the form of an update of a previous review. Briefly, the company identified a recent
systematic review conducted in March 2017,47 and updated/extended the search contained in it to
cover the remaining period until August 2018. The search was restricted to studies published in
English that reported resource use and costs from a UK perspective. A wide range of cost and
resource use terms were included in the database searches. However, database searches may have
missed some studies because they included terms for the stage of the disease (advanced/metastatic)
and a basic set of UK search terms (a more sensitive, validated UK geographic search filter for
Medline is available48). From the 82 titles/abstracts screened, one study49 was identified. The main
objective of this study was to describe the rate of neutropenic sepsis in people with NSCLC treated
with docetaxel monotherapy following relapse after first-line therapy in a ‘real world’ UK clinical
setting. Additionally, other objectives were to document the resource use and costs associated with
the management of NSCLC patients with confirmed or suspected neutropenic sepsis.
5.1.5 Systematic review of HRQoL studies
The company performed a systematic review to identify relevant HRQoL evidence for use in the
submitted cost-effectiveness analysis. This was an update of a previous systematic review which
was conducted in March 2017 to inform the submission for TA529.47
Searches were carried out on 1 August 2018 in a range of relevant databases (MEDLINE (Ovid),
Embase (Ovid), CDSR, DARE, CENTRAL, The HTA Database and NHSEED via the Cochrane
Library (Wiley), EconLIT (EBSCO)). Searches were limited to records identified as published after
1 January 2017. A list of the eligibility criteria used by the company can be seen in Table 18. In
addition, five relevant conferences, NICE and the Scottish Medicines Consortium websites and
reference lists of relevant systematic reviews were searched. Database searches combined a suitable
range of terms for NSCLC, but were less sensitive than the searches undertaken for the clinical and
published cost-effectiveness studies reviews because they included terms for the stage of the
disease (advanced/metastatic) and a number of specific HRQoL terms (e.g. “utility values” OR
“utility scores” rather than utilit*).

65
Table 18: Eligibility criteria for inclusion in the utility review.
PICOS Domain Inclusion criteria Exclusion criteria Patient population Adults (≥18) with locally advanced
(stage IIIb) or metastatic (stage IV) NSCLC. Advanced or metastatic lung cancer patients could be the focus of the study or could alternatively be a subgroup of a broader lung cancer patient population, as long as results were presented separately for the advanced or metastatic lung cancer patients specifically.
Patients without advanced or metastatic lung cancer
Patients only identified as having lung cancer
A mixed patient population by disease stage, with results not presented separately for advanced or metastatic lung cancer patients
Populations with other cancers
Adolescents and children
Intervention(s) None specified Comparator(s) None specified Outcome measures Health state utility as measured by
one of:
Any generic QOL scale with established utility scoring
or
A direct measure of health state utility such as TTO or SG
No health state utility data Health state utilities not
presented by stage of disease
Health utilities not presented by line of treatment
Health state utility data not "novel" (e.g. the study was a cost-utility study, with utilities obtained from the literature)
Study design Studies reporting directly-elicited utility values and utility decrements
Observational studies that measured HRQoL and utilities (or utility decrements)
RCTs of treatments for NSCLC, where the investigators collected HRQoL data as the primary or secondary outcome measure, and from which utility estimates were collected using validated elicitation measures (e.g. EQ-5D, SF-6D)
SLRs of any of the above (included at the abstract review stage, then excluded following hand-searching of their
Non-specific systematic literature reviews or meta-analyses
Editorials or notes or letters to the editor
Studies containing no primary data
Studies which do not report utility or disutility scores from a validated instrument
Conference abstracts which do not report utility values

66
reference lists at the full-text review stage)
Restrictions English language
Non-English language articles
Date of publication prior to 17 March 2017
EQ-5D, EuroQol five dimensions; HRQoL, Health-related quality of life; NSCLC, Non-small-cell lung cancer; QOL, quality of life; RCTs, randomised controlled trials; SF-6D, Short-Form Six-Dimension; SG, standard gamble; SLR, systematic literature review; TTO, time trade-off.
5.1.6 Results
The company performed a systematic review to identify relevant health quality of life evidence for
use in the cost-effectiveness analysis. This was a search updating a previous systematic that was
conducted in March 2017 to inform the submission for TA529.47 The search for TA529 identified
33 publications resulting in 22 separate studies eligible for inclusion.
In the updated search, three publications covering three unique studies and three HTA submissions
were identified for inclusion.
Nafees et al. (2008)50 used a questionnaire which had been adapted and validated by
clinical experts from an existing metastatic breast cancer health state questionnaire, to
describe metastatic NSCLC patients receiving second-line treatment. Standard gamble
interviews were performed with 100 members of the UK general public to elicit societal
utility values for various stages of NSCLC and grade III-IV toxicities associated with
treatment. Utility values of 0.653 for stable disease and no side effects, and 0.473 with
progressive disease were derived.
Labbé et al.2 sought to derive health state utility scores using the EQ-5D-3L questionnaire
in a longitudinal cohort of 475 Canadian outpatients diagnosed with metastatic lung
cancer across various disease states (EGFR, anaplastic lymphoma kinase [ALK], SCLC,
wild-type NSCLC). Varying follow up time occurred between patients with a median of
12 months (range: 0-201 months) post-diagnosis. Utility values obtained for the EGFR
population (n = 112/475) using UK preference weights elicited through time-trade off
(TTO)51 stable on most appropriate treatment (TKI) 0.77±0.02 and 0.64±0.03 for
progressive disease.

67
Huang et al., (2017)52 evaluated the cost-effectiveness of pembrolizumab compared with
standard-of-care (SoC) platinum-based chemotherapy as first-line treatment in patients
with metastatic non-small-cell lung cancer (NSCLC). They used EQ-5D values obtained
from patients in the KEYNOTE-024 randomised controlled trial which consisted of
patients aged ≥18 years (mean age 64 years) with a diagnosis of stage IV NSCLC but
specifically without EGFR-activating mutations or ALK translocations. Time-to-death
utilities from pooled treatment groups were reported but despite use of EQ-5D-3L it was
unclear which population-based preference weights were applied to generate utilities.
The systematic review also identified three NICE Technology Appraisal documents: TA48353,
TA48454 and TA520,55 which were fully reported on in Appendix H of the company submission.
5.1.7 Conclusions
The company’s systematic review of the published cost-effectiveness evidence assessing
dacomitinib as a first-line treatment for EGFR M+ with advanced/metastatic NSCLC did not
identify any relevant cost-effectiveness studies. The ERG are satisfied with the company’s
systematic review and are reasonably confident that there are no relevant cost-effectiveness studies
that include dacomitinib as a comparator in the specific patient population. Additionally, we are
satisfied that the company undertook a systematic review to identify studies reporting resource use,
costs and HRQoL information, and we consider these reviews to have used appropriate methods.
5.2 Summary and critique of company’s submitted economic evaluation by the
ERG
As part of their submission to NICE, the company made available a detailed description of their
economic analysis and a partitioned survival model developed in Microsoft Excel®. A combined
summary and critique of the inputs and methods employed in the submitted economic analysis is
presented in the following sections.
5.2.1 NICE reference case checklist
The ERG have undertaken an evaluation of the CS in relation to the NICE reference case. Findings
are summarised in Table 19 below.

68
Table 19: NICE reference case checklist
Attribute Reference case and TA Methods guidance
Does the de novo economic evaluation match the reference case
Defining the decision problem
The scope developed by NICE Decision problem clearly stated and is in line with the scope developed by NICE
Comparator(s) Therapies routinely used in the NHS, including technologies regarded as current best practice for this population
Dacomitinib is being compared to gefitinib, erlotinib or afatinib
Patient group As per NICE final scope, the population refers to: People living with advanced NSCLC
As per NICE final scope
Perspective costs NHS & Personal Social Services Yes Perspective benefits All health effects on individuals Yes Form of economic evaluation
Cost-effectiveness analysis Cost-effectiveness analysis
Time horizon Sufficient to capture differences in costs and outcomes between the technologies being compared
15-year time horizon
Synthesis of evidence on outcomes
Systematic review Systematic review was undertaken by the company
Outcome measure Quality adjusted life-years Results reported in terms of quality adjusted life-years
Health states for QALY
Described using a standardised and validated instrument
Yes
Benefit valuation Time-trade off or standard gamble The standard UK EQ-5D tariff is used, which is based upon time-trade off
Source of preference data for valuation of changes in HRQoL
Representative sample of the public Yes
Discount rate An annual rate of 3.5% on both costs and health effects
Yes
Equity
An additional QALY has the same weight regardless of the other characteristics of the individuals receiving the health benefit
Yes
Probabilistic modelling
Probabilistic modelling The company undertook PSA and reported these results
Sensitivity analysis The company undertook a range of sensitivity analyses.
HRQoL; health-related quality of life; NHS; National Health Service; NICE; National Institute for Health and Care Excellence; NSCLC; non-small cell lung cancer; PSA; probabilistic sensitivity analysis; QALY, quality-adjusted life years;

69
5.2.2 Model structure
The company constructed a partitioned survival model to show the experience of a cohort treatment
naïve participants with locally advanced or metastatic non-small cell lung cancer with activating
mutations in epidermal growth factor receptor (EGFR) who may undergo treatment with
dacomitinib compared to gefitinib, erlotinib or afatinib. Partitioned survival modelling considers
the progression-free survival curve and the overall survival curve directly, with the time in
progression calculated using the difference in area between the two curves (see Figure 3). The
company’s model is characterised by three health states: progression-free, post-progression
(progressed disease) and dead. Figure 4 shows the illustrative model structure.
Figure 3: Illustrative survival model (obtained from the CS)

70
Figure 4: Illustrative model structure (obtained from the submission)
The model started from a hypothetical cohort of people, all of whom began in the progression-free
health state. Over time, people were at risk of progression or death. Transitions between health
states was unidirectional and occurred at the end of each 28-day cycle, where people remained in
the same health state or progressed. Each cycle, people incurred costs and accrued benefits
(QALYs) depending on the health state they occupied. A half-cycle correction was applied in the
base-case and the model concluded at a 15-year time horizon.
ERG summary
The partitioned survival model appears to capture the key important features (overall survival and
progression-free survival) of people living with locally advanced or metastatic NSCLC with EGFR.
However, it should be noted that model does not capture survival following second and third-line
treatment directly or separately. Instead, time in post-progression survival was derived using the
area under the curve approach; the difference in the survival between overall and progression-free
survival. The 28-day cycle length is adequate to capture the changes to the disease over short
periods of time.

71
5.2.3 Population
The expected EMA marketing authorisation is for treatment-naïve people with locally advanced or
metastatic NSCLC with activating mutations in EGFR. The population modelled was based on the
participants in the ARCHER-1050 phase III clinical trial. In the ARCHER 1050 trial participants
were randomised to dacomitinib or gefitinib. Details of the patient characteristics in the ARCHER
1050 trial are presented in Section 4.2.1. Patients in the modelled cohort had an average starting
age of 62 years with 60% being female, which reflected some of the characteristics of people
included in ARCHER 1050. An average body surface area of 1.75m2 was used to estimate the
dosing for second and third-line treatment. This was calculated based on the weighted average by
gender of males 1.89m2 and females 1.65m2. In general, the ERG was satisfied that the population
modelled resembled the patient participants included in the ARCHER 1050 trial.
Upon request at the clarification stage, the company further provided an updated model that allowed
for subgroup analyses to be undertaken separately for the Asian and non-Asian sub-populations.
5.2.4 Intervention and comparators
First line treatment
The company’s base-case analysis evaluated the cost-effectiveness of dacomitinib compared to
gefitinib, erlotinib and afatinib. In the model, the dosing schedule for people receiving dacomitinib
was 45mg/day, and the comparators: gefitinib was 250mg/day, erlotinib 150mg/day and afatinib
40mg/day. All drugs taken orally and in keeping with their marketing authorisation.
Subsequent treatments
Following disease progression, it was assumed that 71% and 48% of people would receive second-
and third-line treatment, respectively. This assumption is based on participants who would be
unable or unwilling to receive subsequent treatment. It was assumed that 60% of people who were
treated with first- or second-generation tyrosine-kinase inhibitors (TKIs) would develop the T790M
mutation and would receive second-line treatment, with majority receiving osimertinib. The
company further stated that a proportion of people would have false negative tests or there would
be difficulties with obtaining a sample for a biopsy. All other participants received platinum doublet
chemotherapy. For third-line treatment, participants who received osimertinib treatment, then
received platinum doublet chemotherapy and for those who received second-line platinum doublet
chemotherapy, then received docetaxel.

72
Table 20: Second- and third-line treatments.
Subsequent treatment Proportion of people receiving second- and third-line
treatment Second-line (%)a Third-line (%)b
Osimertinib 56% - Platinum doublet chemotherapy
44% 56%
Docetaxel - 44% a model assumed that 71% of people who progressed received second-line treatment b model assumed that 48% of original cohort received third-line treatment
ERG summary
The comparators included in the base-case analysis were considered to be appropriate to be
compared against dacomitinib, and in line with the NICE scope for treatment of first-line EGFR+
patients. All comparators were in keeping with their marketing authorisation and licensed dosing
schedule. Also, the ERG considers that the subsequent treatments following first-line treatment to
be appropriate. However, it was not clear what strategy/methods that were used to identify the
EGFR-T790M mutation to guide subsequent treatment decisions.
5.2.5 Perspective, time horizon and discounting
The perspective/viewpoint of the analysis is that of the NHS and personal social services (PSS)
perspective, which is in line with the NICE Guide to the Methods of Technology Appraisal.56 The
model assumes a 15-year time horizon, which is long enough to capture the long-term costs and
benefits of treatment. This time horizon reflects the maximum life expectancy of the cohort
predicted by the base-case parametric survival analysis, where <1% of the cohort were alive at 15
years under the company’s base-case assumptions. In the base-case, costs and benefits are
discounted at a rate of 3.5% per annum. A number of sensitivity and scenario analyses were
undertaken by the company. The company presented sensitivity results based on changes made to
the time horizon of the economic analysis, annual discount rates for costs and benefits.
ERG Summary
The perspective, time horizon and discount rates chosen by the company are in line with the NICE
recommendations,56 and are appropriate to the decision problem.
73
5.2.6 Treatment effectiveness and extrapolation
Four clinical outcomes from ARCHER 1050 were used to inform the transitions between health
states in the model:
Progression-free survival
Overall survival
Adverse events of treatment
Health-related quality of life
5.2.6.1 Time-to-event extrapolation
The company chose to extrapolate both PFS and OS using a combination of parametric and
fractional polynomial (FP) models. A generalised gamma model was fitted separately to both the
observed PFS and OS data of the gefitinib arm of ARCHER 1050 and extrapolated across the model
time horizon. The data used for PFS extrapolation was obtained from Wu et al. (data cut July
2016),1 whereas the OS data came from Mok et al. (data cut February 2017).29
Equivalent efficacy was assumed between gefitinib and erlotinib, whereas for afatinib and
dacomitinib, time-varying hazard ratios of their relative effects to gefitinib were estimated using a
FP network meta-analysis (NMA). The hazard ratios were then applied to the generalised gamma
extrapolation of gefitinib to predict PFS and OS for dacomitinib and afatinib. The ERG have
concerns over this approach, as the resulting extrapolations from FP models can be unstable and
extremely implausible. The company encountered this during their model selection process, and
excluded many FP models based on their implausibility. FP models offer benefits to traditional
parametric curves when fitting to survival data with unusual hazard profiles, but it is unclear
whether they offer a benefit when extrapolating.
5.2.6.2 Progression-free survival
The company selected a parametric curve for gefitinib through consideration of visual fit, goodness-
of-fit statistics and clinical plausibility. They also compared predicted quantiles to those observed
in ARCHER 1050. The parametric models had a similar visual fit, and the goodness-of-fit statistics
suggested that the Weibull, log-logistic and generalised gamma were the best fitting to the data.
The company’s clinical experts stated that whilst the 3-year estimates for the log-logistic and log-
normal were too optimistic, the 5-year estimates were realistic. The log-logistic and log-normal
SUPERSEDED See erratum

74
curves were similar, with log-normal having higher PFS estimates for the first four years, but lower
predictions beyond this. Across the time horizon, the log-normal had a slightly lower estimate for
mean PFS.
The company opted for the generalised gamma, despite stating that its 3 and 5 year PFS estimates
were too low when examined by their clinical experts. They also explored using a log-normal curve
as an alternative scenario.
The extrapolations were compared to external sources of data: LUX-Lung 728, WJTOG 340557 and
Lin 201658. Note that the PFS population from ARCHER 1050 and LUX-Lung 7 had high levels
of censoring and so their long-term follow-up is not complete. In general, the LUX-Lung 7
population were broadly similar to ARCHER 1050, perhaps slightly unhealthier, as mentioned in
the ERG critique of the company’s NMA. The WJTOG 340557 population appear healthier as they
generally had a lower ECOG score and less had stage IV disease. Lin 201658 had the unhealthiest
population due to the proportion of patients with brain metastases and the fact that a large number
of patients entered the study on 2nd or later line of therapy. A comparison of the best three fitting
models and log-normal, alongside the external sources of PFS data are shown in Table 21.
Table 21: Predictions for gefitinib PFS
Distribution Mean Median Proportion progression-free at 2 years 3 years 4 years 5 years
Weibull ***** ***** **** **** **** ****
Log-logistic ***** **** ***** **** **** ****
Log-normal ***** **** ***** **** **** ****
Gen gamma ***** ***** **** **** **** ****
ARCHER 10501 (n=225) - 9.23 9.6% - - -
LUX-Lung 728 (n=159) - 10.9 7.75% 4.92% - -
WJTOG 340557 (n=86) - 9.6 12-14% 6-7% 6-7% 6-7%
Lin 201658 (n=137*) - 12.1 16% 8.9% 3.6% 0% *Patients received either gefitinib or erlotinib. Values in this table were extracted before the half cycle correction was applied. All entries in this table are based on the company’s initial submission which used PFS data from Park 2016, and not Paz-Ares 2017.
It is apparent that the pessimistic extrapolations for PFS correspond with the increasing hazard
function, which results from the generalised gamma model, as shown in Figure 5. The ERG suggest
a decreasing hazard better represents the observed data in ARCHER 1050, and will result in a more
plausible long-term extrapolation.

75
Figure 5: Hazard plot of PFS for gefitinib ARCHER 1050
Considering this, the ERG believe the company’s generalised gamma extrapolation may be too
pessimistic beyond two years, and considered the log-normal and log-logistic models, and
alternatively using a two-phase piecewise model (e.g. KM data followed by a parametric
extrapolation), in later analyses.
The company modelled the PFS for erlotinib by assuming equivalent efficacy with gefitinib. The
PFS for both dacomitinib and afatinib were extrapolated using the FP model with P1 = 0.5 and P2
= 1.5, chosen by the company as the model with best fitting model that yielded plausible estimates,
applied to the generalised gamma model fitted to the ARCHER 1050 gefitinib population. The
company rejected the best fitting model as it predicted a sharp increase in the dacomitinib HR from
24 months, and opted for the P1 = 0.5 and P2 = 1.5 which was among the best fitting and yielded
relatively more plausible results, but still predicted a sharp increase in the dacomitinib hazard from
36 months (Figure 6).
In the initial company submission, the FP NMA used PFS data generated from the Park et al. 2016
paper27 of LUX-Lung 7. However, the company submitted an updated economic model during the
appraisal process using PFS data from the Paz-Ares 2017 paper28 of LUX-Lung 7.28 The KM graphs
of the two papers look very similar (Figure 7), and it was expected that this update would have
minimal impact on the economic model, however it significantly changed the resulting HRs from
the company’s FP NMA (Figure 6). This demonstrates how sensitive the FP NMA models can be,
and suggests that considerable uncertainty remains in the extrapolations. The company’s
corresponding survival curves are shown in Figure 8.
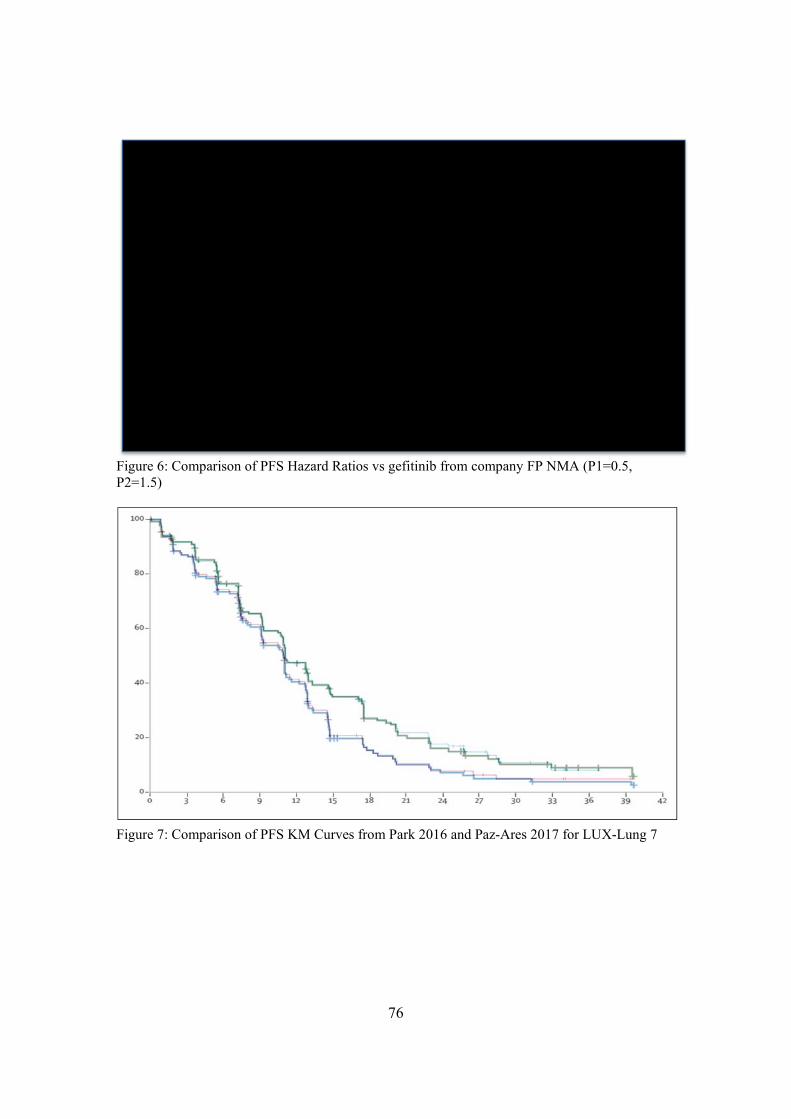
76
Figure 6: Comparison of PFS Hazard Ratios vs gefitinib from company FP NMA (P1=0.5, P2=1.5)
Figure 7: Comparison of PFS KM Curves from Park 2016 and Paz-Ares 2017 for LUX-Lung 7

77
Figure 8: PFS curves under company base-case: generalised gamma and P1=0.5, P2=1.5
The company’s base-case analysis, shown in Figure 8, applying the P1=0.5, P2=1.5 to the gen-
gamma curve resulted in PFS curves which suggest that dacomitinib has the highest PFS until 38
months, beyond which afatinib has the highest PFS. There were less than 5% of patients remaining
in the PF health state across all treatments at 38 months suggesting the impact of this implausibility
may be small. However when gefitinib is modelled using a log-normal curve, dacomitinib crosses
both the gefitinib and afatinib curves, due to the higher tail of the log-normal graph combined with
the sharply increasing dacomitinib hazard ratio. The ERG believe that this model is pessimistic of
the PFS for dacomitinib, and optimistic for afatinib.
The ERG were not aware of any clinical rationale for dacomitinib to have less progression-free
patients than the comparators, and this led us to consider the other FP models provided by the
company, applied to the log-normal extrapolation. The only model to improve the PFS for
dacomitinib was the P1=0.5, P2=1 FP model, however this resulted in implausibly optimistic
predictions for the afatinib (Figure 9). Hence, the ERG considered alternative approaches to the
company’s FP NMA to produce plausible extrapolations for afatinib.
78
Figure 9: PFS Curve of P1=0.5, P2=1
To improve the plausibility of the extrapolation for afatinib, the ERG first considered assuming that
the number of patients remaining progression-free on afatinib would match the number
progression-free on dacomitinib, from where the afatinib and dacomitinib curves cross at 55
months.
This assumption prevented the over-optimistic extrapolation for afatinib, but implied that the initial
benefit of dacomitinib relative to afatinib, in terms of proportion of progression-free patients, is lost
from 55 months. This was considered unlikely by the ERG, due to the fact that patients would still
be receiving treatment. This assumption was explored by the ERG in a scenario analysis.
To further improve the afatinib extrapolation the ERG chose a novel approach to model the PFS of
afatinib from 36 months, which is roughly when the observed period for PFS ends in both ARCHER
1050 and LUX-Lung 7, as the mean average of the proportions progression-free in both the gefitinib
and dacomitinib arms. This maintains the difference in PFS curves, and provides plausible
extrapolations for all comparators in the economic model. A comparison of the survival curves
against the company’s preferred PFS curves are shown in Figure 10. The ERG believe that this
approach may underestimate the number of PFS patients in the dacomitinib arm beyond 48 months
as it uses the hazard ratios shown in Figure 11, where the HR for dacomitinib appears to grow
exponentially. This would result in an underestimation of both the costs and QALYs of dacomitinib,
as patients beyond this point are likely to remain progression-free and on first-line treatment for

79
less time in the model than expected, potentially underestimating the ICER. The consequence of
the ERG’s assumption of linking the efficacy of dacomitinib and afatinib is that the afatinib
extrapolation beyond 48 months may also be affected. The ERG were not able to robustly improve
this assumption within the model provided by the company in the timeframe of this appraisal. A
comparison of the models is shown in Table 22.
Figure 10: Comparison of Company (dashed) and ERG (solid) preferred PFS extrapolations.
Figure 11: Hazard Ratios of Company (solid) and ERG (dashed) preferred PFS FP model.

80
Table 22: PFS Predictions for Dacomitinib and Afatinib
Distribution Drug Mean
(months) Median
(months) Proportion PF at
2 years 3 years 4 years 5 years
Gefitinib Log Normal Gefitinib ***** **** ***** **** **** ****
P1=0.5, P2=1.5 on Gen Gamma
(Company Base-case)
Dacomitinib
Afatinib *********** *********** *********** ********* ********* *********
P1=0.5, P2=1.5 on Log-Normal Dacomitinib
Afatinib *********** *********** *********** *********** ********* *********
P1=0.5, P2=1 on Log-Normal Dacomitinib
Afatinib *********** *********** *********** *********** ********** *********
P1=0.5, P2=1 on Log-Normal with Afatinib PFS = Dacomitinib PFS from 55 months
Dacomitinib
Afatinib *********** *********** *********** *********** ********** *********
P1=0.5, P2=1 on Log-Normal with Afatinib PFS = mean of Dacomitinib and Gefitinib PFS from 36 months.
Dacomitinib
Afatinib *********** *********** *********** *********** ********** *********
ARCHER 1050 1 (n=225) Dacomitinib - 14.65 30% - - -
LUX-Lung 7 28 (n=160) Afatinib - 11.0 16% 9% - -
Values in this table were extracted before the half cycle correction was applied. All entries in this table are based on the company’s latest, using PFS data from Paz-Ares 2017.
81
ERG Summary
The company approach to PFS was pessimistic for all considered first-line treatments. The ERG
chose a different parametric curve (log-normal) for gefitinib that predicts more patients to be
progression-free at 5 years than under the company’s assumptions. When applying the HR from
the company’s FP NMA, the extrapolations appeared implausible. The ERG chose a different FP
model (P1=0.5, P2= 1) which improved the dacomitinib PFS extrapolation, but may still be
pessimistic in the tail. The afatinib extrapolation remained implausible, and so the ERG resorted to
modelling the proportion of progression-free afatinib patients as the mean of the proportions from
the dacomitinib and gefitinib progression-free populations.
5.2.6.3 Overall survival
The company took a similar approach in their modelling of OS. They fitted a range of parametric
models to the OS data from the gefitinib arm of ARCHER 1050 and selected a model based on the
statistical goodness-of-fit, clinical plausibility and visual fit. Predictions are shown in Table 23
below, alongside comparisons to external data.
The company selected the generalised gamma as they felt the predictions were most in line with
the external studies, and explored the log-logistic in a scenario analysis. The ERG believe that the
generalised gamma may underestimate OS for gefitinib patients in ARCHER 1050 as the estimates
are consistently below what was observed in Lin 2016, which has an unhealthier population than
ARCHER 1050. The ERG’s clinical adviser also stated that they expected up to 5% of patients to
still be alive at 15 years. Hence the ERG will consider the log-logistic distribution as it is consistent
with the 5 and 7 year data from both Lin 2016 and WJTOG 3405, in addition to exploring using
KM data followed by a parametric curve, in later analyses. The log-logistic distribution also had
the lowest AIC and BIC scores.

82
Table 23: OS goodness of fit and predictions for gefitinib.
Distribution AIC BIC Mean (months)
Median (months)
Proportion (%) alive at
3 years 5 years 7 years 10 years 15 years
Exponential 488.64 492.06 ***** ***** ***** ***** ***** **** ****
Weibull 461.29 468.12 ***** ***** ***** **** **** **** ****
Gompertz 474.30 481.14 ***** ***** ***** **** **** **** ****
Log-logistic 455.76 462.59 ***** ***** ***** ***** **** **** ****
Log-normal 463.23 470.06 ***** ***** ***** ***** ***** **** ****
Generalised gamma
460.69 470.94 ***** ***** ***** ***** **** **** ****
KM + Expo - - ***** ***** ***** ***** **** **** ****
ARCHER 1050 - - - 26.84 41.8% - - - -
LUX-Lung 7 - - - 24.5 32.3% - - - -
WJTOG 3405 - - - 34.8 48% 20% - - -
Lin 2016 - - - 30.9 40% 15% 6.5% - -
Values in this table were extracted before the half cycle correction was applied.

83
The company modelled the OS of erlotinib by assuming equivalent efficacy with gefitinib. For
afatinib and dacomitinib, the company applied the time varying hazard ratios obtained from their
FP NMA of the OS data from the ARCHER 1050 and LUX-Lung 7 trials. The company initially
considered second-order FPs as these were the best fitting to the data, however none provided a
plausible extrapolation, a consensus shared by the ERG. The company selected the best fitting first
order FP (P1=-0.5) as they felt it provided plausible predictions for both afatinib and dacomitinib.
The hazard ratios are shown in Figure 12, and the corresponding survival curves in Figure 13.
Figure 12: Hazard ratios applied to gefitinib extrapolation comparators in company base-case (P1=-0.5)
Figure 13: OS Curves from company base-case

84
It is apparent that the effect of afatinib relative to gefitinib decreases and appears to tend towards 1
across the time horizon of the model, which could be interpreted as a gradual waning effect.
However, the efficacy of dacomitinib appears to increase across the time horizon, with the hazard
ratio reducing. This results in a clear difference between the long term OS predictions for
dacomitinib and gefitinib (Figure 13), of which the ERG’s clinical advisor was unconvinced. When
applied to the log-logistic extrapolation, the company’s FP predicts XX% alive on dacomitinib
compared to XX % on gefitinib.
The ERG are not aware of any evidence or clinical rationale to support this optimistic prediction
for dacomitinib, nor the contrast between the behaviours of the dacomitinib PFS and OS ratios.
Recall that for PFS, under the company’s FP NMA the HR for dacomitinib grew seemingly
exponentially, yet for OS the HR for dacomitinib improves constantly over time. Whilst for
afatinib, the PFS improved over time whilst the OS worsened. This contrast between afatinib and
dacomitinib is not supported by any clinical rationale, and sheds further doubt over the reliability
of the FP analysis extrapolations. The ERG did not consider the other single order FP model to be
an improvement in terms of plausibility, with the survival curves for dacomitinib appearing to be
almost identical.
Recall also that the company failed to provide evidence of a significant difference between
dacomitinib and afatinib for OS in their clinical section. The ERG considered alternative
approaches to the extrapolation of dacomitinib OS, including the assumption of equivalency of
dacomitinib and afatinib by assuming the FP OS HR from afatinib for both interventions. A
summary of the predictions made by the models explored by the ERG is presented in Table 24.
SUPERSEDED See erratum

85
Table 24: OS predictions for dacomitinib and afatinib
Distribution Drug Mean Median Proportion alive at 3 years 5 years 7 years 10 years 15 years
Gefitinib Gen Gamma
Gefitinib ***** ***** ***** ***** **** **** ****
P1=0.5 on Gen Gamma (Company base-case)
Dacomitinib Afatinib
*********** *********** *********** *********** ********** ********* *********
P1=0.5 on Log-Logistic
Dacomitinib Afatinib
*********** *********** *********** *********** *********** ********** *********
Constant HR on Log-Logistic
Dacomitinib Afatinib
*********** ********* *********** *********** *********** ********** *********
KM + Exponential
Dacomitinib Afatinib*
******* ******* ******* ******* ******* ****** ******
P1=0.5 on Gen Gamma with HR=1 after 3 years
Dacomitinib Afatinib
*********** *********** *********** *********** ********* ********* *********
P1=0.5 on Log-Logistic with HR=1 after 3 years
Dacomitinib Afatinib
*********** *********** *********** *********** *********** ********* *********
ARCHER 10501 (n=225)
Dacomitinib - 34.1 43.1% - - - -
LUX-Lung 728 (n=160)
Afatinib - 27.9 38.2% - - - -
Values in this table were extracted before the half cycle correction was applied. *Model functionality did not allow comparison with afatinib to be made when using KM+Parametric Fit

86
When considering alternative approaches to OS modelling, the ERG noted that the observed OS
data from ARCHER 1050 were heavily censored from 30 months onwards, and so we could not be
certain of the behaviour of the OS curves beyond this point. Given the unreliability of the FP models
in this appraisal, the ERG requested that the company would implement an assumption of a HR=1
for the OS of all comparators from 36 months. This approach avoids the extrapolating with the FP
output, and instead uses the hazard modelled by the parametric model fitted to the gefitinib arm of
ARCHER 1050, accounting for the perceived benefit that occurred during the observed trial follow-
up. This request was also based on the lack of relevant data beyond 36 months. For example,
ARCHER 1050 had 14 and 12 patients at risk at 36 months in the dacomitinib and gefitinib arms
respectively, which fell to 3 and 3 at 42 months respectively. The ERG also digitised the cumulative
hazard plots of OS from ARCHER 1050 provided by the company. These were seen to be parallel
from 27 months, suggesting there was no difference in OS efficacy beyond this point.
The ERG acknowledge that implementing the HR=1 assumption from 48 months and 60 months
could also be considered plausible, and investigated these in scenario analyses.
The ERG also fitted a restricted cubic spline model to digitised OS data from ARCHER 1050 and
LUX-Lung 7 trials, Figure 14, which shows that the HR for dacomitinib vs gefitinib crosses 1 at
roughly 24 months. This is consistent with the second order FP models fitted by the company which
also demonstrated a similar diminishing of the OS benefit on the hazard scale. It is worth noting
that at 24 months there remains 138 and 113 people at risk of death in dacomitinib and gefitinib
arms respectively, meaning this reduction in effect should not be dismissed as a result of censoring.
Whilst the company did provide this functionality to the model, they objected to its use on the
following grounds:
It is based on censored data that is driven small patient numbers
It disregards the trend seen in the observed data prior to this point
It abandons the parametric curve fits that have been modelled in line with DSU
guidelines59

87
Figure 14: OS hazard ratio from spline model fitted to digitised data from ARCHER 1050 and LUX-Lung 7

88
The ERG agree with the first point, that it is unclear what happens beyond the trial follow-up, but
this argument could be placed against the company’s own base-case analysis . The second point is
unclear to the ERG. The trends are most accurately captured by the second order FP models (see
company appendix D.6.3), which almost all demonstrated a sharply increasing OS hazard from
around 20 months. The ERG also performed their own analysis on digitised data from ARCHER
1050, and fitted flexible parametric models using restricted cubic splines60, which confirmed a trend
of a sharply increasing hazard from around 2 years. Finally, without the company being more
specific in their third point, the ERG believe their criticism to incorrect as the generalised gamma
parametric curve fitted to the gefitinib arm is unaffected by this assumption.
The company also argued that implementing the OS HR=1 from 3 years results in a lower post-
progression survival for dacomitinib patients than the comparators, which led them to question the
clinical validity. However, assuming that dacomitinib offers the most pre-progression survival gain,
it is plausible that post-progression survival could be equal or less than the post-progression
survival of the comparators, whilst still providing some overall survival benefit. This is common
for interventions when benefits in surrogate markers (e.g. PFS) are not repeated to the same degree
in the primary outcome (e.g. OS).
The company state that implementing this assumption underestimates the OS benefit by comparing
the observed median gain in OS (7.3 months) to the predicted mean gain in OS when applying the
assumption to their base-case (2.9 months). Firstly, the ERG do not believe that this is a meaningful
comparison due to the difference in the definition of the two measures. Secondly, under the
company’s base-case assumptions the median difference is 4.57 months, which is also unaffected
by the 36 month equal efficacy assumption. Thirdly, the widest interval in the OS KM plot from
ARCHER 1050 is at roughly 22 months with a difference of approximately 12% between arms.
Yet under the company’s base-case analysis at 22 months the difference is 4.5%, which is
unaffected by the application of OS HR=1 from 36 months.
The ERG’s clinical adviser stated that it was reasonable to assume equivalent post-progression
survival for the comparators in this analysis, however the nature of the partitioned survival model
meant that this could not be implemented as the post-progression survival is estimated as the
difference between the PFS and OS.
In summary, the ERG were not aware of the clinical rationale of the efficacy of dacomitinib
improving throughout the economic model as modelled by the company, particularly once the
89
majority of patients had moved to later lines of treatment. The survival curves for the ERG preferred
OS assumptions are shown in Figure 15.
The ERG also requested to be able to model OS for dacomitinib parametrically, without using the
FP NMA results.
Figure 15: ERG preferred OS extrapolation (log-logistic and HR=1 from 36 months)
ERG Summary
The company’s OS modelling was thought to be too pessimistic for all interventions. The ERG
chose a different parametric curve to model the OS of gefitinib (log-logistic). The results of the
company’s OS FP NMA were inconsistent with the results obtained from the same analysis
performed on the PFS data, and resulted in implausible extrapolations, with the benefit of
dacomitinib improving across the time horizon of the economic model. The ERG preferred to not
rely on the FP NMA extrapolation, and instead assume a HR=1 from 36 months for OS across all
comparators. This maintained the benefits occurred in the period supported by observed data from
clinical trials, and resulted in plausible extrapolations across the full time horizon of the economic
model.
Under the company’s base-case assumptions, it can be seen that dacomitinib appears to provide
both pre-progression and post-progression benefit (Table 25). The ERG consider this unlikely to
be plausible as it is uncommon for PFS benefits to be mirrored to the same degree in post-

90
progression survival, and less common for the PFS benefits to be extended in post-progression
survival. Under the models fitted with ERG’s preferred PFS and OS assumptions, dacomitinib
provides an OS and PFS benefit over the comparators, but has a shorter post-progression survival
time, consistent with the scenario of the degree of the pre-progression benefit not being repeated in
the OS benefit as has been observed in ARCHER 1050 (PFS HR: 0.59, OS HR: 0.76).
Table 25: Comparison of pre-progression and post-progression survival gains
Scenario Pre Progression Incremental Life Years (Dacomitinib difference)
Post Progression Incremental Life Years (Dacomitinib difference)
Total Incremental Life Years (Dacomitinib difference)
Company Base-case
Dacomitinib **** **** **** Gefitinib/Erlotinib ************ ************ ************ Afatinib ************ ************ ************
ERG PFS and OS log-logistic
Dacomitinib **** **** **** Gefitinib/Erlotinib ************ ************ ************ Afatinib ************ ************ ************
ERG PFS and OS matched to Afatinib
Dacomitinib **** **** **** Gefitinib/Erlotinib ************ ************ ************ Afatinib ************ ************ ************
ERG PFS and OS HR=1 at 3 years
Dacomitinib **** **** **** Gefitinib/Erlotinib ************ ************ ************ Afatinib ************ ************ ************
ERG PFS and OS HR=1 at 4 years
Dacomitinib **** **** **** Gefitinib/Erlotinib ************ ************ ************ Afatinib ************ ************ ************
ERG PFS and OS HR=1 at 5 years
Dacomitinib **** **** **** Gefitinib/Erlotinib ************ ************ ************ Afatinib ************ ************ ************
5.2.7 ERG’s exploratory survival analysis
5.2.7.1 Progression-free survival
The ERG investigated modelling separately the PFS of dacomitinib from ARCHER 1050 using
parametric models, and KM data followed by parametric models fitted to data beyond 8 month,
chosen because it was at this point that the KM curves separated. However, none of the parametric
curves produced using these models produced a better model than those discussed above. Since the
SUPERSEDED See erratum

91
PH assumption was violated in ARCHER 1050 for PFS, the ERG did not consider using the HR
from the traditional NMA within the economic analysis
5.2.7.2 Overall survival
The ERG also investigated modelling OS in the same way, though the switch from KM to
parametric model was at 12 months. The parametric fits did not provide plausible extrapolations to
the dacomitinib data, however the KM and exponential did provide a very good visual fit for both
arms of ARCHER 1050, and plausible extrapolation for the dacomitinib arm. However, this
approach assumed a constant treatment effect of dacomitinib across the model time horizon, which
resulted in larger differences between the predicted OS of dacomitinib and gefitinib across the time
horizon of the model than were observed in ARCHER 1050, which there is no evidence to support.
This analysis did not allow the comparison to afatinib or erlotinib in the company’s economic
model. The ERG did consider using the HR from the traditional NMA for OS within the economic
analysis, however this analysis also maintained a treatment effects across the model time horizon,
and resulted in optimistic extrapolations for dacomitinib compared to the comparators.
The ERG performed a sensitivity analysis of their spline model, to investigate the possibility of
overfitting to the tail. We fitted the model to the digitised ARCHER 1050 trial as before, but
replaced the event status for the final death events occurring in the dacomitinib arm. The ERG
found that even when the final 10 death events were instead marked as being censored at their time
of event, the spline model still predicted a rising hazard ratio which crosses one at roughly 32
months.
5.2.8 Adverse events
The company claims to have considered the impact on costs and HRQoL associated with treatment-
related AEs within the model which represent AEs of Grade 3 or higher that occur in >5% of
patients in at least one treatment of interest. They assumed that Grade 1/2 AEs had negligible impact
on costs and HRQoL so were therefore excluded. This approach was reasoned by reference to how
AEs had been addressed in previous TA submissions.61-63 Probabilities of incurring an AE for
dacomitinib, gefitinib, and by established precedent of equivalence erlotinib, were taken from the
ARCHER 1050 trial. The incidences of AEs for afatinib were taken from the LUX-Lung 7 study.
Table 26 includes the final list of AEs that met the criteria specified by the company and are applied
in the model.

92
Table 26: List of adverse events included in the model
Adverse event Dacomitinib (n=227)
Gefitinib (n=224)
Afatinib (n=160)
Erlotinib*
ALT increased 2 (0.9%) 18 (8.0%) 0 (0.0%) 18 (8.0%)
Diarrhoea 18 (7.9%) 1 (0.4%) 21 (13.1%) 1 (0.4%)
Fatigue 0 (0.0%) 0 (0.0%) 9 (5.6%) 0 (0.0%)
Paronychia 17 (7.5%) 3 (1.3%) 3 (1.9%) 3 (1.3%)
Rash (grouped term) 55 (24.2%) 1 (0.4%) 15 (9.4%) 1 (0.4%) *Erlotinib assumed equivalent to Gefitinib (see Section B.2.9.1)
The ERG finds error in the company’s use of 7.9% as the proportion of patients experiencing
diarrhoea at Grade 3 or above. This is the cumulative value for Grades 3-4 but 0.4% patients
experienced grade 5 diarrhoea in the dacomitinib group which has not been counted. Therefore the
model input should have been 8.3% rather than the 7.9% used.
Additional data supplied by the company during the clarification process provided AE data per
cycle by frequency reported for grades 3 and above at a >2% threshold. Table 27 summarises this
new data showing a discernible difference between AE frequencies in patients from the >5% to
>2% level. (N.B. rash was not calculated due to lack of clarity as to how the company had defined
rash as a grouped term.)
Table 27: Treatment-related adverse events occurring in >2% of patients
Type of AE Dacomitinib n=227 Frequency (percentage)
Gefitinib n=224 Frequency (percentage)
Stomatitis XXXXX XXXXX ALT increase XXXXX XXXXX Diarrhoea XXXXX XXXXX Paronychia XXXXX XXXXX
In addition to frequency, this data also suggests that the mix of AEs considered may also be
different with the notable inclusion of stomatitis that could potentially be relevant at >5% threshold.
The further data provided could not definitively show a low rate of recurrence as suggested by the
company and to which they attribute as the ability of clinicians to manage these events through
dose reduction and discontinuation. It is noted that dose reduction due to AEs was required in 64.8%
of dacomitinib patients versus 8.0% of gefitinib patients (see Table 7 and further discussion in
clinical effectiveness section).
SUPERSEDED See erratum

93
5.2.9 Mortality
General population background mortality was estimated using the UK life tables for 2015-2017
obtained from the Office of National Statistics (ONS).64 A weighted average to reflect the
proportion of male (40%) and female (60%) and starting age (62 years) of participants in the
ARCHER 1050 trial was used to derive the probability of people dying in each model cycle. These
probabilities were then used to adjust overall survival, which estimated as the maximum of the
general population’s survival and the trial participants’ overall survival.
5.2.10 Health-related quality of life
For HRQoL values the company used the PF utilities obtained from the ARCHER 1050 trial1 (see
Table 28) which are derived from EQ-5D-3L values as per the NICE reference case. The company
report a high patient completion rate (>90%) of nearly all questions at each time point although
exact numbers are not provided. A mixed-effects regression model was used to obtain utility scores
in an effort to mediate auto-correlation between individual patient repeated measures. The company
provided sufficient methodological detail in their reporting for analysis and reproduction of data
given baseline data.
Table 28: EQ-5D-3L PFS utility values by treatment from ARCHER 1050
Treatment Mean 95% CI Dacomitinib **** ********** Gefitinib **** ********** CI = confidence interval
Treatment specific utilities were used in the base-case in contrast to non-treatment specific values
in previous NSCLC appraisals which the ERG considers good practice given the availability of this
data. Utility values for afatinib and erlotinib were assumed to be equal to dacomitinib and erlotinib
respectively with justification by the company on grounds of similar safety profiles and the
equivalence precedent set by the NICE committee on TA310.43
The company stated in their submission that:
“Given that EQ-5D was not collected beyond progression in ARCHER 1050, the PD utility was
sourced from the literature…”
However, in the protocol and reporting of the ARCHER 1050 trial, it indicated that;

94
“Patient reported outcomes were assessed at days 1 (baseline), 8, and 15 of cycle one, on day 1
of subsequent cycles, at the end-of treatment visit, and at the post-treatment follow up visit.” 1 (p.
1456).
The company were able to provide these values during the clarification process which are presented
in Table 29.
Table 29: Summary of mean EQ-5D health index score.
Time point
Dacomitinib Gefitinib Median Mean 95% CI n Median Mean 95% CI n
End of treatment
**** **** ********** 121 **** **** ********** 145
Post- treatment
**** **** ********** 75 **** **** ********** 107
CI : confidence interval
In light of the company’s original assertion that this trial data was not collected, they used a post
disease (PD) progression utility value of 0.64 from the literature.2 (see Table 30) The use of health
utility scores resulting from the Labbé et al, 2017 study2 was well justified as an alternative source
of utility data as it represents real world data obtained from a longitudinal study of EGFR-NSCLC
patients directly from EQ-5D-3L. An alternative value from Nafees et al. (2008) sourced in the
systematic review was rejected by the company as this study did not meet the NICE reference
case.56 EQ-5D was not used and values were not derived from patients, therefore it was not
considered a robust source. In addition, a recent repeat of this study by Nafees et al. in 2017 that
was identified in the systematic review, reported a PF value of 0.883 and PD of 0.166,65 which
further demonstrates the unreliability of the original Nafees et al. (2008) study.50
The health state utility values obtained from the Labbé, 2017 study2 would be the ERGs preferred
source of utility values from the literature. The ERG finds the company’s reasoning for using these
values over the Nafees, 200850 compelling and appropriate. Similarly, the ERG finds the health
state utility values used by Huang (2017)52 equally less convincing for use in the model as the
KEYNOTE-024 trial was directed at patients specifically without EGFR-activating mutations or
ALK translocations.
However, whilst the ERG considers the Labbé et al, 20172 values appropriate for use in scenario
analysis (when both the PF value of 0.77 and PD value 0.64 are used simultaneously) it prefers the
use of PD scores obtained from the ARCHER 1050 trial to be used in the base-case. This continues
SUPERSEDED See erratum

95
the differential approach in treatment arms utilised for the PF utility values with EQ-5D scores
obtained from 182 patients from the ARCHER 1050 trial (75 dacomitinib arm, 107 gefitinib arm)
rather than the 81 patients on a wider variety of TKI treatments in the Labbé et al, 2017 study.
Although Labbé et al. presents longitudinal data, mean number of encounters per patient were only
3.2 over the full disease spectrum2 and use of ARCHER 1050 values is further strengthened as it
meets DSU recommendations to maintain the same data source for HUS values wherever possible 3, (pg 11) whilst also adhering to the NICE reference case.56
Table 30: Summary of utility values used in company’s cost-effectiveness analysis.
State Utility value: mean
(standard error)
95% confidence
interval
Reference in
submission
Justification
Progression-free – Dacomitinib
*********** **********
B.3.4.1
Pre-progression utilities sourced from ARCHER- 1050 trial in line with the
NICE reference case Comparator values assumed
equal based on the similarity of safety profiles
Progression-free – Gefitinib
*********** **********
Progression-free – Afatinib
*********** **********
Progression free – Erlotinib
*********** **********
Progressed disease
0.64 (0.03) NR B.3.4.3.1
Based on the results of the systematic review (see
section B.3.4.3 in CS) the study by Labbé et al.
provided most appropriate values from the literature
NR, not reported
The company have used a model time horizon of 15 years with starting age of 62 years. The health
utility scores (HUS) are not adjusted over the time horizon to reflect age-related disutility. The
ERG believes it would be appropriate to do so given both the starting age and length of time horizon
used and follows guidance by the NICE DSU to account for potential changes in HUS due to age
and comorbidities 3 (pg 21).
The company did not include AE decrements within the base-case which was justified in order to
avoid double counting due to the treatment specific PF values from ARCHER 1050 that were used.
They assumed the effect of any AEs were already captured due to the nature of them as trial data.
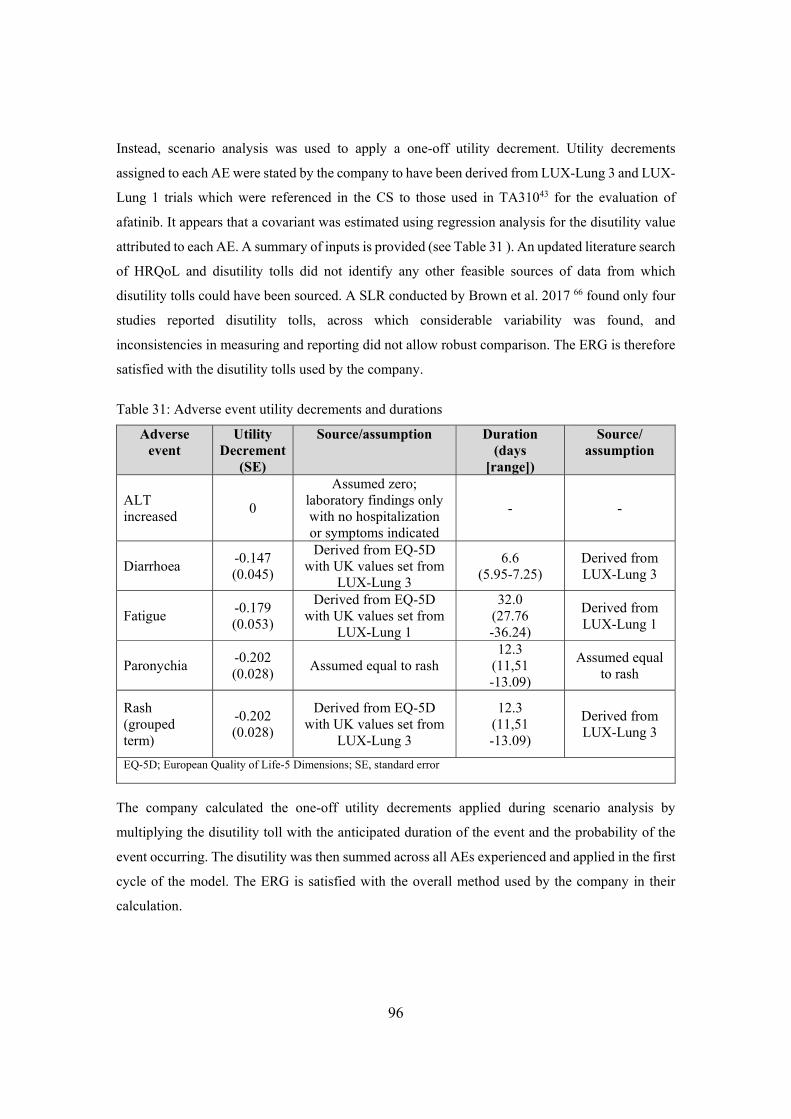
96
Instead, scenario analysis was used to apply a one-off utility decrement. Utility decrements
assigned to each AE were stated by the company to have been derived from LUX-Lung 3 and LUX-
Lung 1 trials which were referenced in the CS to those used in TA31043 for the evaluation of
afatinib. It appears that a covariant was estimated using regression analysis for the disutility value
attributed to each AE. A summary of inputs is provided (see Table 31 ). An updated literature search
of HRQoL and disutility tolls did not identify any other feasible sources of data from which
disutility tolls could have been sourced. A SLR conducted by Brown et al. 2017 66 found only four
studies reported disutility tolls, across which considerable variability was found, and
inconsistencies in measuring and reporting did not allow robust comparison. The ERG is therefore
satisfied with the disutility tolls used by the company.
Table 31: Adverse event utility decrements and durations
Adverse event
Utility Decrement
(SE)
Source/assumption Duration (days
[range])
Source/ assumption
ALT increased
0
Assumed zero; laboratory findings only with no hospitalization or symptoms indicated
- -
Diarrhoea -0.147 (0.045)
Derived from EQ-5D with UK values set from
LUX-Lung 3
6.6 (5.95-7.25)
Derived from LUX-Lung 3
Fatigue -0.179 (0.053)
Derived from EQ-5D with UK values set from
LUX-Lung 1
32.0 (27.76 -36.24)
Derived from LUX-Lung 1
Paronychia -0.202 (0.028)
Assumed equal to rash 12.3
(11,51 -13.09)
Assumed equal to rash
Rash (grouped term)
-0.202 (0.028)
Derived from EQ-5D with UK values set from
LUX-Lung 3
12.3 (11,51 -13.09)
Derived from LUX-Lung 3
EQ-5D; European Quality of Life-5 Dimensions; SE, standard error
The company calculated the one-off utility decrements applied during scenario analysis by
multiplying the disutility toll with the anticipated duration of the event and the probability of the
event occurring. The disutility was then summed across all AEs experienced and applied in the first
cycle of the model. The ERG is satisfied with the overall method used by the company in their
calculation.

97
The company’s suggestion that including disutility decrements in their base-case would constitute
‘double-counting’ as the patient collected EQ-5D from the trial would already capture a HRQoL
detriment, is viewed as unfounded by the ERG. EQ-5D data was collected on day one of each 28-
day cycle1 whereas average duration of the 2 most common frequently reported treatment related
AE in dacomitinib patients, diarrhoea (7.9%) and paronychia (7.5%), were assumed to occur for a
duration of 6.6 and 12.3 days respectively. As the EQ-5D asks patients about their health state on
the day of the month they complete the form (EuroQol, 1990),67 it is likely that a large proportion
of adverse events were not captured in the trial data.
Therefore, the ERG strongly believes that disutility is not fully represented in the company’s base-
case and that the inclusion of the treatment specific disutility decrements is founded.
Scenario analyses were conducted by the company (see Table 32). In one scenario, non-treatment
specific PF utility values from the ARCHER-1050 trial were used, with the Labbé (2017)2 PD value
and in a subsequent scenario analysis values from the Labbé (2017)2 study were used for both PF
and PD values. Rather than this being the only change made within each scenario, the company
also chose to include AE disutilities, reporting the model output for both changes simultaneous.
Whilst the ERG has previously discussed the company’s use of AE disutilities, their inclusion of
two parameter changes within each scenario analysis is also not considered appropriate. The ERG
would prefer single parameter changes to be applied in each scenario to clarify the effect of each.
Table 32: Summary of HRQoL scenario analyses
Scenario Base-case Scenario description Reference in submission
Utility (PF) with AEs
Treatment specific utility based on
ARCHER 1050 and assumption
***********
Non-treatment specific PF utility based on
ARCHER 1050 ******, PD from Labbé 2017
(0.64) with AE disutility’s
B.3.4.5
Utility (PF) with AEs
Treatment specific utility based on
ARCHER 1050 and assumption
***********
Non-treatment specific PF utility based on
Labbé (0.77), PD from Labbé (0.64) with AE
disutility’s
B.3.4.5
ERG Summary
The ERG supports the company’s use of treatment specific PF health utility values obtained from
the ARCHER-1050 trial for use in the model. However, it feels that PD progression values should

98
also have been taken from the same source (as they were available) rather than using an alternative
value from the literature. This will be presented in the ERG’s base-case analysis.
The HRQoL values that were obtained by the literature were well justified and appropriate for use
within scenario analysis. The ERG believes it would be appropriate to adjust HUS over the 15-year
time horizon of the model to reflect health related disutility and will be applied in the ERG’s base-
case analysis.
The ERG finds the rationale for omitting AE disutilities from the base-case on the grounds of
double counting to be unfounded and will specifically include a disutility decrement in their base-
case analysis. Last, the ERG believes disutilities associated with AEs have been under-represented
within the model and is concerned that other AEs such as stomatitis should have been considered
as clinically these are relevant.
5.2.11 Resource use and costs
Total costs estimated in the model comprised of cost of dacomitinib (drug acquisition and drug
administration), subsequent treatment and administration costs, resource use and costs associated
with each health state, treatment related to adverse events and terminal care costs, all from the
perspective of the NHS and PSS.
Intervention and comparators
The drug regimen for dacomitinib and gefitinib was based on the dosing schedule used within the
ARCHER 1050 protocol. People randomised to the intervention and comparator received 45mg
and 250mg, respectively, both taken once daily and orally. Table 33 reports the list price per packet
for the intervention and the comparators. Given that treatments were oral therapies, only costs for
a dispensing fee of £9.40 was applied for each treatment. In the model, the company presented drug
acquisition costs based on a discounted price for dacomitininb under the patient access scheme
(PAS) approved by the Department of Health. Additionally, the company provided discounted costs
based on the assumed PAS for each comparator (see Table 34). It must be noted that the ERG is
unable to comment on the accuracy of the assumed PAS discounts.
A PAS discount, the details of which are available in the public domain, is in effect for gefitinib.
An error was identified in the application of the PAS discount for gefitinib in the economic model.
In the model, a charge for gefitinib is applied on receipt of the 3rd packet of treatment, while, upon

99
seeking confirmation about the exact arrangement, it transpired that a charge incurred on receipt of
the 4th packet of treatment. A relevant correction was made in the economic model.
Table 33: Units costs of intervention and comparators.
Treatment Dosing schedule Pack size Package price (£)
Cost per model cycle (£)
Dacomitinib 45 mg once daily, orally
30 ********* *********
Gefitinib 250 mg once daily, orally
30 £2,167.71 £2,023.20
Afatinib 40 mg once daily, orally
28 £2,023.28 £2,023.28
Erlotinib 150 mg once daily, orally
30 £1,631.53 £1,522.76
Table 34: Units costs of intervention and comparators based on PAS and assumed PAS.
Treatment Dosing schedule Pack size Package price (£)
Cost per model cycle (£)
Dacomitinib 45mg once daily, orally
30 ********* *********
Gefitinib 250mg once daily, orally
30 £2,167.71 £2,023.20
Afatinib 40mg once daily, orally
28 ******* *******
Erlotinib 150mg once daily, orally
30 ******* *******
Subsequent treatment costs
Drug acquisition costs for subsequent treatment were based on the dosing schedule as per Summary
of product Characteristics (SmPC). The cost for osimertinib consisted of drug costs and dispensing
fee for a dose of 80mg once daily taken orally. The CS stated that an average body surface area of
1.75m2 was used to calculate the dosing for all other subsequent treatments (pemetrexed,
carboplatin, cisplatin and docetaxel). Drug acquisition costs and administration costs for
intravenous therapies are presented in Table 35 and Table 36 respectively, and these are in line with
their respective SmPCs.

100
Table 35: Drug acquisition cost of subsequent treatment
Treatment Dosing schedule Pack size Package price (£)
Cost per model cycle (£)
Osimertinib 80 mg once
daily 30 £5,770.00 £5,385.33
Pemetrexed 500 mg/m2
every 21 days 1 vial £800.00 £1,866.67
Carboplatin 400 mg/m2
every 21 days 1 vial £18.73 £38.85
Cisplatin 75 mg/m2 every
21 days 1 vial £4.48 £15.68
Docetaxel 75 mg/m2 every
21 days 1 vial £14.74 £32.34
Table 36: Drug administration costs for subsequent treatment (obtained from CS)
Treatment Administration IV infusion
time
Cost per administration
Source
Osimertinib Oral - £9.40 PSSRU 201768
PDC
Pemetrexed with carboplatin
Intravenous 15-60
minutes £241.07
SB12Z; Deliver Simple Parenteral
Chemotherapy at First Attendance69
Pemetrexed with cisplatin
Intravenous 160
minutes £355.54
SB14Z; Deliver Complex
Chemotherapy, including Prolonged
Infusional Treatment, at First Attendance69
Docetaxel
Intravenous 60
minutes £241.07
SB12Z; Deliver Simple Parenteral
Chemotherapy at First Attendance69
IV, intravenous; PDC, platinum doublet chemotherapy
Health state costs
Resource use associated with the routine monitoring and disease management of people in the
progression-free and progressed health states were combined with the frequency and the unit costs
for each item of resource to derive the total cost for each health state. Resource use consisted of
visits to various health care professionals (general practitioner and cancer nurse), blood tests

101
(complete blood count and biochemistry) and imaging (computerised tomography and chest x-ray),
all assumed to be undertaken during outpatient visits.
Resource use was based on information obtained from previous technology appraisals.43, 45, 46 The
model assumed that the frequency and the proportion of people requiring disease management is
the same across all treatments. Table 37 shows the total costs per cycle for disease management by
health state. The total costs associated with people in the progression-free and progressed disease
health state were £186.53 and £190.43, respectively.

102
Table 37: Total costs for routine monitoring and disease management by health state (obtained from the CS)
Items Use in model Unit cost (£)
Progression-free survival Progressed disease
Frequency Frequency per model cycle
Frequency per cycle
% of patients
Outpatient visit Medical Oncology - Non-Admitted Face-to-Face Attendance, Follow-up
£172.67 0.75 visits per
month 0.69
1 visit per month
0.92
GP visit GP per surgery consultation lasting 9.22 minutes
£38.00 10% patients; 1
per month 0.09
28% patients 1 per month
0.26
Cancer nurse N10AF: Specialist Nursing, Cancer Related, Adult, Face to face
£82.09
20% of patients;
receive 1 per month
0.18 10% patients 1
per month 0.09
Complete Blood Count
DAPS05: Haematology £3.06 0.75 per month 0.69 1 per month 0.92
Biochemistry DAPS04: Clinical Biochemistry £1.13 0.75 per month 0.69 1 per month 0.92 CT scan (other) RD26Z: Computerised
Tomography Scan of Three Areas, with Contrast (outpatient)
£122.51 30% patients;
0.75 per month 0.21
5% patients 0.75 per month
0.03
Chest X-ray DAPF: Direct Access Plain Film £29.78 0.75 per month 0.69
30% patients 0.75 per month
0.21
Total cost per 28-day cycle £186.53 £190.43

103
Cost of treating adverse events
The model included costs of treating adverse events (≥Grade 3 that occurred in >5% of participants
in at least one treatment of interest) by comparator. Table 38 shows the proportion of people who
experienced adverse events as well as the costs associated with treating each event. However,
limiting adverse events without providing the count data on the number of adverse events, means
that multiple adverse events experienced by the same participant would be under-represented in the
model. For example, a participant may experience an adverse event on multiple occasions, but this
would have only been captured as a single occurrence in the model (a one-off cost for the treatment
of the adverse event).
Table 38: Costs of treating adverse events
Adverse events
Cost per adverse event (£)
Proportion of people who experienced adverse events (%)
Dacomitinib Gefitinib Afatinib Erlotinib Diarrhoea £462.08 7.9% 0.4% 13.1% 0.4% Fatigue £592.48 0.0% 0.0% 5.6% 0.0% ALT increased
£0 0.9% 8.0% 0.0% 8.0%
Paronychia £436.17 7.5% 1.3% 1.9% 1.3% Rash £436.17 24.2% 0.4% 9.4% 0.4%
From these proportions and unit costs per adverse event the company derived a weighted costs for
treating adverse events by comparator (see Table 39). These costs were applied as one-off costs but
only to the first cycle of the model.
Table 39: Total costs of treating adverse events, by treatment
Treatment Management costs Dacomitinib £175 Gefitinib £10 Afatinib £143 Erlotinib £10
Terminal care costs
The model includes a one-off terminal care costs of £4,593 incurred at death to account for the
resource use and costs associated with patient monitoring and supportive care in the months prior
the death for people in the progression-free and post-progression health states. This cost is based
on resource use obtained from Brown et al.,70 and calculated as a weighted-average based on the

104
percentage of people receiving care at home (27.3%), hospital (55.80%) or within a hospice
(16.90%).
ERG summary
The costs included in the model is in keeping with the viewpoint of the analysis that is from the
NHS and PSS perspective, and reported in current prices. All costs incurred are appropriately
discounted, using the recommended discount rate of 3.5% per annum. Though there were no
discrepancies (for example, between the costs for drug acquisition (using the list prices) and
administration costs, and costs associated with the treatment of adverse events), there were
concerns relating to costs that might have been excluded from the analysis.
Notably, resource use and costs associated with unscheduled hospital admissions, MRI scans for
suspected brain metastases or cord compression and costs associated with the diagnosis of T790M
(personal communication with clinical expert). With this in mind, we consider that these costs
included in the model are likely to be an underestimate of the true costs associated with
managing/treating people with NSCLC.
5.2.12 Overview of model assumptions and ERG critique
In Table 40 , we present the company’s modelling assumptions with comments from the ERG.
Table 40: Model assumptions with ERG’s comments.
Assumption Justification ERG’s comments
Model
15-year time horizon “Aligned with the maximum life expectancy of the cohort predicted by the base-case parametric survival analysis (<1% alive at 15 years) (see section B.3.3.1.3)”
We consider this time horizon appropriate to reflect all important differences in costs and outcomes between the technologies being compared.
EGFR + NSCLC “Population identical to the ARCHER 1050 phase III clinical study, in line with the scope of the current appraisal and with the expected EMA marketing authorization”.
The population modelled is in line with the expected EMA marketing authorization. The population reflects the ARCHER 1050 trial and is in line with the scope.

105
Comparators: afatanib, erlotinib and gefitinib
“In line with the NICE scope” As listed in the scope developed by NICE.
Partitioned survival model
“Captures the chronic nature of the condition and two of the key objectives of treatment in NSCLC, namely avoiding disease progression and prolonging life. Commonly used in previous oncology NICE appraisals, including NSCLC”
The ERG considers it appropriate to use a partitioned survival model to capture the nature of the condition. However, the company could have included other health states to better capture survival following 2nd and 3rd line treatments.
Four week (28-day) cycle length
“Aligns with the schedule of the ARCHER 1050 trial, captures differences in dosing on a monthly basis.”
Appropriate cycle length.
Drug acquisition and administration costs for oral treatments are not half-cycle corrected
“Oral treatments were assumed to be dispensed at the beginning of the cycle”
This is a reasonable assumption.
Survival
Erlotinib was assumed to have equal efficacy (PFS and OS) and safety to geftinib
“In line with previous NICE and SMC committee conclusions and the supporting data from the recent RCT subgroup analysis.”
This is a reasonable assumption.
Proportional hazards was assumed to be potentially violated for PFS and OS
“Given potential violation in at least one trial in the network (tested using log cumulative hazard plots and Schoenfeld residuals) a FP NMA was utilised to allow hazards to vary over time in the base-case analysis. A traditional ITC was also explored in a sensitivity analysis.”
The ERG considers that the proportional hazard assumption was potentially violated in the ARCHER 1050, so it would have been appropriate to consider other methods. Despite FP models being a plausible fit to the observed data, there is considerable uncertainty in the extrapolations.
Utility
Progression free utility values were assumed to be treatment specific
“ARCHER 1050 collected EQ-5D aligned with the NICE reference case. There was a statistically significant difference observed between dacomitinib and gefitinib in EQ-5D, however it did not exceed a minimally important difference. Therefore, a conservative assumption was made to apply
This is a reasonable assumption.

106
treatment specific utilities in the base-case and a single non-treatment value was explored in scenario analysis.”
Disutility due to adverse events was not included in the base-case model
“Given that treatment specific values were applied in the base-case that are elicited from the EQ-5D on treatment (thus capturing disutilities on treatment), it was considered that including separate disutilities for adverse events would be double counting. A one-off disutility was explored in scenario analysis.”
The ERG did not consider that the inclusion of AE disutilities would constitute as double-counting because it is unlikely that the EQ-5D had been administered at the time-point when the events occurred. Hence, disutility would have been under represented.
Costs
Relative dose intensity was not included in the model
“Given that all primary treatments were administered orally, RDI was not considered relevant.”
This is a reasonable assumption.
Complete vial sharing was assumed
“Only subsequent treatments were administered intravenously. Therefore, for simplicity these therapies were estimated using the lowest cost per mg of any vial.”
This is a reasonable assumption.
The cost of adverse events are applied as a one-off cost at the start of treatment
“The majority of adverse events will occur within the first year of treatment and any adverse events occurred beyond the first year will only have a minimal difference due to discounting.”
The ERG considers this a strong assumption, as people are likely to experience multiple/or re-occurring adverse events and the costs for treating these events would be underestimated.
The proportion of patients receiving cisplatin or carboplatin in PDC was assumed from PROFILE 1014
“These values have been applied in a previous NSCLC appraisal and are therefore considering representative of UK clinical practice.”
This is a reasonable assumption.
EGFR, epidermal growth factor receptor; EMA, European marketing authorsation; NSCLC, non-small cell lung cancer; OS, overall survival; PDC, platinum doublet chemotherapy; PFS, progression free survival; SMC, Scottish Medicines Consortium.
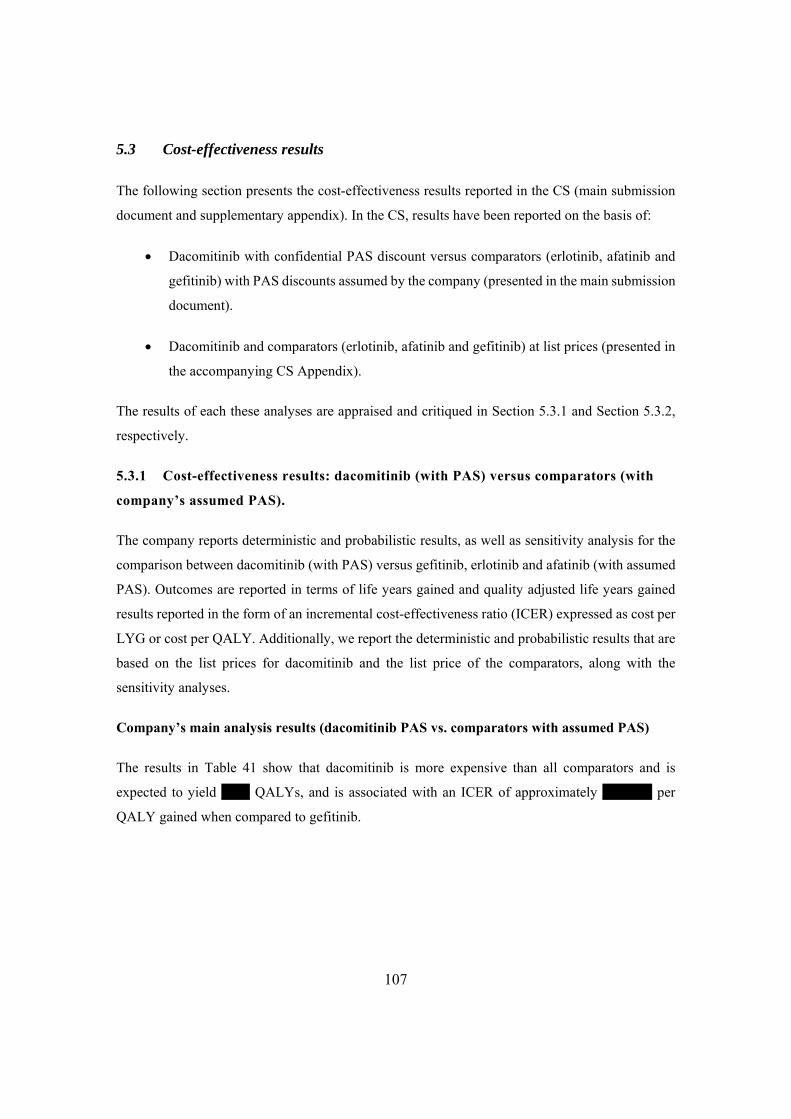
107
5.3 Cost-effectiveness results
The following section presents the cost-effectiveness results reported in the CS (main submission
document and supplementary appendix). In the CS, results have been reported on the basis of:
Dacomitinib with confidential PAS discount versus comparators (erlotinib, afatinib and
gefitinib) with PAS discounts assumed by the company (presented in the main submission
document).
Dacomitinib and comparators (erlotinib, afatinib and gefitinib) at list prices (presented in
the accompanying CS Appendix).
The results of each these analyses are appraised and critiqued in Section 5.3.1 and Section 5.3.2,
respectively.
5.3.1 Cost-effectiveness results: dacomitinib (with PAS) versus comparators (with
company’s assumed PAS).
The company reports deterministic and probabilistic results, as well as sensitivity analysis for the
comparison between dacomitinib (with PAS) versus gefitinib, erlotinib and afatinib (with assumed
PAS). Outcomes are reported in terms of life years gained and quality adjusted life years gained
results reported in the form of an incremental cost-effectiveness ratio (ICER) expressed as cost per
LYG or cost per QALY. Additionally, we report the deterministic and probabilistic results that are
based on the list prices for dacomitinib and the list price of the comparators, along with the
sensitivity analyses.
Company’s main analysis results (dacomitinib PAS vs. comparators with assumed PAS)
The results in Table 41 show that dacomitinib is more expensive than all comparators and is
expected to yield **** QALYs, and is associated with an ICER of approximately ******* per
QALY gained when compared to gefitinib.

108
Table 41: Deterministic results, company base-case using the assumed PAS for comparators (discounted)
Treatment Expected mean costs (£)
Incremental costs (£)
Expected mean QALY
Incremental QALY
ICER (£)
Gefitinib ******* * **** * *
Erlotinib ******* *** **** **** *********
Afatinib ******* ***** **** **** *******************
* Dacomitinib
******* ******* **** **** *******
ICER, incremental cost-effectiveness ratio; QALY, quality adjusted life years gained
Results in the form of LYG show that dacomitinib is more expensive than all comparators and is
expected to yield **** LYG and has an ICER of approximately ******* per LYG (see Table 42).
Table 42: Deterministic results, company base-case using the assumed PAS for comparators (discounted).
Treatment Expected mean
costs (£)
Incremental costs (£)
Expected mean LYGs
Incremental LYGs
ICER (£)
Gefitinib ******* * **** * *
Erlotinib ******* *** **** **** *********
Afatinib ******* ***** **** **** ********************
Dacomitinib ******* ******* **** **** ******* ICER, incremental cost-effectiveness ratio; LYG, life years gained
Company’s probabilistic sensitivity analysis results (dacomitinib PAS vs. comparators
assumed PAS)
Probabilistic sensitivity analysis was undertaken for the outcome cost per QALY only. In PSA,
each parameter is assigned a distribution to reflect the pattern of its variation and the ICER results
are calculated based on randomly selecting variables from each distribution. Probability
distributions were applied to majority of the key model input parameters, and these were considered
appropriate. However, were there was missing information about the standard error, the company
assumed it to be 5% of the mean. Applying a standard error equal to 5% of the mean may not
represent the true uncertainty about the input value. As presented in Table 43, the results for the
PSA are in line with the results from the deterministic results.

109
Table 43: Probabilistic results, company base-case using the assumed PAS for comparators
Treatment Expected mean
costs (£)
Incremental costs (£)
Expected mean
QALYs
Incremental QALYs
ICER (£)
Gefitinib ****** * **** *
Erlotinib ****** *** **** **** *********
Afatinib ****** **** **** **** ********************
Dacomitinib ****** ****** **** **** ******* ICER, incremental cost-effectiveness ratio; QALY, quality adjusted life years gained
Each simulation for the incremental costs and incremental QALYs for dacomitinib versus gefitinib,
erlotinib and afatinib was graphed/plotted on a cost-effectiveness plane (see Figure 16), along with
the respective cost-effectiveness acceptability curves (CEACs). For 10,000 simulations, the
scatterplot shows considerable uncertainty around the incremental QALYs, and less so for the
incremental costs. This may be a result of the company assuming some of the resource use and/or
costs estimates used to derive costs to be constant/fixed. Note, the scatterplot presents dacomitinib
against each of the three comparator drugs (showing incremental costs and QALYs) and where the
legend indicates the comparator drug being visualised.
Figure 17 shows the results of the PSA in the form of a CEAC for the comparison between
dacomitinib and all comparators included in the analysis. The curves show the proportion of
simulations in which treatments are cost-effective at different willingness-to-pay thresholds for a
QALY. Results show that at a WTP threshold of £30,000 per QALY dacomitinib compared to all
other comparators has a probability of **** of being cost-effective.

110
Figure 16: Scatterplot of strategies on the cost-effectiveness plane, company base-case using assumed PAS for comparators

111
Figure 17: Cost-effectiveness acceptability curve, company base-case using assumed PAS for comparators

112
In general, the ERG considers the distributions used around key input parameters to be appropriate.
However, by applying a 5% standard error to means, when unknown, may have underestimated the
uncertainty around these parameters.
Company’s deterministic sensitivity analysis results (dacomitinib PAS vs. comparators
assumed PAS)
A number of deterministic sensitivity analyses were undertaken to explore the impact on the ICER
to making changes to key model input parameters. Parameters were varied according to the lower
and upper bound of their respective 95% confidence interval (CI) or by assuming uncertainty of
±25% of the point estimate where the confidence intervals were missing. The results are presented
in the form of tornado diagrams and are shown in Figure 18 through to Figure 20.
Similar results are seen for the comparison between dacomitinib versus gefitinib/erlotinib, which
showed that the monthly discount rate applied to costs and benefits are the key drivers of cost-
effectiveness. Applying a lower value of 0% and upper value of 6% based on an annual discount
rate resulted in a decrease to in the ICER to approximately ******* and an increase to
approximately ******* per QALY.
Figure 18: Tornado diagram for the comparison of dacomitinib versus gefitinib, using the assumed PAS for comparators

113
Figure 19: Tornado diagram for the comparison of dacomitinib versus erlotinib, using the assumed PAS for comparators
Likewise for the comparison between dacomitinib versus afatinib showed that the monthly discount
rate applied to benefits and the time horizon were the key drivers to the cost-effectiveness. Applying
a lower value of 0% and upper value of 6% based on an annual discount rate resulted in a decrease
to in the ICER to approximately ******* and an increase to approximately ******* per QALY.
Figure 20: Tornado diagram for the comparison of dacomitinib versus afatinib, using the assumed PAS for comparators

114
The company undertook one-way sensitivity analyses across a range of model input parameters,
mainly time horizon, discount rates applied to both costs and benefits, utility values for PFS and
PPS, probabilities of receiving 2nd and 3rd line treatment, costs associated with medical resource
use, cost for treating adverse events, and terminal care costs. All of which are appropriate; however,
the ERG consider other inputs could have been included: starting age of the population, different
plausible survival models applied to the observed data for PFS (and OS), frequency of adverse
events, and the proportion of participants in each care setting.
Company’s scenario analysis results (dacomitinib PAS vs. comparators assumed PAS)
A range of scenario analyses were undertaken to determine the impact to the base-case ICER, by
making changes to some assumptions:-
Fitting a log-normal parametric model to PFS and log-logistic to OS for gefitinib instead
of the generalised gamma
Selection of different FP models for PFS and OS
Treatment effect based on the conventional NMA instead of using the FP NMA
Non-treatment specific PFS utility value (****) based on ARCHER 1050 with disutilities
associated with adverse events
Non-treatment specific PFS utility value (0.77) based on Labbé with disutilities associated
with adverse events
Including treatment beyond disease progression for dacomitinib and the comparators
oppose to discontinuing treatment upon progression
The results for each change made and the impact to the base-case results are presented in Table 44
through Table 46 for the comparison between dacomitinib and the comparators. As seen in Table
44, under the scenario of using log-normal and log-logistic parametric curves for PFS and OS,
respectively had the greatest impact to the base-case ICER for the comparison between dacomitinib
and gefitinib.

115
Table 44: Results of base-case scenario analysis for the comparison between dacomitinib and gefitinib.
Scenario Dacomitinib Gefitinib ICER
% changeTotal
LYs Total QALYs
Total costs
Total LYs
Total QALYs
Total costs
Base-case ***** ***** ******* ***** ***** ******* ******* * Gefitinib survival projection (PFS)
***** ***** ******* ***** ***** ******* ******* ***
Gefitinib survival projection (OS)
***** ***** ******* ***** ***** ******* ******* ****
FP model (PFS)
***** ***** ******* ***** ***** ******* ******* **
FP model (OS)
***** ***** ******* ***** ***** ******* ******* ***
NMA methodology (PFS and OS)
***** ***** ******* ***** ***** ******* ******* **
Utility (PF - ARCHER) with AEs
***** ***** ******* ***** ***** ******* ******* ****
Utility (PF - Labbé) with AEs
***** ***** ******* ***** ***** ******* ******* ****
Treatment beyond progression
***** ***** ******* ***** ***** ******* ******* ***
The results for each change made and the impact to the base-case results for the comparison
between dacomitinib and erlotinib is presented in Table 45. The scenarios of using the log-normal
parametric curve for gefitinib survival projection of PFS and treatment beyond progression had the
greatest impact to the base-case ICER, with both changes leading to a decrease to the ICER.
116
Table 45: Results of base-case scenario analysis for the comparison between dacomitinib and erlotinib.
Scenario Dacomitinib Erlotinib ICER
% changeTotal
LYs Total QALYs
Total costs
Total LYs
Total QALYs
Total costs
Base-case ***** ***** ******* ***** ***** ******* ******* * Gefitinib survival projection (PFS)
***** ***** ******* ***** ***** ******* ******* ***
Gefitinib survival projection (OS)
***** ***** ******* ***** ***** ******* ******* ****
FP model (PFS)
***** ***** ******* ***** ***** ******* ******* **
FP model (OS)
***** ***** ******* ***** ***** ******* ******* ***
NMA methodology (PFS and OS)
***** ***** ******* ***** ***** ******* ******* **
Utility (PF - ARCHER) with AEs
***** ***** ******* ***** ***** ******* ******* ****
Utility (PF - Labbé) with AEs
***** ***** ******* ***** ***** ******* ******* ****
Treatment beyond progression
***** ***** ******* ***** ***** ******* ******* ****
Scenario analysis results for the comparison between dacomitinib and afatinib is presented in Table
46. The scenarios of using the log-logistic parametric curve for gefitinib survival projection of OS
and treatment beyond progression had the greatest impact to the base-case ICER, with both changes
leading to a decrease to the ICER. Using the results from the NMA for PFS and OS resulted in an
increase to the ICER.

117
Table 46: Results of base-case scenario analysis for the comparison between dacomitinib and afatinib.
Scenario Dacomitinib Afatanib ICER % changeTotal
LYs Total QALYs
Total costs
Total LYs
Total QALYs
Total costs
Base-case ***** ***** ******* ***** ***** ******* ******* * Gefitinib survival projection (PFS)
*****
*****
******* ***** ***** ******* ******* ***
Gefitinib survival projection (OS)
***** ***** ******* ***** ***** ******* ******* ****
FP model (PFS)
***** ***** ******* ***** ***** ******* ******* ***
FP model (OS)
***** ***** ******* ***** ***** ******* ******* ***
NMA methodology (PFS and OS)
***** ***** ******* ***** ***** ******* ******* ***
Utility (PF - ARCHER) with AEs
***** ***** ******* ***** ***** ******* ******* **
Utility (PF - Labbé) with AEs
***** ***** ******* ***** ***** ******* ******* **
Treatment beyond progression
***** ***** ******* ***** ***** ******* ******* ****
The company presented results for the PSA undertaken around the outcome cost per QALY gained.
In general, the company used appropriate distributions around the model input parameters varied.
However, the ERG noted that distributions could have been placed around other inputs to reflect
the uncertainty, instead of keeping these inputs fixed. A range of sensitivity and scenario analyses
were undertaken. These results showed that the discount rate applied to benefits and using the log-
logistic parametric curve to model OS for gefitinib were the key drivers to the ICERs.
SUPERSEDED See erratum

118
5.3.2 Cost-effectiveness results: dacomitinib (list price) versus comparators (list
prices).
Results for the comparison between dacomitinib, erlotinib, afatinib and gefitinib at list prices were
presented in the CS Appendix M.
Company’s main results (all treatments at list prices)
Using the list prices for dacomitinib and its comparators lead to an increase to the expected mean
costs, whilst the expected mean QALYs remained constant. In Table 47 the results show that
gefitinib was dominated by erlotinib, and afatinib was extendedly dominated by the comparison
between dacomitinib and erlotinib. Hence, the ICER for the comparison between dacomitinib
versus erlotinib was approximately ******* per QALY gained.
Table 47: Deterministic results, company base-case using the list prices.
Treatment Expected mean costs (£)
Incremental costs (£)
Expected mean QALY
Incremental QALY
ICER (£)
Erlotinib ******* * **** * *
Gefitinib ******* ****** **** **** *********
Afatinib ******* ******* **** **** ********************
Dacomitinib ******* ******* **** **** ******* ICER, incremental cost-effectiveness ratio; QALY, quality adjusted life years gained
Results in the form of LYG show that dacomitinib is more expensive than all comparators and is
expected to yield **** LYG and has an ICER of approximately ******* per LYG (see Table 48).
Table 48: Deterministic results, company base-case using the list prices.
Treatment Expected mean costs (£)
Incremental costs (£)
Expected mean LYGs
Incremental LYGs
ICER (£)
Erlotinib ******* * **** * * Gefitinib ******* ****** **** **** ********* Afatinib ******* ******* **** **** ********************Dacomitinib ******* ******* **** **** ******* ICER, incremental cost-effectiveness ratio; LYG, life years gained

119
Company’s probabilistic sensitivity analysis results (all treatments at list prices)
Using the list prices, the ICER results of the PSA are similar/in-line with the results based on the
deterministic analysis (Table 49). The results of the PSA slightly underestimates to expected mean
costs for each comparator and slightly overestimates the expected mean QALYs yielded.
Table 49: Probabilistic results, company base-case using the list prices.
Strategy Expected mean costs (£)
Incremental costs (£)
Expected mean LYGs
Incremental LYGs
ICER (£)
Erlotinib ******* * **** * * Gefitinib ******* ****** **** **** ********* Afatinib ******* ******* **** **** ********************Dacomitinib ******* ******* **** **** ******* ICER, incremental cost-effectiveness ratio; LYG, life years gained
The output of the PSA is given graphically in the scatterplot depicted in Figure 21 and is plotted in
the form of CEACs in Figure 22. According to this output, the probability of dacomitinib being
cost-effective at a WTP threshold of £30,000 per additional QALY is *****
Figure 21: Scatterplot of strategies on the cost-effectiveness plane, company base-case using list prices

120
Figure 22: Cost-effectiveness acceptability curve, company base-case using the list prices
Deterministic sensitivity analysis results (all treatments at list prices)
Similar results are seen for the comparison between dacomitinib versus gefitinib/erlotinib in
deterministic sensitivity analyses (see Figure 23 and Figure 24), which showed that the monthly
discount rate applied to benefits is the key driver of cost-effectiveness.
Likewise for the comparison between dacomitinib versus afatinib the discount rate applied to
benefits and time horizon appears to be the key drivers of the ICER (see Figure 25).
121
Figure 23: Tornado diagram for the comparison of dacomitinib versus gefitinib, using the list prices
Figure 24: Tornado diagram for the comparison of dacomitinib versus erlotinib, using the list prices

122
Figure 25: Tornado diagram for the comparison of dacomitinib versus afatinib, using the list prices
Company’s scenario analysis results (all treatments at list prices)
The results for each change made and the impact to the base-case results are presented in Table 50
through to Table 52 for the comparison between dacomitinib and the comparators, using the list
prices. As seen in these Tables , under the scenario of using log-logistic parametric curves for OS
had the greatest impact to the base-case ICER for dacomitinib against all comparators.
SUPERSEDED See erratum
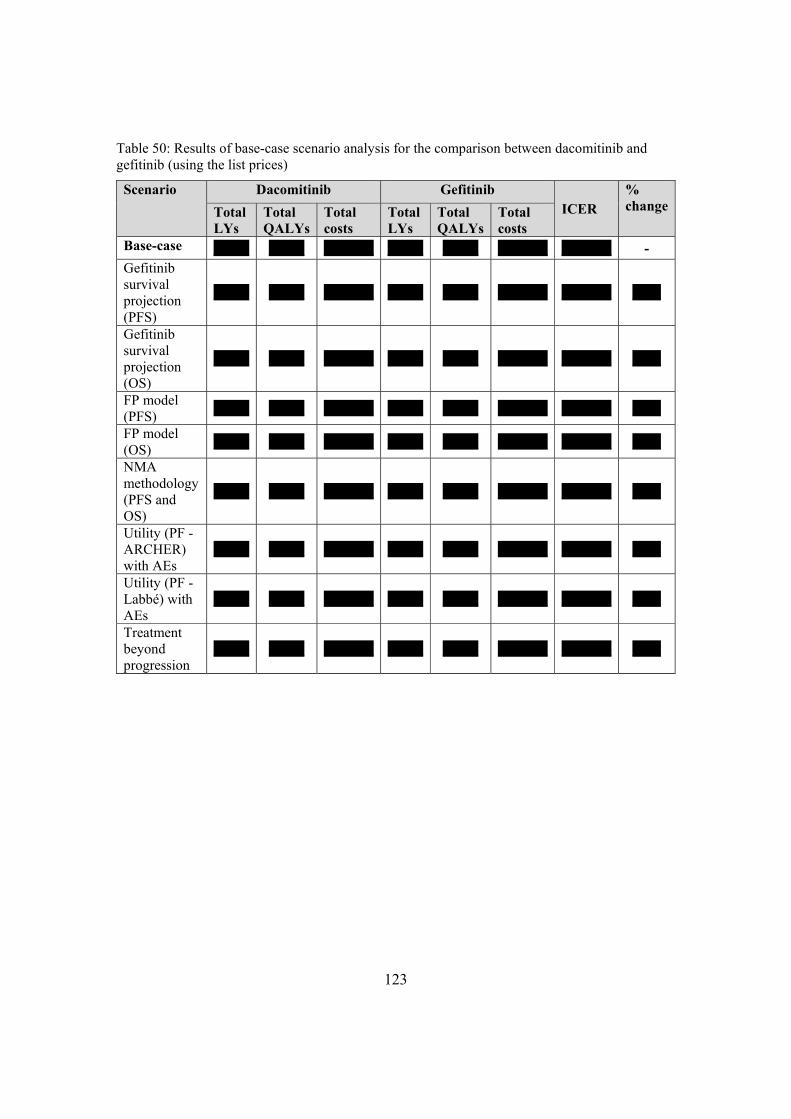
123
Table 50: Results of base-case scenario analysis for the comparison between dacomitinib and gefitinib (using the list prices)
Scenario Dacomitinib Gefitinib ICER
% changeTotal
LYs Total QALYs
Total costs
Total LYs
Total QALYs
Total costs
Base-case ***** ***** ******* ***** ***** ******* ******* - Gefitinib survival projection (PFS)
***** ***** ******* ***** ***** ******* ******* ****
Gefitinib survival projection (OS)
***** ***** ******* ***** ***** ******* ******* ****
FP model (PFS)
***** ***** ******* ***** ***** ******* ******* ****
FP model (OS)
***** ***** ******* ***** ***** ******* ******* ****
NMA methodology (PFS and OS)
***** ***** ******* ***** ***** ******* ******* ****
Utility (PF - ARCHER) with AEs
***** ***** ******* ***** ***** ******* ******* ****
Utility (PF - Labbé) with AEs
***** ***** ******* ***** ***** ******* ******* ****
Treatment beyond progression
***** ***** ******* ***** ***** ******* ******* ****

124
Table 51: Results of base-case scenario analysis for the comparison between dacomitinib and erlotinib (using list prices)
Scenario Dacomitinib Erlotinib ICER
% changeTotal
LYs Total QALYs
Total costs
Total LYs
Total QALYs
Total costs
Base-case ***** ***** ******* ***** ***** ******* ******* - Gefitinib survival projection (PFS)
***** ***** ******* ***** ***** ******* ******* ****
Gefitinib survival projection (OS)
***** ***** ******* ***** ***** ******* ******* ****
FP model (PFS)
***** ***** ******* ***** ***** ******* ******* ****
FP model (OS)
***** ***** ******* ***** ***** ******* ******* ****
NMA methodology (PFS and OS)
***** ***** ******* ***** ***** ******* ******* ****
Utility (PF - ARCHER) with AEs
***** ***** ******* ***** ***** ******* ******* ****
Utility (PF - Labbé) with AEs
***** ***** ******* ***** ***** ******* ******* ****
Treatment beyond progression
***** ***** ******* ***** ***** ******* ******* ****

125
Table 52: Results of base-case scenario analysis for the comparison between dacomitinib and afatinib (using list prices)
Scenario Dacomitinib Afatinib ICER
% changeTotal
LYs Total QALYs
Total costs
Total LYs
Total QALYs
Total costs
Base-case ***** ***** ******* ***** ***** ******* ******* * Gefitinib survival projection (PFS)
***** ***** ******* ***** ***** ******* ******* ****
Gefitinib survival projection (OS)
***** ***** ******* ***** ***** ******* ******* ****
FP model (PFS)
***** ***** ******* ***** ***** ******* ******* ****
FP model (OS)
***** ***** ******* ***** ***** ******* ******* ****
NMA methodology (PFS and OS)
***** ***** ******* ***** ***** ******* ******* ****
Utility (PF - ARCHER) with AEs
***** ***** ******* ***** ***** ******* ******* ****
Utility (PF - Labbé) with AEs
***** ***** ******* ***** ***** ******* ******* ****
Treatment beyond progression
***** ***** ******* ***** ***** ******* ******* ****
5.3.3 Model validation and face validity check
The company provided validity checks by comparing their clinical and cost-effectiveness results
against those in previous studies. Briefly, from the model the company reported median PFS and
OS for gefitinib, then compared these results to previous studies that included gefitinib as a
comparison. Table 53 and Table 54 show the comparisons between the company’s model and those
reported in published studies for PFS and OS for gefitinib, respectively.

126
Table 53: PFS outcome for gefitinib versus previous published studies.
Median
Proportion progression-free at
1 year 2 years 3 years 5 years Base-case (generalised gamma)
**** ***** **** **** ****
Scenario (Log-normal) *** ***** ***** **** ****
ARCHER 1050 *** ***** **** * *
LUX-Lung 7 10.9 39.5% 5.6% 1.5% -
Lin 2016 12.1 54% 16.2% 8.4% 0.0%
WJTOG 3405 9.6 41.6% 12.4% 6.2% -
Table 54: OS outcome for gefitinib versus previous published studies.
Median
Proportion alive at 1 year 2 years 3 years 5 years 6 years 7 years 8 years
Base-case (generalised gamma)
**** ***** ***** ***** ***** **** **** ****
Scenario (Log-logistic)
**** ***** ***** ***** ***** ***** **** ****
ARCHER 1050
**** ***** ***** ***** * * * *
LUX-Lung 7
24.5 84.6% 50.9% 32.7% -
Lin 2016
30.9 89.9% 66.3% 39.3% 14.6% 10.5% 6.6% 0.0%
WJTOG 3405
34.8 85.1% 64.3% 47.5% 21.0% 10.9% 6.8% -
In addition to model validity checks, the company consulted with two clinical experts who provided
information on key inputs used in the cost-effectiveness model.
ERG summary
Based on the parametric curves used, the ERG notes that the model predicts similar PFS and OS
results for gefitinib as those observed in previous studies. However, we consider that the long-term
extrapolations based on these parametric models to be pessimistic.

127
5.4 Exploratory and sensitivity analyses undertaken by the ERG
5.4.1 The ERG’s suggested amendments
On the basis of the critique of the submitted economic model, the ERG suggests an amended base-
case. The rationale for these amendments has been given alongside the critique provided in Section
5.2 and is briefly summarised below.
Changes in PFS: As explained in Section 5.2.6.2, the ERG consider that the extrapolations
based on the generalised parametric curve for PFS along with the selected results from the
FP NMA to be pessimistic beyond two years. Hence, we used the log-normal parametric
curve for gefitinib with the results from the FP NMA to derive the survival for the other
comparators (P1= 0.5, P2=1). Also, we assumed that afatinib PFS to be equal to the mean
PFS of dacomitinib and gefitinib from 36 months onwards.
Changes in OS: As noted in Section 5.2.6.3, the ERG considers that OS estimates based
on the generalised gamma parametric curve for patients randomised to gefitinib in
ARCHER 1050 are consistently below what was observed in Lin et al. (2016)58, which
was an unhealthier than the population in ARCHER 1050. Additionally, expert advise
sought by the ERG indicated that up to 5% of patients would be expected to be alive at 15
years. Hence, we used the log-logistic parametric curve for gefitinib with the results from
the FP NMA, and assumed equal efficacy, on the hazard scale, from 36 months onwards.
Extrapolations based on the log-logistic parametric curve was consistent at 5- and 7-year
data from both Lin et al. (2016)58 and WJTOG 340557.
Disutilities associated with adverse events: As explained in Section 5.2.10, the ERG
deems that application of disutility values associated with AEs is necessary, as it is
unlikely that the EQ-5D had been administered at the time-point where these AEs
occurred. Hence, we included disutilities associated with AEs.
Post-progression utility values: The ERG used a weighted-mean utility value for post-
progression from the ARCHER 1050 trial. We considered these values to be more
appropriate, in line with the NICE DSU reccommendations to maintain the same data
source for health state values.3 (see a Section 5.2.10).

128
Age-related disutilities: The health utility values used in the model were not age-adjusted.
Including age-related disutilites takes into consideration the effect of ageing on a person’s
HRQoL. We derived age-related disutilities from the widely used algorithm published by
Ara and colleagues.4
Correction to how the PAS for gefitinib had been applied in the model: On inspection, the
ERG identified that the publicly available PAS discount for gefitinib had been applied
incorrectly in the economic model (see Section 5.2.11). An amendment was made in the
model to correct for this error.
During communication with the NICE Technical Team overlooking this appraisal, it was agreed
that ERG will undertake and present an additional analysis based on the the comparison between
dacomitinib (applying the company’s PAS discount) versus the comparators (at list prices). This
analysis forms the basis on which any ERG amendments and preferred assumptions are applied.
For each of these amendments, the values used in the company’s base-case analysis and the values
preferred by the ERG (given in bold) can be found in 55 below. Results of the ERG base-case
analysis are presented in Section 6.1.
Table 55. Values and assumptions used in the ERG’s base-case analysis.
Parameter Values in
company's base-case
ERG’s preferred value Section where justification is
given PFS for gefinitib Generalised gamma;
FP NMA (P1=0.5; P2=1.5)
Log-normal; FP (P1=0.5;P2=1); assumed PFS equal to mean PFS for dacomitinib and gefitinib from 36 months
Section 5.2.6.2
OS for gefinitib Generalised gamma; FP NMA (P1=0.5; P2=1.5)
Log-logistic; FP(P1=0.5;P2=1); assumed equal efficacy, on the hazard scale, from 36 months onwards
Section 5.2.6.3
Incorporation of disutility due to AEs
Not included in the model
Diarrhoea: -0.15 Fatigue: -0.18 ALT increased: 0.00 Paronychia: -0.20 Rash: -0.20
Section 5.2.10

129
Post-progression utility value
0.64 ****
Age-related disutilities Not applied in the model
Applied in the model
Patient access scheme for gefitinib
Applied in cycle 2 Applied in cycle 3 Section 5.4.1
PFS: progression free survival; OS: overall survival; AEs: adverse events
5.4.2 Probabilistic sensitivity analysis
The ERG re-run the PSA in order to obtain results that reflect the values and assumptions forming
the ERG suggested base-case. The revised PSA results (joint distribution of cost and QALY
estimates) were generated through 10,000 iterations and are depicted in the cost-effectiveness plane
and cost-effectiveness acceptability curves presented in Section 6.2.
5.4.3 Additional deterministic analyses
The ERG undertook additional scenario analyses, where amendments made as part of the ERG’s
base-case were assigned alternative values. The following scenario analyses were undertaken:-
For PFS, use the log-normal parametric curve for gefitinib with the results from the FP
NMA to derive the survival for the other comparators (P1= 0.5, P2=1). Assume afatinib
PFS assumed to be equal to the mean PFS of dacomitinib and gefitinib from 55 months
onwards
For OS, use the log-logistic parametric curve for gefitinib with the results from the FP
NMA, and assume equal efficacy
Post-progression utility values obtained from Labbé et al.2
Clinical effectiveness results from the company’s NMA for OS
The main findings of this additional work are presented in Section 6.3 below.
5.5 Conclusions of the cost-effectiveness section
The company submission is based on a partitioned survival model used to show the experience of
a cohort treatment naïve participants with locally advanced or metastatic non-small cell lung cancer
with activating mutations in epidermal growth factor receptor (EGFR). The model is used to
evaluate the cost-effectiveness of dacomitinib compared to gefitinib, erlotinib and afatinib. The
130
model captures the clinical and economic outcomes for this patient population, by incorporating
clinical effectiveness information from the ARCHER 1050 trial, as well as using a novel FP NMA
to model the survival for PFS and OS for the comparators. The costs included in the model relate
to the direct costs incurred, including drug acquisition and administration costs, subsequent
treatment costs, management costs, and costs associated with treatment of adverse events and
terminal care treatment. While the model captures the key features of people living with NSCLC
and includes some relevant costs and benefits; under the company’s assumptions the base-case
results are likely to be higher than that presented.
The company’s base-case results are based on applying a discount of *** to the cost of dacomitinib
in the form of a PAS compared to the assumed PAS for the comparators. Under these assumptions,
the company reported a deterministic ICER of approximately ******* when compared to gefitinib.
Results from the PSA showed that there was a **** probability that dacomitinib was cost-effective
at a willingness-to-pay threshold of £30,000 per QALY.
On inspection, no major errors in the company’s model were identified. The results reported in the
company submission reflected those in the model submitted. However, there were some concerns.
First, the modelling of PFS and OS of gefitinib was pessimistic, potentially underestimating the
number of QALYs and costs for all comparators. Secondly, the extrapolation of dacomitinib and
afatinib was reliant on results from the FP NMA, the majority of which were not considered
plausible by the ERG. Third, we noted that there were some resource use and costs that have been
excluded from the analysis: unscheduled hospital admissions, MRI scans for suspected brain
metastases or cord compression and costs associated with the diagnosis of T790M. Fourth, the
company’s base-case results excluded age-related disutilities, and disutilities associated with
adverse events. Additionally, post-progression utility values were obtained from the literature, and
not those collected from the ARCHER 1050 trial. The ERG believes that it is more appropriate to
include these disutilities, as well as using the utility values obtained from the trial, which is more
in line with the NICE DSU recommendations.3 Last, the economic model has applied the (publicly
available) PAS discount for gefinitinib incorrectly.
The majority of the ERG’s concerns have been addressed, which is reflected in the ERG’s preferred
assumptions and thus base-case. However, it should be noted that the ERG’s base-case reports the
results based on the comparison between dacomitinib (PAS) versus the list prices for all
comparators, which is not directly comparable to the company’s base-case ICER.

131
6 IMPACT OF ADDITIONAL CLINICAL AND ECONOMIC ANALYSES
UNDERTAKEN BY THE ERG
6.1 Impact of ERG changes on the company’s base-case results.
In this section, we present the results following the changes in methods, parameters and inputs
detailed above, executed one at a time. Results are presented for:
the comparison between dacomitinib (with PAS discount) versus comparators (with
company’s assumed PAS discount) (i.e. the company’s base-case analysis, presented in
the main CS document)
the comparison between dacomitinib (with PAS discount) versus comparators (at list
prices, given in the CS Appendix).
6.1.1 Impact of ERG’s suggested changes on comparison between dacomitinib (PAS)
versus comparators (company’s assumed PAS).
In Table 56, Table 57 and Table 58, we present the results for each change made and its impact on
the company’s results relating to PAS applied to dacomitininb versus the company’s assumed PAS
for each comparator. Across all comparisons and scenarios, the greatest impact to the pairwise
ICERs was observed after using the log-logistic parametric curve for gefitinib with the results from
the FP NMA, and assuming equal efficacy, on the hazard scale, from 36 months onwards.
It must be noted that the tables below report the results for pairwise comparison (e.g. dacomitinib
versus gefitinib; dacomitinib versus erlotinib and dacomitinib versus afatinib) so that the impact of
each assumption on the resulting ICER can be seen more clearly (last two columns in the tables).
An alternative presentation, focusing on the impact of each assumption on the results for all
treatments (incremental comparison) is presented in Appendix (Section 10.1.1).

132
Table 56: Results of scenario analysis for the comparison between dacomitinib and gefitinib (dacomitinib PAS vs gefitinib assumed PAS).
Scenario Dacomitinib Gefitinib
ICER % change Total LYs
Total QALYs
Total costs Total LYs
Total QALYs
Total costs
Base-case **** **** ******* **** **** ******* ******* * Gefitinib survival projection (PFS) using log-normal
**** **** ******* **** **** ******* ******* *******
Gefitinib survival projection (PFS) using log-normal and P1=0.5; P2=1
**** **** ******* **** ***** ******* ******* *******
Gefitinib survival projection (OS) using log-logistic
**** **** ******* **** **** ******* ******* *******
Gefitinib survival projection (OS) using log-logistic and HR=1 from 36 months
**** **** ******* **** **** ******* ******* *******
Disutilities associated with AEs
**** **** ******* **** **** ******* ******* ******
Post-progression utility from ARCHER 1050
**** **** ******* **** **** ******* ******* ******
Age-related disutilities
**** **** ******* **** **** ******* ******* ******
Correction of the PAS applied to gefitinib
**** **** ******* **** **** ******* ******* ******

133
Table 57: Results of scenario analysis for the comparison between dacomitinib and erlotinib (dacomitinib PAS vs erlotinib assumed PAS)
Scenario Dacomitinib Erlotinib
ICER % change Total LYs
Total QALYs
Total costs Total LYs
Total QALYs
Total costs
Base-case **** **** ******* **** **** ******* ******* * Gefitinib survival projection (PFS) using log-normal
**** ***** ******* **** **** ******* ******* *******
Gefitinib survival projection (PFS) using log-normal and P1=0.5; P2=1
**** **** ******* **** **** ******* ******* *******
Gefitinib survival projection (OS) using log-logistic
**** **** ******* **** **** ******* ******* *******
Gefitinib survival projection (OS) using log-logistic and HR=1 from 36 months
**** **** ******* **** **** ******* ******* *******
Disutilities associated with AEs
**** **** ******* **** **** ******* ******* ******
Post-progression utility from ARCHER 1050
**** **** ******* **** **** ******* ******* ******
Age-related disutilities
**** **** ******* **** **** ******* ******* ******
Correction of the PAS applied to gefitinib
**** **** ******* **** **** ******* ******* *****

134
Table 58: Results of scenario analysis for the comparison between dacomitinib and afatinib. (dacomitinib PAS vs afatinib assumed PAS)
Scenario Dacomitinib Afatinib ICER % change Total
LYsTotal
QALYsTotal costs
Total LYs
Total QALYs
Total costs
Base-case **** **** ******* **** **** ******* ******* * Gefitinib survival projection (PFS) using log-normal
**** **** ******* **** **** ******* ******* *******
Gefitinib survival projection (PFS) using log-normal and P1=0.5; P2=1
**** **** ******* **** **** ******* ******* *******
Gefitinib survival projection (OS) using log-logistic
**** **** ******* **** **** ******* ******* *******
Gefitinib survival projection (OS) using log-logistic and HR=1 from 36 months
**** **** ******* **** ***** ******* ******* ********
Disutilities associated with AEs
**** **** ******* **** **** ******* ******* ******
Post-progression utility from ARCHER 1050
**** **** ******* **** **** ******* ******* ******
Age-related disutilities
**** **** ******* **** **** ******* ******* ******
Correction of the PAS applied to gefitinib
**** **** ******* **** **** ******* ******* *****

135
6.1.2 Impact of ERG’s suggested changes on the comparison between dacomitinib
(PAS) versus erlotinib, gefitinib and afatinib (list prices).
In Table 59, Table 60 and Table 61 we present the exploratory analysis results based on the
comparison between dacomitinib (with the company’s PAS discount applied) versus comparator
(at list prices). As it can be seen in Table 59 and Table 61 across all scenarios dacomitinib continued
dominating gefitinib and afatinib, respectively.
Table 60 reports the results based on the comparison between dacomitinib and erlotinib. Applying
the PAS discount to dacomitinib and using the list price for erlotinib, resulted in an ICER of
approximately ****** per QALY. The scenario of fitting the log-normal parametric curve to
gefitinib with the results of the FP NMA (selecting P1= 0.5, P2=1) and assuming the PFS for
afatinib to be equal to the mean PFS of dacomitinib and gefitinib from 36 months onwards had the
greatest impact to the ICER, with an increase to approximately ******* per QALY.
ERG summary
Here we undertook exploratory analyses based on the company’s base-case, which applied a
discount in the form of a PAS to dacomitinib and assumed PAS for the comparators. Based on our
changes made, across all comparisons and scenarios, using the log-logistic parametric curve for
gefitinib with the results from the FP NMA, and assumed equal efficacy, from 36 months onwards
had the greatest impact to the pairwise ICERs. Additionally, we undertook scenario analyses using
the PAS discount for dacomitinib and list prices for all comparators. As expected, dacomitinib
dominated gefitinib and afatinib, across all scenarios. The pairwise comparison between
dacomitinib and erlotinib showed that the total expected mean costs for dacomitinib was more than
the costs for erlotinib. Under the scenario of using the log-normal parametric curve for gefitinib
with results from the FP NMA to derive survival for erlotinib (and afatinib) and assuming afatinib
PFS to be equal to the mean PFS of dacomitinib and gefitinib from 36 months onwards had the
greatest impact to the model.

136
Table 59: Results of scenario analysis for the comparison between dacomitinib and gefitinib (both at list prices)
Scenario Dacomitinib Gefitinib
ICER Total LYs Total QALYs Total costs Total LYs Total QALYs Total costs
Base-case **** **** ******* **** **** ******* *********
Gefitinib survival projection (PFS) using log-normal
**** **** ******* **** **** ******* *********
Gefitinib survival projection (PFS) using log-normal and P1=0.5; P2=1
**** **** ******* **** **** ******* *********
Gefitinib survival projection (OS) using log-logistic
**** **** ******* **** **** ******* *********
Gefitinib survival projection (OS) using log-logistic and HR=1 from 36 months
**** **** ******* **** **** ******* *********
Disutilities associated with AEs
**** **** ******* **** **** ******* *********
Post-progression utility from ARCHER 1050
**** **** ******* **** **** ******* *********
Age-related disutilities **** **** ******* **** **** ******* *********

137
Table 60: Results of base-case scenario analysis for the comparison between dacomitinib and erlotinib (both at list prices)
Scenario Dacomitinib Erlotinib ICER % change in ICER
Total LYs
Total QALYs
Total costs Total LYs
Total QALYs
Total costs
Base-case **** **** ******* **** **** ******* ****** *
Gefitinib survival projection (PFS) using log-normal
**** **** ******* **** **** ******* ****** ******
Gefitinib survival projection (PFS) using log-normal and P1=0.5; P2=1
**** **** ******* **** **** ******* ******* ********
Gefitinib survival projection (OS) using log-logistic
**** **** ******* **** **** ******* ****** *******
Gefitinib survival projection (OS) using log-logistic and HR=1 from 36 months
**** **** ******* **** **** ******* ****** *******
Disutilities associated with AEs
**** **** ******* **** **** ******* ****** *****
Post-progression utility from ARCHER 1050
**** **** ******* **** **** ******* ****** ******
Age-related disutilities
**** **** ******* **** **** ******* ****** ******

138
Table 61: Results of base-case scenario analysis for the comparison between dacomitinib and afatinib (both at list prices)
Scenario Dacomitinib Afatinib ICER
Total LYs
Total QALYs Total costs Total LYs Total QALYs Total costs
Base-case **** **** ******* **** **** ******* *********
Gefitinib survival projection (PFS) using log-normal
**** **** ******* **** **** ******* *********
Gefitinib survival projection (PFS) using log-normal and P1=0.5; P2=1
**** **** ******* **** **** ******* *********
Gefitinib survival projection (OS) using log-logistic
**** **** ******* **** **** ******* *********
Gefitinib survival projection (OS) using log-logistic and HR=1 from 36 months
**** **** ******* **** **** ******* *********
Disutilities associated with AEs
**** **** ******* **** **** ******* *********
Post-progression utility from ARCHER 1050
**** **** ******* **** **** ******* *********
Age-related disutilities **** **** ******* **** **** ******* *********

139
6.2 Results of ERG base-case analysis.
As explained in Section 5.4.1, following communication with the NICE Technical Team, it was
agreed that the ERG base case analysis should relate to
dacomitinib (with PAS discount proposed by manufacturer) versus comparators (at list
prices).
Carrying out all of the changes detailed in Section 5.4.1 simultaneously, that is, implementing the
ERG’s preferred assumptions, gave the following results.
A table detailing changes in the submitted economic model spreadsheet in order to implement each
of ERG ammendments is given in Appendix 10.1.3. ( Appendix Table 17).
6.2.1 ERG base-case results (dacomitinib with PAS vs comparators at list prices)
In Table 62, we present the results for the comparison between dacomitinib (PAS) versus
comparators (list prices), whilst keeping all other assumptions fixed, before the ERG suggested
amendments were implemented. These results show that dacomitinib dominated gefitinib and
afatinib, thus being less costly and more effective. In comparison to erlotinib, dacomitinib was
approximately ****** more expensive and expected to yield **** more QALYs, with an ICER of
approximately ****** per QALY gained.
Table 62. Deterministic results using the PAS for dacomitinib and the list prices for the comparators
Treatment Expected mean costs
(£)
Incremental costs (£)
Expected mean
QALY
Incremental QALY
ICER (£)
Erlotinib ******* * **** * *
Dacomitinib ******* ****** **** **** ******
Gefitinib ******* ****** **** ***** *********
Afatinib ******* ******* **** ***** *********
ICER, incremental cost-effectiveness ratio; QALY, quality adjusted life years gained
In Table 63, we present the results of analysis based on the ERG preferred assumptions. Based on
our preferred assumptions the results show that treatment with erlotinib had the lowest total mean
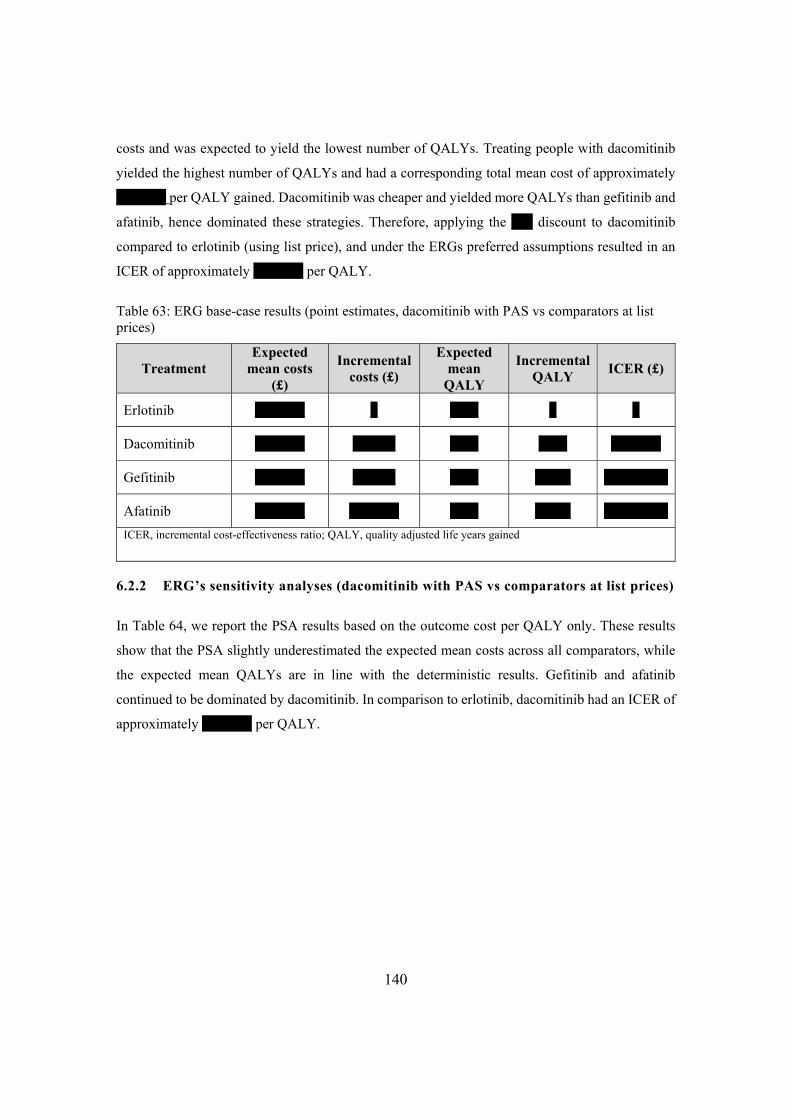
140
costs and was expected to yield the lowest number of QALYs. Treating people with dacomitinib
yielded the highest number of QALYs and had a corresponding total mean cost of approximately
******* per QALY gained. Dacomitinib was cheaper and yielded more QALYs than gefitinib and
afatinib, hence dominated these strategies. Therefore, applying the *** discount to dacomitinib
compared to erlotinib (using list price), and under the ERGs preferred assumptions resulted in an
ICER of approximately ******* per QALY.
Table 63: ERG base-case results (point estimates, dacomitinib with PAS vs comparators at list prices)
Treatment Expected
mean costs (£)
Incremental costs (£)
Expected mean
QALY
Incremental QALY
ICER (£)
Erlotinib ******* * **** * *
Dacomitinib ******* ****** **** **** *******
Gefitinib ******* ****** **** ***** *********
Afatinib ******* ******* **** ***** *********
ICER, incremental cost-effectiveness ratio; QALY, quality adjusted life years gained
6.2.2 ERG’s sensitivity analyses (dacomitinib with PAS vs comparators at list prices)
In Table 64, we report the PSA results based on the outcome cost per QALY only. These results
show that the PSA slightly underestimated the expected mean costs across all comparators, while
the expected mean QALYs are in line with the deterministic results. Gefitinib and afatinib
continued to be dominated by dacomitinib. In comparison to erlotinib, dacomitinib had an ICER of
approximately ******* per QALY.

141
Table 64: ERG probabilistic sensitivity analysis results, using the assumed the PAS for dacomitinib and list prices for comparators
Treatment Expected
mean costs (£)
Incremental costs (£)
Expected mean
QALY
Incremental QALY
ICER (£)
Erlotinib ******* * **** * *
Dacomitinib ******* ***** **** **** *******
Gefitinib ******* ***** **** ***** *********
Afatinib ******* ******* **** ***** *********
ICER, incremental cost-effectiveness ratio; QALY, quality adjusted life years gained
In Figure 26 and Figure 27, we present the results of the PSA in the form of a scatterplot on the
cost-effectiveness plane and a CEAC, respectively. Results from 10,000 simulations show that
there is considerable uncertainty in the incremental QALYs and less so for the incremental costs.
Note, the scatterplot presents dacomitinib against each of the three comparator drugs (showing
incremental costs and QALYs) and the legend indicates the comparator drug being visualised. For
the comparison between dacomitinib and afatininb a small number of iterations/simualtions are in
the south-west quadrant, which signifies that dacomitinib may be less costly and less effective than
afatinib.
At a WTP threshold of £30,000 per QALY, *** of the simulations for the comparison between
dacomitinib and erlotinib were below and up to the threshold.

142
Figure 26: Scatterplot of strategies on the cost-effectiveness plane, ERG base-case

143
Figure 27: Cost-effectiveness acceptability curve, ERG base-case

144
6.2.3 ERG scenario analysis (dacomitinib with PAS vs comparators at list prices)
As explained in Section 5.4.3, in order to test the impact of using values alternative to those
employed in the ERG base-case analysis, the ERG performed additional scenario analyses. Briefly,
the alternative specifications were:
For PFS, use the log-normal parametric curve for gefitinib with the results from the FP
NMA to derive the survival for the other comparators (P1= 0.5, P2=1). Assume afatinib
PFS assumed to be equal to the mean PFS of dacomitinib and gefitinib from 55 months
onwards
For OS, use the log-logistic parametric curve for gefitinib with the results from the FP
NMA, and assume equal efficacy
Post-progression utility values obtained from Labbé et al.2
Clinical effectiveness results from the company’s NMA for OS
The results for these analyses are presented in Table 65 through to Table 68. The results show that
dacomitinib dominated gefitinib and afatinib for all scenarios. When compared to erlotinib, across
all scenarios dacomitib remained cost-effective.
Table 65: ERG scenario analysis, using the log-normal parametric curve for gefitinib
Treatment Expected
mean costs (£)
Incremental costs (£)
Expected mean
QALY
Incremental QALY
ICER (£)
Erlotinib ******* * **** * *
Dacomitinib ******* ***** **** **** *******
Gefitinib ******* ***** **** ***** *********
Afatinib ******* ******* **** ***** *********
ICER, incremental cost-effectiveness ratio; QALY, quality adjusted life years gained

145
Table 66: ERG scenario analysis, using the log-logistic parametric curve for gefitinib
Treatment Expected
mean costs (£)
Incremental costs (£)
Expected mean
QALY
Incremental QALY
ICER (£)
Erlotinib ******* * **** * *
Dacomitinib ******* ***** **** **** *******
Gefitinib ******* ***** **** ***** *********
Afatinib ******* ****** **** ***** *********
ICER, incremental cost-effectiveness ratio; QALY, quality adjusted life years gained
Table 67: ERG scenario analysis, using utility values reported in Labbé et al.
Treatment Expected
mean costs (£)
Incremental costs (£)
Expected mean
QALY
Incremental QALY
ICER (£)
Erlotinib ******* * **** *
Dacomitinib ******* ****** **** **** *******
Gefitinib ******* ****** **** ***** *********
Afatinib ******* ******* **** ***** *********
ICER, incremental cost-effectiveness ratio; QALY, quality adjusted life years gained
Table 68: ERG scenario analysis, using results from the NMA for overall survival
Treatment Expected
mean costs (£)
Incremental costs (£)
Expected mean
QALY
Incremental QALY
ICER (£)
Erlotinib ******* * **** * *
Dacomitinib ******* ***** **** **** ******
Gefitinib ******* ***** **** ***** *********
Afatinib ******* ******* **** ***** *********
ICER, incremental cost-effectiveness ratio; QALY, quality adjusted life years gained

146
ERG summary
We undertook scenario analyses based on the ERG’s preferred assumptions, and using PAS
discount for dacomitinib and list prices for other comparators. Across all scenarios, dacomitinib
dominated gefitinib and afatinib; however, remained cost-effective when compared to erlotinib.
7 END OF LIFE
The company has not presented a case in support of dacomitinib as an ‘end of life’ treatment. NICE
prescribes that, for an ‘end of life’ case to be made, the appraised treatment needs to satisfy all of
the following criteria: i) the treatment is indicated for patients with a short life expectancy, normally
less than 24 months and; ii) there is sufficient evidence to indicate that the treatment offers an
extension to life, normally of at least an additional 3 months, compared to current NHS treatment,
and; iii) the treatment is licensed or otherwise indicated, for small patient populations. The ERG
considers that these criteria are not met.
8 OVERALL CONCLUSION
The evidence of clinical effectiveness for dacomitinib in EGFR-positive NSCLC comes from an
RCT comparing dacomitinib to gefitinib and a NMA comparing dacomitinib to afatinib. The
ARCHER 1050 trial found a favourable effect for dacomitinib on many key outcomes, including
PFS, although the risk of performance bias, baseline imbalance in potential prognostic factors and
some ERG identified issues with the trial statistics should be considered. The NMA used a
fractional polynomial approach and the methods were reasonably described and the approach
justified. Areas of uncertainty include whether the populations in the two trials were homogeneous
enough to be compared and the suitability of the results to the extrapolations required for the cost-
effectiveness analysis. Finally, the ERG believes the submitted evidence may not be generalisable
to the population in England and Wales.
The company’s economic analysis was based on a partitioned survival model programmed in
Microsoft Excel. The ERG considered the choice of model and its structure to be appropriate to
capture the long-term costs and benefits for treating people with EGFR+ advance/metastatic
NSCLC with dacomitinib compared to the comparators. The comparators included in the base-case
analysis were appropriate, and in line with the NICE scope for treatment of first-line EGFR+

147
patients. All comparators were in keeping with their marketing authorisation and licensed dosing
schedule.
Reasonable methods were used to identify information to populate the economic model, with the
clinical information obtained from the ARCHER 1050 trial and a fractional polynomial network
meta-analysis. The resource use and costs were in keeping with the viewpoint of the economic
analysis, with information obtained from the key trial as well as from the published sources. Under
the company’s assumptions, the base-case deterministic ICER was approximately ******* per
QALY gained. Probabilistic sensitivity analysis results showed that dacomoitinib had a ****
probability of being cost-effective at a willingness-to-pay threshold of £30,000 per QALY.
Alterations were made to the company’s economic model that formed the basis for the ERG’s
model, which resulted in differences between the company’s base-case results and those reported
by the ERG. It should be noted that the company’s results were presented on the basis of the
comparison between dacomitinib with PAS discount and comparators with assumed/speculated
PAS discounts (company’s base case), while the ERG’s preferred assumptions were applied to the
comparison between dacomitinib with PAS versus comparators at list prices. The latter comparison
could be viewed as favouring the intervention.
We highlighted several areas or concern/uncertainty, which shows that the company’s ICER could
potentially be overestimated. First, the extrapolations for PFS and OS of gefitinib was pessimistic,
potentially underestimating the number of QALYs and costs for all comparators. Second, the
extrapolation of dacomitinib and afatinib was reliant on results from the FP NMA, the majority of
which were not considered plausible by the ERG. Third, the exclusion of some resource use and
costs from the analysis: unscheduled hospital admissions, MRI scans for suspected brain metastases
or cord compression and costs associated with the diagnosis of T790M. Fourth, the exclusion of
age-related disutilities, and disutilities associated with adverse events. Additionally, post-
progression utility values were obtained from the literature, and not those collected from the
ARCHER 1050 trial. Last, the economic model has applied the (publicly available) PAS discount
for gefinitinib incorrectly.

148
9 REFERENCES
1. Wu YL, Cheng Y, Zhou X, Lee KH, Nakagawa K, Niho S, et al. Dacomitinib versus
gefitinib as first-line treatment for patients with EGFR-mutation-positive non-small-cell lung
cancer (ARCHER 1050): a randomised, open-label, phase 3 trial. Lancet Oncol
2017;18(11):1454-66. http://dx.doi.org/10.1016/s1470-2045(17)30608-3
2. Labbe C, Leung Y, Silva Lemes JG, Stewart E, Brown C, Cosio AP, et al. Real-World
EQ5D Health Utility Scores for Patients With Metastatic Lung Cancer by Molecular Alteration
and Response to Therapy. Clin Lung Cancer 2017;18(4):388-95.e4.
http://dx.doi.org/10.1016/j.cllc.2016.12.015
3. Ara A, Wailoo A. NICE DSU technical support document 12: The Use of Health Utility
Values in Decision Models. Decision Support Unit, ScHARR, University of Sheffield; 2011.
URL: http://nicedsu.org.uk/wp-content/uploads/2016/03/TSD12-Utilities-in-modelling-
FINAL.pdf (Accessed 1 February 2019).
4. Ara R, Brazier JE. Populating an economic model with health state utility values: moving
toward better practice. Value Health 2010;13(5):509-18. http://dx.doi.org/10.1111/j.1524-
4733.2010.00700.x
5. Juan O, Popat S. Treatment choice in epidermal growth factor receptor mutation-positive
non-small cell lung carcinoma: latest evidence and clinical implications. Ther Adv Med Oncol
2017;9(3):201-16. http://dx.doi.org/10.1177/1758834016687262
6. Li AR, Chitale D, Riely GJ, Pao W, Miller VA, Zakowski MF, et al. EGFR mutations in
lung adenocarcinomas: clinical testing experience and relationship to EGFR gene copy number
and immunohistochemical expression. J Mol Diagn 2008;10(3):242-8.
http://dx.doi.org/10.2353/jmoldx.2008.070178
7. Shigematsu H, Lin L, Takahashi T, Nomura M, Suzuki M, Wistuba, II, et al. Clinical and
biological features associated with epidermal growth factor receptor gene mutations in lung
cancers. J Natl Cancer Inst 2005;97(5):339-46. http://dx.doi.org/10.1093/jnci/dji055
8. Garassino MC. Treatment Decision-Making for EGFR-Mutant NSCLC: Is It Time to
Change? PeerCME; 2018. URL:
https://cme.peercme.com/v/index.html?collection=340204519&presentation=340204519-
p2&Language=en (Accessed 1 February 2019).
9. Committee for Medicinal Products for Human Use (CHMP). Summary of opinion (initial
authorisation): Vizimpro: dacomitinib. London: European Medicines Agency; 2019. URL:

149
https://www.ema.europa.eu/documents/smop-initial/chmp-summary-positive-opinion-
vizimpro_en.pdf (Accessed 1 February 2019).
10. Center for Drug Evaluation and Research. Application Number 211288Orig1s000:
Approval Letter. Silver Spring, MD, USA: U.S. Food and Drug Administration; 2018. URL:
https://www.accessdata.fda.gov/drugsatfda_docs/nda/2018/211288Orig1s000Approv.pdf
(Accessed 1 February 2019).
11. Lin JZ, Ma SK, Wu SX, Yu SH, Li XY. A network meta-analysis of nonsmall-cell lung
cancer patients with an activating EGFR mutation: Should osimertinib be the first-line treatment?
Medicine 2018;97(30):e11569. http://dx.doi.org/10.1097/MD.0000000000011569
12. Lilenbaum R, Axelrod R, Thomas S, Dowlati A, Seigel L, Albert D, et al. Randomized
phase II trial of erlotinib or standard chemotherapy in patients with advanced non-small-cell lung
cancer and a performance status of 2. Journal of Clinical Oncology 2008;26(6):863-9.
http://dx.doi.org/10.1200/JCO.2007.13.2720
13. Chen CY. P2.01-024 - An ENSURE Extension Study to Evaluate 2nd Line Erlotinib and
Gemcitabine/Cisplatin Cross-Over Treatment for EGFR-Mutant Chinese NSCLC Patients.
International Association for the Study of Lung Cancer; 2015. URL:
https://library.iaslc.org/search-speaker?search_speaker=29655 (Accessed 1 February 2019).
14. Xing L, Wu G, Wang L, Li JC, Wang J, Yuan Z, et al. A multicenter, randomized, open-
label, phase II trial of erlotinib versus etoposide plus cisplatin with concurrent radiotherapy in
unresectable stage III non-small cell lung cancer (NSCLC) with epidermal growth factor receptor
(EGFR) activating mutation. Journal of Clinical Oncology Conference 2017;35(15 Supplement
1):8531.
15. Soria JC, Ohe Y, Vansteenkiste J, Reungwetwattana T, Chewaskulyong B, Lee KH, et al.
Osimertinib in untreated EGFR-Mutated advanced non-small-cell lung cancer. New England
Journal of Medicine 2018;378(2):113-25. http://dx.doi.org/10.1056/NEJMoa1713137
16. Zhao W, Liu X, Tian Q, Chang Y, Yang Z, Chen L. Randomized phase II study of
erlotinib as first-line or second-line therapy for EGFR mutation-positive advanced lung
adenocarcinoma patients. Biomedical Research - India 2017;28(4):1917-21.
17. Yang JJ, Zhou Q, Yan HH, Zhang XC, Chen HJ, Tu HY, et al. A phase III randomised
controlled trial of erlotinib vs gefitinib in advanced non-small cell lung cancer with EGFR
mutations. Br J Cancer 2017;116(5):568-74. http://dx.doi.org/10.1038/bjc.2016.456
18. Wu YL, Zhou C, Liam CK, Wu G, Liu X, Zhong Z, et al. First-line erlotinib versus
gemcitabine/cisplatin in patients with advanced EGFR mutation-positive non-small-cell lung

150
cancer: analyses from the phase III, randomized, open-label, ENSURE study. Annals of Oncology
2015;26(9):1883-9. http://dx.doi.org/10.1093/annonc/mdv270
19. Rosell R, Carcereny E, Gervais R, Vergnenegre A, Massuti B, Felip E, et al. Erlotinib
versus standard chemotherapy as first-line treatment for European patients with advanced EGFR
mutation-positive non-small-cell lung cancer (EURTAC): a multicentre, open-label, randomised
phase 3 trial. Lancet Oncology 2012;13(3):239-46. http://dx.doi.org/10.1016/S1470-
2045(11)70393-X
20. Zhou C, Wu Y-L, Chen G, Feng J, Liu X-Q, Wang C, et al. Erlotinib versus
chemotherapy as first-line treatment for patients with advanced EGFR mutation-positive non-
small-cell lung cancer (OPTIMAL, CTONG-0802): a multicentre, open-label, randomised, phase
3 study. Lancet Oncology 2011;12(8):735-42. http://dx.doi.org/10.1016/S1470-2045(11)70184-X
21. Han B, Jin B, Chu T, Niu Y, Dong Y, Xu J, et al. Combination of chemotherapy and
gefitinib as first-line treatment for patients with advanced lung adenocarcinoma and sensitive
EGFR mutations: A randomized controlled trial. International Journal of Cancer
2017;141(6):1249-56. http://dx.doi.org/10.1002/ijc.30806
22. Inoue A, Kobayashi K, Maemondo M, Sugawara S, Oizumi S, Isobe H, et al. Updated
overall survival results from a randomized phase III trial comparing gefitinib with carboplatin-
paclitaxel for chemo-naive non-small cell lung cancer with sensitive EGFR gene mutations
(NEJ002). Ann Oncol 2013;24(1):54-9. http://dx.doi.org/10.1093/annonc/mds214
23. Patil VM, Noronha V, Joshi A, Choughule AB, Bhattacharjee A, Kumar R, et al. Phase
III study of gefitinib or pemetrexed with carboplatin in EGFR-mutated advanced lung
adenocarcinoma. ESMO Open 2017;2(1):e000168. http://dx.doi.org/10.1136/esmoopen-2017-
000168
24. Mitsudomi T, Morita S, Yatabe Y, Negoro S, Okamoto I, Tsurutani J, et al. Gefitinib
versus cisplatin plus docetaxel in patients with non-small-cell lung cancer harbouring mutations
of the epidermal growth factor receptor (WJTOG3405): an open label, randomised phase 3 trial.
Lancet Oncology 2010;11(2):121-8. http://dx.doi.org/10.1016/S1470-2045(09)70364-X
25. Sequist LV, Yang JC-H, Yamamoto N, O'Byrne K, Hirsh V, Mok T, et al. Phase III study
of afatinib or cisplatin plus pemetrexed in patients with metastatic lung adenocarcinoma with
EGFR mutations. Journal of Clinical Oncology 2013;31(27):3327-34.
http://dx.doi.org/10.1200/JCO.2012.44.2806
26. Wu Y-L, Zhou C, Hu C-P, Feng J, Lu S, Huang Y, et al. Afatinib versus cisplatin plus
gemcitabine for first-line treatment of Asian patients with advanced non-small-cell lung cancer

151
harbouring EGFR mutations (LUX-Lung 6): an open-label, randomised phase 3 trial. Lancet
Oncology 2014;15(2):213-22. http://dx.doi.org/10.1016/S1470-2045(13)70604-1
27. Park K, Tan E-H, O'Byrne K, Zhang L, Boyer M, Mok T, et al. Afatinib versus gefitinib
as first-line treatment of patients with EGFR mutation-positive non-small-cell lung cancer (LUX-
Lung 7): a phase 2B, open-label, randomised controlled trial. Lancet Oncology 2016;17(5):577-
89. http://dx.doi.org/10.1016/S1470-2045(16)30033-X
28. Paz-Ares L, Tan EH, O'Byrne K, Zhang L, Hirsh V, Boyer M, et al. Afatinib versus
gefitinib in patients with EGFR mutation-positive advanced non-small-cell lung cancer: overall
survival data from the phase IIb LUX-Lung 7 trial. Ann Oncol 2017;28(2):270-7.
http://dx.doi.org/10.1093/annonc/mdw611
29. Mok TS, Cheng Y, Zhou X, Lee KH, Nakagawa K, Niho S, et al. Improvement in
Overall Survival in a Randomized Study That Compared Dacomitinib With Gefitinib in Patients
With Advanced Non-Small-Cell Lung Cancer and EGFR-Activating Mutations. J Clin Oncol
2018;36(22):2244-50. http://dx.doi.org/10.1200/jco.2018.78.7994
30. Nakamura H, Ando K, Shinmyo T, Morita K, Mochizuki A, Kurimoto N, et al. Female
gender is an independent prognostic factor in non-small-cell lung cancer: a meta-analysis. Ann
Thorac Cardiovasc Surg 2011;17(5):469-80.
31. Hsu LH, Chu NM, Liu CC, Tsai SY, You DL, Ko JS, et al. Sex-associated differences in
non-small cell lung cancer in the new era: is gender an independent prognostic factor? Lung
Cancer 2009;66(2):262-7. http://dx.doi.org/10.1016/j.lungcan.2009.01.020
32. Tseng CH, Chiang CJ, Tseng JS, Yang TY, Hsu KH, Chen KC, et al. EGFR mutation,
smoking, and gender in advanced lung adenocarcinoma. Oncotarget 2017;8(58):98384-93.
http://dx.doi.org/10.18632/oncotarget.21842
33. Kawaguchi T, Takada M, Kubo A, Matsumura A, Fukai S, Tamura A, et al. Performance
status and smoking status are independent favorable prognostic factors for survival in non-small
cell lung cancer: a comprehensive analysis of 26,957 patients with NSCLC. J Thorac Oncol
2010;5(5):620-30. http://dx.doi.org/10.1097/JTO.0b013e3181d2dcd9
34. Pinto JA, Vallejos CS, Raez LE, Mas LA, Ruiz R, Torres-Roman JS, et al. Gender and
outcomes in non-small cell lung cancer: an old prognostic variable comes back for targeted
therapy and immunotherapy? ESMO Open 2018;3(3):e000344.
http://dx.doi.org/10.1136/esmoopen-2018-000344

152
35. Arslan D, Bozcuk H, Gunduz S, Tural D, Tattli AM, Uysal M, et al. Survival results and
prognostic factors in T4 N0-3 non-small cell lung cancer patients according to the AJCC 7th
edition staging system. Asian Pac J Cancer Prev 2014;15(6):2465-72.
36. Janne PA, Ou SH, Kim DW, Oxnard GR, Martins R, Kris MG, et al. Dacomitinib as first-
line treatment in patients with clinically or molecularly selected advanced non-small-cell lung
cancer: a multicentre, open-label, phase 2 trial. Lancet Oncol 2014;15(13):1433-41.
http://dx.doi.org/10.1016/s1470-2045(14)70461-9
37. Ramalingam SS, Janne PA, Mok T, O'Byrne K, Boyer MJ, Von Pawel J, et al.
Dacomitinib versus erlotinib in patients with advanced-stage, previously treated non-small-cell
lung cancer (ARCHER 1009): a randomised, double-blind, phase 3 trial. Lancet Oncol
2014;15(12):1369-78. http://dx.doi.org/10.1016/s1470-2045(14)70452-8
38. Ellis PM, Shepherd FA, Millward M, Perrone F, Seymour L, Liu G, et al. Dacomitinib
compared with placebo in pretreated patients with advanced or metastatic non-small-cell lung
cancer (NCIC CTG BR.26): a double-blind, randomised, phase 3 trial. Lancet Oncol
2014;15(12):1379-88. http://dx.doi.org/10.1016/s1470-2045(14)70472-3
39. Ramalingam SS, Blackhall F, Krzakowski M, Barrios CH, Park K, Bover I, et al.
Randomized phase II study of dacomitinib (PF-00299804), an irreversible pan-human epidermal
growth factor receptor inhibitor, versus erlotinib in patients with advanced non-small-cell lung
cancer. J Clin Oncol 2012;30(27):3337-44. http://dx.doi.org/10.1200/jco.2011.40.9433
40. Reckamp KL, Giaccone G, Camidge DR, Gadgeel SM, Khuri FR, Engelman JA, et al. A
phase 2 trial of dacomitinib (PF-00299804), an oral, irreversible pan-HER (human epidermal
growth factor receptor) inhibitor, in patients with advanced non-small cell lung cancer after
failure of prior chemotherapy and erlotinib. Cancer 2014;120(8):1145-54.
http://dx.doi.org/10.1002/cncr.28561
41. Jansen JP. Network meta-analysis of survival data with fractional polynomials. BMC
medical research methodology 2011;11(1):61.
42. Bucher HC, Guyatt GH, Griffith LE, Walter SD. The results of direct and indirect
treatment comparisons in meta-analysis of randomized controlled trials. J Clin Epidemiol
1997;50(6):683-91.
43. National Institute for Health and Care Excellence. Afatinib for treating epidermal growth
factor receptor mutation-positive locally advanced or metastatic non-small-cell lung cancer:
Technology appraisal guidance [TA310]. 2014. URL: https://www.nice.org.uk/guidance/ta310
(Accessed 10 January 2019).

153
44. Chouaid C, Luciani L, LeLay K, Do P, Bennouna J, Perol M, et al. Cost-Effectiveness
Analysis of Afatinib versus Gefitinib for First-Line Treatment of Advanced EGFR-Mutated
Advanced Non-Small Cell Lung Cancers. J Thorac Oncol 2017;12(10):1496-502.
http://dx.doi.org/10.1016/j.jtho.2017.07.013
45. National Institute for Health and Care Excellence. Erlotinib for the first line treatment of
EGFR-TK mutation positive non-small-cell lung cancer: Technology appraisal guidance
[TA258]. 2012. URL: https://www.nice.org.uk/guidance/ta258 (Accessed 10 January 2019).
46. National Institute for Health and Care Excellence. Gefitinib for the first-line treatment of
locally advanced or metastatic non-small-cell lung cancer: Technology appraisal guidance
[TA192]. 2010. URL: https://www.nice.org.uk/guidance/ta192 (Accessed 10 January 2019).
47. National Institute for Health and Care Excellence. Crizotinib for treating ROS1-positive
advanced non-small-cell lung cancer: Committee Papers [TA529]. 2018. URL:
https://www.nice.org.uk/guidance/ta529 (Accessed 10 January 2019).
48. Ayiku L, Levay P, Hudson T, Craven J, Barrett E, Finnegan A, et al. The medline UK
filter: development and validation of a geographic search filter to retrieve research about the UK
from OVID medline. Health Info Libr J 2017; 10.1111/hir.12187.
http://dx.doi.org/10.1111/hir.12187
49. Talbot T, Dangoor A, Shah R, Naik J, Talbot D, Lester JF, et al. The burden of
neutropenic sepsis in patients with advanced non-small cell lung cancer treated with single-agent
docetaxel: A retrospective study. Lung Cancer 2017;113:115-20.
http://dx.doi.org/10.1016/j.lungcan.2017.09.014
50. Nafees B, Stafford M, Gavriel S, Bhalla S, Watkins J. Health state utilities for non small
cell lung cancer. Health Qual Life Outcomes 2008;6:84. http://dx.doi.org/10.1186/1477-7525-6-
84
51. Dolan P. Modeling valuations for EuroQol health states. Med Care 1997;35(11):1095-
108.
52. Huang M, Lou Y, Pellissier J, Burke T, Liu FX, Xu R, et al. Cost Effectiveness of
Pembrolizumab vs. Standard-of-Care Chemotherapy as First-Line Treatment for Metastatic
NSCLC that Expresses High Levels of PD-L1 in the United States. Pharmacoeconomics
2017;35(8):831-44. http://dx.doi.org/10.1007/s40273-017-0527-z
53. National Institute for Health and Care Excellence. Nivolumab for previously treated
squamous non-small-cell lung cancer: Committee Papers [TA483]. 2017. URL:
https://www.nice.org.uk/guidance/ta483 (Accessed 10 January 2019).

154
54. National Institute for Health and Care Excellence. Nivolumab for previously treated non-
squamous non-small-cell lung cancer: Committee Papers [TA484]. 2017. URL:
https://www.nice.org.uk/guidance/ta484 (Accessed 10 January 2019).
55. National Institute for Health and Care Excellence. Atezolizumab for treating locally
advanced or metastatic non-small-cell lung cancer after chemotherapy: Committee Papers
[TA520]. 2018. URL: https://www.nice.org.uk/guidance/ta520 (Accessed 10 January 2019).
56. National Institute for Health and Care Excellence (NICE). Guide to the methods of
technology appraisal 2013. URL: https://www.nice.org.uk/process/pmg9/chapter/the-reference-
case (Accessed 25 October, 2018).
57. Yoshioka H, Mitsudomi T, Morita S, Yatabe Y, Negoro S, Okamoto I, et al. Final overall
survival results of WJTOG 3405, a randomized phase 3 trial comparing gefitinib (G) with
cisplatin plus docetaxel (CD) as the first-line treatment for patients with non-small cell lung
cancer (NSCLC) harboring mutations of the epidermal growth factor receptor (EGFR). Journal of
Clinical Oncology 2014;32(15 suppl):8117. http://dx.doi.org/10.1200/jco.2014.32.15_suppl.8117
58. Lin JJ, Cardarella S, Lydon CA, Dahlberg SE, Jackman DM, Janne PA, et al. Five-Year
Survival in EGFR-Mutant Metastatic Lung Adenocarcinoma Treated with EGFR-TKIs. J Thorac
Oncol 2016;11(4):556-65. http://dx.doi.org/10.1016/j.jtho.2015.12.103
59. Latimer N. NICE DSU Technical Support Document 14: Survival analysis for economic
evaluations alongside clinical trials - extrapolation with patient-level data 2011. URL:
http://nicedsu.org.uk/wp-content/uploads/2016/03/NICE-DSU-TSD-Survival-analysis.updated-
March-2013.v2.pdf (Accessed 25 October, 2018).
60. Royston P, Sauerbrei W. Two techniques for investigating interactions between treatment
and continuous covariates in clinical trials. Stata Journal 2009;9(2):230-51.
61. National Institute for Health and Care Excellence. Alectinib for untreated ALK-positive
advanced non-small-cell lung cancer; Committee Papers [TA536]. 2018. URL:
https://www.nice.org.uk/guidance/ta536 (Accessed 10 February 2019).
62. National Institute for Health and Care Excellence. Crizotinib for untreated anaplastic
lymphoma kinase-positive advanced non-small-cell lung cancer: Committee Papers [TA406].
2016. URL: https://www.nice.org.uk/guidance/ta406 (Accessed 10 February 2019).
63. National Institute for Health and Care Excellence. Ceritinib for previously treated
anaplastic lymphoma kinase positive non-small-cell lung cancer: Committee Papers [TA395].
2016. URL: https://www.nice.org.uk/guidance/ta395 (Accessed 10 February 2019).

155
64. National life tables: UK. Office for National Statistics; 2018. URL:
https://www.ons.gov.uk/peoplepopulationandcommunity/birthsdeathsandmarriages/lifeexpectanci
es/datasets/nationallifetablesunitedkingdomreferencetables (Accessed 10 Feb 2019).
65. Nafees B, Lloyd AJ, Dewilde S, Rajan N, Lorenzo M. Health state utilities in non-small
cell lung cancer: An international study. Asia Pac J Clin Oncol 2017;13(5):e195-e203.
http://dx.doi.org/10.1111/ajco.12477
66. Brown J, Cook K, Adamski K, Lau J, Bargo D, Breen S, et al. Utility values associated
with advanced or metastatic non-small cell lung cancer: data needs for economic modeling.
Expert Rev Pharmacoecon Outcomes Res 2017;17(2):153-64.
http://dx.doi.org/10.1080/14737167.2017.1311210
67. EQ-5D-3L: Health Questionnaire: English version for the UK. Rotterdam, The
Netherlands: EuroQol URL: https://euroqol.org/wp-
content/uploads/2016/10/Sample_UK__English__EQ-5D-
3L_Paper_Self_complete_v1.0__ID_23963.pdf (Accessed 7 February 2019).
68. Curtis LA, Burns A. Unit Costs of Health and Social Care 2017. Canterbury, UK:
Personal Social Services Research Unit, University of Kent; 2017. URL:
https://doi.org/10.22024/UniKent/01.02/65559 (Accessed 3 February 2019).
69. NHS Improvement. 2016/17 reference cost data. 2017. URL:
https://improvement.nhs.uk/documents/3479/201617_ReferenceCostData.zip (Accessed 25
October 2018).
70. Brown T, Pilkington G, Bagust A, Boland A, Oyee J, Tudur-Smith C, et al. Clinical
effectiveness and cost-effectiveness of first-line chemotherapy for adult patients with locally
advanced or metastatic non-small cell lung cancer: a systematic review and economic evaluation.
Health Technol Assess 2013;17(31):1-278. http://dx.doi.org/10.3310/hta17310
SUPERSEDED See erratum

156
10 APPENDICES
10.1.1 ERG’s individual parameter changes.
To determine the impact of the ERG’s preferred assumptions on the company’s results, the ERG
modified the latest version of the company’s economic model (submitted as part of the company’s
response to ERG’s request for clarifications, in February 2019) by implementing the following
amendments:
For PFS, use the log-normal parametric curve for gefitinib;
For PFS, use the log-normal parametric curve for gefitinib with the results from the FP
NMA to derive the survival for the other comparators (p1= 0.5, p2=1). Assume afatinib
PFS assumed to be equal to the mean PFS of dacomitinib and gefitinib from 36 months
onwards;
For OS, use the log-logistic parametric curve for gefitinib;
For OS, use the log-logistic parametric curve for gefitinib with the results from the FP
NMA, and assume equal efficacy, on the hazard scale, from 36 months onwards;
Include disutilities associated with adverse events;
Use the post-progression utility value from the ARCHER 1050 trial;
Including age-related disutilites from the study published by Ara and colleagues4;
Correction to how the PAS for gefitinib had been applied in the model;
The remainder of this section presents the obtained results for: (i) the comparison between the PAS
for dacomitinib versus the company assumed PAS for the comparators (hereafter comparison (i)),
and (ii) the comparison between dacomitinib versus comparators, all at list prices (hereafter
comparison (ii)).
PFS, log-normal parametric curve for PFS data for gefitinib
In this exploratory analysis, we fitted the log-normal parametric curve to the observed progression-
free survival data for gefitinib, then exptrapolated beyond the trial time horizon. Other PFS curves

157
for dacomitinib, afatinib and erlotinib were generated by applying the time-varying hazard ratios
from the FP NMA to the log-normal gefitinib extrapolation. Appendix Table 1 and Appendix Table
2 present the results for this change. For comparison (i), the ICER for dacomitinib versus gefitinib
(the non-dominated treatment) is approximately ******* per QALY. For comparison (ii), the ICER
for dacomitinib versus erlotinib is approximately ******* per QALY.
Appendix Table 1. Exploratory results, fitting the log-normal parametric curve to PFS data for gefitinib (dacomitinib PAS vs. comparators assumed PAS)
Treatment Expected
mean costs (£)
Incremental costs (£)
Expected mean
QALY
Incremental QALY
ICER (£)
Gefitinib ******* * **** * *
Erlotinib ******* ****** **** **** *********
Afatinib ******* ****** **** **** ********************
Dacomitinib ******* ******* **** **** ******* ICER, incremental cost-effectiveness ratio; QALY, quality adjusted life years gained
Appendix Table 2. Exploratory results, fitting the log-normal parametric curve to PFS data for gefitinib (all treatments at least prices).
Treatment Expected
mean costs (£)
Incremental costs (£)
Expected mean
QALY
Incremental QALY
ICER (£)
Erlotinib ******* * **** * *
Gefitinib ******* ****** **** **** *********
Afatinib ******* ******* **** **** ********************
Dacomitinib ******* ******* **** **** ******* ICER, incremental cost-effectiveness ratio; QALY, quality adjusted life years gained
PFS, log-normal parametric curve for gefitinib and assumed afatinib PFS to be equal to the
mean PFS of dacomitinib and gefitinib from 36 months onwards
The results for these analyses are presented in Appendix Table 3 and Appendix Table 4. Assuming
that the PFS for afatinib is equal to the mean PFS for dacomitinib and gefitinib from 36 months
onwards resulted in an ICER for dacomitinib versus gefitinib of about ******* per QALY for

158
comparison (i), and an ICER for dacomitinib versus erlotinib of approximately ******* per QALY
for comparison (ii).
Appendix Table 3. Exploratory results, PFS for afatinib is assumed to be the mean survival for gefitinib and dacomitinib from 36 months onwards (dacomitinib PAS vs. comparators assumed PAS)
Treatment Expected
mean costs (£)
Incremental costs (£)
Expected mean
QALY
Incremental QALY
ICER (£)
Gefitinib ******* * **** * *
Erlotinib ******* ****** **** **** *********
Afatinib ******* ****** **** **** ********************
Dacomitinib ******* ******* **** **** ******* ICER, incremental cost-effectiveness ratio; QALY, quality adjusted life years gained
Appendix Table 4. Exploratory results, PFS for afatinib is assumed to be the mean survival for gefitinib and dacomitinib from 36 months onwards (all treatments at least prices).
Treatment Expected
mean costs (£)
Incremental costs (£)
Expected mean
QALY
Incremental QALY
ICER (£)
Erlotinib ******* * **** * *
Gefitinib ******* ****** **** **** *********
Afatinib ******* ******* **** **** ********************
Dacomitinib ******* ******* **** **** *******
ICER, incremental cost-effectiveness ratio; QALY, quality adjusted life years gained
Overall survival, log-logistic curve to OS data for gefitinib
We fitted the log-logistic parametric curve to the observed OS data for gefitinib, then extrapolated
beyond the trial time horizon. This change resulted in a slight increase to the expected mean costs
and mean QALYs across all comparators for comparison (i). The ICERs for comparison (i) and
comparison (ii) can be seen in Appendix Table 5 and Appendix Table 6, respectively.

159
Appendix Table 5. Exploratory results, fitting the log-logistic parametric curve to OS data for gefitinib (dacomitinib PAS vs. comparators assumed PAS)
Treatment Expected
mean costs (£)
Incremental costs (£)
Expected mean
QALY
Incremental QALY
ICER (£)
Gefitinib ******* * **** * *
Erlotinib ******* *** **** **** *********
Afatinib ******* ****** **** **** ********************
Dacomitinib ******* ******* **** **** ******* ICER, incremental cost-effectiveness ratio; QALY, quality adjusted life years gained
Appendix Table 6. Exploratory results, fitting the log-logistic parametric curve to OS data for gefitinib (all treatments at list prices)
Treatment Expected
mean costs (£)
Incremental costs (£)
Expected mean
QALY
Incremental QALY
ICER (£)
Erlotinib ******* * **** * *
Gefitinib ******* ****** **** **** *********
Afatinib ******* ******* **** **** ********************
Dacomitinib ******* ******* **** **** *******
ICER, incremental cost-effectiveness ratio; QALY, quality adjusted life years gained
OS, log-logistic curve to OS data for gefitinib and assumed equal efficacy, on the hazard
scale, from 36 months onwards
Here, we fitted the log-logistic parametric curve to the OS data for gefitinib and assumed a hazard
ratio of 1 is applied from 36 months onwards. Applying a HR=1 results in reduction to the post-
progression survival and thus post-progression QALYs (results not shown). For comparison (i)
afatininb is associated with an approximate ICER of ******* per QALY as compared to gefitinib.
The ICER for dacomintinib compared to afatinib is approximately ******* per QALY. Under these
assumptions resulted in an increase to the ICERs. (see Appendix Table 7). For comparison (ii), the
ICER for afatinib (versus gefinitib) and dacomitinib (versus afatinib) are over ******* and
******** per QALY, respectively (Appendix Table 8).
SUPERSEDED See erratum

160
Appendix Table 7. Exploratory results, log-logistic curve for OS gefitinib and HR of 1 after 36 months (dacomitinib PAS vs. comparators assumed PAS)
Treatment Expected
mean costs (£)
Incremental costs (£)
Expected mean
QALY
Incremental QALY
ICER (£)
Gefitinib ******* * **** * *
Erlotinib ******* *** **** **** *********
Afatinib ******* ****** **** **** *******
Dacomitinib ******* ****** **** **** ******* ICER, incremental cost-effectiveness ratio; QALY, quality adjusted life years gained
Appendix Table 8. Exploratory results, log-logistic curve for OS gefitinib and HR of 1 after 36 months (all treatments at list prices)
Treatment Expected
mean costs (£)
Incremental costs (£)
Expected mean
QALY
Incremental QALY
ICER (£)
Erlotinib ******* * **** * *
Gefitinib ******* ****** **** **** *********
Afatinib ******* ******* **** **** *******
Dacomitinib ******* ******* **** **** ********
ICER, incremental cost-effectiveness ratio; QALY, quality adjusted life years gained
Disutilities associated with adverse events
This analysis is based on including disutilities associated with adverse events. The ERG considers
that these experiences by the participants are not adequately captured in the company’s base case
analysis. The results are presented in Appendix Table 9 and Appendix Table 10 for comparisons
(i) and (ii) respectively.

161
Appendix Table 9. Exploratory results, including disutilities associated with adverse events (dacomitinib PAS vs. comparators assumed PAS)
Treatment Expected mean
costs (£)
Incremental costs (£)
Expected mean
QALY
Incremental QALY
ICER (£)
Gefitinib ******* * **** * *
Erlotinib ******* *** **** **** *********
Afatinib ******* ****** **** **** ********************
Dacomitinib ******* ******* **** **** *******
ICER, incremental cost-effectiveness ratio; QALY, quality adjusted life years gained
Appendix Table 10. Exploratory results, including disutilities associated with adverse events (all treatments at list prices)
Treatment Expected
mean costs (£)
Incremental costs (£)
Expected mean
QALY
Incremental QALY
ICER (£)
Erlotinib ******* * **** * *
Gefitinib ******* ****** **** **** *********
Afatinib ******* ******* **** **** ********************
Dacomitinib ******* ******* **** **** *******
ICER, incremental cost-effectiveness ratio; QALY, quality adjusted life years gained
Post-progression utility value from the ARCHER 1050 trial
In the original submission, the company assigned a utility value of 0.64 (SE:0.03) obtained from
the Labbé and colleagues2 for people in the post-progression health state. In response to our
clarification question, the company provided utility values based on EQ-5D data collected at the
end-of-treatment/post-treatment follow-up visits, by trial treatment arm. From the mean utility
values submitted we derived a weighted-mean value of **** and, in this analysis we assigned this
to people in the post-progression health-state. The results are presented below (Appendix Table 11
and Appendix Table 12 ). The impact of this change resulted in an increase to the expected mean
QALYs across all comparators, while the expected mean costs remained fixed. For comparison (i),
the ICER for dacomitinib (versus gefitinib) is approximately ******* per QALY. For comparison
(ii), the ICER for dacomitinib (versus erlotinib) is over ******* per additional QALY.

162
Appendix Table 11. Exploratory results, using the post-progression utility value from ARCHER 1050 trial (dacomitinib PAS vs. comparators assumed PAS)
Treatment Expected mean
costs (£)
Incremental costs (£)
Expected mean
QALY
Incremental QALY
ICER (£)
Gefitinib ******* * **** * *
Erlotinib ******* *** **** **** *********
Afatinib ******* ****** **** **** ********************
Dacomitinib ******* ******* **** **** *******
ICER, incremental cost-effectiveness ratio; QALY, quality adjusted life years gained
Appendix Table 12. Exploratory results, using the post-progression utility value from ARCHER 1050 trial (all treatments at list prices)
Treatment Expected mean
costs (£)
Incremental costs (£)
Expected mean
QALY
Incremental QALY
ICER (£)
Erlotinib ******* * **** * *
Gefitinib ******* ****** **** **** *********
Afatinib ******* ******* **** **** ********************
Dacomitinib ******* ******* **** **** *******
ICER, incremental cost-effectiveness ratio; QALY, quality adjusted life years gained
Age-related disutilities
In this analysis, we have included age-related disutilities which takes into consideration the effect
of ageing on a person’s health-related quality of life. These age-related disutilities have been
derived by an algorithm, which estimates the general population utility scores as a function of age
and gender.4 Results for comparisons (i) and (ii) appear in Appendix Table 13 and Appendix Table
14 .

163
Appendix Table 13. Exploratory results, including age-related disutilities in the model (dacomitinib PAS vs. comparators assumed PAS)
Treatment Expected mean
costs (£)
Incremental costs (£)
Expected mean
QALY
Incremental QALY
ICER (£)
Gefitinib ******* * **** * *
Erlotinib ******* *** **** **** *********
Afatinib ******* ****** **** **** ********************
Dacomitinib ******* ******* **** **** *******
ICER, incremental cost-effectiveness ratio; QALY, quality adjusted life years gained
Appendix Table 14. Exploratory results, including age-related disutilities in the model (all treatments at list prices)
Treatment Expected
mean costs (£)
Incremental costs (£)
Expected mean
QALY
Incremental QALY
ICER (£)
Erlotinib ******* * **** * *
Gefitinib ******* ****** **** **** *********
Afatinib ******* ******* **** **** ********************
Dacomitinib ******* ******* **** **** *******
ICER, incremental cost-effectiveness ratio; QALY, quality adjusted life years gained
Correction to how the PAS for gefitinib had been applied in the model
This analysis corrects the application of the PAS arrangement for gefitinib, by applying the charge
incurred on receipt of the fourth packet of treatment. The ERG received confirmation from the
manufacturer via NICE. As expected this change resulted in a derease to the expected mean costs
for gefitinib, and expected to yield **** QALYs. For comparison (i), the resulting ICER for
dacomitinib combared to gefitinib is approximately ******* per QALY. The particular change in
PAS is not relevant to the comparision (ii) (i.e. all treatments at least prices), so no results for this
comparison are reported below.

164
Appendix Table 15. Exploratory results, correcting the PAS arrangement applied to gefitinib (dacomitinib PAS vs. comparators assumed PAS)
Treatment Expected mean
costs (£)
Incremental costs (£)
Expected mean
QALY
Incremental QALY
ICER (£)
Gefitinib ******* * **** * *
Erlotinib ******* **** **** **** *********
Afatinib ******* ****** **** **** ********************
Dacomitinib ******* ******* **** **** *******
ICER, incremental cost-effectiveness ratio; QALY, quality adjusted life years gained

165
10.1.2 Evidence on the equivalence of erlotinib and gefitinib
Appendix Table 16. SR/MAs on the equivalence of erlotinib and gefitinib
Haspinger 2015 Lee 2014 Liang 2014 Haaland 2014 Yang 2017 SR design Indirect comparison using
RCTs Indirect comparison using RCTs
Indirect comparison using RCTs
Indirect comparison using RCTs
Direct comparison including non-randomised data
Search PubMed, Cancer-Lit, Embase-databases and Cochrane-Library; The proceedings of the 2008–2014 conferences of the American Society of Clinical Oncology (ASCO), European Society of Medical Oncology (ESMO) and International Association for the Study of Lung Cancer (IASLC), World Conference of Lung Cancer; unpublished RCTs were considered for inclusion.
PubMed, ASCO and ESMO congress databases
PubMed, EMBASE and the Central Registry of Controlled Trials of the Cochrane Library; abstract books and presentations of major recent meetings of American Society of Clinical Oncology (ASCO), European Society for Medical Oncology (ESMO) and World Conference on Lung Cancer in 2008–2012; reference lists
Medline (PubMed); American Society of Clinical Oncology Meeting Library, European Cancer Congress 2013, Chinese Clinical Trial Registry, clinicaltrials.gov, EU Clinical Trials Register, and UMIN Clinical Trials Registry; limited to clinical trials published within the last 5 years
PubMed, EMBASE, the Cochrane Central Register of Controlled Trials, Chinese Biomedical Literature Database, and China National Knowledge Infrastructure from inception through 17 December 2016, limited to “human studies” where possible, with no restrictions placed on the time, language and format (abstract or full text) of publication; abstracts of 40 American Society of Clinical Oncology and European Society of Medical Oncology meetings, including their annual meetings and the meetings related to lung cancer, two major trial registration websites

166
(www.clinicaltrials.gov/ and www.who.int/ictrp/); reference lists
Inclusion Nine RCTs of gefitinib, erlotinib, afatinib
Four Asian randomised controlled phase-III trials of erlotinib and gefitinib
Twelve phase III RCTs that investigated EGFR-TKIs (erlotinib, gefitinib, afatinib and icotinib)
Eight RCTs of gefitinib, erlotinib, afatinib
Eight randomized trials and 82 cohort studies with a total of 17,621 patients assessing gefitinib, erlotinib and afatinib
Treatment line
First line First line First or second line First line 14 studies were conducted in first-line settings, 21 in ≥second-line settings, and the others in both or did not specify the line of treatment
Outcome Overall response, safety Progression-free survival
Objective response rate (ORR), progression free survival (PFS), overall survival (OS)
Progression-free survival, overall response rate and disease control rate
Progression-free survival, overall survival, overall response rate, disease control rate
Conclusion All treatments had similar efficacy but they differ for toxicities; the main toxicity of erlotinib was diarrhoea, gefitinib gave hypertransaminasemia and afatinib skin toxicity,
Difference in favour of erlotinib
No statistically significant differences in efficacy
Differences among gefitinib, erlotinib, and afatinib were not statistically significant
All three drugs had similar effectiveness. Less dose reduction (RR, 0.34; 95% CI, 0.21 to 0.54, p<0.0001) and grade 3/4 adverse events (RR, 0.78; 95% CI 0.65 to 0.94,

167
mucositis and diarrhoea. Treatment discontinuation was more frequent in the afatinib group, but comparable for erlotinib and gefitinib.
p=0.01) with gefitinib than with erlotinib. Gefitinib was associated with more grade 3/4 liver dysfunction (RR, 2.88; 95% CI, 1.56 to 5.28, p=0.0007), but fewer grade 3/4 rash (RR, 0.43; 95% CI, 0.27 to 0.70, p=0.0005), any-grade diarrhoea (RR, 0.83; 95% CI, 0.75 to 0.93, p=0.0007), any-grade nausea/vomiting (RR, 0.60; 95% CI, 0.43 to 0.85, p=0.003), and grade 3/4 paronychia (RR, 0.19; 95% CI, 0.04 to 0.84, p=0.03) compared with erlotinib. Although the majority of included studies were observational and potential imbalance in patient characteristics between gefitinib and erlotinib groups could be of concern, sensitivity analyses that included the studies with low risk of bias only showed that the summary estimates were robust and very close to those

168
from the overall meta-analyses.
Sponsor/ conflict of interest
All authors of this manuscript declare no potential conflicts of interest.
Funded by Roche. Prof Author has received educational grant, research contracts, and donations from pharmaceutical companies including AstraZeneca, Boehringer Ingelheim, Eisai, Janssen, Pfizer, Novartis, and Roche.
The authors have no support or funding to report. The authors have declared that no competing interests exist.
Funding not stated. Dr. de Castro has received honoraria from Astra Zeneca, Boehringer Ingelheim, and Roche. Dr. Lopes has received honoraria and research funds from Astra Zeneca, Eli Lilly, Roche, and Sanofi. The remaining authors declare no conflict of interest.
Grant sponsors: Faculty Postdoctoral Fellowship Scheme from Faculty of Medicine of the Chinese University of Hong Kong. The authors declare no conflict of interest.
Included studies
IPASS Mok, 2009 Gefitinib WJTOG3405 Mitsudomi, 2010 Gefitinib NEJ002 Maemondo, 2010 Gefitinib First-SIGNAL Han, 2012 Gefitinib TORCH Gridelli, 2012 Erlotinib OPTIMAL Zhou, 2011 Erlotinib
IPASS Gefitinib WJTOG Gefitinib OPTIMAL Erlotinib NEJGSG Gefitinib
IPASS Gefitinib First-SIGNAL Gefitinib NEJ0027 Gefitinib WJTOG 3405 Gefitinib INTEREST* Gefitinib V 15–32* Gefitinib
IPASS Gefitinib West Japan Gefitinib North-East Japan Gefitinib First-SIGNAL Gefitinib OPTIMAL Erlotinib EURTAC Erlotinib LUX-Lung 3 Afatinib LUX-Lung 6 Afatinib
8 RCTs (n/group); % ≥2nd line: Jin Y 2016 China G vs. E (50/50); NR Kim ST 2012 Korea G vs. E (48/48); 100% ≥2nd line Lin QX 2016 China G vs. E (25/25); NR Park K 2016 Korea G vs. A (159/160); 0% ≥2nd line

169
EURTAC Rosell, 2011 Erlotinib LUX-Lung 3 Sequist, 2012 Afatinib LUX-Lung 6 Wu, 2013 Afatinib
OPTIMAL Erlotinib EUTRAC Erlotinib TITAN1* Erlotinib LUX-lung 3 Afatinib LUX-lung 6 Afatinib ICOGEN* Icotinib *=Previously treated
Soria JC 2015 Global E vs. A (397/398); 100% ≥2nd line Urata Y 2016 Japan G vs. E (279/280); 100% ≥2nd line Xie YL 2015 China G vs. E (27/23); 0% ≥2nd line Yang JJ 2015 China G vs. E (128/128); 36% ≥2nd line plus 80 retrospective cohort studies and 2 prospective cohort studies

170
10.1.3 ERG’s changes in the economic model.
Appendix Table 17. Description of changes made in the economic model for the purposes of ERG’s analyses.
Description of changes to the economic model for ERG’s base-case and scenario analyses
Implementation of the change in the model
ERG’s individual parameter changes to the company’s base-case Change PFS distribution for gefitinib to log-normal
“Clinical Inputs” tab, change cell F48 to ‘Log-normal’
Change afatinib PFS extrapolation to be the mean of dacomitinib and gefitinib from 36 months
1. Ensure log-normal PFS distribution is chosen, alongside PFS FP model of P1=0.5 and P2=1.
2. “Survival Curves” tab. Copy cells J18:J214. Paste as values back into J18:J214.
3. Replace cell J58 with ‘=AVERAGE(H58, I58)’.
4. Drag this formula down for the rest of column J, until cell J214
Change OS distribution for gefitinib to log-logistic
“Clinical Inputs” tab, change cell F19 to ‘Log-logistic’
Change OS distribution for gefitinib to log-logistic and OS HR =1 from 36 months
“Clinical Inputs” tab, change cell F19 to ‘Log-logistic’ and “Clinical Inputs” tab, change cell J18 to ‘Yes’
Add adverse event disutility “Utility” tab, change cell E20 to ‘Yes’ Change post-progression utility to reflect value from ARCHER 1050
“Utility” tab, change cell E12 to ‘0.72’
Add age-related disutility “Utility” tab, please see ERG’s model to see changes. The implementation is completed with the adjustment to formulae in “Model Engine” tab: AA20 change to ‘=(INDEX(i.UtilityPFS.Inputs,macro.IncludeComp)+Utility!H40)*T20’ and drag down for the rest of the column AA. AB20 change to =((i.UtilityPPS.Inputs)+Utility!H40)*U20 And drag down for the rest of column AB.
Correct the implementation of Gefitinib PAS
“Model Engine” tab. In cell AL20, change formula to: ‘=IF(AND(macro.IncludeComp=2,'Medical Costs_Drugs'!$J$13="Yes"),IF(C20=3,12200,0),ME.TxCost_UnitCost)*J20’ Drag this formula down for the rest of column AL
ERG’s preferred assumptions (all changes made simultaneously)Change afatinib PFS extrapolation to be the mean of dacomitinib and gefitinib from 36 months
1. Ensure log-normal PFS distribution is chosen, alongside PFS FP model of P1=0.5 and P2=1.
2. “Survival Curves” tab. Copy cells J18:J214. Paste as values back into J18:J214.
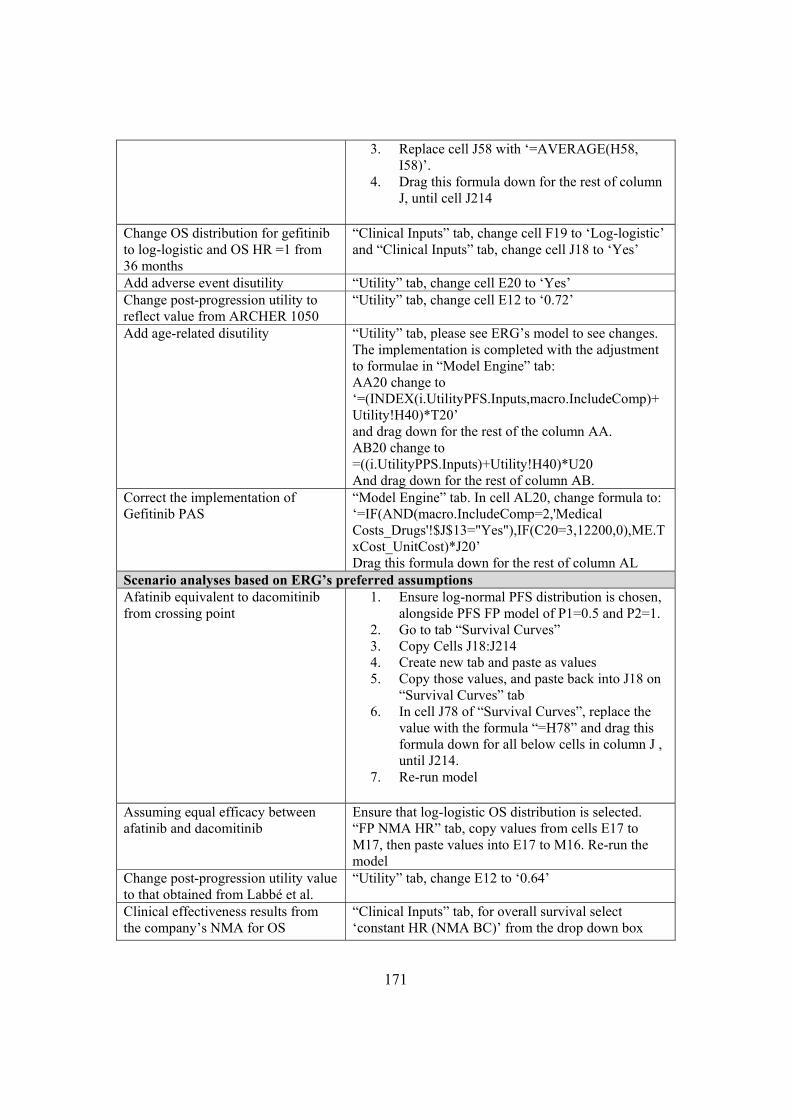
171
3. Replace cell J58 with ‘=AVERAGE(H58, I58)’.
4. Drag this formula down for the rest of column J, until cell J214
Change OS distribution for gefitinib to log-logistic and OS HR =1 from 36 months
“Clinical Inputs” tab, change cell F19 to ‘Log-logistic’ and “Clinical Inputs” tab, change cell J18 to ‘Yes’
Add adverse event disutility “Utility” tab, change cell E20 to ‘Yes’ Change post-progression utility to reflect value from ARCHER 1050
“Utility” tab, change cell E12 to ‘0.72’
Add age-related disutility “Utility” tab, please see ERG’s model to see changes. The implementation is completed with the adjustment to formulae in “Model Engine” tab: AA20 change to ‘=(INDEX(i.UtilityPFS.Inputs,macro.IncludeComp)+Utility!H40)*T20’ and drag down for the rest of the column AA. AB20 change to =((i.UtilityPPS.Inputs)+Utility!H40)*U20 And drag down for the rest of column AB.
Correct the implementation of Gefitinib PAS
“Model Engine” tab. In cell AL20, change formula to: ‘=IF(AND(macro.IncludeComp=2,'Medical Costs_Drugs'!$J$13="Yes"),IF(C20=3,12200,0),ME.TxCost_UnitCost)*J20’ Drag this formula down for the rest of column AL
Scenario analyses based on ERG’s preferred assumptions Afatinib equivalent to dacomitinib from crossing point
1. Ensure log-normal PFS distribution is chosen, alongside PFS FP model of P1=0.5 and P2=1.
2. Go to tab “Survival Curves” 3. Copy Cells J18:J214 4. Create new tab and paste as values 5. Copy those values, and paste back into J18 on
“Survival Curves” tab 6. In cell J78 of “Survival Curves”, replace the
value with the formula “=H78” and drag this formula down for all below cells in column J , until J214.
7. Re-run model
Assuming equal efficacy between afatinib and dacomitinib
Ensure that log-logistic OS distribution is selected. “FP NMA HR” tab, copy values from cells E17 to M17, then paste values into E17 to M16. Re-run the model
Change post-progression utility value to that obtained from Labbé et al.
“Utility” tab, change E12 to ‘0.64’
Clinical effectiveness results from the company’s NMA for OS
“Clinical Inputs” tab, for overall survival select ‘constant HR (NMA BC)’ from the drop down box

172
Additional changes Remove comparator PASs assumed by company
“Medical Costs_Drugs” tab, change cell J13 to ‘No’, and cells J14 and J15 to ‘0%’

1
National Institute for Health and Care Excellence
Centre for Health Technology Evaluation
Pro-forma Response
ERG report
Dacomitinib for untreated EGFR-positive non-small-cell lung cancer [ID1346] You are asked to check the ERG report from Warwick Evidence to ensure there are no factual inaccuracies contained within it. If you do identify any factual inaccuracies you must inform NICE by 5pm, Monday 4 March using the below proforma comments table. All factual errors will be highlighted in a report and presented to the Appraisal Committee and will subsequently be published on the NICE website with the committee papers. The proforma document should act as a method of detailing any inaccuracies found and how and why they should be corrected.

2
ERG scenarios not reported in results
Description of problem Description of proposed amendment
Justification for amendment ERG Response
Page 92
The equally plausible scenarios considering no additional survival benefit beyond 48 and 60 months (OS HR=1) are reported in Table 25; however, these scenarios appear to not have been considered when computing the cost-effectiveness estimates. By doing so, the report seems to bias the results and to direction the reader of the report to the most conservative analyses.
Please consider the equally plausible scenarios in which no additional survival benefit beyond 48 and 60 months is observed (OS HR=1)in the cost-effective analyses. These results should be reported in the ERG report.
It is stated in the ERG report (page 88) that ‘The ERG acknowledge that implementing the HR=1 assumption from 48 months and 60 months could also be considered plausible, and investigated these in scenario analyses.’
In order to provide the committee with all the available data for decision making these scenarios should be included in the report.
The ERG accept that assuming a HR =1 from 48 or 60 months may also be plausible, but maintain that implementing this adjustment from 36 months is the most plausible option that is also supported by the available evidence.
The loss of the initial OS benefit of dacomitinib over gefitinib was observed in ARCHER 1050, as captured by the company’s 2nd order fractional polynomial models and the ERG’s resctricted cubic spline model, was maintained even when the ten latest events in the dacomitinib arm were instead censored in the ERGs analysis of the digitised data.
There is no factual error, and the ERG are happy to present additional analyses if requested by NICE.
Page 90
It is stated that: ‘The ERG’s
Please consider a scenario in which the equivalent post-progression between all comparators is assumed. The scenario
In addition to the clinical adviser comments it reads in the ERG report that ‘assuming that dacomitinib offers the most pre-
The ERG accepts that post-progression survival could be manipulated by varying the

3
clinical adviser stated that it was reasonable to assume equivalent post-progression survival for the comparators in this analysis, however the nature of the partitioned survival model meant that this could not be implemented as the post-progression survival is estimated as the difference between the PFS and OS.’
can be easily added to the model by simply changing the treatment waning scenario to equal 70 months. The approach will have some minor limitations associated with discounting; however it predicts almost equivalent PPS across all treatments.
The proposed change to the wording is as follows:
‘The ERG’s clinical adviser stated that it was reasonable to assume equivalent post-progression survival for the comparators in this analysis, however the nature of the partitioned survival model meant that this could not be implemented explicitly. Nonetheless, a simple naïve adjustment was made to the model to assess the impact of the potential impact assumption and this was included in scenario analysis.’
progression survival gain, it is plausible that post-progression survival could be equal or less than the post-progression survival of the comparators’ (page 90).
As such, the ERG base-case that predicts an afatinib PPS benefit over gefitinib/erlotinib is inconsistent.
time at which the HR = 1 assumption is implemented. However, the optimal timing for the implementation of this assumption is influenced by many factors in the economic model and could not be readily investigated by the ERG in the timeframe of this appraisal.
There is no factual error, and the ERG are happy to undertake and present additional analyses if requested by NICE.
Issue 1 Incorrect interpretation of hazard ratios
Description of problem Description of proposed amendment Justification for amendment ERG Response
Page 89: Figure 14
‘Under the models fitted with ERG’s preferred PFS and OS assumptions, dacomitinib provides an OS and PFS benefit over the comparators, but has a shorter post-progression survival time, consistent with the scenario
The ERG interpretation of hazard ratios is incorrect. The company suggests the following wording to be removed from the ERG report ‘Under the models fitted with ERG’s preferred PFS and OS assumptions, dacomitinib provides an OS and PFS benefit over the comparators, but has a shorter post-progression survival time, consistent with the scenario of the degree of the pre-progression benefit not being
This is an incorrect interpretation of hazard ratios given that hazard ratios demonstrate a relative effect and not an absolute effect. To have an equivalent absolute gain in PFS and OS (i.e. equivalent post-progression survival) does not require an equivalent hazard ratio given that PFS and OS are different
The ERG agrees that HR demonstrate a relative effect, rather than an absolute effect, and have removed the HR values from the end of the sentence. The rest of the sentence is still valid.

4
of the degree of the pre-progression benefit not being repeated in the OS benefit as has been observed in ARCHER 1050 (PFS HR: 0.59, OS HR: 0.76).’
repeated in the OS benefit as has been observed in ARCHER 1050 (PFS HR: 0.59, OS HR: 0.76).’
baselines. For example a 5 month gain in both PFS and OS (i.e. equal post-progression survival) over a control with 10 month PFS and 20 month OS would not provide the same hazard ratios for PFS and OS.
Issue 2 Inaccuracies between ERG proposed base-case and ERG reported statements
Description of problem Description of proposed amendment Justification for amendment ERG Response
Page 88-89
It is stated that: ‘The ERG agree with the first point’ that the assumption of a HR=1 for the OS of all comparators from 36 months is ‘based on censored data that is driven small patient numbers’.
The scenario assuming no survival benefit beyond 36 months should be removed from consideration for decision making.
Given that the ERG acknowledges that the 36 months cut-off is ‘based on censored data that is driven small patient numbers’ other scenarios should be considered. In addition, with this arbitrary cut-off applied the resulting survival curves for dacomitinib and afatinib do not have external validity. The predicted mean OS under this ERG scenario results in a 1.0 month mean gain for dacomitinib (XXX) versus afatinib (XXX), which is misaligned with the median gains over gefitinib of 7.3 and 3.4 months observed respectively in ARCHER 1050 and LUX-Lung 7. Although these are medians, it is implausible that a doubled median gain would result in only 1 month mean survival gain.
The company have misquoted the ERG report. The sentence in question reads:
“The ERG agree with the first point, that it is unclear what happens beyond the trial follow-up, but this argument could be placed against the company’s own base-case analysis”
The company has not provided evidence to suggest that there is a significant difference in OS between afatinib and dacomitinib, and so it is plausible that any difference between the interventions may be slight.
The ERG also maintain that it is incorrect to compare mean and median gains in survival.

5
Page 92
ERG PFS and OS HR=1 at 3 years provides clinically implausible post-progression life years
The ERG reports on page 90 that ‘the ERG’s clinical adviser stated that it was reasonable to assume equivalent post-progression survival for the comparators in this analysis.’
The company is in agreement with the statement of the clinical adviser given that upon progression there is no clinical rationale for patients to have differing prognosis given they are eligible for the same subsequent treatments and will present with similar prognosis.
There is no factual error here.
It is clinically plausible for there to be variation in post-progression survival times, as seen in trials where the difference in mean PFS exceeds the difference in mean OS.
Page 92: Table 25
ERG PFS and OS HR=1 at 3 years provides clinical implausible predictions compared to the ERG base-case PFS
The ERG base-case predicts that on the dacomitinib arm XX% of patients will be on treatment at 36 months. This is inconsistent with the assumption that there is no additional benefit of dacomitinib after 3 years compared to gefitinib. Only XX% of patients in the gefitinib arm are on treatment at 36 months.
The HR=1 assumption was generated by the need to obtain a plausible extrapolation using the model provided by the company, whilst also being consistent with what was observed in ARCHER 1050.
Page 88: Incorrect interpretation
‘The ERG also digitised the cumulative hazard plots of OS from ARCHER 1050 provided by the company. These were seen to be parallel from 27 months, suggesting there was no difference in OS efficacy beyond
The ERG’s interpretation of the cumulative hazards is incorrect. As such, the company suggests the following wording to be removed from the ERG report: ‘The ERG also digitised the cumulative hazard plots of OS from ARCHER 1050 provided by the company. These were seen to be parallel from 27 months, suggesting there was no difference in OS
Parallel cumulative hazard plots suggest that proportional hazards holds and not that the hazard is the same between the treatment. They do not suggest that there is no further benefit.
The convergence observed just beyond this time points is due to the
The company’s interpretation would be correct if it was referring to log-cumulative hazard plots, which are parallel when proportionality is present.
In the present case, the company’s interpretation is incorrect, as cumulative hazard

6
this point.’ efficacy beyond this point.’ immaturity of the data (censoring) that was acknowledge by the ERG in clarification question B6.
plots are not parallel under a proportional hazards assumption.
Issue 3 PFS KOL feedback
Description of problem Description of proposed amendment Justification for amendment ERG Response
Page 74: Incorrect interpretation
‘The company opted for the generalised gamma, despite stating that its 3 and 5 year PFS estimates were too low when examined by their clinical experts. They also explored using a log-normal curve as an alternative scenario.’
The company suggest the following amendment: ‘The company opted for the generalised gamma, despite stating that PFS was considered to be underestimated when examined by their clinical experts. They also explored using a log-normal curve as an alternative scenario; however this was considered to overestimate PFS by their clinical expert.’
CS page 101: ‘Clinicians suggested they would expect the true survival to fall somewhere between the upper and lower models’
There is no factual error.
The ERG would like to point out that the company’s original submission states that the log-normal curve “was considered to slightly overestimate long-term PFS”.
Issue 4 Neglect of plausible scenario that are pivotal for decision making
Description of problem Description of proposed amendment Justification for amendment ERG Response
Page 120
‘These results showed that the discount rate applied to benefits and using the log-logistic parametric curve to model OS for gefitinib were the key drivers to the ICERs.’
Page 125
Given the omission of treatment beyond progression, the company suggest the following amendments:
on page 120: ‘These results showed that the discount rate applied to benefits, using the log-logistic parametric curve to model OS for gefitinib and including treatment beyond progression were the key drivers to
Despite the ERG acknowledging that treatment beyond progression is a key driver in scenario analysis; it appears to have been neglected from all ERG analysis with no justification. This is a concern for the company given the large impact on the cost-effectiveness this assumption has and the availability of TTD data was queried during
We have amended the text to:
‘These results showed that the discount rate applied to benefits, using the log-logistic parametric curve to model OS for gefitinib and including treatment beyond progression were the key drivers to the ICERs and

7
‘As seen in these Tables, under the scenario of using log-logistic parametric curves for OS had the greatest impact to the base-case ICER for dacomitinib against all comparators.’
the ICERs and including treatment beyond progression.’
on page 125: ‘As seen in these tables, under the scenario of using log-logistic parametric curves for OS and including treatment beyond progression had the greatest impact to the base-case ICER for dacomitinib against all comparators.’
Due to these omissions, the treatment beyond progression scenario included in the MS (where a fixed cost is applied upon progression) should be included within the ERG scenario analyses.
ERG clarification B11.
including treatment beyond progression.’
‘on page 125: ‘As seen in these tables, under the scenario of using log-logistic parametric curves for OS and including treatment beyond progression had the greatest impact to the base-case ICER for dacomitinib against all comparators.’
Treatment beyond progression is included in the company’s scenario analysis. However, the ERG did not present a scenario analysis as the company’s model (latest version: ID1346 dacomitinib company model v0.3 060219 JE [ACIC]) omitted the time-to-treatment discontinuation data.
Issue 5 Incorrect interpretation of follow-up visit utility value
Description of problem Description of proposed amendment Justification for amendment ERG Response
Page 16: Incorrect interpretation
‘On clarification, the company provided utility values collected from participants in ARCHER 1050 trial who were in the post-
The utility values provided in response to clarification question B10 have been misinterpreted. Therefore, the company suggest the following amendment: ‘On clarification, the company provided utility values collected from participants in ARCHER 1050 trial at a single
The values provided in the response to clarification question B10 only represent data collected at a single post-treatment follow-up (at least 28 days, and no more than 35 days after end of treatment visit
The ERG maintain that sentence in question is valid. However, to improve the clarity of this sentence, we will amend to: ‘On clarification, the company provided utility values

8
progression health state.’ post-treatment follow-up (at least 28 days, and no more than 35 days after end of treatment visit).’
assessments).
Patients are in the post-progression state from the points of progressing until death, therefore the utility values must capture the gradual decline over the patients remaining life, especially prior to death. Therefore, this single post-treatment follow-up value does not capture the quality-of-life fully across the post-progression state.
collected from participants in ARCHER 1050 trial in the post-progression state at follow-up visit (28-35 days following end of treatment visit).’
CS section B.3.3.4. states:
“Patients were assumed to be treated until progression, with PFS being used as a proxy for treatment duration.” Therefore, the post-treatment follow up which occurred after the end of treatment is within the company’s defined ‘post-progression’ health state as stated by the ERG. The post-progression state in the company model contains progressing patients and patients on 2nd and 3rd line therapy. The company used utility figures reported in the Labbe et al. 2017 study of 0.64 but Labbe et al. also report utility values of 0.72 for patients not on other systemic treatments typically chemotherapy.
Longitudinal results in Labbe et al. are collected over a mean of 12 months from date of diagnosis with mean of 3.2 encounters per patient with no

9
data on time-length how long into the progressing stage or proximity to death these patients were when EQ-5D was captured. Based on a sample of n=81 progressing patients. ARCHER figures based on n=182.
The Labbe et al. results in the CS sensitivity analysis were 0.77 for PFS and 0.64 for PD representing a 0.13 decrease in utility. The ERG use a value for gefitinib and erlotinib of XXX for PFS and 0.72 for PD representing a similar decrease of XXX.
A sensitivity analysis using the Labbe et al. result for PD was also conducted by the ERG.
Page 18: Incorrect interpretation
‘However, as ARCHER 1050 trial utility data were available for PD’
The utility values provided in response to clarification question B10 have been misinterpreted. Therefore, the company suggests the following wording to be removed from the ERG report: ‘However, as ARCHER 1050 trial utility data were available for PD’.
Same as above. Same as above
Page 96: Incorrect interpretation
‘In light of the company’s original assertion that this trial data was
The utility values provided in response to clarification question B10 have been misinterpreted. Therefore, the company
Same as above. “Given that EQ-5D was not collected beyond progression in ARCHER 1050, the PD utility
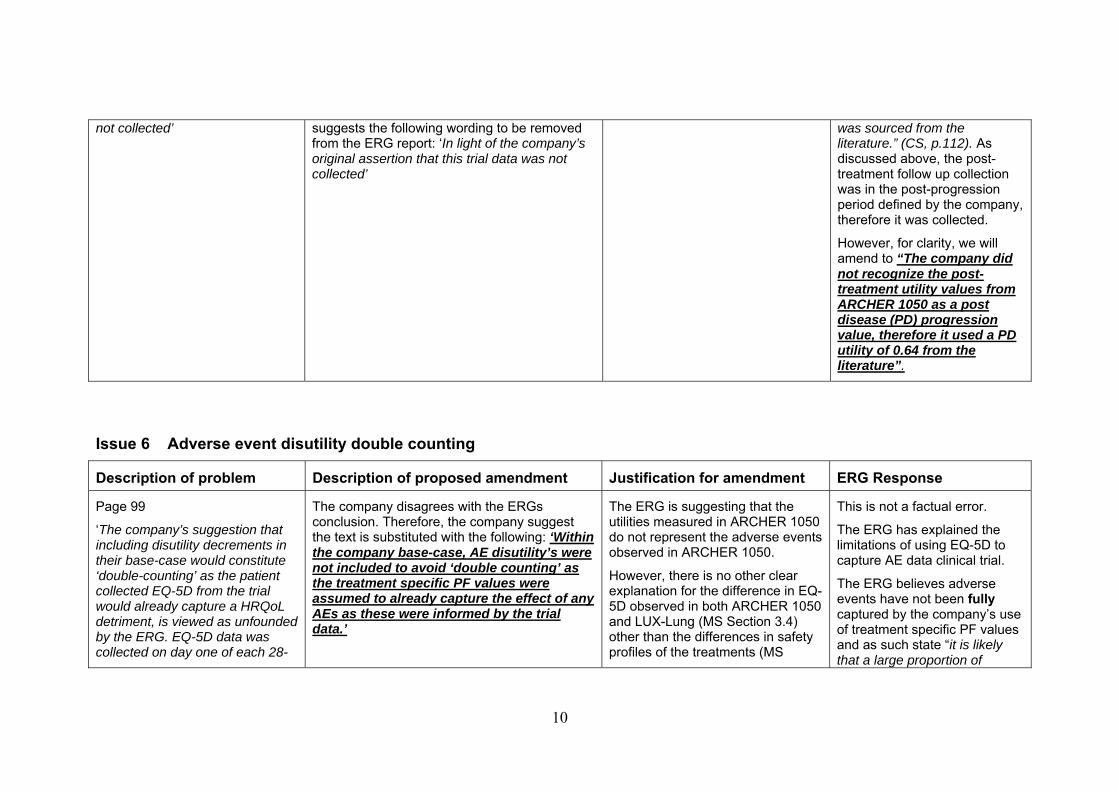
10
not collected’
suggests the following wording to be removed from the ERG report: ‘In light of the company’s original assertion that this trial data was not collected’
was sourced from the literature.” (CS, p.112). As discussed above, the post-treatment follow up collection was in the post-progression period defined by the company, therefore it was collected.
However, for clarity, we will amend to “The company did not recognize the post-treatment utility values from ARCHER 1050 as a post disease (PD) progression value, therefore it used a PD utility of 0.64 from the literature”.
Issue 6 Adverse event disutility double counting
Description of problem Description of proposed amendment Justification for amendment ERG Response
Page 99
‘The company’s suggestion that including disutility decrements in their base-case would constitute ‘double-counting’ as the patient collected EQ-5D from the trial would already capture a HRQoL detriment, is viewed as unfounded by the ERG. EQ-5D data was collected on day one of each 28-
The company disagrees with the ERGs conclusion. Therefore, the company suggest the text is substituted with the following: ‘Within the company base-case, AE disutility’s were not included to avoid ‘double counting’ as the treatment specific PF values were assumed to already capture the effect of any AEs as these were informed by the trial data.’
The ERG is suggesting that the utilities measured in ARCHER 1050 do not represent the adverse events observed in ARCHER 1050.
However, there is no other clear explanation for the difference in EQ-5D observed in both ARCHER 1050 and LUX-Lung (MS Section 3.4) other than the differences in safety profiles of the treatments (MS
This is not a factual error.
The ERG has explained the limitations of using EQ-5D to capture AE data clinical trial.
The ERG believes adverse events have not been fully captured by the company’s use of treatment specific PF values and as such state “it is likely that a large proportion of

11
day cycle whereas average duration of the 2 most common frequently reported treatment related AE in dacomitinib patients, diarrhoea (7.9%) and paronychia (7.5%), were assumed to occur for a duration of 6.6 and 12.3 days respectively. As the EQ-5D asks patients about their health state on the day of the month they complete the form (EuroQol, 1990), it is likely that a large proportion of adverse events were not captured in the trial data.
Therefore, the ERG strongly believes that disutility is not fully represented in the company’s base-case and that the inclusion of the treatment specific disutility decrements is founded.’
Section B.2.10.4). adverse events were not captured in the trial data”.
Page 100
‘The ERG finds the rationale for omitting AE disutilities from the base-case on the grounds of double counting to be unfounded and will specifically include a disutility decrement in their base-case analysis.’
The company disagrees with the ERGs conclusion. Therefore, the company suggests the following wording to be removed from the ERG report: ‘The ERG finds the rationale for omitting AE disutilities from the base-case on the grounds of double counting to be unfounded and will specifically include a disutility decrement in their base-case analysis.’
Same as above. Same as above
Page 108
‘The ERG did not consider that the inclusion of AE disutilities would constitute as double-
The company disagrees with the ERGs conclusion. Therefore, the company suggest the text is substituted with the following: ‘This is a reasonable assumption.’
Same as above. Same as above

12
counting because it is unlikely that the EQ-5D had been administered at the time-point when the events occurred. Hence, disutility would have been under represented.’
Issue 7 Proportion of European sites
Description of problem Description of proposed amendment Justification for amendment ERG Response
Page 14: Incorrect percentage reported on
‘There were no UK sites participating in the trial and only XXX of sites were from European countries.’
The company suggest the following amendment: ‘There were no UK sites participating in the trial and XXX of sites were in European countries.’
Of the 71 sites the following were in Europe: Italy (13 sites), Poland (3 sites), and Spain (17 sites)).
This is an error by the ERG, as the sentence should have reflected the proportion of participants rather than the proportion of sites (as per p33 in the ERG report).
In response, we have amended the text to: There were no UK sites participating in the trial. The proportion of participants from European countries was approximately XXX.
Issue 8 Typo
Description of problem Description of proposed amendment Justification for amendment ERG Response
Page 15: ‘elevant’ ‘relevant’ Thank you, we have made the necessary correction.
Page 25: ‘dacomininib’ ‘dacomitinib’ Thank you, we have made the necessary correction, and also

13
further corrected pages 47 and 159.
Page 36 ‘ECFR’ ‘EGFR’ Thank you, we have made the necessary correction.
Page 93 ‘acrossthe’ ‘across the’ We were unable to locate this mistake in our report, and could not perform a correction.
Issue 9 Gender balance in ARCHER 1050
Description of problem Description of proposed amendment Justification for amendment ERG Response
Page 32: Misrepresentation of CS
‘The CS states that the difference in gender was not unexpected given the higher frequency of EGFR mutations among females than males. However, this does not explain the imbalance since EGFR mutations were required for inclusion and randomisation should have ensured an even distribution between arms.’
Given that this is an incorrect interpretation of the company’s comment in the CS, the company suggests the following wording to be removed from the ERG report ‘The CS states that the difference in gender was not unexpected given the higher frequency of EGFR mutations among females than males. However, this does not explain the imbalance since EGFR mutations were required for inclusion and randomisation should have ensured an even distribution between arms.’
The CS is discussing the difference between the portion of males and females as stated by the ERG and not the balances of females between treatment arms which the ERG is alluding to.
When discussing the baseline characteristics of the ARCHER 1050 trial, the CS states (page 38) “Although there was some differences in gender (females comprised 64.3% and 55.6% of the dacomitinib and gefitinib arms, respectively), this was not unexpected as EGFR mutations in NSCLC are more common among females”. It was not clear to the ERG that this was referring to the ratio of females to males as clarified here and was interpreted by the ERG as referring to the different proportions of females in the dacomitinib and gefitinib arms given the data presented.
Although this is not a factual

14
error, the ERG have changed the text to:
The CS refers to the difference in proportions of females and males in the trial (which is expected given higher frequency of EGFR mutations in females) but makes no reference to the difference in the rates of females across the arms of the trials.
Issue 10 Gender and ECOG prognostic factors
Description of problem Description of proposed amendment Justification for amendment ERG Response
Page 32: Not presented data from ARCHER 1050
‘Gender is a potential prognostic factor (see Section 4.2.1). The CS states that generally there is no difference in outcomes between ECOG PS 0 and 1, citing ARCHER 1050 as evidence.’
This statement from the ERG is not fully represented of the data from ARCHER 1050. Therefore, the company suggest the following amendment: ‘Gender and ECOG are potential prognostic factors, however no significant difference were observed in either PFS or OS in ARCHER 1050 for these subgroups (insignificant interaction p-values).’
Non-significant interaction terms for PFS (A9 response) and OS (Figure 14 MS) were observed in ARCHER 1050 for both gender and ECOG status.
The CS make no reference to the difference in gender as a prognostic factor and this statement is the ERG’s summary of the evidence subsequently reviewed in the ERG report. With regard to performance status the ERG state that the evidence from ARCHER 1050 is used to show there is no difference in outcomes in the PS subgroups. No further action required.

15
Issue 11 Inaccurate summary of ARCHER 1050 secondary outcomes
Description of problem Description of proposed amendment Justification for amendment ERG Response
Page 58: Incorrect reporting of the data
‘A statistically significant improvement in the primary outcome of PFS was found in favour of dacomitinib and some, but not all, secondary outcomes also favoured dacomitinib.’
This statement from the ERG is not fully representative of the data from ARCHER 1050. Therefore, the company suggest the following amendment: ‘A statistically significant improvement in the primary outcome of PFS was found in favour of dacomitinib. Statistically significant improvements were also observed in secondary outcomes of PFS by investigator assessment, OS, DoR and TTF.’
All secondary outcomes (PFS investigator assessment, OS, ORR, DoR, TTF) numerically favoured dacomitinib in ARCHER 1050 (CS Section B.2.6.3) with PFS investigator assessment, OS, DoR and TTF all reaching statistical significance.
This is an overall summary and reflects the data, which for some secondary outcomes showed a statistically significant effect and for others did not. The data themselves are reported in more detail elsewhere in the ERG report. No action required.
Issue 12 Traditional proportional hazard NMA
Description of problem Description of proposed amendment Justification for amendment ERG Response
Page 56:
‘As noted above, the CS undertook a traditional NMA using the Bucher method42 using gefitinib as the common comparator. This preserves the randomisation within the included trials. The CS states that the baselines characteristics between the two included trials were generally well balanced. As noted above the ERG considers there is a potential for the transitivity assumption to be violated. The CS hazard ratios from the NMA for PFS (independent review) and
This statement is an incorrect interpretation of the company’s comment in the CS. Therefore, the company suggest the following amendment: ‘As noted above, the CS undertook a traditional NMA akin to the Bucher method42 using gefitinib as the common comparator. This preserves the randomisation within the included trials. The CS states that the baselines characteristics between the two included trials were generally well balanced. As noted above the ERG considers there is a potential for the transitivity assumption to be violated. The CS hazard ratios from the NMA for PFS (independent review) and OS are presented in CS Tables 80 and 81 respectively.’
As discussed in the CS (page 67), the traditional NMA undertaken by the company was akin to the Bucher method in that it used gefitinib as the common comparator however this was applied in the model naïvely to the baseline gefitinib curve. Therefore, there are no formal outputs from the traditional NMA to report in the main text or appendix.
There is no factual error. The ERG maintain that the company failed to present the results for the pairwise comparison of afatinib and dacomitinib.

16
OS are presented in CS Tables 80 and 81 respectively. While the CS states that an indirect treatment comparison was undertaken, the ERG has noted that the findings from this indirect comparison were neither presented in the main report, nor in the CS Appendix.‘
Issue 13 Incorrect description of model transition inputs
Description of problem Description of proposed amendment Justification for amendment ERG Response
Page 73
‘Four clinical outcomes from ARCHER 1050 were used to inform the transitions between health states in the model:
Progression-free survival
Overall survival
Adverse events of treatment
Health-related quality of life’
The statement from the ERG is incorrect, therefore, the company suggest the following amendment: ‘Two clinical outcomes from ARCHER 1050 were used to inform the transitions between health states in the model:
Progression-free survival
Overall survival’
Adverse events and HRQoL did not inform the model transitions.
We accept this error and we have amended the text to :
Two clinical outcomes from ARCHER 1050 were used to inform the transitions between health states in the model:
Progression-free survival
Overall survival
Issue 14 Unclear statement
Description of problem Description of proposed amendment Justification for amendment ERG Response
Page 85: Unclear and CIC The statement from the ERG is unclear, therefor the company cannot suggest an
Not clear what the percentages are referring to and percentages should
CIC marking and a clarification about the time point these

17
marking
‘When applied to the log-logistic extrapolation, the company’s FP predicts 6.9% alive on dacomitinib compared to 2.4% on gefitinib.’
amendment. be CIC marked if related to survival outputs.
percentages refer to have now been added:
‘When applied to the log-logistic extrapolation, the company’s FP predicts XXX alive on dacomitinib compared to XXX on gefitinib at 5 years.
Issue 15 CIC marking
Description of problem Description of proposed amendment Justification for amendment ERG Response
Page 89: Figure 14
Please mark as CIC Not marked as CIC in line with all other survival analyses.
This figure was produced using publicly available data. Confidential marking is not necessary.
Issue 16 Misrepresentation of stomatitis
Description of problem Description of proposed amendment Justification for amendment ERG Response
Page 94:
‘In addition to frequency, this data also suggests that the mix of AEs considered may also be different with the notable inclusion of stomatitis that could potentially be relevant at >5% threshold.’
Given that this is an incorrect interpretation of the company’s comment in the CS, the company suggests the following wording to be removed from the ERG report: ‘In addition to frequency, this data also suggests that the mix of AEs considered may also be different with the notable inclusion of stomatitis that could potentially be relevant at >5% threshold’
Please see response to Response B9ii. It was explain that stomatitis was an outlier given that of the 26 events that are reported across 8 patients that experienced grade 3 stomatitis, 17 of these 26 events were from a single patient.’ Therefore, due to this single outlier it is incorrect to suggest it should be included under the 5% threshold.
The wording has been amended to: “The mix of AEs represented in table 27 shows the inclusion of stomatitis. Clarification data from the company reported XX events across XX patients experiencing grade 3 stomatitis, XX xx xxxx xxxx xxx x xxxxx xxxxxx. However, stomatitis is a dermatological AE commonly

18
associated with irreversible EGFR TKI inhibitors (Melosky et al., 2015) and showed clinically meaningful worsening in HRQOL in dacomitinib patients assessed using the EORTC QOL questionnaire in ARCHER 1050. Therefore, inclusion of stomatitis in AE data may be relevant and warranted.” Ref: Melosky B, Leighl NB, Rothenstein J, Sangha R, Stewart D, Papp K. Management of egfr tki-induced dermatologic adverse events. Curr Oncol. 2015;22(2):123-32.
Page 100
‘Last, the ERG believes disutilities associated with AEs have been under-represented within the model and is concerned that other AEs such as stomatitis should have been considered as clinically these are relevant.’
Given that this is an incorrect interpretation of the company’s comment in the CS, the company suggests the following wording to be removed from the ERG report: ‘Last, the ERG believes disutilities associated with AEs have been under-represented within the model and is concerned that other AEs such as stomatitis should have been considered as clinically these are relevant.’ to be removed from the ERG report.
Same as above. The ERG states 2 concerns which are based on trial data and on wider evidence:
1. disutilities associated with AEs have been under-represented within the model
2. other AEs such as stomatitis should have been considered as clinically these are relevant
The impact of stomatitis (sore mouth) within ARCHER 1050 patients was clinically significant in dacomitib patients

19
and therefore its inclusion as an AE could be justified. (Wu et al., 2017, p.1463)
No amendment required.
Issue 17 Missing inference of impact of missing cost on cost-effectiveness
Description of problem Description of proposed amendment Justification for amendment ERG Response
Page 106
‘With this in mind, we consider that these costs included in the model are likely to be an underestimate of the true costs associated with managing/treating people with NSCLC.’
The company believe the ERG statement is missing an interpretation of the impact. Therefore, the company suggest the following amendment: ‘With this in mind, we consider that these costs included in the model are likely to be an underestimate of the true costs associated with managing/treating people with NSCLC. However, they would have been applied equally to all treatment so would therefore have had no incremental impact on costs.’
This is a minor limitation and it should be emphasised that this has no impact on the cost-effectiveness.
We do not consider that there is a factual error in this sentence, hence no change to the text is necessary.
The ERG maintain that there is no certainty that the use of the excluded resources (MRI scans for suspected brain metastases or cord compression and costs associated with the diagnosis of T790M), will be equal or comparable between the treatment groups. No justification for such an assumption, or evidence to support it, is offered in the CS. Given this, the ERG consider that it would be inappropriate to state that the costs would have been equal across treatments (and therefore would have no impact on the

20
cost-effectiveness analysis), as the company suggests in their proposed amendment.
Issue 18 ERG has not commented on validation compared to previous CE analysis
Description of problem Description of proposed amendment Justification for amendment ERG Response
Page 129
‘Based on the parametric curves used, the ERG notes that the model predicts similar PFS and OS results for gefitinib as those observed in previous studies. However, we consider that the long-term extrapolations based on these parametric models to be pessimistic.’
The company believes the ERG has omitted validation presented in the CS. Therefore, the company suggest that the ERG includes validation to previous CE analysis and acknowledge that these provide external validity for the company base-case.
ERG has failed to mention previous CE analysis validation which compared LYs
CS pg. 136
XXXXXXXXXXXXXXXX
XXXXXXXXXXXXXXXX
XXXXXXXXXXXXXXXX
XXXXXXXXXXXXXXXX
The ERG has presented validation compared to observed studies in section 5.3 of the ERG report.
This comparison of different extrapolations, which were obtained using different approaches without any consideration of the heterogeneity of the studies, should be treated with caution.

Dacomitinib for untreated EGFR-positive non-small-cell lung cancer (ID1346). ERG Addendum 1.
Produced by: Warwick Evidence
Authors: Peter Auguste, Research Fellow in Health Economics1 Emma Loveman, Senior Researcher 2
Daniel Gallacher, Research Fellow in Statistics1 Mary Jordan, Research Associate in Health Economics1 Rachel Court, Information Specialist1
Jacoby Patterson, Honorary Clinical Research Fellow1 Jatinder Kaur, Academic Foundation Year Two Doctor3 John Green, Consultant in Medical Oncology4 Jill Colquitt, Senior Researcher2
Xavier Armoiry, Honorary Clinical Research Fellow1 and Professor of Pharmacy5
James Mason, Professor of Health Economics1 Lazaros Andronis, Senior Research Fellow in Health Economics1
1 Warwick Evidence, Division of Health Sciences, Warwick Medical School, University of Warwick, Coventry, CV4 7AL, UK 2 Effective Evidence LPP, Waterlooville, PO8 9SE, UK 3University Hospitals Birmingham NHS Foundation Trust, Birmingham B15 2QU, UK 4The Clatterbridge Cancer Centre, Wirral, CH63 4JY, UK 5Claude Bernard University, Villeurbanne 69100, France
Correspondence to: Dr Lazaros Andronis, Division of Health Sciences, Warwick Medical School, University of Warwick, Coventry, CV4 7AL. Tel: +44 (0) 24 765 74490. Email: [email protected]
Date completed: 15th March 2019
Source of funding: This report was commissioned by the NIHR HTA Programme as project number
17/156/04

2
Declared competing interests:
PA, EL, DG, MJ, RC, JP, JK, XA, JC, JG, JM and LA declare no competing interests.
LA declares an honorarium received from Pfizer for participation in a panel set up to provide expert opinion on aspects of an unrelated submission to NICE (Tofacitinib for moderately to severely active ulcerative colitis [TA574]).
Acknowledgements:
The ERG team are grateful to Dr John Green (BSc MBChB DM FRCPE FRCP) who acted as an expert clinical advisor throughout the course of this appraisal.
Rider on responsibility for report:
The views expressed in this report are those of the authors and not necessarily those of the NIHR HTA Programme. Any errors are the responsibility of the authors. Copyright belongs to The University of Warwick.
This report should be referenced as follows:
Auguste P., Loveman E., Gallacher, D., Jordan M., Court R, Patterson J., Kaur J., Green J., Colquit J., Armoiry X., Mason J and Andronis L. Dacomitinib for untreated EGFR-positive non-small-cell lung cancer (ID1346): A Single Technology Appraisal. Warwick Evidence, University of Warwick, February 2019.
Contributions of authors
Lazaros Andronis (Senior Research Fellow) led and co-ordinated the project; Peter Auguste (Research Fellow) co-ordinated and conducted the appraisal of the economic evidence; Emma Loveman (Senior Researcher) co-ordinated and conducted the appraisal of clinical effectiveness evidence; Daniel Gallacher (Research Fellow) conducted the appraisal of statistical elements in the submission; Mary Jordan (Research Associate) contributed to the appraisal of the economic evidence; Rachel Court (Information Specialist) conducted ERG searches and the critique of the company searches; Jacoby Paterson (Clinical Fellow) contributed to the appraisal of the clinical effectiveness evidence; Jatinder Kaour (Academic F2 Doctor) contributed to the appraisal of the clinical effectiveness evidence; John Green (Consultant in Oncology) contributed to the appraisal of the clinical effectiveness evidence; Jill Colquit (Senior Researcher) contributed to the appraisal of the clinical effectiveness evidence; Xavier Armoiry (Professor of Pharmacology) contributed to the appraisal of statistical elements (Network Meta Analysis), James Mason (Professor of Health Economics) contributed to the appraisal of the economic evidence. All listed authors contributed to writing sections of the report, and reviewed and commented on the final version of the report.

2
Additional Scenario Analyses
In response to a request by NICE, we have undertaken additional analyses in relation to the following
scenarios:
No additional survival benefit (OS HR=1) are assumed after 48 months and 60 months.
Equivalent post-progression survival is assumed between all comparators.
Analyses reported here relate to the comparison between dacomitinib with the company’s PAS
discount applied versus all comparators at their list prices. Results are presented in terms of additional
cost per life-year gained (LYG) and additional cost per quality-adjusted life year (QALY) gained in

Table 1 and Table 2, respectively.

5
Table 1: Scenario analyses (no additional survival benefit after 48 months and 60 months, and equivalent post-progression between comparators)
reported in terms of cost per LYG.
Treatment Expected mean costs
(£)
Incremental costs (£)
Progression-free LYG
Post-progression LYG
Expected mean LYG
Incremental LYG
ICER (£)
ERG’s preferred base-case assumptions Erlotinib xxxxxx xxxxxx xxxxxx xxxxxx xxxxxx xxxxxx xxxxxx Dacomitinib xxxxxx xxxxxx xxxxxx xxxxxx xxxxxx xxxxxx xxxxxx Gefitinib xxxxxx xxxxxx xxxxxx xxxxxx xxxxxx xxxxxx xxxxxx Afatinib xxxxxx xxxxxx xxxxxx xxxxxx xxxxxx xxxxxx xxxxxx Scenario 1: Hazard ratio = 1 from 48 months Erlotinib xxxxxx xxxxxx xxxxxx xxxxxx xxxxxx xxxxxx xxxxxx Dacomitinib xxxxxx xxxxxx xxxxxx xxxxxx xxxxxx xxxxxx xxxxxx Gefitinib xxxxxx xxxxxx xxxxxx xxxxxx xxxxxx xxxxxx xxxxxx Afatinib xxxxxx xxxxxx xxxxxx xxxxxx xxxxxx xxxxxx xxxxxx Scenario 2: Hazard ratio = 1 from 60 months Erlotinib xxxxxx xxxxxx xxxxxx xxxxxx xxxxxx xxxxxx xxxxxx Dacomitinib xxxxxx xxxxxx xxxxxx xxxxxx xxxxxx xxxxxx xxxxxx Gefitinib xxxxxx xxxxxx xxxxxx xxxxxx xxxxxx xxxxxx xxxxxx Afatinib xxxxxx xxxxxx xxxxxx xxxxxx xxxxxx xxxxxx xxxxxx Scenario 3 (Equivalent post-progression survival from ERG base case, by implementing hazard ratio = 1 from 71 months) Erlotinib xxxxxx xxxxxx xxxxxx xxxxxx xxxxxx xxxxxx xxxxxx Dacomitinib xxxxxx xxxxxx xxxxxx xxxxxx xxxxxx xxxxxx xxxxxx Gefitinib xxxxxx xxxxxx xxxxxx xxxxxx xxxxxx xxxxxx xxxxxx Afatinib xxxxxx xxxxxx xxxxxx xxxxxx xxxxxx xxxxxx xxxxxx LYG: life-years gained

6
Table 2: Scenario analyses (no additional survival benefit after 48 months and 60 months, and equivalent post-progression between comparators)
reported in terms of cost per QALY gained.
Treatment Expected mean costs
(£)
Incremental costs (£)
Progression-free LYG
Post-progression QALY
Expected mean QALY
Incremental QALY
ICER (£)
ERG’s preferred base-case assumptions Erlotinib xxxxxx xxxxxx xxxxxx xxxxxx xxxxxx xxxxxx xxxxxx Dacomitinib xxxxxx xxxxxx xxxxxx xxxxxx xxxxxx xxxxxx xxxxxx Gefitinib xxxxxx xxxxxx xxxxxx xxxxxx xxxxxx xxxxxx xxxxxx Afatinib xxxxxx xxxxxx xxxxxx xxxxxx xxxxxx xxxxxx xxxxxx Scenario 1: Hazard ratio = 1 from 48 months Erlotinib xxxxxx xxxxxx xxxxxx xxxxxx xxxxxx xxxxxx xxxxxx Dacomitinib xxxxxx xxxxxx xxxxxx xxxxxx xxxxxx xxxxxx xxxxxx Gefitinib xxxxxx xxxxxx xxxxxx xxxxxx xxxxxx xxxxxx xxxxxx Afatinib xxxxxx xxxxxx xxxxxx xxxxxx xxxxxx xxxxxx xxxxxx Scenario 2: Hazard ratio = 1 from 60 months Erlotinib xxxxxx xxxxxx xxxxxx xxxxxx xxxxxx xxxxxx xxxxxx Dacomitinib xxxxxx xxxxxx xxxxxx xxxxxx xxxxxx xxxxxx xxxxxx Gefitinib xxxxxx xxxxxx xxxxxx xxxxxx xxxxxx xxxxxx xxxxxx Afatinib xxxxxx xxxxxx xxxxxx xxxxxx xxxxxx xxxxxx xxxxxx Scenario 3 (Equivalent post-progression survival from ERG base case, by implementing hazard ratio = 1 from 71 months) Erlotinib xxxxxx xxxxxx xxxxxx xxxxxx xxxxxx xxxxxx xxxxxx Dacomitinib xxxxxx xxxxxx xxxxxx xxxxxx xxxxxx xxxxxx xxxxxx Gefitinib xxxxxx xxxxxx xxxxxx xxxxxx xxxxxx xxxxxx xxxxxx Afatinib xxxxxx xxxxxx xxxxxx xxxxxx xxxxxx xxxxxx xxxxxx QALY, quality adjusted life-years gained

7
We present in Table 3 the scenario analyses conducted along with the details of each change made.
Table 3: Summary of the additional changes made to undertake scenario analyses
Description of ERG
change to economic
model
Implementation of the change in the model
Scenario 1: Hazard ratio = 1 from 48 months
Change following formulae in sheet “FP NMA HR” K243 change, and drag down: =IF(AND(user_HR1_36months=2,B243>48),1,EXP(K$237+K$238*IF($L$231,LN($C243),$C243^$L$229)+IF($L$233,K$239*IF($L$232,LN($C243),$C243^$L$230)*IF($L$234,LN($C243),1),0))) L243 change and drag down: =IF(AND(user_HR1_36months=2,B243>48),1,EXP(L$237+L$238*IF($L$231,LN($C243),$C243^$L$229)+IF($L$233,L$239*IF($L$232,LN($C243),$C243^$L$230)*IF($L$234,LN($C243),1),0)))
Scenario 2: Hazard ratio = 1 from 60 months
K243 change, and drag down: =IF(AND(user_HR1_36months=2,B243>60),1,EXP(K$237+K$238*IF($L$231,LN($C243),$C243^$L$229)+IF($L$233,K$239*IF($L$232,LN($C243),$C243^$L$230)*IF($L$234,LN($C243),1),0))) L243 change and drag down: =IF(AND(user_HR1_36months=2,B243>60),1,EXP(L$237+L$238*IF($L$231,LN($C243),$C243^$L$229)+IF($L$233,L$239*IF($L$232,LN($C243),$C243^$L$230)*IF($L$234,LN($C243),1),0)))
Scenario 3 (Equivalent post-progression survival from ERG base case, by implementing hazard ratio = 1 from 71 months)
K243 change, and drag down: =IF(AND(user_HR1_36months=2,B243>71),1,EXP(K$237+K$238*IF($L$231,LN($C243),$C243^$L$229)+IF($L$233,K$239*IF($L$232,LN($C243),$C243^$L$230)*IF($L$234,LN($C243),1),0))) L243 change and drag down: =IF(AND(user_HR1_36months=2,B243>71),1,EXP(L$237+L$238*IF($L$231,LN($C243),$C243^$L$229)+IF($L$233,L$239*IF($L$232,LN($C243),$C243^$L$230)*IF($L$234,LN($C243),1),0)))

1
Dacomitinib for untreated EGFR-positive non-small-cell lung cancer
(ID1346). – ERG Erratum
Produced by: Warwick Evidence
Authors: Peter Auguste, Research Fellow in Health Economics1 Emma Loveman, Senior Researcher 2
Daniel Gallacher, Research Fellow in Statistics1 Mary Jordan, Research Associate in Health Economics1 Rachel Court, Information Specialist1
Jacoby Patterson, Honorary Clinical Research Fellow1 Jatinder Kaur, Academic Foundation Year Two Doctor3 John Green, Consultant in Medical Oncology4 Jill Colquitt, Senior Researcher2
Xavier Armoiry, Honorary Clinical Research Fellow1 and Professor of Pharmacy5
James Mason, Professor of Health Economics1 Lazaros Andronis, Senior Research Fellow in Health Economics1
Correspondence to: Dr Lazaros Andronis,
Division of Health Sciences, Warwick Medical School,
University of Warwick, Coventry, CV4 7AL.
Tel: +44 (0) 24 765 74490.
Email: [email protected]
Date completed: 13th March 2019
Source of funding: This report was commissioned by the NIHR HTA Programme as project
number 17/156/04
Declared competing interests of the authors
None

14
gefitinib, and these changes were considered clinically meaningful (mean scores diarrhoea: 19.88
vs 7.32, p<0.0001; sore mouth: 15.09 vs 3.51, p<0.0001).
Statistically significant differences in the EQ-5D absolute VAS score and utility index were
observed in favour of gefitinib.
Rates of any all-cause and treatment-related adverse events were similar between dacomitinib and
gefitinib. There were slightly higher rates of any all-cause and any treatment-related grade 3
adverse event and serious adverse events with dacomitinib (based on observation of the proportions
only), and dose reductions or temporary discontinuations were more frequently observed with
dacomitinib.
1.3 Summary of the ERG’s critique of clinical effectiveness evidence submitted
The CS systematic review of clinical effectiveness was generally well executed. Two studies that
the CS excluded from their broader review may have been eligible, however, these omissions would
not have affected the results seen. Overall the ERG considered there to be a low chance of
systematic error in the findings of the review.
The main clinical evidence for dacomitinib was drawn from the ARCHER 1050 trial which was a
multi-centre study comparison with gefitinib. The trial had a high risk of performance bias (owing
to the open-label design) but low risks of detection and attrition bias.
The ARCHER 1050 trial presents a number of potential issues in terms of representativeness to the
population of England and Wales. There were no UK sites participating in the trial. The proportion
of participants from European countries was approximately XXX. There was a high proportion of
Asian participants, the population was limited to two epidermal growth factor receptor (EGFR)
mutations only (albeit the most common ones), and the trial excluded people with brain metastases.
In addition, there are imbalances in potential prognostic factors between arms.
The ERG have no concerns about the analysis sets used in the ARCHER 1050 trial or with the
censorship and management of missing data used. The outcome measures appear appropriate. With
regard to the trial statistics, the CS did not justify why a one-sided p-value was used for PFS and a
two-sided p-value for OS and it is unclear to the ERG why there were different data time cut-off
points for these two key analyses. The company did not provide significance thresholds alongside
p-values presented throughout their submission, and it was unclear to the ERG whether formal

15
hypotheses were being tested or whether conclusions should be drawn, particularly for the sub-
group analyses. The ERG considers that caution is required in the interpretation of the analysis of
OS, as the proportional hazards assumption was violated. For patient reported outcomes, there was
no adjustment for multiple comparisons.
The CS undertook a network meta-analysis (NMA) comparing dacomitinib with afatinib. The ERG
agrees that other than the LUX-Lung 7 trial of afatinib versus gefitinib, there were no other relevant
trials for the comparison. The CS adequately described the methods of their NMA approaches and
provides a reasonable justification for using the fractional polynomial (FP) analysis. Despite this,
the ERG has concerns over the use of the FP analysis with respect to the extrapolations for the
survival outcomes but also because there are no detailed results or interpretation of the findings of
the FP analysis.
In addition, the CS does not adequately assess the included study populations for transitivity and
the ERG considers that the transitivity assumption may be violated. Finally, the CS does not present
results of the indirect comparison between dacomitinib and afatinib. Although caution is
recommended in the interpretation of the ERG analyses, these show no significant differences
between the two respective treatments for PFS or OS.
1.4 Summary of cost-effectiveness evidence submitted by the company
The CS included a systematic review of economic evidence, a review of evidence on resource use
and costs, a separate review to identify studies that measure health-related quality of life (HRQoL)
in people with non-small-cell lung cancer (NSCLC) patients, and an electronic partitioned survival
model built in a widely available spreadsheet application (Microsoft Excel ®).
The search for cost-effectiveness studies comparing the use of dacomitinib against other treatments
did not identify any relevant references. The majority of the studies identified evaluated the cost-
effectiveness of other treatments. Few relevant studies reporting resource use and costs were
identified.
The company constructed a partitioned survival model to trace a cohort of treatment naïve patients
with locally advanced or metastatic EGFR-positive NSCLC who may undergo treatment with
dacomitinib compared to gefitinib, erlotinib or afatinib. Partitioned survival modelling considers
the PFS and the OS curve directly, with the time in post-progression calculated using the difference

16
in area between the two curves. The company’s model comprised three health states: progression-
free, post-progression (progressed disease) (PD) and dead.
The model started from a hypothetical cohort of people reflective of the participants in the
ARCHER 1050 trial,1 all of whom began in the progression-free (PF) health state. Over time,
people were at risk of progression or death. Transitions between health states was unidirectional
and occurred at the end of each 28-day cycle, where people remained in the same health state or
progressed. In each cycle, people incurred costs and accrued benefits depending on the health state
they occupied. A half-cycle correction was applied in the base-case and the model concluded at a
15-year time horizon.
The company modelled PFS for gefitinib and erlotinib using a generalised gamma curve fitted to
the gefitinib arm of ARCHER 1050. They then performed a FP NMA to obtain time-varying hazard
ratios for afatinib and dacomitinib and apply these to the gefitinib extrapolation. The ERG found
the company’s predictions to be pessimistic and preferred a log-normal extrapolation and
alternative adjustments for the comparators.
Similarly, for OS the company used a generalised gamma curve for gefitinib and applied HR
obtained from FP NMA for the dacomitinib and afatinib. The ERG argues for a log-logistic
extrapolation for gefitinib and suggests assuming a HR of 1 from 3 years onwards for the
comparators.
Health-related quality of life values for the pre-progression health states were derived from the EQ-
5D collected from the ARCHER 1050 study,1 while utility values for the post-progression health
state were obtained from the literature.2 On clarification, the company provided utility values
collected from participants in ARCHER 1050 trial1 who were post-progression state at follow-up
visit (28-35 days following end of treatment visit).. The ERG preferred the use of these utility
values; hence they were included in the ERG’s base-case. The impact of treatment related adverse
events was not accounted for directly in the company’s base-case analysis, as it was assumed that
these would have been captured by EQ-5D data collected in the trial. However, the ERG argues
that it is unlikely that quality of life decrements associated with treatment related AEs are captured
by the EQ-5D, unless it is arranged for the instrument to be administered at the same time of these
events. Utility decrements (disutilities) were included in the ERG’s base-case for treatment related
adverse events.

25
3 Critique of company’s definition of decision problem
3.1 Decision problem
The company’s decision problem is as follows:
Population: People with untreated locally advanced or metastatic NSCLC with EGFR activating mutation(s).
Intervention: dacomitinib
Comparators: afatinib, erlotinib, gefitinib
Outcomes: overall survival (OS); progression-free survival (PFS); overall response rate (ORR); duration of response (DoR); adverse events (AE); health-related quality-of-life (HRQoL).
There are no subgroups in the NICE scope or in the company decision problem, and there are no
special considerations. The company’s decision problem is consistent with the NICE scope. The
evidence presented from the ARCHER 1050 trial has some deviations from the decision problem
as summarised in Table 1.
Table 1: Differences between the decision problem and the evidence provided in the CS.
Issue ERG comments
Population
The ARCHER 1050 trial population
have either exon 19 deletion
(del19) or exon 21 L858R (L858R)
substitutions.
This is a narrower population than all EGFR mutations as covered
in the scope. Clarification A10 confirms that these were the
established activating mutations at the time of design of the
ARCHER 1050 trial. The ERG clinical advisor states this has been a
common eligibility criteria in clinical trials. These two mutations
make up approximately 90% of EGFR mutations (clarification
response A4) but it is possible that the other mutations have less
favourable responses to treatment. The European Medicines
Agency (EMA) have published a positive opinion in January 2018
for dacomitinib monotherapy for the first‐line treatment of adult
patients with locally advanced or metastatic NSCLC with EGFR
activating mutations.9 The ERG notes that the FDA approval for
dacomitinib is in EGFR del19 or L858R substitutions specifically.10

31
However, of these potential comparator studies only one study was actually used in the comparison
because there were no links between the other studies in the network (discussed in Section 4.3).
This study, the LUX-Lung 7 trial27, 28 included participants who would match the decision problem
of the current appraisal (previously untreated adults with stage IIIB or IV NSCLC and EGFR
mutation positive). Appendix D.1.7 lists reference details for included studies and excluded studies
with reasons.
A PRISMA style flow-diagram with numbers is presented. Not all excluded studies were available
in the original CS, but these were subsequently provided in response to clarification request A2. A
two-stage study selection process was undertaken (titles and abstract screening, full paper
screening) by two independent reviewers with arbitration from a third reviewer if necessary, for the
main SLR. The CS does not state how studies were screened out of the network but the exclusions
appear appropriate.
4.1.3 Critique of data extraction
The approach to the data extraction is appropriate (data extraction was by two independent, blinded
reviewers and after reconciling differences a third reviewer could be included to reach consensus
for any remaining discrepancies, data were extracted in to a pre-specified extraction form).
4.1.4 Quality assessment
The company assessed the quality of the ARCHER 1050 RCT using NICE recommended criteria
(CS Table 15) and the Cochrane risk of bias tool (CS Appendix Table 75). There were some
differences in the company’s responses between these tools, which are summarised in Table 2. The
ERG generally agrees with the company’s judgements, and notes the potential performance bias
(systematic differences in care or in exposure to other factors) that may arise from the open-label
design. The risk of detection bias was considered to be low due to blinded IRC review of PFS and
ORR (details of how blinding was achieved was provided in clarification response A12).
There was a higher proportion of women (64.3% vs 55.6%) and people with ECOG PS 0 (33% vs
28%) in the dacomitinib arm compared with the gefitinib arm (Section 4.2). The reason for these
imbalances is unclear and could be due to selection bias (despite appropriate procedures in place)
or could be due to chance. The CS refers to the difference in proportions of females and males in
the trial (which is expected given higher frequency of EGFR mutations in females) but makes no

32
reference to the difference in the rates of females across the arms of the trials. Gender is a potential
prognostic factor (see Section 4.2.1). The CS states that generally there is no difference in outcomes
between ECOG PS 0 and 1, citing ARCHER 1050 as evidence. The ERG’s clinical advisor noted
that PS 0 and 1 are usually grouped together in trials, however there is evidence overall that ECOG
PS may be an independent prognostic factor (see Section 4.2). The risk of selection bias is therefore
uncertain.
The company gives the trial an overall judgement of high risk of bias due to the open-label design.
The ERG agrees with this as the trial has a high risk of performance bias (differences between
groups in care provided or in exposure to other factors), but notes that the risk of detection bias and
attrition bias is low.
Table 2: Risk of bias assessment of ARCHER 1050.
Assessment criteria Company response ERG response (Cochrane tool) NICE criteria
(CS Table 15)Cochrane tool (CS Appendix Table 75)
Method used to generate random allocations adequate?
Yes Low risk Low risk
Allocation adequately concealed?
Not applicablea Open label
study Low risk Low risk
Groups similar at the outset of the study in terms of prognostic factors?
Yes Low risk Imbalance in
gender and PSb
Care providers and participants blind to treatment allocation?
Not applicable Open label
study
High risk High risk
Outcome assessors blind to treatment allocation?
Low risk Low risk
Unexpected imbalances in drop-outs between groups?
No Low risk d
Low risk d Differences explained Were the statistical analyses
undertaken appropriate? c Yes
Evidence to suggest authors measured more outcomes than they reported?
No Low risk Low risk
Other bias NR Unclear Sponsored by pharmaceutical
company
Low risk No other bias
apparent
Overall judgement NR High risk
Open-label High risk
NR, not reported. aThe company’s response is referring to masking of treatment, rather than concealment of the allocation sequence, which the ERG considered appropriate as a central interactive web response system was used. b
Potential prognostic factors (although not an item on the Cochrane tool). cQuestion as worded in CS Table 15; the full question should be ‘Did the analysis include an intention to treat analysis? If so, was this appropriate and were appropriate methods used to account for missing data?’ dCochrane risk of bias criterion: Attrition bias due to amount, nature or handling of incomplete outcome data.

36
Table 4: Baseline characteristics in ARCHER 1050
Baseline characteristic Dacomitinib
N=227
Gefitinib
N=225
Male, n (%) 81 (35.7) 100 (44.4)
Female, n (%) 146 (64.3) 125 (55.6)
Age, years, median (range) 62 (28-87) 61 (33-86)
Age, years, mean (SD) 61.2 (11.26) 60.9 (10.17)
White, n (%) 56 (24.7) 49 (21.8)
Black, n (%) 1 (0.4) 0
Asian, n (%) 170 (74.9) 176 (78.2)
Japanese, n (%) 40 (17.6) 41 (18.2)
Mainland Chinese, n (%) 114 (50.2) 117 (52.0)
Other East Asian, n (%) 16 (7.0) 18 (8.0)
Never smoked, n (%) 147 (64.8) 144 (64.0)
Ex-smoker, n (%) 65 (28.6) 62 (27.6)
Smoker, n (%) 15 (6.6) 19 (8.4)
ECOG performance status 0, n (%) 75 (33) 62 (28)
ECOG performance status 1, n (%) 152 (67) 163 (72)
Stage IIIB at screening, n (%) 18 (8) 16 (7)
Stage IV at screening, n (%) 184 (81) 183 (81)
Unknown at screening a, n (%) 25 (11) 26 (12)
del19, n (%) 134 (59) 133 (59)
L858R, n (%) 93 (41) 92 (41)
a Newly diagnosed with stage IV at time of study entry.
There are more female compared with male participants in both treatment groups. The company
has referred to this in their summary and have stated that this was to be expected, given the higher
proportion of EGFR mutations in NSCLC occurring in females. Nonetheless, 64.3% are female in
the dacomitinib group compared with 55.6% in the gefitinib group. The CS states in section
B.2.13.2.2 that gender is not a prognostic factor for PFS in EGFR+ NSCLC, citing the ARCHER
1050 trial as evidence. The ERG has identified evidence which suggests that female gender may be
an independent prognostic factor for NSCLC, including in those with EGFR-mutation positive
NSCLC, summarised below.30-33 In addition, evidence suggests that females respond better to

47
dacomitinib were acneiform (XXX), diarrhoea (xxxx) and paronychia (xxxx), while those related
to gefitinib were and increase in ALT (xxxx) and AST (xxxx). All-causality adverse events are
presented in CS Table 24 and follow a similar pattern.
Specific adverse events resulting in dose reductions, temporary discontinuation and permanent
discontinuation are presented in CS Tables 26, 27 and 28, respectively. The most common all-cause
adverse events leading to dose reduction were dermatitis acneiform (20.3%), paronchyia (16.7%)
and diarrhoea (8.4%) for dacomitinib and increased ALT (2.7%) and AST (2.2%) for gefitinib. The
median time to dose reduction was 2.8 months (Inter-quartile range, IQR, 1.3–4.2 months) for
dacomitinib, with a median duration of 11.3 months (IQR 4.8–18.9 months). The median time to
dose reduction for gefitinib was 3.3 months (IQR 2.4–4.2 months); median duration 5.2 months
(IQR 2.5–7.9 months). Temporary discontinuation of dacomitinib resulted most commonly from
dermatitis acneiform (xxxxx), paronchyia (xxxxx) and diarrhoea (xxxx), and of gefitinib due to
increased ALT (xxxx) and AST (xxxx). Treatment-related adverse events leading to permanent
discontinuation of dacomitinib included dermatitis acneiform (xxxx) and diarrhoea (xxxx), and
those leading to permanent discontinuation of gefitinib included increased ALT (xxxx).
ERG summary: overall there were similar rates of all-cause and treatment-related adverse events
between dacomitinib and gefitinib. However, there were higher rates of any all-cause and any
treatment related Grade 3 adverse event and serious adverse events with dacomitinib (based on
observation of the proportions only), and dose reductions or temporary discontinuations were more
frequently observed with dacomitinib.
4.2.4 Other dacomitinib trials
The ERG identified five additional trials of dacomitinib 45 mg once daily in NSCLC to inform the
evidence base on adverse events (dose escalation studies were not considered). One of these36 was
undertaken in treatment naive patients, the rest were undertaken in previously treated patients
therefore a different patient population to the NICE scope (Table 9).
Phase 2 single-arm study (NCT00818441) of dacomitinib in advanced NSCSC
(adenocarcinoma subtype) as first-line treatment.36

73
5.2.6 Treatment effectiveness and extrapolation
Two clinical outcomes from ARCHER 1050 were used to inform the transitions between health
states in the model:
Progression-free survival
Overall survival
5.2.6.1 Time-to-event extrapolation
The company chose to extrapolate both PFS and OS using a combination of parametric and
fractional polynomial (FP) models. A generalised gamma model was fitted separately to both the
observed PFS and OS data of the gefitinib arm of ARCHER 1050 and extrapolated across the model
time horizon. The data used for PFS extrapolation was obtained from Wu et al. (data cut July
2016),1 whereas the OS data came from Mok et al. (data cut February 2017).29
Equivalent efficacy was assumed between gefitinib and erlotinib, whereas for afatinib and
dacomitinib, time-varying hazard ratios of their relative effects to gefitinib were estimated using a
FP network meta-analysis (NMA). The hazard ratios were then applied to the generalised gamma
extrapolation of gefitinib to predict PFS and OS for dacomitinib and afatinib. The ERG have
concerns over this approach, as the resulting extrapolations from FP models can be unstable and
extremely implausible. The company encountered this during their model selection process, and
excluded many FP models based on their implausibility. FP models offer benefits to traditional
parametric curves when fitting to survival data with unusual hazard profiles, but it is unclear
whether they offer a benefit when extrapolating.
5.2.6.2 Progression-free survival
The company selected a parametric curve for gefitinib through consideration of visual fit, goodness-
of-fit statistics and clinical plausibility. They also compared predicted quantiles to those observed
in ARCHER 1050. The parametric models had a similar visual fit, and the goodness-of-fit statistics
suggested that the Weibull, log-logistic and generalised gamma were the best fitting to the data.
The company’s clinical experts stated that whilst the 3-year estimates for the log-logistic and log-
normal were too optimistic, the 5-year estimates were realistic. The log-logistic and log-normal

84
It is apparent that the effect of afatinib relative to gefitinib decreases and appears to tend towards 1
across the time horizon of the model, which could be interpreted as a gradual waning effect.
However, the efficacy of dacomitinib appears to increase across the time horizon, with the hazard
ratio reducing. This results in a clear difference between the long term OS predictions for
dacomitinib and gefitinib (Figure 13), of which the ERG’s clinical advisor was unconvinced. When
applied to the log-logistic extrapolation, the company’s FP predicts xxx% alive on dacomitinib
compared to xxx% on gefitinib at 5 years.
The ERG are not aware of any evidence or clinical rationale to support this optimistic prediction
for dacomitinib, nor the contrast between the behaviours of the dacomitinib PFS and OS ratios.
Recall that for PFS, under the company’s FP NMA the HR for dacomitinib grew seemingly
exponentially, yet for OS the HR for dacomitinib improves constantly over time. Whilst for
afatinib, the PFS improved over time whilst the OS worsened. This contrast between afatinib and
dacomitinib is not supported by any clinical rationale, and sheds further doubt over the reliability
of the FP analysis extrapolations. The ERG did not consider the other single order FP model to be
an improvement in terms of plausibility, with the survival curves for dacomitinib appearing to be
almost identical.
Recall also that the company failed to provide evidence of a significant difference between
dacomitinib and afatinib for OS in their clinical section. The ERG considered alternative
approaches to the extrapolation of dacomitinib OS, including the assumption of equivalency of
dacomitinib and afatinib by assuming the FP OS HR from afatinib for both interventions. A
summary of the predictions made by the models explored by the ERG is presented in Table 24.

90
progression survival, and less common for the PFS benefits to be extended in post-progression
survival. Under the models fitted with ERG’s preferred PFS and OS assumptions, dacomitinib
provides an OS and PFS benefit over the comparators, but has a shorter post-progression survival
time, consistent with the scenario of the degree of the pre-progression benefit not being repeated in
the OS benefit as has been observed in ARCHER 1050.
Table 25: Comparison of pre-progression and post-progression survival gains
Scenario Pre Progression Incremental Life Years (Dacomitinib difference)
Post Progression Incremental Life Years (Dacomitinib difference)
Total Incremental Life Years (Dacomitinib difference)
Company Base-case
Dacomitinib xxxx xxxx xxxx Gefitinib/Erlotinib xxxxxxxxxxxx xxxxxxxxxxxx xxxxxxxxxxxx Afatinib xxxxxxxxxxxx xxxxxxxxxxxx xxxxxxxxxxxx
ERG PFS and OS log-logistic
Dacomitinib xxxx xxxx xxxx Gefitinib/Erlotinib xxxxxxxxxxxx xxxxxxxxxxxx xxxxxxxxxxxx Afatinib xxxxxxxxxxxx xxxxxxxxxxxx xxxxxxxxxxxx
ERG PFS and OS matched to Afatinib
Dacomitinib xxxx xxxx xxxx Gefitinib/Erlotinib xxxxxxxxxxxx xxxxxxxxxxxx xxxxxxxxxxxx Afatinib xxxxxxxxxxxx xxxxxxxxxxxx xxxxxxxxxxxx
ERG PFS and OS HR=1 at 3 years
Dacomitinib xxxx xxxx xxxx Gefitinib/Erlotinib xxxxxxxxxxxx xxxxxxxxxxxx xxxxxxxxxxxx Afatinib xxxxxxxxxxxx xxxxxxxxxxxx xxxxxxxxxxxx
ERG PFS and OS HR=1 at 4 years
Dacomitinib xxxx xxxx xxxx Gefitinib/Erlotinib xxxxxxxxxxxx xxxxxxxxxxxx xxxxxxxxxxxx Afatinib xxxxxxxxxxxx xxxxxxxxxxxx xxxxxxxxxxxx
ERG PFS and OS HR=1 at 5 years
Dacomitinib xxxx xxxx xxxx Gefitinib/Erlotinib xxxxxxxxxxxx xxxxxxxxxxxx xxxxxxxxxxxx Afatinib xxxxxxxxxxxx xxxxxxxxxxxx xxxxxxxxx
5.2.7 ERG’s exploratory survival analysis
5.2.7.1 Progression-free survival
The ERG investigated modelling separately the PFS of dacomitinib from ARCHER 1050 using
parametric models, and KM data followed by parametric models fitted to data beyond 8 month,
chosen because it was at this point that the KM curves separated. However, none of the parametric
curves produced using these models produced a better model than those discussed above. Since the

92
Table 26: List of adverse events included in the model
Adverse event Dacomitinib (n=227)
Gefitinib (n=224)
Afatinib (n=160)
Erlotinib*
ALT increased 2 (0.9%) 18 (8.0%) 0 (0.0%) 18 (8.0%)
Diarrhoea 18 (7.9%) 1 (0.4%) 21 (13.1%) 1 (0.4%)
Fatigue 0 (0.0%) 0 (0.0%) 9 (5.6%) 0 (0.0%)
Paronychia 17 (7.5%) 3 (1.3%) 3 (1.9%) 3 (1.3%)
Rash (grouped term) 55 (24.2%) 1 (0.4%) 15 (9.4%) 1 (0.4%) *Erlotinib assumed equivalent to Gefitinib (see Section B.2.9.1)
The ERG finds error in the company’s use of 7.9% as the proportion of patients experiencing
diarrhoea at Grade 3 or above. This is the cumulative value for Grades 3-4 but 0.4% patients
experienced grade 5 diarrhoea in the dacomitinib group which has not been counted. Therefore the
model input should have been 8.3% rather than the 7.9% used.
Additional data supplied by the company during the clarification process provided AE data per
cycle by frequency reported for grades 3 and above at a >2% threshold. Table 27 summarises this
new data showing a discernible difference between AE frequencies in patients from the >5% to
>2% level. (N.B. rash was not calculated due to lack of clarity as to how the company had defined
rash as a grouped term.)
Table 27: Treatment-related adverse events occurring in >2% of patients
Type of AE Dacomitinib n=227 Frequency (percentage)
Gefitinib n=224 Frequency (percentage)
Stomatitis XXXXX XXXXX ALT increase XXXXX XXXXX Diarrhoea XXXXX XXXXX Paronychia XXXXX XXXXX
The mix of AEs represented in table 27 shows the inclusion of stomatitis. Clarification data from
the company reported xxxxxxxxxxxxxxx. However, stomatitis is a dermatological AE commonly
associated with irreversible EGFR TKI inhibitors71 and showed clinically meaningful worsening in
HRQOL in dacomitinib patients assessed using the EORTC QOL questionnaire in ARCHER 1050.
Therefore, inclusion of stomatitis in AE data may be relevant and warranted. The further data
provided could not definitively show a low rate of recurrence as suggested by the company and to
which they attribute as the ability of clinicians to manage these events through dose reduction and
discontinuation. It is noted that dose reduction due to AEs was required in 64.8% of dacomitinib
patients versus 8.0% of gefitinib patients (see Table 7 and further discussion in clinical
effectiveness section).

94
“Patient reported outcomes were assessed at days 1 (baseline), 8, and 15 of cycle one, on day 1 of
subsequent cycles, at the end‐of treatment visit, and at the post‐treatment follow up visit.” 1 (p.
1456).
The company were able to provide these values during the clarification process which are presented
in Table 29.
Table 29: Summary of mean EQ-5D health index score.
Time point
Dacomitinib Gefitinib Median Mean 95% CI n Median Mean 95% CI n
End of treatment
xxxx xxxx xxxxxxxxxx 121 xxxx xxxx xxxxxxxxxx 145
Post- treatment
xxxx xxxx xxxxxxxxxx 75 xxxx xxxx xxxxxxxxxx 107
CI : confidence interval
The company did not recognize the post-treatment utility values from ARCHER 1050 as a PD
progression value, therefore it used a PD utility of 0.64 from the literature.2 (see Table 30). The use
of health utility scores resulting from the Labbé et al, 2017 study2 was well justified as an alternative
source of utility data as it represents real world data obtained from a longitudinal study of EGFR-
NSCLC patients directly from EQ-5D-3L. An alternative value from Nafees et al. (2008) sourced
in the systematic review was rejected by the company as this study did not meet the NICE reference
case.56 EQ-5D was not used and values were not derived from patients, therefore it was not
considered a robust source. In addition, a recent repeat of this study by Nafees et al. in 2017 that
was identified in the systematic review, reported a PF value of 0.883 and PD of 0.166,65 which
further demonstrates the unreliability of the original Nafees et al. (2008) study.50
The health state utility values obtained from the Labbé, 2017 study2 would be the ERGs preferred
source of utility values from the literature. The ERG finds the company’s reasoning for using these
values over the Nafees, 200850 compelling and appropriate. Similarly, the ERG finds the health
state utility values used by Huang (2017)52 equally less convincing for use in the model as the
KEYNOTE-024 trial was directed at patients specifically without EGFR-activating mutations or
ALK translocations.
However, whilst the ERG considers the Labbé et al, 20172 values appropriate for use in scenario
analysis (when both the PF value of 0.77 and PD value 0.64 are used simultaneously) it prefers the
use of PD scores obtained from the ARCHER 1050 trial to be used in the base-case. This continues

117
Table 46: Results of base-case scenario analysis for the comparison between dacomitinib and afatinib.
Scenario Dacomitinib Afatanib ICER % changeTotal
LYs Total QALYs
Total costs
Total LYs
Total QALYs
Total costs
Base-case xxxxx xxxxx xxxxxxx xxxxx xxxxx xxxxxxx xxxxxxx x Gefitinib survival projection (PFS)
xxxxx xxxxx xxxxxxx xxxxx xxxxx xxxxxxx xxxxxxx xxx
Gefitinib survival projection (OS)
xxxxx xxxxx xxxxxxx xxxxx xxxxx xxxxxxx xxxxxxx xxxx
FP model (PFS)
xxxxx xxxxx xxxxxxx xxxxx xxxxx xxxxxxx xxxxxxx xxx
FP model (OS)
xxxxx xxxxx xxxxxxx xxxxx xxxxx xxxxxxx xxxxxxx xxx
NMA methodology (PFS and OS)
xxxxx xxxxx xxxxxxx xxxxx xxxxx xxxxxxx xxxxxxx xxx
Utility (PF - ARCHER) with AEs
xxxxx xxxxx xxxxxxx xxxxx xxxxx xxxxxxx xxxxxxx xx
Utility (PF - Labbé) with AEs
xxxxx xxxxx xxxxxxx xxxxx xxxxx xxxxxxx xxxxxxx xx
Treatment beyond progression
xxxxx xxxxx xxxxxxx xxxxx xxxxx xxxxxxx xxxxxxx xxxx
The company presented results for the PSA undertaken around the outcome cost per QALY gained.
In general, the company used appropriate distributions around the model input parameters varied.
However, the ERG noted that distributions could have been placed around other inputs to reflect
the uncertainty, instead of keeping these inputs fixed. A range of sensitivity and scenario analyses
were undertaken. These results showed that the discount rate applied to benefits, using the log-
logistic parametric curve to model OS for gefitinib and including treatment beyond progression
were the key drivers to the ICERs and including treatment beyond progression.

122
Figure 25: Tornado diagram for the comparison of dacomitinib versus afatinib, using the list prices
Company’s scenario analysis results (all treatments at list prices)
The results for each change made and the impact to the base-case results are presented in Table 50
through to Table 52 for the comparison between dacomitinib and the comparators, using the list
prices. As seen in these tables, under the scenario of using log-logistic parametric curves for OS
and including treatment beyond progression had the greatest impact to the base-case ICER for
dacomitinib against all comparators.
155
64. National life tables: UK. Office for National Statistics; 2018. URL:
https://www.ons.gov.uk/peoplepopulationandcommunity/birthsdeathsandmarriages/lifeexpectanci
es/datasets/nationallifetablesunitedkingdomreferencetables (Accessed 10 Feb 2019).
65. Nafees B, Lloyd AJ, Dewilde S, Rajan N, Lorenzo M. Health state utilities in non-small
cell lung cancer: An international study. Asia Pac J Clin Oncol 2017;13(5):e195-e203.
http://dx.doi.org/10.1111/ajco.12477
66. Brown J, Cook K, Adamski K, Lau J, Bargo D, Breen S, et al. Utility values associated
with advanced or metastatic non-small cell lung cancer: data needs for economic modeling.
Expert Rev Pharmacoecon Outcomes Res 2017;17(2):153-64.
http://dx.doi.org/10.1080/14737167.2017.1311210
67. EQ-5D-3L: Health Questionnaire: English version for the UK. Rotterdam, The
Netherlands: EuroQol URL: https://euroqol.org/wp-
content/uploads/2016/10/Sample_UK__English__EQ-5D-
3L_Paper_Self_complete_v1.0__ID_23963.pdf (Accessed 7 February 2019).
68. Curtis LA, Burns A. Unit Costs of Health and Social Care 2017. Canterbury, UK:
Personal Social Services Research Unit, University of Kent; 2017. URL:
https://doi.org/10.22024/UniKent/01.02/65559 (Accessed 3 February 2019).
69. NHS Improvement. 2016/17 reference cost data. 2017. URL:
https://improvement.nhs.uk/documents/3479/201617_ReferenceCostData.zip (Accessed 25
October 2018).
70. Brown T, Pilkington G, Bagust A, Boland A, Oyee J, Tudur-Smith C, et al. Clinical
effectiveness and cost-effectiveness of first-line chemotherapy for adult patients with locally
advanced or metastatic non-small cell lung cancer: a systematic review and economic evaluation.
Health Technol Assess 2013;17(31):1-278. http://dx.doi.org/10.3310/hta17310
71. Melosky B, Leighl NB, Rothenstein J, Sangha R, Stewart D, Papp K. Management of
EGFR TKI-induced dermatologic adverse events. Curr Oncol. 2015;22(2):123-32

159
Appendix Table 5. Exploratory results, fitting the log-logistic parametric curve to OS data for gefitinib (dacomitinib PAS vs. comparators assumed PAS)
Treatment Expected mean costs (£)
Incremental costs (£)
Expected mean QALY
Incremental QALY
ICER (£)
Gefitinib xxxxxxx x xxxx x x
Erlotinib xxxxxxx xxx xxxx xxxx Xxxxxxxxx
Afatinib xxxxxxx xxxxxx xxxx xxxx Xxxxxxxxxxxxxxxxxxx
x Dacomitinib
xxxxxxx xxxxxxx xxxx xxxx xxxxxxx
ICER, incremental cost-effectiveness ratio; QALY, quality adjusted life years gained
Appendix Table 6. Exploratory results, fitting the log-logistic parametric curve to OS data for gefitinib (all treatments at list prices)
Treatment Expected mean costs (£)
Incremental costs (£)
Expected mean QALY
Incremental QALY
ICER (£)
Erlotinib xxxxxxx x xxxx x x
Gefitinib xxxxxxx xxxxxx xxxx xxxx Xxxxxxxxx
Afatinib xxxxxxx xxxxxxx xxxx xxxx Xxxxxxxxxxxxxxxxxxx
x Dacomitinib
xxxxxxx xxxxxxx xxxx xxxx xxxxxxx
ICER, incremental cost-effectiveness ratio; QALY, quality adjusted life years gained
OS, log-logistic curve to OS data for gefitinib and assumed equal efficacy, on the hazard
scale, from 36 months onwards
Here, we fitted the log-logistic parametric curve to the OS data for gefitinib and assumed a hazard
ratio of 1 is applied from 36 months onwards. Applying a HR=1 results in reduction to the post-
progression survival and thus post-progression QALYs (results not shown). For comparison (i)
afatinib is associated with an approximate ICER of xxxxxxx per QALY as compared to gefitinib.
The ICER for dacomitinib compared to afatinib is approximately xxxxxxx per QALY. Under
these assumptions resulted in an increase to the ICERs. (see Appendix Table 7). For comparison
(ii), the ICER for afatinib (versus gefitinib) and dacomitinib (versus afatinib) are over xxxxxxx
and xxxxxxxx per QALY, respectively (Appendix Table 8).