site disturbance and archaeological integrity€¦ · site formation processes are frequently...
TRANSCRIPT

1Number 70, June 2010
AbstractBend Road is an open site covering c.12 hectares on a sand sheet formation in southeast Melbourne, now bisected by the new Mitcham-Frankston tollway. Results from earlier salvage archaeology suggesting this was a significant scientific site were subsequently questioned on geomorphological grounds that indicated post-depositional disturbance. In 2006 the authors carried out extensive and detailed excavations and analyses that indicated that while both large-scale aeolian deflation events and smaller-scale bioturbation could be demonstrated, paradoxically the archaeology retained a clear coherence. While the bulk of the archaeology relates to the backed artefact period – the site has now yielded hundreds of asymmetric points and geometric microlith forms from the late Holocene – an earlier sequence extends back to 30–35,000 BP, putting Bend Road amongst the oldest known sites in Victoria. This paper summarises the methodological procedures and results that reflect both the natural disturbances to the site and the data that demonstrate its archaeological integrity, and points to a growing imbalance between increasingly sophisticated dating techniques available to the archaeologist and the levels of scale and resolution that usually pertain in archaeological sites.
Context, Site Formation, Taphonomy and BioturbationHiscock (2008:37) has recently re-emphasised the need to
pay close attention to the depositional contexts from which
archaeological data are excavated. Site formation processes
are frequently ignored in site reporting while researchers rely
ever more heavily on an array of sophisticated techniques, and
especially radiometric dating of smaller and smaller samples,
where context is increasingly crucial. Paradoxically, peer
group reviews of archaeological claims most frequently attack
contentious data by questioning site integrity (e.g. Allen and
O’Connell 2003; Hiscock 1990; Roberts et al. 2001). Where
interpretations depend on artefacts being in situ, it needs to
be demonstrated rather than assumed that they have not been
moved after deposition.
Earlier archaeologists (e.g. Binford 1964:424; Childe 1956:1
among many others) failed to recognise that artefact patterning
in sites might not merely reflect human behaviour but also
chemical, physical and biological post-depositional processes.
Today such processes are well-known and widely documented
(e.g. Armour-Chelu and Andrews 1994; Canti 2003; Dibble et
al. 1997; Hole 1961; Nash and Petraglia 1987; Rick 1976; Schiffer
1972; Solomon et al. 1990; Wood and Johnson 1978). Hole
(1961) defined nine forms of post-depositional disturbance:
faunalturbation, floralturbation, cryoturbation, graviturbation,
argilliturbation, aeroturbation, aquaturbation, crystalturbation
and seismiturbation. In Australia we are not greatly troubled
by some of these, such as earthquakes or freezing and thawing,
but others are common. While we do not have the range of
burrowing animals seen elsewhere in the world, the introduced
rabbit has damaged sites (e.g. Bird and Frankel 2001:51-52) and
tree root intrusion is commonplace, even if rarely reported.
Direct discussions of taphonomic processes in Australian
sites have been infrequent. Stockton (1973) investigated
artefact displacement by scuffage and treadage at Shaw’s Creek
rockshelter. Artefact redistribution by birds has been noted (Cane
1982; Solomon et al. 1986) and studies have been undertaken to
distinguish bone deposits laid down by humans from those of
owls (e.g. Cosgrove 1995a; Geering 1990) or scavengers such as
dingoes (e.g. Huchet 1990; Solomon and David 1990). Cameron
et al. (1990) have studied the effects on surface sites of both
matrix deflation and accumulation and more recently the effects
of slope and rainfall flow on surface sites has been studied by
Fanning and Holdaway (2001).
Much less attention has been paid in Australia to the effects
of bioturbation, particularly by smaller organisms like worms,
ants or beetles. Termites, some species of which can tunnel up
to 50m below the surface and deposit up to one tonne of soil
per hectare per year on the surface (Cahen and Moeyersons
1977; Coventry et al. 1988; Holt and Lepage 2000), have been
recognised in tropical sites in Australia, but their impacts have
not been closely investigated. Smith et al. (1997) recognised
bioturbation by invertebrates at Puritjarra rockshelter in
Central Australia but did not identify any immediate effects
on the archaeological record there. Watson and Flood (1987)
reported termites at Green Ant Shelter 1 and Echidna Shelter
but dismissed serious bioturbation because they saw no signs
of disturbance and no inversions in the radiocarbon dates.
On the basis of Watson and Flood’s findings, Huchet (1990)
dismissed significant disturbance by termites at Pleistocene-aged
Yam Camp rockshelter on Cape York although ‘a large termite
mound … presently stands about 2m away from the excavated
area’ (1990:67; see also Morwood and Dagg 1995:Figures 9.3 and
9.4). Since this mound is c.2m high and comprises c.1 tonne
of sand grains derived mostly from the archaeological deposit,
the intactness of the site is questionable. One consequence of
continuous deep soil churning by termites is that many natural
stones sink to form ‘stone lines’ (e.g. Williams 1968, 1978). Stone
artefacts can do the same thing and it is suggestive that at Yam
Camp Morwood and Dagg (1995:114) identify artefact peaks at
SITE dISTURBANCE ANd ARCHAEOLOGICAL INTEGRITY:The Case of Bend Road, an Open Site in Melbourne Spanning Pre-LGM Pleistocene to Late Holocene PeriodsGeoff Hewitt and Jim Allen*
Archaeology Program, School of Historical and European Studies, La Trobe University, Bundoora, VIC 3083, Australia [email protected], [email protected]* Corresponding author

2 Number 70, June 2010
Site Disturbance and Archaeological Integrity
the base of the excavation in the two squares nearest this termite
mound. More recently McNiven et al. (2009) attributed size
sorting of stone artefacts in the lower levels of Kabadul Kula
rockshelter in Torres Strait to either invertebrate bioturbation,
rootlet penetration, rainwater percolation or treadage. Vectors of
bioturbation present at the site include termites, ants and cicadas
(McNiven et al. 2009:35). Lastly the possible site-disturbing
effects of termite tunnelling in Nauwalabila has been canvassed
by O’Connell and Allen (1998) and Allen and O’Connell (2003).
Because termite activity may homogenise a deposit there may be
no visual indication in the stratigraphy and termite bioturbation
might only be detected through unusual artefact density peaks
or other aberrant data such as artefact size sorting with depth, as
with Kabadul Kula where stone artefacts in the lower strata of the
site are significantly smaller than those above them.
Less is known about earthworms in Australia. Many species
appear to feed on vegetation litter and thus may be confined to
the upper levels of sites, unlike in Europe and the United States
where their effects on soil profiles are well-known (e.g. Armour-
Chelu and Andrews 1994; Canti 2003; Stein 1983). Since they
appear to dislike extremes in acidity/alkalinity and temperature
they may be of less importance in bioturbating Australian sites.
On the other hand, archaeologists generally assume that any
level of a site was once a surface, so worm bioturbation should
not be readily dismissed. Surface ant nests indicate the degree to
which ants can reorganise local landscapes and, from experience
at Bend Road, burrowing black ants can create vertical tunnels
to small nests up to 600mm below the ground (see below). Other
species such as cicadas and dung beetles nest underground and
can dig tunnels up to 300mm in length. We consider bioturbation
at Bend Road later in the paper.
Bend RoadHere we report a case where excavation began with the
expectation that a large sand sheet site in suburban Melbourne
named ‘Bend Road’ was so disturbed that its only scientific
interest was the chance to identify markers and vectors of site
disturbance. While many were identified, we also found that the
archaeology maintained a general stratigraphic coherence that
provided an overall integrity to the conclusions that could be
drawn from it. We contend that many Australian sites might be
similar in this respect, but we are unaware of any that have been
reported. Elsewhere there is a precedent in the Dry Creek site in
Alaska (Thorson and Hamilton 1977, cited in Wood and Johnson
1978) where six of the nine turbative processes described by
Hole (1961) have been recognised but where the site maintains
sufficient contextual and stratigraphic integrity to provide
meaningful interpretations of the archaeology and palaeoecology.
Excavations carried out at Bend Road are detailed in
Hewitt and de Lange (2007) and Allen et al. (2008). This
paper synthesises data relating to geomorphological processes,
bioturbation, stratigraphies, artefact distributions, artefact
conjoining and radiometric dating on the site. Many vectors of
bioturbation including ants, worms, beetles, rabbits and humans
were identified, but more dramatic were large-scale aeolian
deflation and accumulation events creating and reorganising the
sand deposit itself on an unknown number of occasions.
Deflation events in sand sheet deposits are at best of low
archaeological visibility and frequently invisible. They are mostly
identified by unusual dispositions of artefacts in the deposits
and/or fine-grained radiometric dating programmes, together
with soil particle analyses and other geomorphic assessments.
Here we contend that if post-depositional disturbance does
not necessarily compromise the integrity of an archaeological
deposit beyond measurable or predictable limits, then some
archaeological sites will maintain scientific importance despite
variable degrees of reworking. Bend Road is such a site.
If the Bend Road situation is not unusual then it has important
implications. It is widely assumed that the demonstration of
any stratigraphic disturbance in a site is sufficient to dismiss its
archaeological relevance. For example, Roberts et al. (2001) base
their criticism of Cuddie Springs on the fact that OSL dating
samples contained younger and older sand grains. Single grain
analysis identified ‘multiple discrete populations’ that implied
that ‘some sediment mixing had occurred.’ Similar sediment
mixing in some Bend Road OSL samples led the dating scientist
involved (Matt Cupper, University of Melbourne, pers. comm.,
2007) to draw similar conclusions about Bend Road.
However the Bend Road archaeology suggests that this
should not be an either/or proposition. Here, multiple instances
of ‘large-scale’ post-depositional disturbance and bioturbation
can be demonstrated which do not undermine the coherence of
the archaeological sequence.
The Site and its Archaeological HistoryBetween January and August 2006 the authors carried out
archaeological excavations at Bend Road on behalf of La Trobe
University for contractors constructing a tollway from Mitcham
Figure 1 Location map of the Bend Road site. Site shaded on the inset. The Mitcham to Frankston tollway is shown as a dotted line.
Figure 2 Bend Road, showing the locations of Pits A and B and Trench 3 (Photograph: Courtesy of the Southern and Eastern Integrated Transport Authority).

3Number 70, June 2010
Geoff Hewitt and Jim Allen
to Frankston, in southeast Melbourne. At Keysborough, near
Dandenong, the tollway passes directly through an open sand
sheet site registered as AAV 7921-0735/6, but known as ‘Bend
Road’ after the road that bisected the site prior to tollway
construction (Figures 1-2).
The site is located on an undulating sand promontory jutting
out into the northern end of Carrum Swamp, drained for
farmland in the late nineteenth century. On the surface the site
reflects extensive European alteration with house rubble, fences,
drains and other structures evident. Until recently the northern
end of the site was a large chicken farm. Carrum Swamp,
extending c.20km from Dandenong to Frankston, formed a
basin in the Port Phillip sunkland (Cupper et al. 2003:346). It
comprised a ‘core’ swamp between sand barriers nearer to Port
Phillip Bay that included marshland and permanent water
bodies, and further inland a larger area of flood-prone alluvial
flats. Near the site these flats may have dried out seasonally so
that Aboriginal use of this resource was also likely to have been
seasonal. Ethnographic accounts suggest that birds, eggs, fish,
yabbies, shellfish, eels and edible swamp plants, together with
the focus the swamp provided for foraging terrestrial marsupials,
would have made the area an important resource for Aborigines,
especially in spring. In summer people traditionally moved
nearer to the coast (Long 2008).
Carrum Swamp was fed by Dandenong Creek, which
debouched onto the basin floor adjacent to the Bend Road
promontory. Thus the immediate location provided freshwater
and swamp resources that indicate a preferred camping and
foraging location.
Original surveys for the tollway (Vines 1997, 2003) identified
the Bend Road sand sheet as a likely site location occupying an
area c.600m x c.200m (Figure 3). In 2005 subsurface testing was
undertaken by Tardis Enterprises Pty Ltd (2005). Tardis dug c.36
transects by backhoe, some in excess of 100m long, and sieved
a proportion of the deposits through 7mm mesh mechanical
sieves. Recovered stone artefacts, the only cultural data present,
were briefly described and quantified in the field (Tardis 2005).
Tardis concluded the area was of scientific significance and
that deposits below the plough zone were generally in situ. The
contractors commissioned a peer review of the Tardis report.
Long and Hughes (2005) argued on the available geomorphic
evidence and the assumed effects of wind deflation and
bioturbation that interpretations of artefact distributions in the
site were problematic.
Subsequently Hughes reopened some of the Tardis transects
to gather further evidence. Hughes (2005, 2006) noted mottling
in the sections that he interpreted as small-scale bioturbation
possibly caused by rootlets. He also considered the depths and
distributions of distinctive backed bladelets and geometric
microliths, here referred to as backed artefacts, after Hiscock and
Attenbrow (2005), a.k.a. ‘Bondaian’(see Attenbrow 2002, 2004).
These artefacts are most common in southeast Australia in mid-
to-late Holocene contexts (but see Hiscock and Attenbrow 1998;
Slack et al. 2004 for older examples). According to Tardis (2005)
these artefacts tended to concentrate at around 400mm below
the surface in sand deposits 0.8m to 1.4m deep, but Hughes
noted that Tardis reported that in 16 of their transects backed
artefacts occurred at the base of the sand sheet in six cases and
within 200mm of it in seven others.
Hughes concluded that if backed artefacts were in situ as
argued by Tardis, then the whole sand sheet was of mid-to-
late Holocene age. However Hughes could find no persuasive
explanation for sand sheet development on such a scale at such a
recent time and concluded that the sand sheet probably formed
at or after the LGM. If the sand sheet was late Pleistocene in age,
backed artefacts at its base could not be in situ.
Satisfactory resolution of this problem required
further excavation.
Here we synthesise only the pertinent data from three areas
of hand excavation (Pits) and three mechanically dug trenches
(Trenches) that were dug by us.1
Hand Excavated PitsThree pit areas were excavated by hand using either 25mm deep
or 50mm deep arbitrary spits in the absence of stratigraphy
that was not visible while excavating. All artefacts not disturbed
by trowelling were recorded in three dimensions using an
Electronic Distance Meter. All residues were wet-sieved through
3mm mesh sieves.
Pit A comprised a 3m x 4m rectangle excavated as 12 x
1m x 1m squares. No new spit in any square was begun until
the previous spit had been removed from all 12 squares, thus
affording good stratigraphic control between squares across the
whole pit. A total of 1709 artefacts were recovered from this area.
Figure 3 Site ground plan showing pits and trenches discussed in the text and their relationship to the tollway. Shaded area represents the sand sheet.

4 Number 70, June 2010
Site Disturbance and Archaeological Integrity
Pit B grew as an irregular but contiguous excavation
comprising 12 x 1m x 1m squares. It is 330m north of Pit A.
Spits between squares in Pit B were correlated by spit depth
measurements when required. A total of 2913 artefacts were
recovered from this area.
Pit C is a cluster of three smaller excavations at the southern
end of the site separate from each other but all adjacent to Trench
3 (see below). Pit C1 is c.45m southeast of Pit A and comprised a
1m x 2m pit running north-south. Pit C2 located 8.5m south of
Pit C1 was a 1m x 2m pit running north-south. Pit C
3, 5.5m south
of Pit C2, comprised a 1m x 3m pit running north-south. A total
of 728 artefacts were recovered from the Pit C area.
Mechanically Excavated TrenchesThree trenches, each with a different excavation history, provided
relevant information.
Trench 1 was dug as a toe drain by the road contractors. It is
c.200m long, running roughly north-south in the northwestern
part of the site. We recorded 11 x 1m wide stratigraphic sections
at regular intervals along the western face and undertook a small
excavation into sterile basal deposits of this trench near Pit B.
Trench 2 was mechanically excavated and partly sieved
by Tardis as their Transect A2. It is c.120m long and lies
approximately east-west across the site. We recorded 16 x 1m
wide stratigraphic sections at regular intervals on the northern
face of this trench after reopening it.
Trench 3 was dug by us at the request of the Traditional
Owners. It lies north-south, intersecting at its northern end with
Trench 2, c.5m east of Pit A and concluding at its southern end
at the edge of the Holocene swamp (and beyond the sand sheet)
a distance of 80m. The strategy was to remove spits 3m long,
1.5m wide (the width of the backhoe bucket) and 100mm deep
down to the sterile coffee rock layer. Deposit was passed through
mechanical sieves using a 7mm mesh. Wet-sieving was employed
as required. We recovered 2865 artefacts from this trench. After
each spit was dug the trench wall on both sides was cut back
by hand to ensure that the backhoe bucket did not disturb the
sections when re-entering the trench. We recorded 12 x 1m
wide stratigraphic sections and one 3m wide section at regular
intervals along this trench. Further stratigraphy in this location
was recorded in the Pit C cluster of pits.
In all, the sample comprises data from 31m2 of hand excavation
and c.120m2 of mechanical excavation and stratigraphic
information from 60m of sections in the excavations and 40m
of sections sampled from the 400m of exposed trench sections
running both north-south and east-west across the site. This
strategy provided an extended sample not normally available in
Australian excavations. The excavations yielded 8215 artefacts; all
of these were analysed, together with two collections preserved
from the earlier Tardis work, one thought by Tardis to be a
backed artefact ‘flaking floor’. These increased the sample by
421 artefacts. The site yielded 268 backed artefacts, the largest
excavated collection of such tools in Victoria.
Stratigraphy
Coffee RockCoffee rock forms the basal substrate that underlies the
archaeological sands everywhere but at the peripheries of the
site. Coffee rock is formed within a sand body when iron leached
from the non-quartz mineral component of the sand by water
rich in organic acids is concentrated within a horizon causing
sand grains at that level to become cemented and stained by iron
oxides or iron/organic complexes. Either or both of two processes
may be involved at Bend Road: the percolation of surface water
down through the sand sheet and/or the prolonged contact of
sand and groundwater at the level of the water table. The current
sand sheet may not be thick enough to produce the coffee rock
layer by the first method (Meredith Orr, Monash University, pers.
comm., 2006), but it may have formed beneath a larger and earlier
sand sheet, perhaps being sufficiently impervious to permit
further coffee rock development on a ‘perched’ water table.
Coffee rock is present in two distinct forms at the site. In the north,
in Pit B and in most of Trench 1 it comprises an unbroken layer, but
one whose surface is uneven and pitted. In the south, in Trenches 2
and 3 and Pits A and C, the coffee rock occurs as rubble probably
caused by exposure at the LGM (Figure 4). Stone artefacts, argued to
be lagged, occur within the coffee rock rubble in the southern part
of the site but are absent within the unweathered coffee rock in the
northern part of the site. These artefact distributions offer support
for our interpretation that the coffee rock in the south was exposed
at the LGM and turned to rubble at that time. The sands and clays
underlying the coffee rock are also archaeologically sterile.
Incidental exposures of coffee rock in Trenches 1 and 2 suggest
that it varies in thickness between c.150mm and c.300mm.
Beneath it cemented sands and clays are frequently mottled
in colour from grey to brown, orange and red. In Trench 1 a
hole was dug 500mm below the base of the coffee rock through
these cemented sands. An OSL sample near the base of this hole
(the first available level to allow extraction of a dating sample)
returned a date of 126,500±7200 BP (KB15).
Figure 4 Basement coffee rock (a) intact in Pit B (Photograph: Geoff Hewitt) and (b) in rubble form in Pit A (Photograph: Rudy Frank).
A
B

5Number 70, June 2010
Geoff Hewitt and Jim Allen
Overlying Sand SheetBend Road sands form part of the larger Cranbourne Sands, an
extensive belt of aeolian sands trending northwest/southeast
northwards from the head of Westernport Bay (Cupper et al.
2003:354). Watchman (2006) concluded that the mineralogy
and surface texture of the Bend Road sands indicated that they
have been subject to polycyclic weathering that has removed all
minerals other than quartz. The grains are highly rounded and
frosted and have been recycled as wind-blown sand perhaps for
hundreds of thousands of years (Hughes 2006).
Stratigraphic change within the sand sheet could not easily
be detected while excavating but was visible in section. Figure
5 gives six examples of the stratigraphy from widely separated
localities across the site. While specific differences between them
are apparent, similarities and consistencies between them allow
an overall stratigraphic sequence to be proposed.
Unit 1. Everywhere a sharply delineated grey sand unit
normally 250–300mm deep was defined as a ‘plough zone’.
European artefacts – glass, ceramics and metal – were common
in this zone but rarely found below it. Occasional holes had been
dug into the underlying sands from this unit. These included a
horse burial in Pit A and a 2m deep drainage channel in Trench 2.
Unit 2. Occasionally separating Units 1 and 3 was a thin
(<100mm) layer described in the field as dry sand, light grey
sand or disturbed grey sand. This layer is of minor significance
and perhaps should be included with the disturbed Unit 1.
Unit 3. This is a large unit frequently up to 500mm thick.
In places such as Pit B the upper 100–150mm of this unit may
be separated out as a distinct compact grey sand unit, but this
may merely reflect a different late prehistoric use of this part of
the site. Mostly Unit 3 comprises compact or undifferentiated
brownish-grey sand. In places this sand is visibly mottled with
lighter yellow blotches, considered by Hughes (2006) to reflect
rootlet activity, but we believe that it reflects ant activity. As
discussed below, ants at Bend Road are an important vector of
small scale bioturbation.
Importantly Unit 3 can be subdivided into an upper Unit 3a
and a lower Unit 3b, not on stratigraphic grounds, but by the
presence of backed artefacts in the upper part of this unit and
their absence below. This division is also marked by an important
change in the soil particle size analyses (see below).
Unit 4. Over most of the site the sand underlying Unit 3
is light grey, almost ‘white’, while elsewhere it is mottled with
incipient coffee rock, stained sand nodules that give the layer a
darker, browner colour.
Unit 5. This unit occurs in discrete patches and pockets in
the southern part of the site (Trench 2, Pit C1) where it is always
located between Unit 4 and the coffee rock (Unit 7). It comprises
clayey white sand that is moister than the overlying sands.
Although labelled as Unit 5 we cannot determine its stratigraphic
relationship with Unit 6 so we cannot determine which is earlier
and which is later. On depth below surface this unit is deeper but
depth is a poor indicator of temporal relationships on this site
(see caption for Table 1).
Unit 6. This comprises moist dark brown sand that sits
immediately above the intact coffee rock (Pit B, Trench 1). It
is assumed that this is a causal relationship where this unit is
either discoloured by the coffee rock and/or is in the process
of becoming coffee rock. Stratigraphically its relationship with
Unit 5 is unclear because the two units nowhere intersect; each
represents the immediate unit above the coffee rock. On the basis
of the OSL dates (see below) Units 5 and 6 appear to be generally
contemporaneous.
Unit 7. Coffee rock.
Unit 8. Underlying cemented sands and clays.
At the southern end of Pit C2 and throughout Pit C
3 (both
areas being beyond the extent of the coffee rock) Unit 3 overlies
dark lacustrine clays and cemented sterile sands. Elsewhere
cemented sands and clays beneath the coffee rock were exposed
in Trenches 1 and 2.
Areal Distributions of the Stratigraphic UnitsThe three trenches exposed the lateral extent of the major
stratigraphic units across the site. The southern ends of Trenches
1 and 3 and the eastern end of Trench 2 comprise the Holocene
swamp margins. Unit 7, the coffee rock, terminates c.20m
short of these margins. Unit 6, seen only in Trench 1 and Pit
B, corresponds in distribution to the coffee rock. Units 4 and 5,
considered to be Pleistocene sands, are further restricted, being
10–20m inside the coffee rock boundaries. In contrast, Units 1–3,
Holocene sands, extend to the swamp margins.
Pit C2 was excavated to examine the termination of the
coffee rock layer in Trench 3. Here the basal deposits reveal
a stratigraphic succession with the coffee rock overlain by
archaeologically sterile cemented sandy clay of unknown age and
lastly with black lacustrine clay interpreted as swamp deposit.
These deposits are directly overlain by artefact-bearing sand
that yielded a date of 16,300±1900 BP (KB18), providing direct
evidence of at least an intermittent swamp at Bend Road during
the late Pleistocene. As with the late Holocene, swamp resources
and available freshwater are likely to have provided the focus for
Pleistocene human occupation.
Figure 5 Six examples of the Bend Road stratigraphy from widely separated areas in the site. Numbers are the stratigraphic units described in text. (a) Pit B, west baulk, square DN3; (b) Trench 1, section DS8; (c) Pit A, north baulk, square D4; (d) Trench 3, section S6; (e) Trench 2, section S7; (f) Pit C1, east baulk, square N.
6 Number 70, June 2010
Site Disturbance and Archaeological Integrity
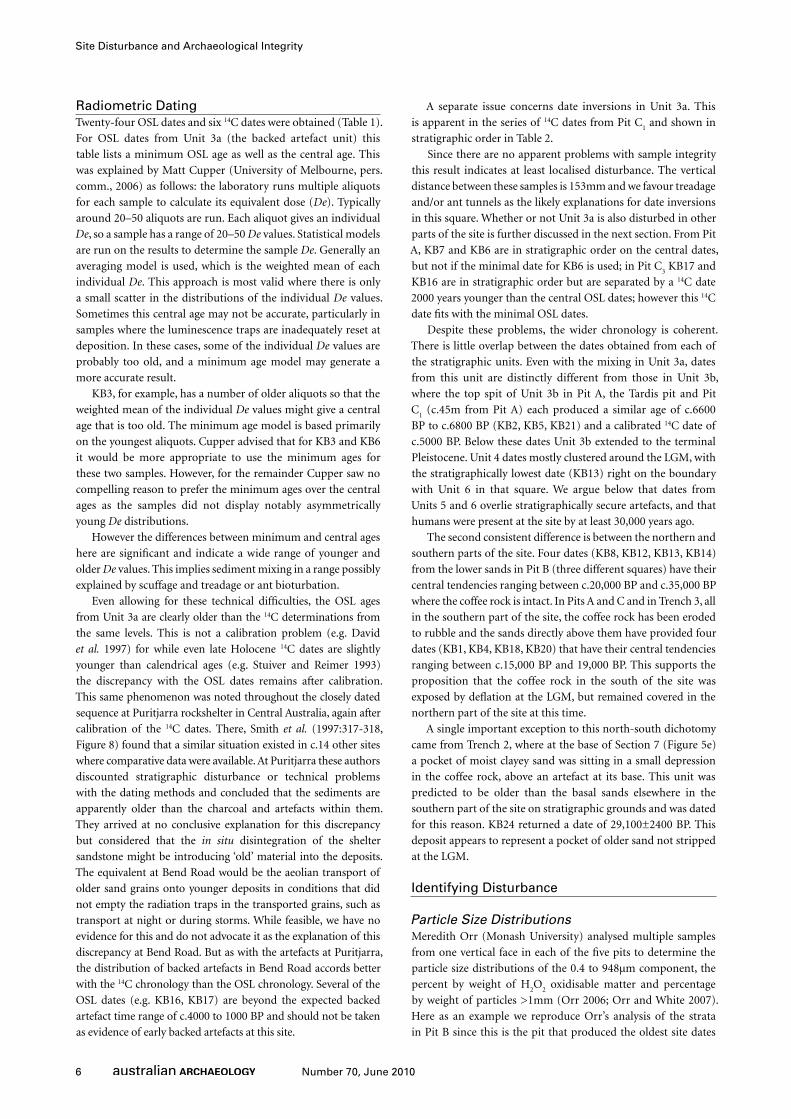
Radiometric DatingTwenty-four OSL dates and six 14C dates were obtained (Table 1).
For OSL dates from Unit 3a (the backed artefact unit) this
table lists a minimum OSL age as well as the central age. This
was explained by Matt Cupper (University of Melbourne, pers.
comm., 2006) as follows: the laboratory runs multiple aliquots
for each sample to calculate its equivalent dose (De). Typically
around 20–50 aliquots are run. Each aliquot gives an individual
De, so a sample has a range of 20–50 De values. Statistical models
are run on the results to determine the sample De. Generally an
averaging model is used, which is the weighted mean of each
individual De. This approach is most valid where there is only
a small scatter in the distributions of the individual De values.
Sometimes this central age may not be accurate, particularly in
samples where the luminescence traps are inadequately reset at
deposition. In these cases, some of the individual De values are
probably too old, and a minimum age model may generate a
more accurate result.
KB3, for example, has a number of older aliquots so that the
weighted mean of the individual De values might give a central
age that is too old. The minimum age model is based primarily
on the youngest aliquots. Cupper advised that for KB3 and KB6
it would be more appropriate to use the minimum ages for
these two samples. However, for the remainder Cupper saw no
compelling reason to prefer the minimum ages over the central
ages as the samples did not display notably asymmetrically
young De distributions.
However the differences between minimum and central ages
here are significant and indicate a wide range of younger and
older De values. This implies sediment mixing in a range possibly
explained by scuffage and treadage or ant bioturbation.
Even allowing for these technical difficulties, the OSL ages
from Unit 3a are clearly older than the 14C determinations from
the same levels. This is not a calibration problem (e.g. David
et al. 1997) for while even late Holocene 14C dates are slightly
younger than calendrical ages (e.g. Stuiver and Reimer 1993)
the discrepancy with the OSL dates remains after calibration.
This same phenomenon was noted throughout the closely dated
sequence at Puritjarra rockshelter in Central Australia, again after
calibration of the 14C dates. There, Smith et al. (1997:317-318,
Figure 8) found that a similar situation existed in c.14 other sites
where comparative data were available. At Puritjarra these authors
discounted stratigraphic disturbance or technical problems
with the dating methods and concluded that the sediments are
apparently older than the charcoal and artefacts within them.
They arrived at no conclusive explanation for this discrepancy
but considered that the in situ disintegration of the shelter
sandstone might be introducing ‘old’ material into the deposits.
The equivalent at Bend Road would be the aeolian transport of
older sand grains onto younger deposits in conditions that did
not empty the radiation traps in the transported grains, such as
transport at night or during storms. While feasible, we have no
evidence for this and do not advocate it as the explanation of this
discrepancy at Bend Road. But as with the artefacts at Puritjarra,
the distribution of backed artefacts in Bend Road accords better
with the 14C chronology than the OSL chronology. Several of the
OSL dates (e.g. KB16, KB17) are beyond the expected backed
artefact time range of c.4000 to 1000 BP and should not be taken
as evidence of early backed artefacts at this site.
A separate issue concerns date inversions in Unit 3a. This
is apparent in the series of 14C dates from Pit C1 and shown in
stratigraphic order in Table 2.
Since there are no apparent problems with sample integrity
this result indicates at least localised disturbance. The vertical
distance between these samples is 153mm and we favour treadage
and/or ant tunnels as the likely explanations for date inversions
in this square. Whether or not Unit 3a is also disturbed in other
parts of the site is further discussed in the next section. From Pit
A, KB7 and KB6 are in stratigraphic order on the central dates,
but not if the minimal date for KB6 is used; in Pit C3 KB17 and
KB16 are in stratigraphic order but are separated by a 14C date
2000 years younger than the central OSL dates; however this 14C
date fits with the minimal OSL dates.
Despite these problems, the wider chronology is coherent.
There is little overlap between the dates obtained from each of
the stratigraphic units. Even with the mixing in Unit 3a, dates
from this unit are distinctly different from those in Unit 3b,
where the top spit of Unit 3b in Pit A, the Tardis pit and Pit
C1 (c.45m from Pit A) each produced a similar age of c.6600
BP to c.6800 BP (KB2, KB5, KB21) and a calibrated 14C date of
c.5000 BP. Below these dates Unit 3b extended to the terminal
Pleistocene. Unit 4 dates mostly clustered around the LGM, with
the stratigraphically lowest date (KB13) right on the boundary
with Unit 6 in that square. We argue below that dates from
Units 5 and 6 overlie stratigraphically secure artefacts, and that
humans were present at the site by at least 30,000 years ago.
The second consistent difference is between the northern and
southern parts of the site. Four dates (KB8, KB12, KB13, KB14)
from the lower sands in Pit B (three different squares) have their
central tendencies ranging between c.20,000 BP and c.35,000 BP
where the coffee rock is intact. In Pits A and C and in Trench 3, all
in the southern part of the site, the coffee rock has been eroded
to rubble and the sands directly above them have provided four
dates (KB1, KB4, KB18, KB20) that have their central tendencies
ranging between c.15,000 BP and 19,000 BP. This supports the
proposition that the coffee rock in the south of the site was
exposed by deflation at the LGM, but remained covered in the
northern part of the site at this time.
A single important exception to this north-south dichotomy
came from Trench 2, where at the base of Section 7 (Figure 5e)
a pocket of moist clayey sand was sitting in a small depression
in the coffee rock, above an artefact at its base. This unit was
predicted to be older than the basal sands elsewhere in the
southern part of the site on stratigraphic grounds and was dated
for this reason. KB24 returned a date of 29,100±2400 BP. This
deposit appears to represent a pocket of older sand not stripped
at the LGM.
Identifying Disturbance
Particle Size DistributionsMeredith Orr (Monash University) analysed multiple samples
from one vertical face in each of the five pits to determine the
particle size distributions of the 0.4 to 948μm component, the
percent by weight of H2O
2 oxidisable matter and percentage
by weight of particles >1mm (Orr 2006; Orr and White 2007).
Here as an example we reproduce Orr’s analysis of the strata
in Pit B since this is the pit that produced the oldest site dates

7Number 70, June 2010
Geoff Hewitt and Jim Allen
SU Original Site/Spit
designation
Area designation in
this Paper
Lab. No. depth Below Surface
(mm)
Age BP Calendrical Age
(cal BP)
Minimum OSL Age
3a BR2/C/5 Pit B KB10 400 3300±400 2100±100
3a BR1/RTP/1 Tardis pit KB3 350 3700±500 2000±1003a BR1/C4/6 Pit A KB7 400 3900±400 1700±200
3a BR1/C4/8-9 Pit A KB6 550 4900±500 2700±3003a BR1/N/6 Pit C1 Wk-23460 322 2277±32 2272±66
3a BR1/N/8 Pit C1 KB22 379 3500±400a 2000±200
3a BR1/N/8 Pit C1 Wk-19710 379 2350±32a 2389±40
3a BR1/N/11 Pit C1 Wk-23461 452 1828±36 1771±43
3a BR1/N/12 Pit C1 Wk-23462 475 1391±32 1314±18
3a BR1/J/11 Pit C3 KB17 367 5000±600 2000±200
3a BR1/J/12 Pit C3 Wk-19709 346 2965±32 3147±56
3a BR1/J/14 Pit C3 KB16 455 5200±400 3200±200
3b BR1/N/15 Pit C1 Wk-23983 547 4485±30 5165±91
3b BR1/P/13 Pit C1 KB21 531 6600±800
3b BR1/RTP/2 Tardis pit KB2 650 6700±700
3b BR1/C4/10-11 Pit A KB5 680 6800±500
3b BR1/NS/S25-26 Trench 3 KB23 707 9700±800
3b BR2/C12 Pit B KB9 700 11,600±1200
3b BR1/M/26 Pit C2 KB19 764 10,800±1000
3b BR2/A/10 Not used this paper
KB11 650 12,300±1000
4 BR1/RTP/3 Tardis pit KB1 950 15,100±1300
4 BR1/L/30 Pit C2 KB18 925 16,300±1900
4 BR1/C4/15-16 Pit A KB4 950 18,100±1400
4 BR1/P/27 Pit C1 KB20 957 19,200±1900
4 BR2/H/28-29 Pit B KB14 920 20,700±1500
4 BR2/H/31 Pit B KB13 1008 27,400±2400
5 BR1/EW/S7 Trench 2 KB24 1344 29,100±2400
6 BR2/G/31-32 Pit B KB12 1050 28,200±2200
6 BR2/C/18 Pit B KB8 1000 35,300±2600
8 BR2/toedrain/DS3 Trench 1 KB15 1550 126,500±7200
Table 1 Radiometric dates from Bend Road sorted by stratigraphic unit. KB denotes OSL dates run at the University of Melbourne. Wk denotes 14C dates from the University of Waikato. 14C calibrations by CalPal 2007HULU (www.calpal-online.de; Weninger and Joris 2008). KB11 derives from a test pit otherwise not mentioned in this paper. a=check dates from same square and spit. Minimum OSL ages in bold may be preferred, see text. Within each stratigraphic unit dates from the same pit are also listed stratigraphically, but otherwise dates are listed in ascending age order for easy comparison. Given the large distances between pits, the undulating (and in places machine-damaged) site surface and variable depths of the sand deposit, depths below surface or site datum provide no sensible relationship between distant dates except at the most general level. Even so there is little depth overlap between stratigraphic units. As discussed in text the stratigraphic relationship between Units 5 and 6 is unknown and not implied in these numbered designations. KB15 derives from non-artefact bearing sands below cultural material (see text). The stratigraphic units provide the best comparative guide to depth/age relationships.
Table 2 14C age determinations from Bend Road Pit C1. Spits were nominally 25mm deep.
SU Original Site/ Spit designation
depth Below Surface (mm)
Lab. No. Age BP Calendrical Age (cal BP)
3a BR1/N/6 322 Wk-23460 2277±32 2272±66
3a BR1/N/8 379 Wk-19710 2350±32 2389±40
3a BR1/N/11 452 Wk-23461 1828±36 1771±43
3a BR1/N/12 475 Wk-23462 1391±32 1314±18

8 Number 70, June 2010
Site Disturbance and Archaeological Integrity
(Figure 6). All of Orr’s results were in advance of the dating of
the relevant sediments.
Orr (2006) suggests the particle size distributions, if
bimodal, indicate saltation and creep as the modes of transport
and indicate no significant post-depositional modification.
If classified as unimodal, the distribution indicates reduced,
indistinct or absent bimodality, interpreted by Orr to reflect
post-depositional reworking by processes such as bioturbation,
deflation or surface wash.
Table 3 shows the distribution of Orr’s bimodal and unimodal
classes according to the stratigraphic units previously defined.
Collectively there is variation across the site, with Unit 3b being
the only unit to show disturbance in all samples.
The upper ‘plough zone’ shows expected disturbance in the
soil particle analyses, attributed to European farming activities.
Unit 3a, containing the backed artefacts, shows post-depositional
disturbance only in Pit B. In this pit Orr notes that a change in
particle size distributions differentiates the 300–600mm unit in
the tested square from the 600–900mm unit. This change is at
the approximate point of change from Unit 3a to Unit 3b, but
is difficult to judge precisely in the tested square because of the
absence of a clear backed artefact layer there. It is at the same
depth as this transition in another Pit B square 3m away, where
there are backed artefacts.
In several pits Orr (Orr and White 2007) reported
increases in organic matter coinciding with a boundary
between particle size distribution classes that might reflect
buried surfaces. One of these coincides with the boundary
between Units 3a and 3b and a break in the sequence at this
point is independently confirmed by the relevant OSL dates,
where the top spit of Unit 3b in three pits some 50m apart
each produced a similar age of c.6600 BP to c.6800 BP (KB2,
KB5, KB21). Here the soil particle analyses suggest widespread
post-depositional disturbance of Unit 3b, stabilising with a
surface comprising sands deposited around 6700 years ago.
The subsequent deposition of a backed artefact layer can be
argued on the data to be no older than 4000 years ago. This
implies either a cessation of sediment accumulation or, more
likely, an aeolian deflation event prior to the formation of Unit
3a. The alternative interpretation, that Unit 3a itself reflects
a lagged deposit caused by such deflation, is not supported
by the soil particle analyses, which suggest little or no post-
depositional disturbance of this unit, nor is it supported by
artefact distributions described below.
A final point of importance in these analyses is the lack of
post-depositional disturbance at the base of Pit B (Unit 6), the
unit that yielded three dates >27,000 BP from the northern part
of the site (KB8, KB12 and KB13).
SU Pit A Pit B Pit C1 Pit C2 Pit C3
1 unimodal unimodal bimodal bimodal unimodal
2 bimodal unimodal bimodal unimodal unimodal
3a bimodal unimodal bimodal bimodal bimodal
3b unimodal unimodal unimodal unimodal unimodal
4 bimodal unimodal bimodal lacustrine clay lacustrine clay
5 not present not present unimodal not present not present
6 not present bimodal not present not present not present
7 coffee rock coffee rock coffee rock lacustrine clay not present
Table 3 Type of particle size distribution for five Bend Road pits according to stratigraphic unit. See text for explanation.
Figure 6 Particle size distributions for Pit B, after Orr (2006). In this pit all samples down to 900mm show a unimodal distribution consistent with aeolian deposition and subsequent reworking by bioturbation and/or deflation. The bimodal distribution of the lowest set of samples indicates saltation or creep as the mode of transportation, without significant post-depositional modification. The oldest site dates came from this unit. See text for further discussion.
Depth from surface (mm)
0
100
200
300
400
500
600
700
800
900
1000
1100
Percent by volumeDifferential volume (average) (2SD)
Differential volume (average) (2SD)
Differential volume (average) (2SD)
0-300 mm
300-600 mm
Volu
me
(%)
Volu
me
(%)
Volu
me
(%)
Volu
me
(%)
55.5
4.54
3.53
2.52
1.51
0.50
Particle diameter (um)l
100 200 300 400 500 600 700 800 900 1000
100-200mm
6
55.5
4.54
3.53
2.52
1.51
0.50
Particle diameter (um)l
100 200 300 400 500 600 700 800 900 1000
600-900 mm
55.5
4.54
3.53
2.52
1.51
0.50
Particle diameter (um)l
100 200 300 400 500 600 700 800 900 1000
Differential volume (average) (2SD)
900-1000mm+ coffee rock
55.5
4.54
3.53
2.52
1.51
0.50
Particle diameter (um)l
100 200 300 400 500 600 700 800 900 1000
6
Particle size distributions

9Number 70, June 2010
Geoff Hewitt and Jim Allen
Spit 28 29 30 31 32 33 34 35
Number 1 2 7 18 3 1 1 2
Av. Wt. (g) 0.4 0.2 1.0 1.0 0.2 0.2 1.7 1.0
Range (g) - 0.1-0.2 0.1-3.3 0.1-8.6 0.1-0.2 - - 0.4-1.5
Table 4 Artefacts in Pit C2, spits 28–35. Spits are 25mm in depth.
Table 5 Artefacts in squares G and H of Pit B, spits 27–34. Spits are 25mm in depth. The aberrant data in Spit 33 is caused by the presence of a large silcrete core.
Spit 27 28 29 30 31 32 33 34
Number 2 5 10 16 4 12 3 1
Av. Wt. (g) 0.1 0.3 0.2 0.3 0.4 0.1 27.9 0.1
Range (g) 0.1 0.1-1.1 0.1-1.6 0.1-1.6 0.1-1.1 0.1-0.2 0.1-83.5
5.00
4.80
4.60
4.20
4.00
3.80
4.40
20 cm
A north baulk B north baulk C north baulk D north baulk
KB7
KB1
KB6
KB5
KB4
KB2
KB3
spit 1
start level
spit 2spit 3
spit 4
spit 5spit 6
spit 7
spit 8
spit 9
spit 10
spit 11spit 12
spit 13spit 14
spit 15spit 16
spit 17
spit 18
5.00
5.20
5.40
4.80
4.60
4.20
4.40
5.336
H north baulk G north baulk
spit 1
spit 2spit 3
spit 4spit 5
spit 6spit 7spit 8
spit 9spit 10
spit 11spit 12
spit 13
spit 1
spit 2spit 3
spit 4spit 5spit 6
spit 7spit 8 spit 9
spit 10spit 11spit 12spit 13spit 14spit 15spit 16spit 17
spit 18spit 19spit 20spit 21
spit 22spit 23spit 24spit 25
spit 26spit 27
spit 28spit 29
spit 30spit 31
spit 33spit 34spit 35
spit 32
spit 14spit 15spit 16spit 17
spit 18spit 19spit 20spit 21spit 22spit 23
spit 24spit 25
spit 26spit 27spit 28spit 29spit 30
spit 31spit 32spit 33spit 34spit 35
KB13KB14 KB1220 cm
Figure 7 The north face of Pit A with 3-dimensionally plotted artefacts projected onto section. The backed artefact phase occurs from Spit 5 to Spit 11. The shaded section is a projection of the south face of the Tardis pit showing the three OSL dates from there in relation to the four Pit A dates.
Figure 8 North section of Squares G and H in Pit B, showing the locations of the KB12, KB13 and KB14 OSL samples. The surface of H was cut by machinery prior to excavation. Near vertical lines are ant nest shafts. Light colouring=1–3 artefacts per spit; light grey=4–8 artefacts; mid-grey 9–20 artefacts; dark grey (Spit 2 only)=21–30 artefacts.

10 Number 70, June 2010
Site Disturbance and Archaeological Integrity
Overall, consistent age differences down the profile in all
dated pits support the view that ‘sediments have been deposited
continuously at a low accumulation rate, allowing synchronous
near-surface reworking and deflation’ (Orr 2006).
Artefact DistributionsDeflation events are rarely discernible in archaeological deposits
but can be reflected in the artefact distributions within them.
For example the break between layers containing backed
artefact assemblages and earlier deposits just described was
initially recognised in such distributions (Figure 7). The artefact
distributions in Figure 7 suggest that the backed artefact layer is
not a lagged deposit, but other lagged deposits can be recognised
in the artefact data.
For example, in Pit B, where the archaeologically sterile coffee
rock is intact, only a single artefact was found sitting on (partially
cemented into) the coffee rock across 12m2 of exposure. But in
the 2m2 of Pit C1, where the base is coffee rock rubble, 19 artefacts
were recovered from the rubble and were immediately overlain
by a date of 19,200±1900 (KB20). This difference implies that
the C1 artefacts were lagged from older sands eroded at the LGM.
A second example comes from Pit C2 where artefacts were
distributed as in Table 4. The unusual concentration of artefacts
in Pit C2 spits 30–31 suggests that either this cluster reflects a
short-lived and possibly single activity event or that it is a lag
deposit from a deflation event. Given what we know about the
wider site the latter seems more likely. While 22 of the artefacts
are flakes and the remaining three angular fragments they
contain heavier pieces than the surrounding spits and comprise
a range of fine-, medium- and coarse-grained silcretes, quartz
and crystal quartz, ruling out a single flaking event at this point.
A third example comes from Pit B. At a depth below surface
of c.950mm spits 29 and 30 for two squares (G + H) combined
produced a similar notable increase in artefact numbers (Table 5,
Figure 8). While in this case there was no increase in the average
weight of artefacts, again the artefacts in Spits 29–30 comprise
14 flakes and 12 angular fragments and include silcrete, basalt
and quartz artefacts.
One explanation for this apparent increase was that these are
lagged artefacts. Revisiting the data from the other 10 x 1m x 1m
squares in this pit indicated similar distributional variations at
the same approximate depth. Two further OSL dates were thus
sought to verify the presence of this lagged surface. KB14 from
Pit B, H/28-29 yielded a date of 20,700±1500 BP, while K13 from
Pit B, H/31 returned a date of 27,400±2400 BP.
KB14 is 53mm directly above KB13 but is somewhere between
2800 and 10,600 years younger at 1σ. This supports the notion
of a hiatus at this point in the deposit predicted on the artefact
distribution. The increase in artefacts in spit 32 immediately
below a date of 28,200±2200 BP (KB12) may reflect a similar
lagged event.
Artefact ConjoiningConjoined artefacts from the same locations in sites do not
necessarily demonstrate the post-depositional intactness of
deposits, since separate pieces may move in tandem through a
deposit. However, except in cases where artefacts are lagged by
the removal of the soil matrix by wind or water, it is unusual for
all conjoined pieces to remain together in a disturbed deposit
(e.g. Richardson 1992). Thus vertically separated artefacts that
can be rejoined may demonstrate post-depositional disturbance.
To test this, conjoining was undertaken for selected parts of the
Bend Road assemblage.
For Pit A, 24 conjoin sets comprised 56 artefacts and involved
two to five artefacts in any single conjoin. All 24 sets came from
the same or adjacent squares and 22 of these sets came from spits
at most two spits apart. Of the two separated sets, one involves
two pieces separated by 5 spits (250mm) and >1m laterally that
might have been redeposited by the digging of a European pit
used to bury a horse. The other involves five items from three
adjacent squares that are also separated by 5 spits (one in spit 5,
three in spit 8 and one in spit 10).
Only one of the 24 conjoin sets comes from outside the
backed artefact unit, this being located in Unit 3b. This probably
reflects both the higher artefact numbers in Unit 3a and the more
ephemeral use of the site before this.
A second conjoin analysis was carried out on artefacts from
Trench 3, where sieve mesh size was 7mm and spit depths
were c.100mm. A further 24 conjoin sets involving 57 artefacts
were recorded, but the search did not involve looking beyond
the boundaries of each 3m trench segment, so these numbers
were minimal. Here the analysis concentrated on vertical
displacement; 21 of the 24 conjoin sets came from the same spits
and the remaining three from adjacent spits. All conjoins came
from spits containing backed artefacts.
Finally a brief analysis of the Tardis ‘flaking floor’ assemblage
indicated at least 14 conjoin sets involving 32 pieces in a
Figure 9 Trench 3, excavation segments 23–24 to 25–26. The three diagrams show the same 3m section of the trench. (a) shows the distribution of artefact types: light grey=European artefacts; mid-grey=diagnostic backed artefacts; dark grey=probable early Holocene and Pleistocene artefacts determined by location, size, raw material and artefact form. (b) shows raw material distributions: light grey=c.50% each of quartz and fine-grained silcrete; dark grey=>75% fine-grained silcrete; unfilled=other raw material combinations. (c) shows artefact densities: unfilled=<4 artefacts per spit; light grey=4–8 artefacts per spit; mid-grey =9–20 artefacts per spit; dark grey=21–45 artefacts per spit. There is a strong correlation between higher densities, backed artefact assemblages and fine-grained silcrete here and right across the site.

11Number 70, June 2010
Geoff Hewitt and Jim Allen
collection of 332 artefacts. Vertical displacement could not be
pursued because the bagged collection was undifferentiated
stratigraphically and we held no information on the collection
procedures beyond the collection coming from an area of trench
c.3m long and 200mm deep. Again the collection is from the
period of backed artefact production.
Overall, conjoining at Bend Road yielded evidence for 62
conjoin sets of which only two indicate significant vertical
displacement. As noted, the vertical relationship between conjoined
pieces can be maintained in disturbed deposits, but the possibility
of maintaining close vertical associations between 145 conjoining
artefacts across widely separated areas would appear to be remote,
unless all these pieces are lagged (see discussion below). Instead,
this test suggests that the backed artefact levels are generally in situ.
SummaryArtefact distributions in various parts of the site reflect
deflation events, one in the pre-LGM layers being confirmed by
radiometric dating. The most important of these occurred at the
LGM when most of the southern part of the site was stripped
and artefacts were lagged onto and into the decaying exposed
coffee rock. In other parts of the site the archaeological record
remains coherent and conjoining tests offer strong support for
the stratigraphic intactness of the backed artefact levels. Other
tests on artefact orientation and inclination, not reported here,
did not demonstrate disturbance but could not exclude it.
The Distributions of Specific Archaeological Attributes at Bend RoadFigure 9 shows the distributions of artefacts by density, raw
materials and diagnostic artefacts, including European artefacts,
along 9m of Trench 3. This section is representative of such
distributions right across the site and reflects a high degree of
stratigraphic intactness. Figure 10 provides a comparison from
one square from Pit B, more than 400m from the Trench 3
section shown in Figure 9.
Consistent distributional characteristics in these diagrams
accurately reflect the wider site. European artefacts are confined
to the top 200–300mm of deposit within the plough zone.
Backed artefacts are always distributed between 300mm and
700mm below surface. This distribution correlates with both
the highest artefact densities and those spits where fine-grained
silcrete accounts for more than 75% of raw materials, except in
Pit B where fewer backed artefacts occur; here quartz accounts
for more artefacts than silcrete. Below the backed artefact
assemblages fine-grained silcretes also occur but are mostly a
minor component of a wider range of raw materials dominated
by quartz and including more medium- or coarse-grained
silcretes (or quartzites) and basalt. Artefacts in the lower units
are mostly bigger than in the backed artefact assemblages.
Artefacts stratigraphically younger than backed artefacts are
rare in the Bend Road site but do occur in places as concentrations
of small, angular, amorphous quartz artefacts mixed with silcrete.
Across the site backed artefacts frequently occur as discrete
and dense horizontal distributions 3–4m in diameter. These
occur in Pit B and at six locations in Trench 3. Pits C1 to C
3 were
all placed adjacent to these backed artefact ‘hot spots’ in Trench
3 but failed to yield densities equivalent to those in the adjacent
trench segments, confirming that these dense aggregations were
very localised. The Tardis ‘flaking floor’ is a further example
where hand excavations only a few metres on either side of it also
failed to find equivalent densities of backed artefacts and their
production debris. These ‘hot spots’ show neither consistent raw
material nor technological differences between them, nor do
they cluster near to or away from the swamp edge or any other
topological feature on the site. While such a distribution initially
conveys the impression of temporary encampments or work
stations rather than a base camp, if these ‘hot spots’ could be
shown to be strictly contemporaneous the reverse would be true.
The spatial pattern described here fits well with ethnographic
descriptions of Alyawara residential base camps described by
O’Connell (1987).
Two other aspects of the archaeological distributions require
brief comment. Table 6 indicates the raw material distributions
for the two spits containing backed artefacts from Trench 3
segment 36–37, a ‘hot spot’ location. In Spit 4 the two raw
materials present are approximately half silcrete and half
hornfels, but in spit 5 they are almost exclusively silcrete. This
stratigraphic difference indicates at least two separate backed
artefact occupations at this location. Here the backed artefact
unit as a whole cannot be a lagged deposit. A similar situation
is reflected in artefact distributions in Pit A where a deflation
surface was identified pre-dating the backed artefact deposition
there but where three-dimensionally plotted artefacts from the
backed artefact spits are clearly not lagged (Figure 7).
The second piece of site data is a hearth in Pit C1 initiated
from immediate post-backed artefact spits down through the
backed artefact layers, apparently in a scooped pit. It extended
from Spit 5 to Spit 15, a depth of 250mm. While this hearth
could still have cut through previously disturbed backed artefact
layers, its intactness demonstrates that deflation of this deposit
did not occur after it was created. Given its depth it seems likely
that this hearth was reused over a period of time. Because it is
stratigraphically recent, dating this feature was rejected during
Figure 10 Pit B, square DN3. Artefact densities and types for comparison with Figure 9. On left unfilled=<4 artefacts per spit; light grey=4–20 artefacts per spit; dark grey=21–>45 artefacts per spit. Here spit 1 reflects presence of post-backed artefact quartz industry and spits 26–28 pre-LGM artefacts. On right, spits containing diagnostic backed artefacts.
Spit Silcrete Hornfels
4 49 (54.4%) 41 (45.6%)
5 189 (99.5%) 1 (0.5%)
Table 6 Bend Road Trench 3, segment 36-37, spits 4 and 5. Distributions and percentages of artefacts according to raw materials.

12 Number 70, June 2010
Site Disturbance and Archaeological Integrity
analysis because knowing its age did not help to clarify the aims
of the overall excavation (Allen et al. 2008).
Discussion
Site FormationData from Pit B and Trench 1 show that the Bend Road coffee
rock formed at the base of a sand dune that formed after
126,500±7200 BP. On the evidence of the younger sands now
immediately overlying the coffee rock, this dune was deflated
some unknown time before 35,000 BP and the coffee rock was
briefly exposed as the stub of the older dune. This event probably
occurred prior to humans occupying the site because there is no
layer of lagged artefacts on the Pit B coffee rock surface. Above
the coffee rock, artefact-bearing sands dating to 27–35,000 BP
had their accumulation truncated between 27,000 BP and the
LGM, resulting in a temporal gap in the sequence and a layer
of lagged artefacts in the Pit B squares. Gardner et al. (2006)
using data from Cape Liptrap, argue for a period of c.3000 years
immediately prior to the LGM when extreme cold and aridity
led to landscape instability and erosion in the region. This event
probably explains the demonstrated Bend Road deflation as
well as the prolonged stripping of the southern part of the site,
where in Pits A, C1 and C
2 and Trenches 2 and 3, the coffee rock
broke down to rubble. However in Pit B and the adjacent part
of Trench 1 the coffee rock was not exposed at this time and
maintained a cover of pre-LGM Pleistocene sands that contain
artefacts and exhibit particle size distributions suggesting no
post-depositional disturbance.
Unlike the unexposed coffee rock in Pit B, elsewhere the
coffee rock rubble contains numerous lagged artefacts dating to
or before the LGM. At one location in Trench 2 a thick squarish
quartzite artefact measuring 32.1mm in maximum length was
sealed in a depression in the coffee rock by wet clayey sand dated
to 29,100±2400 BP. This indicates a localised area in the south
of the site that was not completely stripped at the LGM, with the
deposit overlying an artefact discarded at or before the OSL date
(see below).
The available post-LGM dates show a general age-depth
concordance through the terminal Pleistocene and early
Holocene, but the particle size distributions suggest deposition at
rates low enough to allow synchronous near-surface reworking
and deflation. The low levels of artefact deposition at this time
indicate people at the site at least intermittently.
During the mid-Holocene a deflation event was detected in
Pits A and C1 and in the Tardis pit, where the exposed surface
dated to c.6700 BP with OSL (KB2, KB5, KB21) and 5165±91
cal BP with 14C (Wk-23983) (www.calpal-online.de; Weninger
and Joris 2008). Backed artefacts sit directly above this surface
in all three instances, occupying a unit 200–300mm thick at
these locations. Artefact distributions, the conjoining results
and the soil particle size distributions all indicate minimal post-
depositional disturbance in this unit, but inverted 14C dates in
Pit C1 suggest at least localised disturbance. Above this unit the
disturbed plough zone indicates European farming activity.
One remaining question is why the backed artefacts are
located so far below the surface. Hughes (2006) asked where so
much sand might have come from in the last 4000 years to bury
them, and speculated that this might reflect increased human
activity in the region that reduced the plant cover and exposed
the sand to greater mobilisation, a process exacerbated in the last
150 years by farming.
Ant BioturbationAnt tunnels up to 5mm in diameter and small nests to c.60mm
in diameter are prevalent in some parts of the Bend Road
site and one active nest was noted 600mm below the surface.
These ants, unidentified to species, are small and black, up to
5mm long. Mottling seen in section and in plan and initially
identified by Hughes as rootlet turbation is now recognised as
old nests (Figures 11-12). While commonly seen in section in
parts of Pits A, B and C they are not present everywhere and
do not occur in the Pleistocene layers except in the post-LGM
layers of Pit B. The proposition that the Pleistocene sands are
homogenised, thus disguising ant bioturbation, is rejected on
the evidence of the particle size analyses. These indicate no
post-depositional bioturbation of the lowest sands anywhere
on the site.
While tunnelling and nesting might have caused minor
artefact relocation downwards through slumping, the evidence
from this site (e.g. Figure 12) suggests that the tunnels were too
small to allow the downward passage of stone artefacts and that
Figure 11 Pit A south section showing area of ant nest disturbance to right of vertical ranging pole and its absence to the left. Horizontal scale in 100mm units (Photograph: Rudy Frank).
Figure 12 Pit A Square D2/Spit 14. Ant nest and tunnels. Top arrow indicates mottling seen in section in Figure 11. Bottom arrow indicates filled-in ant tunnels (Photograph: Rudy Frank).

13Number 70, June 2010
Geoff Hewitt and Jim Allen
nests and tunnels were infilled by sand grains from the surface
rather than slumping by the deposit. This idea is supported by
the artefact conjoin data.
Thus there is no evidence of ant bioturbation or other post-
depositional disturbance affecting the lower deposits in Pit B that
produced the earliest dates from the site.
When Did Humans First Occupy Bend Road?In Pit B three dated samples – 35,300±2600 BP (KB8),
28,200±2200 BP (KB12) and 27,400±2400 BP (KB13) – derive
from three adjacent squares. On heights relative to datum,
KB8, the oldest date, is c.2mm below KB13 but c.1mm above
KB12 (Hewitt and de Lange 2007:127-129, Figure 58), the small
inversion being explained by the uneven coffee rock surface
trapping older and younger sands at slightly different levels. All
dated spits have artefact-bearing spits beneath them; KB8 has
two deeper spits containing two artefacts, KB12 one further spit
containing one artefact and KB13 four deeper spits containing
14 artefacts below it. As stated, this area reflects no evidence
for artefact lagging, bioturbation or other post-depositional
soil disturbance. Additionally, 330m distant, a remnant deposit
in Trench 2 dated to 29,100±2400 BP (KB24) overlies one
artefact (discussed above). Even if these artefacts are lagged, for
which there is no evidence, all four dates represent minimum
ages for the artefacts beneath them, unless these artefacts have
subsequently migrated down the profile.
However, is KB8 actually older than the other three dates of
c.27–29,000 BP, given the wide error margins?
In order to examine OSL dates at the 95% probability level
one does not merely double the standard deviation as with
radiocarbon dates (see Roberts et al. 1990:126 for explanation).
Instead Matt Cupper (University of Melbourne, pers. comm.,
2007) advises that following the procedures advocated by Furetta
(2003) the total 2σ uncertainties are 4150 years (KB8), 3510 years
(KB12), 4170 years (KB13) and 4170 years (KB24). Using these
data, the ages of all four dates correspond at the 2σ confidence
level (Figure 13). However the overlap between KB12 and KB13
on the one hand and KB8 on the other is slight, representing only
a few hundred years around 31,000 BP. These dates suggest that
humans were present at Bend Road by 30,000 BP and possibly
by 35,000 BP.
Lagging and Artefact MigrationIntegrating the dating studies, particle size analyses, stratigraphy
and artefact distributions has isolated three major and several
minor deflation episodes that resulted in artefact lagging in
at least two and probably three demonstrated instances. This
approach allowed us to establish areas in the site where the lack
of such evidence does not immediately disqualify the integrity
of the archaeology. Both the backed artefact and pre-LGM
Pleistocene assemblages fit this latter category.
Artefact migration through the existing matrix, as
opposed to lagging, is well-attested in sandy deposits in
Australia and elsewhere, where it is normally demonstrated
by artefact conjoining (e.g. Richardson 1992, 1996). However
demonstrating that artefacts have not moved down a profile after
deposition is always difficult and frequently ignored. Apart from
subjective impressions, appeals are mostly made by looking at
the numerical distributions of artefacts together with their size
and raw material distributions (e.g. Bird et al. 2002).
Examining Pit B data shows there is no patterning suggesting
that the lowest artefacts have migrated down from higher levels
and none of the artefacts is resting on the basal coffee rock, the
first ‘impervious’ stratum they would have encountered. The
lowest artefacts are spread laterally across Pit B and we have
not merely dated the ‘lowest artefact’ (e.g. Roberts et al. 1994;
Turney et al. 2001). Even so, none of these facts demonstrates
that artefacts have not migrated downwards.
While we are unaware of experimental studies that have
demonstrated that smaller artefacts are more likely to move down
a profile than larger ones where small vectors of bioturbation
(ants, termites, small beetles) are involved, this is a reasonable
assumption since a larger artefact requires a larger area beneath
it to be undermined for it to descend within a deposit than for a
smaller one to descend. This is the assumption that underlies the
claim by McNiven et al. (2009) for disturbance in the lower levels
of Kabadul Kula, where they argue that turbation has resulted
in the size sorting of stone artefacts, with only small artefacts
descending into the lower levels.
While most artefacts in Pit B at Bend Road are <10mm in
length, the artefact in the lowest spit of one square (G/33) is a
silcrete core with a maximum dimension of 55.7mm and a weight
of 83.5g. Equally the artefact from S7 in Trench 2 beneath a date
of c.29,000 BP is 32.1mm in maximum dimension. Artefacts
of this size are unlikely to move far under the forces of minor
bioturbation. The raw materials and their proportions (quartz
66%, silcrete 33%, sample =18) accord with what is encountered
elsewhere in the earliest levels in the site.
There is also no evidence of downward movement elsewhere
in the site. As already discussed, while a close vertical relationship
between conjoined pieces can be maintained in disturbed
deposits and obviously in lagged deposits, the possibility
of maintaining such a relationship in 60 of 62 conjoin sets
involving 145 conjoining artefacts is remote if the backed artefact
assemblages are not lagged, as argued.
Regional EvidenceDates for first human presence at Bend Road at 30–35,000 BP
are unexceptional. People were in Tasmania by c.40,000 cal BP
at Parmerpar Meethaner (Cosgrove 1995b) and Warreen Cave
(Allen 1996), indicating that people were also in southern Victoria
at this date in order to access the Bassian bridge into Tasmania.
The claimed antiquity for Bend Road is not contentious even
though it ranks among the oldest known Victorian sites. Site
7921-0510/0511 on the Koo Wee Rup floodplain near Pakenham
Figure 13 The four oldest OSL dates from archaeological deposits at Bend Road, showing overlap at 2σ between KB8 and the other dates.

14 Number 70, June 2010
Site Disturbance and Archaeological Integrity
(Rhodes 2004) has a basal date of 24,168±268 BP (Wk-15090).
Keilor, on the western side of the Melbourne CBD, has most
recently been dated by Cupper et al. (2003) at or about the
LGM (24,000–18,000 BP). Further afield, Richards et al. (2007)
report human occupation at c.32,000 BP on a lunette on the
edge of Lake Tyrrell in northwest Victoria, but do not emphasise
a calibrated radiocarbon date of c.44,000 BP associated with a
single stone flake from deeper in the lunette. Other older sites in
Victoria, Drual Rockshelter in the Grampians-Gariwerd region
(Bird et al. 1998) and New Guinea II Cave in the mountainous
northeast of the state (Ossa et al. 1995) were both occupied
around 30,000 cal BP.
Are the Backed Artefact Deposits at Bend Road Lagged?In Pit B, while the backed artefact phase was present in much
the same stratigraphic relationship seen right across the site,
it occurred in sands reflecting a unimodal distribution of
particle sizes indicative of reworking through time. Elsewhere
the deposits containing backed artefacts were thought to be
undisturbed on the particle size data.
At three locations in the site the earliest backed artefact
deposits were shown to be sitting on a deflated surface pre-dating
c.5000 BP, well before the time such artefacts most frequently
occur in southeast Australia. In these immediate localities backed
artefacts occupy a stratum c.200–300mm thick, suggesting they
are not lagged. In Trench 3 segment 36–37, two distinct layers of
backed artefacts reflecting obvious raw material differences and
are not a conflated deposit. Despite inverted radiocarbon dates
on loose charcoal in Pit C1, that possibly reflect local mixing of
the backed artefact layers, perhaps as a result of human activities,
we can propose no mechanism for reworking of the deposits in
a manner that might produce the distinctive small horizontal
patches of backed artefact production recorded right across
the site.
Radiometric Dating and ArchaeologyQuestioning the validity of archaeological sites on perceived
mixing of sand grains in single grain or small aliquot OSL samples
– for example at Cuddie Springs (Roberts et al. 2001) and now
Bend Road (Matt Cupper, University of Melbourne, pers. comm.,
2007) – requires fuller attention elsewhere. At Bend Road the
widespread evidence for ant nests and shafts provides a ready
mechanism for the intermingling of sand grains (and charcoal
fragments) down a profile. Intuitively it seems improbable that
this activity also caused any widespread downward movement of
much larger stone artefacts in ways that would not be recognised
in the artefact distributions and conjoining exercises. If we add
the scuffage and treadage factor of human activity on sandy
surfaces, it is reasonable to ask whether the levels of resolution
available in many archaeological sites are compatible with the
implied precision of single grain OSL samples. A comparable
problem in microscopy is known as ‘empty magnification’,
where enlargement of the image may not enhance and may even
obscure the detail being sought.
ConclusionDisturbance at Bend Road consists predominantly of aeolian
deflation and accumulation events before and during human
occupation of the site and subsequent bioturbation by ants.
By identifying these events we have been able to assess the
integrity and coherence of the archaeological record at the
site, which we find to be quite high. Bend Road has maintained
identifiable coherence stratigraphically, chronologically and
archaeologically and thus has maintained its general scientific
importance. However this coherence needs to be understood in
terms of the scales of comparison we can apply to different parts
of the site and the levels of resolution available to us (Cosgrove
and Allen 1996:23). In different areas we can distinguish earlier
and later Pleistocene and earlier and later Holocene phases,
but where present, these may differ in time spans that make
any comparative behavioural interpretations between them
problematic. Equally, while we can define backed artefact and
Pleistocene phases across most of the site stratigraphically, it is
clear that these horizons are neither continuous nor undisturbed
within their own stratigraphic boundaries. Additionally, while
these phases might be contained stratigraphically we cannot
demonstrate contemporaneity of individual events within
them. The discontinuous ‘hotspots’ of backed artefact disposal
are a good example. While there is no evidence to suggest that
any of these were deposited outside a general backed artefact
range of c.4000 BP to c.1000 BP, the site data do not allow
explicit contemporaneity between these discrete locations to
be demonstrated chronologically or typologically.
On balance there is no obvious reason to doubt that people
were at this site by 30,000 years ago and that small, restricted but
intense concentrations of mid-to-late Holocene backed artefacts
and associated debitage reflect a real, if unusual, settlement
pattern. At the same time, if Bend Road were to be subjected to
the same ferocious and subjective scrutiny that has descended on
Cuddie Springs (e.g. David 2002; Gillespie 2008; Gillespie and
Brook 2006; Roberts et al. 2001; but see Hiscock 2008) critics
might well deny its integrity.
AcknowledgementsWe thank the Wurundjeri Tribe Land Compensation and
Cultural Heritage Council Inc., the Victorian Boonerwrung
Elders Land Council Aboriginal Corporation and the Bunurong
Land Council Aboriginal Corporation for their interest and
assistance. The work was financed and assisted by Thiess John
Holland and La Trobe University. Among many individuals we
particularly thank Josara de Lange who carried out the lithic
analyses, Matt Cupper for OSL advice, and Andrew Long, Philip
Hughes, Meredith Orr, Megan Goulding, John McKechnie, Rudy
Frank, Tim Murray and Ming Wei for discussions and assistance.
Philip Hughes, Jim O’Connell, Peter Hiscock and Judith Field
and referees commented on drafts of the paper. We thank the
very large field crew that comprised both members of the
Aboriginal community and La Trobe students.
Endnotes1 Originally the site was differentiated north and south of Bend
Road with the area south called BR1 and that to the north BR2.
BR2 was excavated and analysed by Hewitt and de Lange (2007)
and BR1 by Allen et al. (2008). Pit A was originally reported as
BR1 Phase 1. Pit B was originally reported as BR2 Phase 1 Pit C,
plus Phases 2–4 which incorporated squares D, E, F, CN1, CN2,
CN3, DN1, DN2, DN3, G and H. Pit C was reported as BR1

15Number 70, June 2010
Geoff Hewitt and Jim Allen
Phase 3, where the present C1=Trench NP, C2=Trench LM and
C3=Trench JKS. The present Trench 1 was reported as BR2 toe
drain, Trench 2 as BR1 east-west trench (Tardis trench A2) and
Trench 3 as BR1 Phase 2 Trench.
ReferencesAllen, J. 1996 Warreen Cave. In J. Allen (ed.), Report of the Southern Forests
Archaeological Project: Site Descriptions, Stratigraphies and Chronologies,
pp.135-167. Vol. 1. Melbourne: School of Archaeology, La Trobe University.
Allen, J., G. Hewitt and J. de Lange 2008 Report on Bend Road Archaeological
Investigations: Bend Road 1, Phases 1 to 3. Unpublished report for Thiess
John Holland.
Allen, J. and J.F. O’Connell 2003 The long and the short of it: Archaeological
approaches to determining when humans first colonised Australia and New
Guinea. Australian Archaeology 57:5-19.
Armour-Chelu, M. and P. Andrews 1994 Some effects of bioturbation by
earthworms (Oligochaeta) on archaeological sites. Journal of Archaeological
Science 21:433-443.
Attenbrow, V. 2002 Sydney’s Aboriginal Past. Sydney: University of New South Wales
Press.
Attenbrow, V. 2004 What’s Changing: Population Size or Land-Use Patterns? The
Archaeology of Upper Mangrove Creek, Sydney Basin. Terra Australis 21.
Canberra: Pandanus Books, Research School of Pacific and Asian Studies,
Australian National University.
Binford, L.R. 1964 A consideration of archaeological research design. American
Antiquity 29:425-441.
Bird, C.F.M. and D. Frankel 2001 Excavations at Koongine Cave: Lithics and land-
use in the terminal Pleistocene and Holocene of South Australia. Proceedings
of the Prehistoric Society 67:49-83.
Bird, C.F.M., D. Frankel and N. van Waarden 1998 New radiocarbon determinations
from the Grampians-Gariwerd region, western Victoria. Archaeology in
Oceania 33(1):31-36.
Bird, M.I., C.S.M. Turney, L.K. Fifield, R. Jones, L.K. Ayliffe, A. Palmer, R.G.
Cresswell and S. Robertson 2002 Radiocarbon analysis of the early
archaeological site of Nauwalabila 1, Arnhem Land, Australia: Implications
for sample suitability and stratigraphic integrity. Quaternary Science
Reviews 21:1061-1075.
Cahen, D. and J. Moeyersons 1977 Subsurface movements of stone artifacts and
their implications for the prehistory of Central Africa. Nature 266:812-815.
Cameron, D., P. White, R. Lampert and S. Florek 1990 Site destruction and
site creation at Hawker Lagoon, South Australia. Australian Archaeology
30:58-69.
Cane, S. 1982 Bustard gastroliths in the archaeological record. Australian
Archaeology 14:25-34.
Canti, M.G. 2003 Earthworm activity and archaeological stratigraphy: A review of
products and processes. Journal of Archaeological Science 30:135-148.
Childe, V.G. 1956 Piecing Together the Past. London: Routledge and Kegan Paul.
Cosgrove, R.1995a The Illusion of Riches: Scale Resolution and Explanation in
Tasmanian Pleistocene Human Behaviour. BAR International Series 608.
Oxford: Archaeopress.
Cosgrove, R.1995b Late Pleistocene behavioural variation and time trends: The
case from Tasmania. Archaeology in Oceania 30(2):83-104.
Cosgrove, R. and J. Allen 1996 Research strategies and theoretical perspectives.
In J. Allen (ed.), Report of the Southern Forests Archaeological Project: Site
Descriptions, Stratigraphies and Chronologies, pp.21-30. Vol. 1. Melbourne:
School of Archaeology, La Trobe University.
Coventry, R.J., J.A. Holt and D.F. Sinclair 1988 Nutrient cycling by mound building
termites in low fertility soils of semi-arid tropical Australia. Australian Journal
of Soil Research 26(2):375-390.
Cupper, M.L., S. White and J.L. Neilson 2003 Quaternary: Ice ages –
environments of change. In W.D. Birch (ed.), Geology of Victoria, pp.337-
359. 3rd ed. Geological Society of Australia Special Publication 23.
Melbourne: Geological Society of Australia (Victoria Division).
David, B. 2002 Landscapes, Rock-Art and the Dreaming: An Archaeology of
Preunderstanding. London: Leicester University Press.
David, B., R. Roberts, C. Tuniz, R. Jones and J. Head 1997 New optical and
radiocarbon dates from Ngarrabullgan Cave, a Pleistocene archaeological
site in Australia: Implications for the comparability of time clocks and for
the human colonization of Australia. Antiquity 71:183-188.
Dibble, H.L., P.G. Chase, S.P. McPherron and A. Tuffreau 1997 Testing the reality
of a “living floor” with archaeological data. American Antiquity 62:629-651.
Fanning P.C. and S.J. Holdaway 2001 Stone artifact scatters in western
NSW, Australia: Geomorphic controls on artifact size and distribution.
Geoarchaeology 16(6):667-686.
Furetta, C. 2003 Handbook of Thermoluminescence. New Jersey: World
Scientific Publishing Co.
Gardner, T.W., J. Webb, A.G. Davis, E.R. Cassel, C. Pezzia, D.J. Merritts and
B. Smith 2006 Late Pleistocene response to climate change: Alluvial fan
deposition, Cape Liptrap, southeastern Australia. Quaternary Science
Reviews 25:1552-1569.
Geering, K. 1990 A taphonomic analysis of recent masked owl (Tyto
novaehollandiae castanops) pellets from Tasmania. In S. Solomon,
I. Davidson and D. Watson (eds), Problem Solving in Taphonomy:
Archaeological and Palaeontological Studies from Europe, Africa and
Oceania, pp.135-148. Tempus 2. St Lucia, QLD: Anthropology Museum,
University of Queensland.
Gillespie, R. 2008 Updating Martin’s global extinction model. Quaternary
Science Reviews 27:2522-2529.
Gillespie, R. and B.W. Brook 2006 Is there a Pleistocene archaeological site at
Cuddie Springs? Archaeology in Oceania 41(1):1-11.
Hewitt, G. and J. de Lange 2007 Report on Bend Road Archaeological
Investigations. Bend Road 2 Phases 1 to 4. Unpublished report to Thiess
John Holland.
Hiscock, P. 1990 How old are the artefacts at Malakunanja II? Archaeology in
Oceania 25(3):122-124.
Hiscock, P. 2008 Archaeology of Ancient Australia. London: Routledge.
Hiscock. P. and V.J. Attenbrow 1998 Early Holocene backed artefacts from
Australia. Archaeology in Oceania 33(2):49-62.
Hiscock. P. and V.J. Attenbrow 2005 Australia’s Eastern Regional Sequence
Revisited: Technology and Change at Capertee 3. BAR International Series
1397. Oxford: Archaeopress.
Hole, F.D. 1961 A classification of pedoturbations and some other processes
and factors of soil formation in relation to isotropism and anisotropism.
Soil Science 91:375-377.
Holt, J.A. and M. Lepage 2000 Termites and soil properties. In T. Abe, D.E.
Bignell and M. Higashi (eds), Termites: Evolution, Sociality, Symbioses,
Ecology, pp.389-407. Dordrecht: Kluwer Academic Publishers.
Huchet, B.M.J. 1990 A taphonomic analysis of the faunal assemblage from Yam
Camp rockshelter, S.E. Cape York Peninsula. Queensland Archaeological
Research 7:57-72.
Hughes, P. 2005 Comments on Geomorphology and Depth Distribution of
Artefacts Following Fieldwork on 15 and 16 December 2005. Unpublished
report to Eastlink.
Hughes, P. 2006 Geomorphic History of the Sands at Bend Road 1. Unpublished
typescript.
Long, A. 2008 Ethnohistory. In J. Allen, G. Hewitt and J. de Lange, Report on Bend
Road Archaeological Investigations: Bend Road 1, Phases 1 to 3. Unpublished
report to Thiess John Holland.

16 Number 70, June 2010
Site Disturbance and Archaeological Integrity
Long, A. and P. Hughes 2005 Eastlink SSTA 23, Keysborough: A Geoarchaeological
Appraisal of the Landform and its Implications for the Eastlink Project.
Unpublished report to Thiess John Holland – Eastlink.
McNiven, I.J., L.M. Brady and A.J. Barham 2009 Kabadul Kula and the antiquity of
Torres Strait rock art. Australian Archaeology 69:29-40.
Morwood, M.J. and L. Dagg 1995 Excavations at Yam Camp. In M.J. Morwood and
D.R. Hobbs (eds), Quinkan Prehistory: The Archaeology of Aboriginal Art in
S.E. Cape York Peninsula, Australia, pp.107-115. Tempus 3. St Lucia, QLD:
Anthropology Museum, University of Queensland.
Nash, D.T. and M.D. Petraglia 1987 Natural formation processes and the
archaeological record: Present problems and future requisites. In D.T. Nash
and M.D. Petraglia (eds), Natural Formation Processes and the Archaeological
Record, pp.186-204. BAR International Series 352. Oxford: Archaeopress.
O’Connell, J.F.1987 Alyawara site structure and its archaeological implications.
American Antiquity 52(1):74-108.
O’Connell, J.F. and J. Allen 1998 When did humans first arrive in Greater Australia,
and why is it important to know? EvolutionaryAnthropology 6:132-146.
Orr, M. 2006. Particle Size Analysis Report, Bend Road 1 and Bend Road 2 Pit
C. Unpublished report to School of Geography and Environmental Science,
Monash University.
Orr, M. and C. White 2007 Particle Size Analysis Report, Bend Road Pits J, L and
N. Unpublished report to School of Geography and Environmental Science,
Monash University.
Ossa, P., B. Marshall and C. Webb 1995 New Guinea II Cave: A Pleistocene site on the
Snowy River, Victoria. Archaeology in Oceania 30(1):22-35.
Rhodes, D. 2004. Report on an Archaeological Excavation of a Pre-Contact
Bunurong Campsite, Lakeside Estate, Pakenham. Unpublished report to
Delphin Lendlease.
Richards, T., C. Pavlides, K. Walshe, H. Webber and R. Johnston 2007 Box Gully: New
evidence for Aboriginal occupation south of the Murray River prior to the last
glacial maximum. Archaeology in Oceania 42(1):1-11.
Richardson, N.1992 Conjoin sets and stratigraphic integrity in a sandstone shelter:
Kenniff Cave (Queensland, Australia). Antiquity 66:408-418.
Richardson, N.1996 Seeing is believing: A graphical illustration of the vertical
and horizontal distribution of conjoined artefacts using DesignCAD 3D. In
S. Ulm, I. Lilley and A. Ross (eds), Australian Archaeology ‘95: Proceedings
of the 1995 Australian Archaeological Association Annual Conference,
pp.81-95. Tempus 6. St Lucia: Anthropology Museum, University of
Queensland.
Rick, J.W. 1976 Downslope movement and archaeological intrasite spatial analysis.
American Antiquity 41:133-144.
Roberts, R.G., T.F. Flannery, L.K. Ayliffe, H. Yoshida, J.M. Olley, G.J. Prideaux, G.M.
Laslett, A. Baynes, M.A. Smith, R. Jones and B.L. Smith 2001 New ages for the
last Australian megafauna: Continent-wide extinction about 46,000 years ago.
Science 292:1888-1892.
Roberts, R.G., R. Jones, M.A. Smith 1990 Stratigraphy and statistics at Malakunanja
II: Reply to Hiscock. Archaeology in Oceania 25(3):125-129.
Roberts, R.G., R. Jones, N.A. Spooner, M.J. Head, A.S. Murray and M.A. Smith 1994
The human colonization of Australia: Optical dates of 53,000 and 60,000
bracket human arrival at Deaf Adder Gorge, Northern Territory. Quaternary
Science Reviews 13:575-583.
Schiffer, M.B.1972 Archaeological context and systemic context. American
Antiquity 37:156-165.
Slack, M., R. Fullagar, J. Field and A. Border 2004 New Pleistocene dates for backed
artefact technology in Australia. Archaeology in Oceania 39(3):131-137.
Smith, M.A., J.R. Prescott and M.J. Head 1997 Comparison of 14C and luminescence
chronologies at Puritjarra rock shelter, Central Australia. Quaternary Science
Reviews 16:299-320.
Solomon, S. and B. David 1990 Middle range theory and actualistic studies:
Bones and dingoes in Australian archaeology. In S. Solomon, I. Davidson
and D. Watson (eds), Problem Solving in Taphonomy: Archaeological and
Palaeontological Studies from Europe, Africa and Oceania, pp.234-256. Tempus
2. St Lucia, QLD: Anthropology Museum, University of Queensland.
Solomon, S., I. Davidson and D. Watson (eds) Problem Solving in Taphonomy:
Archaeological and Palaeontological Studies from Europe, Africa and Oceania.
Tempus 2. St Lucia, QLD: Anthropology Museum, University of Queensland.
Solomon, S., M. Minnegal and P. Dwyer 1986. Bower birds, bones and archaeology.
Journal of Archaeological Science13:307-318.
Stein, J. K.1983 Earthworm activity: A source of potential disturbance of
archaeological sediments. American Antiquity 48:277-289.
Stockton, E.D.1973 Shaw’s Creek shelter: Human displacement of artefacts and its
significance. Mankind 9:112-117.
Stuiver, M. and P.J. Reimer 1993 Extended 14C data base and revised CALIB 3.0 14C
age calibration program. Radiocarbon 35:215-230.
Tardis Enterprises Pty Ltd 2005 Eastlink SSTA 23: Preliminary Summary of
Archaeological Sub-Surface Testing Results. Unpublished report to Thiess
John Holland.
Thorson, R.M. and T.D. Hamilton 1977 Geology of the Dry Creek Site; a stratified
Early Man site in interior Alaska. Quaternary Research 7:149-176.
Turney, C.S.M., M. Bird, L.K. Fifield, R.G. Roberts, M.A. Smith, C.E. Dortch, R. Grün,
E. Lawson, L.K. Ayliffe, G.H. Miller, J. Dortch, J. and R.G. Cresswell 2001 Early
human occupation at Devil’s Lair, southwestern Australia, 50,000 years ago.
Quaternary Research 55:3-13.
Vines, G. 1997 Scoresby Transport Corridor EES. Heritage and Archaeological
Assessment. Final Report. Unpublished report to Sinclair Knight Merz,
Melbourne’s Living Museum of the West Inc.
Vines, G. 2003 Archaeological Survey and Geotechnical Monitoring, Mitcham-
Frankston Freeway. Project No. 2911. Report to VicRoads by Biosis Research
Pty Ltd.
Watchman, A. 2006 Bend Road Archaeological Investigations, Sands Component.
Draft report by Slatco Pty Ltd, South Townsville to Thiess John Holland.
Watson, J.A.L. and J.M. Flood 1987 Termite and wasp damage to Australian rock art.
Rock Art Research 4(1):17-28.
Weninger, B. and O. Jöris 2008 A 14C age calibration curve for the last 60 ka: The
Greenland-Hulu U/Th timescale and its impact on understanding the Middle
to Upper Paleolithic transition in Western Eurasia. Journal of Human Evolution
55:772-781.
Williams, M.A.J. 1968 Termites and soil development near Brock’s Creek, Northern
Territory. Australian Journal of Science 31:153-154.
Williams, M.A.J. 1978 Termites, soils and landscape equilibrium in the Northern
Territory of Australia. In J.L. Davies and M.A.J. Williams (eds), Landform
Evolution in Australasia, pp.128-141. Canberra: Australian National University
Press.
Wood, W.R. and D.L. Johnson 1978 A survey of disturbance processes in
archaeological site formation. Advances in Archaeological Method and Theory
1:315-381.