site master model s251c antenna and cable analyzer...site master model s251c antenna and cable...
TRANSCRIPT

Site MasterModel S251CAntenna and
Cable Analyzer
User's Guide
Hand-Held Tester for Transmission Linesand other RF Components
Color Front Cover only P/N: 00986-00045


WARRANTYThe Anritsu product(s) listed on the title page is (are) warranted against defects inmaterials and workmanship for one year from the date of shipment.Anritsu's obligation covers repairing or replacing products which prove to be defec-tive during the warranty period. Buyers shall prepay transportation charges forequipment returned to Anritsu for warranty repairs. Obligation is limited to the origi-nal purchaser. Anritsu is not liable for consequential damages.
LIMITATION OF WARRANTYThe foregoing warranty does not apply to Anritsu connectors that have failed due tonormal wear. Also, the warranty does not apply to defects resulting from improper orinadequate maintenance by the Buyer, unauthorized modification or misuse, or op-eration outside the environmental specifications of the product. No other warranty isexpressed or implied, and the remedies provided herein are the Buyer's sole andexclusive remedies.
TRADEMARK ACKNOWLEDGMENTSMS-DOS, Windows, Windows 95, Windows 98, Windows NT, Windows ME, andWindows 2000 are registered trademarks of the Microsoft Corporation.Anritsu and Site Master are trademarks of Anritsu Company.
NOTICEAnritsu Company has prepared this manual for use by Anritsu Company personneland customers as a guide for the proper installation, operation and maintenance ofAnritsu Company equipment and computer programs. The drawings, specifications,and information contained herein are the property of Anritsu Company, and any un-authorized use or disclosure of these drawings, specifications, and information isprohibited; they shall not be reproduced, copied, or used in whole or in part as thebasis for manufacture or sale of the equipment or software programs without theprior written consent of Anritsu Company.
March 2007 10580-00065Copyright � 2001-2007 Anritsu Co. Revision: C


Table of Contents
Chapter 1 - General InformationIntroduction . . . . . . . . . . . . . . . . . . . . . . . . . . . . . . . . . . 1-1Description . . . . . . . . . . . . . . . . . . . . . . . . . . . . . . . . . . . 1-1Standard Accessories . . . . . . . . . . . . . . . . . . . . . . . . . . . . . 1-1Options . . . . . . . . . . . . . . . . . . . . . . . . . . . . . . . . . . . . . 1-2Optional Accessories. . . . . . . . . . . . . . . . . . . . . . . . . . . . . . 1-2Performance Specifications . . . . . . . . . . . . . . . . . . . . . . . . . . 1-3Preventive Maintenance . . . . . . . . . . . . . . . . . . . . . . . . . . . . 1-6ESD Precautions . . . . . . . . . . . . . . . . . . . . . . . . . . . . . . . . 1-6Annual Verification . . . . . . . . . . . . . . . . . . . . . . . . . . . . . . 1-7
Chapter 2 - Functions and OperationsIntroduction . . . . . . . . . . . . . . . . . . . . . . . . . . . . . . . . . . 2-1Test Connector Panel . . . . . . . . . . . . . . . . . . . . . . . . . . . . . 2-1Front Panel Overview . . . . . . . . . . . . . . . . . . . . . . . . . . . . . 2-2Function Hard Keys . . . . . . . . . . . . . . . . . . . . . . . . . . . . . . 2-3Keypad Hard Keys . . . . . . . . . . . . . . . . . . . . . . . . . . . . . . . 2-4Soft Keys. . . . . . . . . . . . . . . . . . . . . . . . . . . . . . . . . . . . 2-6Power Monitor Menu (Option 5) . . . . . . . . . . . . . . . . . . . . . . . 2-10
RF Source Menu . . . . . . . . . . . . . . . . . . . . . . . . . . . . . . . 2-11Symbols. . . . . . . . . . . . . . . . . . . . . . . . . . . . . . . . . . . . 2-15Self Test . . . . . . . . . . . . . . . . . . . . . . . . . . . . . . . . . . . 2-15Error Codes . . . . . . . . . . . . . . . . . . . . . . . . . . . . . . . . . . 2-16
Self Test Errors . . . . . . . . . . . . . . . . . . . . . . . . . . . . . . . . . . . 2-16Range Errors . . . . . . . . . . . . . . . . . . . . . . . . . . . . . . . . . . . . 2-17
Battery Information. . . . . . . . . . . . . . . . . . . . . . . . . . . . . . 2-18Charging a New Battery . . . . . . . . . . . . . . . . . . . . . . . . . . . 2-18
Charging the Battery in the Site Master . . . . . . . . . . . . . . . . . . . . . . 2-18Charging the Battery in the Optional Charger . . . . . . . . . . . . . . . . . . . 2-18Battery Charge Indicator . . . . . . . . . . . . . . . . . . . . . . . . . . . . . . 2-19Battery Life . . . . . . . . . . . . . . . . . . . . . . . . . . . . . . . . . . . . . 2-19Important Battery Information . . . . . . . . . . . . . . . . . . . . . . . . . . . 2-20
Chapter 3 - Getting StartedIntroduction . . . . . . . . . . . . . . . . . . . . . . . . . . . . . . . . . . 3-1Power On Procedure . . . . . . . . . . . . . . . . . . . . . . . . . . . . . . 3-1
Select the Frequency or Distance . . . . . . . . . . . . . . . . . . . . . . . 3-2
Calibration . . . . . . . . . . . . . . . . . . . . . . . . . . . . . . . . . . . 3-2Calibration Procedure - Single Port . . . . . . . . . . . . . . . . . . . . . . . . . 3-3Calibration Procedure - Dual Port . . . . . . . . . . . . . . . . . . . . . . . . . . 3-4
Setting the Scale . . . . . . . . . . . . . . . . . . . . . . . . . . . . . . . . 3-5Auto Scale . . . . . . . . . . . . . . . . . . . . . . . . . . . . . . . . . . . . . . 3-5Amplitude Scale . . . . . . . . . . . . . . . . . . . . . . . . . . . . . . . . . . . 3-5
Save and Recall a Setup . . . . . . . . . . . . . . . . . . . . . . . . . . . . 3-5
i
Saving a Setup . . . . . . . . . . . . . . . . . . . . . . . . . . . . . . . . . . . . 3-5Recalling a Setup. . . . . . . . . . . . . . . . . . . . . . . . . . . . . . . . . . . 3-5
Save and Recall a Display . . . . . . . . . . . . . . . . . . . . . . . . . . . 3-5Saving a Display . . . . . . . . . . . . . . . . . . . . . . . . . . . . . . . . . . . 3-5Recalling a Display . . . . . . . . . . . . . . . . . . . . . . . . . . . . . . . . . 3-6
Set the Distance and Cable Type . . . . . . . . . . . . . . . . . . . . . . . 3-7
Changing the Units . . . . . . . . . . . . . . . . . . . . . . . . . . . . . . 3-7
Changing the Display Language . . . . . . . . . . . . . . . . . . . . . . . . 3-7Printing. . . . . . . . . . . . . . . . . . . . . . . . . . . . . . . . . . . . . 3-8
Printing a Screen . . . . . . . . . . . . . . . . . . . . . . . . . . . . . . . . . . . 3-8Printer Switch Settings . . . . . . . . . . . . . . . . . . . . . . . . . . . . . . . . 3-9
Using the Soft Carrying Case. . . . . . . . . . . . . . . . . . . . . . . . . 3-10
Chapter 4 - Cable & Antenna AnalysisIntroduction . . . . . . . . . . . . . . . . . . . . . . . . . . . . . . . . . . 4-1One Port Measurements . . . . . . . . . . . . . . . . . . . . . . . . . . . . 4-1Line Sweep Fundamentals . . . . . . . . . . . . . . . . . . . . . . . . . . . 4-1
Information Required for a Line Sweep . . . . . . . . . . . . . . . . . . . . 4-2
Typical Line Sweep Test Procedures . . . . . . . . . . . . . . . . . . . . . 4-3System Return Loss Measurement. . . . . . . . . . . . . . . . . . . . . . . . . . 4-3Insertion Loss Measurement . . . . . . . . . . . . . . . . . . . . . . . . . . . . . 4-5Distance-To-Fault (DTF) Transmission Line Test. . . . . . . . . . . . . . . . . . 4-8Antenna Subsystem Return Loss Test . . . . . . . . . . . . . . . . . . . . . . . 4-10
Two Port Measurements . . . . . . . . . . . . . . . . . . . . . . . . . . . 4-12Introduction . . . . . . . . . . . . . . . . . . . . . . . . . . . . . . . . . . 4-12
TMA Measurements . . . . . . . . . . . . . . . . . . . . . . . . . . . . . 4-13Antenna to Antenna Isolation. . . . . . . . . . . . . . . . . . . . . . . . . 4-19Introduction . . . . . . . . . . . . . . . . . . . . . . . . . . . . . . . . . . 4-19
Antenna-to-Antenna Isolation Measurement . . . . . . . . . . . . . . . . . 4-20
Chapter 5 - Site Master Software ToolsIntroduction . . . . . . . . . . . . . . . . . . . . . . . . . . . . . . . . . . 5-1Features . . . . . . . . . . . . . . . . . . . . . . . . . . . . . . . . . . . . 5-1System Requirements . . . . . . . . . . . . . . . . . . . . . . . . . . . . . 5-1Installation . . . . . . . . . . . . . . . . . . . . . . . . . . . . . . . . . . . 5-2
Communication Port Setting . . . . . . . . . . . . . . . . . . . . . . . . . . . . . 5-2Interface Cable Installation . . . . . . . . . . . . . . . . . . . . . . . . . . . . . 5-3
Using Software Tools . . . . . . . . . . . . . . . . . . . . . . . . . . . . . 5-3Downloading Traces from the Site Master . . . . . . . . . . . . . . . . . . 5-3
Plot Capture . . . . . . . . . . . . . . . . . . . . . . . . . . . . . . . . . . 5-4
Plot Properties . . . . . . . . . . . . . . . . . . . . . . . . . . . . . . . . . 5-4Trace Overlay or Plot Overlay . . . . . . . . . . . . . . . . . . . . . . . . . . . . 5-5Saving Traces . . . . . . . . . . . . . . . . . . . . . . . . . . . . . . . . . . . . 5-5Custom Cable List . . . . . . . . . . . . . . . . . . . . . . . . . . . . . . . . . . 5-6Creating a Database . . . . . . . . . . . . . . . . . . . . . . . . . . . . . . . . . 5-7Printing Formats . . . . . . . . . . . . . . . . . . . . . . . . . . . . . . . . . . . 5-7
ii

Appendix A - Reference DataCoaxial Cable Technical Data. . . . . . . . . . . . . . . . . . . . . . . . . A-1
Appendix B - WindowingIntroduction . . . . . . . . . . . . . . . . . . . . . . . . . . . . . . . . . . B-1
Examples . . . . . . . . . . . . . . . . . . . . . . . . . . . . . . . . . . . B-1
iii/iv
Chapter 1General Information
IntroductionThis chapter provides a description, performance specifications, optional accessories, pre-ventive maintenance, and calibration requirements for the Site Master model S251C.Throughout this manual, the term Site Master will refer to the S251C.
Model Frequency Range PortsS251C 625 to 2500 MHz 2
DescriptionThe Site Master is a hand held SWR/RL (standing wave ratio/return loss), transmissiongain/loss and Distance-To-Fault (DTF) measurement instrument that includes a built-insynthesized signal source. The S251C includes a keypad to enter data and a VGA (640 �
480) liquid crystal display (LCD) to provide graphic indications of SWR, RL (dB) over theselected frequency range and distance. The Site Master is capable of up to 2.5 hours of con-tinuous operation from a fully charged field-replaceable battery and can be operated from a12.5 VDC source. Built-in energy conservation features can be used to extend battery lifeover an eight-hour work day.
The Site Master is designed for measuring SWR, return loss, or one-port cable insertionloss and fault locations of RF components in antenna systems. Power monitoring is avail-able as an option. Site Master model S251C includes transmission gain or loss (S21) mea-surements and an optional built-in bias tee. The displayed trace can be scaled or enhancedwith frequency markers or a limit lines. A menu option provides for an audible “beep”when the limit value is exceeded. To permit use in low-light environments, the LCD can beback lit using a front panel key.
Standard AccessoriesThe Software Tools PC-based software program provides a database record for storingmeasurement data. Site Master Software Tools can also convert the Site Master display to aMicrosoft Windows� 95/98/2000/ME/NT workstation graphic. Measurements stored in theSite Master internal memory can be downloaded to the PC, and vice versa, using the in-cluded null-modem serial cable. Once stored, the graphic trace can be displayed, scaled, orenhanced with markers and limit lines. Historical graphs can be overlaid with current data,and underlying data can be extracted and used in spreadsheets or for other analytical tasks.
The Site Master Software Tools program can display all of the measurements made with theSite Master (SWR, return loss, cable loss, distance-to-fault) as well as providing other func-tions, such as converting display modes and Smith charts. Refer to Chapter 5, SoftwareTools, for more information.
1 - 1
1

The following items are supplied with the basic hardware.
� Soft Carrying Case
� AC-DC Adapter
� Automotive Cigarette Lighter 12 Volt DC Adapter,
� CDROM disk containing the Software Tools program. This program contains Fault Lo-cation (DTF) and Smith Chart functions
� Serial Interface Cable (null modem type)
� One year Warranty (includes battery, firmware, and software)
� User's Guide
Options� Option 5 — Add RF Wattmeter Power Monitor
� Option 10A � Add Bias Tee
Optional Accessories� Anritsu Precision N (m) Open/Short/Load, 42 dB, Part No. OSLN50LF
� Anritsu Precision N (f) Open/Short/Load, 42 dB, Part No. OSLNF50LF
� Anritsu Precision N (m) Short/Open, Part No. 22N50
� Anritsu Precision N (f) Short/Open, Part No. 22NF50
� Site Master Precision N (m) Load, 42 dB, Part No. SM/PL
� Site Master Precision N (f) Load, 42 dB, Part No. SM/PLNF
� 7/16 (m) Precision Open/Short/Load, Part No. 2000-767
� 7/16 (f) Precision Open/Short/Load, Part No. 2000-768
� Adapter, Precision N (m) to N (m), Part No. 34NN50A
� Adapter, Precision N (f) to N (f), Part No. 34NFNF50
� Adapter, 7/16 (f) to N (m), Part No. 510-90
� Adapter, 7/16 (f) to N (f), Part No. 510-91
� Adapter, 7/16 (m) to N (m), Part No. 510-92
� Adapter, 7/16 (m) to N (f), Part No. 510-93
� Adapter, 7/16 DIN (m) to 7/16 DIN (m), Part No. 510-96
� Adapter, 7/16 DIN (f) to 7/16 DIN (f), Part No. 510-97
� Armored Test Port Extension Cable, 1.5 meter, N (m) toN (f), Part No. 15NNF50-1.5C
� Armored Test Port Extension Cable, 3.0 meter, N (m) toN (f), Part No. 15NNF50-3.0C
� Armored Test Port Extension Cable, 5.0 meter, N (m) toN (f), Part No. 15NNF50-5.0C
1 - 2
Chapter 1 General Information

� Armored Test Port Extension Cable, 1.5 meter, N (m) toN (m), Part No. 15NN50-1.5C
� Armored Test Port Extension Cable, 3.0 meter, N (m) toN (m), Part No. 15NN50-3.0C
� Armored Test Port Extension Cable, 5.0 meter, N (m) toN (m), Part No. 15NN50-5.0C
� Armored Test Port Extension Cable, 1.5 meter, N (m) to7/16 DIN (f), Part No. 15NDF50-1.5C
� Armored Test Port Extension Cable, 1.5 meter, N (m) to7/16 DIN (m), Part No. 15ND50-1.5C
� RF Detector, 1 to 3000 MHz, N(m) input connector, 50 Ohms, Part No. 5400-71N50
� RF Detector, 0.01 to 20 GHz, N(m) input connector, 50 Ohms, Part No. 560-7N50B
� Transit Case for Site Master, Part No. 760-215A
� HP Deskjet 350 Printer, Part No. 2000-766
� Serial-to-Parallel Converter Cable (use with the HP 350 Printer), Part No. 2000-753
� Seiko DPU-414 Thermal Printer, Part No. 2000-754 (U.S.) or2000-761 (Europe)
� US Adapter (use with the DPU-414 Printer),Part No. 2000-1002
� Europe Adapter (use with the DPU-414 Printer)Part No. 2000-1003
� Japan Adapter (use with the DPU-414 Printer)Part number 2000-1194
� Battery Pack (use with the DPU-414 Printer)Part No. 2000-1004
� Serial Interface Cable (use with the DPU-414 Printer),Part No. 2000-10012
� Thermal Paper (use with the DPU-411/DPU-414 Printer),Part No. 2000-755
� Rechargeable Battery, NiMHPart No. 633-27
� Battery Charger, NiMH onlyPart No. 2000-1029
Performance SpecificationsPerformance specifications are provided in Table 1-1, on the following page.
1 - 3
Chapter 1 General Information

1 - 4
Chapter 1 General Information
Specifications are valid when the unit is calibrated at ambient temperature after a 5 minutewarmup.
Description ValueSite Master: Frequency Range:
S251C 625 to 2500 MHz
Frequency Accuracy (RF Source Mode): �75 parts per million @ 25°C*
Frequency Resolution: 10 kHz
SWR:RangeResolution
1.00 to 65.000.01
Return Loss:RangeResolution
0.00 to 54.00 dB0.01 dB
**Distance-To-Fault (DTF):Range (in meters)Resolution (in meters)(Rectangular Windowing)
0 to (Resolution x (dp–1)) a maximum of1000m (3281 ft.) with a maximum of 517 pointsresolution, # of data pts. = 130, 259, 517
( . )( )1 5 108� VF
f�
Where Vf is the relative propagation velocity ofthe cable .dp is the number of data points (130, 259,517).�F is F2 - F1 (in Hz.)
Insertion Loss/GainRange:Resolution
RF SourceFrequencyPower Output (nominal)
RF Power Monitor:Range
Offset RangeResolution
–90.00 to +50.00 dB0.01 dB
625 to 2500 MHz @ 10 kHz stepselectable, – 30 dBm or + 6 dBm
–80.0 to +80 dBm or10.0 pW to 100.0 kW0 to +60.0 dB0.1 dB or0.1 xW
Test Port, Type N 50 Ohms
***Immunity to Interfering signalsup to the level of:
on-frequency
on-channel
RF out +10 dBm, reflectionRF in +30 dBc, transmissionRF out +17 dBm, reflection
Maximum Input (Damage Level):Test Port, Type NRF Detector
+22 dBm+20 dBm
Measurement Accuracy:Measurement accuracy depends on calibration components. Precision calibration load providesa corrected directivity of 42 dB.
Table 1-1. Performance Specifications (1 of 2)
1 - 5
Chapter 1 General Information
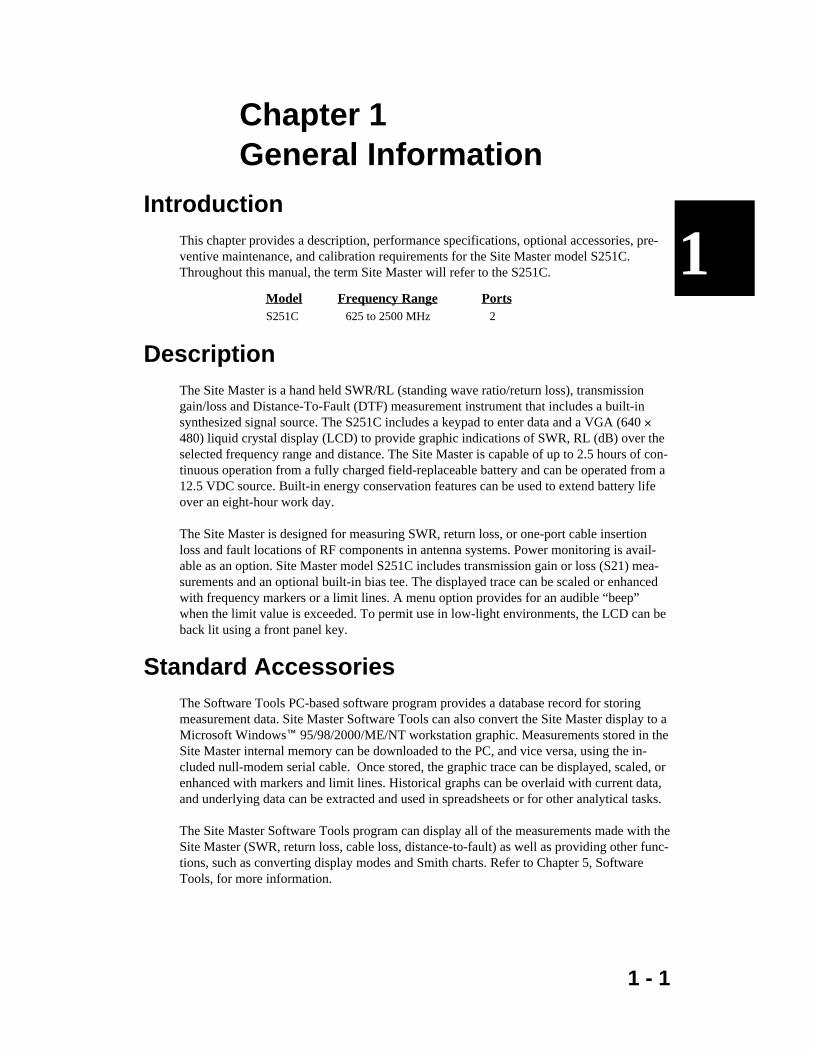
Cable Insertion Loss:RangeResolution
0.00 to 54.00 dB0.01 dB
Bias Teeinput voltage:output current:
12.5 to 15.0 Vdc270 ma maximum surge, 25 ms240 ma maximum steady
General
Internal Memory:Trace MemoryInstrument config.RS-232
200 maximum10 setup locations with associated calibration9 pin D-sub, three wire serial
Electromagnetic Compatibility Meets European Community requirements forCE marking
Power Supply:External DC Input +11 to +15 Vdc, 1250 mA max.
Temperature:StorageOperation
–20° C to 75° C0° C to 50° C
Weight: 1.82 kg (4.0 pounds)
Dimensions: 25.4 x 17.8 x 6.1 cm(10 x 7 x 2.4 inches)
* ±2 ppm/�°C from 25°C** Fault location is accomplished by inverse Fourier Transformation of data taken with the Site Master. Resolution andmaximum range depend on the number of frequency data points, frequency sweep range and relative propagation veloc-ity of the cable being tested.*** Immunity measurement is made in CW mode with incoming interfering signal exactly at the same frequency (worstcase situation). Typical immunity is better when swept frequency is used.
Table 1-2. Performance Specifications (2 of 2)

Preventive MaintenanceSite Master preventive maintenance consists of cleaning the unit and inspecting and clean-ing the RF connectors on the instrument and all accessories.
Clean the Site Master with a soft, lint-free cloth dampened with water or water and a mildcleaning solution.
CAUTION: To avoid damaging the display or case, do not use solvents or abra-sive cleaners.
Clean the RF connectors and center pins with a cotton swab dampened with denatured alco-hol. Visually inspect the connectors. The fingers of the N (f) connectors and the pins of theN (m) connectors should be unbroken and uniform in appearance. If you are unsure whetherthe connectors are good, gauge the connectors to confirm that the dimensions are correct.
Visually inspect the test port cable(s). The test port cable should be uniform in appearance,not stretched, kinked, dented, or broken.
ESD PrecautionsThe Site Master, like other high performance instruments, is susceptible to ESD damage.Very often, coaxial cables and antennas build up a static charge, which, if allowed to dis-charge by connecting to the Site Master, may damage the Site Master input circuitry. SiteMaster operators should be aware of the potential for ESD damage and take all necessaryprecautions. Operators should exercise practices outlined within industry standards likeJEDEC-625 (EIA-625), MIL-HDBK-263, and MIL-STD-1686, which pertain to ESD andESDS devices, equipment, and practices.
As these apply to the Site Master, it is recommended to dissipate any static charges thatmay be present before connecting the coaxial cables or antennas to the Site Master. Thismay be as simple as temporarily attaching a short or load device to the cable or antennaprior to attaching to the Site Master. It is important to remember that the operator may alsocarry a static charge that can cause damage. Following the practices outlined in the abovestandards will insure a safe environment for both personnel and equipment.
1 - 6
Chapter 1 General Information

Annual VerificationAnritsu recommends an annual calibration and performance verification of the Site Masterand the OSL calibration components by local Anritsu service centers. Anritsu service cen-ters are listed in Table 1-2 on the following page.
The Site Master itself is self-calibrating, meaning that there are no field-adjustable compo-nents. However, the OSL calibration components are crucial to the integrity of the calibra-tion and therefore, must be verified periodically to ensure performance conformity. This isespecially important if the OSL calibration components have been accidentally dropped orover-torqued.
1 - 7
Chapter 1 General Information

1 - 8
Chapter 1 General Information
UNITED STATESANRITSU COMPANY685 Jarvis DriveMorgan Hill, CA 95037-2809Telephone: (408) 776-8300FAX: 408-776-1744
ANRITSU COMPANY10 NewMaple Ave., Suite 305Pine Brook, NJ 07058Telephone: 973-227-8999FAX: 973-575-0092
ANRITSU COMPANY1155 E. Collins BlvdRichardson, TX 75081Telephone: 1-800-ANRITSUFAX: 972-671-1877
AUSTRALIAANRITSU PTY. LTD.Unit 3, 170 Foster RoadMt Waverley, VIC 3149AustraliaTelephone: 03-9558-8177FAX: 03-9558-8255
BRAZILANRITSU ELECTRONICA LTDA.Praia de Botafogo 440. Sala 2401CEP22250-040,Rio de Janeiro,RJ,BrasilTelephone: 021-527-6922FAX: 021-53-71-456
CANADAANRITSU INSTRUMENTS LTD.700 Silver Seven Road, Suite 120Kanata, Ontario K2V 1C3Telephone: (613) 591-2003FAX: (613) 591-1006
CHINA (SHANGHAI)ANRITSU ELECTRONICS CO LTD2F,Rm.B, 52 Section Factory Bldg.NO 516 Fu Te Road (N)Waigaoqiao Free Trade ZonePudong, Shanghai 200131PR CHINATelephone: 86-21-58680226FAX: 86-21-58680588
FRANCEANRITSU S.A9 Avenue du QuebecZone de Courtaboeuf91951 Les Ulis CedexTelephone: 016-09-21-550FAX: 016-44-61-065
GERMANYANRITSU GmbHGrafenberger Allee 54-56D-40237 DusseldorfGermanyTelephone: 0211-968550FAX: 0211-9685555
INDIAMEERA AGENCIES (P) LTDA-23 Hauz KhasNew Delhi, India 110 016Telephone: 011-685-3959FAX: 011-686-6720
ISRAELTECH-CENT, LTD4 Raul Valenberg St.Tel-Aviv, Israel 69719Telephone: 972-36-478563FAX: 972-36-478334
ITALYANRITSU Sp.ARome OfficeVia E. Vittorini, 12900144 Roma EURTelephone: (06) 50-2299-711FAX: 06-50-22-4252
JAPANANRITSU CUSTOMER SERVICE LTD.1800 Onna Atsugi—shiKanagawa-Prf. 243 JapanTelephone: 0462-96-6688FAX: 0462-25-8379
KOREAANRITSU SERVICE CENTER8F Sanwon Bldg.1329-8 Seocho-DongSeocho-KuSeoul, Korea 137-070Telephone: 82-2-581-6603FAX: 82-2-582-6603
SINGAPOREANRITSU (SINGAPORE) PTE LTD10, Hoe Chiang Road#07-01/02Keppel TowersSingapore 089315Telephone:65-282-2400FAX:65-282-2533
SOUTH AFRICAETESCSA12 Surrey Square Office Park330 Surrey AvenueFerndale, Randburt, 2194South AfricaTelephone: 011-27-11-787-7200Fax: 011-27-11-787-0446
SWEDENANRITSU ABBotvid CenterFittja Backe 13A145 84Stockholm, SwedenTelephone: (08) 534-707-00FAX: (08)534-707-30
TAIWANANRITSU CO., LTD.6F, No. 96, Section 3Chien Kuo N. RoadTaipei, Taiwan, R.O.C.Telephone: (02) 515-6050FAX: (02) 509-5519
UNITED KINGDOMANRITSU LTD.200 Capability GreenLuton, BedfordshireLU1 3LU, EnglandTelephone: 015-82-43-3200FAX: 015-82-73-1303
Table 1-2. Anritsu Service Centers

Chapter 2Functions and Operations
IntroductionThis chapter provides a brief overview of the Site Master functions and operations, provid-ing the user with a starting point for making basic measurements. For more detailed infor-mation, refer to Chapter 4, Measurements and Chapter 5, Software Tools.
The Site Master is designed specifically for field environments and applications requiringmobility. As such, it is a lightweight, handheld, battery operated unit which can be easilycarried to any location, and is capable of up to 2.5 hours of continuous operation from afully charged battery. Built-in energy conservation features allow battery life to be extendedover an eight-hour workday. The Site Master can also be powered by a 12.5 VDC externalsource. The external source can be either the Anritsu AC-DC Adapter (P/N 40-115) or 12.5Vdc Automotive Cigarette Lighter Adapter (P/N 806-62). Both items are standard accesso-ries.
Test Connector PanelThe connectors and indicators located on the test panel are listed and described below.
12.5-15VDC(1100 mA)
12.5 to 15 Vdc @ 1100 mA input to power the unit or for battery charging.
WARNING
When using the AC-DC Adapter, always use a three-wire power cable connectedto a three-wire power line outlet. If power is supplied without grounding the equip-ment in this manner, there is a risk of receiving a severe or fatal electric shock.
BatteryCharging
Illuminates when the battery is being charged. The indicator automatically shutsoff when the battery is fully charged.
ExternalPower
Illuminates when the Site Master is being powered by the external charging unit.
SerialInterface
RS232 DB9 interface to a COM port on a personal computer (for use with theAnritsu Software Tools program) or to a supported printer.
RF Out RF output, 50 � impedance, for reflection measurements.
RF In RF input 50 � impedance for transmission loss or gain measurement.
RF Detector RF detector input for the Power Monitor.
2 - 1
2
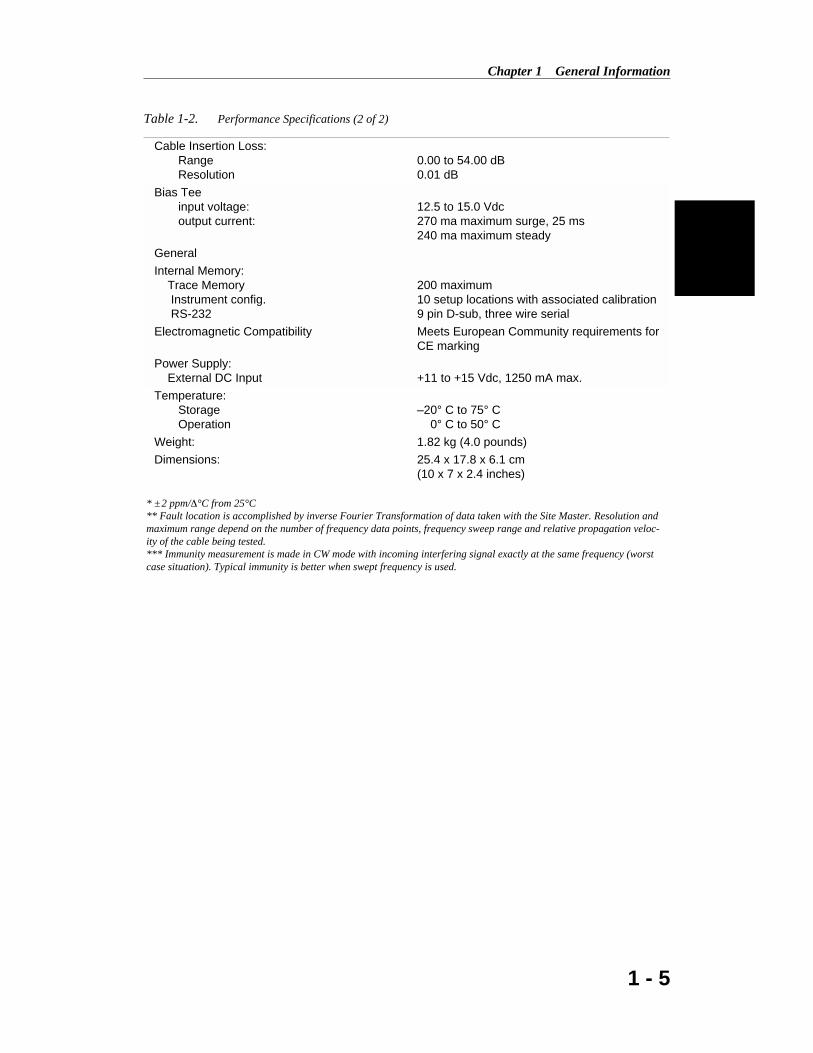
Front Panel OverviewThe Site Master menu-driven user interface is easy to use and requires little training. Hardkeys on the front panel are used to initiate function-specific menus. There are four functionhard keys located below the display, Mode, Frequency/Distance, Amplitude and Sweep.
There are seventeen keypad hard keys located to the right of the display. Twelve of the key-pad hard keys are dual purpose, depending on the current mode of operation. The dual pur-pose keys are labeled with one function in black, the other in blue.
There are also six soft keys that change function depending upon the current mode selec-tion. The current soft key function is indicated in the active function block to the right ofthe display. The locations of the different keys are illustrated in Figure 2-1.
The following sections describe the various key functions.
2 - 2
Chapter 2 Functions and Operations
Soft Keys
ActiveFunction
Block
KeypadHardKeys
Function Hard Keys
HOLDRUN
STARTCAL
AUTOSCALE
SAVESETUP
RECALLSETUP
LIMIT MARKER
SAVEDISPLAY
RECALLDISPLAY
MODE FREQ/DIST AMPLITUDE SWEEP
SYS
ENTER
CLEAR
ESCAPE
ONOFF
/
1 2
4
5 6
7 8
9 0
3
+-
.
Site Master S251C
Figure 2-1. Site Master Soft Keys

Function Hard KeysMODE Opens the mode selection box (below). Use the Up/Down arrow key to select a
mode. Press the ENTER key to implement.
FREQ/DIST Displays the Frequency or Distance to Fault softkey menus depending on themeasurement mode.
AMPLITUDE Displays the amplitude softkey menu for the current operating mode.
SWEEP Displays the Sweep function softkey menu for the current operating mode.
2 - 3
Chapter 2 Functions and Operations
MEASUREMENT MODE
FREQ - SWR
RETURN LOSS
CABLE LOSS - ONE PORT
INSERTION LOSS (+6 dBm)
INSERTION GAIN (–30 dBm)
DTF - SWR
RETURN LOSS
POWER MONITOR
RF SOURCE
Figure 2-2. Mode Selection Box

Keypad Hard KeysThis section contains an alphabetical listing of the Site Master front panel keypad controlsalong with a brief description of each. Where necessary, more detailed descriptions of themajor function keys follow.
The following keypad hard key functions are printed in black on the keypad keys.
0-9 These keys are used to enter numerical data as required to setup or per-form measurements.
+/– The plus/minus key is used to enter positive or negative values as requiredto setup or perform measurements.
� The decimal point is used to enter decimal values as required to set up orperform measurements.
ESCAPE
CLEAR
Exits the present operation or clears the display. If a parameter is beingedited, pressing this key will clear the value currently being entered andrestore the last valid entry. Pressing this key again will close the parame-ter. During normal sweeping, pressing this key will move up one menulevel.
UP/DOWN
ARROWS
Increments or decrements a parameter value. The specific parameter valueaffected typically appears in the message area of the LCD.
NOTE: At turn on, before any other keys are pressed, the Up/Down arrow keymay be used to adjust the display contrast. Press ENTER to return to normal op-eration.
ENTER Implements the current action or parameter selection.
ON
OFF
Turns the Anritsu Site Master on or off. When turned on, the system stateat the last turn-off is restored. If the ESCAPE/CLEAR key is held downwhile the ON/OFF key is pressed, the factory preset state will be restored.
SYS Allows selection of display language and system setup parameters.Choices are OPTIONS, CLOCK, SELF TEST, STATUS and LAN-
GUAGE.
2 - 4
Chapter 2 Functions and Operations
The following keypad hard key functions are printed in blue on the keypad keys.
Turns the liquid crystal display (LCD) back-lighting ON or OFF.(Leaving back lighting off conserves battery power.)
LCD Contrast adjust. Use the Up/Down arrow key and ENTER to adjustthe display contrast.
AUTO
SCALE
Automatically scales the display for optimum resolution.
LIMIT Displays the limit menu of the current operating mode.
MARKER Displays the marker menu of the current operating mode.
PRINT Prints the current display to the selected printer via the RS232 serial port.
RECALL
DISPLAY
Recalls a previously saved trace from memory. When the key is pressed, aRecall Trace selection box appears on the display. Select a trace using theUp/Down arrow key and press the ENTER key to implement.
To erase a saved trace, highlight the trace and select the DELETE TRACEsoftkey. To erase all saved traces, select the DELETE ALL TRACESsoftkey.
RECALL
SETUP
Recalls a previously saved setup from memory location 1 through 10.When the key is pressed, a RECALL SETUP selection box appears on thedisplay. Select a setup using the Up/Down arrow key and press theENTER key to implement. Setup 0 recalls the factory preset state.
RUN
HOLD
When in the Run mode, this key starts the Site Master sweeping and pro-vides a sweep measurement trigger; when in the Hold mode, it pauses thesweep and the hold symbol (page 2-15) appears on the LCD. Hold modeconserves battery power.
SAVE
DISPLAY
Saves up to 200 displayed traces to non-volatile memory. When the key ispressed, TRACE NAME: appears in the lower left of the display. Save thedisplay with up to 16 alphanumeric characters for that trace name andpress the ENTER key to implement.
SAVE
SETUP
Saves the current system setup to 1 of 10 internal non-volatile memory lo-cations. When the key is pressed, a SAVE SETUP selection box appearson the display. Use the Up/Down arrow key to select a setup and press theENTER key to implement.
START
CAL
Starts the calibration in SWR, Return Loss, Cable Loss, or DTF measure-ment modes.
2 - 5
Chapter 2 Functions and Operations

Soft KeysEach function key opens a set of soft key selections. Each of the soft keys has a correspond-ing soft key label area on the display. The label identifies the function of the soft key for thecurrent Mode selection.
Figures 2-3 and 2-4 show the soft key labels for each Mode selection. Where necessary,more detailed descriptions of the function keys follow.
2 - 6
Chapter 2 Functions and Operations
MODE=FREQ:
SOFTKEYS: F1
130
F2
259
517
BOTTOM
PAGE UP
SELECTTRACE
PAGEDOWN
BACK
BOTTOMOF
LIST
DELETETRACE
DELETEALL
TRACE
TOP
TOPOF
LIST
ON/OFF
RESOLU-TION
SINGLESWEEP
TRACEMATH
TRACEOVERLAY
FREQ/DIST AMPLITUDE SWEEP
Figure 2-3. Frequency Mode Soft Key Labels
Chapter 2 Functions and Operations
2 - 7
MODE=DTF:
SOFTKEYS:
BOTTOM
TOP
FREQ/DIST AMPLITUDE
D2
DTF AID
MORE
D1
LOSS
CABLE
WINDOW
BACK
PROPVEL
130
259
517
PAGE UP
SELECTTRACE
PAGEDOWN
BACK
BOTTOMOF
LIST
DELETETRACE
DELETEALL
TRACE
TOPOF
LIST
ON/OFF
RESOLU-TION
SINGLESWEEP
TRACEMATH
TRACEOVERLAY
SWEEP
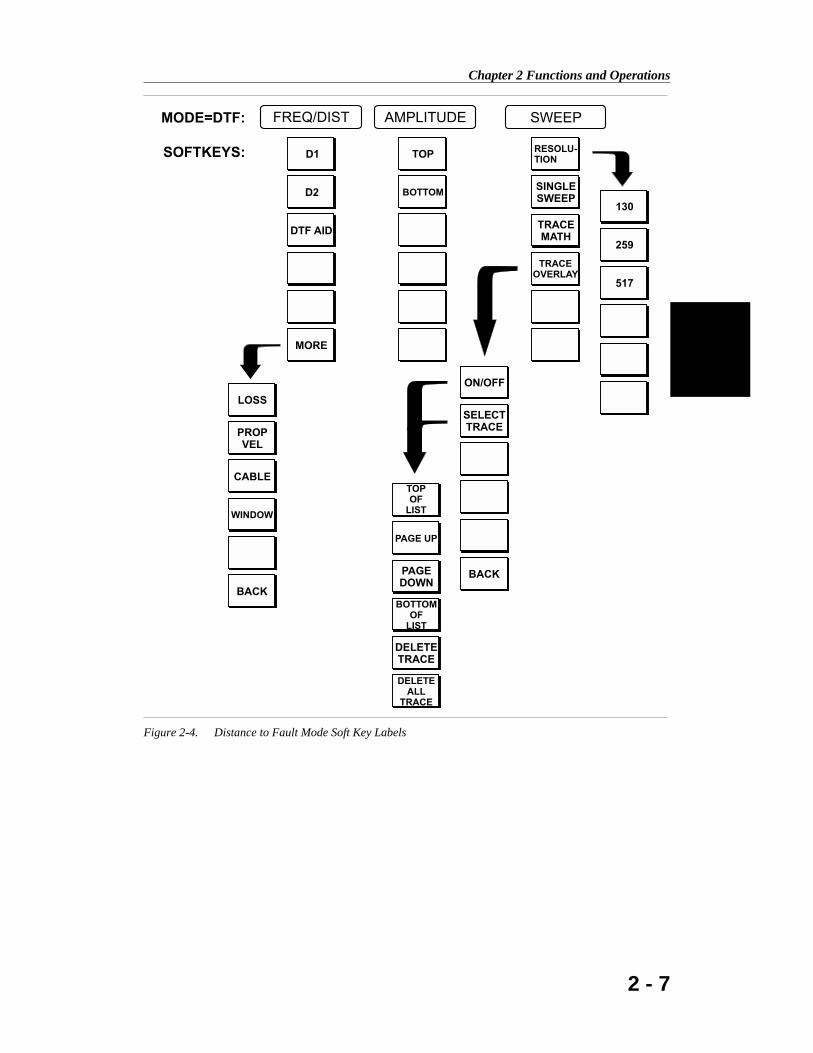
Figure 2-4. Distance to Fault Mode Soft Key Labels
FREQ/DIST Displays the frequency and distance menu depending on the measurement mode.
FrequencyMenu
Provides for setting sweep frequency end points when FREQ mode is selected.Selected frequency values may be changed using the keypad or Up/Down arrowkey.
� F1 — Opens the F1 parameter for data entry. This is the start value for thefrequency sweep. Press ENTER when data entry is complete.
� F2 — Opens the F2 parameter for data entry. This is the stop value for thefrequency sweep. Press ENTER when data entry is complete.
DistanceMenu
Provides for setting Distance to Fault parameters when a DTF mode is selected.Choosing DIST causes the soft keys, below, to be displayed and the correspond-ing values to be shown in the message area. Selected distance values may bechanged using the keypad or Up/Down arrow key.
� D1 — Opens the start distance (D1) parameter for data entry. This is the startvalue for the distance range (D1 default = 0). Press ENTER when data entryis complete.
� D2 — Opens the end distance (D2) parameter for data entry. This is the endvalue for the distance range. Press ENTER when data entry is complete.
� DTF AID — Provides interactive help to optimize DTF set up parameters.Use the Up/Down arrow key to select a parameter to edit. Press ENTER whendata entry is complete.
� MORE — Selects the Distance Sub-Menu, detailed below.
DistanceSub-Menu
Provides for setting the cable loss and relative propagation velocity of the coax-ial cable. Selected values may be changed using the Up/Down arrow key or key-pad.
� LOSS — Opens the Cable Loss parameter for data entry. Enter the loss perfoot (or meter) for the type of transmission line being tested. Press ENTERwhen data entry is complete. (Range is 0.000 to 5.000 dB/m, 1.524 dB/ft)
� PROP VEL (relative propagation velocity) — Opens the Propagation Veloc-ity parameter for data entry. Enter the propagation velocity for the type oftransmission line being tested. Press ENTER when data entry is complete.(Range is 0.010 to 1.000)
� CABLE — Opens a common coaxial cable folder and custom coaxial cablefolder. Select either folder and use the Up/Down arrow key and ENTER tomake a selection. This feature provides a rapid means of setting both cableloss and propagation velocity. (Refer to Appendix A for a listing of commoncoaxial cables showing values for Relative Propagation Velocity and Nomi-nal Attenuation in dB/m @ 1000 MHz, 2000 MHz and 2500 MHz.) The cus-tom cable folder can consist of up to 24 user-defined cable parametersdownloaded via the Site Master Software Tools program.
� WINDOW — Opens a menu of FFT windowing types for the DTF calcula-tion. Scroll the menu using the Up/Down arrow key and make a selectionwith the ENTER key.
� BACK — Returns to the Distance Menu.
2 - 8
Chapter 2 Functions and Operations

AMPLITUDE Displays the amplitude or scale menu depending on the measurement mode.
AmplitudeMenu
Provides for changing the display scale. Selected values may be changed usingthe Up/Down arrow key or keypad.
Choosing AMPLITUDE in FREQ or DTF measurement modes causes the softkeys, below, to be displayed and the corresponding values to be shown in themessage area.
� TOP — Opens the top parameter for data entry and provides for setting thetop scale value. Press ENTER when data entry is complete.
� BOTTOM — Opens the bottom parameter for data entry and provides for set-ting the bottom scale value. Press ENTER when data entry is complete.
SWEEP Displays the Sweep function soft key menu for the current operating mode.
Sweep Menu Provides for changing the display resolution, single or continuous sweep, andaccess to the Trace Math functions.
Choosing SWEEP in FREQ or DTF measurement modes causes the soft keysbelow to be displayed.
� RESOLUTION — Opens the display to change the resolution. Choose 130,259, or 517 data points. (In DTF mode, resolution can be adjusted throughthe DTF-AID table.)
� SINGLE SWEEP — Toggles the sweep between single sweep and continu-ous sweep. In single sweep mode, each sweep must be activated by theRUN/HOLD button.
� TRACE MATH — Opens up the Trace Math functions (trace-memory ortrace+memory) for comparison of the real time trace in the display with anyof the traces from memory. (Not available in DTF mode.)
� TRACE OVERLAY — Opens up the Trace Overlay functions menu to allowthe current trace to be displayed at the same time as a trace in memory.Choose ON or OFF and SELECT TRACE to select the trace from memory toperform trace overlay.
Chapter 2 Functions and Operations
2 - 9

Power Monitor Menu (Option 5)Selecting POWER MONITOR from the Mode menu causes the soft keys, described below,to be displayed and the corresponding values shown in the message area.
� UNITS — Toggles between dBm and Watts.
� REL — Turns relative mode OFF, if currently ON. If relative mode is cur-rently OFF, turns it ON and causes the power level to be measured and savedas the base level. Subsequent measurements are then displayed relative to thissaved value. With units of dBm, relative mode displays dBr; with units ofWatts, relative mode displays % (percent).
� OFFSET — Turns Offset OFF, if currently ON. If Offset is currently OFF,turns it ON and opens the Offset parameter for data entry. Press ENTERwhen data entry is complete.Offset is the attenuation (in dB) inserted in the line between the DUT and theRF detector. The attenuation is added to the measured input level prior to dis-play.
� ZERO — Turns Zero OFF, if currently ON. If Zero is currently OFF, thissoftkey turns it ON and initiates collection of a series of power level samples,which are averaged and saved. This saved value is then subtracted from sub-sequent measurements prior to display.
2 - 10
Chapter 2 Functions and Operations
MODE=POWER MONITOR:
SOFTKEYS: UNITS
REL
OFFSET
ZERO
Figure 2-5. Power Monitor Mode Soft Key Labels

RF Source MenuRF Source mode provides an RF Out source that can be used, for example, in the alignmentof dish antennas. Selecting RF SOURCE from the Mode menu causes the soft keys, de-scribed below, to be displayed:
� FREQ — Allows setting of the RF source frequency. Use the keypad numberkeys to enter a frequency, or use the Up/down arrow key to adjust the fre-quency in 10 kHz steps. Press ENTER to accept, or ESCAPE to restore theprevious value.
� POWER — Selects the RF source output power level. Choose either +6.0dBm or –30.0 dBm.
Chapter 2 Functions and Operations
2 - 11
MODE=RF SOURCE:
SOFTKEYS: FREQ
POWER
Figure . RF Source Softkeys
LIMIT Pressing LIMIT on the data keypad activates a menu of limit related functions.Use the corresponding softkey to select the desired limit function. Then use theUp/Down arrow key to change its value, which is displayed in the message areaat the bottom of the display.
Choosing LIMIT causes the soft keys below to be displayed.
� SINGLE LIMIT — Sets a single limit value in dBm. Menu choices are:ON/OFF
EDIT
BACK
� MULTIPLE UPPER LIMITS — Sets multiple user defined upper limits, andcan be used to create an upper limit mask for quick pass/fail measurements.Menu choices are:
SEGMENT 1
SEGMENT 2
SEGMENT 3
SEGMENT 4
SEGMENT 5
BACK
� MULTIPLE LOWER LIMITS — Set multiple user defined lower limits, andcan be used to create a lower limit mask for quick pass/fail measurements.Menu choices are:
SEGMENT 1
SEGMENT 2
SEGMENT 3
SEGMENT 4
SEGMENT 5
BACK
� LIMIT BEEP — Turns the audible limit beep indicator on or off.
MARKER Choosing MARKER causes the soft keys, below, to be displayed and the corre-sponding values to be shown in the message area. Selected frequency marker ordistance marker values may be changed using the keypad or Up/Down arrowkey.
� M1 — Selects the M1 marker parameter and opens the M1 marker secondlevel menu.
� ON/OFF — Turns the selected marker on or off.
� EDIT — Opens the selected marker parameter for data entry. PressENTER when data entry is complete or ESCAPE to restore the previousvalue.
� MARKER TO PEAK — Places the selected marker at the frequency ordistance with the maximum amplitude value.
� MARKER TO VALLEY — Places the selected marker at the frequency ordistance with the minimum amplitude value.
� BACK — Returns to the Main Markers Menu.
� M2 through M4 — Selects the marker parameter and opens the marker secondlevel menu.
� ON/OFF — Turns the selected marker on or off.
Chapter 2 Functions and Operations
2 - 12

� EDIT — Opens the selected marker parameter for data entry. PressENTER when data entry is complete or ESCAPE to restore the previousvalue.
� DELTA (Mx-M1) — Displays delta amplitude value as well as delta fre-quency or distance for the selected marker with respect to the M1 marker.
� MARKER TO PEAK — Places the selected marker at the frequency ordistance with the maximum amplitude value.
� MARKER TO VALLEY — Places the selected marker at the frequency ordistance with the minimum amplitude value.
� BACK — Returns to the Main Markers Menu.
� M5 — Selects the M5 marker parameter and opens the M5 second levelmenu.
� ON/OFF — Turns the selected marker on or off.
� EDIT — Opens the selected marker parameter for data entry. PressENTER when data entry is complete or ESCAPE to restore the previousvalue.
� PEAK BETWEEN M1 & M2 — Places the selected marker at the fre-quency or distance with the maximum amplitude value between markerM1 and marker M2.
� VALLEY BETWEEN M1 & M2 — Places the selected marker at the fre-quency or distance with the minimum amplitude value between markerM1 and marker M2.
� BACK — Returns to the Main Markers Menu.
� M6 — Selects the M6 marker parameter and opens the M6 second levelmenu.
� ON/OFF — Turns the selected marker on or off.
� EDIT — Opens the selected marker parameter for data entry. PressENTER when data entry is complete or ESCAPE to restore the previousvalue.
� PEAK BETWEEN M3 & M4 — Places the selected marker at the peak be-tween marker M3 and marker M4.
� VALLEY BETWEEN M3 & M4 — Places the selected marker at the valleybetween marker M3 and marker M4.
� BACK — Returns to the Main Markers Menu.
Choosing LIMIT in FREQ or DTF measurement modes causes the soft keys be-low to be displayed.
� SINGLE LIMIT — Sets a single limit value in dBm. Menu choices are:ON/OFF
EDIT
BACK
� MULTIPLE LIMITS — Sets multiple user defined limits, and can be used tocreate a limit mask for quick pass/fail measurements. Menu choices are:
SEGMENT 1
SEGMENT 2
Chapter 2 Functions and Operations
2 - 13
SEGMENT 3
SEGMENT 4
SEGMENT 5
BACK
� LIMIT BEEP — Turns the audible limit beep indicator on or off.
SYS Displays the System menu softkey selections.
� OPTIONS — Displays a second level of functions:
� UNITS — Select the unit of measurement (English or metric).
� PRINTER — Displays a menu of supported printers. Use the Up/Downarrow key and ENTER key to make the selection.
� FIXED CW — Toggles the fixed CW function ON or OFF. When ON, F1is set equal to F2 and a CW frequency is fixed at the selected value. WhenOFF, a narrow band of frequencies centered on the selected frequency isgenerated.
� CHANGE DATE FORMAT — Toggles the date format betweenMM/DD/YY, DD/MM/YY, and YY/MM/DD.
� BACK — Returns to the top-level SYS Menu.
� CLOCK — Displays a second level of functions:
� HOUR — Enter the hour (0-23) using the Up/Down arrow key or the key-pad. Press ENTER when data entry is complete or ESCAPE to restore theprevious value.
� MINUTE — Enter the minute (0-59) using the Up/Down arrow key or thekeypad. Press ENTER when data entry is complete or ESCAPE to restorethe previous value.
� MONTH — Enter the month (1-12) using the Up/Down arrow key or thekeypad. Press ENTER when data entry is complete or ESCAPE to restorethe previous value.
� DAY — Enter the day using the Up/Down arrow key or the keypad. PressENTER when data entry is complete or ESCAPE to restore the previousvalue.
� YEAR — Enter the year (1997-2036) using the Up/Down arrow key orthe keypad. Press ENTER when data entry is complete or ESCAPE to re-store the previous value.
� BACK — Returns to the top-level SYS menu.
� SELF TEST — Start an instrument self test.
� STATUS — Displays the current instrument status, including calibration sta-tus, temperature, and battery charge state. Press ESCAPE to return to normaloperation.
� Language — Pressing this soft key immediately changes the language usedto display messages on the Site Master display. Choices are English, French,German, Spanish, Chinese, and Japanese. The default language is English.
Chapter 2 Functions and Operations
2 - 14
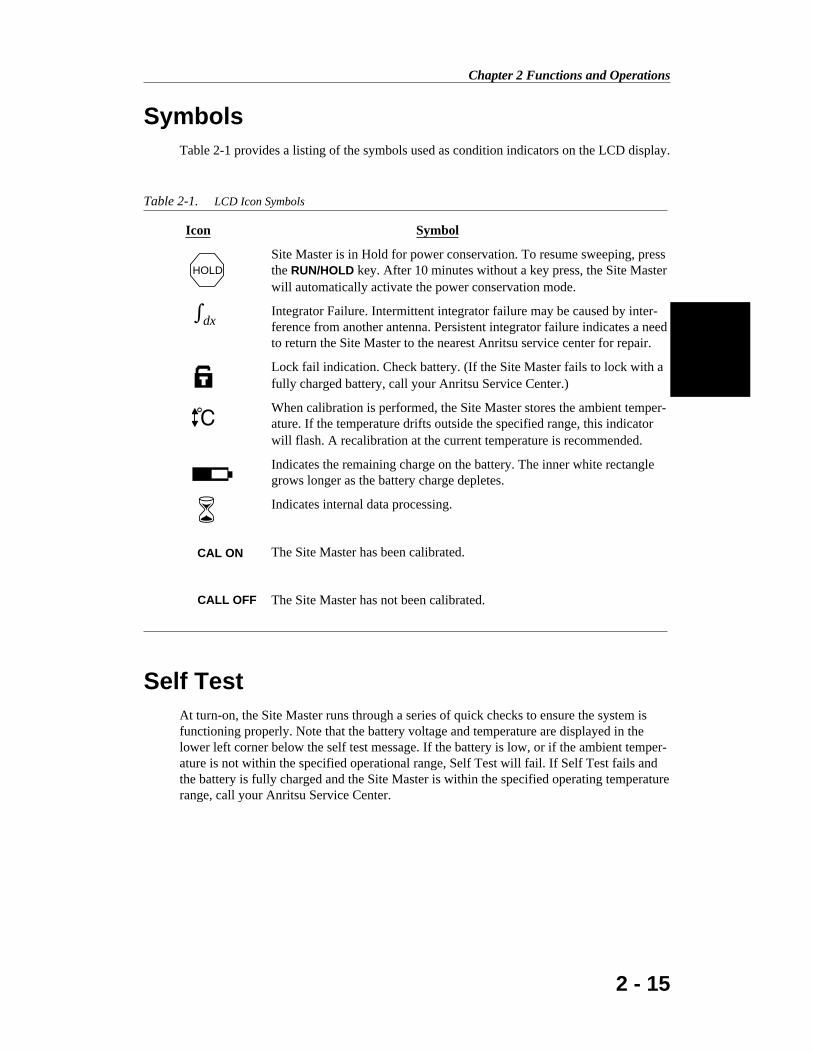
SymbolsTable 2-1 provides a listing of the symbols used as condition indicators on the LCD display.
Self TestAt turn-on, the Site Master runs through a series of quick checks to ensure the system isfunctioning properly. Note that the battery voltage and temperature are displayed in thelower left corner below the self test message. If the battery is low, or if the ambient temper-ature is not within the specified operational range, Self Test will fail. If Self Test fails andthe battery is fully charged and the Site Master is within the specified operating temperaturerange, call your Anritsu Service Center.
Chapter 2 Functions and Operations
2 - 15
Icon Symbol
Site Master is in Hold for power conservation. To resume sweeping, pressthe RUN/HOLD key. After 10 minutes without a key press, the Site Masterwill automatically activate the power conservation mode.
Integrator Failure. Intermittent integrator failure may be caused by inter-ference from another antenna. Persistent integrator failure indicates a needto return the Site Master to the nearest Anritsu service center for repair.
Lock fail indication. Check battery. (If the Site Master fails to lock with afully charged battery, call your Anritsu Service Center.)
When calibration is performed, the Site Master stores the ambient temper-ature. If the temperature drifts outside the specified range, this indicatorwill flash. A recalibration at the current temperature is recommended.
Indicates the remaining charge on the battery. The inner white rectanglegrows longer as the battery charge depletes.
Indicates internal data processing.
The Site Master has been calibrated.
The Site Master has not been calibrated.
Table 2-1. LCD Icon Symbols
HOLD
dx
T
�
CAL ON
CALL OFF
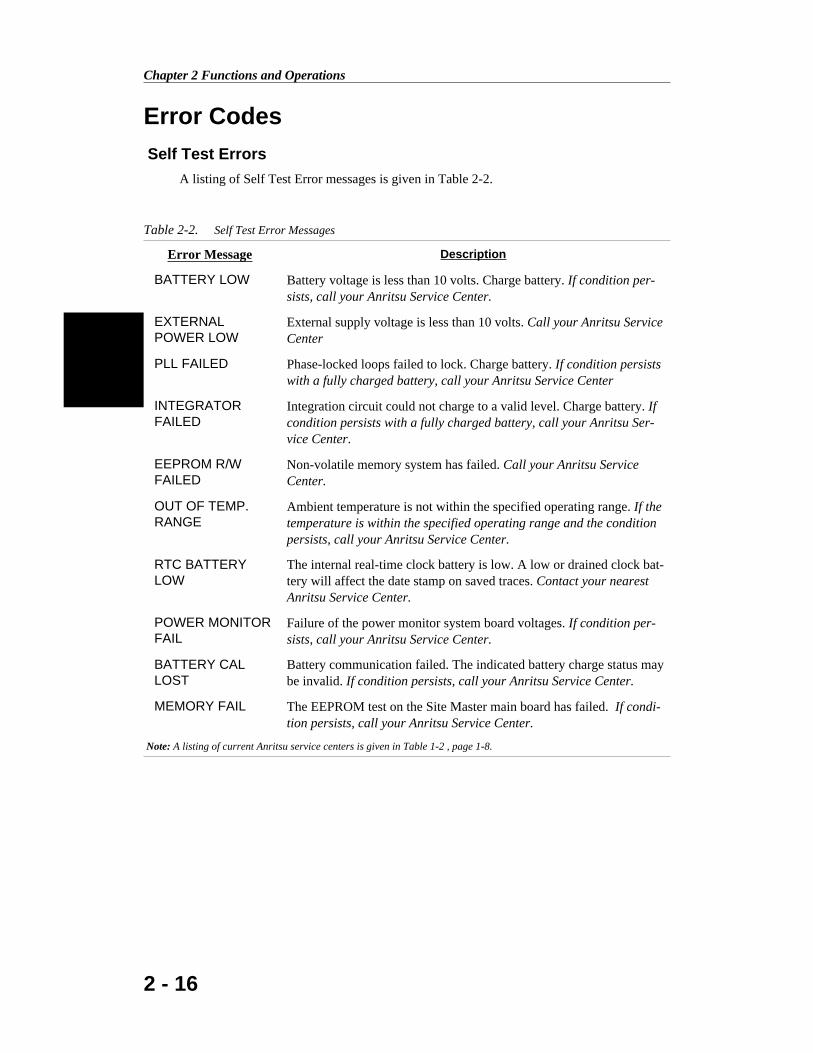
Error CodesSelf Test Errors
A listing of Self Test Error messages is given in Table 2-2.
2 - 16
Chapter 2 Functions and Operations
Error Message Description
BATTERY LOW Battery voltage is less than 10 volts. Charge battery. If condition per-sists, call your Anritsu Service Center.
EXTERNALPOWER LOW
External supply voltage is less than 10 volts. Call your Anritsu ServiceCenter
PLL FAILED Phase-locked loops failed to lock. Charge battery. If condition persistswith a fully charged battery, call your Anritsu Service Center
INTEGRATORFAILED
Integration circuit could not charge to a valid level. Charge battery. Ifcondition persists with a fully charged battery, call your Anritsu Ser-vice Center.
EEPROM R/WFAILED
Non-volatile memory system has failed. Call your Anritsu ServiceCenter.
OUT OF TEMP.RANGE
Ambient temperature is not within the specified operating range. If thetemperature is within the specified operating range and the conditionpersists, call your Anritsu Service Center.
RTC BATTERYLOW
The internal real-time clock battery is low. A low or drained clock bat-tery will affect the date stamp on saved traces. Contact your nearestAnritsu Service Center.
POWER MONITORFAIL
Failure of the power monitor system board voltages. If condition per-sists, call your Anritsu Service Center.
BATTERY CALLOST
Battery communication failed. The indicated battery charge status maybe invalid. If condition persists, call your Anritsu Service Center.
MEMORY FAIL The EEPROM test on the Site Master main board has failed. If condi-tion persists, call your Anritsu Service Center.
Note: A listing of current Anritsu service centers is given in Table 1-2 , page 1-8.
Table 2-2. Self Test Error Messages

Range Errors
A listing of Range Error messages is given in Table 2-3.
2 - 17
Chapter 2 Functions and Operations
Error Message Description
RANGEERROR:F1 > F2
The start (F1) frequency is greater than the stop (F2) frequency.
RANGEERROR:D1 > D2
The start (D1) distance is greater than the stop (D2) distance.
RANGEERROR:D2 >DMax=xx.x ft (m)
The stop distance (D2) exceeds the maximum unaliased range. Thisrange is determined by the frequency span, number of points,and relative propagation velocity:
MaximumUnaliased Rangedp V f
F F
� �
�
( . ) ( ) ( )1 5 108 1
2 1
Where: dp is the number of data points (130, 259, or 517)Vf is the relative propagation velocityF2 is the stop frequency in HzF1 is the start frequency in HzMaximum Unaliased Range is in meters
Refer to Figure -, page , for a plot of maximum range versus fre-quency span.
RANGE ERROR:TOP<=BOTTOM
The SWR scale parameter top value is less than or equal to its bottomvalue.
RANGE ERROR:TOP>=BOTTOM
The RL scale parameter top value is greater than or equal to its bottomvalue.
CALINCOMPLETE
A complete open, short, and load calibration must be performed bef-ore calibration can be turned on.
DIST REQUIRESF1 < F2
Valid distance to fault plots require a non-zero frequency span.
DIST REQUIRESCAL
Distance-to-fault measurements cannot be performed with CAL OFF.
USE OPTIONSMENU TOSELECT APRINTER
Attempting to print a display with no printer selected. Select a printer,then retry.
CANNOT ZERONO DETECTORINSTALLED
Attempting to perform a Power Monitor zero adjust function with noRF detector connected to the Site Master.
CANNOT ZEROINPUT SIGNALTOO HIGH
Attempting to perform a Power Monitor zero adjust function with aninput of greater than –20 dBm.
POWER MONITOROPTION NOTINSTALLED
Attempting to enter Power Monitor mode with no Option 5 installed.
Table 2-3. Range Error Messages (1 of 2)

Battery Information
Charging a New BatteryThe NiMH battery supplied with the Site Master has already completed three charge anddischarge cycles at the factory and full battery performance should be realized after yourfirst charge.
NOTE: The battery will not charge if the battery temperature is above 45� C orbelow 0� C.
Charging the Battery in the Site Master
The battery can be charged while installed in the Site Master.
Step 1. Turn the Site Master off.
Step 2. Connect the AC-DC adapter (Anritsu part number: 40-115) to the Site Mastercharging port.
Step 3. Connect the AC adapter to a 120 VAC or 240 VAC power source as appropriatefor your application.
The green external power indicator on the Site Master will illuminate, indicatingthe presence of external DC power and the battery will begin charging. The indi-cator will remain lit as long as the battery is charging. Once the battery is fullycharged, the battery indicator will turn off. If the battery fails to charge, contactyour nearest Anritsu service center.
Charging the Battery in the Optional Charger
Up to two batteries can be charged simultaneously in the optional battery charger.
Step 1. Remove the NiMH battery from your Site Master and place it in the optionalcharger (Anritsu part number 2000-1029).
Step 2. Connect the lead from the AC-DC adapter to the charger.
Step 3. Connect the AC-DC adapter to a 120 VAC or 240 VAC power source as appro-priate for your application.
Each battery holder in the optional charger has an LED charging status indicator. The LEDcolor changes as the battery is charged:
Red indicates the battery is chargingGreen indicates the battery is fully chargedYellow indicates the battery is in a waiting state (see below).
A yellow light may occur because the battery became too warm during the charge cycle.The charger will allow the battery to cool off before continuing the charge. A yellow lightmay also indicate that the charger is alternating charge to each of the two batteries.
A blinking red light indicates less than 13 VDC is being supplied to the charger stand.Check that the correct AC charger adapter is connected to the charger stand. If the batteryfails to charge, contact your nearest Anritsu Service Center.
2 - 18
Chapter 2 Functions and Operations

The NiMH battery will last longer and perform better if allowed to completely dischargebefore recharging. For maximum battery life, it is recommended that the NiMH battery becompletely discharged and recharged once every three months.
Battery Charge Indicator
When the AC-DC adapter is unplugged from the Site Master, the battery indicator symbolwill be continuously displayed at the top left corner of the Site Master display (Figure ).
A totally black bar indicates a fully charged battery. When LOW BATT replaces the batteryindicator bar at the top left corner, a couple of minutes of measurement time remains. If aflashing LOW BATT is accompanied by an audio beep at the end of each trace, the batteryhas approximately one minute of useable time remaining.
Once all the power has drained from the battery, the Site Master display will fade. At thispoint, your Site Master will switch itself off and the battery will need to be recharged.
Battery Life
It is normal for NiMH batteries to self-discharge during storage, and to degrade to 80% oforiginal capacity after 12 months of continuous use.
2 - 19
Chapter 2 Functions and Operations
BATTERY INDICATOR
Figure . Site Master Battery Indicator
Figure . NiMH Battery Storage Characteristics

The battery can be charged and discharged 300 to 500 times, but it will eventually wear out.The battery may need to be replaced when the operating time between charging is notice-ably shorter than normal.
Important Battery Information
� With a new NiMH battery, full performance is achieved after three to five completecharge and discharge cycles. The NiMH battery supplied with the Site Master has alreadycompleted three charge and discharge cycles at the factory.
� Recharge the battery only in the Site Master or in an Anritsu approved charger.
� When the Site Master or the charger is not in use, disconnect it from the power source.
� Do not charge batteries for longer than 24 hours; overcharging may shorten battery life.
� If left unused a fully charged battery will discharge itself over time. Storing the battery inextreme hot or cold places will reduce the capacity and lifetime of the battery. The bat-tery will discharge faster at higher ambient temperatures.
� Discharge an NiMH battery from time to time to improve battery performance and bat-tery life.
� The battery can be charged and discharged hundreds of times, but it will eventually wearout.
� The battery may need to be replaced when the operating time between charging is notice-ably shorter than normal.
� Do not short-circuit the battery terminals.
� Do not drop, mutilate or attempt to disassemble the battery.
� Never use a damaged or worn out charger or battery.
� Always use the battery for its intended purpose only.
� Temperature extremes will affect the ability of the battery to charge: allow the battery tocool down or warm up as necessary before use or charging.
� Batteries must be recycled or disposed of properly. Do not place batteries in garbage.
� Do not dispose of batteries in a fire!
2 - 20
Chapter 2 Functions and Operations

Chapter 3Getting Started
IntroductionThis chapter provides a brief overview of the Anritsu Site Master. The intent of this chapteris to provide the user with a starting point for making basic measurements.
Power On ProcedureThe Anritsu Site Master is capable of up to 2.5 hours of continuous operation from a fullycharged, field-replaceable battery. Built-in energy conservation features allow battery life tobe extended over an eight-hour workday.
The Site Master can also be operated from a 12.5 Vdc source (which will also simulta-neously charge the battery). This can be achieved with either the Anritsu AC-DC Adapter(P/N 40-115) or 12.5 Vdc Automotive Cigarette Lighter Adapter (P/N 806-62). Both itemsare included as standard accessories (see Chapter 1).
To power on the Site Master:
Step 1. Press the ON/OFF front panel key (Figure 3-1).
The screen displays the Anritsu logo, the Site Master model number, and thefirmware version. The Site Master then takes about five seconds to perform a se-ries of self-diagnostic and adjustment routines, then displays:
Step 2. Press ENTER to continue.
If ENTER is not pressed, the Site Master will continue after a 10 second time-out. The Site Master is now ready for operation.
3-1
3
HOLDRUN
STARTCAL
AUTOSCALE
SAVESETUP
RECALLSETUP
LIMIT MARKER
SAVEDISPLAY
RECALLDISPLAY
MODE FREQ/DIST AMPLITUDE SWEEP
SYS
ENTER
CLEAR
ESCAPE
ONOFF
/
1 2
4
5 6
7 8
9 0
3
+-
.
Site Master S251C
ON/OFFKEY
Figure 3-1. Site Master On/Off Key
Select the Frequency or DistanceRegardless of the calibration method used, the frequency range for the desired measure-ments must be set before calibrating the Site Master. The following procedure selects thefrequency range for the calibration.
Step 1. Press the FREQ/DIST key.
Step 2. Press the F1 soft key.
Step 3. Enter the desired frequency using the key pad or the Up/Down arrow key.
Step 4. Press ENTER to set F1 to the desired frequency.
Step 5. Press the F2 soft key.
Step 6. Enter the desired frequency using the keypad or the Up/Down arrow key.
Step 7. Press ENTER to set F2 to the desired frequency.
Check that the start and stop frequencies displayed match the desired measure-ment range..
CalibrationFor accurate results, the Site Master must be calibrated at the ambient temperature beforemaking any measurements. The Site Master must be re-calibrated whenever the setup fre-quency changes, the temperature exceeds the initial calibration temperature or when the testport extension cable is removed or replaced.
The Site Master may be calibrated manually with Open, Short, Load (OSL) calibrationcomponents. Two port calibration requires two Load components.
If a Test Port Extension Cable is to be used, the Site Master must be calibrated with theTest Port Extension Cable in place. The Test Port Extension Cable is a phase stable cableand is used as an extension cable on the test port to ensure accurate and repeatable measure-ments. This phase stable cable can be moved and bent while making a measurement with-out causing errors in the measurement.
NOTE: The test port extension cable should have the appropriate connectorsfor the measurement. Use of additional connector adapters after the test portextension cable can contribute to measurement errors not compensated forduring calibration.
The following procedure explains the calibration methods. Refer to Figure 3-2 for a calibra-tion setup diagram.
3-2
Chapter 3 Getting Started

Calibration Procedure - Single Port
Check that the “CAL OFF” message is displayed in the upper left corner of the display.This indicates that the Site Master has not been calibrated. The following procedure detailshow to perform the calibration.
Step 1. Select the appropriate frequency range, as described in the procedure on page3-2.
Step 2. Press the START CAL key. The message CONNECT OPEN TO RF Out
PORT will appear in the display.
Step 3. Connect the calibrated Open and press the ENTER key. The messages Mea-
suring OPEN and then CONNECT SHORT TO RF Out PORT will appear.
Step 4. Remove the Open, connect the calibrated Short and press the ENTER key. Themessages Measuring SHORT and then CONNECT TERMINATION TO RF
Out will appear.
Step 5. Verify that the calibration has been properly performed by checking that theCAL ON message is now displayed in the upper left corner of the display.
3-3
Chapter 3 Getting Started
HOLDRUN
STARTCAL
AUTOSCALE
SAVESETUP
RECALLSETUP
LIMIT MARKER
SAVEDISPLAY
RECALLDISPLAY
MODE FREQ/DIST AMPLITUDE SWEEP
SYS
ENTER
CLEAR
ESCAPE
ONOFF
/
1 2
4
5 6
7 8
9 0
3
+-
.
Site Master S332C
OPEN
LOAD
SHORT CALIBRATION
RFOUT/REFLECTIONTEST PORT
TEST PORT CABLE (OPTIONAL)
Figure 3-2. Calibration Setup

Calibration Procedure - Dual Port
Check that the “CAL OFF” message is displayed in the upper left corner of the display.This indicates that the Site Master has not been calibrated. The following procedure detailshow to perform the calibration. Two port calibration requires two Load components.
Step 1. Select the appropriate frequency range, as described in the procedure on page3-2.
Step 2. Press the START CAL key. The message CONNECT OPEN TO RF Out
PORT will appear in the display.
Step 3. Connect the calibrated Open and press the ENTER key. The messages Mea-
suring OPEN and then CONNECT SHORT TO RF Out PORT will appear.
Step 4. Remove the Open, connect the calibrated Short and press the ENTER key. Themessages Measuring SHORT and then CONNECT LOAD TO RF Out
PORT will appear.
Step 5. Remove the Short, connect the calibrated Load and press the ENTER key. Themessages Measuring LOAD and then CONNECT LOADS TO RF Out AND
RF In PORTS will appear.
Step 6. Connect the calibrated Loads to the RF Out and RF In ports and press theENTER key. The messages Measuring ISOLATION and then CONNECT RF
Out PORT TO RF In PORT will appear.
Step 7. Remove the Loads, connect the RF Out PORT extension cable to the RF InPORT extension cable, using the proper adapter for the cable connector type,and press the ENTER key. The message Measuring THRU will appear.
Step 8. Verify that the calibration has been properly performed by checking that theCAL ON message is now displayed in the upper left corner of the display.
Chapter 3 Getting Started
3-4
HOLDRUN
STARTCAL
AUTOSCALE
SAVESETUP
RECALLSETUP
LIMIT MARKER
SAVEDISPLAY
RECALLDISPLAY
MODE FREQ/DIST AMPLITUDE SWEEP
SYS
ENTER
CLEAR
ESCAPE
ONOFF
/
1 2
4
5 6
7 8
9 0
3
+-
.
Site Master S251C
LOAD
OPEN
LOAD
SHORT
RF OUT TEST PORT
RF IN TEST PORT
TEST PORT CABLE(OPTIONAL)
TEST PORT CABLE(OPTIONAL)
Figure 3-3. Two-Port Measurement Calibration Setup
Setting the Scale
Auto Scale
The Site Master can automatically set the scales to the minimum and maximum values ofthe measurement on the y-axis of the display. This function is particularly useful for mea-surements in SWR mode. To automatically set the scales:
Step 1. Press the AUTO SCALE key.The Site Master will automatically set the top and bottom scales to the minimumand maximum values of the measurement on the y-axis of the display.
Amplitude Scale
The following procedure sets the top and bottom scale display.
Step 2. Press the AMPLITUDE key to call up the Scale Menu.
Step 3. Press the TOP soft key and use the keypad or Up/Down arrow key to edit the topscale value.
Step 4. Press the BOTTOM soft key and use the keypad or Up/Down arrow key to editthe bottom scale value.
NOTE: Typically the y-axis scale of the display is 0-54 dB (return loss) but forsome measurements (for example, insertion loss) the scale should be changedto 0-10 dB. If the scale is not changed, some measurement results may not beeasily displayed on the screen.
Save and Recall a Setup
Saving a Setup
Saving a setup configuration in memory will preserve the calibration information.
Step 1. To save the configuration in one of the 10 available user setup locations, pressSAVE SETUP .
Step 2. Use the key pad or the Up/Down arrow key to select a location (1 - 10).
Step 3. Press ENTER to save the setup.
Recalling a Setup
The following procedure recalls a setup from memory.
Step 1. Press the RECALL SETUP key.
Step 2. Select the desired setup using the Up/Down arrow key.
Step 3. Press ENTER to recall the setup.
Save and Recall a Display
Saving a Display
The following procedure saves a display to memory.
3-5
Chapter 3 Getting Started
Step 1. Press the SAVE DISPLAY key to activate the alphanumeric menu for trace stor-age.
Step 2. Use the soft keys to enter a label for the saved trace.
For example, to save a display with the name “TX1 RETURN LOSS” press thesoft key group that contains the letter “T” then press the “T” soft key. Press thesoft key group that contains the letter “X” then press the “X” soft key. Press thenumber “1” key on the numeric keypad. Use the softkeys and keypad as neces-sary to enter the entire name, then press ENTER to complete the process.
NOTE: More than one trace can be saved using the same alphanumeric name,as traces are stored chronologically, using the time/date stamp.
NOTE: Pressing the SAVE DISPLAY key will bring up the last saved trace nameon the input line. Pressing the BACK SPACE soft key will erase the last charac-ter in that trace name. This feature can be useful when naming traces sequen-tially, such as: Trace 1, Trace 2, etc.
Recalling a Display
The following procedure recalls a previously saved display from memory.
Step 1. Press the RECALL DISPLAY key.
Step 2. Select the desired display using the Up/Down arrow key.
Step 3. Press ENTER to recall the display.
3-6
Chapter 3 Getting Started
Set the Distance and Cable TypeIn Distance-To-Fault (DTF) mode, the length of the transmission line (distance) and cabletype are selected. The cable type determines the velocity propagation and cable attenuationfactor. The following procedure can be used to set the distance and select the appropriatecable type.
NOTE: Selecting the correct cable is very important for accurate measurementsand for identifying faults in the transmission line. Selecting the incorrect cabletype will allow the DTF trace to be shifted in vertical and horizontal displays andmake it difficult to accurately locate faults.
Step 1. Press the MODE key.
Step 2. Select DTF RETURN LOSS or DTF SWR mode. The Site Master automaticallysets D1 to zero.
Step 3. Press the D2 soft key.
Step 4. Enter the appropriate D2 value for the maximum length of the transmission lineand press the ENTER key to set the D2 value.
Step 5. Press the DTF AID soft key.
Step 6. Using the Up/Down arrow key, select CABLE TYPE. Standard cable types arestored in the Site Master cable list. This standard list may not be edited. A cus-tom cable list can also be created.
Step 7. Using the Up/Down arrow key, select the appropriate list and select the type ofcable. The selected cable type, PROP VEL and CABLE LOSS in dB/ft (ordB/m) will be displayed.
Step 8. Press ENTER.
Changing the UnitsBy default, the Site Master displays information in metric units. Use the following proce-dure to change the display to English units.
Step 1. Press the SYS key.
Step 2. Select the OPTIONS soft key.
Step 3. Press UNITS to change from metric to English measurement units, or vice versa.The current selection is displayed at the bottom left corner of the screen.
Changing the Display LanguageBy default, the Site Master displays messages in English. To change the display language:
Step 1. Press the SYS key.
Step 2. Select the Language soft key.
Step 3. Select the desired language. Choices are English, French, German, Spanish, Chi-nese, and Japanese. The default language is English.
3-7
Chapter 3 Getting Started

PrintingPrinting is accomplished by selecting an available printer and pressing the print key as de-scribed below. Refer to the particular printer operating manual for specific printer settings.
Printing a Screen
Step 1. Connect the printer as shown in Figure 3-4.
Step 2. Obtain the desired measurement display
Step 3. Press the SYS key and the OPTIONS soft key (Figure 3-5) .
3-8
Chapter 3 Getting Started
SEIKOPRINTER
HP 350DESKJET
SERIAL CABLE2000-1012
SERIAL-TO-PARALLELINTERFACE CABLE
2000-753
HOLDRUN
STARTCAL
AUTOSCALE
SAVESETUP
RECALLSETUP
LIMIT MARKER
SAVEDISPLAY
RECALLDISPLAY
MODE FREQ/DIST AMPLITUDE SWEEP
SYS
ENTER
CLEAR
ESCAPE
ONOFF
/
1 2
4
5 6
7 8
9 0
3
+-
.
Site Master S251C
Figure 3-4-. Site Master Printer Setup
HOLDRUN
STARTCAL
AUTOSCALE
SAVESETUP
RECALLSETUP
LIMIT MARKER
SAVEDISPLAY
RECALLDISPLAY
MODE AMPLITUDE
SYS
ENTER
CLEAR
ESCAPE
ONOFF
/
1 2
4
5 6
7 8
9 0
3
+-
.
OPTIONS
SYS
Site Master S251C
OPTIONS
CLOCK
SELF TEST
STATUS
FREQ/DIST SWEEP
Figure 3-5-. SYS Key and OPTIONS Soft Key

Step 4. Press the PRINTER soft key and select from the displayed menu of supportedprinters.
Step 5. Press the PRINT key. (Figure 3-6).
Printer Switch Settings
Set the switches, SW1, SW2, and SW3, on the Seiko DPU-414 thermal printer as follows:
Set the switches on the serial-to-parallel interface cable to the HP Deskjet 350 ink jetprinter as follows:
3-9
Chapter 3 Getting Started
HOLDRUN
STARTCAL
AUTOSCALE
SAVESETUP
RECALLSETUP
LIMIT MARKER
SAVEDISPLAY
RECALLDISPLAY
MODE FREQ/DIST AMPLITUDE SWEEP
SYS
ENTER
CLEAR
ESCAPE
ONOFF
/
1 2
4
5 6
7 8
9 0
3
+-
.
PRINTER
PRINTER
CHANGEDATE
Site Master S251C
Figure 3-6-. PRINTER Soft Key and PRINT Key
Switch 1 2 3 4 5 6 7 8
SW1 OFF ON ON ON ON OFF ON ON
SW2 ON ON ON ON ON ON ON OFF
SW3 ON ON ON OFF OFF ON ON ON
SW1 SW2 SW3 SW4 SW5 SW6 SW7 SW8
OFF ON OFF OFF OFF OFF ON OFF
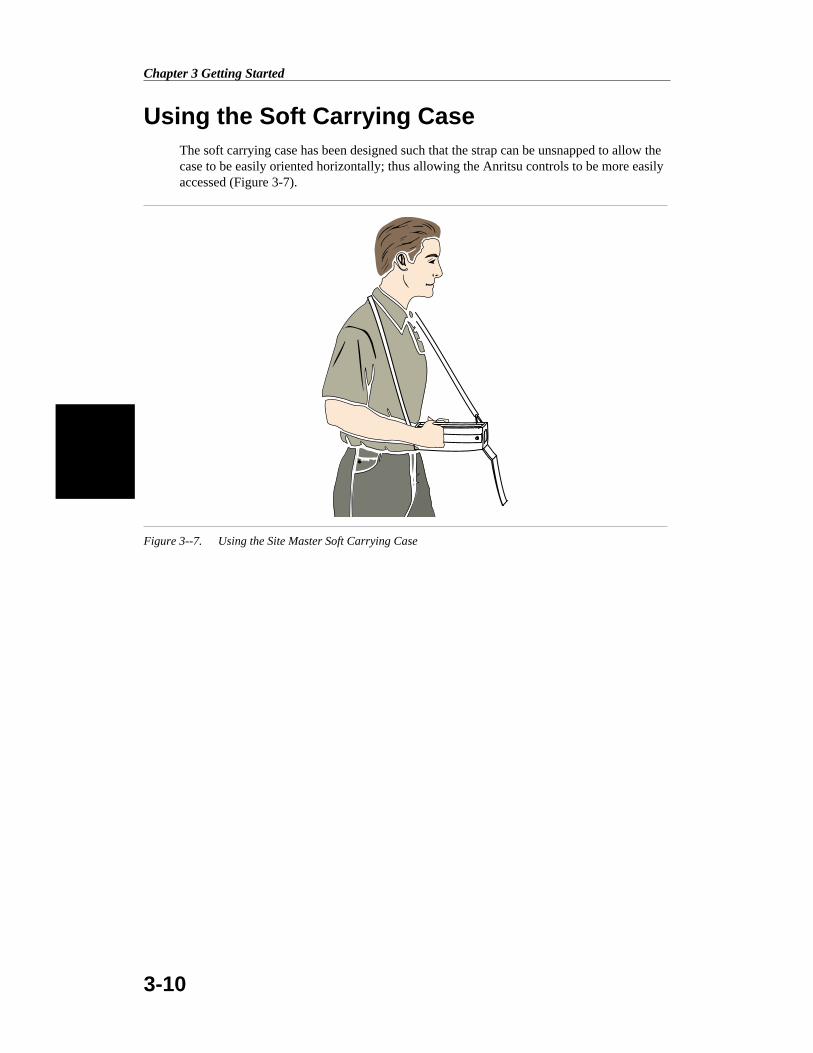
Using the Soft Carrying CaseThe soft carrying case has been designed such that the strap can be unsnapped to allow thecase to be easily oriented horizontally; thus allowing the Anritsu controls to be more easilyaccessed (Figure 3-7).
3-10
Chapter 3 Getting Started
Figure 3--7. Using the Site Master Soft Carrying Case

Chapter 4Cable & AntennaAnalysis
IntroductionThis chapter provides a description of cable and antenna measurements in one port and twoport modes. Measurements include line sweeping fundamentals and line sweeping measure-ment procedures, available when the Site Master is in frequency or DTF mode.
One Port Measurements
Line Sweep FundamentalsIn wireless communication, the transmit and receive antennas are connected to the radiothrough a transmission line. This transmission line is usually a coaxial cable or waveguide.This connection system is referred to as a transmission feed line system. Figure 4-1 showsan example of a typical transmission feed line system.
4-1
4
Figure 4-1. A Typical Transmission Feed Line System
The performance of a transmission feed line system may be affected by excessive signal re-flection and cable loss. Signal reflection occurs when the RF signal reflects back due to animpedance mismatch or change in impedance caused by excessive kinking or bending ofthe transmission line. Cable loss is caused by attenuation of the signal as it passes throughthe transmission line and connectors.
To verify the performance of the transmission feed line system and analyze these problems,three types of line sweeps are required:
Return Loss Measurement�Measures the reflected power of the system in decibels (dB).This measurement can also be taken in the Voltage Standing Wave Ratio (VSWR) mode,which is the ratio of the transmitted power to the reflected power. However, the return lossmeasurement is typically used for most field applications.
Insertion Loss Measurement�Measures the energy absorbed, or lost, by the transmissionline in dB/ft or dB/meter. Different transmission lines have different losses, and the loss isfrequency and distance specific. The higher the frequency or longer the distance, the greaterthe loss.
Distance-To-Fault (DTF) Measurement�Reveals the precise fault location of compo-nents in the transmission line system. This test helps to identify specific problems in thesystem, such as connector transitions, jumpers, kinks in the cable or moisture intrusion.
The different measurements are defined as:
Return Loss - System Sweep�A measurement made when the antenna is connected at theend of the transmission line. This measurement provides an analysis of how the variouscomponents of the system are interacting and provides an aggregate return loss of the entiresystem.
Distance To Fault - Load Sweep�A measurement made with the antenna disconnectedand replaced with a 50� precision load at the end of the transmission line. This measure-ment allows analysis of the various components of the transmission feed line system in theDTF mode.
Cable Loss - Insertion Loss Sweep�A measurement made when a short is connected atthe end of the transmission line. This condition allows analysis of the signal loss throughthe transmission line and identifies the problems in the system. High insertion loss in thefeed line or jumpers can contribute to poor system performance and loss of coverage.
This whole process of measurements and testing the transmission line system is called LineSweeping.
Information Required for a Line SweepThe following information must be determined before attempting a line sweep measure-ment:
� System Frequency Range, to set the sweep frequency
� Cable Type, to set the cable characteristics for DTF measurements
� Distance of the Cable Run, to set the distance for DTF measurements
Chapter 4 Measurements
4-2

Typical Line Sweep Test ProceduresThis section provides typical line sweep measurements used to analyze the performance ofa transmission feed line system.
System Return Loss Measurement
System return loss measurement verifies the performance of the transmission feed line sys-tem with the antenna connected at the end of the transmission line. To measure the systemreturn loss:
Required Equipment
� Site Master Model S251C
� Precision Open/Short, Anritsu 22N50 orPrecision Open/Short/Load, Anritsu OSLN50LF
� Precision Load, Anritsu SM/PL
� Test Port Extension Cable, Anritsu 15NNF50-1.5C
� Optional 510-90 Adapter, DC to 7.5 GHz, 50 ohm, 7/16 (F)-N (M)
Device Under Test
� Transmission Feed Line with Antenna
Procedure
Step 1. Press the MODE key.
Step 2. Select FREQ-RETURN LOSS using the Up/Down arrow key and pressENTER.
Step 3. Set the start and stop frequencies, F1 and F2, as described on page 3-2.
Step 4. Calibrate the Site Master as described on page 3-2.
Step 5. Connect the Device Under Test to the Site Master. A trace will be displayed onthe screen when the Site Master is in the sweep mode.
Step 6. Press SAVE DISPLAY (page 3-5) name the trace, and press ENTER.
NOTE: The antenna must be connected at the end of the transmission feed linewhen conducting a System Return Loss measurement.
Chapter 4 Measurements
4-3
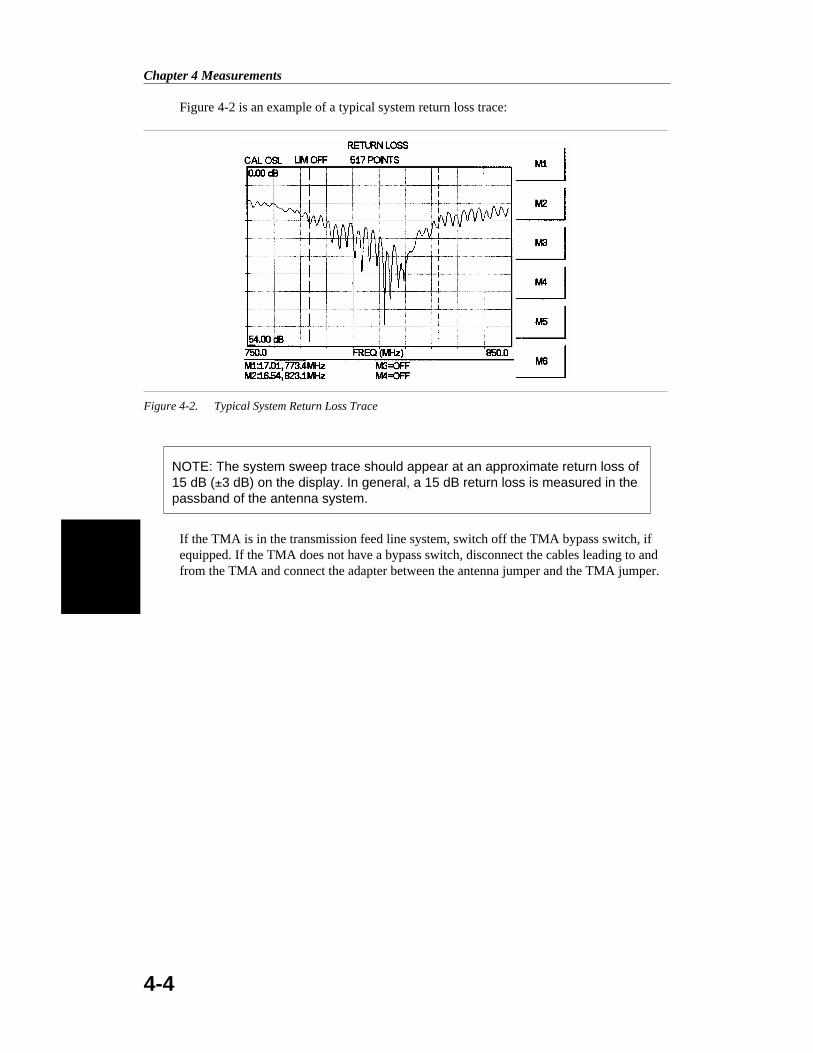
Figure 4-2 is an example of a typical system return loss trace:
NOTE: The system sweep trace should appear at an approximate return loss of15 dB (�3 dB) on the display. In general, a 15 dB return loss is measured in thepassband of the antenna system.
If the TMA is in the transmission feed line system, switch off the TMA bypass switch, ifequipped. If the TMA does not have a bypass switch, disconnect the cables leading to andfrom the TMA and connect the adapter between the antenna jumper and the TMA jumper.
Chapter 4 Measurements
4-4
Figure 4-2. Typical System Return Loss Trace

Insertion Loss Measurement
The transmission feed line insertion loss test verifies the signal attenuation level of the ca-ble system in reference to the specification. This test can be conducted with the Site Masterin either FREQ–CABLE LOSS or FREQ–RETURN LOSS mode. In Cable Loss mode, theSite Master automatically considers the signal traveling in both directions when calculatingthe insertion loss, making the measurement easier for the user in the field. Both methods areexplained below.
Required Equipment
� Site Master Model S251C
� Precision Open/Short, Anritsu 22N50 orPrecision Open/Short/Load, Anritsu OSLN50LF
� Precision Load, Anritsu SM/PL
� Test Port Extension Cable, Anritsu 15NNF50-1.5C
� Optional 510-90 Adapter, DC to 7.5 GHz, 50 ohm, 7/16(F)-N(M)
Device Under Test
� Transmission Feed Line with Short
Procedure - Cable Loss Mode
Step 1. Press the MODE key.
Step 2. Select FREQ-CABLE LOSS using the Up/Down arrow key and press ENTER.
Step 3. Set the start and stop frequencies, F1 and F2, as described on page 3-2.
Step 4. Connect the Test Port Extension cable to the RF Out port and calibrate the SiteMaster as described on page 3-2.
Step 5. Save the calibration set up (page 3-5).
Step 6. Connect the Device Under Test to the Site Master phase stable Test Port Exten-sion cable. A trace will be displayed on the screen as long as the Site Master isin sweep mode.
Step 7. Press the AMPLITUDE key and set the TOP and BOTTOM values of the dis-play. In the example below, the TOP is set to 2, and the BOTTOM is set to 5.
Step 8. Press the MARKER key.
Step 9. Set M1 to MARKER TO PEAK.
Step 10. Set M2 to MARKER TO VALLEY.
Step 11. Calculate the measured insertion loss by averaging M1 (marker to peak) and M2(marker to valley) as follows:
Step 12. Insertion Loss M M �1 22
Step 13. Press SAVE DISPLAY (page 3-5) name the trace, and press ENTER.
Chapter 4 Measurements
4-5

Step 14. Verify the measured insertion loss against the calculated insertion loss:
Type Attenuation (dB/ft) � Length (ft) = Loss (dB)
First Jumper LDF4-50A 0.0325 20 0.65
Main Feeder LDF5-50A 0.0186 150 2.79
Top Jumper LDF4-50A 0.0325 10 0.325
The number of connector pairs (3) times the loss per pair (in dB) equals the con-nector loss: 3 � 0.14 = 0.42.
The insertion loss of the transmission system is equal to:
First Jumper loss + Main Feeder Loss + Top Jumper Loss + Connector Loss = Insertion Loss0.65 + 2.79 + 0.325 + 0.42 = 4.19 dB
Figure 4-3 is an example of a typical transmission line cable loss trace.
Chapter 4 Measurements
4-6
Figure 4-3. Typical Transmission Line Cable Loss Trace
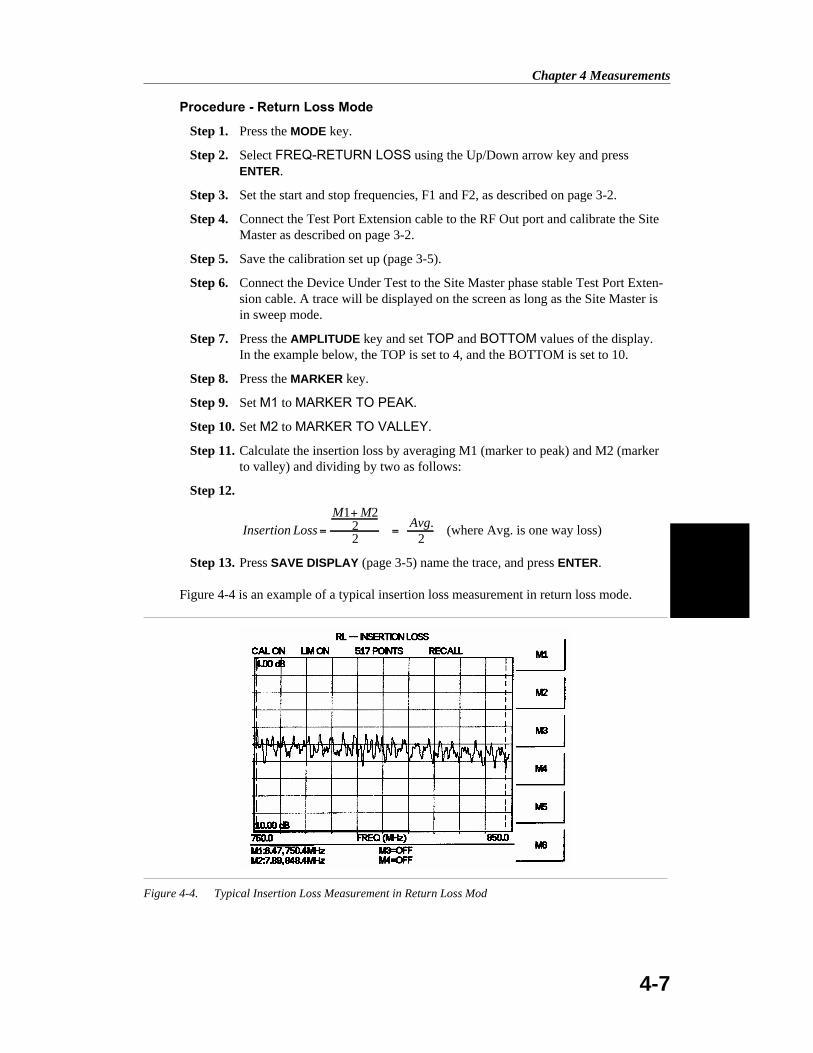
Procedure - Return Loss Mode
Step 1. Press the MODE key.
Step 2. Select FREQ-RETURN LOSS using the Up/Down arrow key and pressENTER.
Step 3. Set the start and stop frequencies, F1 and F2, as described on page 3-2.
Step 4. Connect the Test Port Extension cable to the RF Out port and calibrate the SiteMaster as described on page 3-2.
Step 5. Save the calibration set up (page 3-5).
Step 6. Connect the Device Under Test to the Site Master phase stable Test Port Exten-sion cable. A trace will be displayed on the screen as long as the Site Master isin sweep mode.
Step 7. Press the AMPLITUDE key and set TOP and BOTTOM values of the display.In the example below, the TOP is set to 4, and the BOTTOM is set to 10.
Step 8. Press the MARKER key.
Step 9. Set M1 to MARKER TO PEAK.
Step 10. Set M2 to MARKER TO VALLEY.
Step 11. Calculate the insertion loss by averaging M1 (marker to peak) and M2 (markerto valley) and dividing by two as follows:
Step 12.
Insertion LossM M
�1 222
Avg.
2(where Avg. is one way loss)
Step 13. Press SAVE DISPLAY (page 3-5) name the trace, and press ENTER.
Figure 4-4 is an example of a typical insertion loss measurement in return loss mode.
Chapter 4 Measurements
4-7
Figure 4-4. Typical Insertion Loss Measurement in Return Loss Mod
Distance-To-Fault (DTF) Transmission Line Test
The Distance-To-Fault transmission line test verifies the performance of the transmissionline assembly and its components and identifies the fault locations in the transmission linesystem. This test determines the return loss value of each connector pair, cable componentand cable to identify the problem location. This test can be performed in the DTF–RE-TURN LOSS or DTF–SWR mode. Typically, for field applications, the DTF–RETURNLOSS mode is used. To perform this test, disconnect the antenna and connect the load at theend of the transmission line.
Required Equipment
� Site Master Model S251C
� Precision Open/Short, Anritsu 22N50 orPrecision Open/Short/Load, Anritsu OSLN50LF
� Precision Load, Anritsu SM/PL
� Test Port Extension Cable, Anritsu 15NNF50-1.5C
� Optional 510-90 Adapter, DC to 7.5 GHz, 50 ohm, 7/16(F)-N(M)
Device Under Test
� Transmission Feed Line with Load
Procedure - DTF-Return Loss Mode
The following steps explain how to make a DTF measurement in return loss mode.
Step 1. Press the MODE key.
Step 2. Select DTF-RETURN LOSS using the Up/Down arrow key and press ENTER.
Step 3. Set the start and stop frequencies, F1 and F2, as described on page 3-2.
Step 4. Connect the Test Port Extension cable to the RF Out port and calibrate the SiteMaster as described on page 3-2.
Step 5. Save the calibration set up (page 3-5).
Step 6. Connect the Device Under Test to the Site Master phase stable Test Port Exten-sion cable. A trace will be displayed on the screen as long as the Site Master isin sweep mode.
Step 7. Press the FREQ/DIST key.
Step 8. Set the D1 and D2 values. The Site Master default for D1 is zero.
Step 9. Press the DTF AID soft key and select the appropriate CABLE TYPE to set thecorrect propagation velocity and attenuation factor.
NOTE: Selecting the right propagation velocity, attenuation factor and distanceis very important for accurate measurements, otherwise the faults can not beidentified accurately and insertion loss will be incorrect.
Step 10. Press SAVE DISPLAY (page 3-5) name the trace, and press ENTER.
Step 11. Record the connector transitions.
Chapter 4 Measurements
4-8
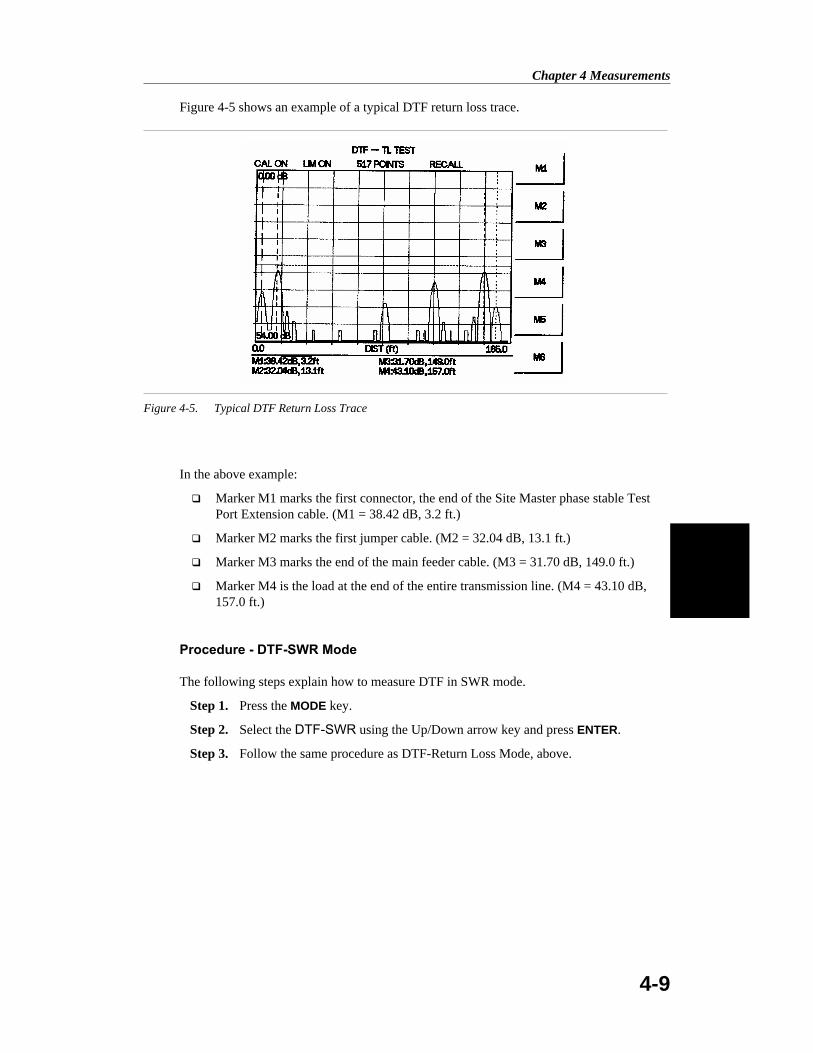
Figure 4-5 shows an example of a typical DTF return loss trace.
In the above example:
� Marker M1 marks the first connector, the end of the Site Master phase stable TestPort Extension cable. (M1 = 38.42 dB, 3.2 ft.)
� Marker M2 marks the first jumper cable. (M2 = 32.04 dB, 13.1 ft.)
� Marker M3 marks the end of the main feeder cable. (M3 = 31.70 dB, 149.0 ft.)
� Marker M4 is the load at the end of the entire transmission line. (M4 = 43.10 dB,157.0 ft.)
Procedure - DTF-SWR Mode
The following steps explain how to measure DTF in SWR mode.
Step 1. Press the MODE key.
Step 2. Select the DTF-SWR using the Up/Down arrow key and press ENTER.
Step 3. Follow the same procedure as DTF-Return Loss Mode, above.
Chapter 4 Measurements
4-9
Figure 4-5. Typical DTF Return Loss Trace
Antenna Subsystem Return Loss Test
Antenna Subsystem return loss measurement verifies the performance of the transmit andreceive antennas. This measurement can be used to analyze the performance of the antennabefore installation. The antenna can be tested for the entire frequency band, or tested to aspecific frequency range. Transmit and receive frequency measurements are conducted sep-arately. The following steps explain how to measure the antenna loss in return loss mode.
Required Equipment
� Site Master Model S251C
� Precision Open/Short, Anritsu 22N50 orPrecision Open/Short/Load, Anritsu OSLN50LF
� Precision Load, Anritsu SM/PL
� Test Port Extension Cable, Anritsu 15NNF50-1.5C
� Optional 510-90 Adapter, DC to 7.5 GHz, 50 ohm, 7/16(F)-N(M)
Device Under Test
� Antenna Sub Assembly
Procedure
Step 1. Press the MODE key.
Step 2. Select FREQ-RETURN LOSS using the Up/Down arrow key and pressENTER.
Step 3. Set the start and stop frequencies, F1 and F2, as described on page 3-2.
Step 4. Connect the Test Port Extension cable to the RF port and calibrate the Site Mas-ter as described on page 3-2.
Step 5. Press SAVE SETUP and save the calibration set up (page 3-5).
Step 6. Connect the Device Under Test to the Site Master phase stable Test Port Exten-sion cable.
Step 7. Press the MARKER key.
Step 8. Set marker M1 to 750 MHz and M2 to 829 MHz.
Step 9. Record the lowest return loss over the specified frequency.
Step 10. Press SAVE DISPLAY (page 3-5) name the trace, and press ENTER.
Chapter 4 Measurements
4-10

The following trace is an example of an antenna return loss trace.
Calculate the threshold value and compare the recorded Lowest Return Loss to the calcu-lated threshold value.
Maximum Return Loss = �
�
� �
�
20 1
1
log VSWR
VSWR
NOTE: VSWR is the antenna manufacturer’s specified VSWR.
If the measured return loss is less than the calculated threshold value, the test fails and theantenna must be replaced.
Chapter 4 Measurements
4-11
Figure 4-6. Antenna Return Loss Trace

Two Port Measurements
IntroductionA Tower Mounted Amplifier (TMA) can be used to amplify the received signal. There aredifferent types of TMA depending on the system requirements. Three commonly used typesare:
� TMA-D�A duplex tower mounted amplifier that combines transmit and receiveports from the radio system and connects to a single antenna. This configuration isspecific to systems that use a single antenna configuration.
� TMA-S�A receive-only tower mounted amplifier is installed between the receivingantenna and the radio to boost weak signals. This configuration is common on sys-tems that implement separate antennas for transmitting and receiving.
� TMA-DD�A dual-duplex tower mounted amplifier used for radios systems with asingle transmission line connection for transmit and receive. These systems are com-monly called transceivers.
During installation of the TMA, the following tests should be conducted:
� Antenna Subsystem Return Loss Testing to verify antenna performance.
� TMA performance testing to verify the tower mounted amplifier performance.
� Insertion Loss Measurement Test to verify the transmission line performance beforeTMA installation and connecting the antenna.
When troubleshooting TMA problems, the following test should be conducted:
� Insertion Loss Measurement Test to verify the transmission line performance afterTMA insertion.
� DTF-Return Loss with the TMA removed from the configuration.
Chapter 4 Measurements
4-12
ANTTX RX
TMA-D
S251CRF OUT
S251CRF IN
(Bias Tee)
TMA-S
ANT RX
TMA-DD
ANT RX/TX
S251CRF OUT
S251CRF IN
S251CRF OUT
S251CRF IN
(Bias Tee)(Bias Tee)
Figure 4-7. Types of Tower Mounted Amplifiers

TMA Measurements
Required Equipment
� Site Master Model S251C
� Option 10A, Bias Tee
� External Power Supply 40-115
� Test Port Extension Cable, Anritsu 15NNF50-1.5C
� N (m) to 716 (m) Adapters
Device Under Test
� TMA-S
Procedure
Step 1. Connect the External Power Supply (40-115) to the Site Master.
Step 2. Turn on the Site Master and press the MODE key.
Step 3. Select INSERTION GAIN (–30 dBm) using the Up/Down arrow key and pressENTER.
Step 4. Press the FREQ/DIST key to set the frequency limits. For a TMA-S amplifier,set F1 to 800 MHz and F2 to 925 MHz.
Step 5. Perform a two-port calibration of the Site Master (page 3-4).
Step 6. Connect the RF Out port of the Site Master to the ANT connector of the TMA.
Step 7. Connect the RF In port of the Site Master to the RX connector of the TMA.
Chapter 4 Measurements
4-13
TMA-S
RX ANT
HOLDRUN
STARTCAL
AUTOSCALE
SAVESETUP
RECALLSETUP
LIMIT MARKER
SAVEDISPLAY
RECALLDISPLAY
MODE FREQ/DIST AMPLITUDE SWEEP
SYS
ENTER
CLEAR
ESCAPE
ONOFF
/
1 2
4
5 6
7 8
9 0
3
+-
.
Site Master S251C
RF OUT TEST PORT(BIAS TEE)
RF IN TEST PORT
EXTERNAL POWERSUPPLY (40-115)
TEST PORT CABLE(OPTIONAL)
TEST PORT CABLE(OPTIONAL)
Figure 4-8. TMA-S Measurement Setup

Step 8. Press the SYS key, then OPTIONS, then BIAS TEE to turn on the bias tee volt-age. The gain is the level change before and after the bias tee voltage is turnedon.
Step 9. Press the AUTO SCALE key, or press the AMPLITUDE key to adjust the top andbottom scale, to display the gain level.
Step 10. Press the MARKER key and set marker set M1 to 834 MHz and marker M2 to883 MHz.
Marker M1 set at 834 MHz indicates the receive band of the tower mounted amplifier. Thelevel above the 0 dB reference level is the gain of the TMA. Marker M2 set at 883 MHz in-dicates the transmit band of the amplifier where there is no gain.
Chapter 4 Measurements
4-14
-10
-5
0
5
10
15
800 810 820 830 840 850 860 870 880 890 900
Limit : 0.00
M1 M2
Gain/Insertion Loss2-PORT CAL
Date: 06/13/2001 Time: 15:52:43Resolution: 130 CAL: ON(COAX)
dB
Frequency (800.0 - 906.0
M1: .01 dB @ 833.68 MHz M2: .00 dB @ 882.99 MHz
-70
-60
-50
-40
-30
-20
-10
0
10
20
800 810 820 830 840 850 860 870 880 890 900
Limit : 0.00
M1 M2
Gain/Insertion LossTMA
Date: 06/13/2001 Time: 15:38:07Resolution: 130 CAL: ON(COAX)
dB
Frequency (800.0 - 906.0 MHz)
M1: 12.90 dB @ 833.68 MHz M2: -.92 dB @ 882.99 MHz
REFERENCE LEVELAFTER CALIBRATION
GAIN MEASURED WITHBIAS TEE ACTIVATED
Figure 4-9. TMA Gain Measurement After Calibration
Gain/Insertion LossTMA-S CELLULAR
M1: 13.57 dB @ 836.82 MHz
Frequency (750.0 - 925.0 MHz)
Tra
nsm
issi
on(d
B) 20
-20
-30
-40
-50
-60
-70
10
-10
0
750 775 800 825 850 875 900 925
M1
Figure 4-10. TMA-S Gain Measurement

Device Under Test
� TMA-DD
Procedure
Step 1. Connect the External Power Supply (40-115) to the Site Master.
Step 2. Turn on the Site Master and press the MODE key.
Step 3. Select INSERTION GAIN (–30 dBm) using the Up/Down arrow key and pressENTER.
Step 4. Press the FREQ/DIST key to set the frequency limits. For a TMA-DD amplifier,set F1 to 1800 MHz and F2 to 1990 MHz.
Step 5. Perform a two-port calibration of the Site Master (page 3-4).
Step 6. Connect the RF Out port of the Site Master to the ANT connector of the TMA.
Step 7. Connect the RF In port of the Site Master to the RX/TX connector of the TMA
Step 8. Press the MARKER key and set marker set M1 to 1849 MHz and marker M2 to1891 MHz
Step 9. Press the SYS key, then OPTIONS, then BIAS TEE to turn on the bias tee volt-age. The gain is the level change before and after the bias tee voltage is turnedon.
4-15
Chapter 4 Measurements
TMA-DD
RX/TX ANT
HOLDRUN
STARTCAL
AUTOSCALE
SAVESETUP
RECALLSETUP
LIMIT MARKER
SAVEDISPLAY
RECALLDISPLAY
MODE FREQ/DIST AMPLITUDE SWEEP
SYS
ENTER
CLEAR
ESCAPE
ONOFF
/
1 2
4
5 6
7 8
9 0
3
+-
.
Site Master S251C
RF IN TEST PORT
TEST PORT CABLE(OPTIONAL)
TEST PORT CABLE(OPTIONAL)
EXTERNAL POWERSUPPLY (40-115)
RF OUT TEST PORT(BIAS TEE)
Figure 4-11. TMA-DD Measurement Setup

Marker M1 indicates the receive band of the tower mounted amplifier. The level above the0 dB reference level is the gain of the TMA. Marker M2 indicates the transmit band of theamplifier where there is no gain.
4-16
Chapter 4 Measurements
Gain/Insertion LossTMA-DD PCS
M1: 12.17 dB @ 1882.36 MHz
Frequency (18250.0 - 2025.0 MHz)1825 1850 1875 1900 1925 1950 1975 2000 2025
dB
10
-10
-20
-30
-40
-50
-60
-70
0
M1
Figure 4-12. TMA-DD Gain Measurement

Device Under Test
� TMA-D
Procedure
Step 1. Connect the External Power Supply (40-115) to the Site Master.
Step 2. Turn on the Site Master and press the MODE key.
Step 3. Select INSERTION GAIN (–30 dBm) using the Up/Down arrow key and pressENTER.
Step 4. Press the FREQ/DIST key to set the frequency limits. For a TMA-D amplifier,set F1 to 1800 MHz and F2 to 1990 MHz.
Step 5. Perform a two-port calibration of the Site Master (page 3-4).
Step 6. Connect the RF Out port of the Site Master to the ANT connector of the TMA.
Step 7. Connect the RF In port of the Site Master to the RX connector of the TMA
Step 8. Press the MARKER key and set marker set M1 to 1834 MHz and marker M2 to1871 MHz
Step 9. Press the SYS key, then OPTIONS, then BIAS TEE to turn on the bias tee volt-age. The gain is the level change before and after the bias tee voltage is turnedon.
4-17
Chapter 4 Measurements
TMA-D
RX TX ANT
HOLDRUN
STARTCAL
AUTOSCALE
SAVESETUP
RECALLSETUP
LIMIT MARKER
SAVEDISPLAY
RECALLDISPLAY
MODE FREQ/DIST AMPLITUDE SWEEP
SYS
ENTER
CLEAR
ESCAPE
ONOFF
/
1 2
4
5 6
7 8
9 0
3
+-
.
Site Master S251C
RF IN TEST PORT
TEST PORT CABLE(OPTIONAL)
TEST PORT CABLE(OPTIONAL)
EXTERNAL POWERSUPPLY (40-115)
RF OUT TEST PORT(BIAS TEE)
Figure 4-13. TMA-D Measurement Setup

Marker M1 indicates the receive band of the tower mounted amplifier. The level above the0 dB reference level is the gain of the TMA. Marker M2 indicates the transmit band of theamplifier where there is no gain.
4-18
Chapter 4 Measurements
Figure 4-14. TMA-D Gain Measurement
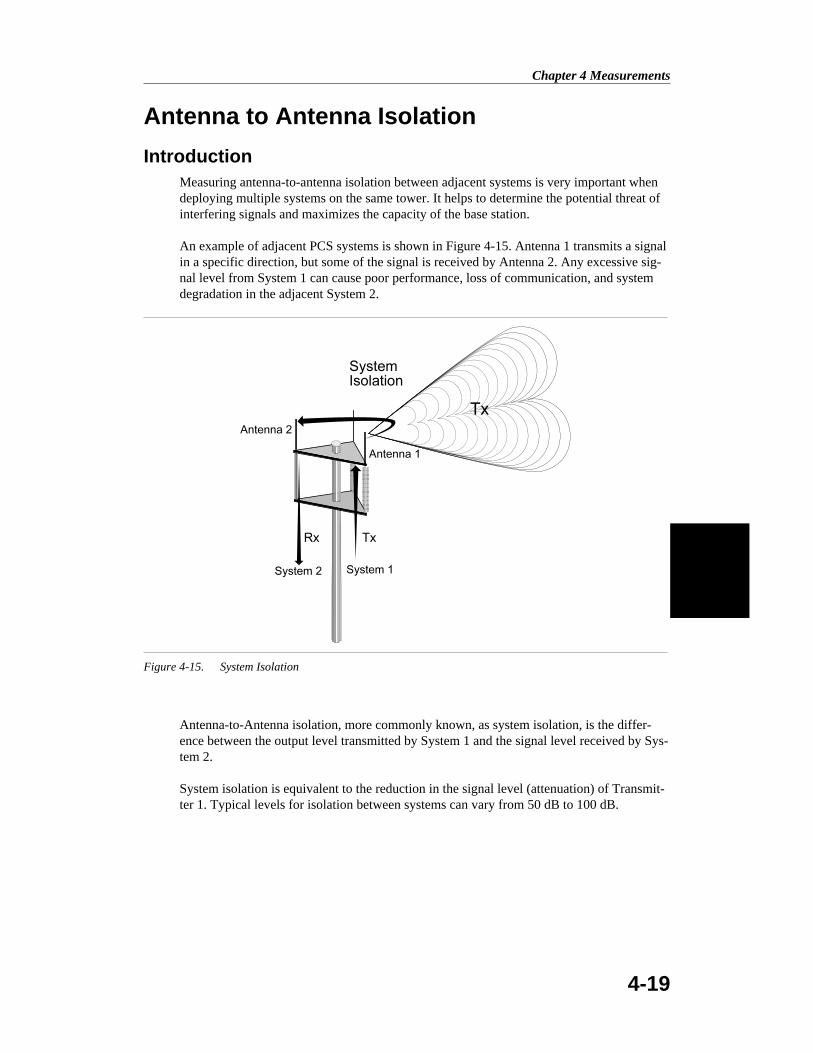
Antenna to Antenna Isolation
IntroductionMeasuring antenna-to-antenna isolation between adjacent systems is very important whendeploying multiple systems on the same tower. It helps to determine the potential threat ofinterfering signals and maximizes the capacity of the base station.
An example of adjacent PCS systems is shown in Figure 4-15. Antenna 1 transmits a signalin a specific direction, but some of the signal is received by Antenna 2. Any excessive sig-nal level from System 1 can cause poor performance, loss of communication, and systemdegradation in the adjacent System 2.
Antenna-to-Antenna isolation, more commonly known, as system isolation, is the differ-ence between the output level transmitted by System 1 and the signal level received by Sys-tem 2.
System isolation is equivalent to the reduction in the signal level (attenuation) of Transmit-ter 1. Typical levels for isolation between systems can vary from 50 dB to 100 dB.
4-19
Chapter 4 Measurements
Figure 4-15. System Isolation
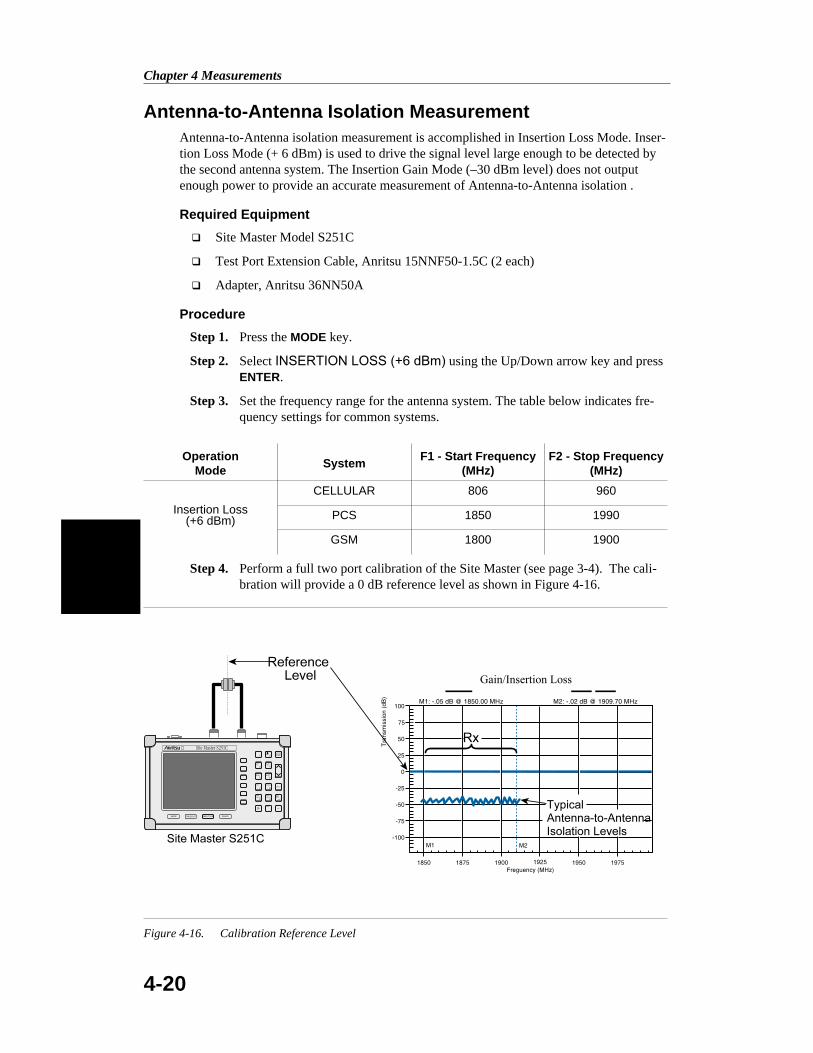
Antenna-to-Antenna Isolation MeasurementAntenna-to-Antenna isolation measurement is accomplished in Insertion Loss Mode. Inser-tion Loss Mode (+ 6 dBm) is used to drive the signal level large enough to be detected bythe second antenna system. The Insertion Gain Mode (–30 dBm level) does not outputenough power to provide an accurate measurement of Antenna-to-Antenna isolation .
Required Equipment
� Site Master Model S251C
� Test Port Extension Cable, Anritsu 15NNF50-1.5C (2 each)
� Adapter, Anritsu 36NN50A
Procedure
Step 1. Press the MODE key.
Step 2. Select INSERTION LOSS (+6 dBm) using the Up/Down arrow key and pressENTER.
Step 3. Set the frequency range for the antenna system. The table below indicates fre-quency settings for common systems.
Step 4. Perform a full two port calibration of the Site Master (see page 3-4). The cali-bration will provide a 0 dB reference level as shown in Figure 4-16.
4-20
Chapter 4 Measurements
OperationMode
SystemF1 - Start Frequency
(MHz)F2 - Stop Frequency
(MHz)
Insertion Loss(+6 dBm)
CELLULAR 806 960
PCS 1850 1990
GSM 1800 1900
Figure 4-16. Calibration Reference Level

Step 5. Disconnect the Tx (Transmit) coax from System 1 and connect it to the RF Outport of the Site Master.
Step 6. Disconnect the Rx (Receive) coax from System 2 and connect it to the RF Inport of the Site Master.
Step 7. Adjust the scale, either manually or by using the AUTO SCALE key, to displaythe isolation level in the center of the display.
Step 8. Press the MARKER key and set markers M1 and M2 to identify the receive bandof the amplifier.
Step 9. Press the LIMIT key and set the limit line to the estimated average signal level.Figure 4-17 displays a typical antenna isolation measurement display.
Typical antenna-to antenna isolation measurements are made between –50 dB and –100 dBbelow the 0 dB reference line established by the 2-port calibration.
4-21/4-22
Chapter 4 Measurements
Site Master S251C
Tx
Rx
RF Input
RF O utputA ntennaIso lation
Level
Site Master S251C
Gain/Insertion Loss
Rx
Figure 4-17. Typical Antenna Isolation Measurement Display

Chapter 5Site Master Software Tools
IntroductionThis chapter provides a description of the Site Master Software Tools provided with theSite Master. Site Master Software Tools (SMST) is a Windows 95/98/NT4/2000/ME pro-gram for cable and antenna trace analysis. The program help function provides on screeninstructions on display modification, trace overlay, and multiple plot printing.
FeaturesSite Master Software Tools provides the following features:
� Download traces saved in the Site Master memory to the PC for storage and analysis
� DTF and Smith Chart analysis capability
� Trace Overlay allows the viewing of two plots simultaneously
� Ability to save captured plots as data files (.dat file format) or as records representingsite information in a database file
� Ability to convert Return Loss measurements to Distance-To-Fault measurements
� Ability to zoom in or out to analyze a particular region of the plot
� Ability to modify Plot Properties
� Ability to output plots to a printer for hard copy records
� Capture of the current trace in the unit
System RequirementsThe Site Master Software Tools program will run on most any computer running Windows95/98/NT4/2000/ME. Minimum requirements and recommendations are:
� Intel Pentium 100 MHz microprocessor (Pentium II 350 MHz or better recom-mended)
� 16 MB of RAM (64 MB or above recommended)
� Hard disk drive with approximately 15 MB of available space (An additional 20 MBfree space for storage of captured plots is recommended.)
� A serial (COM) port for communication with the Site Master
NOTE: It is recommended that Windows NT 4.0 users install NT 4.0 ServicePack 3 (SP3) or above. In addition, Windows 2000 and Windows ME may re-quire installation of the latest Service Pack. Please contact Microsoft Corpora-tion for further information on obtaining and installing service packs.
5-1
5

InstallationTo install the Site Master Software Tools program:
Step 1. Insert the Anritsu Site Master Software Tools disk in the CDROM drive.
Step 2. From the Windows Start menu, select Run .
Step 3. Type: X:\Setup.exe where X is the drive letter of your CDROM drive.
Step 4. When prompted, press the Enter key to accept the default directory C:\ProgramFiles\Site Master Software Tools and the installation will begin.
Step 5. When the installation is complete, pres Enter to restart Windows.
The readme.doc file on the disk provides updated information about the program, and theHelp function provides detailed operating information.
Communication Port Setting
The Site Master Software Tools communicates with the Site Master through a standard se-rial COM port on the PC. Set the baud rate of the COM port to 115200.
Step 1. Select Start, Programs and select Site Master Software Tools.
Step 2. When the program has loaded, select Settings, Communication.
Step 3. Select the appropriate PC COM port and Transfer Baud Rate for your system,and click OK.
5-2
Chapter 5 Software Tools Program
Figure 5-1. Communication Setting Dialog Box

Interface Cable Installation
Communication between the Site Master and the PC is accomplished over a null modem se-rial cable provided with the Site Master (Anritsu part number 800-441).
Step 1. Install the null modem serial interface cable to the Serial Interface connector onthe Site Master Test Connector Panel.
Step 2. Connect the other end of the serial interface cable to the appropriate COM portconnector on the PC.
Step 3. Turn on both the Site Master and the PC.
Using Software ToolsSelect Start, Programs and select Site Master Software Tools.
When communication is established between the Site Master and the PC a “Remote” statusmessage will be displayed on the Site Master display.
Downloading Traces from the Site MasterDownloaded traces from the Site Master can be selected as a entire block or as individualfiles. Files are categorized by measurement type:
5-3
Chapter 5 Software Tools Program
COM PORT
SERIAL INTERFACE
HOLDRUN
STARTCAL
AUTOSCALE
SAVESETUP
RECALLSETUP
LIMIT MARKER
SAVEDISPLAY
RECALLDISPLAY
MODE FREQ/DIST AMPLITUDE SWEEP
SYS
ENTER
CLEAR
ESCAPE
ONOFF
/
1 2
4
5 6
7 8
9 0
3
+-
.
Site Master S332C
Figure 5-2. Serial Cable Connection
� Return Loss
� VSWR
� DTF (Distance-to-Fault)
� Time/Date stamp
Plot CaptureTo open the plot capture menus, select the capture icon on the button bar, or select the Cap-ture drop down menu from the menu bar.
Select Capture to Screen to download traces to the PC.
Highlight a folder, or highlight individual traces within a folder, to be downloaded to thePC. The traces will appear on the PC display as they are downloaded.
Plot PropertiesAfter downloading, certain plot properties and information can be modified. Select the PlotProperties or Plot Information icon, or right click on the graph area of the trace.
Plot Properties that can be changed include:Graph TitlesDisplay ModeScale/LimitMarkersMisc.
Graph Titles
After downloading the plot, the Main Title can be changed to reflect the site name or otherdescriptive information. The Sub Title field can be used to describe the specifics of themeasurement and configuration.
Display Mode
Display Mode allows changing the display type without having to retest. Plots can bechanged from Return Loss to VSWR with single click of mouse button.
Scale/Limit
The scale of the displayed plot can be modified to help analyze whether the plot meetspass/fail criteria. The Scale/Limit sub menu activates options to manually enter the scalelimits, or to use the Auto Scale mode.
Manual adjustment sets the upper and lower limits of the display under theScale/Limit Submenu.
Auto Scale automatically adjusts the scale for maximum and minimum mea-surement readings.
Limit Line Off turns off all limit lines.
Single Limit Line can be activated to help identify faults. Typical antenna speci-fications require better than –15 dB return loss.
Multi-Segment Limit Lines can be activated to set different limits within thesame measurement display for specification requirements.
5-4
Chapter 5 Software Tools Program

Markers
Markers M1 through M6 can be activated from the Plot Properties menu.
The six active markers can be displayed on the plot to help identify faults from the linesweep data.
Misc.
The Miscellaneous tab allows adjustment of the Plot/Limit Line Width and the setting ofthe Plot Footer.
Plot/Limit Line Width can be used when preparing reports for the carrier, ser-vice providers, and network operators where the trace data must be visible andlegible for documentation. The line density of the trace can be set to Normal(Thin Line) or Thick Line to make the data appear easily when copies are made.
Plot Footer allows selection of information to be displayed in the trace display.Selections are:
Trace Overlay or Plot Overlay
Trace Overlay is activated by the Mouse Function icon. Single-click on the Mouse Functionicon to toggle. Toggling this icon switches the mouse function between Marker/Limit/Zoomand Plot Overlaying.
To overlay two plots, click-and-drag from one plot to the other plot. The final display willbe the two plots superimposed on one another.
Refer to the SMST HELP function for more information on the steps necessary to perform atrace overlay.
Saving Traces
Once the plots are captured to the PC they can be save as individual files, as a block of filesto a database, exported as a graphic Windows metafile (.wmf) or text data file (.txt).
Saving a Plot as a Windows Metafile or to a Spreadsheet
Plots can be saved as a Windows metafile (.wmf) or as a text file (.txt). The metafile maybe imported into graphic programs and the text file can be imported into spreadsheet.
To save a plot as a Windows metafile, click on the File menu and select Save as Metafilefrom the pull down menu. Once the trace is saved as a metafile, it can be copied and trans-ferred into other applications as a picture or graphic file.
To copy a metafile:
Step 1. Select the trace to be copied with the mouse cursor.
Step 2. Select Edit and then Copy. The file will copied to clipboard.
5-5
Chapter 5 Software Tools Program
� Bias Tee � Impedance
� Time/Date � Measurements
� Model and Serial Number � DTF Parameters
� Date Format � Overlay Indicator

Step 3. Exit the Site Master Software Tools program and open the target application(Microsoft Word, etc.).
Step 4. Select Edit and then Paste. The file will be inserted as a low-resolution graphicfile or a bitmap.
Saving a Plot to a Spreadsheet
Plots can be saved as a text file (.txt) which can then be imported into a spreadsheetprogram.
To save a plot as a text file:
Step 1. Select the trace to be copied with the mouse cursor.
Step 2. Click on the File menu and select Export to Text File for a Spreadsheet fromthe pull down menu.
Step 3. Save the file to a local directory.
Step 4. Exit the Site Master Software Tools program and open the spreadsheet applica-tion.
Step 5. Import the .txt file into the spreadsheet program.
Custom Cable List
A custom cable list can be created in Site Master Software Tools and uploaded to the SiteMaster. Some standard 1000 MHz, 2000 MHz, and 2500 MHz cables are stored in the SiteMaster and are listed in Appendix A of this User’s Guide.
The cable list contains vital information such as propagation velocity (Vp) and insertionloss (dB/m or dB/ft). These parameters are important when identifying faults and disconti-nuities of transmission lines.
NOTE: Values for the cable list are taken from manufacturers specifications andare normalized for a sweep frequency setting of 1 GHz. Complex digital com-munications systems may require adjustment to attenuation values at thehigher frequencies. Contact the manufacturer for the appropriate cable losses.
The Cable Editor is specifically designed to provide contractors, service providers, and net-work operators with a list of cable types that are tailored to their use.
To open the Cable Editor, select the Tools menu and select Cable Editor.
To open an existing cable list file, select File and Open. Select the desired cable list andpress Enter.
Creating a Custom Cable List
To create a custom cable list:
Step 1. Select the File menu and select New.
Step 2. Type in or cut and paste the cable types and specifications for the desired cables.
5-6
Chapter 5 Software Tools Program

Uploading a Cable List
After custom cable list has be created in Site Master Software Tools it can upload it to theSite Master. The serial communication null modem cable must be connected from the SiteMaster to the PC.
In the Cable Editor, select Tools and Upload Cable List. The software will confirm the up-load with a message " Upload Complete" when the operation is finished.
Querying the Site Master Cable List
Query Cable List allows the user to check and review the contents of the custom cable listin the Site Master.
In the Cable Editor, select Tools and Query Cable List. The software will download the ca-ble list from the Site Master to the PC.
Creating a Database
A single trace or a block of traces can be transferred from the Site Master to the PC. A sep-arate database can be created for each cellular site. The site name can be used as the data-base name.
Step 1. Select the File menu and select the Database.
Step 2. Open an existing database or create a new database with a descriptive filenamethat represents the site name.
Once the database has been created, files can be saved and site information can be added,such as Plot Description, Date/Time, Operator, record/trace number and session description(Transmitter type etc.)
Individual plots will be labeled with the Database Site Name. Each record has its own plotdescription and measurement type (for example, Return Loss-antenna, Return Loss-cable,and DTF-Return Loss).
Printing Formats
One to multiple plots per page can be set up under the print format in Site Master SoftwareTools. Orientation of how the plots are printed on the page can be changed from vertical tohorizontal.
5-7/5-8
Chapter 5 Software Tools Program

Appendix AReference Data
Coaxial Cable Technical DataTable A-1 provides a standard listing of common coaxial cables along with their RelativePropagation Velocity and Nominal Attenuation values in dB/m @1000, 2000, and2500 MHz.
A-1
Manufacturer Cable TypeRelative
PropagationVelocity (Vf)
NominalAttenuation
dB/m @1000 MHz
NominalAttenuation
dB/m @2000 MHz
NominalAttenuation
dB/m @2500 MHz
Andrew FSJ1-50A 0.84 0.197 0.285 0.323
Andrew FSJ2-50 0.83 0.134 0.196 0.224
Andrew FSJ4-50B 0.81 0.119 0.176 0.202
Andrew LDF4-50A 0.88 0.077 0.113 0.133
Andrew LDF5-50A 0.89 0.043 0.064 0.077
Andrew LDF6-50 0.89 0.032 0.048 0.056
Andrew LDF7-50A 0.88 0.027 0.041 0.047
Andrew LDF12-50 0.88 0.022 0.035 N/A
Andrew HJ4-50 0.914 0.087 0.126 0.15
Andrew HJ4.5-50 0.92 0.054 0.079 0.084
Andrew HJ5-50 0.916 0.042 0.063 0.07
Andrew HJ7-50A 0.921 0.023 0.034 0.04
Andrew HJ12-50 0.931 0.019 0.029 N/A
Belden RG8, 8A 0.659 0.262 N/A N/A
Belden RG9, 9A 0.659 0.289 N/A N/A
Belden RG17, 17A 0.659 0.18 N/A N/A
Belden RG55, 55A, 55B 0.659 0.541 N/A N/A
Belden RG58, 58B 0.659 0.558 N/A N/A
Belden RG58A, 58C 0.659 0.787 N/A N/A
Belden RG142 0.659 0.443 N/A N/A
Belden RG174 0.659 0.984 N/A N/A
Belden RG178B 0.659 1.509 N/A N/A
Belden RG188 0.659 1.017 N/A N/A
Belden RG213 0.659 0.292 N/A N/A
Table A-1. Coaxial Cable Technical Data (1 of 3)

A-2
Appendix A Reference Data
Manufacturer Cable TypeRelative
PropagationVelocity (Vf)
NominalAttenuation
dB/m @1000 MHz
NominalAttenuation
dB/m @2000 MHz
NominalAttenuation
dB/m @2500 MHz
Belden RG214 0.659 0.292 N/A N/A
Belden RG223 0.659 0.535 N/A N/A
Cablewave HCC12-50J 0.915 0.087 0.126 0.137
Cablewave HCC78-50J 0.915 0.041 0.061 0.066
Cablewave HCC158-50J 0.95 0.022 0.031 0.033
Cablewave HCC300-50J 0.96 0.015 N/A N/A
Cablewave HCC312-50J 0.96 0.013 N/A N/A
Cablewave HF 4-1/8” Cu2Y 0.97 0.01 N/A N/A
Cablewave HF 5” Cu2Y 0.96 0.007 N/A N/A
Cablewave HF 6-1/8” Cu2Y 0.97 0.006 N/A N/A
Cablewave FLC 38-50J 0.88 0.115 0.169 0.19
Cablewave FLC 12-50J 0.88 0.072 0.11 0.134
Cablewave FLC 78-50J 0.88 0.041 0.061 0.072
Cablewave FLC 114-50J 0.88 0.033 0.05 0.059
Cablewave FLC158-50J 0.88 0.025 0.038 0.042
Comscope CR50 540 PE 0.88 0.069 0.103 0.116
Comscope CR50 1070PE 0.88 0.037 0.055 0.064
Comscope CR50 1873PE 0.88 0.022 0.0344 0.04
NK Cables RF ½” -50 0.88 0.0757 0.112 0.127
NK Cables RF ½” -50 GHF 0.88 0.0757 0.112 0.127
NK Cables RF ½” -50 BHF 0.88 0.0757 0.112 0.127
NK Cables RF 5/8”-50 0.88 0.0518 0.0768 0.087
NK Cables RF 5/8”-50GHF” 0.88 0.0518 0.0768 0.087
NK Cables RF 5/8”-50BHF” 0.88 0.0518 0.0768 0.087
NK Cables RF 7/8”-50 0.88 0.0413 0.062 0.07
NK Cables RF 7/8”-50GHF” 0.88 0.0413 0.062 0.07
NK Cables RF 7/8”-50BHF” 0.88 0.0413 0.062 0.07
NK Cables RF 1 5/8” -50 0.88 0.0248 0.038 0.044
NK Cables RF 1 5/8” -50GHF” 0.88 0.0248 0.038 0.044
NK Cables RF 1 5/8” -50BHF” 0.88 0.0248 0.038 0.044
Table A-1. Coaxial Cable Technical Data (2 of 3)

A-3/A-4
Appendix A Reference Data
Manufacturer Cable TypeRelative
PropagationVelocity (Vf)
NominalAttenuation
dB/m @1000 MHz
NominalAttenuation
dB/m @2000 MHz
NominalAttenuation
dB/m @2500 MHz
NK Cables RF 2 ¼” -50 0.88 0.021 0.034 N/A
NK Cables RF 2 ¼” -50GHF 0.88 0.021 0.034 N/A
NK Cables RF 2 ¼” -50BHF 0.88 0.021 0.034 N/A
NK Cables RFF 3/8” -50 0.81 0.147 0.218 0.25
NK Cables RFF 3/8” -50GHF 0.81 0.147 0.218 0.25
NK Cables RFF 3/8” -50BHF 0.81 0.147 0.218 0.25
NK Cables RFF ½” -50 0.82 0.112 0.167 0.19
NK Cables RFF ½” -50GHF 0.82 0.112 0.167 0.19
NK Cables RFF ½” -50BHF 0.82 0.112 0.167 0.19
NK Cables RFF 7/8” -50 0.84 0.052 0.078 0.089
NK Cables RFF 7/8” -50GHF 0.84 0.052 0.078 0.089
NK Cables RFF 7/8” -50BHF 0.84 0.052 0.078 0.089
Times LMR100 0.8 0.792 1.15 1.31
Times LMR200 0.83 0.344 0.49 0.554
Times LMR240 0.84 0.262 0.377 0.424
Times LMR400 0.85 0.135 0.196 0.222
Times LMR500 0.86 0.109 0.159 0.18
Times LMR600 0.87 0.087 0.128 0.145
Times LMR900 0.87 0.056 0.086 0.098
Times LMR1200 0.88 0.044 0.065 0.074
Times LMR1700 0.89 0.033 0.049 0.056
- 310801 0.821 0.115 N/A N/A
- 311201 0.82 0.18 N/A N/A
- 311501 0.8 0.23 N/A N/A
- 311601 0.8 0.262 N/A N/A
- 311901 0.8 0.377 N/A N/A
- 352001 0.8 0.377 N/A N/A
Table A-1. Coaxial Cable Technical Data (3 of 3)
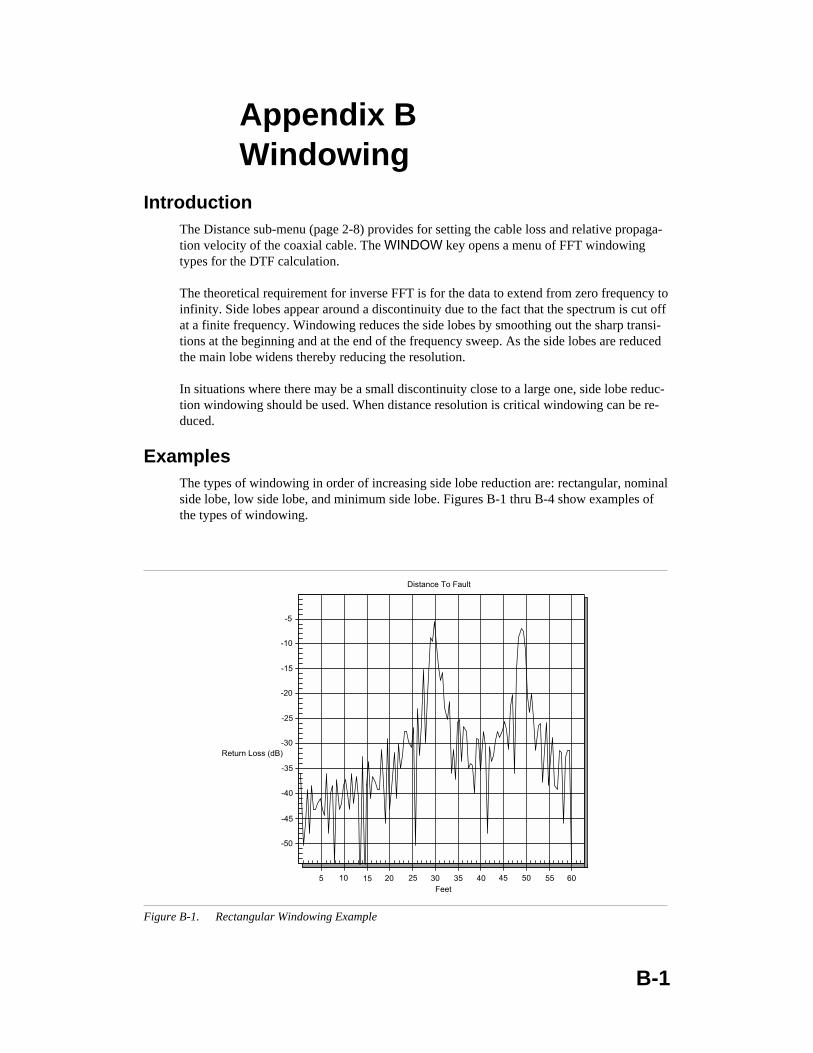
Appendix BWindowing
IntroductionThe Distance sub-menu (page 2-8) provides for setting the cable loss and relative propaga-tion velocity of the coaxial cable. The WINDOW key opens a menu of FFT windowingtypes for the DTF calculation.
The theoretical requirement for inverse FFT is for the data to extend from zero frequency toinfinity. Side lobes appear around a discontinuity due to the fact that the spectrum is cut offat a finite frequency. Windowing reduces the side lobes by smoothing out the sharp transi-tions at the beginning and at the end of the frequency sweep. As the side lobes are reducedthe main lobe widens thereby reducing the resolution.
In situations where there may be a small discontinuity close to a large one, side lobe reduc-tion windowing should be used. When distance resolution is critical windowing can be re-duced.
ExamplesThe types of windowing in order of increasing side lobe reduction are: rectangular, nominalside lobe, low side lobe, and minimum side lobe. Figures B-1 thru B-4 show examples ofthe types of windowing.
B-1
� � � �
� � � � � � � � � � � � � � � � � � � �
� �
� � �
� � �
� � �
� � �
� � �
� � �
� �
� �
� � �
� � � � � � � � � � � � � � �
� � � � � � � � � � � � � � � �
Figure B-1. Rectangular Windowing Example

B-2
Appendix B Windowing
� � � � � � � � � � � � � � � �
� � � � � � � � � � �
� � � �
� � � � � � � � �
� �
� � �
� � �
� � �
� � �
� � �
� � �
� �
� �
� � �
� � � � � � � � � � � � � � �
Figure B-2. Nominal Side Lobe Windowing Example
� � � � � � � � � � � � � � � �
� � � � � � � � � � �
� � � �
� � � � � � � � �
� �
� � �
� � �
� � �
� � �
� � �
� � �
� �
� �
� � �
� � � � � � � � � � � � � � �
Figure B-3. Low Side Lobe Windowing Example

B-3/B-4
Appendix B Windowing
� � � � � � � � � � � � � � � �
� � � � � � � � � � � � � � � � � � � �
� � � �
� �
� � �
� � �
� � �
� � �
� � �
� � �
� �
� �
� � �
� � � � � � � � � � � � � � �
Figure B-4. Minimum Side Lobe Windowing Example