site operator program final report · site operator program final report introduction this report...
TRANSCRIPT

INEEL/EXT-97-01383
January 1998
Site Operator Program Final Reportfor Fiscal Years 1992 through 1996
J. E. FrancfortR. R. BassettS. BriascoW. CullitonE. F. DuffyR. A. EmmertJ. R. HagueR. HobbsB. GrazianoI. J. KakwanS. NealL. StefanakosT. G. Ware
INEEL/EXT-97-01383
Site Operator Program Final Reportfor Fiscal Years 1992 through 1996
J. E. Francfort1
R. R. Bassett2
S. Briasco3
W. Culliton4
E. F. Duffy5
R. A. Emmert6
B. Graziano7
J. R. Hague8
R. Hobbs9
I. J. Kakwan10
S. Neal11
L. Stefanakos12
T. G. Ware13
Published January 1998
Idaho National Engineering and Environmental LaboratoryAutomotive Systems and Technology Department
Lockheed Martin Idaho Technologies CompanyIdaho Falls, Idaho 83415
Prepared for the U.S. Department of Energy
Assistant Secretary for Energy Efficiency and Renewable EnergyUnder DOE Idaho Operations OfficeContract No. DE-AC07-94ID13223
1 INEEL/Lockheed Martin Idaho Technologies Co.2 Sandia National Laboratories3 Los Angeles Department of Water and Power4 Orcas Power & Light Company5 Potomac Electric Power Company6 Platte River Power Authority7 Potomac Electric Power Company
8 Kansas State University 9 Arizona Public Service10 Texas A&M University11 Pacific Gas & Electric Company12 University of South Florida13 Southern California Edison Company

iii
ABSTRACT
The Site Operator Program was an electric vehicle testing and evaluation programsponsored by U.S. Department of Energy and managed at the Idaho National Engineering andEnvironmental Laboratory. The Program’s goals included the field evaluation of electric vehiclesin real-world applications and environments; the support of electric vehicle technologyadvancement; the development of infrastructure elements necessary to support significant electricvehicle use; and increasing the awareness and acceptance of electric vehicles. This report coversProgram activities from 1992 to 1996. The Site Operator Program ended in September 1996,when it was superseded by the Field Operations Program. Electric vehicle testing includedbaseline performance testing, which was performed in conjunction with EV America. Thebaseline performance parameters included acceleration, braking, range, energy efficiency, andcharging time. The Program collected fleet operations data on electric vehicles operated by theProgram’s thirteen partners, comprising electric utilities, universities, and federal agencies. TheProgram’s partners had over 250 electric vehicles, from vehicle converters and originalequipment manufacturers, in their operating fleets. Test results are available via the World WideWeb site at http://ev.inel.gov/sop .

iv

v
EXECUTIVE SUMMARY
The U.S. Department of Energy’s (DOE's) Site Operator Program was initially established tomeet the requirements of the Electric and Hybrid Vehicle Research, Development, andDemonstration Act of 1976. Over time, the Program evolved in response to legislation changes andtechnology advancements. The goals of the Site Operator Program included the field evaluation ofelectric vehicles in real-world applications and environments; the support of electric vehicletechnology advancement; the development of infrastructure elements necessary to supportsignificant electric vehicle use; and increasing the awareness and acceptance of electric vehicles.The Site Operator Program ended in September 1996, when it was superseded by the FieldOperations Program.
The Site Operator Program, managed by the Idaho National Engineering and EnvironmentalLaboratory, consisted of 11 participants under contract and two other organizations that had data-sharing agreements with the Program. The participants (electric utilities, academic institutions, andFederal agencies) were geographically dispersed within the United States and their vehicles saw abroad spectrum of service conditions.
During the 5-year period (1992–1996) that this report covers, the Site Operator Programcollected data on electric vehicles that were operated by their Program partners. These 13organizations had 250 electric vehicles in their fleets and gained significant knowledge aboutelectric vehicle operations, vehicle components, and battery charging methods. For example, theProgram partners identified
• Typical vehicle energy usage (1 to 4 miles per kWh depending on a vehicle’s age andtechnology)
• The amount of energy that can be recaptured by regenerative braking (about 25–30%according to studies by the University of South Florida)
• The benefits of fast charging (according to Arizona Public Service, higher vehicleutilization with pack recharging that takes less than 15 minutes)
• The need for more dependable vehicles (Southern California Edison’s knowledgegained while running the largest electric vehicle fleet in the United States).
Another area of Program activity was the support of the EV America baseline performancetesting of electric vehicles offered for sale by vehicle converters and original equipmentmanufacturers. During the first year of baseline performance testing (1994), nine vehicles weretested; during 1995, three vehicles were tested; and during 1996, a prototype from Toyota wastested and the first original equipment manufacturer vehicle intended for public distribution (theEV1 from General Motors) was also tested. During the 3 years of baseline performance testing,the average annual testing results suggested significant improvements in product offerings. Forinstance, from 1994 to 1996:
• As measured by the SAE J1634 Driving Cycle Test, ranges increased 56%
• Driving Cycle Efficiencies in miles per kWh increased 53%

vi
• Vehicles accelerated 0 to 50 mph, 58% faster
• Battery charging times were 22% faster.
This report, and the results of the baseline performance testing and fleet operationsparameters, are available electronically at the Field Operations Program’s World Wide Web site:http://ev.inel.gov/sop .

vii
ACKNOWLEDGMENTS
I would like to thank each of the Site Operator Program participants for their input,active participation, and timely comments. This report incorporates text and data from thequarterly and final reports that each of the Site Operator participants have submitted. Because ofthe significant amount of text that is drawn from these reports, each Site Operator is listed as aco-author. However, any errors, omissions, or inaccuracies are my responsibility.
J. E. Francfort

viii

ix
CONTENTS
Abstract.................................................................................................................................... iii
Executive Summary................................................................................................................. v
Acknowledgments.................................................................................................................. vii
Introduction.............................................................................................................................. 1
Vehicle Performance Tests Sponsored by DOE and EV America ...................................... 5
Test Results Reported on Vehicle Fact Sheets............................................................. 8
Energy Economics ................................................................................................................. 23
Assumptions................................................................................................................. 23
Results .......................................................................................................................... 24
Arizona Public Service .......................................................................................................... 27
Fleet Testing................................................................................................................. 27
The Old Fleet...................................................................................................... 27The New Fleet .................................................................................................... 30Battery Field Testing ......................................................................................... 32
Kansas State University......................................................................................................... 37
Field Data Collection and Vehicle Operations .......................................................... 37
EVcorts ............................................................................................................... 37TDM Ford Ranger.............................................................................................. 38
Los Angeles Department of Water and Power..................................................................... 40
Introduction.................................................................................................................. 40
Vehicle Operations and Activities .............................................................................. 40
U.S. Electricar Pickup Trucks........................................................................... 40Chrysler TEVans................................................................................................ 41U.S. Electricar Sedans ....................................................................................... 41Other Electric Vehicles...................................................................................... 42
Orcas Power and Light .......................................................................................................... 43
Introduction.................................................................................................................. 43
Operations Results ....................................................................................................... 43
General Motors G-Van ...................................................................................... 43Solectria Force.................................................................................................... 43Jet Industries Escort........................................................................................... 44
Public Activities........................................................................................................... 45

x
Pacific Gas and Electric Co................................................................................................... 47
Vehicle Operations ...................................................................................................... 47
Ford Ecostars...................................................................................................... 47Honda Civics ...................................................................................................... 47Toyota RAV4 ..................................................................................................... 48U.S. Electricar Chevy S-10s.............................................................................. 49Other Vehicles.................................................................................................... 49
Platte River Power Authority ................................................................................................ 50
Potomac Electric Power Company ....................................................................................... 51
Introduction.................................................................................................................. 51
Revenue.............................................................................................................. 51Environment....................................................................................................... 51Technology......................................................................................................... 51
Demonstrations ............................................................................................................ 51
Vehicles/Components/Batteries ........................................................................ 52Sandia National Laboratory .................................................................................................. 55
History .......................................................................................................................... 55
Fleet Problems.............................................................................................................. 56
Fleet Performance ........................................................................................................ 56
Lessons Learned and Causes of Failures.................................................................... 57
Future Program Activities ........................................................................................... 58
Conclusions.................................................................................................................. 59
Southern California Edison Co. ............................................................................................ 60
Introduction.................................................................................................................. 60
Vehicle Development and Testing.............................................................................. 61
Energy Storage Development and Testing ................................................................. 62
Infrastructure ................................................................................................................ 63
Lessons Learned .......................................................................................................... 64
Vehicles .............................................................................................................. 64Energy Storage ................................................................................................... 64Infrastructure ...................................................................................................... 65
Texas A&M University ......................................................................................................... 66
Introduction.................................................................................................................. 66
Vehicle Operations and Activities .............................................................................. 66
Education and Information.......................................................................................... 66

xi
Conclusions.................................................................................................................. 66
University of South Florida................................................................................................... 68
Introduction.................................................................................................................. 68
Vehicle Inventory......................................................................................................... 68
Vehicle Performance ................................................................................................... 69
Air Conditioning Performance.................................................................................... 73
Photovoltaic Solar Power ............................................................................................ 73
U.S. Navy ............................................................................................................................... 75
York Technical College......................................................................................................... 77
Introduction.................................................................................................................. 77
Public Awareness and Education................................................................................ 77
Curriculum Development and Training...................................................................... 78
Basic Electric Vehicle Operator Training ........................................................ 78Introduction to Electric Vehicle Technologies ................................................ 78Introduction to Electric Vehicle Maintenance and Repair .............................. 79
Field Data Collection................................................................................................... 79
Vehicle Modification and Upgrades........................................................................... 79
Lessons Learned .......................................................................................................... 80
References .............................................................................................................................. 81

xii

1
Site Operator Program Final Report
INTRODUCTION
This report summarizes activities of the Site Operator Program for the fiscal years 1992through 1996. The Site Operator Program was established by the Department of Energy (DOE) toincorporate the electric vehicle activities dictated by the Electric and Hybrid Vehicle Research,Development and Demonstration Act of 1976. In the ensuing years, the Program evolved inresponse to new legislation and interests. The goals of the Site Operator Program included the fieldevaluation of electric vehicles in real-world applications and environments; the advancement ofelectric vehicle technologies; the development of infrastructure elements necessary to supportsignificant electric vehicle use; and increasing the awareness and acceptance of electric vehicles bythe public.
The Site Operator Program’s focus included two major and concurrent electric vehicletesting activities. The first activity was the baseline performance testing of electric vehicles thatwere offered for sale by original equipment manufacturers and vehicle converters. This testingwas performed in conjunction with an electric utility group known as EV America.
The second activity consisted of field operations testing of electric vehicles and thecollection and dissemination of operating performance parameters. This activity also includedelectric vehicle public awareness activities such as ride-n-drives and electric vehicle displays,with the intent of maximizing the public’s and decisionmakers’ awareness of electric vehicles.This second activity was conducted in conjunction with the 11 Site Operators located in diverseareas across the United States (Figure Intro-1). Information was also shared reciprocally with twoadditional sites (U.S. Navy and Sandia National Laboratory) that were not under Program contract.
The Site Operator Program was managed by personnel of the Automotive Systems andTechnology Department at the Idaho National Engineering and Environmental Laboratory(INEEL). The principal management functions included:
i Technical and financial monitoring of programmatic activities, including periodicprogress reports to DOE.
i Data acquisition, analysis, and dissemination. The data from the Site Operator Program ismade available to users through the INEEL’s World Wide Web site athttp://ev.inel.gov/sop .
i Coordination of Site Operator Program efforts in the areas of public awareness andinfrastructure development (program-related meetings, and educational presentations).
This Final Report contains the following:
i A general discussion of electric vehicle performance testing results and an indication ofperformance testing trends over the years 1994, 1995, and 1996.
i A discussion about the energy economics of electric vehicles in comparison to internalcombustion vehicles

2
Figure Intro-1. Location of the 13 Site Operator Program partners.
i Sections to provide more specific information concerning the Program participants andtheir overall interests, their programmatic activities, and their experiences with electricvehicles and accompanying problems. Detailed information on electric vehicle activitiesat each Site Operator include operations, maintenance, and electric vehicle tests ofcomponents.
The Site Operator Program has evolved substantially since its inception in 1976. In its originalform, a commercialization effort was intended, but this was not feasible for lack of vehicle suppliersand infrastructure. Nonetheless, with DOE sponsorship and technical participation, a few results(primarily operating experience and data) were forthcoming.
In the early 1980s, DOE emphasis shifted to data collection and interpretation. A mechanismwas set up to support participating sites. However, several problems soon became apparent:
• Too much data was required
• Data collection methods were primitive
• Data quality was suspect
• Database operation was ineffective.
In 1987, DOE transferred the contract for the Program to the INEEL, and the basic premises ofthe Program were refined to emphasize the following efforts:
i Operating and maintenance data collection, analysis, and dissemination
Potomac ElectricPower Co.
York Technical
College
University ofSouth Florida
Texas A&MUniveristy
Kansas StateUniveristy
Platte RiverPower Authority
Orcas Power& Light Co.
Southern CaliforniaEdison
Arizona PublicService Co.
LA Dept. ofWater & Power
U.S. Navy
Pacific Gas& Electric Co.
INEEL
SNL

3
i Public demonstrations to promote general awareness of this developing technology.
Both of these efforts have been fruitful. In particular, practical methods and equipment nowexist for acquiring and handling operating data, with increasingly broad distribution of relevantinformation.
By 1996, the Program comprised over 250 vehicles, of which about 50 were latest generationvehicles. DOE partially funded the participant’s Program expenditures and the INEEL receivedoperating and maintenance data. Program participant efforts reflected varying combinations of day-to-day use, laboratory testing and evaluation, and successful promotion of public awareness bydemonstrations, exhibits, and media dissemination of related activities and information. The SiteOperator Program ended in September 1996, when it was superseded by the Field OperationsProgram.
The utilities have been concerned with infrastructure needs for electric vehicle operation,particularly those required for battery recharging. Several candidate technologies have beeninvestigated and developed for commercial use. In addition, the problems associated with operatingand maintaining an electric vehicle fleet have been scoped and workable solutions devised andimplemented.
The academic institutions and electric utilities have been productive beyond the originalProgram scope in the areas of:
• Charging methods, both curbside and solar
• Electric vehicle performance testing results
• Vehicle operating data acquisition, via mobile data acquisition systems (MDAS)
• Training courses and related materials for maintenance personnel and operators
• Field testing of experimental or prototype vehicles and components.
The INEEL worked closely with Program participants to improve acquisition methods anddata quality. The INEEL also established a central database and arranged for the dissemination of aspectrum of electric vehicle-related information. Through Program reports, INEEL also gained abroad picture of the state of electric vehicle technology and accompanying public awareness.
Some tentative conclusions can be drawn about the state of electric vehicle technology andoperation:
• The industry is evolving as product offerings are becoming more technologicallyadvanced.
• Product prices should decrease and the technology continue to increase as most of themajor automakers have announced product-offering schedules.
• Battery technology is a major limitation in achieving range and vehicle cost goals.
• Conversion of vehicles originally designed for internal combustion engine power canfrequently severely reduce payload capability and the service life of key components.
• Production of useful data may be limited where up-to-date equipment is not available.Some of the operating units monitored by the program are approaching a 20-year servicelife.
4
Several states (notably, California, New York, and Massachusetts) have or are consideringregulatory mandates or voluntary agreements to increase the use of electric vehicles forenvironmental benefit. Their eventual effectiveness depends on establishing a viable electricvehicle manufacturing industry and an adequate infrastructure for vehicle operation and service.
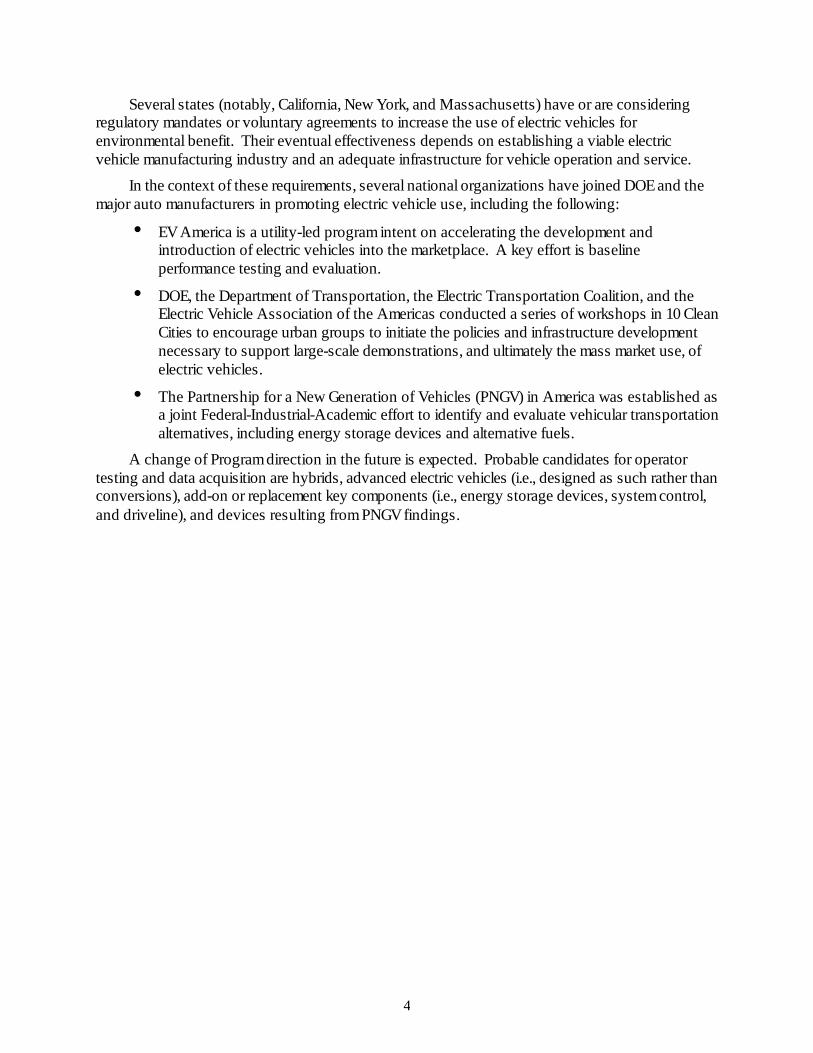
In the contex t of these requirements, several national organizations have joined DOE and themajor auto manufacturers in promoting electric vehicle use, including the following:
i EV America is a utility-led program intent on accelerating the development andintroduction of electric vehicles into the marketplace. A key effort is baselineperformance testing and evaluation.
i DOE, the Department of Transportation, the Electric Transportation Coalition, and theElectric Vehicle Association of the Americas conducted a series of workshops in 10 CleanCities to encourage urban groups to initiate the policies and infrastructure developmentnecessary to support large-scale demonstrations, and ultimately the mass market use, ofelectric vehicles.
i The Partnership for a New Generation of Vehicles (PNGV) in America was established asa joint Federal-Industrial-Academic effort to identify and evaluate vehicular transportationalternatives, including energy storage devices and alternative fuels.
A change of Program direction in the future is expected. Probable candidates for operatortesting and data acquisition are hybrids, advanced electric vehicles (i.e., designed as such rather thanconversions), add-on or replacement key components (i.e., energy storage devices, system control,and driveline), and devices resulting from PNGV findings.
5
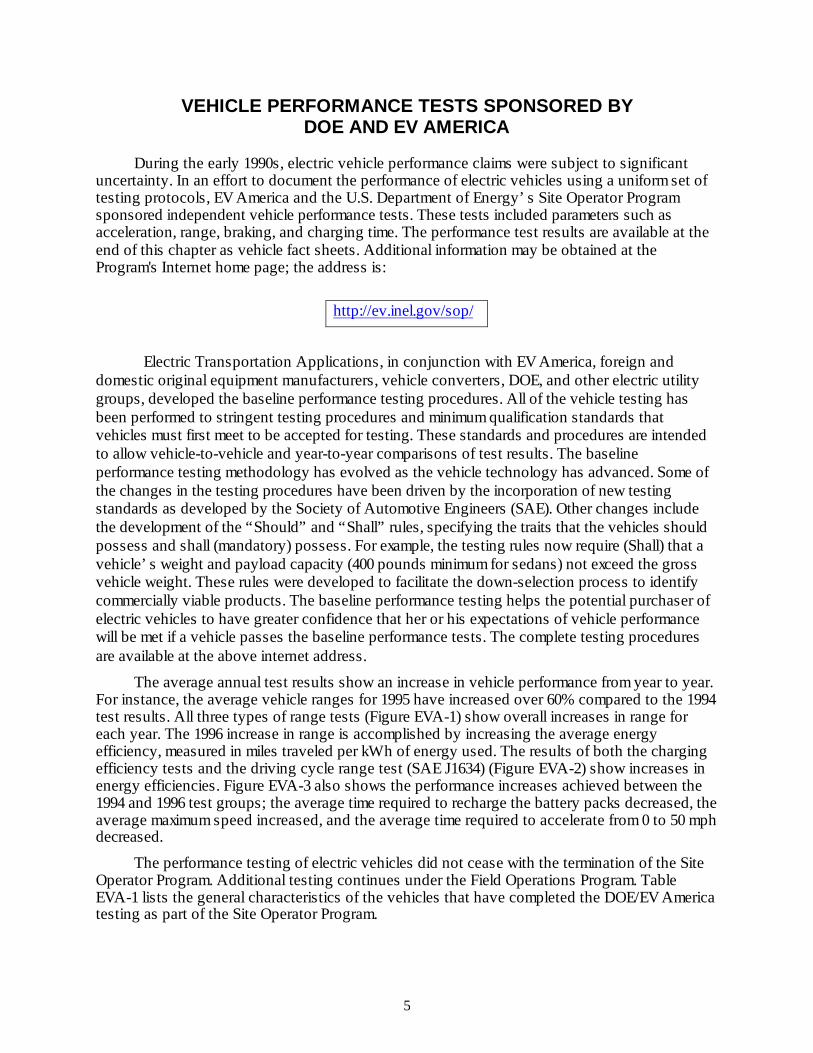
VEHICLE PERFORMANCE TESTS SPONSORED BYDOE AND EV AMERICA
During the early 1990s, electric vehicle performance claims were subject to significantuncertainty. In an effort to document the performance of electric vehicles using a uniform set oftesting protocols, EV America and the U.S. Department of Energy’s Site Operator Programsponsored independent vehicle performance tests. These tests included parameters such asacceleration, range, braking, and charging time. The performance test results are available at theend of this chapter as vehicle fact sheets. Additional information may be obtained at theProgram's Internet home page; the address is:
http://ev.inel.gov/sop/
Electric Transportation Applications, in conjunction with EV America, foreign anddomestic original equipment manufacturers, vehicle converters, DOE, and other electric utilitygroups, developed the baseline performance testing procedures. All of the vehicle testing hasbeen performed to stringent testing procedures and minimum qualification standards thatvehicles must first meet to be accepted for testing. These standards and procedures are intendedto allow vehicle-to-vehicle and year-to-year comparisons of test results. The baselineperformance testing methodology has evolved as the vehicle technology has advanced. Some ofthe changes in the testing procedures have been driven by the incorporation of new testingstandards as developed by the Society of Automotive Engineers (SAE). Other changes includethe development of the “Should” and “Shall” rules, specifying the traits that the vehicles shouldpossess and shall (mandatory) possess. For example, the testing rules now require (Shall) that avehicle’s weight and payload capacity (400 pounds minimum for sedans) not exceed the grossvehicle weight. These rules were developed to facilitate the down-selection process to identifycommercially viable products. The baseline performance testing helps the potential purchaser ofelectric vehicles to have greater confidence that her or his expectations of vehicle performancewill be met if a vehicle passes the baseline performance tests. The complete testing proceduresare available at the above internet address.
The average annual test results show an increase in vehicle performance from year to year.For instance, the average vehicle ranges for 1995 have increased over 60% compared to the 1994test results. All three types of range tests (Figure EVA-1) show overall increases in range foreach year. The 1996 increase in range is accomplished by increasing the average energyefficiency, measured in miles traveled per kWh of energy used. The results of both the chargingefficiency tests and the driving cycle range test (SAE J1634) (Figure EVA-2) show increases inenergy efficiencies. Figure EVA-3 also shows the performance increases achieved between the1994 and 1996 test groups; the average time required to recharge the battery packs decreased, theaverage maximum speed increased, and the average time required to accelerate from 0 to 50 mphdecreased.
The performance testing of electric vehicles did not cease with the termination of the SiteOperator Program. Additional testing continues under the Field Operations Program. TableEVA-1 lists the general characteristics of the vehicles that have completed the DOE/EV Americatesting as part of the Site Operator Program.

6
Table EVA-1.
Manufacturer Model Type Battery Battery type
Tested 1996
General Motors 1997 EV1 Sport coupe Delphi Lead-acid
Toyota 1996 RAV4 Sport utilityvehicle
Matsushita Lead-acid
Tested 1995
Solectria 1995 Force Sedan G M Ovonic Nickel-metalhydride
Solectria 1994 E10 Pickup Hawker Lead-acid
Baker 1994 EV100 Pickup G M Ovonic Nickel-metalhydride
Tested 1994
BAT International 1994 Metro Sedan Optima Lead-acid
BAT International 1994 Metro Sedan Trojan Lead-acid
BAT International 1994 Pickup Pickup Trojan Lead-acid
Dodge 1994 Caravan Van Eagle-Picher Nickel Iron
Solectria 1994 Force Sedan HawkerEnergy
Lead-acid
Solectria 1994 E10 Pickup HawkerEnergy
Lead-acid
Unique Mobility 1994 Pickup Pickup Optima Lead-acid
U.S. Electricar 1994 Sedan Sedan HawkerEnergy
Lead-acid
U.S. Electricar 1994 Pickup HawkerEnergy
Lead-acid

7
Figure EVA-1. EV America range test results (in miles) for constant-speed tests at 45 and 60mph and range test results for the SAE J1634 driving cycle test. The plotted results are theaverage test results for all vehicles tested during each respective year.
Figure EVA-2. EV America energy efficiency results for the charging efficiency test and theSAE J1634 driving cycle test. The plotted results are the average test results for all vehiclestested during each respective year. The charging efficiency test was not performed on the 1994tested vehicles.
05
101520253035404550556065707580859095
100105110115
1994 1995 1996
Mile
s
Range @ 45 mph
Range @ 60 mph
Driving Cycle Range
0
0.5
1
1.5
2
2.5
3
3.5
4
4.5
5
5.5
1994 1995 1996
Charging Efficiency (miles/AC kWh)
Driving Cycle Efficiency (miles/kWh)

8
Figure EVA-3. EV America test results for acceleration in seconds and maximum speed in mphat 50% state of charge (SOC), and recharge time in hours. The plotted results are the average testresults for all vehicles tested during each respective year.
Test Results Reported on Vehicle Fact SheetsThe following fact sheets summarize the test results for each vehicle in the Site Operator
Program. Results in regular type indicate the results met the performance standards. Results inbold type indicate the vehicle did not meet the standard for that performance category.
05
10152025303540455055606570758085
1994 1995 1996
0-50 mph @ 50% SOC (sec.)
Max speed @ 50% SOC (mph)
Recharge time (hours)

9
EVAMERICA USDOE PERFORMANCE STATISTICSACCELERATION 0-50 mphAt 100% SOC: 6.3 secAt 50% SOC: 6.7 secMax. Power: 116.4 kWPerformance Goal: 13.5 sec at 50% SOC
MAXIMUM SPEED @ 50% SOCAt 1/4 Mile: 78.9 mphAt 1 Mile: 80.4 mphPerformance Goal: 70 mph in one mile
CONSTANT SPEED RANGE @ 45 mphRange: 135.2 milesEnergy Used: 15.58 kWhAverage Power: 5.19 kWEfficiency: 115 Wh/mileSpecific Energy: 31.9 Wh/kg
GENERAL MOTORS EV1VEHICLE SPECIFICATIONS
PURPOSE-BUILT VEHICLEBase Vehicle: 1997 EV1VIN: 4g5px2250t0100009Seatbelt Positions: TwoStandard Features:
Heat Pump Climate Control SystemCruise ControlPower Door Locks, Power WindowsPower SteeringDual Air BagsFront Disc BrakesAnti-Lock BrakesFront Wheel DriveRegenerative BrakingDaytime Running LightsAM/FM Stereo w/Cassette and CDPlayer w/4 Speaker SystemElectiClear WindshieldCheck Tire Pressure SystemHigh Voltage Isolation AssuranceWelded & Bonded Aluminum AlloyBodyElectronic Key Pad Entry/VehicleActivation System110V 1.2 kW Convenience Charger
BATTERYManufacturer: DelphiType: Valve Regulated Lead-acidNumber of Modules: 26Weight of Module: 18.8 kgWeight of Pack(s): 1175 kg
BATTERYPack Locations: T-Pack IntegralNominal Module Voltage: 12 VNominal System Voltage: 312 VNominal Capacity (1C): 53 AhWEIGHTSDesign Curb Weight: 2970 lbDelivered Curb Weight: 2922 lbDistribution F/R: 53/47 %GVWR: 3410 lbGAWR F/R: 1705/1705 lbPayload: 440 lbPerformance Goal: 400 lbDIMENSIONSWheelbase: 98.9 inchesTrack F/R: 57.9/49.0 inchesLength: 169.7 inchesWidth: 69.5 inchesHeight: 50.5 inchesGround Clearance: 4.2 inches at GVWRPerformance Goal: 5.0 inches at GVWRCHARGERLocation: Off-BoardType: Delco Electronics Inductive 6.6 kWInput Voltages: 156 to 260 VACTIRESTire Mfg: MichelinTire Model: Proxima RR RadialTire Size: P175/65R14Tire Pressure F/R: 50/50 psiSpare Installed: No; Self-Sealing Tires
CONSTANT SPEED RANGE @ 60 mphRange: 89.1 milesEnergy Used: 14.58 kWhAverage Power: 9.79 kWEfficiency: 164 Wh/mileSpecific Energy: 29.8 Wh/kgDRIVING CYCLE RANGERange per SAE J1634: 78.2 milesEnergy Used: 12.84 kWhAverage Power: 4.06 kWEfficiency: 164 Wh/mileSpecific Energy: 26.3 Wh/kgPerformance Goal: 60 milesBRAKING FROM 60 mphControlled Dry: 171.0 ftControlled Wet: 214.8 ftPanic Wet: 211.9 ftCourse Deviation: 0.0 ftHANDLINGAvg Time @ 90% SOC: 55.8 secAvg Time @ 50% SOC: 55.4 secAvg Time @ 20% SOC: 55.4 secAvg ICE Full Size Time: 54.62 secGRADEABILITY (Calculated)Maximum Speed @ 3%: 79.0 mphMaximum Speed @ 6%: 78.2 mphMaximum Grade: 53.2%Time on 3% Grade: 28 min 57 secPerformance Goal: 15 MinCHARGING EFFICIENCYEfficiency: 248 Wh-AC/mileEnergy Cost @ 10 ¢/kWh: 2.48 ¢/mile
TEST NOTES:
1. At various times during these range tests, the Battery Life, Reduced Performance,Service Soon, and Service Now telltales illuminated.
2. Charging time was extended due to high temperature conditions.3. Specific Energy values were calculated using the number of modules times the
module weight.4. The battery pack data collection voltage signal was reduced 100:1 through a voltage
divider installed by General Motors. This was for personnel protection.5. The Standing Water Test was conducted with a water depth of six inches versus
eight inches.This vehicle meets all EV America Minimum Requirements listed on back
Values in bold indicate the Performance Goal was not met. * All Power and Energyvalues are DC unless otherwise specified.
CHARGERMax Charger Ground Current: <0.01 mAMax Battery Leakage Current: <0.01 mAMax DC Charge Current: 16.83 AmpsMax AC Charge Current: 28.96 AmpsPwr Factor @ Max Current: 1.00THD(V)/(I) @ Max Current: 2.78/4.80 %Peak Demand: 5.93 kWTime to Recharge: 5 Hrs 18 minPerformance Goal: 8 hours
©1996 Electric Transportation Applications All Rights Reserved

10
TOYOTA RAV4 EVVEHICLE SPECIFICATIONS
PERFORMANCE STATISTICS
ACCELERATION 0-50 mphAt 100% SOC: 13.15 secAt 50% SOC: 13.3 secMax. Power: 58.6 kWPerformance Goal: 13.5 sec at 50% SOC
MAXIMUM SPEED @ 50% SOCAt 1/4 Mile: 64.6 mphAt 1 Mile: 77.9 mphPerformance Goal: 70 mph in one mile
CONSTANT SPEED RANGE @ 45 mphRange: 81.7 milesEnergy Used: 16.21 kWhAverage Power: 9.01 kWEfficiency: 198 Wh/mileSpecific Energy: 32.2 Wh/kg
CONVERTED VEHICLEBase Vehicle: 1996 Toyota RAV4VIN:327T0220000000000Seatbelt Positions: Four
Standard Features:Air Conditioning (Heat Pump)Heating (Heat Pump)Front Wheel DrivePower SteeringPower BrakesFront Disk BrakesRegenerative BrakingDrivers Side Air BagAM/FM Stereo Radio
BATTERYManufacturer: Matsushita BatteryType: Valve Regulated Lead-acidNumber of Modules: 24Weight of Module: 21 kgWeight of Pack(s): 550 kgPack Locations: UnderbodyNominal Module Voltage: 12 VNominal System Voltage: 288 VNominal Capacity (1C): 55 A/H
WEIGHTSDesign Curb Weight: 3329 lbDelivered Curb Weight: 3364 lbDistribution F/R: 48/52 %GVWR: 3990 lbGAWR F/R: 1929/2061 lbPayload: 626 lbPerformance Goal: 600 lb
DIMENSIONSWheelbase: 86.4 inchesTrack F/R: 57.6/56.7 inchesLength: 146.6 inchesWidth: 67.2 inchesHeight: 62.5 inchesGround Clearance: 4.1 inches at GVWR
Performance Goal: 5.0 inches at GVWR
CHARGERLocation: On-boardType: High Frequency Resonant ConverterInput Voltages: 90-264 VAC
TIRESTire Mfg: YokohamaTire Model: AVS E100 RadialTire Size: 195/80R16Tire Pressure F/R: 44/44 psiSpare Installed: Yes
CONSTANT SPEED RANGE @ 60 mphRange: 54.7 milesEnergy Used: 15.82 kWhAverage Power: 17.16 kWEfficiency: 289 Wh/mileSpecific Energy: 31.4 Wh/kg
DRIVING CYCLE RANGERange per SAE J1634: 68.2 milesEnergy Used: 16.05 kWhAverage Power: 6.44 kWEfficiency: 235 Wh/mileSpecific Energy: 31.8 Wh/kgPerformance Goal: 60 miles
BRAKING FROM 60 mphControlled Dry: 140.1 ftControlled Wet: 196.3 ftPanic Wet: 260.1 ftCourse Deviation: 3 ft
HANDLINGAvg Time @ 90% SOC: 56.67 secAvg Time @ 50% SOC: 55.68 secAvg Time @ 20% SOC: 55.08 secAvg Dodge Neon Time: 54.62 sec
GRADEABILITY (Calculated)Maximum Speed @ 3%: 75.6 mphMaximum Speed @ 6%: 69.3 mphMaximum Grade: 29.1%
TEST NOTES:
1. The Battery Leakage Current measured during the 8-in. standing water test exceededthe Maximum Allowable under EV America Technical Specifications (1.24 mA vs.1.0 mA required).
2. Contrary to the requirements of EV America Technical Specification 8.1, the chargerdoes not cycle to maintain the battery in a fully charged condition.
3. Contrary to the requirements of EV America Technical Specification 8.1, The batterycharger will not initiate a full algorithm charge unless the battery SOC is =< 90 %.
4. The vehicle provided to EV America was a Prototype. Some information was notprovided and/or not available from Toyota. The specifics are noted in theManufacturer's Proposal Review Checklist in the Test Report.
5. Specific Energy calculations were completed using the aggregate weight of the batterymodules only.
6. The auxiliary battery was replaced due to an apparent internal fault.7. This vehicle did not have FMVSS Certification at the time of testing.
Values in bold indicate the Performance Goal was not met. All Power and Energy values are DC unless otherwise specified.
Time on 3% Grade: 28 min 24 secPerformance Goal: 15 Min
CHARGING EFFICIENCYEfficiency: 412 Wh-AC/mileEnergy Cost @ 10¢/kWh: 4.12 ¢/mile
CHARGERMax Charger Ground Current: <0.01 mAMax Battery Leakage Current: 1.24 mAMax DC Charge Current: 13.48 AmpsMax AC Charge Current: 24.01 AmpsPwr Factor @ Max Current: 1.00THD(V)(I) @ Max Current: 4.51/4.73%Peak Demand: 4.15 kWTime to Recharge: 8 Hrs 29 minPerformance Goal: 8 hours
©1996 Electric Transportation Applications All Rights Reserved
11
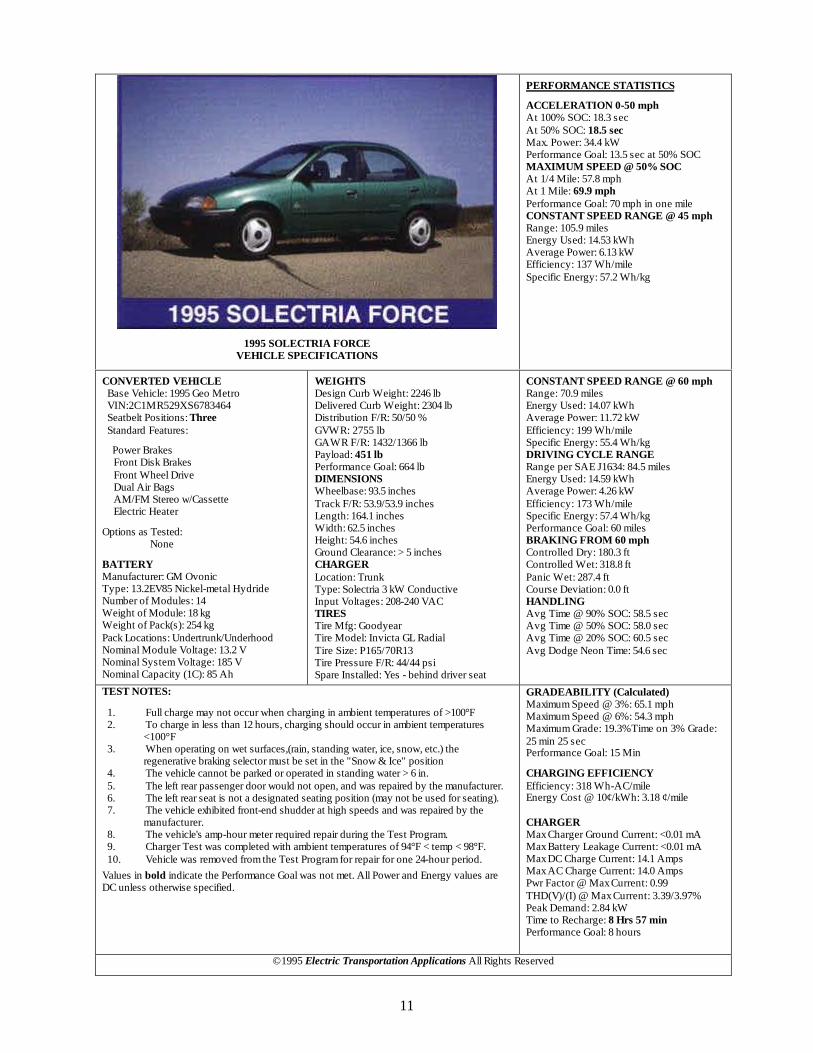
1995 SOLECTRIA FORCEVEHICLE SPECIFICATIONS
PERFORMANCE STATISTICS
ACCELERATION 0-50 mphAt 100% SOC: 18.3 secAt 50% SOC: 18.5 secMax. Power: 34.4 kWPerformance Goal: 13.5 sec at 50% SOCMAXIMUM SPEED @ 50% SOCAt 1/4 Mile: 57.8 mphAt 1 Mile: 69.9 mphPerformance Goal: 70 mph in one mileCONSTANT SPEED RANGE @ 45 mphRange: 105.9 milesEnergy Used: 14.53 kWhAverage Power: 6.13 kWEfficiency: 137 Wh/mileSpecific Energy: 57.2 Wh/kg
CONVERTED VEHICLEBase Vehicle: 1995 Geo MetroVIN:2C1MR529XS6783464Seatbelt Positions: ThreeStandard Features:
Power BrakesFront Disk BrakesFront Wheel DriveDual Air BagsAM/FM Stereo w/CassetteElectric Heater
Options as Tested:None
BATTERYManufacturer: GM OvonicType: 13.2EV85 Nickel-metal HydrideNumber of Modules: 14Weight of Module: 18 kgWeight of Pack(s): 254 kgPack Locations: Undertrunk/UnderhoodNominal Module Voltage: 13.2 VNominal System Voltage: 185 VNominal Capacity (1C): 85 Ah
WEIGHTSDesign Curb Weight: 2246 lbDelivered Curb Weight: 2304 lbDistribution F/R: 50/50 %GVWR: 2755 lbGAWR F/R: 1432/1366 lbPayload: 451 lbPerformance Goal: 664 lbDIMENSIONSWheelbase: 93.5 inchesTrack F/R: 53.9/53.9 inchesLength: 164.1 inchesWidth: 62.5 inchesHeight: 54.6 inchesGround Clearance: > 5 inchesCHARGERLocation: TrunkType: Solectria 3 kW ConductiveInput Voltages: 208-240 VACTIRESTire Mfg: GoodyearTire Model: Invicta GL RadialTire Size: P165/70R13Tire Pressure F/R: 44/44 psiSpare Installed: Yes - behind driver seat
CONSTANT SPEED RANGE @ 60 mphRange: 70.9 milesEnergy Used: 14.07 kWhAverage Power: 11.72 kWEfficiency: 199 Wh/mileSpecific Energy: 55.4 Wh/kgDRIVING CYCLE RANGERange per SAE J1634: 84.5 milesEnergy Used: 14.59 kWhAverage Power: 4.26 kWEfficiency: 173 Wh/mileSpecific Energy: 57.4 Wh/kgPerformance Goal: 60 milesBRAKING FROM 60 mphControlled Dry: 180.3 ftControlled Wet: 318.8 ftPanic Wet: 287.4 ftCourse Deviation: 0.0 ftHANDLINGAvg Time @ 90% SOC: 58.5 secAvg Time @ 50% SOC: 58.0 secAvg Time @ 20% SOC: 60.5 secAvg Dodge Neon Time: 54.6 sec
TEST NOTES:
1. Full charge may not occur when charging in ambient temperatures of >100°F2. To charge in less than 12 hours, charging should occur in ambient temperatures
<100°F3. When operating on wet surfaces,(rain, standing water, ice, snow, etc.) the
regenerative braking selector must be set in the "Snow & Ice" position4. The vehicle cannot be parked or operated in standing water > 6 in.5. The left rear passenger door would not open, and was repaired by the manufacturer.6. The left rear seat is not a designated seating position (may not be used for seating).7. The vehicle exhibited front-end shudder at high speeds and was repaired by the
manufacturer.8. The vehicle's amp-hour meter required repair during the Test Program.9. Charger Test was completed with ambient temperatures of 94°F < temp < 98°F.10. Vehicle was removed from the Test Program for repair for one 24-hour period.
Values in bold indicate the Performance Goal was not met. All Power and Energy values areDC unless otherwise specified.
GRADEABILITY (Calculated)Maximum Speed @ 3%: 65.1 mphMaximum Speed @ 6%: 54.3 mphMaximum Grade: 19.3%Time on 3% Grade:25 min 25 secPerformance Goal: 15 Min
CHARGING EFFICIENCYEfficiency: 318 Wh-AC/mileEnergy Cost @ 10¢/kWh: 3.18 ¢/mile
CHARGERMax Charger Ground Current: <0.01 mAMax Battery Leakage Current: <0.01 mAMax DC Charge Current: 14.1 AmpsMax AC Charge Current: 14.0 AmpsPwr Factor @ Max Current: 0.99THD(V)/(I) @ Max Current: 3.39/3.97%Peak Demand: 2.84 kWTime to Recharge: 8 Hrs 57 minPerformance Goal: 8 hours
©1995 Electric Transportation Applications All Rights Reserved

12
1995 SOLECTRIA E10VEHICLE SPECIFICATIONS
PERFORMANCE STATISTICS
ACCELERATION 0-50 mphAt 100% SOC: 14.8 secAt 50% SOC: 17.4 secMax. Power: 71.6 kWPerformance Goal: 13.5 sec at 50% SOC
MAXIMUM SPEED @ 50% SOCAt 1/4 Mile: 55.4 mphAt 1 Mile: 67.9 mphPerformance Goal: 70 mph in one mile
CONSTANT SPEED RANGE @ 45 mphRange: 80.8 milesEnergy Used: 18.49 kWhAverage Power: 9.99 kWEfficiency: 229 Wh/mileSpecific Energy: 32.3 Wh/kg
CONVERTED VEHICLEBase Vehicle: 1995 Chevrolet S-10 PickupVIN:1GCCS144XSK175700Seatbelt Positions: Two
Standard Features:Power SteeringPower BrakesFront Disk BrakesRear Anti-Lock BrakesDriver Side Air BagsAM/FM Stereo Radio w/CassetteElectric Heater
Options as Tested:None
BATTERYManufacturer: HawkerType: G12V38Ah10C Sealed Lead-acidNumber of Modules: 36Weight of Module: 16 kgWeight of Pack(s): 573 kgPack Locations: Underhood/UnderbedNominal Module Voltage: 12 VNominal System Voltage: 144 VNominal Capacity (1C): 30 Ah
WEIGHTSDesign Curb Weight: 3790 lbDelivered Curb Weight: 3959 lbDistribution F/R: 48/52 %GVWR: 4600 lbGAWR F/R: 2500/2700 lbPayload: 641 lbPerformance Goal: 632 lb
DIMENSIONSWheelbase: 110.0 inchesTrack F/R: 54.6/54.6 inchesLength: 188.7 inchesWidth: 68.0 inchesHeight: 61.8 inchesGround Clearance: 4.7 inches
CHARGERLocation: UnderhoodType: Solectria 3 kW ConductiveInput Voltages: 208-240 VAC
TIRESTire Mfg: GoodyearTire Model: Invicta GS RadialTire Size: P215/70R15Tire Pressure F/R: 44/44 psiSpare Installed: No
CONSTANT SPEED RANGE @ 60 mphRange: 49.9 milesEnergy Used: 15.59 kWhAverage Power: 17.85 kWEfficiency: 312 Wh/mileSpecific Energy: 27.2 Wh/kg
DRIVING CYCLE RANGERange per SAE J1634: 55.1 milesEnergy Used: 15.59 kWhAverage Power: 6.87 kWEfficiency: 283 Wh/mileSpecific Energy: 27.3 Wh/kgPerformance Goal: 60 miles
BRAKING FROM 60 mphControlled Dry: 184.2 ftControlled Wet: 259.4 ftPanic Wet: 316.0 ftCourse Deviation: 1.0 ft
HANDLINGAvg Time @ 90% SOC: 56.1 secAvg Time @ 50% SOC: 56.8 secAvg Time @ 20% SOC: 58.7 secAvg ICE S-10 Time: 58.3 sec
TEST NOTES:
1. The charge algorithm was modified twice during the Test Program.2. The amp-hour meter showed continuous discharge, even when vehicle was charging.3. During the "55 mph at 3% Grade Test," the vehicle stopped with no apparent cause.4. Full charge may not occur when charging at ambient temperatures of >100°F.5. To charge in less than 12 hours, charging should occur in ambient temperatures
<100°F.6. Vehicle was removed from the Test Program for repair for three 24-hour periods.7. The Charger Test was completed with ambient temperatures of 82°F < temp < 90°F.8. The vehicle charger tripped the GFI feeder breaker routinely during the Test Program.
Values in bold indicate the Performance Goal was not met. All Power and Energy values areDC unless otherwise specified.
GRADEABILITY (Calculated)Maximum Speed @ 3%: 59.4 mphMaximum Speed @ 6%: 48.5 mphMaximum Grade: 28.2%Time on 3% Grade: 12 min 47 secPerformance Goal: 15 Min
CHARGING EFFICIENCYEfficiency: 317 Wh-AC/mileEnergy Cost @ 10 ¢/kWh: 3.17 ¢/mile
CHARGERMax Charger Ground Current: <0.01 mAMax Battery Leakage Current: <0.01 mAMax DC Charge Current: 21.0 AmpsMax AC Charge Current: 14.5 AmpsPwr Factor @ Max Current: 0.99THD(V)/(I) @ Max Current: 4.23/4.05 %Peak Demand: 2.92 kWTime to Recharge: 11 Hrs 11 minPerformance Goal: 8 hours
©1995 Electric Transportation Applications All Rights Reserved

13
1994 BAKER EV100 ELECTRIC PICKUPVEHICLE SPECIFICATIONS
PERFORMANCE STATISTICS
ACCELERATION 0-50 mphAt 100% SOC: 12.9 secAt 50% SOC: 14.9 secMax. Power: 102.2 kWPerformance Goal: 13.5 sec at 50% SOCMAXIMUM SPEED @ 50% SOCAt 1/4 Mile: 59.8 mphAt 1 Mile: 71.1 mphPerformance Goal: 70 mph in one mileCONSTANT SPEED RANGE @ 45 mphRange: 61.2 milesEnergy Used: 21.40 kWhAverage Power: 15.33 kWEfficiency: 350 Wh/mileSpecific Energy: 47.6 Wh/kg
CONVERTED VEHICLEBase Vehicle: 1994 GMC Full Size PickupVIN: 1GTFC24Z6RZ562287Seatbelt Positions: Three
Standard Features:Power SteeringPower BrakesFront Disk BrakesRear Anti-Lock BrakesDriver Side Air BagAM/FM Stereo RadioDiesel Fuel Fired Heater
Options as Tested:Air Conditioning
BATTERYManufacturer: GM OvonicType: 13EV85 Nickel-metal HydrideNumber of Modules: 25Weight of Module: 18 kgWeight of Pack(s): 450 kgPack Locations: Cargo BedNominal Module Voltage: 13.2 VNominal System Voltage: 330 VNominal Capacity (1C): 85 Ah
WEIGHTSDesign Curb Weight: 5132 lbDelivered Curb Weight: 5481 lbDistribution F/R: 50/50 %GVWR: 7200 lbGAWR F/R: 3150/4670 lbPayload: 1719 lbPerformance Goal: 632 lb
DIMENSIONSWheelbase: 131.5 inchesTrack F/R: 62.8/64.0 inchesLength: 218.4 inchesWidth: 77.1 inchesHeight: 69.1 inchesGround Clearance: >5 inches
CHARGERLocation: Off-BoardType: Hughes 6.6kW InductiveInput Voltages: 165 to 260 VAC
TIRESTire Mfg: GeneralTire Model: Amber 550 AS RadialTire Size: P225/75R16Tire Pressure F/R: 40/65 psiSpare Installed: No
CONSTANT SPEED RANGE @ 60 mphRange: 31.5 milesEnergy Used: 15.36 kWhAverage Power: 25.78 kWEfficiency: 487.6 Wh/mileSpecific Energy: 34.1 Wh/kg
DRIVING CYCLE RANGERange per SAE J1634: 56.6 milesEnergy Used: 25.67 kWhAverage Power: 11.32 kWEfficiency: 453.5 Wh/mileSpecific Energy: 57.0 Wh/kgPerformance Goal: 60 miles
BRAKING FROM 60 mphControlled Dry: 199.9 ftControlled Wet: 238.5 ftPanic Wet: 281.2 ftCourse Deviation: 2.5 ft
HANDLINGAvg Time @ 90% SOC: 59.9 secAvg Time @ 50% SOC: 60.4 secAvg Time @ 20% SOC: 60.9 secAvg ICE Full Size Time: 58.3 sec
GRADEABILITY (Calculated)Maximum Speed @ 3%: 67.1 mphMaximum Speed @ 6%: 56.8 mphMaximum Grade: 31.5%Time on 3% Grade: 26 min 36 secPerformance Goal: 15 Min
TEST NOTES:
1. Vehicle was delivered with a non-functional amp-hour meter. It remained non-functioning throughout the Test Program.
2. The charge algorithm was modified after the 45 mph and 60 mph range tests.3. The Start-Up Sequence allows the vehicle to be operated without functioning
power steering and power assisted brakes.4. The "Limit Light" warning light did not provide useful information to the driver
due to multiple inputs.5. Oil leaks on the drive motor were repaired.6. The Battery Pack Management (BPM) switch required repair.7. Vehicle was removed from the Test Program for repair for one 24-hour period.Values in bold indicate the Performance Goal was not met.All Power and Energy values are DC unless otherwise specified.
CHARGING EFFICIENCYEfficiency: 715 Wh-AC/mileEnergy Cost @ 10 ¢/kWh: 7.15 ¢/mileCHARGERMax Charger Ground Current: <0.01 mAMax Battery Leakage Current: 0.31 mAMax DC Charge Current: 16.33 AmpsMax AC Charge Current: 30.65 AmpsPwr Factor @ Max Current: 1.00THD(V)/(I) @ Max Current: 3.40/4.47 %Peak Demand: 6.53 kWTime to Recharge: 7 Hrs 50 minPerformance Goal: 8 hours
©1995 Electric Transportation Applications All Rights Reserved

14
VEHICLE SPECIFICATIONS
PERFORMANCE STATISTICS
ACCELERATION AT 90% SOC *
Zero to 30 mph: 7.1 secZero to 40 mph: 11.5 secZero to 50 mph: 17.0 secZero to 60 mph: 23.8 secPerformance Goal: 13.5 seconds; 0 to 60 mphACCELERATION AT 50% SOC *
Zero to 30 mph: 6.6 secZero to 40 mph: 10.9 secZero to 50 mph: 16.5 secZero to 60 mph: 23.0 secPerformance Goal: 13.5 seconds; 0 to 60 mphMAXIMUM SPEEDAt 50% SOC: 81 mphPerformance Goal: 70 mph
VEHICLE TYPEConversion Of: Geo MetroVIN: 2C1MR24G5R6799793Seating Capacity: 2 AdultsFeatures: Heater, Front Wheel Drive, FrontDisk Brakes
DIMENSIONSWheelbase: 88.9 inchesTrack F/R: 55/54 inchesLength: 147.5 inchesWidth: 62.4 inchesHeight: 52.4 inchesGround Clearance: >50 mmCargo Space: Battery Pack DisplacesRear Seat and original equipmentmanufacturer (OEM) Cargo Well.
WEIGHTCurb Weight: 2719 lbTest Weight: 2719 lbDistribution F/R: 43/57 %Conversion GVWR: 3040 lbOEM GVWR: 2447 lbPayload: 321 lb
WHEELS & TIRESWheel Size: 13 inchTire Mfg: Goodyear InvictaTire Size: P175/70R13Tire Pressure F/R: 44/44 psiSpare Installed: No
DRIVE SYSTEMDrive Type: Brush DCMotor Mfg: Advanced DC
DRIVE SYSTEM Controller Mfg: Curtis PMCTransmission: 3 Speed AutomaticBATTERYManufacturer: OptimaType: Prototype Deep CycleNumber of Modules: 22Total Traction Voltage: 132 VoltsBattery Pack Weight: 858 lbLocations In Vehicle: Rear Seat & Trunk
CHARGERLocation: Off-BoardInput Voltage(s): N/AInput Current(s): N/A
INTERLOCKSKey Removable When Off Only: YesKey Off In Park Only: YesStart In Park Only: YesStart Blocked By Accelerator: NoStart Blocked On Charge: No
REQUIREMENTSManual Disconnect Present & Operational:NoBatteries Sealed or Valve Regulated: YesCharger Automatic Control: NoSOC Indicator: YesBattery Voltage Indicator: NoBattery Current Indicator: YesRegenerative Current Indicator: N/RTransmission Single Speed: YesTransmission Parking Pawl: YesNo Open Access to High Voltage: NoAll High Voltage Clearly Marked: NoControl Efforts Similar To OEM: Yes
CONSTANT SPEED RANGE45 mph Distance: 47.1 miles45 mph Energy Used: 11.3 kWh45 mph Efficiency: 0.240 kWh/mile45 mph Specific Energy: 0.0132 kWh/lb60 mph Distance: 39.6 miles60 mph Energy Used: 7.1 kWh60 mph Efficiency: 0.180 kWh/mile60 mph Specific Energy: 0.0083 kWh/lb
DRIVING CYCLE RANGE77°F Distance: 37.9 miles77°F Energy Used: 13.24 kWh77°F Efficiency: 0.349 kWh/mile77°F Specific Energy: 0.0154 kWh/lb19°F Distance: 27.6 miles19°F Energy Used: 10.13 kWh19°F Efficiency: 0.367 kWh/mile19°F Specific Energy: 0.0118 kWh/lb
Performance Goal: 60 miles
GRADEABILITY*
Maximum Grade: 32%Performance Goal: 25%Speed At 3% Grade: >70 mphPerformance Goal: 55 mphSpeed At 6% Grade: 57 mphPerformance Goal: 45 mph
HANDLING COURSEAvg Time @ 90% SOC: 60.3 secAvg Time @ 50% SOC: 59.5 secAvg Time @ 20% SOC: 58.4 secAvg Dodge Neon (ICE) Time: 54.62 secAverage Chevrolet S-10 Time: 58.29 sec
BRAKING STABILITYControllability: No Stability ProblemsDistance Dry/Wet: 208.8/323.6 ft
TEST EXCEPTIONSPrototype batteriesPayload 379 lb less than requiredNo onboard chargerTest weight greater than OEM GVWROEM GVWR re-rated (not certified) byconverterRequired battery module replacementTesting delayed by high battery temperatureOffboard charger fuse failure
Test Date: October 1994Notes: Bold - Results did not meet EVAmerica Performance Goal
* - Tested at gross vehicle weightN/R - No regenerative braking
CHARGERGround Current During Charge: 8 mABattery Leakage Current: 0.01 mACharger Efficiency: N/AAverage Power Factor: N/APerformance Goal: 0.95Average THD: N/APerformance Goal: 5%Time From 80% DOD: N/APerformance Goal: <8 hours
EV America
15
VEHICLE SPECIFICATIONS
PERFORMANCE STATISTICS
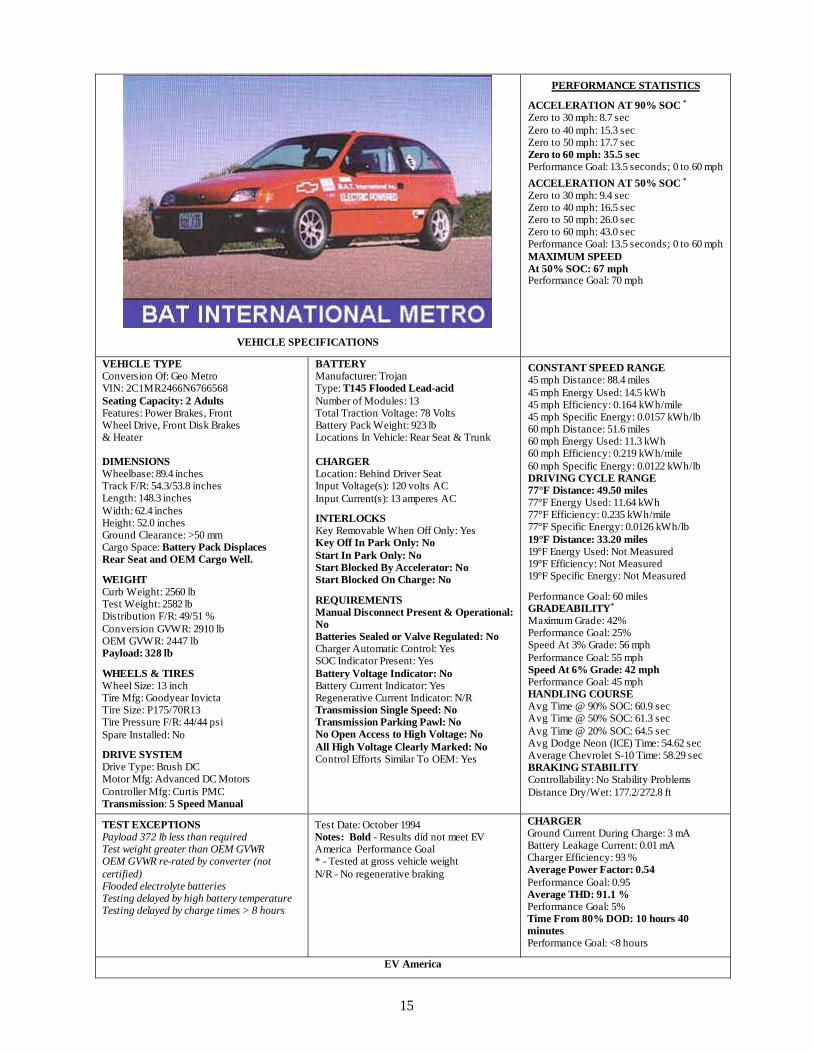
ACCELERATION AT 90% SOC *
Zero to 30 mph: 8.7 secZero to 40 mph: 15.3 secZero to 50 mph: 17.7 secZero to 60 mph: 35.5 secPerformance Goal: 13.5 seconds; 0 to 60 mphACCELERATION AT 50% SOC *
Zero to 30 mph: 9.4 secZero to 40 mph: 16.5 secZero to 50 mph: 26.0 secZero to 60 mph: 43.0 secPerformance Goal: 13.5 seconds; 0 to 60 mphMAXIMUM SPEEDAt 50% SOC: 67 mphPerformance Goal: 70 mph
VEHICLE TYPEConversion Of: Geo MetroVIN: 2C1MR2466N6766568Seating Capacity: 2 AdultsFeatures: Power Brakes, FrontWheel Drive, Front Disk Brakes& Heater
DIMENSIONSWheelbase: 89.4 inchesTrack F/R: 54.3/53.8 inchesLength: 148.3 inchesWidth: 62.4 inchesHeight: 52.0 inchesGround Clearance: >50 mmCargo Space: Battery Pack DisplacesRear Seat and OEM Cargo Well.
WEIGHTCurb Weight: 2560 lbTest Weight: 2582 lbDistribution F/R: 49/51 %Conversion GVWR: 2910 lbOEM GVWR: 2447 lbPayload: 328 lb
WHEELS & TIRESWheel Size: 13 inchTire Mfg: Goodyear InvictaTire Size: P175/70R13Tire Pressure F/R: 44/44 psiSpare Installed: No
DRIVE SYSTEMDrive Type: Brush DCMotor Mfg: Advanced DC MotorsController Mfg: Curtis PMCTransmission: 5 Speed Manual
BATTERYManufacturer: TrojanType: T145 Flooded Lead-acidNumber of Modules: 13Total Traction Voltage: 78 VoltsBattery Pack Weight: 923 lbLocations In Vehicle: Rear Seat & Trunk
CHARGERLocation: Behind Driver SeatInput Voltage(s): 120 volts ACInput Current(s): 13 amperes AC
INTERLOCKSKey Removable When Off Only: YesKey Off In Park Only: NoStart In Park Only: NoStart Blocked By Accelerator: NoStart Blocked On Charge: No
REQUIREMENTSManual Disconnect Present & Operational:NoBatteries Sealed or Valve Regulated: NoCharger Automatic Control: YesSOC Indicator Present: YesBattery Voltage Indicator: NoBattery Current Indicator: YesRegenerative Current Indicator: N/RTransmission Single Speed: NoTransmission Parking Pawl: NoNo Open Access to High Voltage: NoAll High Voltage Clearly Marked: NoControl Efforts Similar To OEM: Yes
CONSTANT SPEED RANGE45 mph Distance: 88.4 miles45 mph Energy Used: 14.5 kWh45 mph Efficiency: 0.164 kWh/mile45 mph Specific Energy: 0.0157 kWh/lb60 mph Distance: 51.6 miles60 mph Energy Used: 11.3 kWh60 mph Efficiency: 0.219 kWh/mile60 mph Specific Energy: 0.0122 kWh/lbDRIVING CYCLE RANGE77°F Distance: 49.50 miles77°F Energy Used: 11.64 kWh77°F Efficiency: 0.235 kWh/mile77°F Specific Energy: 0.0126 kWh/lb19°F Distance: 33.20 miles19°F Energy Used: Not Measured19°F Efficiency: Not Measured19°F Specific Energy: Not Measured
Performance Goal: 60 milesGRADEABILITY*
Maximum Grade: 42%Performance Goal: 25%Speed At 3% Grade: 56 mphPerformance Goal: 55 mphSpeed At 6% Grade: 42 mphPerformance Goal: 45 mphHANDLING COURSEAvg Time @ 90% SOC: 60.9 secAvg Time @ 50% SOC: 61.3 secAvg Time @ 20% SOC: 64.5 secAvg Dodge Neon (ICE) Time: 54.62 secAverage Chevrolet S-10 Time: 58.29 secBRAKING STABILITYControllability: No Stability ProblemsDistance Dry/Wet: 177.2/272.8 ft
TEST EXCEPTIONSPayload 372 lb less than requiredTest weight greater than OEM GVWROEM GVWR re-rated by converter (notcertified)Flooded electrolyte batteriesTesting delayed by high battery temperatureTesting delayed by charge times > 8 hours
Test Date: October 1994Notes: Bold - Results did not meet EVAmerica Performance Goal* - Tested at gross vehicle weightN/R - No regenerative braking
CHARGERGround Current During Charge: 3 mABattery Leakage Current: 0.01 mACharger Efficiency: 93 %Average Power Factor: 0.54Performance Goal: 0.95Average THD: 91.1 %Performance Goal: 5%Time From 80% DOD: 10 hours 40minutesPerformance Goal: <8 hours
EV America

16
VEHICLE SPECIFICATIONS
PERFORMANCE STATISTICS
ACCELERATION AT 90% SOC *
Zero to 30 mph: 9.7 secZero to 40 mph: 17.6 secZero to 50 mph: 29.8 sec
Performance Goal: 13.5 seconds; 0 to 50 mphACCELERATION AT 50% SOC *
Zero to 30 mph: 10.0 secZero to 40 mph: Not AchievedZero to 50 mph: Not AchievedPerformance Goal: 13.5 seconds; 0 to 50 mph
MAXIMUM SPEEDAt 50% SOC: Not AchievedPerformance Goal: 70 mph
CONSTANT SPEED RANGE45 mph Distance: 55.4 miles45 mph Energy Used: 17.8 kWh45 mph Efficiency: 0.321 kWh/mile45 mph Specific Energy: 0.0119 kWh/lb
VEHICLE TYPEConversion Of: Ford RangerVIN: 1FTCRIOU1PPA36115Seating Capacity: 2 AdultsFeatures: AM/FM Stereo, PowerBrakes, Tilt Wheel, Front DiscBrakes & Anti-lock Brakes
DIMENSIONSWheelbase: 114.8 inchesTrack F/R: 56.9/57.4 inchesLength: 198.1 inchesWidth: 69.6 inchesHeight: 63.5 inchesGround Clearance: >50 mmCargo Space: 10 cu ft of OEMcargo space lost due toplacement of battery box.
WEIGHTCurb Weight: 4000 lbTest Weight: 4354 lbDistribution F/R: 47/53 %Conversion GVWR: 4700 lbOEM GVWR: 4260 lbPayload: 346 lb
WHEELS & TIRESWheel Size: 14 inchTire Mfg: Goodyear InvictaTire Size: P215/75R14Tire Pressure F/R: 35/35 psiSpare Installed: No
DRIVE SYSTEMDrive Type: Brush DCMotor Mfg: General Electric
DRIVE SYSTEM Controller Mfg: General ElectricTransmission: 5 Speed Manual
BATTERYManufacturer: TrojanType: T145 Flooded Lead-acidNumber of Modules: 21Total Traction Voltage: 126 VoltsBattery Pack Weight: 1491 lbLocations In Vehicle: Cargo Bed &Under Hood
CHARGERLocation: Off-BoardInput Voltage(s): N/AInput Current(s): N/A
INTERLOCKSKey Removable When Off Only: YesKey Off In Park Only: NoStart In Park Only: NoStart Blocked By Accelerator: YesStart Blocked On Charge: No
REQUIREMENTSManual Disconnect Present &Operational: NoBatteries Sealed or Valve Regulated: NoCharger Automatic Control: NoSOC Indicator: YesBattery Voltage Indicator: NoBattery Current Indicator: YesRegenerative Current Indicator: N/RTransmission Single Speed: NoTransmission Parking Pawl: NoNo Open Access to High Voltage: NoAll High Voltage Clearly Marked: NoControl Efforts Similar To OEM: Yes
60 mph Distance: 44.0 miles60 mph Energy Used: 16.6 kWh60 mph Efficiency: 0.378 kWh/mile60 mph Specific Energy: 0.0111 kWh/lb
DRIVING CYCLE RANGE77°F Distance: 21.14 miles77°F Energy Used: 9.21 kWh77°F Efficiency: 0.436 kWh/mile77°F Specific Energy: 0.0062 kWh/lb19°F Distance: 9.40 miles19°F Energy Used: 4.37 kWh19°F Efficiency: 0.465 kWh/mile19°F Specific Energy: 0.0029 kWh/lb
Performance Goal: 60 miles
GRADEABILITY*
Maximum Grade: 37%Performance Goal: 25%
Speed At 3% Grade: 29 mphPerformance Goal: 55 mph
Speed At 6% Grade: 19 mphPerformance Goal: 45 mph
HANDLING COURSEAvg Time @ 90% SOC: 65.5 secAvg Time @ 50% SOC: 66.6 secAvg Time @ 20% SOC: 70.9 secAvg Dodge Neon (ICE) Time: 54.62 secAverage Chevrolet S-10 Time: 58.29 sec
BRAKING STABILITYControllability: No Stability ProblemsDistance Dry/Wet: 151.6/201.6 ft
TEST EXCEPTIONSPayload 304 lb less than required OEMGVWR re-rated (not certified) by converterFlooded electrolyte batteriesNo onboard chargerAuxiliary battery replacedRequired 12 volt connector repairRemoved from testing to add BAT CatalystTesting delayed by high battery temperatureShock absorbers replaced
Test Date: October 1994Notes: Bold - Results did not meet EVAmerica Performance Goal* - Tested at gross vehicle weightN/R - No regenerative braking
CHARGERGround Current During Charge: 9 mABattery Leakage Current: 1.7 mACharger Efficiency: N/AAverage Power Factor: N/APerformance Goal: 0.95Average THD: N/APerformance Goal: 5%Time From 80% DOD: N/APerformance Goal: <8 hours
EV America
17
VEHICLE SPECIFICATIONS
PERFORMANCE STATISTICS
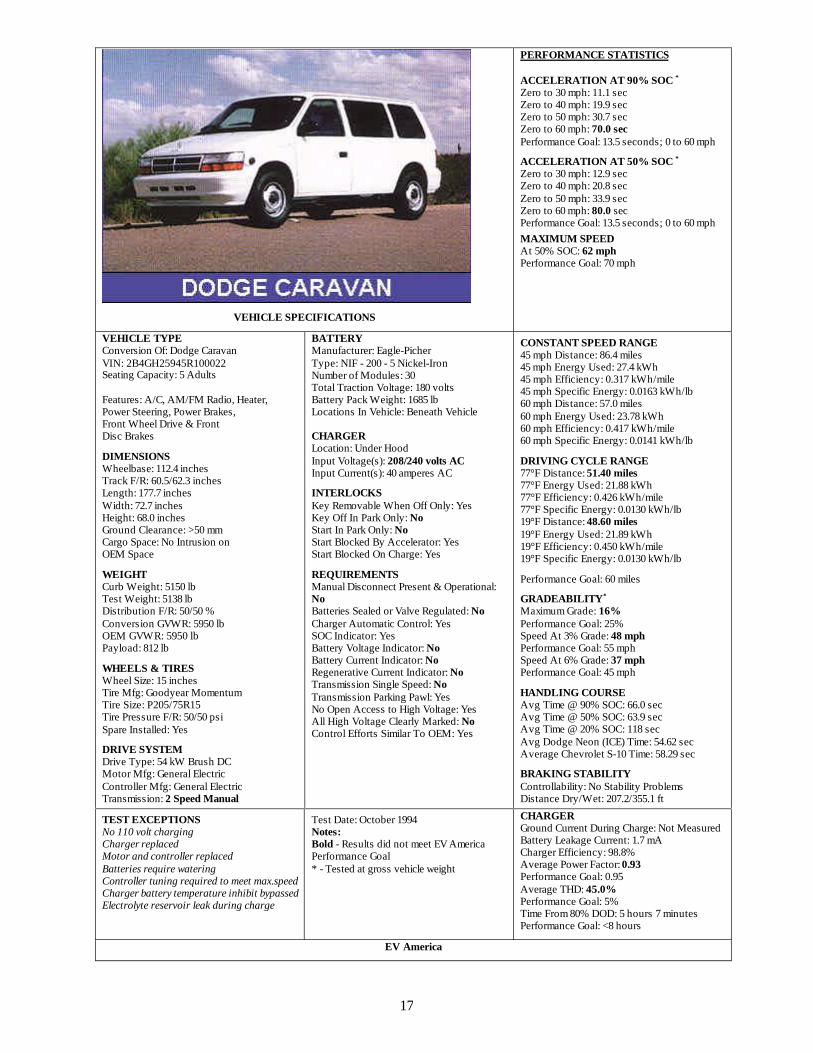
ACCELERATION AT 90% SOC *
Zero to 30 mph: 11.1 secZero to 40 mph: 19.9 secZero to 50 mph: 30.7 secZero to 60 mph: 70.0 secPerformance Goal: 13.5 seconds; 0 to 60 mph
ACCELERATION AT 50% SOC *
Zero to 30 mph: 12.9 secZero to 40 mph: 20.8 secZero to 50 mph: 33.9 secZero to 60 mph: 80.0 secPerformance Goal: 13.5 seconds; 0 to 60 mphMAXIMUM SPEEDAt 50% SOC: 62 mphPerformance Goal: 70 mph
VEHICLE TYPEConversion Of: Dodge CaravanVIN: 2B4GH25945R100022Seating Capacity: 5 Adults
Features: A/C, AM/FM Radio, Heater,Power Steering, Power Brakes,Front Wheel Drive & FrontDisc Brakes
DIMENSIONSWheelbase: 112.4 inchesTrack F/R: 60.5/62.3 inchesLength: 177.7 inchesWidth: 72.7 inchesHeight: 68.0 inchesGround Clearance: >50 mmCargo Space: No Intrusion onOEM Space
WEIGHTCurb Weight: 5150 lbTest Weight: 5138 lbDistribution F/R: 50/50 %Conversion GVWR: 5950 lbOEM GVWR: 5950 lbPayload: 812 lb
WHEELS & TIRESWheel Size: 15 inchesTire Mfg: Goodyear MomentumTire Size: P205/75R15Tire Pressure F/R: 50/50 psiSpare Installed: Yes
DRIVE SYSTEMDrive Type: 54 kW Brush DCMotor Mfg: General ElectricController Mfg: General ElectricTransmission: 2 Speed Manual
BATTERYManufacturer: Eagle-PicherType: NIF - 200 - 5 Nickel-IronNumber of Modules: 30Total Traction Voltage: 180 voltsBattery Pack Weight: 1685 lbLocations In Vehicle: Beneath Vehicle
CHARGERLocation: Under HoodInput Voltage(s): 208/240 volts ACInput Current(s): 40 amperes AC
INTERLOCKSKey Removable When Off Only: YesKey Off In Park Only: NoStart In Park Only: NoStart Blocked By Accelerator: YesStart Blocked On Charge: Yes
REQUIREMENTSManual Disconnect Present & Operational:NoBatteries Sealed or Valve Regulated: NoCharger Automatic Control: YesSOC Indicator: YesBattery Voltage Indicator: NoBattery Current Indicator: NoRegenerative Current Indicator: NoTransmission Single Speed: NoTransmission Parking Pawl: YesNo Open Access to High Voltage: YesAll High Voltage Clearly Marked: NoControl Efforts Similar To OEM: Yes
CONSTANT SPEED RANGE45 mph Distance: 86.4 miles45 mph Energy Used: 27.4 kWh45 mph Efficiency: 0.317 kWh/mile45 mph Specific Energy: 0.0163 kWh/lb60 mph Distance: 57.0 miles60 mph Energy Used: 23.78 kWh60 mph Efficiency: 0.417 kWh/mile60 mph Specific Energy: 0.0141 kWh/lb
DRIVING CYCLE RANGE77°F Distance: 51.40 miles77°F Energy Used: 21.88 kWh77°F Efficiency: 0.426 kWh/mile77°F Specific Energy: 0.0130 kWh/lb19°F Distance: 48.60 miles19°F Energy Used: 21.89 kWh19°F Efficiency: 0.450 kWh/mile19°F Specific Energy: 0.0130 kWh/lb
Performance Goal: 60 miles
GRADEABILITY*
Maximum Grade: 16%Performance Goal: 25%Speed At 3% Grade: 48 mphPerformance Goal: 55 mphSpeed At 6% Grade: 37 mphPerformance Goal: 45 mph
HANDLING COURSEAvg Time @ 90% SOC: 66.0 secAvg Time @ 50% SOC: 63.9 secAvg Time @ 20% SOC: 118 secAvg Dodge Neon (ICE) Time: 54.62 secAverage Chevrolet S-10 Time: 58.29 sec
BRAKING STABILITYControllability: No Stability ProblemsDistance Dry/Wet: 207.2/355.1 ft
TEST EXCEPTIONSNo 110 volt chargingCharger replacedMotor and controller replacedBatteries require wateringController tuning required to meet max.speedCharger battery temperature inhibit bypassedElectrolyte reservoir leak during charge
Test Date: October 1994Notes:Bold - Results did not meet EV AmericaPerformance Goal* - Tested at gross vehicle weight
CHARGERGround Current During Charge: Not MeasuredBattery Leakage Current: 1.7 mACharger Efficiency: 98.8%Average Power Factor: 0.93Performance Goal: 0.95Average THD: 45.0%Performance Goal: 5%Time From 80% DOD: 5 hours 7 minutesPerformance Goal: <8 hours
EV America

18
VEHICLE SPECIFICATIONS
PERFORMANCE STATISTICS
ACCELERATION AT 90% SOC *
Zero to 30 mph: 8.5 secZero to 40 mph: 12.6 secZero to 50 mph: 18.4 secZero to 60 mph: 27.0 secPerformance Goal: 13.5 seconds; 0 to 60 mphACCELERATION AT 50% SOC *
Zero to 30 mph: 9.4 secZero to 40 mph: 14.2 secZero to 50 mph: 21.5 secZero to 60 mph: 34.1 secPerformance Goal: 13.5 seconds; 0 to 60 mph
MAXIMUM SPEEDAt 50% SOC: 70 mphPerformance Goal: 70 mph
VEHICLE TYPEConversion Of: Geo MetroVIN: 2CIMR5299567000106Seating Capacity: 4 Adults
Features: AM/FM Radio, Heater,Battery Thermal Management,Power Steering, Power Brakes,Front Wheel Drive, Front DiscBrakes & Anti-Lock Brakes
DIMENSIONSWheelbase: 93.0 inchesTrack F/R: 55.0/53.9 inchesLength: 164.3 inchesWidth: 62.0 inchesHeight: 54.5 inchesGround Clearance: >50 mmCargo Space: No Intrusionon OEM Space
WEIGHTCurb Weight: 2290 lbTest Weight: 2424 lbDistribution F/R: 49/51 %Conversion GVWR: 2800 lbOEM GVWR: 2800 lbPayload: 376 lb
WHEELS & TIRESWheel Size: 13 inchesTire Mfg: Goodyear InvictaTire Size: P165/70R13Tire Pressure F/R: 44/44 psiSpare Installed: No
DRIVE SYSTEMDrive Type: 35 kW AC InductionMotor Mfg: Solectria
DRIVE SYSTEM Controller Mfg: SolectriaTransmission: Single Speed
BATTERYManufacturer: Hawker EnergyType: G12V26Ah10C Sealed Lead-acidNumber of Modules: 30Total Traction Voltage: 180 voltsBattery Pack Weight: 690 lbLocations In Vehicle: Under Trunk& Engine Compartment
CHARGERLocation: TrunkInput Voltage(s): 120/208/240 volts ACInput Current(s): 15/14.4/12.5 amperes AC
INTERLOCKSKey Removable When Off Only: YesKey Off In Park Only: YesStart In Park Only: YesStart Blocked By Accelerator: NoStart Blocked On Charge: Yes
REQUIREMENTSManual Disconnect Present & Operational: NoBatteries Sealed or Valve Regulated: YesCharger Automatic Control: YesSOC Indicator: YesBattery Voltage Indicator: NoBattery Current Indicator: NoRegenerative Current Indicator: NoTransmission Single Speed: YesTransmission Parking Pawl: YesNo Open Access to High Voltage: YesAll High Voltage Clearly Marked: YesControl Efforts Similar To OEM: Yes
CONSTANT SPEED RANGE45 mph Distance: 49.5 miles45 mph Energy Used: 7.2 kWh45 mph Efficiency: 0.171 kWh/mile45 mph Specific Energy: 0.0104 kWh/lb60 mph Distance: 26.6 miles60 mph Energy Used: 5.3 kWh60 mph Efficiency: 0.199 kWh/mile60 mph Specific Energy: 0.0077 kWh/lb
DRIVING CYCLE RANGE77°F Distance: 45.4 miles77°F Energy Used: 7.77 kWh77°F Efficiency: 0.145 kWh/mile77°F Specific Energy: 0.0113 kWh/lb19°F Distance: 43.5 miles19°F Energy Used: 7.75 kWh19°F Efficiency: 0.178 kWh/mile19°F Specific Energy: 0.0112 kWh/lbPerformance Goal: 60 miles
GRADEABILITY*
Maximum Grade: 15.2%Performance Goal: 25%Speed At 3% Grade: 60 mphPerformance Goal: 55 mphSpeed At 6% Grade: 47 mphPerformance Goal: 45 mph
HANDLING COURSEAvg Time @ 90% SOC: 58.6 secAvg Time @ 50% SOC: 58.3 secAvg Time @ 20% SOC: 58.1 secAvg Dodge Neon (ICE) Time: 54.62 secAverage Chevrolet S-10 Time: 58.29 sec
BRAKING STABILITYControllability: No Stability ProblemsDistance Dry/Wet: 164.4/214.4 ft
TEST EXCEPTIONSPrototype vehiclePayload 324 lb less than requiredRequired charger adjustmentRequired battery module replacement
Test Date: October 1994Notes: Bold - Results did not meet EV AmericaPerformance Goal * - Tested at gross vehicle weight
CHARGERGround Current During Charge: <0.01 mABattery Leakage Current: <0.01 mACharger Efficiency: 95.2%Average Power Factor: 0.937Performance Goal: 0.95Average THD: 29.0%Performance Goal: 5%Time From 80% DOD: 3 hours 54 minutesPerformance Goal: <8 hours
EV America

19
VEHICLE SPECIFICATIONS
PERFORMANCE STATISTICS
ACCELERATION AT 90% SOC *
Zero to 30 mph: 7.0 secZero to 40 mph: 11.5 secZero to 50 mph: 18.8 secPerformance Goal: 13.5 seconds; 0 to 50 mph
ACCELERATION AT 50% SOC *
Zero to 30 mph: 7.1 secZero to 40 mph: 12.2 secZero to 50 mph: 21.7 secPerformance Goal: 13.5 seconds; 0 to 50 mphMAXIMUM SPEEDAt 50% SOC: 66 mphPerformance Goal: 70 mph
VEHICLE TYPEConversion Of: Chevrolet S10VIN: 1GCCS1448SK100655Seating Capacity: 2 Adults
Features: AM/FM Stereo,Battery ThermalManagement,Power Steering, PowerBrakes,Front Disc Brakes & Anti-LockBrakes
DIMENSIONSWheelbase: 109.0 inchesTrack F/R: 54.2/54.5 inchesLength: 189.7 inchesWidth: 68.1 inchesHeight: 62.3 inchesGround Clearance: >50 mmCargo Space: No Intrusionon OEM Cargo Bed
WEIGHTCurb Weight: 3790 lbTest Weight: 3991 lbDistribution F/R: 47/53 %Conversion GVWR: 4600 lbOEM GVWR: 4600 lbPayload: 609 lb
WHEELS & TIRESWheel Size: 15 inchTire Mfg: Goodyear MomentumTire Size: P205/75R15Tire Pressure F/R: 50/50 psiSpare Installed: No
DRIVE SYSTEMDrive Type: Dual AC InductionMotor Mfg: SolectriaController Mfg: SolectriaTransmission: Single Speed
BATTERYManufacturer: Hawker EnergyType: G12V38Ah10C Sealed Lead-acidNumber of Modules: 36Total Traction Voltage: 144 voltsBattery Pack Weight: 1260 lbLocations In Vehicle: Under Cargo Bed& Under Hood
CHARGERLocation: Behind Seat in CabInput Voltage(s): 110/208/220 volts ACInput Current(s): 15/14.4/12.5 amperesAC
INTERLOCKSKey Removable When Off Only: YesKey Off In Park Only: NoStart In Park Only: YesStart Blocked By Accelerator: NoStart Blocked On Charge: Yes
REQUIREMENTSManual Disconnect Present &Operational: NoBatteries Sealed or Valve Regulated: YesCharger Automatic Control: YesSOC Indicator: YesBattery Voltage Indicator: YesBattery Current Indicator: YesRegenerative Current Indicator: YesTransmission Single Speed: YesTransmission Parking Pawl: NoNo Open Access to High Voltage: YesAll High Voltage Clearly Marked: YesControl Efforts Similar To OEM: Yes
CONSTANT SPEED RANGE45 mph Distance: 72.8 miles45 mph Energy Used: 16.7 kWh45 mph Efficiency: 0.229 kWh/mile45 mph Specific Energy: 0.0132 kWh/lb60 mph Distance: 39.5 miles60 mph Energy Used: 14.2 kWh60 mph Efficiency: 0.359 kWh/mile60 mph Specific Energy: 0.0113 kWh/lb
DRIVING CYCLE RANGE77°F Distance: 57.86 miles77°F Energy Used: 21.09 kWh77°F Efficiency: 0.364 kWh/mile77°F Specific Energy: 0.0167 kWh/lb19°F Distance: 53.80 miles19°F Energy Used: 18.09 kWh19°F Efficiency: 0.336 kWh/mile19°F Specific Energy: 0.0144 kWh/lb
Performance Goal: 60 miles
GRADEABILITY*
Maximum Grade: 26%Performance Goal: 25%Speed At 3% Grade: 53 mphPerformance Goal: 55 mphSpeed At 6% Grade: 42 mphPerformance Goal: 45 mph
HANDLING COURSEAvg Time @ 90% SOC: 57.8 secAvg Time @ 50% SOC: 57.2 secAvg Time @ 20% SOC: 57.1 secAvg Dodge Neon (ICE) Time: 54.62 secAverage Chevrolet S-10 Time: 58.29 sec
BRAKING STABILITYControllability: No Stability ProblemsDistance Dry/Wet: 172.4/258.2 ft
TEST EXCEPTIONSBattery charging delayed by hightemperatureCharger output fuse replacedRequired charger adjustmentPayload 41 lb less than required
Test Date: October 1994Notes:Bold - Results did not meet EV AmericaPerformance Goal* - Tested at gross vehicle weight
CHARGERGround Current During Charge: <0.01 mABattery Leakage Current: 0.02 mACharger Efficiency: 96.2%Average Power Factor: 0.943Performance Goal: 0.95Average THD: 19.4%Performance Goal: 5%Time From 80% DOD: 6 hours 52 minutesPerformance Goal: <8 hours
EV America
20
VEHICLE SPECIFICATIONS
PERFORMANCE STATISTICS
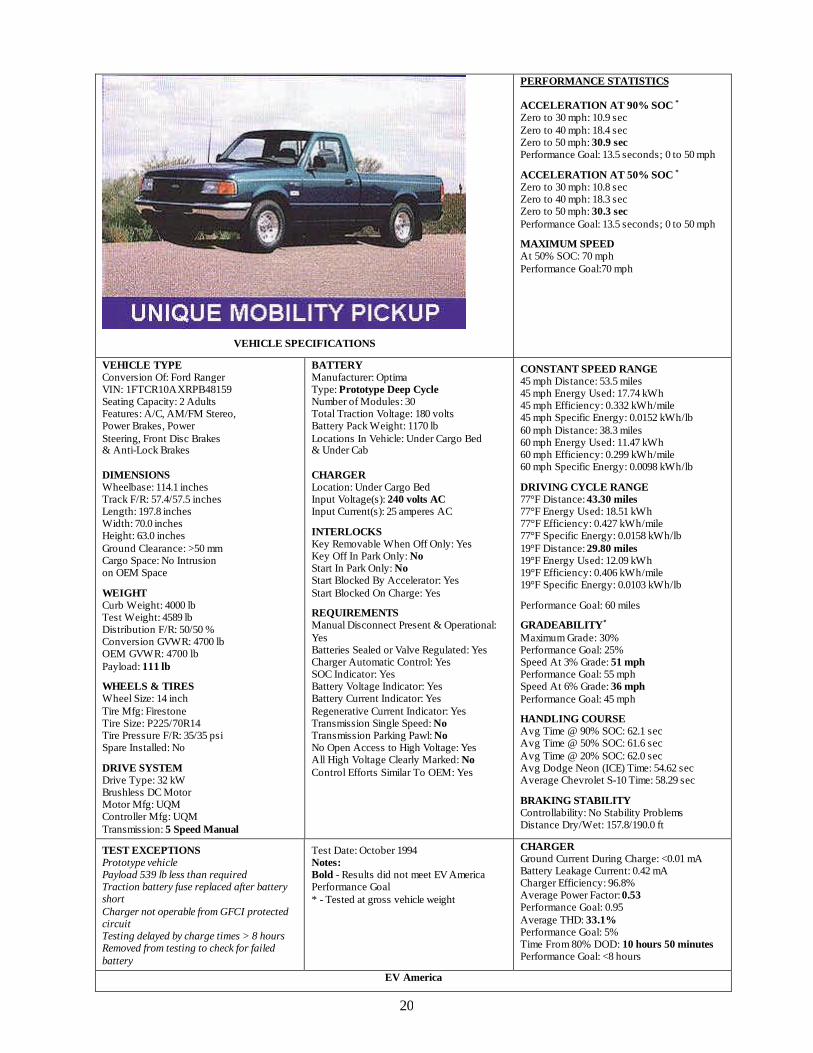
ACCELERATION AT 90% SOC *
Zero to 30 mph: 10.9 secZero to 40 mph: 18.4 secZero to 50 mph: 30.9 secPerformance Goal: 13.5 seconds; 0 to 50 mph
ACCELERATION AT 50% SOC *
Zero to 30 mph: 10.8 secZero to 40 mph: 18.3 secZero to 50 mph: 30.3 secPerformance Goal: 13.5 seconds; 0 to 50 mph
MAXIMUM SPEEDAt 50% SOC: 70 mphPerformance Goal:70 mph
VEHICLE TYPEConversion Of: Ford RangerVIN: 1FTCR10AXRPB48159Seating Capacity: 2 AdultsFeatures: A/C, AM/FM Stereo,Power Brakes, PowerSteering, Front Disc Brakes& Anti-Lock Brakes
DIMENSIONSWheelbase: 114.1 inchesTrack F/R: 57.4/57.5 inchesLength: 197.8 inchesWidth: 70.0 inchesHeight: 63.0 inchesGround Clearance: >50 mmCargo Space: No Intrusionon OEM Space
WEIGHTCurb Weight: 4000 lbTest Weight: 4589 lbDistribution F/R: 50/50 %Conversion GVWR: 4700 lbOEM GVWR: 4700 lbPayload: 111 lb
WHEELS & TIRESWheel Size: 14 inchTire Mfg: FirestoneTire Size: P225/70R14Tire Pressure F/R: 35/35 psiSpare Installed: No
DRIVE SYSTEMDrive Type: 32 kWBrushless DC MotorMotor Mfg: UQMController Mfg: UQMTransmission: 5 Speed Manual
BATTERYManufacturer: OptimaType: Prototype Deep CycleNumber of Modules: 30Total Traction Voltage: 180 voltsBattery Pack Weight: 1170 lbLocations In Vehicle: Under Cargo Bed& Under Cab
CHARGERLocation: Under Cargo BedInput Voltage(s): 240 volts ACInput Current(s): 25 amperes AC
INTERLOCKSKey Removable When Off Only: YesKey Off In Park Only: NoStart In Park Only: NoStart Blocked By Accelerator: YesStart Blocked On Charge: Yes
REQUIREMENTSManual Disconnect Present & Operational:YesBatteries Sealed or Valve Regulated: YesCharger Automatic Control: YesSOC Indicator: YesBattery Voltage Indicator: YesBattery Current Indicator: YesRegenerative Current Indicator: YesTransmission Single Speed: NoTransmission Parking Pawl: NoNo Open Access to High Voltage: YesAll High Voltage Clearly Marked: NoControl Efforts Similar To OEM: Yes
CONSTANT SPEED RANGE45 mph Distance: 53.5 miles45 mph Energy Used: 17.74 kWh45 mph Efficiency: 0.332 kWh/mile45 mph Specific Energy: 0.0152 kWh/lb60 mph Distance: 38.3 miles60 mph Energy Used: 11.47 kWh60 mph Efficiency: 0.299 kWh/mile60 mph Specific Energy: 0.0098 kWh/lb
DRIVING CYCLE RANGE77°F Distance: 43.30 miles77°F Energy Used: 18.51 kWh77°F Efficiency: 0.427 kWh/mile77°F Specific Energy: 0.0158 kWh/lb19°F Distance: 29.80 miles19°F Energy Used: 12.09 kWh19°F Efficiency: 0.406 kWh/mile19°F Specific Energy: 0.0103 kWh/lb
Performance Goal: 60 miles
GRADEABILITY*
Maximum Grade: 30%Performance Goal: 25%Speed At 3% Grade: 51 mphPerformance Goal: 55 mphSpeed At 6% Grade: 36 mphPerformance Goal: 45 mph
HANDLING COURSEAvg Time @ 90% SOC: 62.1 secAvg Time @ 50% SOC: 61.6 secAvg Time @ 20% SOC: 62.0 secAvg Dodge Neon (ICE) Time: 54.62 secAverage Chevrolet S-10 Time: 58.29 sec
BRAKING STABILITYControllability: No Stability ProblemsDistance Dry/Wet: 157.8/190.0 ft
TEST EXCEPTIONSPrototype vehiclePayload 539 lb less than requiredTraction battery fuse replaced after batteryshortCharger not operable from GFCI protectedcircuitTesting delayed by charge times > 8 hoursRemoved from testing to check for failedbattery
Test Date: October 1994Notes:Bold - Results did not meet EV AmericaPerformance Goal* - Tested at gross vehicle weight
CHARGERGround Current During Charge: <0.01 mABattery Leakage Current: 0.42 mACharger Efficiency: 96.8%Average Power Factor: 0.53Performance Goal: 0.95Average THD: 33.1%Performance Goal: 5%Time From 80% DOD: 10 hours 50 minutesPerformance Goal: <8 hours
EV America

21
VEHICLE SPECIFICATIONS
PERFORMANCE STATISTICS
ACCELERATION AT 90% SOC *
Zero to 30 mph: 6.5 secZero to 40 mph: 9.6 secZero to 50 mph: 14.3 secZero to 60 mph: 21.0 secPerformance Goal: 13.5 seconds; 0 to 60 mph
ACCELERATION AT 50% SOC *
Zero to 30 mph: 7.0 secZero to 40 mph: 10.6 secZero to 50 mph: 16.2 secZero to 60 mph: 24.9 secPerformance Goal: 13.5 seconds; 0 to 60 mphMAXIMUM SPEEDAt 50% SOC: 81 mphPerformance Goal: 70 mph
VEHICLE TYPEConversion Of: Geo PrizmVIN: 1YSK5304RZ092279Seating Capacity: 4 Adults
Features: AM/FM Radio,Power Steering, PowerBrakes, Front Wheel Drive& Front Disc Brakes
DIMENSIONSWheelbase: 96.8 inchesTrack F/R: 57.5/56.7 inchesLength: 173.1 inchesWidth: 66.6 inchesHeight: 55.2 inchesGround Clearance: >50 mmCargo Space: No Intrusionon OEM Space
WEIGHTCurb Weight: 3420 lbTest Weight: 3445 lbDistribution F/R: 55/45 %Conversion GVWR: 4060 lbOEM GVWR: 3510 lbPayload: 615 lb
WHEELS & TIRESWheel Size: 14 inchesTire Mfg: FirestoneTire Size: P185/765R14Tire Pressure F/R: 35/35 psiSpare Installed: No
DRIVE SYSTEMDrive Type: 50 kW AC InductionMotor Mfg: HughesController Mfg: HughesTransmission: Single Speed
BATTERYManufacturer: Hawker EnergyType: G12V26Ah10C Sealed Lead-acidNumber of Modules: 50Total Traction Voltage: 300 voltsBattery Pack Weight: 1150 lbLocations In Vehicle: Below ThePassenger Compartment
CHARGERLocation: Under HoodInput Voltage(s): 110/220 volts ACInput Current(s): 15/30 amperes AC
INTERLOCKSKey Removable When Off Only: YesKey Off In Park Only: NoStart In Park Only: NoStart Blocked By Accelerator: YesStart Blocked On Charge: Yes
REQUIREMENTSManual Disconnect Present & Operational:YesBatteries Sealed or Valve Regulated: YesCharger Automatic Control: YesSOC Indicator: YesBattery Voltage Indicator: NoBattery Current Indicator: NoRegenerative Current Indicator: NoTransmission Single Speed: YesTransmission Parking Pawl: YesNo Open Access to High Voltage: YesAll High Voltage Clearly Marked: NoControl Efforts Similar To OEM: Yes
CONSTANT SPEED RANGE45 mph Distance: 59.3 miles45 mph Energy Used: 12.4 kWh45 mph Efficiency: 0.209 kWh/mile45 mph Specific Energy: 0.0108 kWh/lb60 mph Distance: 41.5 miles60 mph Energy Used: 11.7 kWh60 mph Efficiency: 0.282 kWh/mile60 mph Specific Energy: 0.0102 kWh/lb
DRIVING CYCLE RANGE77°F Distance: 45.90 miles77°F Energy Used: 11.93 kWh77°F Efficiency: 0.260 kWh/mile77°F Specific Energy: 0.0104 kWh/lb19°F Distance: 32.20 miles19°F Energy Used: 9.57 kWh19°F Efficiency: 0.296 kWh/mile19°F Specific Energy: 0.0083 kWh/lb
Performance Goal: 60 miles
GRADEABILITY*
Maximum Grade: 23%Performance Goal: 25%Speed At 3% Grade: 66 mphPerformance Goal: 55 mphSpeed At 6% Grade: 53 mphPerformance Goal: 45 mph
HANDLING COURSEAvg Time @ 90% SOC: 55.0 secAvg Time @ 50% SOC: 55.0 secAvg Time @ 20% SOC: 57.6 secAvg Dodge Neon (ICE) Time: 54.62 secAverage Chevrolet S-10 Time: 58.29 sec
BRAKING STABILITYControllability: No Stability ProblemsDistance Dry/Wet: 157.6/203.9 ft
TEST EXCEPTIONSPayload 85 lb less than requiredRequires offboard transformer for chargingCharger/Controller GFI trips inadvertentlyOEM GVWR re-certified by converterCharge Complete Indicator lightsprematurely
Test Date: October 1994Notes:Bold - Results did not meet EV AmericaPerformance Goal* - Tested at gross vehicle weight
CHARGERGround Current During Charge: <0.01 mABattery Leakage Current: <0.01 mACharger Efficiency: 95.8%Average Power Factor: 0.937Performance Goal: 0.95Average THD: 15.5%Performance Goal: 5%Time From 80% DOD: 8 hours 12 minutesPerformance Goal: <8 hours
EV America
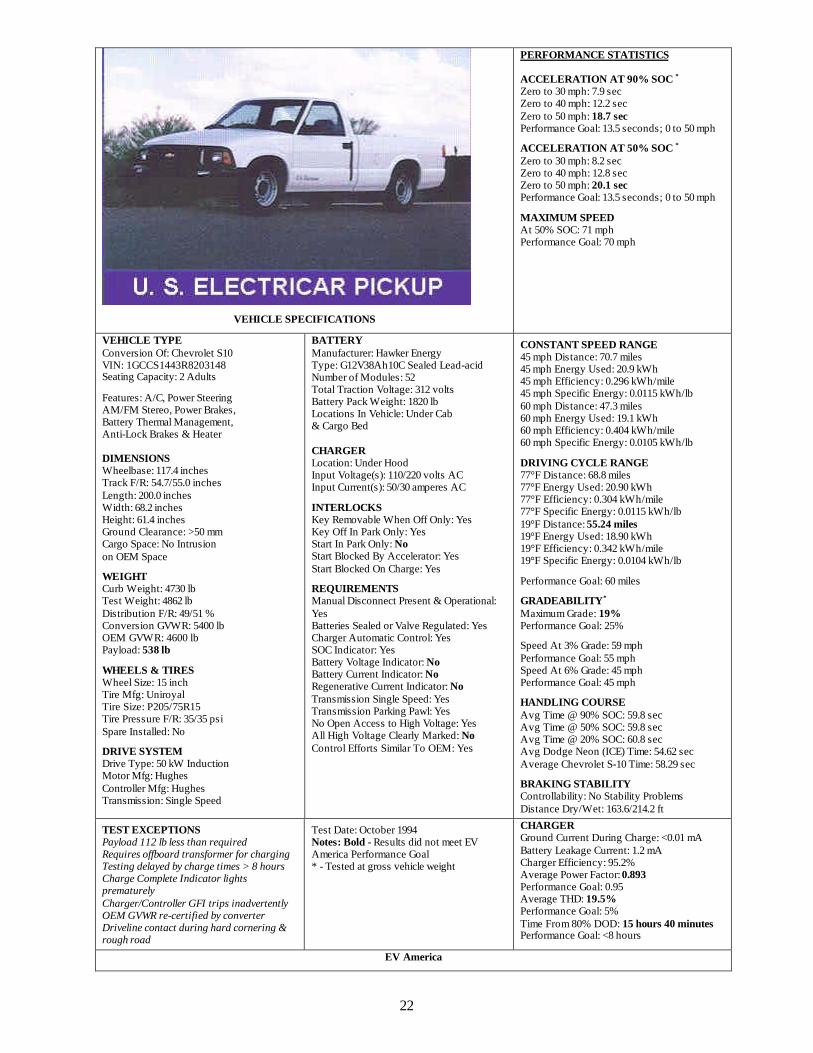
22
VEHICLE SPECIFICATIONS
PERFORMANCE STATISTICS
ACCELERATION AT 90% SOC *
Zero to 30 mph: 7.9 secZero to 40 mph: 12.2 secZero to 50 mph: 18.7 secPerformance Goal: 13.5 seconds; 0 to 50 mph
ACCELERATION AT 50% SOC *
Zero to 30 mph: 8.2 secZero to 40 mph: 12.8 secZero to 50 mph: 20.1 secPerformance Goal: 13.5 seconds; 0 to 50 mph
MAXIMUM SPEEDAt 50% SOC: 71 mphPerformance Goal: 70 mph
VEHICLE TYPEConversion Of: Chevrolet S10VIN: 1GCCS1443R8203148Seating Capacity: 2 Adults
Features: A/C, Power SteeringAM/FM Stereo, Power Brakes,Battery Thermal Management,Anti-Lock Brakes & Heater
DIMENSIONSWheelbase: 117.4 inchesTrack F/R: 54.7/55.0 inchesLength: 200.0 inchesWidth: 68.2 inchesHeight: 61.4 inchesGround Clearance: >50 mmCargo Space: No Intrusionon OEM Space
WEIGHTCurb Weight: 4730 lbTest Weight: 4862 lbDistribution F/R: 49/51 %Conversion GVWR: 5400 lbOEM GVWR: 4600 lbPayload: 538 lb
WHEELS & TIRESWheel Size: 15 inchTire Mfg: UniroyalTire Size: P205/75R15Tire Pressure F/R: 35/35 psiSpare Installed: No
DRIVE SYSTEMDrive Type: 50 kW InductionMotor Mfg: HughesController Mfg: HughesTransmission: Single Speed
BATTERYManufacturer: Hawker EnergyType: G12V38Ah10C Sealed Lead-acidNumber of Modules: 52Total Traction Voltage: 312 voltsBattery Pack Weight: 1820 lbLocations In Vehicle: Under Cab& Cargo Bed
CHARGERLocation: Under HoodInput Voltage(s): 110/220 volts ACInput Current(s): 50/30 amperes AC
INTERLOCKSKey Removable When Off Only: YesKey Off In Park Only: YesStart In Park Only: NoStart Blocked By Accelerator: YesStart Blocked On Charge: Yes
REQUIREMENTSManual Disconnect Present & Operational:YesBatteries Sealed or Valve Regulated: YesCharger Automatic Control: YesSOC Indicator: YesBattery Voltage Indicator: NoBattery Current Indicator: NoRegenerative Current Indicator: NoTransmission Single Speed: YesTransmission Parking Pawl: YesNo Open Access to High Voltage: YesAll High Voltage Clearly Marked: NoControl Efforts Similar To OEM: Yes
CONSTANT SPEED RANGE45 mph Distance: 70.7 miles45 mph Energy Used: 20.9 kWh45 mph Efficiency: 0.296 kWh/mile45 mph Specific Energy: 0.0115 kWh/lb60 mph Distance: 47.3 miles60 mph Energy Used: 19.1 kWh60 mph Efficiency: 0.404 kWh/mile60 mph Specific Energy: 0.0105 kWh/lb
DRIVING CYCLE RANGE77°F Distance: 68.8 miles77°F Energy Used: 20.90 kWh77°F Efficiency: 0.304 kWh/mile77°F Specific Energy: 0.0115 kWh/lb19°F Distance: 55.24 miles19°F Energy Used: 18.90 kWh19°F Efficiency: 0.342 kWh/mile19°F Specific Energy: 0.0104 kWh/lb
Performance Goal: 60 miles
GRADEABILITY*
Maximum Grade: 19%Performance Goal: 25%
Speed At 3% Grade: 59 mphPerformance Goal: 55 mphSpeed At 6% Grade: 45 mphPerformance Goal: 45 mph
HANDLING COURSEAvg Time @ 90% SOC: 59.8 secAvg Time @ 50% SOC: 59.8 secAvg Time @ 20% SOC: 60.8 secAvg Dodge Neon (ICE) Time: 54.62 secAverage Chevrolet S-10 Time: 58.29 sec
BRAKING STABILITYControllability: No Stability ProblemsDistance Dry/Wet: 163.6/214.2 ft
TEST EXCEPTIONSPayload 112 lb less than requiredRequires offboard transformer for chargingTesting delayed by charge times > 8 hoursCharge Complete Indicator lightsprematurelyCharger/Controller GFI trips inadvertentlyOEM GVWR re-certified by converterDriveline contact during hard cornering &rough road
Test Date: October 1994Notes: Bold - Results did not meet EVAmerica Performance Goal* - Tested at gross vehicle weight
CHARGERGround Current During Charge: <0.01 mABattery Leakage Current: 1.2 mACharger Efficiency: 95.2%Average Power Factor: 0.893Performance Goal: 0.95Average THD: 19.5%Performance Goal: 5%Time From 80% DOD: 15 hours 40 minutesPerformance Goal: <8 hours
EV America

23
ENERGY ECONOMICS
This section compares the energy economics of electric vehicles to the energy costs ofvehicles fueled by internal combustion engines (ICE). The energy costs are discussed for fivetypes of vehicles: two gasoline-powered ICEs that get 18 miles per gallon (mpg), and 22 mpg,respectively; and three electric vehicles that go 2, 3, and 4 miles per kWh of electricity,respectively. The last Site Operator's Quarterly Report originally touched on this subject, but thisdiscussion has been expanded, with dynamic comparisons of electricity efficiencies and variablefuel costs (for electricity on a per-kWh basis and for a gallon of gasoline). The use of an ICEtruck that gets 18 mpg has been included as this is the type of vehicle that a utility would mostlikely replace with an electric vehicle pickup or minivan from an original equipmentmanufacturer (OEM) or a vehicle converter. An electric vehicle that gets 2 miles/kWh has alsobeen included, given that this is probably the bottom range for energy efficiency that a newelectric vehicle pickup/minivan would experience.
While there are other variables that affect the total life-cycle costs of electric vehicles, onlythe energy costs are examined here. It is acknowledged that other costs, such as the initial capitalcosts of the vehicle and a charger (if off-board), minus any applicable tax deductions or taxcredits, can have significant impacts on total life-cycle costs. However, many of these costcomparison questions are difficult to quantify for electric vehicles. For instance, should the costof GM's EV1/Impact be compared to an ICE that has similar range, similar luxury, or similarhandling and acceleration?
AssumptionsTo perform the energy economics comparison, several assumptions must be used that can
generate controversy, as not all are willing to accept the same set of assumptions. To mitigatethis potential controversy, the assumptions used are clearly stated and hopefully reasonable.
An Energy Information Agency publication1 lists the 1992 United States automobileaverage efficiency of 21.6 mpg, with this value historically increasing at an average annual rateof 2.6% per year for the previous 19 years. This equates to a calculated 1996 rate of 23.9 mpg.However, utility use vehicles usually have low mpg characteristics, so the 22-mpg and 18-mpgICE vehicle profiles are included.
An electric vehicle baseline efficiency value of 3 miles/kWh is assumed for the analysis.There is no strong historical basis for electric vehicle fleet efficiency, given the continuousincreases in electric vehicle technology over short periods of time and the relatively short historyof OEM-built electric vehicle availability. However, some miles/kWh information is available,including the GM EV1/Impact, which exhibited an energy efficiency of over 6 miles/kWh in theSAE J1634 test performed under the DOE/EV America Program. With the exception of theBaker pickup (of which only a very limited number were built), the other four 1995 and 1996 EVAmerica performance tested electric vehicles all obtained greater than 3 miles/kWh. In fact, 8 ofthe 14 electric vehicles tested by EV America exceeded the 3 miles/kWh value, and 5 electricvehicles exceeded 4 miles/kWh, as did both of the 1996 test vehicles.
The nex t assumption is the cost of gasoline. Based on the February 23rd Lundberg Surveyof 10,000 gas stations nationwide, the average pump price for gasoline was 119.13 cents. Theprices for unleaded gas at self-serve pumps were 112.42 cents for regular, 122.64 for mid-grade,and 131.20 cents for premium. At full-service pumps, the nationwide average prices for regular,
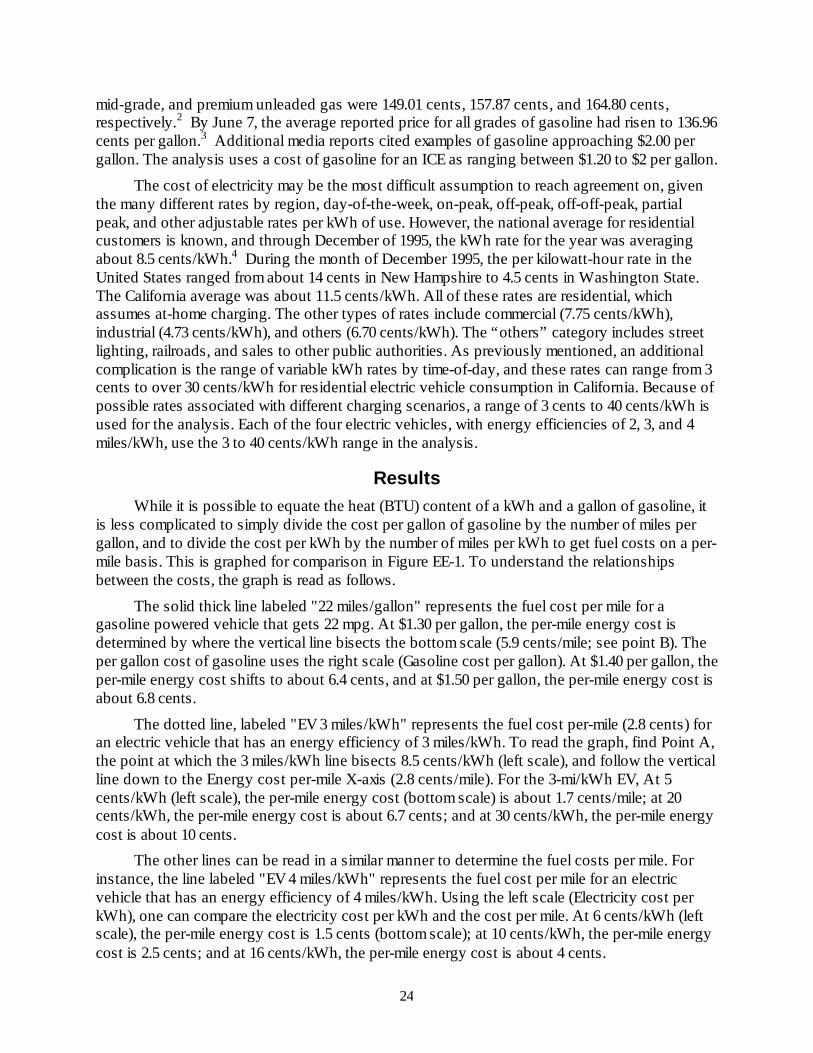
24
mid-grade, and premium unleaded gas were 149.01 cents, 157.87 cents, and 164.80 cents,respectively.2 By June 7, the average reported price for all grades of gasoline had risen to 136.96cents per gallon.3 Additional media reports cited examples of gasoline approaching $2.00 pergallon. The analysis uses a cost of gasoline for an ICE as ranging between $1.20 to $2 per gallon.
The cost of electricity may be the most difficult assumption to reach agreement on, giventhe many different rates by region, day-of-the-week, on-peak, off-peak, off-off-peak, partialpeak, and other adjustable rates per kWh of use. However, the national average for residentialcustomers is known, and through December of 1995, the kWh rate for the year was averagingabout 8.5 cents/kWh.4 During the month of December 1995, the per kilowatt-hour rate in theUnited States ranged from about 14 cents in New Hampshire to 4.5 cents in Washington State.The California average was about 11.5 cents/kWh. All of these rates are residential, whichassumes at-home charging. The other types of rates include commercial (7.75 cents/kWh),industrial (4.73 cents/kWh), and others (6.70 cents/kWh). The “others” category includes streetlighting, railroads, and sales to other public authorities. As previously mentioned, an additionalcomplication is the range of variable kWh rates by time-of-day, and these rates can range from 3cents to over 30 cents/kWh for residential electric vehicle consumption in California. Because ofpossible rates associated with different charging scenarios, a range of 3 cents to 40 cents/kWh isused for the analysis. Each of the four electric vehicles, with energy efficiencies of 2, 3, and 4miles/kWh, use the 3 to 40 cents/kWh range in the analysis.
ResultsWhile it is possible to equate the heat (BTU) content of a kWh and a gallon of gasoline, it
is less complicated to simply divide the cost per gallon of gasoline by the number of miles pergallon, and to divide the cost per kWh by the number of miles per kWh to get fuel costs on a per-mile basis. This is graphed for comparison in Figure EE-1. To understand the relationshipsbetween the costs, the graph is read as follows.
The solid thick line labeled "22 miles/gallon" represents the fuel cost per mile for agasoline powered vehicle that gets 22 mpg. At $1.30 per gallon, the per-mile energy cost isdetermined by where the vertical line bisects the bottom scale (5.9 cents/mile; see point B). Theper gallon cost of gasoline uses the right scale (Gasoline cost per gallon). At $1.40 per gallon, theper-mile energy cost shifts to about 6.4 cents, and at $1.50 per gallon, the per-mile energy cost isabout 6.8 cents.
The dotted line, labeled "EV 3 miles/kWh" represents the fuel cost per-mile (2.8 cents) foran electric vehicle that has an energy efficiency of 3 miles/kWh. To read the graph, find Point A,the point at which the 3 miles/kWh line bisects 8.5 cents/kWh (left scale), and follow the verticalline down to the Energy cost per-mile X-axis (2.8 cents/mile). For the 3-mi/kWh EV, At 5cents/kWh (left scale), the per-mile energy cost (bottom scale) is about 1.7 cents/mile; at 20cents/kWh, the per-mile energy cost is about 6.7 cents; and at 30 cents/kWh, the per-mile energycost is about 10 cents.
The other lines can be read in a similar manner to determine the fuel costs per mile. Forinstance, the line labeled "EV 4 miles/kWh" represents the fuel cost per mile for an electricvehicle that has an energy efficiency of 4 miles/kWh. Using the left scale (Electricity cost perkWh), one can compare the electricity cost per kWh and the cost per mile. At 6 cents/kWh (leftscale), the per-mile energy cost is 1.5 cents (bottom scale); at 10 cents/kWh, the per-mile energycost is 2.5 cents; and at 16 cents/kWh, the per-mile energy cost is about 4 cents.

25
The reader can compare the per-mile energy costs for electric vehicles and ICEs for eachof the energy efficiencies and at various energy costs. For instance, the 22 mpg ICE profile at$1.40 per gallon has a per-mile gasoline cost of about 6.4 cents. Using the national average costof about 8 cents for a kWh of electricity, the 3 miles/kWh electric vehicle has an energy cost of2.7 cents/mile, significantly lower than the ICE vehicle. To further the discussion, the 4miles/kWh electric vehicle will always have lower per-mile energy costs than the 18 mpg ICEvehicle when the cost of electricity is lower than 21 cents/kWh and the cost of gasoline is at$1.30 per gallon or higher. If the electric vehicle owner has the option of charging her electricvehicle at night with California off-peak charging rates under 4 cents/kWh, the cost per mile forelectricity is 0.5 to 1 cent for all three electric vehicles.
As seen in the graph (Figure EE-1), the per-mile cost to fuel an electric vehicle can besignificantly lower than the cost to fuel an ICE. The consumer has the ability to control his/herbehavior to fuel the EV, provided of course that the consumer does not try to exceed thevehicle’s maximum range on any given day. Attempting to exceed the vehicle's range wouldlikely require on-peak refueling at a public recharging station. Such recharging could include theuse of more expensive peak-energy costs, as well as a payment to the charging station for thisconvenience.
Other electric vehicle cost factors to be considered include the cost to replace the batterypack, the initial capital cost of the vehicle, tax incentives, and the avoidance of ICE costs thatelectric vehicles do not incur. These avoided costs include the 3,000-mile oil changes, thereplacement of the muffler system, timing belt replacements, tune ups, changing the antifreezeand fuel filter, and other miscellaneous costs. Of course electric vehicles will have maintenancecosts that are unique to electric vehicles. It may be difficult to quantify some electric vehiclebenefits, including the noise and pollution reductions, and the shifting away from dependence onforeign fossil fuels that will someday prove to be of a finite quantity.

26
Figure EE-1. Comparison of the cost of running electric vehicles versus ICEs.
$0.03
$0.05
$0.07
$0.09
$0.11
$0.13
$0.15
$0.17
$0.19
$0.21
$0.23
$0.25
$0.27
$0.29
$0.31
$0.33
$0.35
$0.37
$0.39
$0.00 $0.01 $0.02 $0.03 $0.04 $0.05 $0.06 $0.07 $0.08 $0.09 $0.10 $0.11 $0.12 $0.13 $0.14 $0.15
Energy cost per mile
Ele
ctri
city
cos
t per
kW
$1.20
$1.25
$1.30
$1.35
$1.40
$1.45
$1.50
$1.55
$1.60
$1.65
$1.70
$1.75
$1.80
$1.85
$1.90
$1.95
$2.00
Gas
olin
e co
st p
er g
allo
n
EV 2 miles/kWh
22 miles/gal.
Gas 18 miles/gal.
EV 3 miles/kWh
EV 4 miles/kWh
Point A
Point B
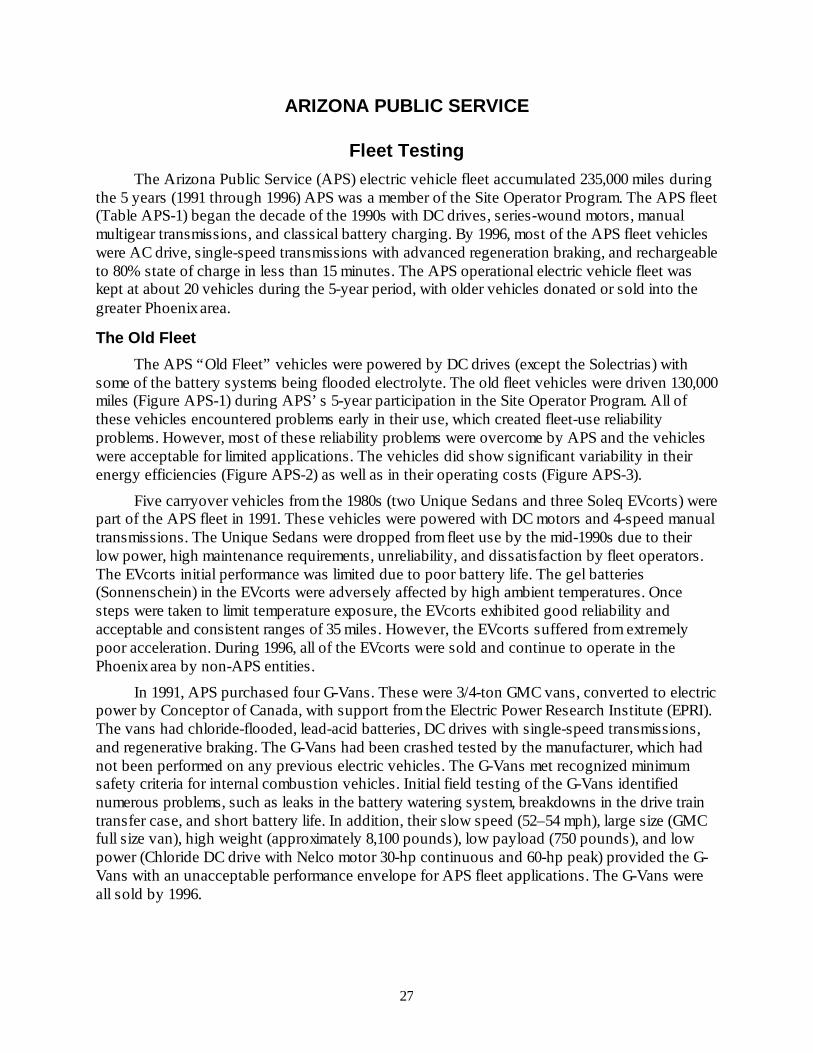
27
ARIZONA PUBLIC SERVICE
Fleet TestingThe Arizona Public Service (APS) electric vehicle fleet accumulated 235,000 miles during
the 5 years (1991 through 1996) APS was a member of the Site Operator Program. The APS fleet(Table APS-1) began the decade of the 1990s with DC drives, series-wound motors, manualmultigear transmissions, and classical battery charging. By 1996, most of the APS fleet vehicleswere AC drive, single-speed transmissions with advanced regeneration braking, and rechargeableto 80% state of charge in less than 15 minutes. The APS operational electric vehicle fleet waskept at about 20 vehicles during the 5-year period, with older vehicles donated or sold into thegreater Phoenix area.
The Old Fleet
The APS “Old Fleet” vehicles were powered by DC drives (except the Solectrias) withsome of the battery systems being flooded electrolyte. The old fleet vehicles were driven 130,000miles (Figure APS-1) during APS’s 5-year participation in the Site Operator Program. All ofthese vehicles encountered problems early in their use, which created fleet-use reliabilityproblems. However, most of these reliability problems were overcome by APS and the vehicleswere acceptable for limited applications. The vehicles did show significant variability in theirenergy efficiencies (Figure APS-2) as well as in their operating costs (Figure APS-3).
Five carryover vehicles from the 1980s (two Unique Sedans and three Soleq EVcorts) werepart of the APS fleet in 1991. These vehicles were powered with DC motors and 4-speed manualtransmissions. The Unique Sedans were dropped from fleet use by the mid-1990s due to theirlow power, high maintenance requirements, unreliability, and dissatisfaction by fleet operators.The EVcorts initial performance was limited due to poor battery life. The gel batteries(Sonnenschein) in the EVcorts were adversely affected by high ambient temperatures. Oncesteps were taken to limit temperature exposure, the EVcorts exhibited good reliability andacceptable and consistent ranges of 35 miles. However, the EVcorts suffered from extremelypoor acceleration. During 1996, all of the EVcorts were sold and continue to operate in thePhoenix area by non-APS entities.
In 1991, APS purchased four G-Vans. These were 3/4-ton GMC vans, converted to electricpower by Conceptor of Canada, with support from the Electric Power Research Institute (EPRI).The vans had chloride-flooded, lead-acid batteries, DC drives with single-speed transmissions,and regenerative braking. The G-Vans had been crashed tested by the manufacturer, which hadnot been performed on any previous electric vehicles. The G-Vans met recognized minimumsafety criteria for internal combustion vehicles. Initial field testing of the G-Vans identifiednumerous problems, such as leaks in the battery watering system, breakdowns in the drive traintransfer case, and short battery life. In addition, their slow speed (52–54 mph), large size (GMCfull size van), high weight (approximately 8,100 pounds), low payload (750 pounds), and lowpower (Chloride DC drive with Nelco motor 30-hp continuous and 60-hp peak) provided the G-Vans with an unacceptable performance envelope for APS fleet applications. The G-Vans wereall sold by 1996.
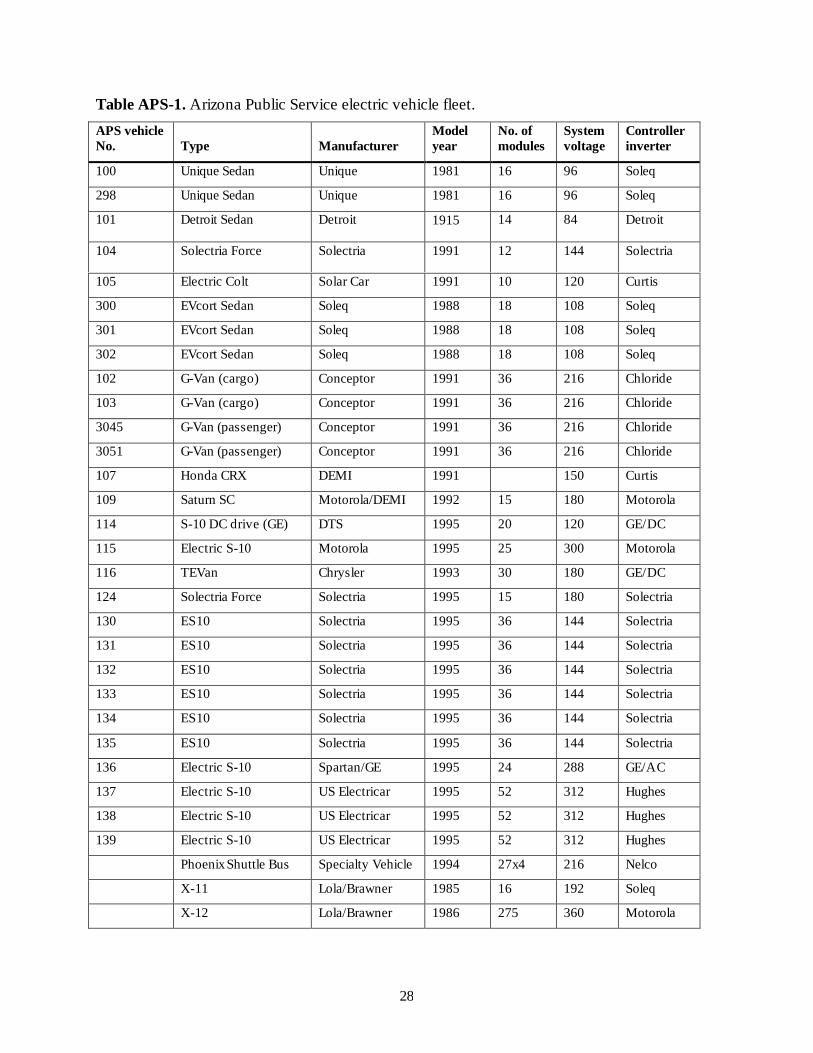
28
Table APS-1. Arizona Public Service electric vehicle fleet.
APS vehicleNo. Type Manufacturer
Modelyear
No. ofmodules
Systemvoltage
Controllerinverter
100 Unique Sedan Unique 1981 16 96 Soleq
298 Unique Sedan Unique 1981 16 96 Soleq
101 Detroit Sedan Detroit 1915 14 84 Detroit
104 Solectria Force Solectria 1991 12 144 Solectria
105 Electric Colt Solar Car 1991 10 120 Curtis
300 EVcort Sedan Soleq 1988 18 108 Soleq
301 EVcort Sedan Soleq 1988 18 108 Soleq
302 EVcort Sedan Soleq 1988 18 108 Soleq
102 G-Van (cargo) Conceptor 1991 36 216 Chloride
103 G-Van (cargo) Conceptor 1991 36 216 Chloride
3045 G-Van (passenger) Conceptor 1991 36 216 Chloride
3051 G-Van (passenger) Conceptor 1991 36 216 Chloride
107 Honda CRX DEMI 1991 150 Curtis
109 Saturn SC Motorola/DEMI 1992 15 180 Motorola
114 S-10 DC drive (GE) DTS 1995 20 120 GE/DC
115 Electric S-10 Motorola 1995 25 300 Motorola
116 TEVan Chrysler 1993 30 180 GE/DC
124 Solectria Force Solectria 1995 15 180 Solectria
130 ES10 Solectria 1995 36 144 Solectria
131 ES10 Solectria 1995 36 144 Solectria
132 ES10 Solectria 1995 36 144 Solectria
133 ES10 Solectria 1995 36 144 Solectria
134 ES10 Solectria 1995 36 144 Solectria
135 ES10 Solectria 1995 36 144 Solectria
136 Electric S-10 Spartan/GE 1995 24 288 GE/AC
137 Electric S-10 US Electricar 1995 52 312 Hughes
138 Electric S-10 US Electricar 1995 52 312 Hughes
139 Electric S-10 US Electricar 1995 52 312 Hughes
Phoenix Shuttle Bus Specialty Vehicle 1994 27x4 216 Nelco
X-11 Lola/Brawner 1985 16 192 Soleq
X-12 Lola/Brawner 1986 275 360 Motorola

29
APS purchased the first Solectria Force produced (a GEO Metro conversion) and an earlySolar Colt (Dodge Colt conversion). Both cars were powered by 12 Sears Die Hard batteries.The Force had a single-speed transmission and air conditioning. The Solar Car featuredphotovoltaic panels on its roof and hood, giving the illusion of off-grid charging. Both vehiclesexhibited short battery life, low range, and poor reliability. Powered by their Die Hard batteries,both vehicles exhibited impressive performance through the first few battery charge cycles, butdrive range dropped off linearly with charge cycles to less than 10 miles per charge atapproximately 2,500 miles on each pack. The vehicles were fun to drive but due to reliabilityissues and having to replace the packs at 2,500 miles, the vehicles were never operated in thefleet. The vehicles were used for exhibits and ride-n-drives. The Solar Car was sold with 5,000miles and the Force was sold at 15,000 miles.
The Chrysler prototype TEVan began operating at APS during 1994. The TEVan, part ofan EPRI program, was the first electric vehicle sold by a major car manufacturer and it wasconsidered as a development step, both for Chrysler as the manufacturer, and electric utilities asthe future infrastructure builders. The TEVan had Saft nickel cadmium (NiCad) batteries(requiring watering), General Electric DC motor and controller, manual 2-speed transmission,and a 10-kW Martin Marietta battery charger. The TEVan complied with NTHSA safetystandards and it had undergone safety testing by Chrysler. Chrysler introduced fast charging (25to 30 minutes) of the NiCad battery, using a Norvik Charger. After overcoming early problemswith the motor and controller, the TEVan performed well in fleet use and was charged almostexclusively with a Norvik fast charger.
Old Fleet Miles Traveled and Energy Use
010,00020,000
30,00040,00050,000
60,00070,00080,000
Evcort G-Van Force TEVan
Mile
s an
d kW
h
Miles Energy (kWh)
Figure APS-1. Old Fleet total mileage and energy use (kWh) for four EVcorts, four G-Vans, oneSolectria Force, and one TEVan.

30
Old Fleet Energy Efficiency
0
0.5
1
1.5
2
2.5
3
Evcort G-Van Force TEVan
Mile
s/kW
h
Figure APS-2. Old Fleet average energy efficiencies for four EVcorts, four G-Vans, oneSolectria Force, and one TEVan.
Old Fleet Operating Costs
$0.00$0.05$0.10$0.15$0.20$0.25$0.30$0.35$0.40$0.45$0.50$0.55$0.60$0.65
EvcortG-VanForceTEVan
Dol
lars
per
Mile
s Energy
Maintenance
Figure APS-3. Old Fleet average operating costs for four EVcorts, four G-Vans, one SolectriaForce, and one TEVan.
The New Fleet
APS’s “New Fleet” is defined to be those vehicles that were purchased after theestablishment of the EV America program (1994). After the first year of EV America testing,APS purchased three US Electricar S10 pickup conversions and three Solectria S10 pickupconversions. These vehicles all had AC drives. After the second phase of EV Americaperformance testing in 1995, APS purchased three additional Solectria pickup conversions andone Solectria Force sedan which was powered by a GM Ovonics Nickel Metal Hydride battery.APS also acquired one Spartan S10 pickup conversion manufactured by Spartan Motors ofLansing, Michigan. The Spartan S10 had an advanced GE AC drive system (motor and inverterpackage). The Spartan was specifically built for the Site Operator Program.
The new fleet accumulated over 100,000 miles (Figure APS-4) during 1995 and 1996. Boththe Solectria and US Electricar pickup conversions encountered severe charger problems thatlater caused premature battery failures. The US Electricar pickups suffered from a design flaw inthe driveline bushing, which caused failure of the bushing and at times, the carrier bearing.Failures of the auxiliary motors in the Solectria pickups were routine, occurring about every5,000 miles. Most of these vehicles exhibited similar energy efficiencies of about 3 miles/kWh(Figure APS-5). The exception was the Solectria Force sedan, with its nickel-metal hydride

31
battery pack; its energy efficiency approached 6 miles/kWh. Similarly, most of the vehicles hadoperating costs exceeding 30 cents per mile, except the Force, whose only reported operatingcosts were for energy (Figure APS-6).
New Fleet Miles Traveled and Energy Use
05000
100001500020000250003000035000400004500050000
USE S-10 Solectria S-10 Spartan S-10 Force (NMH)
Mile
s an
d kW
h Miles Energy (kWh)
Figure APS-4. New Fleet total mileage and energy use (kWh) for three US Electricar S10conversions, six Solectria S10 conversions, one Solectria Force sedan with a Nickel-MetalHydride battery from GM Ovonics, and one Spartan S10 conversion.
New Fleet Energy Efficiency
0
1
2
3
4
5
6
USE S-10 Solectria S-10 Spartan S-10 Force (NMH)
Mile
s/kW
h
Figure APS-5. New Fleet average energy efficiencies (miles/kWh) for three US Electricar S10conversions, six Solectria S10 conversions, one Solectria Force sedan with a Nickel-MetalHydride battery from GM Ovonics, and one Spartan S10 conversion.
New Fleet Operating Costs
$0.00$0.05$0.10$0.15$0.20$0.25$0.30$0.35$0.40$0.45$0.50$0.55$0.60$0.65
USE S-10 Solectria S-10 Spartan S-10 Force (NMH)
Dol
lars
per
Mile
s
EnergyMaintenance
Figure APS-6. New Fleet average operating costs per mile for three US Electricar S10conversions, six Solectria S10 conversions, one Solectria Force sedan with a Nickel MetalHydride battery from GM Ovonics, and one Spartan S10 conversion.
32
Battery Field Testing
The first round of EV America performance testing concluded in November 1994. Amongthe numerous bench mark performance data collected was vehicle range at a constant speed of 45mph (SAE 227A), constant speed at 60 mph (SAE 227A), and range per fuel efficiency drivecycle (SAE J1634). Over 225 electric vehicles (Solectria pickups and sedans, and US Electricarpickups and sedans) were purchased during the first phase of the EV America program byutilities and government agencies. All of these vehicles were powered by Hawker Genesis 38amp-hour VRLA AGM batteries, model G190W. In use, these early vehicles reported asignificant loss in range, at low battery cycles. Proving ground range testing (45 mph constantspeed, SAE 227A) in Phoenix, confirmed an approximate 50% range reduction in a USElectricar S-10, and a 37% range reduction in a Solectria E-10.
An evaluation by Hawker Energy Products concluded that an undercharge conditionexisted in the batteries. The US Electricar S-10 was equipped with a 2-kW integral charger,which charged a 52 module, 21-kWh pack. However, Hawker concluded that a minimum 12-kWcharging rate was required. The Solectria ES-10 was equipped with a 2-kW charger, whichcharged a 36-module, 16-kWh pack. Hawker concluded that a 8-kW charging rate was required.
Phase I Battery/Charger Testing. A field test program was initiated in 1995 for thepurpose of evaluating the performance of the Hawker Genesis batteries with a variety ofchargers. This Phase I testing evaluated the following conductive chargers: 150-kW NorvikMinit charger, 2-kW Solectria charger, and a 3-kW Solectria Charger. A 6.6-kW Delco inductivecharger was also evaluated. Six electric pickup trucks were selected for field testing. None ofthese vehicles were equipped with a battery energy management system to monitor modulesduring charging. Thermal management of the batteries was limited to a few small oven fans inhalf the vehicles. The test program began in May 1995 and terminated in January 1996. Thevehicles were driven in the Phoenix area, where summer daytime temperatures can reach 120°F.
Table APS-2 describes the alignment of chargers and total charge cycles accumulated at theend of pack life. The Norvik Minit charger was used to fast charge two vehicles at an arbitrarilychosen rate of 3C (3 times the one-hour discharge rating of the Hawker batteries). The vehiclescharged by the Norvik charger required periodic equalize charges. Only vehicle 138 (USElectricar S-10) was equalized periodically with the Norvik charger. Norvik charging used 2.45volts per cell for the Genesis battery and equalization was based upon 2.65 volts per cell. Vehicle137 (another US Electricar S-10) was equalized with the Delco inductive charger. The Delcocharger conducted the main charge routine with 2.45 volts per cell and the equalization routinewas based upon 2.56 volts per cell. The Solectria onboard conductive chargers used a 2.45 voltsper cell routine and cell equalization was accomplished with extensive overcharging.
Table APS-3 provides a summary of the battery pack performances and battery modulefailure causes. Although the batteries were the same make and model in each vehicle, there issignificant variability is the number of charge cycles and pack miles that may be attributable tochargers and charge algorithms. In considering the battery performance in this test, it was evidentthat the Hawker Genesis battery can be damaged by low-power charging and the batteryperforms better as charge power is increased. The summer heat in Phoenix did not appear to haveany impact on battery performance with high rate charging. One of the vehicles had a pack fire(vehicle 138) that appeared to be caused by loose battery interconnections. The pack firereinforced the importance of following proper procedures for assembling battery packs.

33
Table APS-2. Phase I electric vehicle chargers and charge cycles. The ES10 models are allSolectria pickups and the S-10 models are all US Electricar pickups. "Cyc" is the number ofcycles on the battery pack.
VehicleNorvik Fast
ChargeOvernight
DelcoOvernightSolectria Equalization
No. Make Rate Cyc Cyc Rate Cyc Type Cyc
133 ES10 3kW 197
134 ES10 2kW 52
135 ES10 2C 59 2kW 54
137 S-10 3C 240 6kW 120
138 S-10 3C 140 Norvik
139 S-10 120
Table APS-3. Vehicle, battery pack charge cycles and miles, and the pack failure reason for thesix vehicles in the Phase I electric vehicle chargers field test. The ES10 models are all Solectriapickups and the S-10 models are all US Electricar pickups.
VehicleNo. Make
Chargecycles
Packmiles Cause of module failure
133 ES10 197 7,500 Corrosion, 12 modules
134 ES10 52 1,200 Thermal run away, 12 modules
135 ES10 103 3,573 Thermal run away, 36 modules
137 S-10 360 16,500 Corrosion, 8 modules
138 S-10 140 4,250 Pack fire due to loose connection, 52 modules
139 S-10 120 3,878 Corrosion, 17 modules
From the results of the Phase I field testing and the autopsy of the modules from thevehicles, it was concluded that the Norvik 3C charging provided the optimal vehicle performanceand the longest battery cycle life. The abrupt failure of the 17 modules in the number 139 vehicle(which were caused by grid corrosion) was hypothesized to be the result of equalization orovercharge at the elevated voltage portion of the implemented algorithm. Coincidentally, afterthe same number of equalization cycles on vehicle 137, which was charged by the Norvikcharger and equalized by the Delco charger, a similar failure mechanism occurred in 8 modules.The Solectria 2-kW chargers produced battery failures due to thermal run away early in batterylife (vehicles 134 and 135). The Solectria 3-kW charger produced failure via grid corrosion(vehicle 133).
Phase II Battery/Charger Testing. Significant cycle life extension has been achievedusing high charging rates in laboratory testing. It has been demonstrated that sealed VRLAbatteries can be rapidly charged with higher energy efficiencies than traditional charging,without detrimental effect to the battery, and with significantly extended cycle lives. It has alsobeen shown that VRLA batteries in laboratory testing given five to ten rapid partial-chargecycles can fully recover their capacity.

34
For years, laboratory testing has been performed to determine the effects of chargingmethods on battery performance in electric vehicle applications. Parameters such as batterycapacity life and grid corrosion have been examined. Results of laboratory testing to date haveindicated that the charging scheme utilized has a direct effect on battery performance. However,testing within laboratories, even when simulated drive cycles are used for charge and dischargetest cycles, does not completely represent the environmental rigors of fleet use. Fleet vehicles donot operate under controlled sets of conditions, rather, traffic conditions, ambient temperature,and operator usage are just a few of the variant conditions impacting battery performance.
Table APS-4 describes the field test fleet used for the Phase II testing. Vehicles 130, 136,137, 114, and 333 were given multiple fast charges each day and the vehicles were operated bydedicated drivers. This method of accelerated aging of the vehicles compresses the testing time.The other vehicles were driven arbitrary routes with arbitrary charge routines. These vehicleswere driven by APS employees while performing normal work missions. Vehicles 131 and 134were driven by meter readers and at the end of the work shift, vehicles 131 and 134 were chargedby the Delco inductive charger. Twice per month, vehicles 131 and 134 were given a 3C chargeon the Norvik fast charger.
Table APS-4. Phase II battery charger field test vehicles and charging scenarios.
VehicleNo. Model Make
Modules inpack
Batterymanufacturer
Norvik chargerate
Overnightcharger
114 S10 DTS 42 Hawker 9C Martin M
333 S10 Solectria 36 Hawker 9C
137 S10 USE 52 Hawker 5C Delco
136a S10 Spartan 24 Optima 5C
136a S10 Spartan 24 GNG 3C
130 S10 Solectria 36 Hawker 3C Solectria
131 S10 Solectria 36 Hawker 3C Delco
133 S10 Solectria 36 Hawker 3C Solectria
134 S10 Solectria 36 Hawker 3C Delco
135 S10 Solectria 36 Hawker 3C Solectria
124 Geo Solectria 15 GMO Solectria
116 TEVan Chrysler 30 Saft 3C Martin M
a. The 136 vehicle was used twice in the Phase II test with battery parts from two manufacturers.
The electric vehicles used for the Phase II testing did not have battery energy managementsystems or battery module monitoring equipment installed. The amount of thermal managementequipment varied among the vehicles. The two vehicles (333 and 114) charged at 9C rates wereequipped with module cooling systems. The 333 vehicle was equipped with high air velocitymanually initiated module cooling. The 114 vehicle was equipped with a Phase Change materialprovided by Shape. The 124, 130, 131, 133, 134, and 135 vehicles had small oven fans toventilate ambient air across the packs and were activated by battery temperatures. Vehicle 116,the TEVan equipped with Nickel Cadmium batteries from Saft, was nearly 100% fast chargedwith minimal equalizations. The 124 vehicle, the Solectria sedan with the GM Ovonics nickel-

35
metal hydride battery pack, was charged by a Solectria 3-kW charger and it was given veryfrequent opportunity charges in its fleet mission. On 6–8 week intervals, the vehicles were takento a local proving ground and given the 60-mile, constant-speed range test (SAE 227 A) toevaluate pack capacity.
The accelerated aging group required extensive use of fast charging. Fast charging occurredat the 3C, 5C, and 9C rates. Daily fast charge cycles varied in number from 1 to 5. Batteryequalizations were varied from every third to every tenth cycle, depending upon the specificvehicle. Hence, the majority of vehicle charging and operations were with partial charge cyclesincluding the overnight charging. Equalization cycles were minimized because of the gridcorrosion found during the Phase I battery autopsy.
Table APS-5 provides a description of the Phase II testing through December 1, 1996. The333 and 114 vehicles were primarily charged at the 9C rate. Vehicle 333 was equalized everysix th cycle by the Norvik charger, while the 114 vehicle was charged overnight by the MartinMarietta 10-kW charger and equalized every fifth charge cycle by the Martin Marietta charger,which incorporates a manually initiated equalization cycle. Equalization voltage on the MartinMarietta charger was 2.5 volts per cell for the Hawker Genesis batteries. During the overnightcycle on the 114 vehicle, the Shape Phase Change material used for pack thermal stability wasfrozen using a standard window air-conditioning unit to circulate air through the battery pack.Although a relatively large number of battery modules were lost by these high-rate charges, fastcharging was deemed to by very promising due to the large number of modules which survivedwithout benefit of individual module charge control. Typical 9C charge rate module failureswere observed to have a hot high-rate venting of a module cell, which was detected by theNorvik charger and the charge was terminated.
Vehicles 137 and 136 were charged at the 5C rate. The 137 vehicle carried HawkerGenesis batteries and it was charged over night by the Delco inductive charger. During everythird Delco charge, the battery was equalized at 2.56 volts per cell. The Delco charger permittedprogramming for automated charge equalization on a specific cycle interval. The 136 vehiclecarried Optima batteries and it was equalized every sixth cycle by the Norvik charger. The 137vehicle operated extremely well, incurring over 100 miles daily (two partial 5C charges daily).At just under 10,000 miles, without any previous battery maintenance, a single module failed. Atthis point, the test on the 137 vehicle was terminated. The 136 vehicle suffered problems withbattery module interconnections, which caused arcing and battery damage.

36
Table APS-5. Phase II battery charger performance results through December 1, 1996.Vehicle
No. Model MakeDays of
operationPackmiles
Packcycles
End oflife
Modulefailures
114 S10 DTS 78 1,772 108 no 2
333 S10 Solectria 165 4,607 200 no 9
137 S10 USE 247 9,984 251 yes 1
136a S10 Spartan(GNB)
279 3,927 97 yes
136a S10 Spartan(Optima)
175 2,658 137 no 4
130 S10 Solectria 367 11,192 399 no 1
131 S10 Solectria 414 3,744 140 no 0
133 S10 Solectria 610 11,355 427 yes 9
134 S10 Solectria 368 8,969 344 no 12
135 S10 Solectria 321 6,125 no 0
124 Geo Solectria 473 12,143 379 no
116 TEVan Chrysler 1,120 11,937 367 no 0
a. The 136 vehicle was used twice in the Phase II test with battery parts from two manufacturers.
The 130 vehicle, which was predominately charged at the 3C rate, performed verysuccessfully. Overnight charges were accomplished with the Solectria 3kW charger. The 130vehicle showed no significant deterioration in range up to the time of its first module failure at11,134 miles. The test protocol for the 130 vehicle was based upon the 137 vehicle test protocolduring the Phase I testing, were the 137 vehicle operated successfully at the 3C charge rate and itwas overnight charged by the Delco charger. The 137 vehicle achieved about 16,500 milesduring the Phase I testing and the 130 vehicle achieved over 11,000 miles during the Phase IItesting and 399 charge cycles. All of the fast charge cycles achieved 80% state of charge within15 minutes. In both cases, the 130 and 137 vehicles did well without thermal management orbattery energy management systems, which, if added to the vehicles, should increase theirperformance.
The 131 and 134 vehicles were driven in meter reading duty missions of about 20 to 25miles per day during the Phase II testing. The 134 vehicle was part of the Phase I testing and itused a Solectria 2-kW charger when it lost 12 battery modules due to thermal run away. The 12modules were replaced and the battery pack underwent numerous fast charge cycles at the 3Crate. It was then moved into the Phase II test program. Both the 131 and 134 vehicles werecharged with the Delco charger at the end of the work day, with equalizations occurring everyfifth cycle. These vehicles were fast charged once every other weekend with the Norvik fastcharger at the 3C rate. Over the test period, their range continued to decrease, until during theearly part of November 1996, the ranges dropped to about 23 miles at a constant speed of 60mph. The 133 vehicle was also continued from the Phase I into the Phase II program. In Phase I,the 133 vehicle accumulated about 7,800 miles on the pack while being charged by the Solectria3-kW charger, at which point the range had fallen to about 25 miles. At this point, the 133vehicle was only charged by the Norvik charger at the 3C rate. The 133 vehicle’s rangeimproved significantly and it was returned to fleet duty where it continued to operate until abruptpack death at 11,355 miles.

37
KANSAS STATE UNIVERSITY
Kansas State University (KSU) is the Program Manager for the Kansas Electric UtilitiesResearch Program (KEURP). The KEURP is an alternative fuel research partnership, responsiblefor developing a regional Alternative Fuel Vehicle Test and Evaluation Center. The members ofthe program are:
• KG&E, A Western Resources Company
• KPL, A Western Resources Company
• Kansas City Power & Light Company
• Midwest Energy, Inc.
• WestPlains Energy
• Sunflower Electric Power Corporation
• The Empire District Electric Company.
The Test and Evaluation Center will research, design, develop, produce, and support themost advanced technology alternative fuel vehicles manufactured in America. The KSU Test andEvaluation Center will serve as the genesis of a long-term process, a process that will replacepetroleum-based vehicles as America’s primary individual transportation systems. Whilemaintaining a position of fuel neutrality, the University will make every effort to assist thedevelopment of electric drive technology while working to find flex ible fuel and energy systemsto power the high efficiency electric drive trains that will be an integral part of any advancedtechnology vehicle.
Transportation Design and Manufacturing (TDM), a major supplier to the domesticautomobile industry, has established a research, development, and manufacturing base inManhattan, Kansas. KSU expects TDM’s new Alternative Fuel Vehicle Production Facility toserve as the cornerstone in establishing the region as a leader in the development of advancedvehicles.
Field Data Collection and Vehicle OperationsKSU, in partnership with TDM, has been collecting data on both of KSU’s Ford EVcorts,
and a TDM Ford Ranger electric vehicle.
EVcorts
The 1993 Ford EVcorts are Ford Escorts that were converted to electric vehicles by theSoleq Corporation, of Chicago, Illinois. These two vehicles, except for minor component failures(such as battery cables or system fuses) have been routinely operated without incident sinceinitial purchase. The vehicles have been involved in a number of serious collisions, and, althoughsignificant body damage occurred, the vehicles were available for use once body repairs werecompleted. One of the EVcorts has been transferred to Kansas City Power and Light for use intheir demonstration program, and the other EVcort was transferred to the West Plains EnergyCompany.
The Soleq EVcorts have proven to be highly reliable vehicles, with limited range and highinitial costs. The EVcorts were operated over 3 years, and except for minor maintenanceproblems that could be fixed in less than two hours once parts were available, were 100%

38
operational. The Soleq vehicles have proven to be excellent prototype vehicles, but they will notlikely ever see commercial production. The two vehicles were driven a total of almost 13,000miles during the 3 years and they have had an average energy efficiency of 1.56 miles/kWh(Tables KSU-1 & KSU-2).
Table KSU-1. Operating miles and energy totals for the EVcort number 151. The quarterly datais for June 1995 through June 1996, and the total is accumulated 3-year vehicle totals.
Quarter End Date MilesDailyMiles Charges
Miles/Charge kWh
Miles/kWh
1st 09/30/95 888 11.1 80 11.1 479 1.9
2nd 12/13/95 1,387 16.1 86 16.1 951 1.5
3rd 03/31/96 300 6.0 50 6.0 306 1.0
4th 06/30/96 220 7.9 28 7.9 141 1.6
3-year Totals 9,182 16.3 585 16.3 5,827 1.6
Table KSU-2. Operating miles and energy totals for the EVcort number 152. The quarterly datais for June 1995 through June 1996, and the total is accumulated 3-year vehicle totals.
Quarter End Date MilesDailyMiles Charges
Miles/Charge kWh
Miles/kWh
1st 09/30/95 403 6.1 66 6.1 189 2.1
2nd 12/13/95 449 7.1 63 7.1 428 1.0
3rd 03/31/96 447 6.0 68 6.0 287 1.6
4th 06/30/96 268 8.3 32 8.3 161 1.7
3-year Totals 3,616 12.0 445 12.0 2,387 1.5
TDM Ford Ranger
The 1996 Ford Ranger Electric was the first conversion prototype produced by TDM. Asshould be expected, there was a large number of “rough edges” on the vehicle. A significantamount of time was spent repairing components, installing systems necessary for properoperation, or modifying system capability to maintain the vehicle’s operations. The only reportedoperations data is displayed in Table KSU-3, and it includes the vehicle’s energy use of 2.3miles/kWh.
KSU reported on several operations and maintenance issues with the vehicle; in summary,these include the following issues and problems. It must be remembered that this vehicle was thefirst prototype constructed and some or all of these problems may be of a singular nature.
• Main controller board defect causing auxiliary battery charging failures
• Electronic speedometer failures
• Wiring harness circuit failure

39
• Poor quality fuse used in the charger requiring replacement with a higher quality fuse
• Defective oil cooling pump
• AC induction motor upgraded from 65 to 95 horsepower
• High battery pack temperatures (exceeding 150°F), caused by chemical reactionsduring both charging and discharging. The charging time is increased and the pack lifewill be decreased. However, the vehicle range is dramatically increased resulting in around trip of almost 150 miles.
Table KSU-3. Operating miles and energy totals for the TDM converted Ford Ranger electricvehicle number A5. The quarterly data is for October 1995 through June 1996, and the total isfor the 3 quarters. (Because this vehicle is not equipped to directly record kWh supplied to thevehicle while charging, the data is interpolated from other information.)
Quarter End Date Miles DailyMiles Charges
Miles/Charge kWh Miles/kWh
1st -- -- -- -- -- -- --
2nd 12/13/95 250 8.3 30 8.3 120 2.1
3rd 03/31/96 2,190 27 82 27 920 2.4
4th 06/30/96 1,947 46 42 46 837 2.3
Accumulated Totals 4,387 27 154 27 1,877 2.3

40
LOS ANGELES DEPARTMENT OF WATER AND POWER
IntroductionThe Los Angeles Department of Water and Power (LADWP) is a municipal utility serving
the citizens of Los Angeles, California. The LADWP has promoted the use of electrictransportation for more than 8 years, both as part of Los Angeles' overall air qualityimprovement effort and as a means of improving the region’s economic competitiveness throughthe creation of new industries.
LADWP's electric transportation program continues to extend beyond vehicle deploymentto include infrastructure and public transit development, public education and awareness, andlegislative and regulatory activities.
Vehicle Operations and ActivitiesLADWP has maintained and operated 20 electric vehicles since the fourth quarter of 1994.
These vehicles consisted of six G-Vans, four Chrysler TEVans, five U.S. Electricar pickuptrucks, and five U.S. Electricar Prizms.
U.S. Electricar Pickup Trucks
LADWP took delivery of the five U.S. Electricar pickups during the fourth quarter of FY1994. Real-world driving tests performed on the vehicles showed a range of 50 to 60 miles undernormal driving conditions. A complete charge consistently requires approximately 21 kWh ofenergy and 7 hours of charging time. The vehicles have logged almost 20,000 miles since theirdelivery.
During LADWP’s involvement with the Site Operator Program, several issues wereaddressed with the pickups, including the following:
• Ground Fault Circuit Interrupter Incompatibility. All U.S. Electricar vehicles showeda basic inability to charge on an outlet protected by a ground fault circuit interrupter(GFCI). This incompatibility causes the GFCI on the 220-volt receptacle to trip whilethe vehicle is charging. U.S. Electricar has never resolved this problem, and all of thecharging stations used to charge the pickups had to be retrofitted with the "G-FIX"device manufactured by EVI. The “G-FIX” cancels out electrical noise generated bythe electric vehicle controller during charging. The vehicles cannot be successfullycharged on GFCI equipped receptacles without this device.
• Defective Battery Modules. Soon after vehicle delivery, some of the pickups exhibitedinadequate ranges due to defective battery modules. The LADWP replaced batterymodules in several of the battery packs. Premature module failure was attributed to theintegrated charger under-charging the battery packs. The charging algorithm wasmodified to fix this problem.
The U.S. Electricar pickups exhibited sluggish performance, especially on hills and whencarrying a load. Because of this, one of the trucks was retrofitted with an automatic transmission,and two other trucks were retrofitted with 5-speed manual transmissions. These modificationsimproved performance considerably. The pickup retrofitted with the automatic transmissionshowed a slight decrease in range (under 5 miles), while the trucks with manual transmissionsshowed no range reduction over the stock vehicle. Air conditioning units were also installed on

41
two of the pickups. Mobile Data Acquisition System (MDAS) units were installed in three of thetrucks.
The MDAS units operated somewhat unreliably. In some cases, they caused the auxiliarybatteries in the vehicles to fail after overnight charging, because the MDAS units sometimeswould not shut down when battery pack charging was completed. The data would also often becorrupted, making evaluation impossible. Some of the data errors were caused by floppy disksthat were damaged during use. Because of the problems with the MDAS units, LADWP decidedto install hard cards to replace the often unreliable floppy discs used for data storage. Since thehard cards stay with the MDAS unit, confusion was eliminated concerning configuration files,which are often a problem when using multiple floppy disks on multiple vehicles.
After installation of the hard cards on the MDAS units, the problem of unexpected unitfailures still persisted until the first quarter of 1997. At that time LADWP discovered, perdiscussions with the main processor board manufacturer, that bad memory chips had beeninstalled on some boards back in 1995 when the units were delivered. These chips would failintermittently when they heated up during normal vehicle operations. The memory chips wereimmediately replaced and no unexpected failures have occurred since.
Chrysler TEVans
LADWP has logged over 15,000 miles on four Chrysler TEVans since the fourth quarter of1994, but use of these vehicles has been limited due to their very poor reliability. The vehicleshave experienced significant problems from the first day that LADWP received them, with mostof the problems being of a repetitive nature and related to design flaws. Several problems wereencountered early, but most have been corrected. One of the problems was the inability to chargethe vehicle from a GFCI-equipped, single-phase outlet. These safety devices are required by theCity of Los Angeles Building Code on all electric vehicle charging facilities. Other problemsincluded repeated failures of the motor controller units and auxiliary power units.
U.S. Electricar Sedans
The five U.S. Electricar sedans were driven under a variety of conditions. The sedansgenerally continued to maintain a 50- to 55-mile range under city/highway conditions,sometimes dropping to 40 miles when the battery packs had started to deteriorate. One of thevehicles was used daily as an employee car pool vehicle. A full charge takes 6 to 8 hours,requiring 17 kWh of energy. The sedans logged a total of 35,000 miles since delivery during thefirst quarter of 1995. The following problems were encountered with the U.S. Electric sedans:
It was determined that the charging algorithm provided with the sedans was underchargingthe batteries. As a result, one battery pack was damaged and subsequently replaced. LADWP,with input from the manufacturer, modified the charging algorithm on another sedan.
LADWP service technicians adjusted the state-of-charge gage to increase its accuracy. Thegauge is still inaccurate when the batteries are nearly exhausted; the gauge can show as much asone-quarter of usable battery capacity remaining while the vehicle has already gone into areduced-performance mode.
Hill climbing ability for the sedans is adequate for most areas in Los Angeles, however,there are some hills that can only be climbed very slowly, and in one extreme case cannot beclimbed at all.

42
Other Electric Vehicles
LADWP continued to support the maintenance and operation of six G-Vans. Two of the G-Vans are being operated at the Los Angeles International Airport, and the other four are currentlyoperating in LADWP's fleet.
The Unique Mobility minivan is not operational.
43
ORCAS POWER AND LIGHT
IntroductionThe Orcas Power and Light Company (OPALCO) is a rural electric distribution
cooperation serving 19 islands in San Juan County, Washington. The county has a population of12,000 and a two-lane road system with speed limits between 25 and 40 miles per hour. In 1995,the Sustainable Technology Center was completed. This campus incorporates several state-of-the-art technologies aimed at reducing building and tenant costs. Electric Transportation isincluded as a feature of the Center. Seventy-two percent of the electric distribution system in SanJuan County is underground. At one electric vehicle for every 750 internal combustion engine(ICE) vehicles, San Juan County boasts the highest ratio of electric vehicles to ICE vehicles ofany county in the United States. Early in 1991, the Board of Directors encouraged OPALCOmanagement to explore the possibility of operating electric vehicles in San Juan County.OPALCO joined the Site Operator Program in 1991, with the intent of purchasing and operatingelectric vehicles. OPALCO also documented their experiences and educated the public onelectric vehicle operation.
Operations ResultsOPALCO owned and operated three electric vehicles as part of the Site Operator Program.
The vehicles were a General Motors G-Van, which is a full-size, 1-ton General Motors Vanconversion; a Jet Escort, which is a Jet Industries conversion of a Ford Escort; and a SolectriaForce, which is a GEO Metro glider that has electric vehicle components added by the SolectriaCompany of Arlington, Massachusetts. Information about each vehicle is provided below.
General Motors G-Van
This vehicle was selected for its large space and seating capacities. The G-Van was adependable vehicle with a consistent range. This vehicle was traded for the Jet Escort. The G-Van did have a few problems, including the following:
• The motor and controller were replaced because of a motor failure
• Intermittent starting required relay replacements
• The 4 x 4 x 4-ft, 300-lb off-board charger did not allow any opportunity charging inthe course of a trip
• Some drivers, used to driving compacts on Orcas Island, had difficulty with the sizeand weight of the van.
Solectria Force
This automatic AC-drive vehicle is the vehicle of choice among drivers, and has highestuse when measured by quarterly miles driven (Figure OCR-1). The Solectria is also the mostenergy efficient of the three vehicles, averaging 2.7 miles/kWh over the 5-year program period(Table OCR-1). The Solectria also had the best energy efficiency on a quarter-by-quarter basis ofthe three vehicles in the program (Figure OCR-2). However, an inadequate heater and defroster,and regenerative braking on ice make it less desirable to drive during the winter months. TheForce’s relative light weight, 2,400 lb, makes it responsive and lively. After two battery packreplacements, OPALCO concluded that charging at every opportunity and keeping the battery
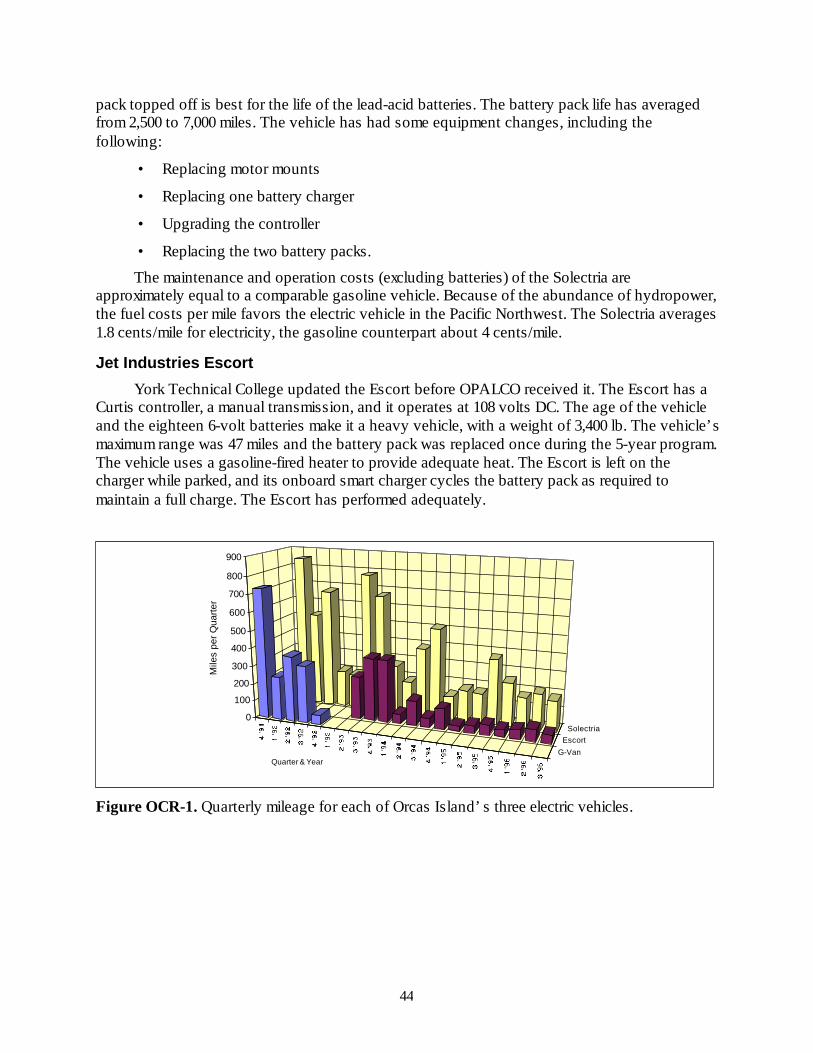
44
pack topped off is best for the life of the lead-acid batteries. The battery pack life has averagedfrom 2,500 to 7,000 miles. The vehicle has had some equipment changes, including thefollowing:
• Replacing motor mounts
• Replacing one battery charger
• Upgrading the controller
• Replacing the two battery packs.
The maintenance and operation costs (excluding batteries) of the Solectria areapproximately equal to a comparable gasoline vehicle. Because of the abundance of hydropower,the fuel costs per mile favors the electric vehicle in the Pacific Northwest. The Solectria averages1.8 cents/mile for electricity, the gasoline counterpart about 4 cents/mile.
Jet Industries Escort
York Technical College updated the Escort before OPALCO received it. The Escort has aCurtis controller, a manual transmission, and it operates at 108 volts DC. The age of the vehicleand the eighteen 6-volt batteries make it a heavy vehicle, with a weight of 3,400 lb. The vehicle’smaximum range was 47 miles and the battery pack was replaced once during the 5-year program.The vehicle uses a gasoline-fired heater to provide adequate heat. The Escort is left on thecharger while parked, and its onboard smart charger cycles the battery pack as required tomaintain a full charge. The Escort has performed adequately.
G-VanEscort
Solectria0
100
200
300
400
500
600
700
800
900
Mile
s pe
r Qua
rter
Quarter & Year
Figure OCR-1. Quarterly mileage for each of Orcas Island’s three electric vehicles.

45
Table OCR-1. Total mileage and energy use for Orcas Island’s three electric vehicles.
Totalmiles
Miles/day
Miles/month
Averagemiles/kWh
GM G-Van 1,714 14.8 115 0.6
Solectria Force 7,170 12.5 150 2.7
Jet Industries Escort 1,645 7.7 40 0.8
Total 10,529
G-VanEscort
Solectria0
0.5
1
1.5
2
2.5
3
3.5
4
4.5
5
Mile
s pe
r kW
h
Figure OCR-2. Miles/kWh for each of Orcas Island’s three electric vehicles. The data isdisplayed by quarter years.
Public ActivitiesGetting the public behind the wheel of an electric vehicle was an important goal of the
OPALCO electric vehicle program. In addition to the numerous ride and drive events, San JuanCounty residents have a standing invitation to stop by and drive an electric vehicle anytime.Residents’ responses generally fall in the following categories:
• Is it running?
• It’s so quiet!
• You really have to push on the brakes
• It’s not too peppy.
Regular drivers are those who are using or have used an electric vehicle on a daily basis forat least thirty days. In addition to initial responses similar to those above, these driverscommented as follows:
• A back-of-the-mind worry about running out of fuel
• Negative effects of cold weather, reduction of range, and inability to heat/defrost
• Grew to enjoy “one-footed” driving of regenerative braking

46
• Made a game of seeing how few amp hours a specific trip could be accomplished with
• A sense of contributing towards the improvement of the environment
• Considered distance of trip, state of charge, and availability of charging at thedestination.
Other opportunities to reach the public have included OPALCO employee education, localmedia, country fairs, Seattle Auto Show, Earth Day celebrations, state legislative rallies, highschool driver training classes, Fourth of July parades, and merely driving the vehicles that areclearly marked “Electric Vehicle.” Numerous feature stories on the electric vehicle program inlocal newspapers and the novelty of the charging stations caused predictable small townconversations. As a result, over 75% of the adult population of San Juan County is aware thatOPALCO operates electric vehicles. Another measure of the public’s response to theOPALCO/DOE electric vehicle program is the number of electric vehicles operating in San JuanCounty. Since the beginning of the program, 11 electric vehicles have taken to the roads of SanJuan County.

47
PACIFIC GAS AND ELECTRIC CO.
Pacific Gas and Electric (PG&E) is actively supporting the use of electric vehicles, and itsexpanding electric vehicle program is addressing the following :
• Vehicle development and demonstration
• Vehicle technology assessment
• Infrastructure evaluation
• Participation and support of various electric vehicle organizations and events.
The PG&E electric vehicle program had 18 vehicles in its traditional light-duty electricvehicle fleet during 1996. These included 10 active vehicles that were driven a total of 18,755miles between January and October 1996.
Vehicle Operations
Ford Ecostars
PG&E operated five Ecostars during the first half of 1996. The Ecostars were returned toFord during June 1996. The Ecostars were used throughout the service territory by meter readers,customer service representatives, electrical inspectors, parts delivery personnel, and staffcommuters. They were typically charged at the PG&E service center at 240 volts, although theEcostars were occasionally slow-charged at home by employees at 110 volts. The 90+ milesrange and 70 mph top speed have made the Ecostars very popular vehicles with employees. Thefive Ecostars were not all used during each month (Figure PGE-1), but they did accumulate over5,000 miles total during the first 6 months of 1996.
Figure PGE-1. Mileage per month for the five Ecostar minivans in Pacific Gas & Electric’selectric vehicle fleet.
Honda Civics
PG&E only operated three Honda Civics at any one time. However, a total of fourCivics were in PG&E’s possession during 1996; two of the vehicles were switched and this is
0
100
200
300
400
500
600
700
800
900
1000
Mile
s pe
r m
onth
#34 #35 #37 #38 #06
Ecostar Vehicle No.
Jan. Feb. March April May

48
reflected in vehicles #13 and #17 only reporting miles driven for parts of 1996 (Figure PGE-2).The Honda Civic fleet was driven 8,843 miles during the reported 10-month period. The Civicsexhibited ranges of 35-40 miles per charge with their lead-acid battery packs. The Civics did nothave any failures, only requiring scheduled preventative maintenance. Vehicle #16 received anickel-metal hydride battery pack during 1996. The monthly average miles driven went from 389miles with the lead-acid battery pack to 570 miles per month with the nickel-metal hydride pack,a 47% increase.
Toyota RAV4
Since the first quarter 1996 arrival of the RAV4, it has been driven a total of 4,844 miles(Figure PGE-3) and has been used regularly for demonstrations and fleet applications withoutany problems.
Figure PGE-2. Monthly mileage for PG&E’s four Honda Civic electric vehicles.
Figure PGE-3. Monthly mileage totals by car type for PG&E’s electric vehicles. PG&E had oneRAV4, four Honda Civics, and five Ford Ecostars. The Ecostars were not driven after May.
#13
#17
#15
#16
0
100
200
300
400
500
600
700
800
Mile
s pe
r m
onth
Honda Civics vehicle no.
0
250500
7501000
12501500
1750
20002250
25002750
30003250
3500
Jan. Feb. March April May June July Aug. Sept. Oct.
Mile
s pe
r m
onth
Hondas
Ecostars
RAV4

49
U.S. Electricar Chevy S-10s
PG&E has in its possession five U.S. Electricar conversions of the Chevy S-10. Thesevehicles have not operated in the past in a satisfactory manner and they were scheduled for thefollowing component changes:
• A Wavedriver controller/charger was to be installed in one pickup, but due tooperational difficulties, the system could not successfully recognize the batterytechnology. Various software and E-Prom problems were experienced as well.
• A 5-kW Coherent Power charger, designed to recondition onboard batteries, was to beinstalled on a second vehicle, however, the circuitry had to be redesigned to preventthe charger from overcharging the batteries.
• The Hawker batteries were to be replaced in a third pickup with an ElectrosourceHorizon battery pack and a Badicheq battery management system with the intention ofmodifying the technology to accept power from a Wavedriver charger. Technicaldifficulties required sending the Badicheq system back to the manufacturer for repair.A new E-Prom was installed.
• The fourth pickup is scheduled to receive a new Hughes charger.
Other Vehicles
PG&E is in the process of transferring its three G-Vans to Cal Poly State University andthe City of Santa Rosa.
PG&E is a partner in a project to develop a Narrow Lane Vehicle, allowing a single lane tobe divided into two traffic lanes; and a project to develop a Fleet Electric Vehicle for use as anin-town delivery vehicle. PG&E is also supporting a 22-vehicle station car demonstration using aNorwegian Citi car for commuting to and from train stations. The station car test is scheduled toinclude 40 vehicles.
PG&E is supporting the use of 31-ft (Specialty Vehicle) and 35-ft (APS Systems) electricbuses in Yosemite National Park. Both of the buses use Trojan quick-charge battery packs. Asecond electric bus project is the Berkeley demonstration project, which is using seven 22-ft U.S.Electricar shuttle buses.

50
PLATTE RIVER POWER AUTHORITY
This Program participant did not provide input to the final report.

51
POTOMAC ELECTRIC POWER COMPANY
IntroductionThe Potomac Electric Power Company (PEPCO) is an investor-owned electric utility
servicing approximately 2 million people in the Maryland and Washington, D.C. area. Themajority of PEPCO’s service area has been classified as a serious ozone non-attainment area andis part of the Northeast Ozone Transport Region. Amendments to the Clean Air Act require boththe District of Columbia and the state of Maryland to take significant steps to reduce ozoneemissions over the next 10 years. In addition, as an alternative fuel provider under the EnergyPolicy Act, PEPCO is purchasing electric vehicles to meet the requirements for fleet conversionto alternative fuel vehicles. PEPCO formed its electric vehicle program in 1992 and subsequentlybecame a member of the Site Operator Program.
PEPCO has established special electric vehicle rates for both of its jurisdictions. For theDistrict of Columbia, the experimental electric vehicle time-of-use rate is 2.795 cents per kWh inthe summer and 2.705 cents per kWh in the winter. In Maryland, the experimental time-of-userate is 2.512 cents per kWh. A dedicated meter is installed to measure the energy used to chargeelectric vehicles. The PEPCO electric vehicle program is focused on three objectives: revenue,environment, and technology.
Revenue
PEPCO is committed to encouraging the commercialization of electric vehicles as a sourceof future revenue growth. During the last few years, PEPCO has played a key role in developingnational commercialization strategies for electric vehicles through PEPCO’s leadership in EVAmerica and the Electric Transportation Coalition. EV America is an organization of utilitiesthat PEPCO helped establish in order to develop common technical specifications and vehicletesting procedures to ensure that only quality, road-worthy vehicles are brought to themarketplace. The Electric Transportation Coalition is an organization committed to helpinglaunch the market for electric vehicles across the United States.
Environment
PEPCO is committed to helping reduce mobile source emissions by encouraging thecommercialization of electric vehicles. PEPCO intends to purchase a total of 25 new electricvehicles for use in its fleet, to comply with the Energy Policy Act as well as to help stimulate aself-sustaining market for electric vehicles.
Technology
PEPCO expects its involvement with electric vehicles to continue to benefit the companyfrom a technology monitoring point of view. Much of the technology being developed forelectric vehicles has direct application to PEPCO’s core electricity business, e.g., batteries,flywheels, capacitors, fuel cells, turbines, and advanced power electronics.
DemonstrationsDuring the spring of 1996, PEPCO worked closely with General Motors in a program
called the GM PrEView Drive Program. The PrEView Drive Program was a market researchstudy for electric vehicles using General Motors’ prototype vehicle, the Impact, for test drives.Sixty of PEPCO’s customers were selected to drive Impacts for 2-week trial periods. Through

52
the PrEView Drive Program, General Motors gained valuable information about consumerpreferences and driving patterns, consumers learned about electric vehicles, and PEPCO learneda great deal about infrastructure requirements.
An additional success of the PrEView Drive Program was the visibility it received in theWashington D.C. area. During the course of the Program, PEPCO performed over 250 electricvehicle demonstrations with the Impacts. Audiences ranged from high-ranking governmentofficials to school children. Notable demonstrations included: the governor of Virginia, severalmembers of congress, members of the Renewable Energy Caucus, members of the local andnational media, as well as local business leaders. In addition, the general public had manyopportunities to see the Impacts via sidewalk demonstrations, county fair exhibits and parades,and several television news stories.
PEPCO is committed to helping all of the automobile manufacturers acquaint potentialcustomers with electric vehicles. To facilitate this, PEPCO has hosted joint marketing activitieswith automobile manufacturers by helping to display electric vehicles to local fleet managers andassisting in the coordination of Ride and Drives for fleet managers and the general public.
Vehicles/Components/Batteries
In 1996, PEPCO operated a total of 15 electric vehicles. Twelve of the vehicles wereImpacts, and the other three vehicles were Solectria E-10 pickups. The Solectria E-10s weredelivered to PEPCO in 1995 as part of the EV America field test evaluation. Two of thesevehicles were 1995 models and the third was a 1994 model. All three of the vehicles wereequipped with Mobile Data Acquisition Systems for on-board data acquisition of operatingparameters. One of the pickups (number S07) was in service with the Architect of the Capital,the second pickup (S06) was operated as a mail delivery vehicle in PEPCO’s fleet, and the thirdvehicle was operated as a commuter and demonstration vehicle.
Vehicle range and performance was measured by operating the vehicles on a ten-miledriving loop on local streets and a highway in the District of Colombia. Through the use of thisbench mark, it was determined that the batteries in the S06 vehicle were not providing theexpected energy capacity. Through consultation with Solectria, it was determined that thebatteries were from different manufacturing runs and they did not have consistent characteristics.The entire pack was replaced under warranty by Solectria. During the course of installing thenew pack, one of the connectors was improperly installed and damage occurred to the frontportion of the battery pack. The front portion was subsequently replaced with sequentialbatteries. The trouble-shooting, negotiation, and pack replacement activities covered a span offive months and it was responsible for the low vehicle mileage.
The three pickups were driven a total of 650 miles during 1996 and they used a total of 154kWh of energy for charging (Figure PEPCO-1). The three vehicles had a combined energyefficiency of 4.2 miles/kWh during 1996 (Figure PEPCO-2).

53
Figure PEPCO-1. Total miles driven and charging energy (kWh) for the three Solectria E-10pickups in the PEPCO fleet during 1996.
Figure PEPCO-2. Energy efficiencies, in miles/kWh, for the three Solectria E-10 pickups in thePEPCO fleet during 1996.
During 1996, PEPCO’s three Solectria E-10 required a combined total of 110 hours ofmaintenance (Table PEPCO-1). The three vehicles averaged only 5.9 miles per each hour ofmaintenance performed. On a per-miles-driven basis, the vehicles incurred 16.9 hours ofmaintenance for each 100 miles driven. Note that not all the maintenance activities were directlyrelated to electric component maintenance. For example, over 35 hours were required forinstalling a bed liner, a fire extinguisher, and a bed cap, as well as for vehicle licensing andregistration-related inspections.
Energy Efficiency
00.5
11.5
22.5
33.5
4
4.55
S06 S07 S08
Mile
s pe
r kW
h
PEPCO Miles Driven and Energy Use
0
50
100
150
200
250
300
S06 S07 S08
Miles Energy (kWh)

54
Table PEPCO-1. The 1996 maintenance requirements for the three Solectria E-10 pickups in thePEPCO fleet.
Vehicle Date Description of Work Labor Hours
S06 03/26 Record serial numbers of batteries 10.50
05/06 A level preventive maintenance 1.00
05/28 Replace inoperative PS pump 1.50
06/25 Remove and reinstall all batteries 6.00
08/01 Install cap, backup alarm, fire extinguisher 17.40
08/29 Install brushes in PS motor 0.50
09/05 Washington D.C. inspection 3.75
11/13 A level preventive maintenance 2.00
Total 42.65
S07 02/23 Check and test batteries 12.00
03/12 Check batteries 4.50
03/26 Check batteries 8.00
05/06 A level preventive maintenance, C level p.m. also 1.50
08/29 Install brushes in PS motor 0.50
09/05 Washington D.C. inspection 3.75
09/19 Install bed liner 7.50
Total 37.75
S08 05/24 Repair emergency brake cable problem 1.00
05/24 Repair air conditioner, replace bad relay 12.00
06/14 A level preventive maintenance 1.00
08/24 Check PS motor for brush fix, not needed 0.50
09/09 Washington D.C. inspection 4.00
09/09 Repair A/C, replace relay, repair regen. and wiring 2.00
11/13 A level preventive maintenance 1.00
12/05 Replace fuse in 110 charging, repair ground 8.00
Total 29.50

55
SANDIA NATIONAL LABORATORY
HistoryThe Sandia electric vehicle fleet was created in 1981, when the DOE supplied Sandia with
seven electric vehicles, manufactured by “Jet” Industries of Austin Texas. The seven vehicleswere called Electricas, and they were electric vehicle conversions of the two-door Ford Escortsedan (Table SNL-1). Four additional Electricas were obtained in 1986 from the U.S. Navy;these were upgraded before being placed in service. A twelfth Electrica was obtained from thePublic Service Company of New Mexico, and it was added to the Sandia fleet after upgrading.During 1990, the entire electric vehicle fleet had state-of-art speed controllers installed.
Table SNL-1. V ehicle specifications for the Sandia fleet of Electricas.
Parameter Value
Weight 3,300 lb
Model Ford Escort, 2-door, 4 passenger sedan
Motor 20 HP series D.C., 120 volt
Transmission 4-speed manual
Battery pack 16, 6 volt deep discharge lead-acid batteries
Auxiliary battery 12 volt lead-acid, supplied voltage for controller logic and ancillaryequipment
Controller Solid-state, variable-speed, 80-120 volts D.C., 400 amp. Max
Acceleration 0 to 50 mph, 12 seconds
Range Up to 40 miles
Top speed 65 mph
Energy efficiency On-road, 0.8 to 1.3 miles/kWh
A preventive maintenance program was initiated early on to maximize the life of theElectricas. Every 4 to 8 weeks each vehicle was inspected by the electric vehicle maintenancecontractor. The batteries were cleaned and watered, and any defective or marginal componentwas repaired or replaced. The battery packs were replaced as needed, approximately every 2years. The maintenance contractor also responded to on-road emergency failures. The aggressivemaintenance program has resulted in very few on-road failures. The preventative maintenanceprogram has proven to be very effective and the costs have been lower than expected; the annualcost has been $5000–$8,500 for all twelve vehicles, or about $562 per vehicle, per year. Inaddition to the reasonable maintenance cost, the fleet has been accident-free.
56
Fleet ProblemsThe fleet has experienced a variety of problems, including the following:
• Erratic state-of-charge (SOC) indicators, caused by aging electronic components. Dueto inoperable SOC meters, the miles per vehicle were not as great as desired, whichtherefore led to the reluctance of many drivers to use these vehicles. A CurtisInstruments Model 986 SOC system has been evaluated and found satisfactory. It hasa current integrator that uses a microprocessor to record both the charge and dischargecycles and displays the battery capacity. The display uses a 10-bar LED to clearlydisplay the state-of-charge. This system has been procured and is being installed in all12 vehicles.
• Failure of the 12-volt auxiliary battery system, caused by inadequate chargercapabilities.
• The emergency pull-out switch (kill switch) is occasionally pulled by drivers thinkingit is the parking brake. This is a cause of poor human engineering in componentplacement.
• Exhaust fan failure, caused by acid vapors destroying the fan impellers.
• Some battery compartments are showing the results of aging and effects of exposure tobattery acids.
• Faulty microswitch in the charger receptacle, caused by sand or dirt. This switchprevents moving the vehicle with the charge cable attached.
• Faulty microswitch in power brake vacuum sensing unit. This switch fails in the “on”position, which means the vacuum pump runs continuously, but does not create asafety problem.
• Age of all vehicles is approaching 16 years old, making it difficult to obtain specialspare parts and components. None of the air-conditioning units are operating due toold design and unavailability of replacement parts.
• The heaters are VW 8,000 BTU gasoline units. These are difficult to keep operationaldue to failing logic circuits, fuel pumps, and clogged fuel lines.
• Chargers failing to turn off after reaching traction pack voltage (122 volts), caused bythe failure of electronic components in the logic board due to age and heat.
Fleet PerformanceAs of October 1996, the Sandia electric vehicle fleet had accumulated over 120,000 miles
and the fleet energy efficiency for the 12 Electricas was 1.1 miles/kWh (Table SNL-2).

57
Table SNL-2. Sandia electric vehicle fleet performance as of October 1996.
Vehicle Odometer kWh Miles/kWh
E-22410 10,998 8,752 1.3
E-22411 8,887 9,934 0.9
E-22412 11,153 11,261 1.0
E-22413 15,395 8,142 1.9
E-22414 11,139 11,422 1.0
E-22415 14,300 13,656 1.0
E-22416 6,922 5,793 1.2
E-27433 12,391 10,678 1.2
E-27434 8,570 7,703 1.1
E-27436 8,549 10,464 0.8
E-27440 10,126 10,648 1.0
E-27661 5,744 5,012 1.1
Totals 124,174 113,465 1.1
Lessons Learned and Causes of Failures• Traction battery failures were caused by:
− Manufacturing defects
− Temperature extremes
− Lack of ventilation
− Mismatched modules
− Deep discharge
− Overcharging
− Undercharging
− Low electrolyte level
− Shock of vibration.
− The auxiliary battery failures were caused by the above plus the following:
− Not large enough capacity for auxiliary load
− Not being charged separately from the traction pack charger.
• The high current cables and battery connectors have fused and or melted down due tothe following:
− Improper size, capacity

58
− Dirt, corrosion at interconnection causing high resistant contact
− Connections improperly tightened
− Overheated due to high contact resistance
− Inadequate air flow.
• Most battery compartments have fan exhaust systems. It is a must that a negativepressure be maintained in the compartment. As a result, acid vapors are exhaustedwhich destroys the exhaust fans impellers. These fans are replaced every 6–9 months.
• Matching the charger to the required manufacturers’ battery signature is one of themost important features to be addressed in an electric vehicle. The Electricas have a96-volt traction system. The biggest failure is the charger failing to shut off whenreaching the traction pack terminal voltage of 122 volts. Also, sometimes the back-up16-hour mechanical timer fails. The charger failures are caused by aging components(defective) in the logic board. A few diodes have failed but that is rare.
• The original Anderson state-of-charge system on the Electricas were very satisfactory;the accuracy was +/- 10-15%. However, components aged and units became erratic orcompletely failed.
• There are two different microswitches in the Electricas. One is in the power brakevacuum sensing unit. When this switch fails, it fails in the “on” position and thevacuum pump runs continuously instead of shutting off at a pre-determined vacuum.However, this does not cause a safety problem since the vehicle always has vacuum forthe power brakes.
The other microswitch is located in the charge receptacle (220 volt). With the 220-voltcable attached, it opens up the key circuit for running and prevents the driver fromoperating the car with the cable attached.
• The heaters are all VW gasoline fueled units. They are very complex and verysensitive to dirt, vibration, heat, etc. and fail frequently.
• Most drivers use “opportunity” charging and usually the battery pack is not down to80% SOC. As a result, much energy is wasted on converting water into hydrogen,oxygen, and heat. That is obvious when the kWh/mile exceeds 0.900.
Future Program ActivitiesSandia will continue to maintain the viability of their electric vehicle fleet by continuing
the preventive maintenance program, upgrading components when necessary, and replacing oldor marginal battery packs. This will include the evaluation of new battery packs. New CurtisInstruments Model 986 SOC systems are being installed in the 12 Electricas. DC-to-DCconverters are being evaluated to replace the current battery charger for the 12-volt auxiliarybatteries to help increase vehicle reliability. Smaller, high frequency battery pack chargers willbe evaluated for possibly increased energy efficiency and vehicle reliability.

59
ConclusionsWhile the Electricas are older vehicles that do not now represent the state-of-the-art,
several positive conclusions can be drawn from the Sandia electric vehicle program.
• The Sandia electric vehicle program has proved to be very successful at providingtransportation to Sandia personnel.
• The Sandia vehicles have demonstrated that electric vehicles can be a very efficientmeans of transportation.
• Electric vehicles are reliable and the cost of operation is acceptable: (1) there hasnever been a run-away condition where the “emergency switch” had to be pulled; (2)the fleet has never had an accident due to electrical components or brake failure dueto extra weight; (3) there never has been a motor failure or any need to replacebrushes or bearings; (4) the original PMC speed controllers were replaced with theCurtis controllers. Since then, no speed controller failures have occurred; (5) theElectricas passed the Environmental Safety and Health evaluations after safety “highvoltage” decals and a fire extinguisher were added to the vehicle; (6) maintenancecosts have been lower than predicted at a yearly average of $562.
• Sandia has been part of an effective public awareness program through exhibits,conventions, public programs, and by using the 12 Electricas throughout the city ofAlbuquerque.

60
SOUTHERN CALIFORNIA EDISON CO.
IntroductionThe Southern California Edison Company (SCE) was a member of the Site Operator
Program from 1991until 1996. As of September 1996, the SCE fleet had 65 electric vehicles(Table SCE-1). Some of these vehicles were the newest generation of electric vehicles available.The entire fleet has accumulated well over 500,000 miles. Some of the model-types haveaccumulated over 100,000 miles each, averaging over 10,000 miles per vehicle (Figure SCE-1).Given the limited range per charge, this per-vehicle mileage is a significant accomplishment.
Table SCE-1. Southern California Edison’s electric vehicle fleet profile as of September 1996.
Make Model Battery Quantity Miles
Conceptor G-Van Lead-acid 9 140,600
Conceptor G-Van Nickel-cadmium 1 14,300
Specialty Shuttle Lead-acid 1 21,500
Solectria Force (Metro) Lead-acid 7 36,600
Solectria E-10 (PU) Lead-acid 2 6,900
US Electricar ES-10 (PU) Lead-acid 10 35,100
US Electricar Sedan (Prizm) Lead-acid 10 40,400
Ford Ecostar Sodium-Sulfur 12 114,200
Honda CUV4 (Civic) Lead-acid/Nickel-Metal Hydride 3 26,800
Toyota RAV4 Lead-acid/Nickel-Metal Hydride 2 10,700
Nissan Avenir Lead-acid 1 1,700
Chrysler TEVan Lead-acid 1 1,000
Chrysler TEVan Nickel-Iron 1 900
TDM Ranger Lead-acid 2 3,700
AC Propulsion CX Lead-acid 1 6,500
B.A.T. Metro Lead-acid 1 1,400
B.A.T. Ranger Lead-acid 1 200
Retired electricvehicles
G-Van, etc. Lead-acid (12) 115,700
Totals: 65 578,200

61
Figure SCE-1. Average miles per vehicle for Southern California Edison’s electric vehicle fleetas of September 1996.
Vehicle Development and TestingSCE had an active electric vehicle program before joining the Site Operator Program, and
technology assessment was a major focus of the early SCE electric vehicle program. As part ofthat early program, SCE received two proof-of-concept G-Vans in 1988 for test and evaluation tosupport the design and certification of a production version G-Van and the development of amore advanced electric vehicle based on the early Chrysler TEVan platform. The development ofa lithium-air battery powered mini-van with significant range potential was also initiated.
Early experience with the G-Vans led Edison to support the improvement of vehiclesubsystems such as the air conditioning, battery state-of-charge gauges, and on-broad chargers.Two Solectria electric passenger vehicles and an electric shuttle bus were added to the fleetduring 1991.
During 1992, several vehicles were tested and evaluated, including a side-by-side energyefficiency test of a Solectria and its gasoline counterpart (the Geo Metro). Two G-Vans wereaccepted in the local Federal Express delivery fleet for testing, and a Southern Californiaconversion firm converted two SCE gasoline fleet vehicles to electric vehicles.
The SCE Transportation Research group tested two light-duty pickup trucks, onepassenger car, one converted electric school bus, and a full-size van upgraded with nickel-cadmium batteries during 1993. Also during 1993, a Hughes inductive charger was tested in twoof SCE’s electric vans. One was tested for performance characterization at SCE’s facilities, andthe other was field tested in conjunction with PG&E.
SCE was able to significantly improve one of the Federal Express-loaned G-Vans byretrofitting it with nickel-cadmium batteries. This project included the design and fabrication ofan air-cooled battery tray, the use of a new battery charger and a new state-of-charge gauge. SCEtested several electric vehicles for electromagnetic fields and prepared a fact sheet on electricvehicles and electromagnetic fields. Test protocols for electromagnetic field testing weredeveloped by SCE and project partners EPRI and PG&E.
0100020003000400050006000700080009000
10000110001200013000140001500016000
Ave
rage
mile
s pe
r ve
hicl
e
G-Van
G-Van (N
i-Cad
)Fo
rce E-10ES-10
Sedan
Ecosta
rCUV4
RAV4
Avenir
TEVan
TEVan
(Nick
el)
TDM Ran
ger CX
Metro
BAT Ran
ger
Retired
Evs

62
During 1994, SCE initiated the test and evaluation of the first of twelve Ford Ecostarprototype electric vans; a total of 23 electric vehicles were transferred to fleet operations. Acomplete electric vehicle technical center was made fully operational when the charginginfrastructure was completed and energized. SCE also performed the acceptance testing of theUS Electricar S-10 pickups for the Site Operator Program.
During 1995 and 1996, SCE developed and implemented a Fleet Evaluation Program tosystematically and consistently document the performance of its electric vehicle fleet.
Energy Storage Development and TestingSCE’s earliest electric vehicle related work was with lead-acid battery testing. The first
batteries tested were those in the two proof-of-concept G-Vans in 1988 and subsequent prototypeG-Vans from Conceptor, all of which had chloride-flooded lead-acid packs. SCE co-funded thedevelopment of a high energy density nickel-iron battery at Eagle-Picher as part of the effort toextend the range of electric vehicles. While successful in producing prototype batteries forincorporation into Chrysler TEVans, the high hydrogen gassing of this battery during rechargecontributed to the dropping of attempts to proceed to a pilot-plant stage. A number of sealedbipolar lead-acid battery prototypes were built and tested in 1990 and 1991, but shorts occurreddue to mechanical failures and SCE discontinued funding.
A joint project with Electrotek saw a Griffon van with a CSPL sodium sulfur batteryachieve 154 miles on a C-Cycle. (The C-Cycle was a simulated driving cycle test proceduredeveloped in the 1980s.) The battery developed internal problems and a replacement battery wasbuilt and tested at the Electrotek test track in 1991. The battery demonstrated a range of 130–160miles. About 15,000 total miles were logged over 170 discharge cycles. The test was terminatedwhen capacity began to drop.
A light-weight, 168-cell zinc-air battery was produced and it has achieved a range of 120miles in a Chrysler mini-van. A range of 65 miles has been achieved with a 84-cell half-pack.Work continues with the goal of improving the cells to obtain a discharge rate of nearly threetimes the power of the previous cells to ensure adequate driveability of the van.
In a joint project between Arizona Public Service and SCE, a Honda CRX was equippedwith a bipolar zinc-air battery design by Dreisback Electromotive Inc. (DEMI). The vehicleaveraged 54 mph for 108 miles while winning the 1991 Solar and Electric 500 race in Phoenix.In another test, the CRX recorded 251 miles on a single charge.
Testing has been performed on several alternative lead-acid batteries; the G-Vans wereused to complete tests on battery packs produced by Chloride, Sonnenschein and Trojan.Reviews of battery options such as ARIAS Bipolar and Electrosource lead-acid batteries werecompleted. A study of battery/fuel cell hybrid combinations suggested that the optimal hybridcombination is a 50/50 battery/fuel cell mix.
SCE provided support to the USABC (United States Advanced Battery Consortium) bothfinancially and through active participation on the Technical Advisory Committee and on othercommittees. Some of the battery technologies that are being investigated include nickel-metalhydride, lithium polymer, and lithium iron disulfide.
SCE has been able to obtain first-hand information on current technology by testingseveral battery technologies, including advanced lead-acid and nickel-cadmium batteries, fromseveral different manufacturers. SCE has also monitored the progress of electric vehiclealternative energy storage technologies, including fuel cells, ultracapacitors, and flywheels.

63
During 1994, two new battery systems were introduced for testing: a valve-regulated spiralwould absorb electrolyte from a lead-acid battery pack by Optima, and a nickel-iron battery packmanufactured by Eagle Picher. These new packs underwent initial characterization andequalization in the laboratory, followed by in-vehicle road testing and life cycle testing in theSCE fleet. SCE conducted life cycle tests on maintenance-free valve regulated lead-acid batterypacks from Hawker (four packs), Sonnenschein (two packs), East Penn (two packs), andTeledyne (one pack).
SCE has attempted to integrate battery packs with battery chargers produced by differentmanufacturers such as La Marche, Enerpro, and Soleq. The main goal of this task was toimprove overall energy efficiency of electric vehicles by meeting charging regimes as requiredby battery manufacturers. SCE has also investigated battery pack life and charge acceptanceduring quick charging using a Norvik fast charger. This charger may allow the recharging ofelectric vehicle battery packs from a 20% state-of-charger to a 80% state-of-charge (SOC) in asfew as 10 minutes.
InfrastructureIn 1992, SCE initiated research, development and demonstration activities to support the
creation of an electric vehicle recharging infrastructure. A multi-year research plan wasdeveloped and implemented. In the initial years, the plan’s focus was on electric vehiclerecharging load management device testing and evaluation, while projects in the later yearsdeveloped and tested other recharging equipment, on-site energy storage, and distributedgeneration concepts that minimize the utility’s electrical demand. Some of the specific activitiesincluded:
• The function of battery chargers and their impacts on a utility electrical system
• Standards for charging connectors
• Communication links between the battery charger and the utility, for load management
• Strategies for effective charging facilities
• Ways to manage (shift) charging loads through on-site energy storage or distributedgeneration
• Electrical infrastructure requirements of alternative fuels
• Battery charging safety issues
• Billing for charging
• Standards for charging power quality.
Another activity is SCE’s participation on the Infrastructure Working Council’sConnectors and Connecting Stations Committee. This is a national committee for establishingelectric vehicle charging standards for voltage, current, and time.
SCE has analyzed and tested the Hughes Power Control Systems inductive chargertechnology. SCE found that this technology has good power quality with a very high powerfactor and very low harmonics. The inductive paddle was found to be safe and convenient from ausers standpoint.
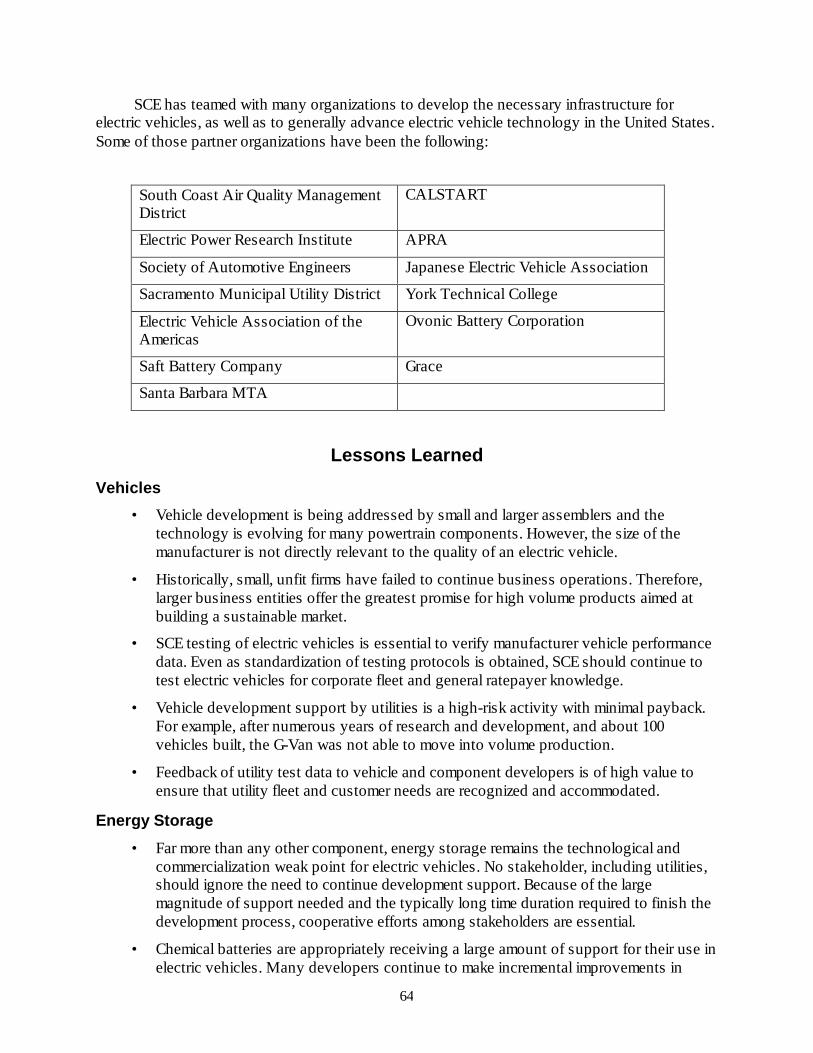
64
SCE has teamed with many organizations to develop the necessary infrastructure forelectric vehicles, as well as to generally advance electric vehicle technology in the United States.Some of those partner organizations have been the following:
South Coast Air Quality ManagementDistrict
CALSTART
Electric Power Research Institute APRA
Society of Automotive Engineers Japanese Electric Vehicle Association
Sacramento Municipal Utility District York Technical College
Electric Vehicle Association of theAmericas
Ovonic Battery Corporation
Saft Battery Company Grace
Santa Barbara MTA
Lessons Learned
Vehicles
• Vehicle development is being addressed by small and larger assemblers and thetechnology is evolving for many powertrain components. However, the size of themanufacturer is not directly relevant to the quality of an electric vehicle.
• Historically, small, unfit firms have failed to continue business operations. Therefore,larger business entities offer the greatest promise for high volume products aimed atbuilding a sustainable market.
• SCE testing of electric vehicles is essential to verify manufacturer vehicle performancedata. Even as standardization of testing protocols is obtained, SCE should continue totest electric vehicles for corporate fleet and general ratepayer knowledge.
• Vehicle development support by utilities is a high-risk activity with minimal payback.For example, after numerous years of research and development, and about 100vehicles built, the G-Van was not able to move into volume production.
• Feedback of utility test data to vehicle and component developers is of high value toensure that utility fleet and customer needs are recognized and accommodated.
Energy Storage
• Far more than any other component, energy storage remains the technological andcommercialization weak point for electric vehicles. No stakeholder, including utilities,should ignore the need to continue development support. Because of the largemagnitude of support needed and the typically long time duration required to finish thedevelopment process, cooperative efforts among stakeholders are essential.
• Chemical batteries are appropriately receiving a large amount of support for their use inelectric vehicles. Many developers continue to make incremental improvements in

65
near-term batteries, e.g., lead-acid. However, if electric vehicles are to be a sustainablemarket, there must be technology advancements that meet midterm and long-termperformance parameters. Research and development support for a battery type must becontinuously evaluated for its commercial cost viability.
• SCE should continue to test promising new chemical batteries at both the prototype andproduction stages of development. Unanticipated quality problems have occurred astechnologies move from the laboratory stage to production.
• About every 10 years, mechanical battery (i.e., flywheel) developers forecastcommercial product availability in 5 years. Healthy skepticism should be applied tothese forecasts and only when working units are available and acceptable costs verified,should high confidence be assumed for their use in electric vehicles.
• Fuel cells have a potential for use in electric vehicles. Their use in combination withbatteries at about a 50/50 mix seems most viable, but not before the mid-2000s.
• Although SCE’s program has not been involved in developing and testing hybridelectric vehicles (HEV), electric vehicles are a viable lower emission vehicle. Thesevehicles put less of a range and cost demand on batteries, since the battery pack can besmaller in size. Range extension is likely to come from combustion engines or turbines.
• Feedback to developers is of high value in efforts to develop products suitable forutility and customer needs. Laboratory and auto manufacturer testing alone is notsufficient. Real-world testing over extended periods in actual user environments hasexposed the need for numerous product improvements.
Infrastructure
• Standardization and code accommodation of electric vehicles in the infrastructuresegment of the industry has been glaringly deficient. A combined utility and automakereffort under the Infrastructure Working Council has begun and needs to be nurtured toensure charging infrastructure has a solid base from which to grow.
• Early charging equipment did not meet power quality parameters. Testing revealedundesirable feedback into the utility electrical system; high value was obtained fromthese tests by identifying improvement needs to suppliers. Equipment tests by neutralparties should be expanded and efforts should be directed to establish industrystandards.
• Industry has shown the ability to agree on some parameters for electric vehiclecharging, i.e., power levels 1, 2, and 3. However, a major controversy continues to existbetween the inductive and conductive charging methods. SCE has tested bothapproaches with neither emerging as a overwhelming winner. A single method shouldbe identified.

66
TEXAS A&M UNIVERSITY
IntroductionTexas A&M’s involvement of electric vehicles is through the Center for Electrochemical
Systems and Hydrogen Research, which is a department of the Texas Engineering ExperimentStation. Texas A&M joined the Site Operator Program in August 1991. The University has beeninvolved in the education, demonstration, research, development and testing of electric vehiclessince 1988. Texas A&M continues to be actively involved in the research in new materials foradvanced batteries and in proton exchange membrane fuel cells for transportation applications.
Vehicle Operations and ActivitiesDuring the first 2 years as a Site Operator Program participant, Texas A&M tested 16 G-
Vans and two Jet Industries conversions in field applications. During the following years, nineChrysler TEVans were added to the fleet. During the final year of the program, three USElectricar Chevrolet S-10 pickups were added to the Texas A&M fleet. The 30 vehicles logged atotal of 150,000 miles. Several different electric vehicle projects and studies have occurred aspart of the program; some of the titles included:
• Battery Modeling for Electric Vehicle Applications using Neural Networks
• Comparison of Various Battery Technologies for Electric Vehicles (lead-acid, nickel-cadmium, nickel-metal hydride, zinc-bromide)
• Comparison of Advanced Battery Technologies for Electric Vehicles
• A Smart Control System for Electric Vehicle Batteries.
Education and InformationDuring the course of the 5-year Site Operator Program, Texas A&M personnel made more
than 150 electric vehicle presentations and demonstrations; nearly half of these presentationswere followed by ride and drive events. Some of the groups that received presentations includethe Texas Public Utility Commission, the Texas Energy Policy Alternative Fuels Committee,Governor Richards of Texas, Vice President Al Gore, Secretary of Transportation Federico Pena,Earth Day events, and school groups. An Electric Vehicle Symposium to educate public, private,and government organizations has been held annually.
The program has also helped the research programs and theses projects of graduatestudents in the areas of electric vehicles, batteries, fuel cells, and hybrids. Electric vehiclemechanics have been trained and specialized electric vehicle tools have been developed throughprogram support. The program has also supported the development of safety procedures forelectric vehicle operations, maintenance, and repairs.
ConclusionsThe program objectives of education and awareness of electric vehicles have met with total
success. Today, electric vehicle awareness is much higher than at the beginning of the programin 1991. This is especially true among younger children and students up to the high school level.
The vehicle evaluation aspect of the Program was not as great a success as the educationand awareness objectives. Electric vehicles need more sophistication and the power source

67
(battery) must be greatly improved before electric vehicles will be acceptable and affordable bythe general public. Quality control by the early manufacturers and converters of electric vehiclesof the vehicles tested was poor. The after-sales treatment of electric vehicle owners was equallypoor. This experience deterred electric vehicles purchasers as they became disenchanted with theproducts and support service.

68
UNIVERSITY OF SOUTH FLORIDA
IntroductionThe University of South Florida (USF), in collaboration with Florida utilities and other
organizations, has completed a research and development program for the testing and evaluationof electric vehicles in fleet and commuter operations. One feature of the USF program has beenthe development of a utility-interconnected photovoltaic system for charging electric vehicleswith solar energy. The photovoltaic system consists of a twelve bay parking facility equippedwith roof mounted photovoltaic panels. The primary objects of the USF program included thefollowing:
• Gathering electric vehicle performance data under actual commuter and fleetconditions.
• Determining public acceptance of electric vehicles through questionnaires andpersonal interviews with drivers.
• Determine the maintenance requirements.
• Evaluation of battery performance as a function of vehicle range and drivingconditions.
• Determine vehicle ranges for commercially available electric vehicles.
• Evaluate the effect of an air conditioner on electric vehicle range and performance.
• Determine the best role for photovoltaic systems in charging electric vehicles.
• Determine the technical feasibility and economic advantages of returning the extrapower generated by the photovoltaic system to the utility grid.
Vehicle InventoryEight electric vehicles were purchased with funds received from the DOE, with cost
sharing by Tampa Electric Company, Florida Power Corporation, the Florida Energy Office,Hillsborough County, and the City of Tampa. Six of these electric vehicles were located at theUSF campus and operated under the guidance of the Electrical Engineering Department. Twoelectric vehicles were located in downtown Tampa; one was operated by the HillsboroughCounty Environmental Protection Commission and the second electric vehicle was operated bythe Tampa Electric Company. These two electric vehicles were tested in both commuter-type andfleet-type environments. Additional electric vehicles were acquired and operated by the FloridaPower Corporation. Data from the Florida Power Corporation electric vehicles were included ina common database with those of the USF fleet. All of the electric vehicles operated in theTampa-St. Petersburg metropolitan area of Florida. Eight additional operators of electric vehiclescontributing to the database were located in the counties of Alachua, Volusia, Pinellas, Dade,Polk, Duval, Brevard, and Orange (Table USF-1).

69
Table USF-1. Inventory and status of vehicles monitored by the University of South Florida.
Vehicle # Model Location Status
G01 GMC van USF Not operational
G02 GMC van USF Not operational due to motor failure
S01 Chev S10 USF Operational, data being collected
S02 Chev S10 USF Operational, data being collected, noisycharger causing faulty charge readings
M01 Mitsubishi Mirage USF Operational, testing
SOL Solectria Geo Force USF Vehicle totaled in accident
S3 Chev S10 Clearwater Vehicle totaled by fire
S4 Chev S10 Gainesville Not operational
S5 Chev S10 Jacksonville Operational, data being collected, little use
S6 Chev S10 Hillsborough Operational data being collected
S7 Chev S10 Orlando Not operational
S8 Chev S10 Volusia Not operational, bad battery pack
S9 Chev S10 Miami Not operational
S10 Chev S10 Haines City Not operational, controller failure
FP1 Chev S10 St. Petersburg Operational, little usage, no data
FP2 Chev S10 St. Petersburg Operational, little usage, no data
SL1 Chev S10 Tampa Operational, data being collected
Vehicle PerformanceA Mobile Data Acquisition System (MDAS) was developed by USF for installation in
electric and alternative fuel vehicles. The MDAS was installed onboard vehicles and theycollected performance data such as battery pack voltage, current, and temperature, as well asspeed and ambient temperatures. The MDAS units and supporting software have undergoneseveral improvements since the initial use in 1992. The MDAS units are now commerciallyavailable by a private company. Table USF-2 gives a summary of performance data derived fromthe MDAS units that have been used on 14 vehicles monitored by the USF electric vehicleprogram. This data has been collected over different time intervals since the fourth quarter of1993.
Driver logs were also used to obtain vehicle driving and charge summaries for four ofUSF’s electric vehicles. The data from the driver logs represents a longer period of time thandoes the MDAS-captured data. The operations and charging data (Figure USF-1) is for thesecond quarter of 1993 to the second quarter of 1996. The four vehicles were driven a total of22,250 miles (Figure USF-1) during the 3-year reporting period, and the average energy use was1.1 miles/kWh (Figure USF-2).

70
Table USF-2. Vehicle performance summaries collected by the Mobile Data Acquisition System developed by the University ofSouth Florida.
Trip Summary Vehicle Number
Parameter Units G01 S01 S02 M01 S3 S4 S5 S6 S7 S10 SOL
Days in use # days 372 408 149 139 10 86 108 114 7 45 12
Trip cycles # 1526 1274 429 445 15 247 425 450 9 261 55
Total trip time hours 222 204 56 81 3 49 54 58 6 31
Total distance miles 4143 3581 1075 1099 74 630 1006 1208 71 707 81
Avg. speed mph 22 22 20 18 24 22 18 22 17 26 11
Max. batt. temp. oC 65 58 99 99 45 60 42 99 34 99 47
Avg. batt. temp. oC 35 31 36 37 40 35 26 42 30 39 33
Total Regen kWh 74 15 2.5 na 0.04 2 9 4 2 5
Total A/C energy kWh 101 30 8 na 3 28 17 7 0.4 na na
Total discharge kWh 2368 1183 366 417 26 133 304 410 4 178 20
Net DC energy mi/kWh 1.8 2.6 3.0 2.9 2.9 4.7 3.3 2.9 2.4 3.9

71
Table USF-2 (cont.) Vehicle Numbers
Charge Summary G01 S01 S02 M01 S3 S4 S5 S6 S7 S10 SOL
Total charges Number 264 424 136 117 7 66 108 110 3 67 21
Tot. charge time hours 1540 2736 559 537 62 659 591 911 5 270 98
Max. charge current A 185 34 137 39 41 53 26 36 16 23 20
Avg. charge current A 18 8 9 10 5 7 6 13 2 12
Max batt. temp. oC 52 75 44 36 52 44 45 45 31 38 52
Avg. batt. temp oC 27 29 27 20 34 26 27 27 27 25 30
Tot. charge energy kWh 6883 2962 748 623 47 409 414 1048 2 258 44
Gross DC eff. mi/kWh 0.6 1.8 1.2 1.4 1.6 1.5 2.4 1.2 5.4 2.7
Battery pack eff. % 33 69 40 48 54 32 73 41 225 69 45
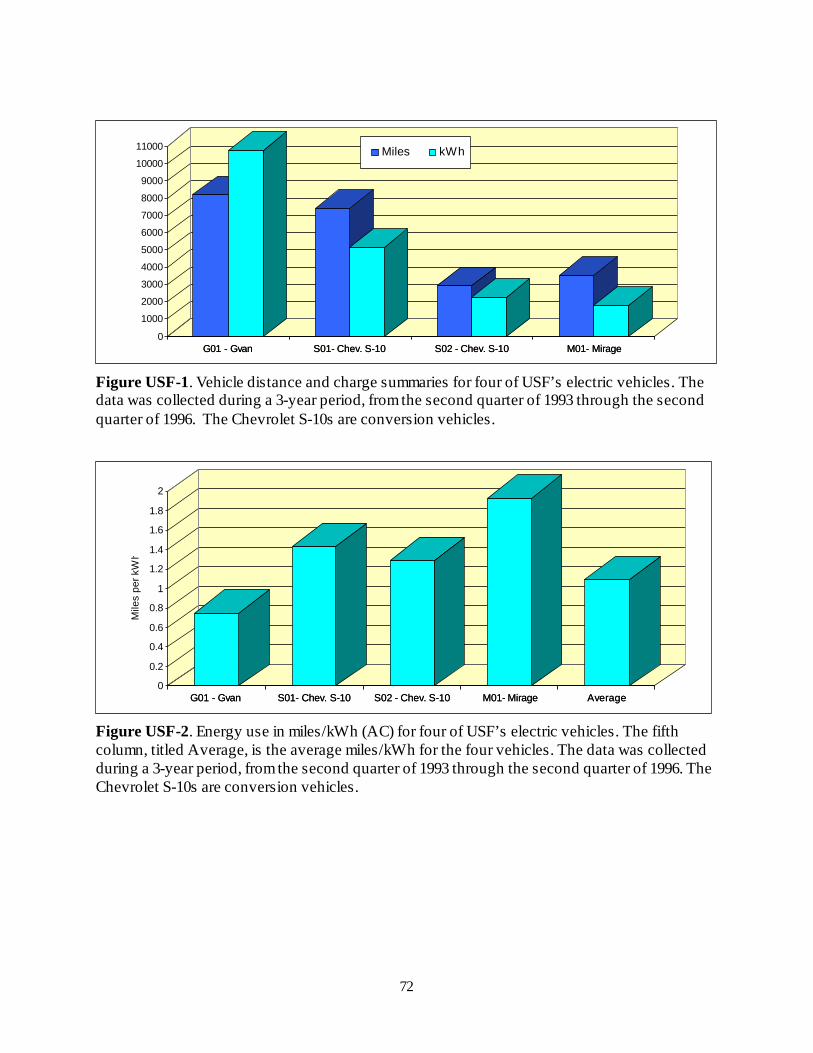
72
G01 - Gvan S01- Chev. S-10 S02 - Chev. S-10 M01- Mirage
0
1000
2000
3000
4000
5000
6000
7000
8000
9000
10000
11000
G01 - Gvan S01- Chev. S-10 S02 - Chev. S-10 M01- Mirage
Miles kWh
Figure USF-1. Vehicle distance and charge summaries for four of USF’s electric vehicles. Thedata was collected during a 3-year period, from the second quarter of 1993 through the secondquarter of 1996. The Chevrolet S-10s are conversion vehicles.
G01 - Gvan S01- Chev. S-10 S02 - Chev. S-10 M01- Mirage Average
0
0.2
0.4
0.6
0.8
1
1.2
1.4
1.6
1.8
2
Mile
s pe
r kW
h
G01 - Gvan S01- Chev. S-10 S02 - Chev. S-10 M01- Mirage Average
Figure USF-2. Energy use in miles/kWh (AC) for four of USF’s electric vehicles. The fifthcolumn, titled Average, is the average miles/kWh for the four vehicles. The data was collectedduring a 3-year period, from the second quarter of 1993 through the second quarter of 1996. TheChevrolet S-10s are conversion vehicles.

73
Air Conditioning PerformanceA set of sensors were installed on the G01 GVan to monitor air conditioning power
requirements. The data was collected from the second quarter of 1995 through the second quarterof 1996. The energy use results were:
Total battery discharge energy 1,161 kWh
Energy consumed by the air conditioner 56 kWh
Percentage of battery discharge consumed by the air conditioner 4.8%
Photovoltaic Solar PowerThe USF Photovoltaic Demonstration and Evaluation Program includes a 20-kW (peak)
photovoltaic (PV) system. The system includes a 12-bay carport with 20 solar panels forming thecarport roof (Figure USF-3). A 6-kW (peak) segment of the PV system can be simultaneouslydistributed between computer-controlled direct DC-DC charging and power grid interconnection.The DC-DC charger (DC-DAS) controls the charging current of a battery pack with minimalpower waste by using computer control of current flow direction for each of the four sourcecircuits. By connecting the modules in series and in parallel, the modules can be interfaced withthe electric vehicles directly or through the utility grid. AC-DC chargers are available forcharging when solar power is unavailable or insufficient. The photovoltaic panels are tilted southat three different angles. Array #1 has 117 modules angled at 25 degrees, Array #2 has 130modules angled at 15 degrees, and Array #3 has 130 modules angled at 5 degrees. All the electricpower produced by Arrays #2 and #3 is directed to the power grid via microprocessor-controlledinverters, which load the PV circuits at their maximum power voltage by constantly varying theload and monitoring the power.

74
Figure USF-3. 20-kW solar energy charging station located on the campus of the University of South Florida. The facility can chargeup to 12 electric vehicles, using 377 Siemens 53-watt solar modules. When not charging vehicles, the electricity generated by the solarcells is fed into the local utility grid. (photo 95-943-1-1)
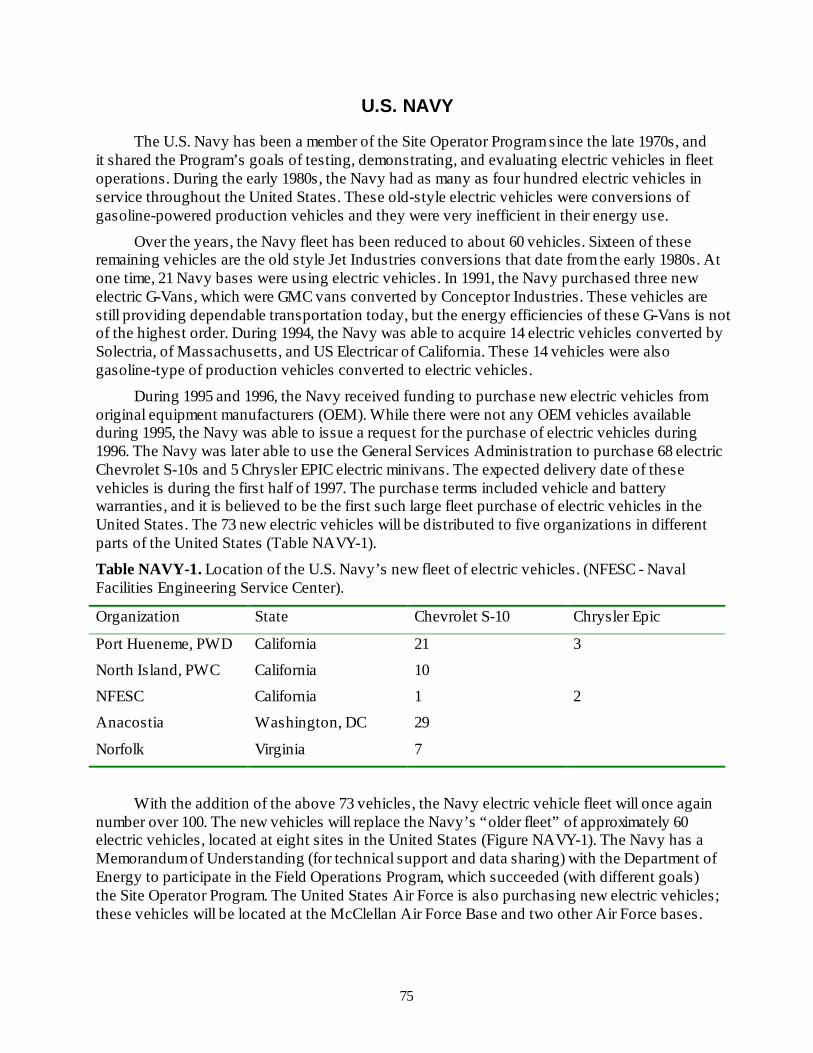
75
U.S. NAVY
The U.S. Navy has been a member of the Site Operator Program since the late 1970s, andit shared the Program’s goals of testing, demonstrating, and evaluating electric vehicles in fleetoperations. During the early 1980s, the Navy had as many as four hundred electric vehicles inservice throughout the United States. These old-style electric vehicles were conversions ofgasoline-powered production vehicles and they were very inefficient in their energy use.
Over the years, the Navy fleet has been reduced to about 60 vehicles. Sixteen of theseremaining vehicles are the old style Jet Industries conversions that date from the early 1980s. Atone time, 21 Navy bases were using electric vehicles. In 1991, the Navy purchased three newelectric G-Vans, which were GMC vans converted by Conceptor Industries. These vehicles arestill providing dependable transportation today, but the energy efficiencies of these G-Vans is notof the highest order. During 1994, the Navy was able to acquire 14 electric vehicles converted bySolectria, of Massachusetts, and US Electricar of California. These 14 vehicles were alsogasoline-type of production vehicles converted to electric vehicles.
During 1995 and 1996, the Navy received funding to purchase new electric vehicles fromoriginal equipment manufacturers (OEM). While there were not any OEM vehicles availableduring 1995, the Navy was able to issue a request for the purchase of electric vehicles during1996. The Navy was later able to use the General Services Administration to purchase 68 electricChevrolet S-10s and 5 Chrysler EPIC electric minivans. The expected delivery date of thesevehicles is during the first half of 1997. The purchase terms included vehicle and batterywarranties, and it is believed to be the first such large fleet purchase of electric vehicles in theUnited States. The 73 new electric vehicles will be distributed to five organizations in differentparts of the United States (Table NAVY-1).
Table NAVY-1. Location of the U.S. Navy’s new fleet of electric vehicles. (NFESC - NavalFacilities Engineering Service Center).
Organization State Chevrolet S-10 Chrysler Epic
Port Hueneme, PWD California 21 3
North Island, PWC California 10
NFESC California 1 2
Anacostia Washington, DC 29
Norfolk Virginia 7
With the addition of the above 73 vehicles, the Navy electric vehicle fleet will once againnumber over 100. The new vehicles will replace the Navy’s “older fleet” of approximately 60electric vehicles, located at eight sites in the United States (Figure NAVY-1). The Navy has aMemorandum of Understanding (for technical support and data sharing) with the Department ofEnergy to participate in the Field Operations Program, which succeeded (with different goals)the Site Operator Program. The United States Air Force is also purchasing new electric vehicles;these vehicles will be located at the McClellan Air Force Base and two other Air Force bases.

76
San DiegoCalifornia
Long BeachCalifornia
Port HuenemeCalifornia
LemooreCalifornia
OaklandCalifornia
CraneIndiana
HonoluluHawaii
Adak IslandAlaska
0
2
4
6
8
10
12
14
16
18
20
22U
.S. N
avy
Ele
ctri
c V
ehic
le F
leet
San DiegoCalifornia
Long BeachCalifornia
Port HuenemeCalifornia
LemooreCalifornia
OaklandCalifornia
CraneIndiana
HonoluluHawaii
Adak IslandAlaska
Figure Navy-1. Location of the U.S. Navy’s “old fleet” of electric vehicles.

77
YORK TECHNICAL COLLEGE
IntroductionYork Technical College is a two-year public institution, located in Rock Hill, South
Carolina. York Technical College initially became involved with electric vehicles during the late1980s. Their original fleet included Griffon vans, Ford Escorts, and Unique Mobility sedans, allwith lead-acid batteries; as well as Volkswagen pickups and sedans with nickel-iron batteries.Newer vehicles were added, including Geo Metro and Chevrolet S-10 conversions. The majorobjectives of the York Technical College electric vehicle program included
• Public awareness
• Public education
• Curriculum development and training
• Field data collection
• Vehicle modification and upgrades.
Public Awareness and EducationDuring York Technical College’s involvement with the Site Operator Program, York
Technical College participated in and supported over 500 public awareness activities. Theseactivities included
• Programs at area elementary and secondary schools
• Participation in area events such as parades, civic events, fairs, and orientationprograms
• Displays at museums and shopping malls
• Tours of York Technical College’s electric vehicle laboratory for students
• Elementary and secondary school teacher workshops on the electric vehicletechnology and the impact on the environment.
York Technical College participated by displaying electric vehicles, providing electricvehicles for people to drive, and making presentations on electric vehicle technologyadvancements, electric vehicle impacts on the environment and energy consumption, electricvehicle availability, and the future of electric vehicles. York Technical College developed anetwork of public and private partners to support the introduction of and education about electricvehicles in North and South Carolinas. York Technical College also supported their partners’efforts to evaluate the suitability of using electric vehicles in their respective fleets. Thesepartners included:
• Duke Power
• South Carolina State Energy Office
• South Carolina Central Electric Power Coop
• City of Charlotte

78
• City of Rock Hill
• Discovery Place Science Museum
• North Carolina Alternative Energy Center
• Palmetto Electric Coop
• Santee Cooper Electric Coop
• South Carolina Coastal Center
• York Electric Coop.
York Technical College also developed and published a series of educational brochures onelectric vehicles (available at http://ev.inel.gov/sop); the subjects included:
• History of Electric Vehicles
• The Effect of Electric Vehicles on the Environment
• Electric Vehicle Systems, including Charging, Motors and Controllers, Batteries, andAuxiliary Equipment.
Curriculum Development and TrainingThe main thrust of the Site Operator Program at York Technical College was training and
public education. During York Technical College’s tenure as a member of the Site OperatorProgram, York Technical College developed training programs on electric vehicle maintenance,technology, safety, and operations. York Technical College conducted a Develop a Curriculumprogram for electric vehicle technicians, which resulted in the definition of the tasks and thelevel of competency required for an electric vehicle technician. From this competency profile,York Technical College developed a two-year associate degree program for the electric vehicletechnician. York Technical College also developed and conducted a number of continuingeducation courses to train individuals interested in, and working in, the electric vehicle field.These courses include the following:
Basic Electric Vehicle Operator Training
This course was designed to familiarize the electric vehicle operator with the fundamentalsof driving an electric vehicle safely and efficiently. The course covered the factors that affectrange, as well as driving techniques to obtain maximum performance and range. The course alsocovered identifying and using the electric vehicle specific instruments and controls, as well asproper techniques to safely and properly charge electric vehicles. This course was designed to bea half-day long.
Introduction to Electric Vehicle Technologies
This course was designed to provide the individual uneducated about electric vehicles withthe fundamentals of electric vehicle technology. The purpose is to better prepare individuals whoare considering the use of electric vehicles with information on the pros and cons of electricvehicles and their impact on the environment and the economy. This course can be 2 or 3 dayslong, and it covers
• History of electric vehicles
• Environmental issues

79
• Legislation, mandates, and incentives
• Technology of electric vehicle components
• Availability of electric vehicles
• Maintenance issues.
Introduction to Electric Vehicle Maintenance and Repair
This introductory course is designed to prepare the maintenance technician with theminimum skills to conduct simple testing and repair of the most common problems encounteredwith electric vehicles. This course is two and one-half days in duration and it covers:
• Electric vehicle familiarization
• Test equipment familiarization
• Component test procedures
• Troubleshooting electric vehicle faults
• Component removal and replacement procedures
• Electric vehicle safety.
Field Data CollectionThe majority of field testing activities were performed on older technology vehicles. While
the test results were not always applicable to the newest generation of vehicles, the student’sexposure to testing methods was of value and the testing of these older vehicles played a key rolein establishing the maintenance database that was used to develop the maintenance trainingprograms. These older vehicles also provided ideal platforms to incorporate new technologycomponents.
Three vehicles with new technology components were tested and these vehicles were aFord Escort with an advanced DC motor and Genesis lead-acid batteries, a Solectria Geo Metrowith an AC motor and Sonnenshein lead-acid batteries, and a US Electricar S-10 pickup with anAC motor and Genesis lead-acid batteries.
The vehicles using the Genesis lead-acid batteries experienced rapid battery degradationdue to inadequate and improper battery charging profiles. The Genesis battery pack in the FordEscort deteriorated within 1,800 miles. All efforts to rejuvenate the batteries failed. The batteriesin the S-10 lasted about 5,000 miles before they failed. The range of the S-10 was about 70 mileswhen the batteries started to fail.
Vehicle Modification and UpgradesYork Technical College actively modified and upgraded its own fleet of electric vehicles
as well as the vehicles of several of its education partners. This involvement allowed the faculty,staff, and students to maintain their familiarity with the operation, function, and interaction of theelectric vehicle components and systems. Vehicle modifications included changing onboardchargers, controllers, other vehicle subsystems, as well as battery modules and packs. Mostnotable of these modifications was the conversion of a Ford Escort from a lead-acid battery packto a nickel-cadmium battery pack. The Escort’s lead-acid batteries were replaced with nickelcadmium batteries donated by the SAFT Battery Company. However, from the start, a suitable

80
charger that could provide the required charging algorithm for the nickel-cadmium batteries wasnot available. However, the nickel-cadmium batteries did exhibit an initial 20–30% improvementin range.
The Ford Escort that received the advanced brush DC motor operated at 120 volts and itwas powered by two Genesis parallel battery packs. The two packs contained 8.4 kWh of energy;with an energy efficiency of 3.57 mi/kWh, the vehicle had a range of 25–30 miles. Atapproximately 1,500 miles, the range began to decrease and by approximately 1,800 miles, thevehicle would no longer operate as the batteries would no longer hold a charge.
The VW pickups were upgraded with new DC motors and controllers, and the nickel-ironbatteries were replaced with flooded lead-acid batteries. These pickups continue to be used bythe Palmetto Electric Co-ops and they continue to provide good service with ranges of 40–50miles.
Lessons LearnedThe most significant lesson learned during York Technical College’s participation in the
Site Operator Program is that in an area such as the electric vehicle field, where technology ischanging and improving rapidly, training, testing, and public education materials must bereviewed and updated regularly.
Field testing of vehicles must be accelerated to collect high mileage and data in a shortperiod of time so that the data can identify any problems and corrective action taken before thenext generation electric vehicle is introduced. Field test data collected on old vehicles is notuseful and not only takes up valuable time and resources, but it also clouds the issue on theperformance of the current generation electric vehicles.
The lack of service manuals and manufacturer-supplied, vehicle-specific training meantthat each operator had to invent the maintenance procedures to keep his electric vehicle inoperation. For future purchases, a service manual and schematics, even if they are basic, must beprovided with each vehicle. Failure to do this severely limits the operator’s ability to maintain hisor her fleet of electric vehicles.
With the current generation of lead-acid batteries, better coordination between the electricvehicle manufacturer and the battery manufacturer is needed. Most of the battery degradationexperienced at York Technical College can be attributed to improper charging algorithms. Propercharging will not only extend the life of the battery pack, but it will also provide for themaximum range on each charge cycle.
As a result of all of the public appearances and presentations, York Technical Collegefound that the public has a great interest in electric vehicles. Many people said that they wouldlike to own an electric vehicle some day. However, all said that before they would seriouslyconsider purchasing an electric vehicle, the purchase price would have to be competitive with theprice of conventional gasoline-powered vehicles. Range was another issue of concern, but it didnot seem to be as important an issue as the purchase price. Many people felt that they could use avehicle with a 50- to 60-mile range. However, this must be the true useable range under actualdriving conditions. The number of interested people would increase if a public charginginfrastructure was available so that they could charge vehicles while at work or shopping.Increased emphasis should be placed on developing a public charging infrastructure and anintegrated training program to support the operation and maintenance of electric vehicles.

81
REFERENCES
1. Energy Information Administration. Alternative to Traditional Transportation Fuels. June
1994. Table 13. U.S. Department of Energy. Washington, D.C.
2. Idaho State Journal, February 26, 1996, p. B4, Biz Briefs: Gas Prices Jump Again, Up 1.5cents, Pocatello, Idaho.
3. Idaho State Journal, February June 11, 1996, p. B4, Biz Briefs: Average Gas Price Up 1.62cents, Pocatello, Idaho.
4. Energy Information Administration. Electric Power Monthly. January 1996. Table 60. U.S.Department of Energy. Washington, D.C.