site-specific seismic response analysis of metro …...under the seismic excitation has been...
TRANSCRIPT

\http://www.iaeme.com/IJCIET/index.asp 505 [email protected]
International Journal of Civil Engineering and Technology (IJCIET)
Volume 10, Issue 12, December 2019, pp. 505-530, Article ID: IJCIET_10_12_051
Available online at http://www.iaeme.com/ijciet/issues.asp?JType=IJCIET&VType=10&IType=12
ISSN Print: 0976-6308 and ISSN Online: 0976-6316
© IAEME Publication
SITE-SPECIFIC SEISMIC RESPONSE
ANALYSIS OF METRO RAIL BRIDGE
Basavana Gowda G.M
Assistant Professor, Ramaiah Institute of Technology, Bangalore - 560054
Harsha G.M
Research Scholar, Ramaiah Institute of Technology, Bangalore - 560054
Govindaraju L
Professor, Dept. of Civil Engineering, UVCE, Bangalore - 560056
ABSTRACT
The effects of ground motion modification on the characteristics and time histories
of the original seed motion have been the topic of recent studies. But, the effects of these
modifications on the results of subsequent seismic analyses have not been
studied. These papers discuss the site specific seismic response analysis of Metro Rail
Bridge situated in Bengaluru, India. For this purpose, it was necessary to consider the
local site effects with Soil-Structure Interaction (SSI) for the analysis of structure
during seismic excitation. Site Response analysis was done using RSPMatch2005 and
SHAKE2000. The wavelet based spectrum compatibility approach is used to generate
synthetic earthquake motion for study area. The effect of soil deposits on the
propagation of seismic wave motion is investigated based on the equivalent linear
approach. Static and Dynamic analysis was done using STAAD(V8i) in order to find
the variation in Natural Period, Bending Moment and Deflection of the structure, by
incorporating soil-flexibility as compared to structures with conventional fixed-base.
The study concludes that the site was amplified by 4.85times. But, structural response
for the SSI with local site effect was within the range of acceptable values. The results
will be useful for design engineer to use as a guiding tool for carrying out more
advanced dynamic analysis at the study site.
Keywords: Soil Structure Interaction, Site Specific Response Analysis, Equivalent
Linear approach
Cite this Article: Basavana Gowda G.M, Harsha G.M and Govindaraju L, Site-
Specific Seismic Response Analysis of Metro Rail Bridge, International Journal of
Civil Engineering and Technology, 10(12), 2019, pp.505-530
http://www.iaeme.com/IJCIET/issues.asp?JType=IJCIET&VType=10&IType=12

Basavana Gowda G.M, Harsha G.M and Govindaraju L
http://www.iaeme.com/IJCIET/index.asp 506 [email protected]
1. INTRODUCTION
1.1. General
Bengaluru is a city in India currently experiencing a hasty development towards social
suburbanisation; new structures are often built beside or above the legacy structures as cities
grow to accommodate the influx of residents and commerce. In this regards, there was a need
of report being prepared for the future construction of Elevated Metro Bridge near
Chinnaswamy Cricket stadium. In fact, Bengaluru has experienced several minor earthquakes
in the 20th century. Recent studies by Ganesha Raj and Nijagunappa (2004), Sitharam et. al.
(2006) and Sitharam and Anbazhagan (2007) have proposed that Bengaluru need to be
upgraded from the current seismic zone II (BIS, 2002) to zone III based on the local seismo
tectonic details and hazard analysis[1],. It has also been highlighted that, the presence of
potentially active geological structures in vicinity of Bengaluru [2]. The Rock level PGA map
for Bengaluru varies from 0.09g to 0.16g [1] and the amplification factor ranged from 1 to 5.8,
Sitharam et. al. [2]. Hence sub soil classification for the Bengaluru region is very much required
to evaluate seismic local site effects for an earthquake. The assessment of local site effects on
seismic ground motions is of great importance in earthquake engineering practice. Soil-
Structure Interaction (SSI) is one of the design issues, which is often disregarded and even in
some cases ignored. Therefore, it is necessary to consider the local site effects with SSI for the
analysis of structure during seismic excitation. The dynamic behaviour of soil is quite complex
phenomenon and requires models which can distinguish the important aspects of cyclic
behaviour and need to be simple. Ground response effects generally are evaluated using one
dimensional models which assumes that seismic waves will propagate in vertical direction
through the horizontal layers of the soil. Hypothetical modelling of 1Dimension site response
can be generally accomplished using Equivalent-linear (EL) or nonlinear (NL) analysis. The
advantages of equivalent-linear modelling include small computational effort and few input
parameters.
This paper discusses the estimation of ground motion parameters for the performance of
Metro Rail Bridge. In the first part of the paper, Site-Specific response analysis is carried out
based on the Seismic Down-Hole Test parameter (Shear wave Velocity). One of the problems
in carrying out site-specific study for Bengaluru is the lack of previously recorded strong
motion data in the city. Hence, the current study highlights a methodology to predict the local
soil condition effects at site where no past earthquake recorded data are available. The
methodology adopts wavelet-based spectrum compatibility approach to generate synthetic
earthquake motions for the study area. Based on the equivalent linear approach, The effect of
soil deposits in the region on propagation of seismic wave motion parameters to the ground
surface is investigated. In the second part of the paper, the performance of a Metro Rail Bridge
under the seismic excitation has been analyzed for the pier supported on three approaches,
namely, pier with fixed support, pier with support accounting for soil-flexibility with pile
foundation and pier with support on underground station box. Individually, each of these
structures has a unique seismic response.
Soils being natural geological material, its properties are often difficult to assess. Due to
near surface geology with inhomogeneous nature, each earthquake produces a spatial variation
of ground motion and, consequently, spatial variability in the damage pattern. Therefore it has
been customary to assign large factors of safety to soil stresses when compared to that of
superstructure. In this situation, the soil stresses generally do not cross the elastic range except
in the small overstressed zones. Hence, in the current analysis the soil system is assumed to be
in elastic state. The process in which the response of the soil influences the motion of the

Site-Specific Seismic Response Analysis of Metro Rail Bridge
http://www.iaeme.com/IJCIET/index.asp 507 [email protected]
structure and the motion of the structure influences the response of the soil is termed as “Soil-
Structure Interaction” (SSI).
Pile Foundations are widely used for supporting important structures. Currently, Bengaluru
is undergoing huge infrastructure development and therefore it is important to adopt the best
engineering practices in such projects. Pile foundation is known as one of the popular method
of construction to overcome the difficulties of foundation in medium and soft soils. But, till
nineteenth century the design was entirely based on experience (Poulos and Davis, 1980)[3]. It
is for the convenient of an engineer to divide the design of major structures into two
components: the design of the structure and the design of foundation. But in reality, the loads
on foundation determines their movement, and this movement affects the loads imposed by the
structure; inevitably interaction between structure, foundation and soil or rock forming the
founding material together comprise one interacting structural system (Poulos and Davis, 1980)
)[3].The performance of superstructures during earthquake completely depends on foundation
performance which is interlinked with ground conditions at the site and the ground motion
experienced by the foundation. The response of structures is essentially a function of the
seismicity of the region, the nature of source mechanism, local site conditions and geology of
the site. Therefore, identifying the soil deposits which are susceptible to ground-motion
amplification is an important for accurate assessment of the structural analysis.
1.2. Study Area
Bengaluru city spreads over an area of 220 square kilometers and it is situated at an altitude of
around 910m above mean sea level (MSL). It is the administrative, commercial, industrial,
educational and cultural capital of Karnataka state, in the South India. The population of
Bengaluru region is over 6 million. It is situated on a latitude of 12° 58' North and longitude of
77° 37' East.
Figure: 1 a. Study Site (Source - Google Map)

Basavana Gowda G.M, Harsha G.M and Govindaraju L
http://www.iaeme.com/IJCIET/index.asp 508 [email protected]
1.3. Seismicity and Geology of study area
As per Seismic zonation map IS: 1893 (Part I): 2002 [4], Bengaluru falls under Zone II. Recent
earthquake that occurred to Bengaluru was in the range of 2.0 to 5.5 on Richter scale. On
29thJanuary, 2001, an earthquake with a magnitude of 4.3 on the Richer scale hit in the Mandya
district, Karnataka state, India, with its epicentre distance about 35km south of
Bengaluru.Geology wise,the Mandya district shows dominant presence of 'Archean' crystalline
formation comprising peninsular neissic complex with small patch of hornblende schist in the
northern part and intrusive closepet granites all along the western part of the district. The
overburden soil generally is dominated by Silty sand /residual silt and shows the presence of
clay as a nominal interstitial binder.
1.4. Geotechnical site characterizations
In order to perform a detailed site-specific seismic response analysis of the study site, sub soil
information is one of the most essential data. The characteristics of geological layer up to the
depth of first 30m are very important in amplification of earthquake shaking (Nandy 2007) [5].
In the current study, extensive geophysical site investigation data were collected from CEC-
SOMA-CICI JV (UG-2, BMRCL Project) [6] and analyzed. The data collected includes
geotechnical bore hole data and laboratory test data providing information such as standard
penetration test (SPT) values, thickness of subsoil strata, index and the engineering properties
of deposits of Study area. Table 1 presents classification of site with soil deposits along with
standard penetration test ‘N’ values.
Table 1. Sub Soil Details for Bore hole AB14
(Near Chinnaswamy Cricket Stadium location)
Depth (m) Symbolic Engineering Classification SPT Values RQD (%)
0
Loose, red, brow at
places, Clayey Silt
4 7
6 38
7
Highly weathered, light grey, weak to very weak, granitic
genesis fragments
9 > 100
12 > 100
15 > 100
17.5
18.5
Extremely strong, light grey, hard massive, granitic gneiss
86
19.5 54
20.5 54
21.8 93
1.5. Geophysical Site Characterizations
Characterization of the site was carried out using shear wave velocity (Vs) for the Bore Hole
AB-14 using Seismic down Hole Test (Geophysical method). Shear wave velocity at 30m
depth (Vs30) is accepted for site classification as per NEHRP (National Earthquake Hazard
Research Programme) (Dobry et. al. 2000) [7] (Kanli et. al, 2006) [8]. Usually, for amplification
and site response study, the average 30m depth Vs is considered. However, if the rock is found
within a depth of about 30m, near surface shear wave velocity of soil has to be considered.
Otherwise, Vs30 obtained will be higher due to the velocity of rock mass [1]. Table 2 presents
the Shear wave velocity (Vs) along with Dynamic module of soil deposit. Using 1-dimensional
shear wave velocity, the average shear wave velocity of soil has been calculated for depths of

Site-Specific Seismic Response Analysis of Metro Rail Bridge
http://www.iaeme.com/IJCIET/index.asp 509 [email protected]
3m, 6m, 12m, 18m and 21m depths, which is been shown in Table 3. Based on the average
shear wave velocity of 21m depth of study site, sub soil classification has been carried out for
local site effect evaluation using NEHRP classification. The Study site falls into “Site class C”
type of soil (Very Dense soil).
Table 2. Down Hole Test for Bore hole AB14
(Near Chinnaswamy Cricket Stadium location)
Depth (m) Vp (m/s) Vs (m/s) Density
(kN/m3) μ
Young’s
Modulus
(MPa)
Shear
Modulus
(MPa)
Bulk Modulus
(MPa)
1.5 353.4 144.6 17 0.40 99.5 35.53 164.95
3.0 671.2 229.3 17 0.43 256.4 89.40 646.65
4.5 1445.7 264.7 17 0.48 353.2 119.11 3394.18
6.0 1856.9 791.5 17 0.39 2958.2 1064.88 4441.71
7.5 2345.1 1264.4 19 0.30 7867.3 3037.34 6399.05
9.0 2370.8 1274.6 19 0.30 8005.7 3086.91 6563.45
10.5 2399.6 1303.4 19 0.29 8332.8 3227.89 6636.87
12.0 2443.9 1347.9 19 0.28 8846.2 3451.71 6745.32
13.5 2540.9 1388.7 19 0.29 9431.4 3664.01 7381.07
15.0 2625.4 1444.4 19 0.28 10171.7 3964.13 7811.01
16.5 2643.1 1438.7 19 0.29 10142.5 3932.74 8030.00
18.0 3072.3 1719.1 21 0.27 15789.6 6206.17 11546.61
19.5 3183.7 1772.6 21 0.28 16830.8 6598.40 12487.53
21.0 3220.6 1789.2 21 0.28 17167.2 6722.81 12818.15
Table 3. Typical Average Shear Wave Velocity Calculations
(Near Chinnaswamy Cricket Stadium location)
Depth
(m)
Shear wave
velocity
"Vs" (m/s)
Soil
thickness
"di" (m)
di/Vs
Average "Vs" of the soil depths
3m
(m/s)
6m
(m/s)
12m
(m/s)
18m
(m/s)
21m
(m/s)
1.5 144.58 1.50 0.0104
177.35 245.12 412.31 543.18 603.05
3.0 229.33 1.50 0.0065
4.5 264.70 1.50 0.0057
6.0 791.45 1.50 0.0019
7.5 1264.36 1.50 0.0012
9.0 1274.63 1.50 0.0012
10.5 1303.41 1.50 0.0012
12.0 1347.85 1.50 0.0011
13.5 1388.68 1.50 0.0011
15.0 1444.43 1.50 0.0010
16.5 1438.70 1.50 0.0010
18.0 1719.10 1.50 0.0009
19.5 1772.60 1.50 0.0008
21.0 1789.23 1.50 0.0008

Basavana Gowda G.M, Harsha G.M and Govindaraju L
http://www.iaeme.com/IJCIET/index.asp 510 [email protected]
1.6. Quantification of the Ground motion
To estimate the maximum horizontal forces that can be expected at the study site, Peak ground
acceleration value is used. Determining the spatial variation of peak ground acceleration is not
adequate, because peak acceleration often correspond to high frequencies, which are out of
range of the natural frequencies of most structures. The largest amplification of the soil will
occur at the lowest natural frequency. (Equation 1) [1]. the period of vibration corresponding to
the fundamental frequency is called the “Characteristic Site Period” (Equation 2) [1]
wo = πVs
2H (1)
Ts = 2π
wo (2)
The characteristic site period, depends on the shear wave velocity of the soil and soil
thickness. When the natural frequency of the ground motion coincides with the natural
frequency of the structures, Structures have a high probability to achieve resonance. Resonance
will cause increase in swing of the structure and given sufficient duration, amplification of
ground motion can result in total destruction. Hence, it was essential to evaluate the spectral
acceleration, i.e. the amplification of the seismic signal for the Bore Hole AB-14, which is been
shown in Table 4.
2. SOIL STRUCTURE INTERACTION
SSI has been recognized as an important factor that may considerably affect the relative
structure response, the motion of base and motion of surrounding soil (Todorovska and
Trifunac, 1990) [9]. Structures subjected to earthquake motion are generally analyzed using free
field ground motions. This assumption, which simplifies the analysis, it is although valid for
structure on rock or stiff soils, might not be appropriate for a structure on soft soils. For the
structures founded on rock or stiff soils, The fixed base assumption imply that high stiffness
of elastic soil media constrain the motion at the foundation of structure close to the free field
motion. However, there is always some soil-structure interaction during earthquake shaking
and the interaction is particularly major for structures founded on soft soils in which elastic
media confining the foundation acts as flexible column and due to inertial and kinematic
effects, overall response of structure gets modified. SSI results in increase of fundamental time
period of structure thereby reduces base shear, lateral forces, and overturning moments but
might increase the Displacement Demands. There are two kinds of analysis methods that are
used in contemporary software packages: (1) Direct method and (2) Sub-structure method.
Table 3.Quantification of the Ground Motion
Soil Classification based
on bore hole (AB-14)
Soil
depth
(m)
Shear Wave
velocity "Vs"
(m/s)
Fundamental
frequency "wo"
(rad/sec)
Fundamental
frequency "fo"
(Hz)
Characteristic
Site period
"Ts" (sec)
Loose, Red, Brown at
places, CLAYEY SILT
1.5 144.58 151 24 0.041
3.0 229.33 120 19 0.052
4.5 264.70 92 15 0.068
6.0 791.45 207 33 0.030
Highly weathered, light
grey, weak to very weak,
granitic gneiss fragments
7.5 1264.36 265 42 0.024
9.0 1274.63 222 35 0.028
10.5 1303.41 195 31 0.032
12.0 1347.85 176 28 0.036

Site-Specific Seismic Response Analysis of Metro Rail Bridge
http://www.iaeme.com/IJCIET/index.asp 511 [email protected]
13.5 1388.68 162 26 0.039
15.0 1444.43 151 24 0.042
16.5 1438.70 137 22 0.046
Extremely strong, light
grey, white at places,
hard, massive, granitic
gneiss
18.0 1719.10 150 24 0.042
19.5 1772.60 143 23 0.044
21.0 1789.23 134 21 0.047
2.1. Sub Structure Method or Multilevel Method
Substructure method divides the analysis in three simple steps and uses the principle of
superposition to obtain the final response. It is solved in frequency domain and soil-structure
behavior is assumed to be linear.
The three steps followed in sub-structure method are
Evaluation of foundation input motion
Performing Dynamic analysis of soil media to obtain stiffness and damping
characteristic of foundation-soil interaction.
Analyzing the structure supported on springs represented by step 2 and subjected to
base excitation obtained in step 1.
In the present study, SHAKE2000 was used for seismic site response analysis to provide
the input ground motion parameters required for SSI analysis in STAAD V8i.
3. METHODOLOGY
The following figure shows the methodology adopted in the present study.(Figure b)
Figure 2. Flow Chart Showing the Methodology Adopted

Basavana Gowda G.M, Harsha G.M and Govindaraju L
http://www.iaeme.com/IJCIET/index.asp 512 [email protected]
4. SITE SPECIFIC RESPONSE ANALYSIS
It is generally believed that Dynamic analysis provides the most realistic predictions of
structural response induced by earthquake ground motions. The forces on structures depend on
time period and peak ground acceleration of the structure. Subsoil condition is responsible for
the amplification of ground motion and amplification may increase or decrease the value of
spectral acceleration coefficient. The phenomena where in the local soils act as a filter and
modify the ground motion characteristics is referred as Site amplification. The seismic waves
travel from the bedrock to the surface with certain change in its characteristics (i.e. amplitude
and frequency of seismic waves) as they pass through the different soil deposits. During this
process, large accelerations may transfer to the structure and thus causing large deflection. Site
specific response analysis aims to determine the effects of local soil conditions on amplification
of seismic waves and hence estimating the ground response spectra for the design purposes. In
this study, an attempt has been made to study site specific ground response by equivalent linear,
1D analysis using SHAKE2000 for the study site. The term ‘one-dimensional’ means the soil
profile extends to infinity in all horizontal directions and the bottom layer is considered a half
space.
4.1. Selection of Peak Ground Acceleration
As per seismic zoning map of India (IS 1893–part I: 2002) [4], Bengaluru region, lies in low
seismic zone (Zone II) with a zone factor of 0.1 and expected earthquake of magnitude 5 to 6.
It is quite interesting to note that Sitharam and Anbazhagan (2006) [2] have identified Mandya-
Channapatna-Bengaluru lineament as the most vulnerable source for Bengaluru and have
reported that the MCE for this region has a moment magnitude of 5.1 thus developing a Peak
Ground Acceleration (PGA) of 0.146g at rock level. Hence, in the present study the maximum
PGA of 0.15g has been selected for the study site from the Rock level PGA Map (Figure 1) to
study the effect of local soil condition on the Metro Rail Bridge due to seismic excitation.
Figure3: Rock Level PGA Map for Bengaluru [1]
4.2. Development of Synthetic Earthquake Motion
As cited earlier, there are no records of strong ground motion available in the study site and
therefore there was a need for the development of synthetic earthquake for the study site. A
wavelet-based method was used for the generation of spectrum-compatible time-history of
earthquake. RSPMatch2005 is one such wavelet-based method developed by Hancock et al.

Site-Specific Seismic Response Analysis of Metro Rail Bridge
http://www.iaeme.com/IJCIET/index.asp 513 [email protected]
(2006) [10] [11] and same is used in the present study for developing synthetic earthquakes. As a
basic step, the methodology requires the use of strong motion records available from historical
earthquake. Several important factors are considered while selecting a suitable strong motion.
These include peak acceleration close to the target value, similar magnitude and similar site
conditions (Kramer 1996) [12]. Based on these factors, earthquake recorded at Boston of
magnitude (M) 5.9 and PGA 0.2g was selected from the earthquake data base. The selected
earthquakes represent nearly the similar magnitude of 5 to 6 for Bengaluru site condition.
Figure 2 shows the time history of selected strong motion for Boston earthquake having peak
acceleration of 0.2 g.
Based on the anticipated PGA (0.15g) and target response spectra at 5% damping for rock
or hard soil as per IS : 1893 (part I): 2002 [4], the program RSPMatch2005 was used to scale
down the PGA from 0.2g to 0.15g and generate the spectrum compatible time-history of the
earthquake. Figure 3 shows the time history of selected strong motion after scaling down the
PGA to 0.15 g. Figure 4 shows the response spectrum of selected earthquake motion before
and after matching the target spectra for the Boston earthquake.
Figure 4: Time-History of Selected Motion Record (PGA 0.2g)
0 2 4 6 8 10 12 14 16 18 20
-0.25
-0.20
-0.15
-0.10
-0.05
0.00
0.05
0.10
0.15
Accele
rati
on
(g
)
Time (sec)
Boston Saguenay, Baie-St-Paul,amax
=0.2g

Basavana Gowda G.M, Harsha G.M and Govindaraju L
http://www.iaeme.com/IJCIET/index.asp 514 [email protected]
Figure 5: Time-History of Selected Motion Record (PGA 0.15g)
Figure 6: Comparison of Target and Response Spectrum of Boston Earthquake Time History
4.3. Site Response Analysis
In the present study, equivalent linear approach using the computer program SHAKE2000
developed by Idriss and Sun (2004) [13] [14] was used for the analysis. The shear wave velocity
of each soil layer obtained from Seismic down hole test is used as the input parameter for the
model. Also to account for behavior of soil under irregular cyclic loading, the dynamic
properties of soils such as modulus reduction and damping versus shear strain curves proposed
by Seed and Idriss, Average formula for Sand soil and Schnabel formula for Rock were
considered in the SHAKE analysis. Synthetic earthquake motions are then specified at the base
0 2 4 6 8 10 12 14 16 18 20
-0.15
-0.10
-0.05
0.00
0.05
0.10
0.15
Accele
rati
on
(g
)
Time (Sec)
Boston(saguenay,Baie-St-Paul)
amax
=0.15g
0 1 2 3 4
0.0
0.1
0.2
0.3
0.4
0.5
0.6
0.7
Sp
ectr
al A
ccele
rati
on
(g
)
Period (Sec)
Target Spectra
(IS1893:2002 Rock or Hard Soil)
Spectra of original motion
(Boston,Saguenay)
Spectra of Modified motion

Site-Specific Seismic Response Analysis of Metro Rail Bridge
http://www.iaeme.com/IJCIET/index.asp 515 [email protected]
of soil profile to carry out dynamic analysis. The output from the site response analysis includes
time history of ground motion at any depth, amplification of motion at the ground surface,
fundamental frequency of the ground and spectral response at the ground surface. Figure 5
shows the acceleration time history at the ground surface.
Figure 7: Acceleration Time-History at ground surface
4.4. Response Spectra
The frequency content of an earthquake motion will strongly influence the effects of that
motion and hence only the PGA value cannot characterize the ground surface motion. A
response spectrum is used extensively in earthquake engineering practice to indicate the
frequency content of an earthquake motion. A Response Spectrum describes the maximum
response of a single-degree-of-freedom (SDOF) system to a particular input motion as a
function of the natural frequency/period and damping ratio of the SDOF system. Figure 6
shows variation of spectral accelerations (Sa) with period corresponding to 5% damping for the
study site. Also shown is the BIS 1893 Part (1): 2002 [4] code-specified response spectra for
medium soil condition at 5% damping for comparison. It may be observed that the spectral
values exceed the code specified values at some period. The maximum spectral acceleration
is 1.6117 for the earthquake input motion.
0 5 10 15 20
-0.4
-0.2
0.0
0.2
0.4
0.6
Accele
rati
on
(g
)
Period (Sec)
amax
=0.485g

Basavana Gowda G.M, Harsha G.M and Govindaraju L
http://www.iaeme.com/IJCIET/index.asp 516 [email protected]
Figure 7: Response Spectra at Ground Surface (5% damping)
4.5. Peak Ground Acceleration
The Peak Horizontal Acceleration (PHA) values at bedrock level are amplified based on the
soil profile at AB14 location. The acceleration-time histories at different depths were obtained
as output from SHAKE analysis. Figure 7 shows the variation of peak acceleration with depth.
The PGA value for the study site was 0.485g.
Figure 7: Variation of Peak Acceleration with Depth
4.6. Amplification Factor
The term “Amplification Factor” is used to refer to the ratio of the peak horizontal acceleration
at the ground surface to the peak horizontal acceleration at the bedrock. This factor was
evaluated for AB-14 using the PHA at bedrock obtained from the synthetic acceleration time
history for the borehole and the peak ground surface acceleration obtained as a result of ground
response analysis using SHAKE2000. The amplification factor thus calculated for the study
0 1 2 3 4
0.0
0.2
0.4
0.6
0.8
1.0
1.2
1.4
1.6
1.8
Accele
rati
on
(g
)
Period (Sec)
Target Spectra
(IS 1893-2002, Medium Soil)
Spectral Acceleration at Ground Surface Motion

Site-Specific Seismic Response Analysis of Metro Rail Bridge
http://www.iaeme.com/IJCIET/index.asp 517 [email protected]
site was 3.17. It can be observed that the amplification factor for most of Bengaluru region is
in the range of 2-3. This is in agreement with Sitharam et. al. (2005) [2] who have also concluded
that most of Bangalore region has a moderate amplification potential.
5. ANALYSIS OF BRIDGE STRUCTURE
Generally structures which are subjected to earthquake ground motion are analyzed using free
field ground motions. This assumption, which simplifies the analysis, is although valid for
structure supported on rock or stiff soils, might not be appropriate for a structure resting on
other soils. According to Gazetas and Mylonakis (1998) [15] SSI effect on the response of the
bridge was to increase the natural period of vibration and thus increase the ductility demand on
the pier by two times due to the increased base shear forces. Gazetas and Mylonakis (1998) [15]
stated that ignoring SSI has lead to oversimplification in the design leading to an unsafe design
of foundation and superstructure. Soil-structure interaction can be divided into two phenomena
inertia interaction and kinematic interaction. Earthquake ground motion causes soil
displacement known as free-filed motion. However the foundation embedded in to the soil will
not follow the free field motion. This inability of the foundation to match the free field motion
causes the kinematic interaction. On the other hand, the mass of the super structure transmits
the inertia force to the soil causing further deformation in the soil which is termed as inertia
interaction.
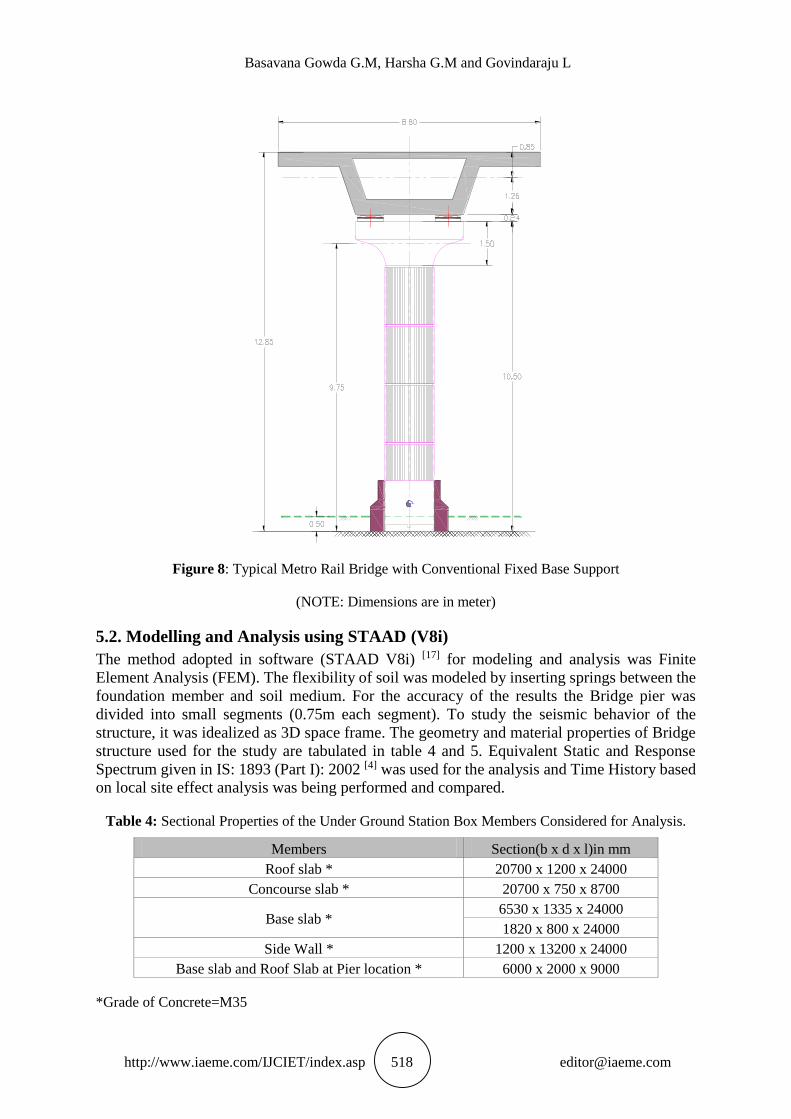
5.1. Bridge Structure Description
To study the dynamic behavior while accounting the effect of soil-structure interaction, Metro
Bridge pier was modeled with three approaches, namely, pier with fixed support (Figure 8),
pier with supports accounting for soil-flexibility with pile foundation (Figure 9) and pier
supporting on underground station box (Figure 10). The cross section of the superstructure of
the box girder bridge consists of single cell box (Trapezoidal Shape). The bridge is simply
supported and having a span of 25mC/C. The structural parameters that used in this study were
collated from CEC-SOMA-CICI-JV (BMRCL Project) [16]
Basavana Gowda G.M, Harsha G.M and Govindaraju L
http://www.iaeme.com/IJCIET/index.asp 518 [email protected]
Figure 8: Typical Metro Rail Bridge with Conventional Fixed Base Support
(NOTE: Dimensions are in meter)
5.2. Modelling and Analysis using STAAD (V8i)
The method adopted in software (STAAD V8i) [17] for modeling and analysis was Finite
Element Analysis (FEM). The flexibility of soil was modeled by inserting springs between the
foundation member and soil medium. For the accuracy of the results the Bridge pier was
divided into small segments (0.75m each segment). To study the seismic behavior of the
structure, it was idealized as 3D space frame. The geometry and material properties of Bridge
structure used for the study are tabulated in table 4 and 5. Equivalent Static and Response
Spectrum given in IS: 1893 (Part I): 2002 [4] was used for the analysis and Time History based
on local site effect analysis was being performed and compared.
Table 4: Sectional Properties of the Under Ground Station Box Members Considered for Analysis.
Members Section(b x d x l)in mm
Roof slab * 20700 x 1200 x 24000
Concourse slab * 20700 x 750 x 8700
Base slab * 6530 x 1335 x 24000
1820 x 800 x 24000
Side Wall * 1200 x 13200 x 24000
Base slab and Roof Slab at Pier location * 6000 x 2000 x 9000
*Grade of Concrete=M35

Site-Specific Seismic Response Analysis of Metro Rail Bridge
http://www.iaeme.com/IJCIET/index.asp 519 [email protected]
Table 5: Sectional Properties of the Metro Rail Bridge Considered for Analysis
Members Section(b x d x l)in mm
Depth box girder *** 2100
Width and Thickness of top flange *** 8800 x 250 to 500
Width and Thickness of bottom flange *** 3600 x 300 to 500
Web Thickness *** 375 to 500
Pier Cap ** 3600 x 3100 x 1500
Pier ** (R= 800)2600 x 1600 x 9000
Pile Cap * 5200 x 5200 x 2000
Pile * 4 #, 1200 Dia. 17m length
*** Grade of Concrete = M55 ** Grade of Concrete = M45 * Grade of Concrete = M35
NOTE: Dimensions are along the alignment of Bridge.
HARD ROAD
GROUND LEVEL
Figure 9: Typical Metro Rail Bridge with Pile Support
(NOTE: Dimensions are in meter)
5.3. Modelling of the Foundation System
The foundation system of the bridge comprises of three alternate approaches, namely, fixed
support, pile support and underground station box support. The interaction between foundation
system and the soil is represented by sets of linear springs and is summarized below. The

Basavana Gowda G.M, Harsha G.M and Govindaraju L
http://www.iaeme.com/IJCIET/index.asp 520 [email protected]
estimation of superstructure load coming on to the foundation system and the numerical model
used for the study are described in the following section. In the present analysis, the foundation
systems (Piles and Underground station box) are treated as linear elastic concrete elements as
nonlinear behavior of the material is not expected.
5.4. Load Details
As per IITK-RDSO guidelines [18], the inertia forces due to each component or portion of the
bridge as obtained shall be applied @ centre of mass of the corresponding component or portion
of the bridge for the seismic force calculation (Figure 11)
In Longitudinal Direction of Bridge = 100% Total DL of Super structure + 0 % Live load
In Transverse Direction of Bridge = 100% Total DL of Super structure + 50 % Live load
Table 6: Summary of Nodal loads for Bridge components
Nodal Load Details Longitudinal
Direction
Transverse
Direction
p1 = Super Structure Load 5422 kN 6262 kN
p2 = Pedestal Load 9.8 kN 9.8 kN
p3 = Pier Cap Load 332.35 kN 332.35 kN
p4 = Pier Load 779.90 kN 779.90 kN
Horizontal Design Seismic Force [P] has been calculated:
P1 = p1 x Ah
P2 = p2 x Ah
P3 = p3 x Ah
P4 = p4 x Ah
Base Shear (VB) = P1 + P2 + P3 + P4
Horizontal Design Seismic Moment [M] has been calculate:
M1 = P1 x H1
M2 = P2 x H2 M3 = P3 x H3
M4 = P4 x H4
Bending Moment (M) = M1 + M2 + M3 + M4

Site-Specific Seismic Response Analysis of Metro Rail Bridge
http://www.iaeme.com/IJCIET/index.asp 521 [email protected]
GROUND LEVELGROUND LEVEL
BASE SLAB
CONCOURSE SLAB
ROOF SLAB
LO
WE
R S
IDE
WA
LL
UP
PE
R S
IDE
WA
LL
Figure 10: Typical Metro Rail Bridge with Underground Station Box Support
(NOTE: Dimensions are in meter)

Basavana Gowda G.M, Harsha G.M and Govindaraju L
http://www.iaeme.com/IJCIET/index.asp 522 [email protected]
HORIZONTAL LOAD APPLICATIONTYPICAL CROSS SECTION OF METRO BRIDGE
P 1 "SUPER STRUCTURE LOAD"
P 2 "PEDESTAL LOAD"
P 3 "PIER CAP LOAD"
P 4 "PIER LOAD"
Figure 11: Typical Metro Rail Bridge with Seismic Force application (IITK-RDSO GUIDELINES) [18]
(NOTE: Dimensions are in meter)
5.5. Modelling of Piles
The Bored cast in situ concrete piles are modeled as column with specified lateral and axial
stiffness. The Pile Diameter 1200mm was recommended by the Contractors availability of Rig
Machine. The Pile length was calculated based on the recommended Vertical Capacity of
Single pile was 5000kN. The pile was considered has “End Bearing Pile” socketing in to rock.
The ultimate pile load capacity was estimated by means of static formula based IRC 78:2000 [19], IS 2911:2010 [20] and IS 14593:2003 [21]. The Frictional resistance in soil was ignored and
length of pile was calculated based on “End Bearing” in Rock and “Frictional Resistance” in
weathered rock alone. In the present study, the length of pile was estimated to be 17m.
5.6. Modelling of Soil
Soil is an extremely nonlinear material when subjected to large deformation and its stiffness
also varies with depth. The pile foundation behavior when subjected to seismic loading
significantly depends on the soil-pile interaction. Several analytical and semi-empirical
methods have been adopted in practice to model the soil-pile interaction including (a)
Continuum model, (b) Numerical Finite element model, and (c) Winkler spring model

Site-Specific Seismic Response Analysis of Metro Rail Bridge
http://www.iaeme.com/IJCIET/index.asp 523 [email protected]
In this study, the soil interacting with the foundation of the structure was represented by
Winkler springs. Three types of soil springs (Winkler type) are used in the present analysis
(Figure 12)
Axial soil springs (t-z springs): representing soil resistance at pile surface along its
length,
Lateral soil springs (p-y springs): representing the lateral resistance of soil to the
piles, and
End bearing springs (q-z springs): representing the end bearing of soil at the bottom
of the piles
Figure 12: Schematic Showing Soil Springs along the Pile depth
The Joint springs was considered for the Pile foundation model. Spring constant k (Modules
of subgrade reaction) was obtained for the joint springs by referring to API guidelines [22].
Since, the pile is resting on the Hard Rock, the End bearing springs (q-z springs) has been
considered as “Pin Support condition”.
The Area springs was considered for the Under Ground Station model. Spring constant k
was obtained for the area springs by referring to “Modulus of Subgrade Reaction Ks” has
illustrated in “Foundation Analysis – BOWLES” [23] and the Multi linear spring was calculated
by considering 50mm settlement (Allowable settlement for Raft foundation). A 3-D linear
model was constructed in a finite element program STAAD V8i [17] to analyze the foundation
as a whole.
6. PARAMETRIC STUDY
The Metro Rail Bridge under the seismic excitation has been analyzed for the pier supported
on three approaches, namely, pier with fixed supports, pier with supports accounting for soil-
flexibility with pile foundation and pier supporting on underground station box. Studying the
site response of the soil using the RSP Matching and SHAKE software’s and Equivalent Static,
Response Spectrum and Time History analysis is done using finite element software STAAD
V8i [17] (Linear) in order to find the variation in Natural Time Period ‘Tn’, Bending Moment
(M) in pier and Deflection ‘Δ’ of super structure by incorporating soil flexibility as compared
to structures with conventional fixed base. These are discussed one by one as followed.
6.1. Natural Time Period (Tn)
The variation in Natural Time Period of structure for the fixed base support, Pile support and
Box support is tabulated in Table 7 and 8. Empirical equations given by IITK-RDSO [18]

Basavana Gowda G.M, Harsha G.M and Govindaraju L
http://www.iaeme.com/IJCIET/index.asp 524 [email protected]
guidelines were used for the calculation of time Period (Tn) of the structure and compared
withSTAAD (V8i) for the Fixed base support. “Rayleigh Method” has been adopted to
calculate the “Fundamental Natural Time Period” of the Structure in STAAD (V8i) [17]. Default
STAAD Calculates “Tn”as per IS 1893–part I: 2002 [4] for RC structure. Hence, the Time Period
in longitudinal and transverse direction of the Bridge Pier [Cantilever Structure] shall be
assigned manually using STAAD by Rayleigh Frequency Approach.
Table 7: Fundamental Time Period for Different Support Conditions (Longitudinal Direction)
Type of
Support
Fixed Base
Support (Manual)
Fixed Base Support
(STAAD)
Pile Support
(STAAD)
Box Support
(STAAD)
Time Period
(Tn) 0.454 0.492 0.659 0.659
Table 8: Fundamental Time Period for Different Support Conditions (Transverse Direction)
Type of
Support
Fixed Base
Support (Manual)
Fixed Base Support
(STAAD)
Pile Support
(STAAD)
Box Support
(STAAD)
Time Period
(Tn) 0.914 0.969 1.091 1.091
From the results of detailed study, it has been shown that the Fundamental period is more
for pile and box supported structure due to flexibility of the surrounding soil and time
period obtained for the Fixed Base (STAAD) was similar to the time period calculated for the
Fixed Base (Manual - As per IITK-RDSO guidelines [18]).
6.2. Seismic forces and Base Shear (VB)
The seismic forces for the Metro Rail Bridge Structure was estimated by “Seismic Coefficient
Method” (Single Mode Method), Response Spectrum Method (Multi Mode Method) and Time
History Method in following cases. Design Horizontal Seismic force (Ah) was calculated from
Equation 3.
Ah = Z
2x
I
Rx
Sa
g 3
Base Shear (VB) was computed from the Eq. 4
VB = Ah x Wi 4
Where,
(Z) Zone factor, (I) Importance factor, (R) Response reduction factor, (Sa/g) Bridge
Flexibility factor and (Wi) Seismic Weight of the structure. Base Shear evaluated for various
methods under different support conditions are presented in Table 9 and Table 10
Table 9: Base Shear for various methods with Different Support Conditions (LONGITUDINAL)
Base Shear (VB)
Method of Analysis
Manual Static Response Time
History
Type
of
Support
Fixed Support 490.0 490.0 490.0 490.0
Pile Support 404.5 404.4 404.5 404.5
Box Support 481.2 480.9 480.9 480.6

Site-Specific Seismic Response Analysis of Metro Rail Bridge
http://www.iaeme.com/IJCIET/index.asp 525 [email protected]
Table 10: Base Shear for various methods with Different Support Conditions (TRANSVERSE)
Base Shear (VB)
Method of Analysis
Manual Static Response Time
History
Ty
pe
of
Su
pp
ort
Fixed Support 331.8 310.4 310.4 310.4
Pile Support 275.8 275.8 275.8 275.8
Box Support 292.3 292.7 292.3 292.3
From the results of detailed study, it has been shown that the Dynamic analysis performed
either by the Time History method or by the Response Spectrum Method are matching to the
Base Shear obtained from Static Method (Calculated using a fundamental period Tn).It has
been observed that the reduction in base shear for the Box support and further reduction in base
shear for Pile support. Base shear is more in case of fixed support for all the three types of
analysis in comparison with pile and box support due to more stiffness offered at the support
level.
6.3. Pier Bending Moment (M)
The Variation in Pier Bending Moment at the top of Pile Cap was evaluated for various methods
of analysis under different support conditions are represented in Figure 13 and 14
Figure 13: Variation of Bending Moment (LONGITUDINAL)

Basavana Gowda G.M, Harsha G.M and Govindaraju L
http://www.iaeme.com/IJCIET/index.asp 526 [email protected]
Figure 14: Variation of Bending Moment (TRANSVERSE)
From the results of detailed study, it has been shown that the Bending Moment
In the Longitudinal direction of the Bridge, Maximum Bending moment was 5775kN-m
for the Fixed Base support (Equivalent Static Analysis) and Minimum Bending moment was
4616kN-m for the Pile Support (Equivalent Static Analysis)
Bending moment is more for fixed support condition at the pile cap level by all the three
methods of analysis (Equivalent Static, Response Spectrum and Time history method) whereas
at the top of pile, BM has reduced. Since the flexibility of soil is induced at the level of Pile
cap, it has resulted in more bending moment.
In the Transverse direction of the Bridge, Maximum Bending moment was 3714.31kN-m
for the Fixed Base support (Time History Analysis) and 3667kN-m for the Fixed Base Support
(Equivalent Static Analysis) and Minimum Bending moment was 3166kN-m for the Pile
Support (Equivalent Static Analysis)
6.4. Pier Deflection (Δ)
The Variation in Pier Deflection at the CG of Viaduct was evaluated for various methods with
different support conditions are presented in Figure 15 and 16.
In the Longitudinal direction of the Bridge, Maximum Deflection was 8.953mm for the
Fixed Base support (Time History Analysis) and Minimum Deflection was 5.135mm for the
Fixed Support (Response Spectrum Analysis).

Site-Specific Seismic Response Analysis of Metro Rail Bridge
http://www.iaeme.com/IJCIET/index.asp 527 [email protected]
Figure 15: Variation of Pier Deflection (LONGITUDINAL)
In the Transverse direction of the Bridge, Maximum Deflection was 10.912mm for the
Fixed Base support (Time History Analysis) and Minimum Deflection was 8.115mm for the
Fixed Support (Equivalent Static Analysis).
Figure 16: Variation of Pier Deflection (TRANSVERSE)
There is increase in pier deflection from height 9.75m to 12.0m for fixed support. SSI effect
reduces the displacement of superstructure for both Box support and Pier support condition due
to flexibility offered by the soil at the pile cap level while for the fixed support condition, it
results in more deflection.

Basavana Gowda G.M, Harsha G.M and Govindaraju L
http://www.iaeme.com/IJCIET/index.asp 528 [email protected]
CONCLUSIONS
1. Spectrum compatible time histories of acceleration developed from wavelet
based target spectrum matching, using computer model RSPMatch2005
for the required PGA at bed rock for the study site was identical to the Rock
level PGA Map for Bengaluru region developed by Sitharam et. al. (2005).
2. The Time period of the structure was 6 to18 times more than the Characteristic
Site Period (0.024sec to 0.068sec) obtained based on the shear wave velocity Vs
(Equation 2). Therefore the Resonance will not occur for the Bridge Structure
near the study site.
3. Based on the average shear wave velocity of 603.05m/sec measured at 3m
interval up to a depth of 21m, as per NEHRP, the study site will be classified as
“Site class C” (Very dense Soil)
4. Site Specific Response analysis for the study site shows a Peak Ground
Acceleration at ground surface was 0.485g against 0.1g for the Bengaluru region
(As per SI 1893:2002) with an amplification factor 3.17.
5. The maximum spectral acceleration at ground surface was 1.6117. Further, the
response spectrum obtained for the study site was exceeding the current I.S.
code specified values at some period.
6. The increase in time period of vibration is 18% and 31% in the Longitudinal
direction and 11% and 16% in transverse vibration of Bridge structure for Box
support and Pile support respectively compared to conventional Fixed base
support
7. Variation in Pier Bending Moment in the longitudinal direction (20%) and
transverse direction (13.6%) of the Bridge was less for the Pile support
compared to the conventional fixed base support (Equivalent Static Analysis).
8. The Deflection has increased by 74.35% in the longitudinal direction and 34.5%
in the transverse direction for the pile support (Time History Analysis)
compared to conventional Fixed support (Equivalent Static Analysis).
CONFLICT OF INTEREST
The authors declare that there is no conflict of interest regarding the publication of this journal
paper.
ACKNOWLEDGEMENTS
First and foremost, we express our sincere gratitude to Mr. V.L. Prasad and Mr. M.M. Raju for
the continuous support extended for the research, for their patience, motivation, enthusiasm,
and immense knowledge. Their guidance helped us in all the time of research. The study was
also made possible by the support of Bangalore metro rail corporation limited (BMRCL). The
authors grateful to M/s CEC-SOMA-CICI-JV (UG-2) and Mr. Shiva Kumar-Design Expert
(M/s MOTT) consultants for their assistance.

Site-Specific Seismic Response Analysis of Metro Rail Bridge
http://www.iaeme.com/IJCIET/index.asp 529 [email protected]
REFERENCES
[1] Anbazhagan, P., and T. G. Sitharam. "Seismic microzonation of Bangalore, India." Journal
of Earth System Science 117, no. 2 (2008): 833-852.
[2] Sitharam, T. G., and L. Govinda Raju. "Seismic Response of Soils a case study of Site
Specific Ground Response Analysis." In Indian Geotechnical Conference, vol. 14, p. 16.
2006.
[3] Poulos, H. G., & Davis, E. H. (1980). Pile foundation analysis and design (No. Monograph).
[4] Standard, I. (1893). Criteria for earthquake resistant design of structures. Bureau of Indian
Standards, Part, 1.
[5] Nandy, D. R. "Need for seismic microzonation of Kolkata megacity." In Proceedings of
workshop on microzonation, Indian Institute of science, Bangalore, India, vol. 2627. 2007.
[6] [6] CEC-SOMA-CICI JV conducted “Geotechnical investigation at Station and Tunnel
Locations – Bangalore Metro UG 2” through M/s SECON Private Limited. Soil report
2010.
[7] Dobry, R., R. D. Borcherdt, C. B. Crouse, I. M. Idriss, W. B. Joyner, G. Rinne Martin, M.
S. Power, E. E. Rinne, and R. B. Seed. "New site coefficients and site classification system
used in recent building seismic code provisions." Earthquake spectra 16, no. 1 (2000): 41-
67.
[8] Kanlı, Ali Ismet, Péter Tildy, Zsolt Prónay, Ali Pınar, and László Hermann. "VS 30
mapping and soil classification for seismic site effect evaluation in Dinar region, SW
Turkey." Geophysical Journal International 165, no. 1 (2006): 223-
235.doi.org/10.1111/j.1365-246X.2006.02882.x
[9] Todorovska, M. I., & Trifunac, M. D. (1990). Analytical model for in plane building-
foundation-soil interaction: incident p-, sv-and rayleigh waves.
[10] Hancock, Jonathan, Jennie Watson-Lamprey, Norman A. Abrahamson, Julian J. Bommer,
Alexandros Markatis, E. M. M. A. McCOY, and Rishmila Mendis. "An improved method
of matching response spectra of recorded earthquake ground motion using
wavelets." Journal of earthquake engineering 10, no. spec01 (2006): 67-
89.doi.org/10.1080/13632460609350629
[11] RSPMatch2005, A computer program for performing a time domain modification of an
acceleration time history to make it compatible with a user specified target spectrumThe
original computer code was written by N.A. Abrahamson (1993) and subsequently updated
by J. Hancock et. al (2006).
[12] Steven L. Kramer. “Geotechnical Earthquake Engineering”, Prentice Hall, Upper Saddle
River, New Jersey, 1996, pp. 308 – 347.
[13] Seed, H. B., & Idriss, I. M. (1970). Soil moduli and damping factors for dynamic analysis.
Report No. EERC 70-10. University of California, Berkeley.
[14] Schnabel, P., Lysmer, J., & Seed, H. B. (1972). SHAKE: a computer program for
conducting equivalent linear seismic response analysis of horizontally layered soil
deposits. Earthquake Engineering, Research Center, University of California in Berkeley,
Report No. UCB/EERC, 72, 12.
[15] Gazetas, G. (1998). Seismic soil-structure interaction: New evidence and emerging issues
State of the Art Paper. In Geotechnical Earthquake Engineering and Soil Dynamics Geo-
Institute ASCE Conference.
[16] CEC-SOMA-CICI JV (Contractors) were nominated for the construction of Bengaluru
Metro, Design consultants were M/s MOTT MAC Donald, Bengaluru.
[17] STAAD (V8i), A structural analysis and design computer program, It was originally
developed by Research Engineers International at Yorba Linda, CA in year 1997. In late
2005, Research Engineers international was brought by Bentley Systems
Basavana Gowda G.M, Harsha G.M and Govindaraju L
http://www.iaeme.com/IJCIET/index.asp 530 [email protected]
[18] IIT-Kanpur RDSO guidelines on Seismic design of Railway Bridges, Government of India-
Ministry of Railways, Research Design and Standards Organization, Lucknow.
[19] Indian Roads Congress code of Standard Specifications and code of practice for Road
Bridges, Section VII, Foundation and Substructure, IRC: 78-2000. The Indian Roads
Congress, New Delhi.
[20] Indian standard code for design and construction of pile foundations – code of practice,
part-1 concrete piles, section 2 bored cast in-situ concrete piles, IS 2911 (Part 1/Sec 2 ):
2010. Bureau of Indian Standards, New Delhi.
[21] Indian standard code for design and construction of bored cast-in-situ piles founded on
rocks – guidelines, IS 14593: 1998 (Reaffirmed 2003), Bureau of Indian Standards, New
Delhi.
[22] Recommended practice for planning, designing and constructing fixed offshore platforms
– working stress design, American Petroleum Institute (API) practice 2A-WSD (RP 2A-
WSD), API publishing services, 1220 L street, N.W., Washington, DC.
[23] Joseph E. Bowles, Foundation analysis and design, McGraw-Hill International editions,
Singapore, 1997, pp. 501 – 505.
[24] Ansal, Atilla, Gökçe Tönük, and Aslı Kurtuluş. "Implications of site specific response
analysis." In European Conference on Earthquake Engineering Thessaloniki, Greece, pp.
51-68. Springer, Cham, 2018.
[25] Shiuly, Amit, R. B. Sahu, and Saroj Mandal. "Site specific seismic hazard analysis and
determination of response spectra of Kolkata for maximum considered
earthquake." Journal of Geophysics and Engineering 14, no. 3 (2017): 466-477.
[26] Kumar, Shiv Shankar, Arindam Dey, and A. Murali Krishna. "Importance of site-specific
dynamic soil properties for seismic ground response studies: ground response
analysis." International Journal of Geotechnical Earthquake Engineering (IJGEE) 9, no. 1
(2018): 78-98.
[27] Jayamon, J. R., and F. A. Charney. "Multiple ground motion response spectrum match tool
for use in response history analysis." In Structures Congress 2015, pp. 2497-2509. 2015.