site visit presentation - group five visit presentation november 2007. ... •durban port widening...
TRANSCRIPT

SITE VISIT PRESENTATIONSITE VISIT PRESENTATIONNovember 2007

Agenda
Strategic UpdateStrategic Update
Operational Update
Appendix 1: Outlook
Appendix 2: Alliance
2
ppPartnering

Strategic Update
3

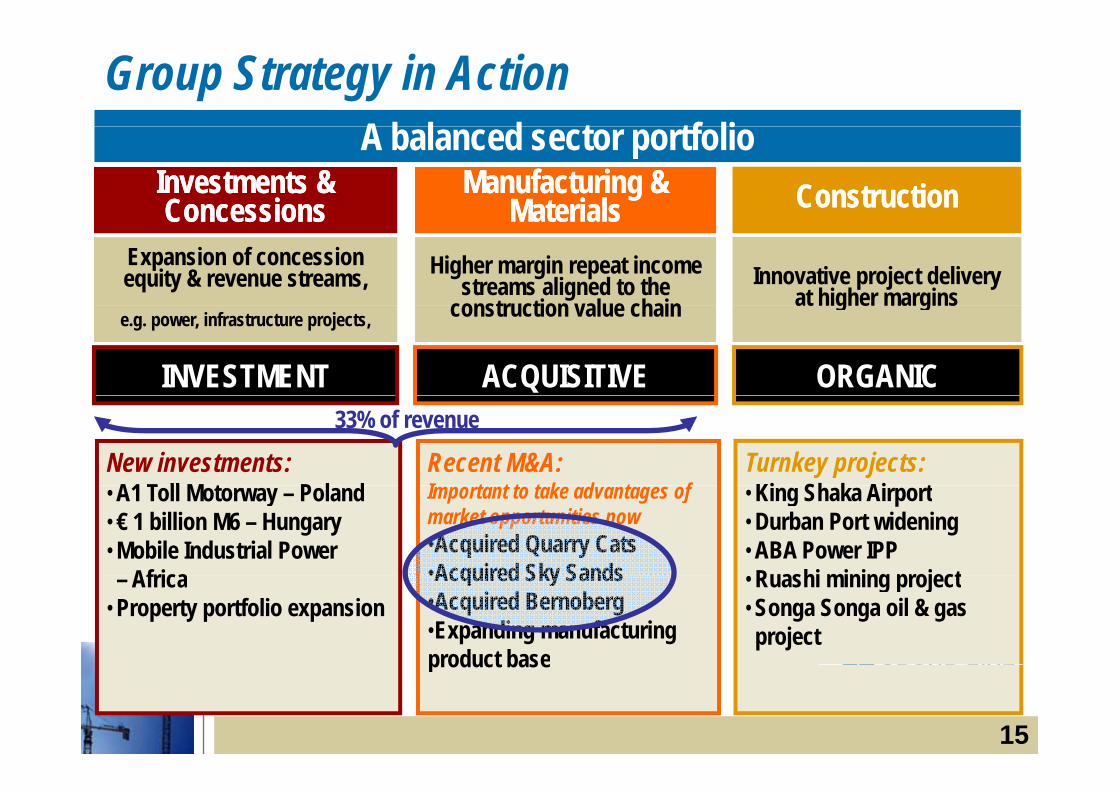
A b l d t tf liGroup Strategy in Action
A balanced sector portfolioInvestments & Investments & ConcessionsConcessions
Manufacturing & Manufacturing & MaterialsMaterials ConstructionConstructionConcessionsConcessions
Expansion of concession equity & revenue streams,
MaterialsMaterialsHigher margin repeat income
streams aligned to the construction value chain
Innovative project delivery at higher margins
e.g. power, infrastructure projects, construction value chain at g e a g s
INVESTMENT ACQUISITIVE ORGANIC
New investments:A1 T ll M t P l d
Recent M&A: I t t t t k d t f
Turnkey projects:Ki Sh k Ai t
33% of revenue
• A1 Toll Motorway – Poland• € 1 billion M6 – Hungary• Mobile Industrial Power
Africa
Important to take advantages of market opportunities now •Acquired Quarry Cats•Acquired Sky Sands
• King Shaka Airport• Durban Port widening• ABA Power IPPRuashi mining project– Africa
• Property portfolio expansion•Acquired Sky Sands•Acquired Bernoberg •Expanding manufacturing product base
• Ruashi mining project• Songa Songa oil & gas project
4
product base
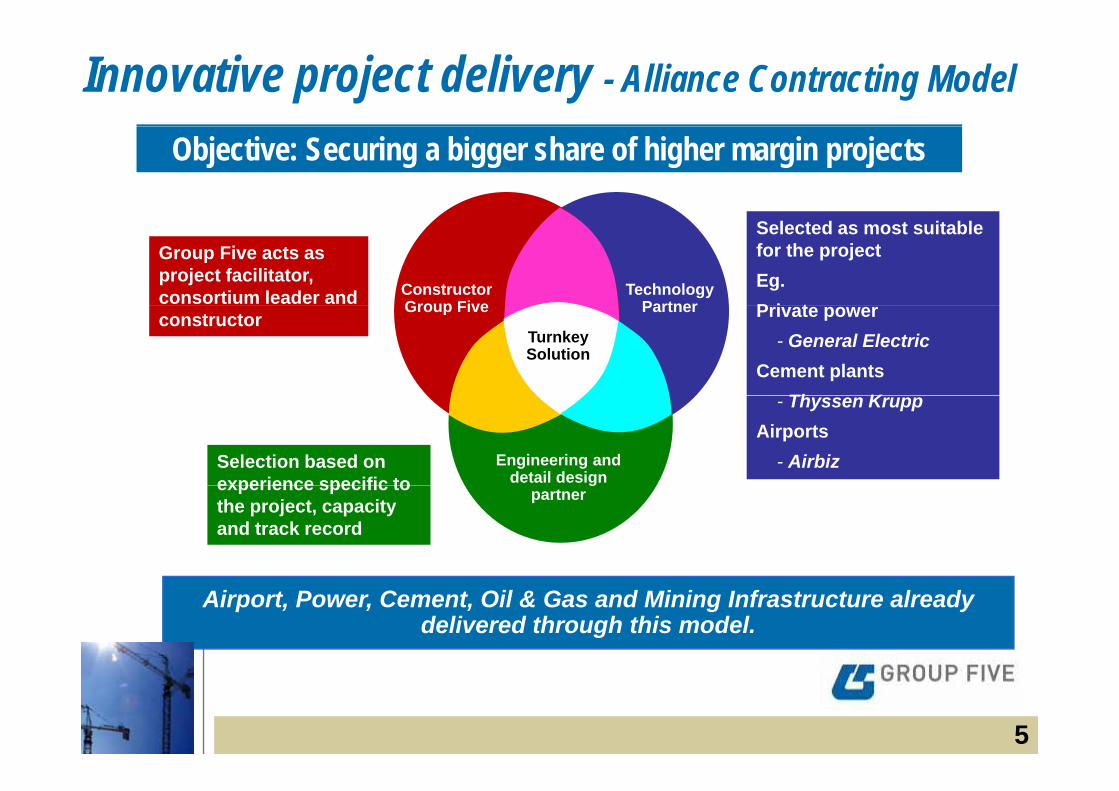
Innovative project delivery - Alliance Contracting Model
Objective: Securing a bigger share of higher margin projects
Selected as most suitable for the projectEg.P i t
Group Five acts as project facilitator, consortium leader and Technology
PartnerConstructorGroup Five Private power
- General ElectricCement plants
Th K
constructorPartnerGroup Five
Turnkey Solution
- Thyssen KruppAirports
- AirbizSelection based on experience specific to
Engineering and detail design experience specific to
the project, capacity and track record
gpartner
Airport, Power, Cement, Oil & Gas and Mining Infrastructure already delivered through this model.
5

Changed pattern of risk assumption on EPC’s through Alliancing in a consortium
EPC contract Alliance partnering
ContractorSub-
contractors Client G5 Partner Client
Process design riskProcess design risk
Detail design risk
Performance responsibility
C t ti Construction responsibility
Contract price riskContract price risk
6
Operational Update
7
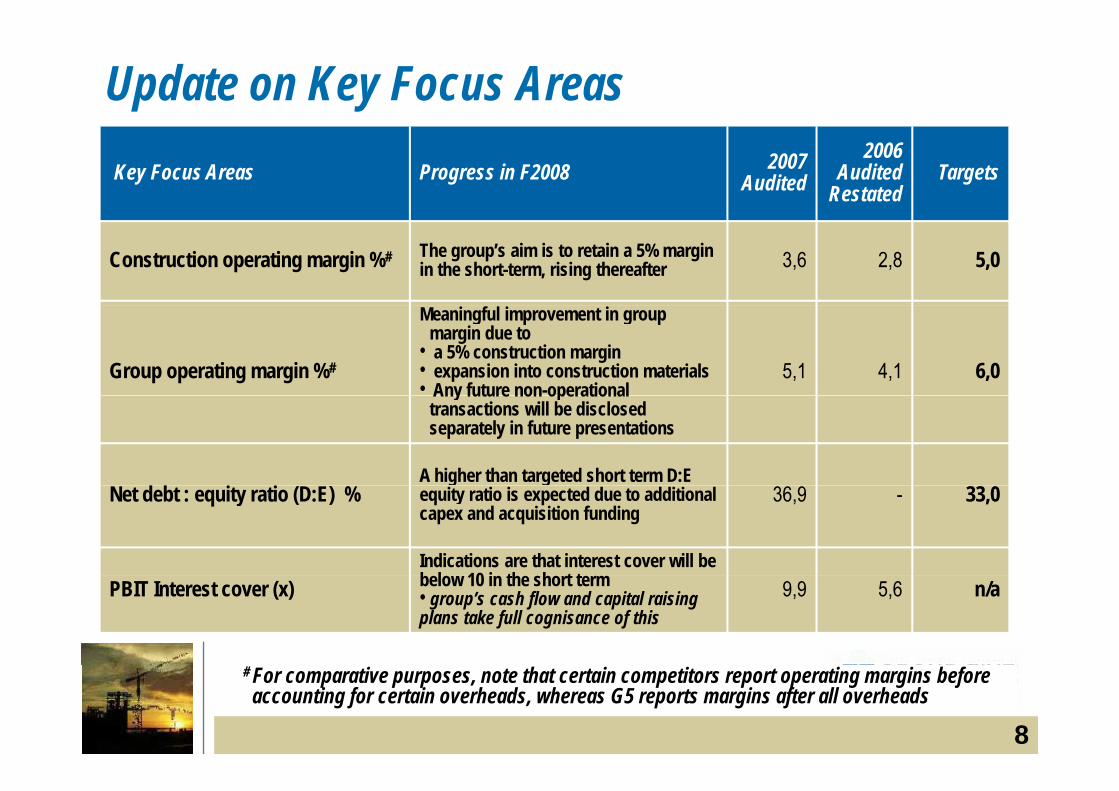
Update on Key Focus AreasKey Focus Areas Progress in F2008 2007
Audited2006
AuditedRestated
Targets
Construction operating margin %# The group’s aim is to retain a 5% margin in the short-term, rising thereafter 3,6 2,8 5,0
Group operating margin %#
Meaningful improvement in group margin due to
• a 5% construction margin • expansion into construction materials• Any future non-operational
5,1 4,1 6,0Any future non operational transactions will be disclosed separately in future presentations
A higher than targeted short term D:E Net debt : equity ratio (D:E) %
g gequity ratio is expected due to additional capex and acquisition funding
36,9 - 33,0
Indications are that interest cover will be b l 10 i th h t tPBIT Interest cover (x) below 10 in the short term• group’s cash flow and capital raising plans take full cognisance of this
9,9 5,6 n/a
8
# For comparative purposes, note that certain competitors report operating margins before accounting for certain overheads, whereas G5 reports margins after all overheads

Update on Key Focus AreasKey Focus Areas Progress in F2008 2007
Audited2006
AuditedRestated
Targets
C h i f f Cash remains an area of focus
• each contract is monitored on an individual basis for margins &cash
Cash and working capital (Rm)
• Advance payments expected on large contracts
• Increasing exposure to manufacturing and construction materials activities 60 391 Cash
=profitand construction materials activities that require working capital investment
• Work continues towards showing improved cash after working capital by interim stage
=profit
interim stage
• Recent smaller acquisitions have been funded via cash from operations
Return on shareholders interest %
The group’s strategy is designed to achieve this target in the medium-term 17% * 11% 25%
9* Annualised

Updated Construction order book – 12 month secured* as at 30 September 2007p
Rm 2007 F2008 order book @ Current 2008 Margin Estimated Rm (Actual) book @ 1July 07 order book F2008 Capacity
Building & H i 3 122 1 883 2 320 2 900& Housing 3 122 1 883 2 320 2 900
Civil Engineering 2 484 2 215 2 624 3 200
Engineering Projects 794 735 1 102 1 200
Total 6 401 4 833 6 046 7 300Total 6 401 4 833 6 046 7 300
Order book emphasis is focused on higher margin areas of activity rather than p g g yhigher turnover.
However the order books contains some older projects which are still in progress
A few older contracts are at completion stage & undergoing commercial resolution
10* For comparative purposes, note that certain competitors report > 12 months secured order book
A few older contracts are at completion stage & undergoing commercial resolution

New Projects Recently SecuredG5 Start Project Value G5
StakeStart Date Duration
Housing Scheme for Police Force and Army Offi R2 3bn R1 5bn Nov
200718
thOfficers - Dubai, Middle East R2,3bn R1,5bn 2007 months
Comment: Contract awarded at good margins, upfront payments obtained
Construction of Inyoni Retirement Village Phase 2 - South Africa R100m R100m Sept
200717
months
Comment: Contract awarded at higher margins than previously seen, no upfront payments obtained
Construction of laboratories auditorium and Construction of laboratories, auditorium and offices - University of Western Cape – South Africa
R311m R311m Sept 2007
24 months
Comment: Contract awarded at higher margins than previously seen, no upfront payments obtained Comment: Contract awarded at higher margins than previously seen, no upfront payments obtained
11

New Projects Recently SecuredProject Value G5
StakeStart Date Duration
Songa Songa Island Train 3 and 4 gas R196 R196 Jan 12 Songa Songa Island Train 3 and 4 gas processing facility – Songa Songa R196m R196m Jan
200812
monthsComment: Piping expansion of the gas processing facility, good tendered margins and upfront payments secured. Songa Songa is located 200km SE of Dar-Es-Salam p y g g
N17 Link Road for SANRAL – South Africa R316m R316m Sept 2007
26 months
Comment: Design and Construct of new road and bridges, good margin, no upfront payment
12
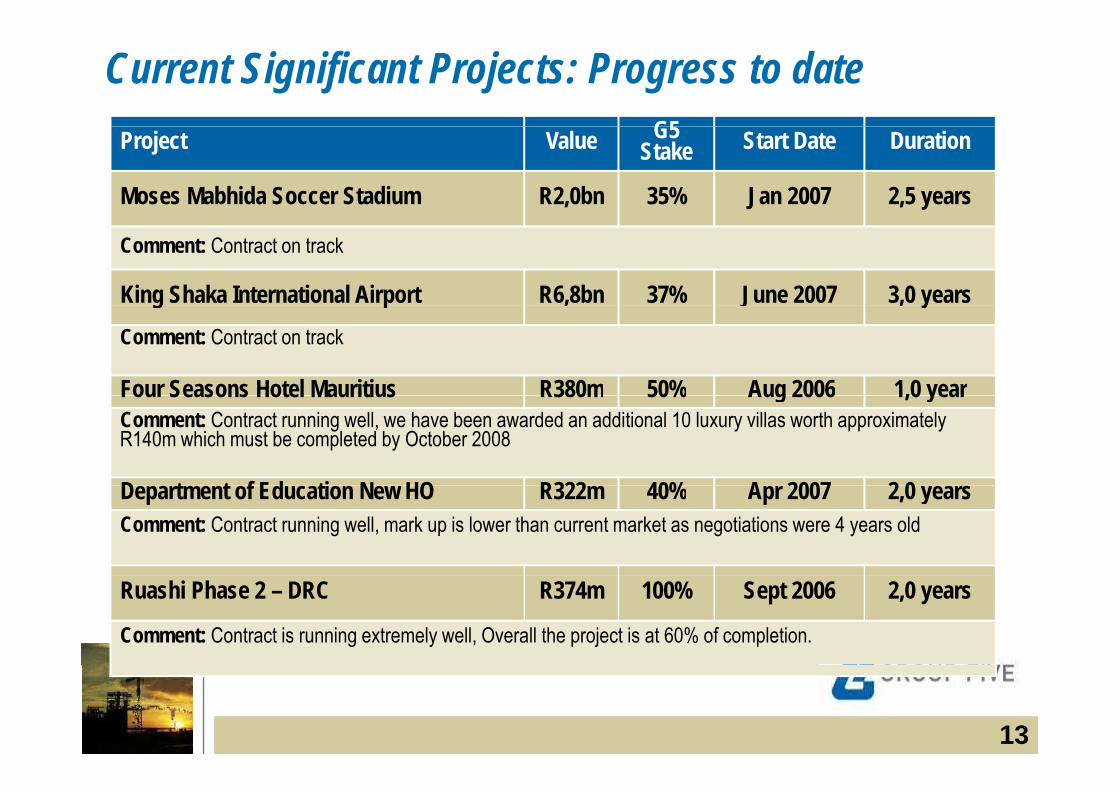
Current Significant Projects: Progress to dateG5 Project Value G5
Stake Start Date Duration
Moses Mabhida Soccer Stadium R2,0bn 35% Jan 2007 2,5 years
Comment: Contract on track
King Shaka International Airport R6,8bn 37% June 2007 3,0 yearsg p , , yComment: Contract on track
Four Seasons Hotel Mauritius R380m 50% Aug 2006 1,0 yearFour Seasons Hotel Mauritius R380m 50% Aug 2006 1,0 yearComment: Contract running well, we have been awarded an additional 10 luxury villas worth approximately R140m which must be completed by October 2008
D t t f Ed ti N HO R322 40% A 2007 2 0 Department of Education New HO R322m 40% Apr 2007 2,0 yearsComment: Contract running well, mark up is lower than current market as negotiations were 4 years old
Ruashi Phase 2 – DRC R374m 100% Sept 2006 2,0 years
Comment: Contract is running extremely well, Overall the project is at 60% of completion.
13

Current Significant Projects: Progress to dateP j t V l G5 St t D t D tiProject Value G5
Stake Start Date Duration
Dubai Duty Free Warehouse R424m 100% Dec 2006 1,5 years
Comment: Project complete; Expected margins achieved
Dubai Terminal 2 expansion R577m 100% Oct 2006 1,5 yearDubai Terminal 2 expansion R577m 100% Oct 2006 1,5 year
Comment: Project underway, some delays experienced
Tenke Fungurume – Copper Mine DRC R170m 100% July 2007 1,3 years
Comment: Commenced with mobilisation and procurement on the project. The installation work commences in the new calendar yeary
Durban Harbour: Entrance widening R1,8bn 65% May 2007 3,0 yearsComment: Contract started slowly but activities are underway and productions are at or above the level required in terms of the programme in terms of the programme.
ABA Power Project: Open Cycle Gas Turbine R458m 100% Oct 2007 1,5 years
14
yComment: Delay in signing of contract has resulted in contract to commence in January 2008 instead of October 2007
A b l d t tf liGroup Strategy in Action
A balanced sector portfolioInvestments & Investments & ConcessionsConcessions
Manufacturing & Manufacturing & MaterialsMaterials ConstructionConstructionConcessionsConcessions
Expansion of concession equity & revenue streams,
MaterialsMaterialsHigher margin repeat income
streams aligned to the construction value chain
Innovative project delivery at higher margins
e.g. power, infrastructure projects, construction value chain at g e a g s
INVESTMENT ACQUISITIVE ORGANIC
New investments:A1 T ll M t P l d
Recent M&A: I t t t t k d t f
Turnkey projects:Ki Sh k Ai t
33% of revenue
• A1 Toll Motorway – Poland• € 1 billion M6 – Hungary• Mobile Industrial Power
Africa
Important to take advantages of market opportunities now •Acquired Quarry Cats•Acquired Sky Sands
• King Shaka Airport• Durban Port widening• ABA Power IPPRuashi mining project– Africa
• Property portfolio expansion•Acquired Sky Sands•Acquired Bernoberg •Expanding manufacturing product base
• Ruashi mining project• Songa Songa oil & gas project
15
product base
G5 Construction Materials
16Tim Woodhead
Appendix 1: Outlook
17
Introduction to Market OutlookBalanced Geographic Portfolio
G5 has an established track record in its non-SA areas of operation in Africa the Middle East and Eastern Europein Africa, the Middle East and Eastern Europe
A small share of these markets, carefully chosen and well managed, should achieve higher margins
G5 maintains the ability to gear up quickly to take advantages of opportunities as the SA market improves, but it’s geographic diversity is a hedge improves, but it s geographic diversity is a hedge against slow SA infrastructure rollout
18

Market Outlook – MIDDLE EASTMainly Civil work with expansion into Engineering Project work
G5 Operations (established in early 2004 in partnershipwith Al Naboodah, the largest local contactor) have now progressed to a JVStrong, sustainable regional economic growth compound growth of 13% since 2000
United Arab Emirates:Abu Dhabi, Dubai,
Sharjah Ajmah Umm Al-growth, compound growth of 13% since 2000G5 focus in the region is Civils work in the United Arab Emirates
Sharjah Ajmah, Umm Al-Qaiwain,
Ras Al-Khaimah and FujairahUnited Arab Emirates Expansion into mechanical electrical piping(MEP) work is scheduled for F2008( )
19

Mega cargo terminal AX101 – Dubai
20

Jebel Ali Airport Tunnel Entrance– Dubai
21

Market Outlook – EASTERN EUROPEMainly Concession work
G5 focus: Toll road operations and investment, with substantial international partners such as Bouygues and Skanska
Pursuing further toll road opportunities in partnership with well-established international groups such as Skanska and Strabag
Sustainable growth opportunities through:
─ Capitalizing on G5’s (Intertoll) established H
Poland
p g ( )reputation in the region
─ The definitive trend towards tolling
Hungary
The definitive trend towards tolling of vehicles for the use of highways
22
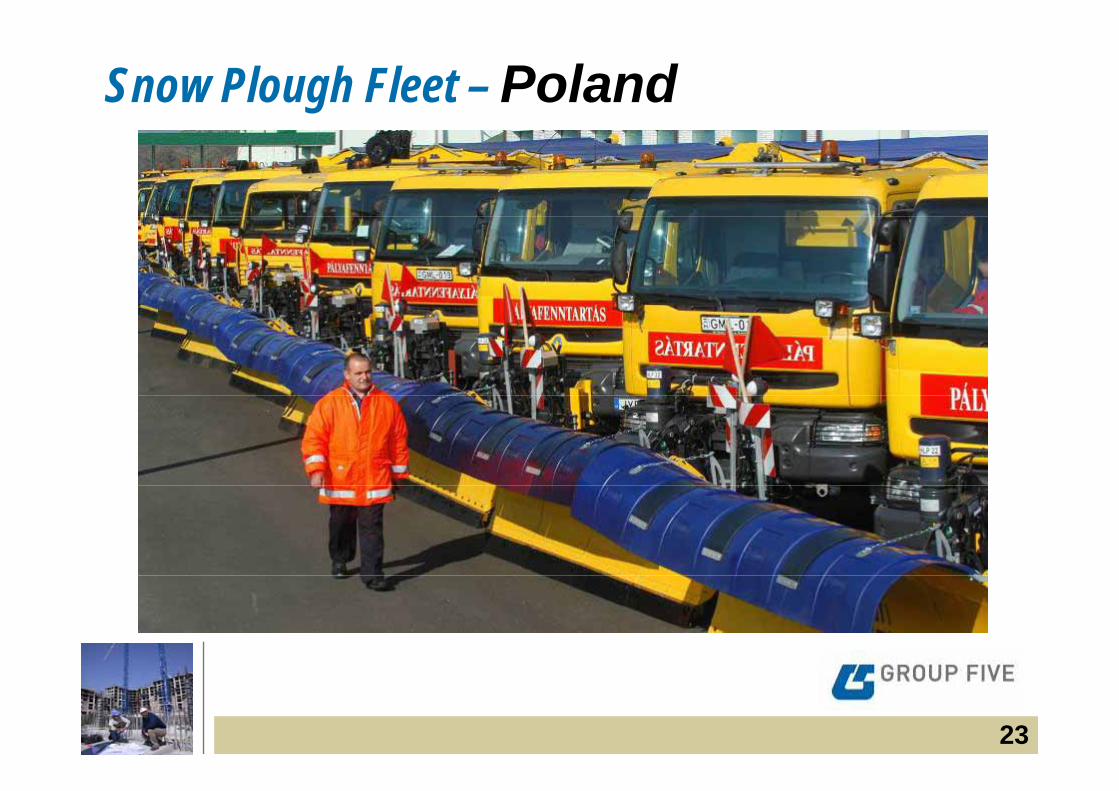
Snow Plough Fleet – Poland
23

Market Outlook – AFRICA & SOUTH AFRICACivil, Building and Engineering Project work
Transportation Transportation ─ Roads *─ Airports *
Rail *─ Rail *─ Ports *
Power─ Public *─ Private *
Mining & industrial *g Oil & gas *
─ West, Emerging East & Southern Africa Communications and TelecomCommunications and Telecom Public buildings & housing * ^ Waste, Water and Environment * ^
24* Group 5 target markets ^ South African focus
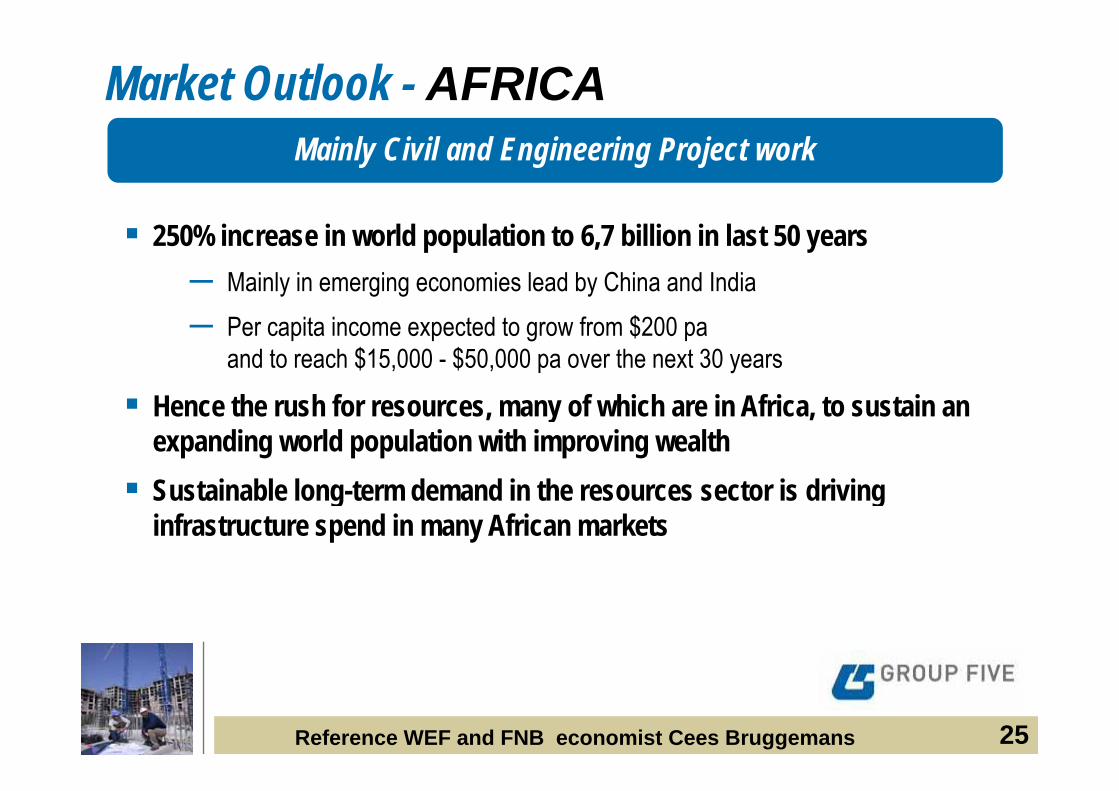
Market Outlook - AFRICAMainly Civil and Engineering Project work
250% increase in world population to 6,7 billion in last 50 years─ Mainly in emerging economies lead by China and India─ Per capita income expected to grow from $200 pa
and to reach $15,000 - $50,000 pa over the next 30 years
H h h f f hi h i Af i i Hence the rush for resources, many of which are in Africa, to sustain an expanding world population with improving wealth Sustainable long term demand in the resources sector is driving Sustainable long-term demand in the resources sector is driving
infrastructure spend in many African markets
25Reference WEF and FNB economist Cees Bruggemans

Market Outlook - AFRICAMainly Civil and Engineering Project work
Private Sector infrastructure spend on resources in Africa is a key G5 target market
Ab i─ Above-average margins─ Provides opportunity across a single project as we move to turnkey
solutionssolutions─ Provides a check against slow delivery by government of infrastructure
projects in SA
Public Sector infrastructure spend in Africa is not a G5 target marketSovereign payment governance and logistical risks─ Sovereign, payment, governance and logistical risks
─ Will only do under strict conditions
26

G5 Perspective of Opportunities in Selected CountriesAngola MadagascarMali• Cement
• Port
Namibia
• Mineral sands
• Mining• Roads/InfrastructureMozambique
• GoldGhana• Gold• Bauxite
• Uranium• Oil & Gas• Building• Water
Mozambique• Mineral sands• Coal• Gas
P ti
• PowerBenin• Power
CementBotswana• Power generation• Diamonds
G
• Power generationSouth Africa• Power generation• Nuclear power
• CementNigeria• Oil & Gas, LNG• Power
• Gas• WaterZambia• Copper/Cobalt
p• Coega development• 2010 soccer• Airports• Transport
• Infrastructure• Building• Housing• Cement
• CementTanzania• Gold• Oil
• Transport• Water• Housing• Building
Congo ROC• Potash• Forestry• Power generation
Sector Targeted Projects
Secured Projects
Transport R33 5bn R5 0bn • Oil• Power Generation
• Cement• Aluminium• Coal
• Power generationCongo DRC• Cobalt• Copper
Transport R33,5bn R5,0bnPower R21,7bn R2,9bnMining R5,2bn R2,0bnIndustrial R6,4bn R0,8bnOil & G R2 8b R0 2b
27
• Building• Roads
Oil & Gas R2,8bn R0,2bnTotal R69,6bn R10,9bn
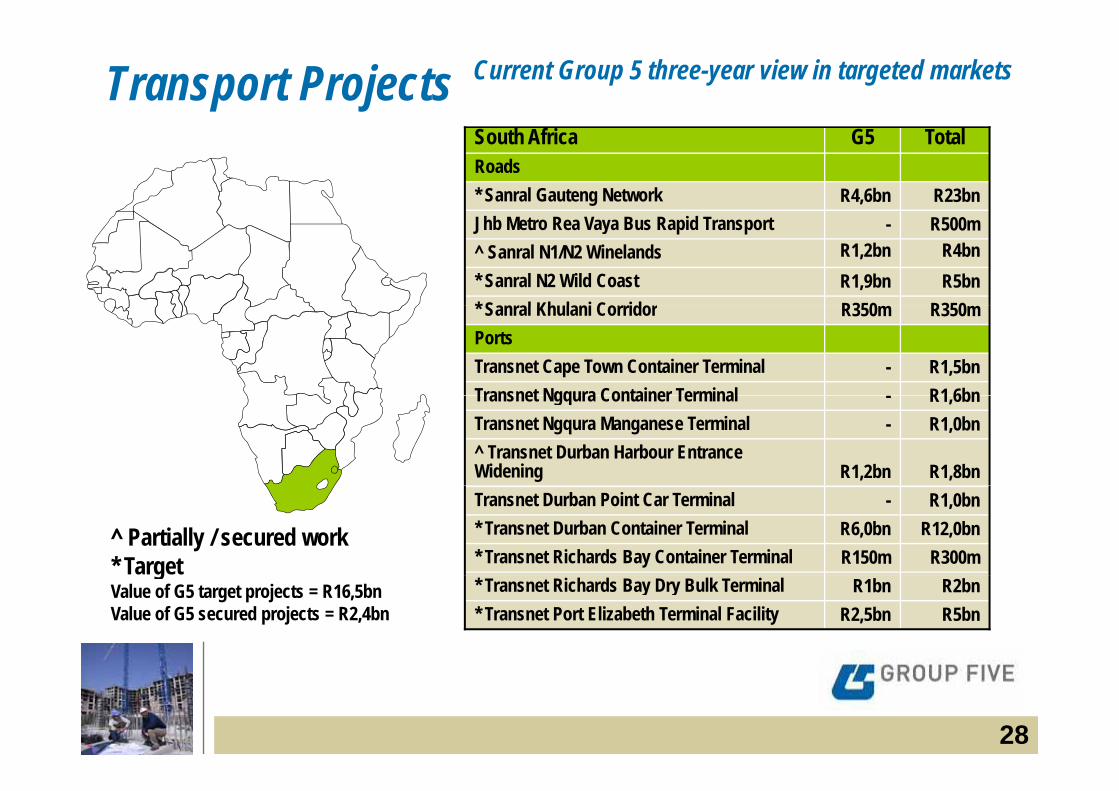
Transport Projects Current Group 5 three-year view in targeted markets
South Africa G5 TotalRoads* Sanral Gauteng Network R4,6bn R23bnJhb Metro Rea Vaya Bus Rapid Transport - R500m^ Sanral N1/N2 Winelands R1,2bn R4bn* Sanral N2 Wild Coast R1,9bn R5bn* Sanral Kh lani Corridor R350 R350* Sanral Khulani Corridor R350m R350mPortsTransnet Cape Town Container Terminal - R1,5bnTransnet Ngqura Container Terminal R1 6bnTransnet Ngqura Container Terminal - R1,6bnTransnet Ngqura Manganese Terminal - R1,0bn^ Transnet Durban Harbour Entrance Widening R1,2bn R1,8bn
^ Partially / secured work* Target
Transnet Durban Point Car Terminal - R1,0bn* Transnet Durban Container Terminal R6,0bn R12,0bn* Transnet Richards Bay Container Terminal R150m R300mg
Value of G5 target projects = R16,5bnValue of G5 secured projects = R2,4bn
* Transnet Richards Bay Dry Bulk Terminal R1bn R2bn* Transnet Port Elizabeth Terminal Facility R2,5bn R5bn
28
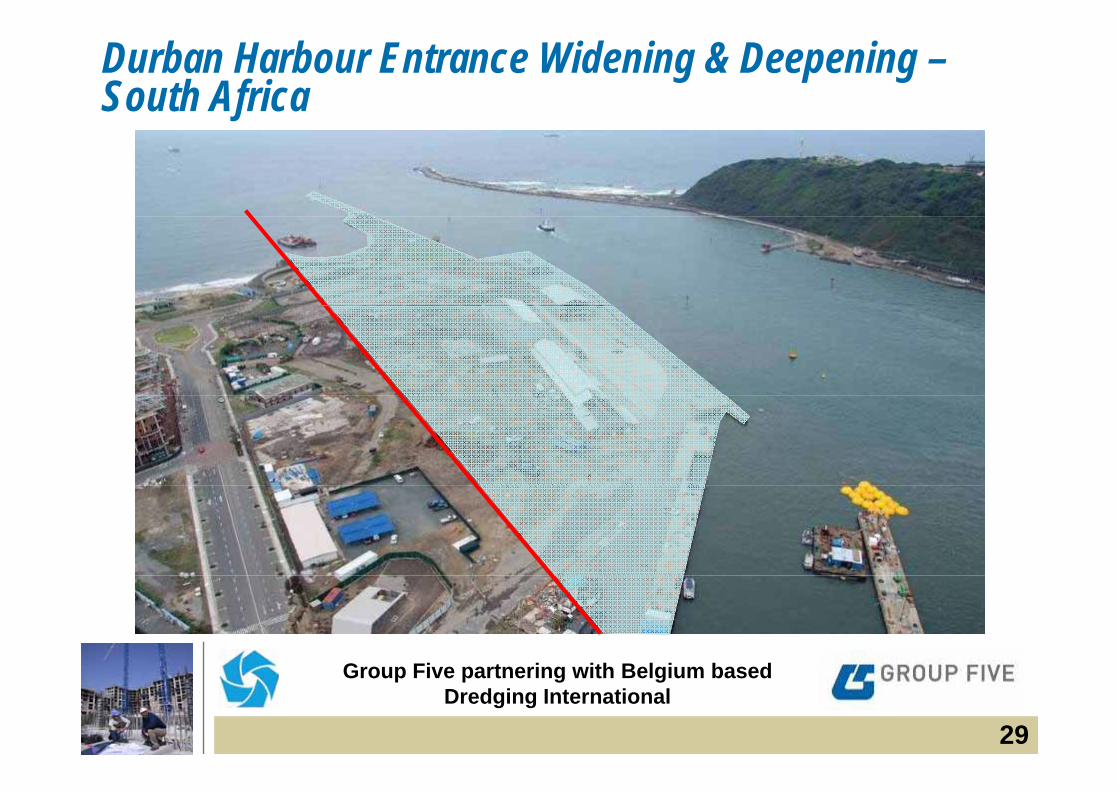
Durban Harbour Entrance Widening & Deepening –South Africa
G Fi t i ith B l i b d
29
Group Five partnering with Belgium based Dredging International
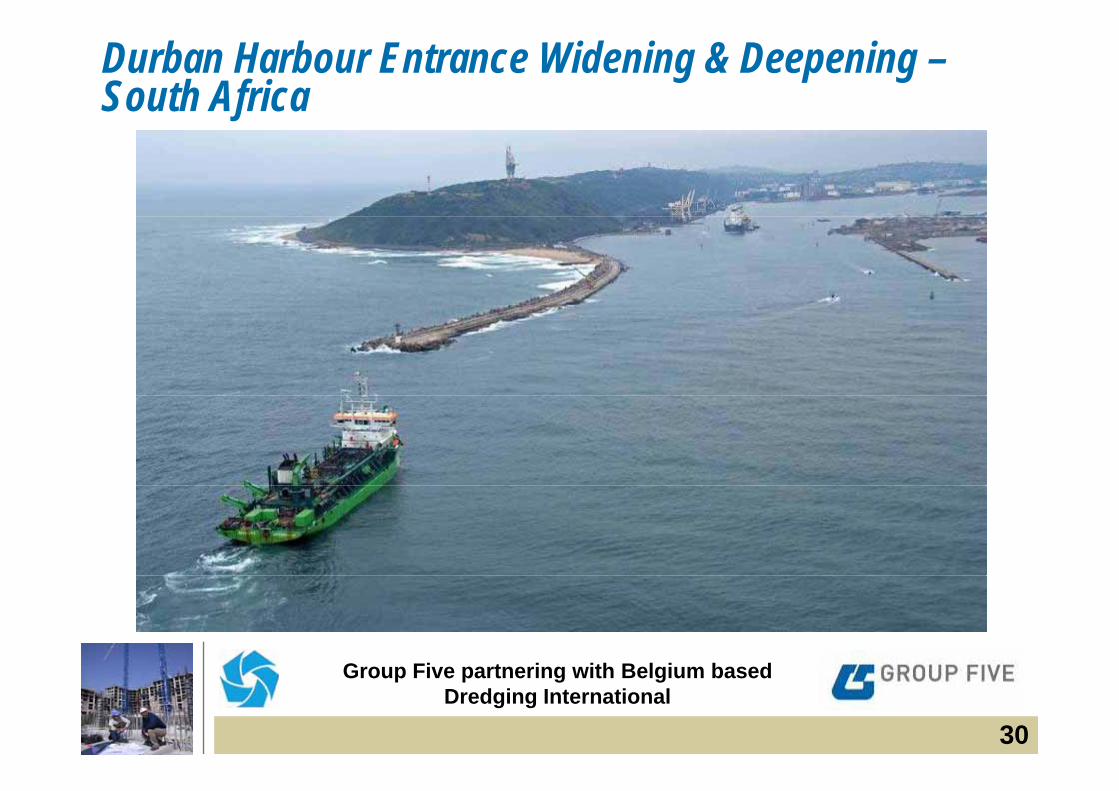
Durban Harbour Entrance Widening & Deepening –South Africa
G Fi t i ith B l i b d
30
Group Five partnering with Belgium based Dredging International
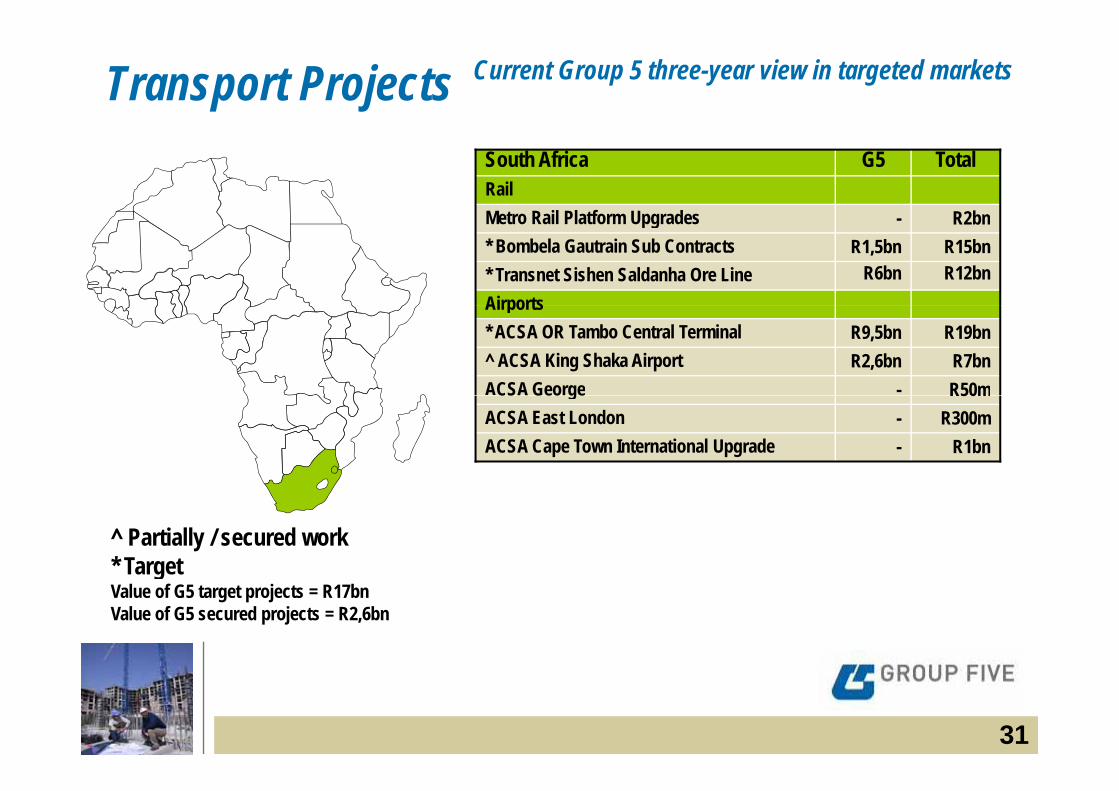
Transport Projects Current Group 5 three-year view in targeted markets
South Africa G5 TotalRailMetro Rail Platform Upgrades R2bnMetro Rail Platform Upgrades - R2bn* Bombela Gautrain Sub Contracts R1,5bn R15bn* Transnet Sishen Saldanha Ore Line R6bn R12bnAirportsAirports* ACSA OR Tambo Central Terminal R9,5bn R19bn^ ACSA King Shaka Airport R2,6bn R7bnACSA George - R50mCS Geo ge R50mACSA East London - R300mACSA Cape Town International Upgrade - R1bn
^ Partially / secured work* TargetgValue of G5 target projects = R17bnValue of G5 secured projects = R2,6bn
31

King Shaka International Airport – South Africa
32
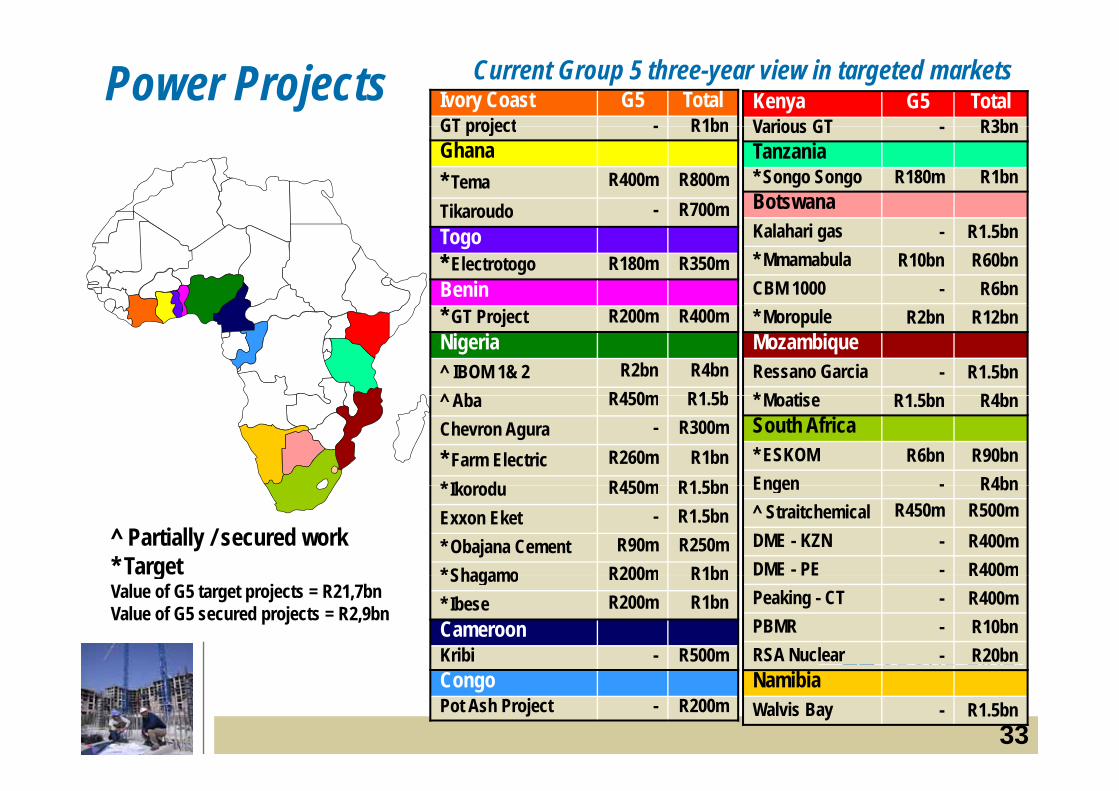
Power Projects Current Group 5 three-year view in targeted marketsIvory Coast G5 TotalGT project - R1bn
Kenya G5 TotalVarious GT R3bnGT project - R1bn
Ghana* Tema R400m R800mTikaroudo - R700m
Various GT - R3bnTanzania* Songo Songo R180m R1bnBotswanaTikaroudo 00
Togo** Electrotogo R180m R350mBenin
Kalahari gas - R1.5bn* Mmamabula R10bn R60bnCBM 1000 - R6bn
* GT Project R200m R400mNigeria^ IBOM 1& 2 R2bn R4bn^ Ab R450m R1 5b
* Moropule R2bn R12bnMozambiqueRessano Garcia - R1.5bn* M ti R1 5b R4b^ Aba R450m R1.5b
Chevron Agura - R300m* Farm Electric R260m R1bn* Ik d R450m R1 5bn
* Moatise R1.5bn R4bnSouth Africa* ESKOM R6bn R90bnEngen - R4bn
^ Partially / secured work* Target
* Ikorodu R450m R1.5bnExxon Eket - R1.5bn* Obajana Cement R90m R250m* Shagamo R200m R1bn
Engen - R4bn^ Straitchemical R450m R500mDME - KZN - R400mDME - PE - R400mg
Value of G5 target projects = R21,7bnValue of G5 secured projects = R2,9bn
Shagamo R200m R1bn* Ibese R200m R1bnCameroonKribi - R500m
DME PE R400mPeaking - CT - R400mPBMR - R10bnRSA Nuclear - R20bn
33
CongoPot Ash Project - R200m
NamibiaWalvis Bay - R1.5bn
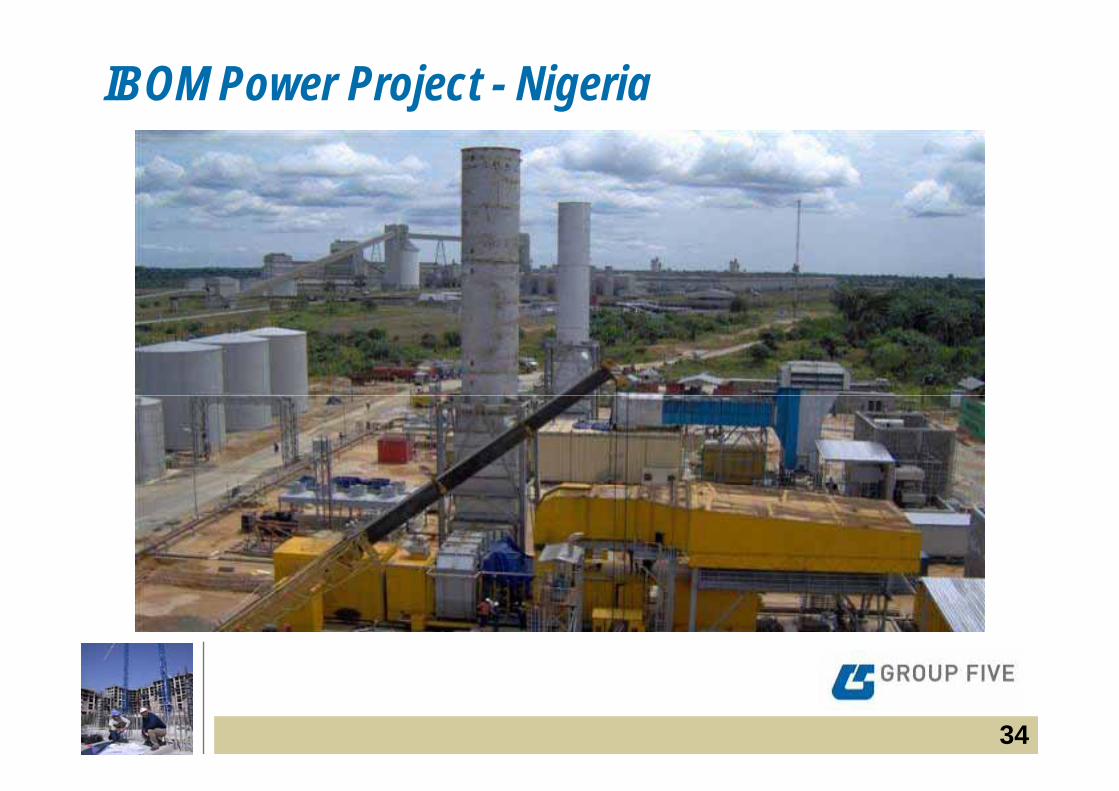
IBOM Power Project - Nigeria
34
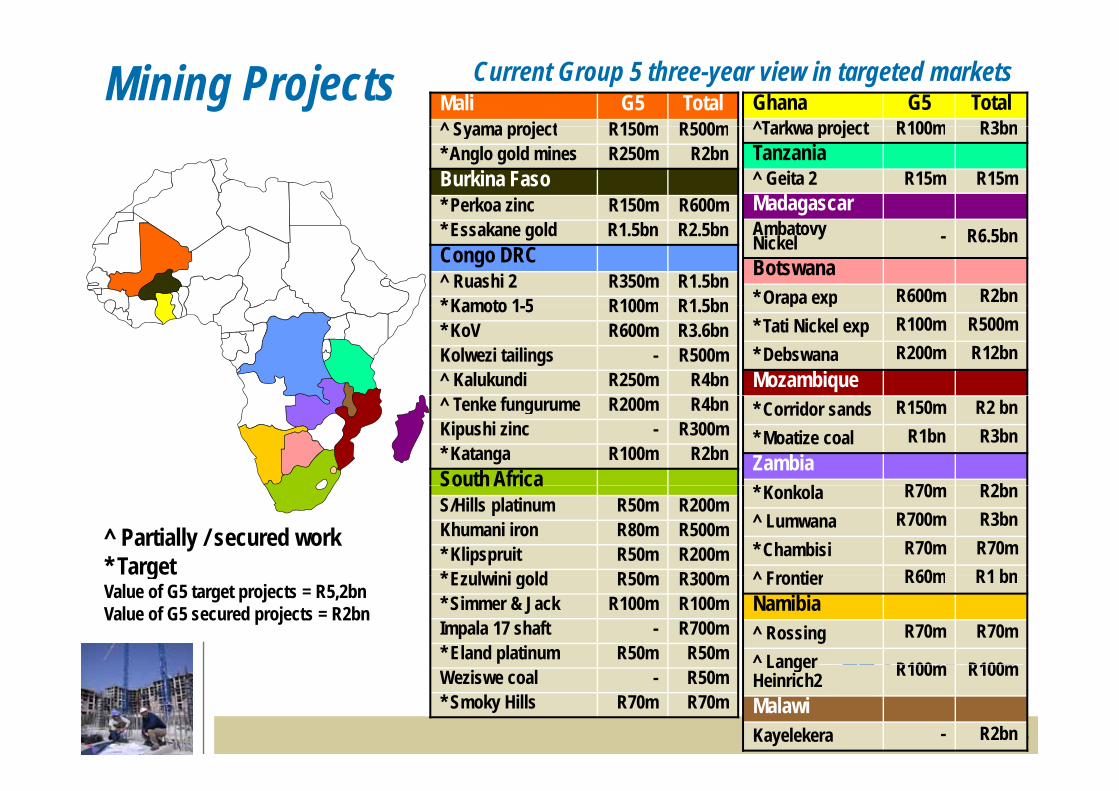
Mining Projects Current Group 5 three-year view in targeted marketsMali G5 Total^ Syama project R150m R500m
Ghana G5 Total^Tarkwa project R100m R3bn^ Syama project R150m R500m
* Anglo gold mines R250m R2bnBurkina Faso* Perkoa zinc R150m R600m
^Tarkwa project R100m R3bnTanzania^ Geita 2 R15m R15mMadagascar
* Essakane gold R1.5bn R2.5bnCongo DRC^ Ruashi 2 R350m R1.5bn* Kamoto 1 5 R100m R1 5bn
Ambatovy Nickel - R6.5bnBotswana* Orapa exp R600m R2bn Kamoto 1-5 R100m R1.5bn
* KoV R600m R3.6bnKolwezi tailings - R500m^ Kalukundi R250m R4bn
p p* Tati Nickel exp R100m R500m* Debswana R200m R12bnMozambique
^ Tenke fungurume R200m R4bnKipushi zinc - R300m* Katanga R100m R2bnSouth Africa
* Corridor sands R150m R2 bn* Moatize coal R1bn R3bnZambia
R70 R2bSouth AfricaS/Hills platinum R50m R200mKhumani iron R80m R500m* Klipspruit R50m R200m* E l i i ld R50 R300
* Konkola R70m R2bn^ Lumwana R700m R3bn* Chambisi R70m R70m^ Frontier R60m R1 bn
^ Partially / secured work* Target * Ezulwini gold R50m R300m
* Simmer & Jack R100m R100mImpala 17 shaft - R700m* Eland platinum R50m R50m
^ Frontier R60m R1 bnNamibia^ Rossing R70m R70m^ Langer R100 R100
gValue of G5 target projects = R5,2bnValue of G5 secured projects = R2bn
35
Weziswe coal - R50m* Smoky Hills R70m R70m
Langer Heinrich2 R100m R100m
MalawiKayelekera - R2bn
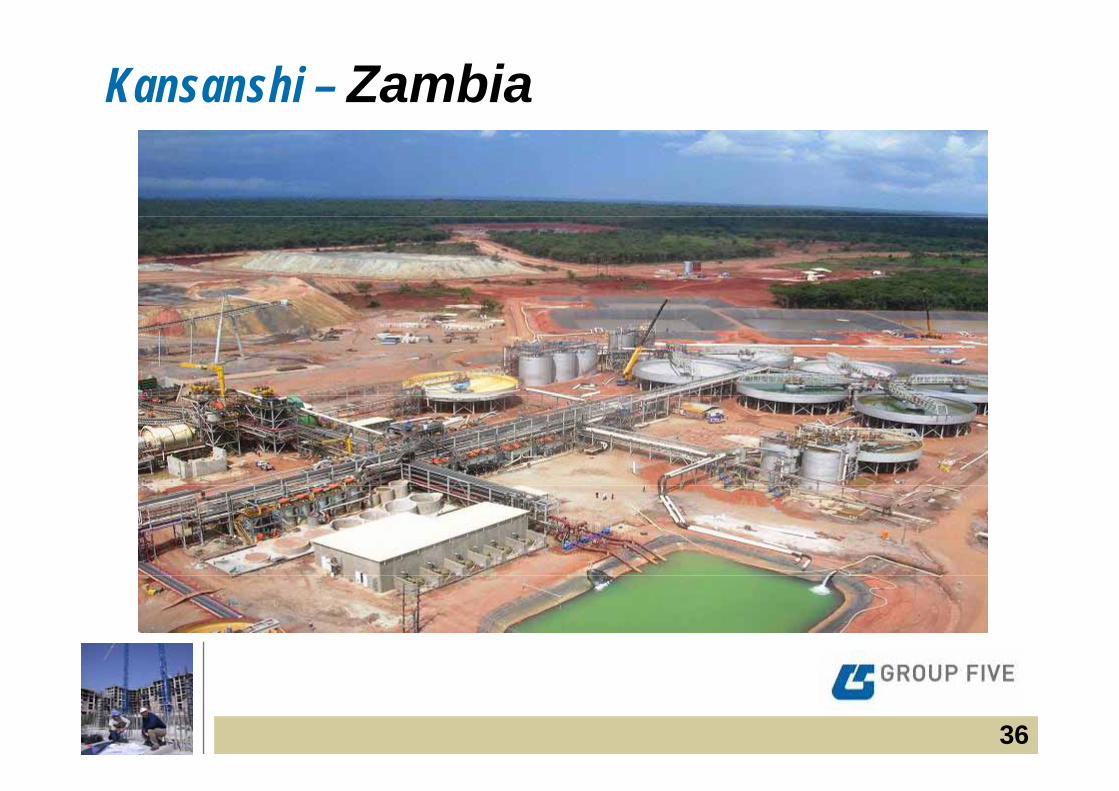
Kansanshi – Zambia
36
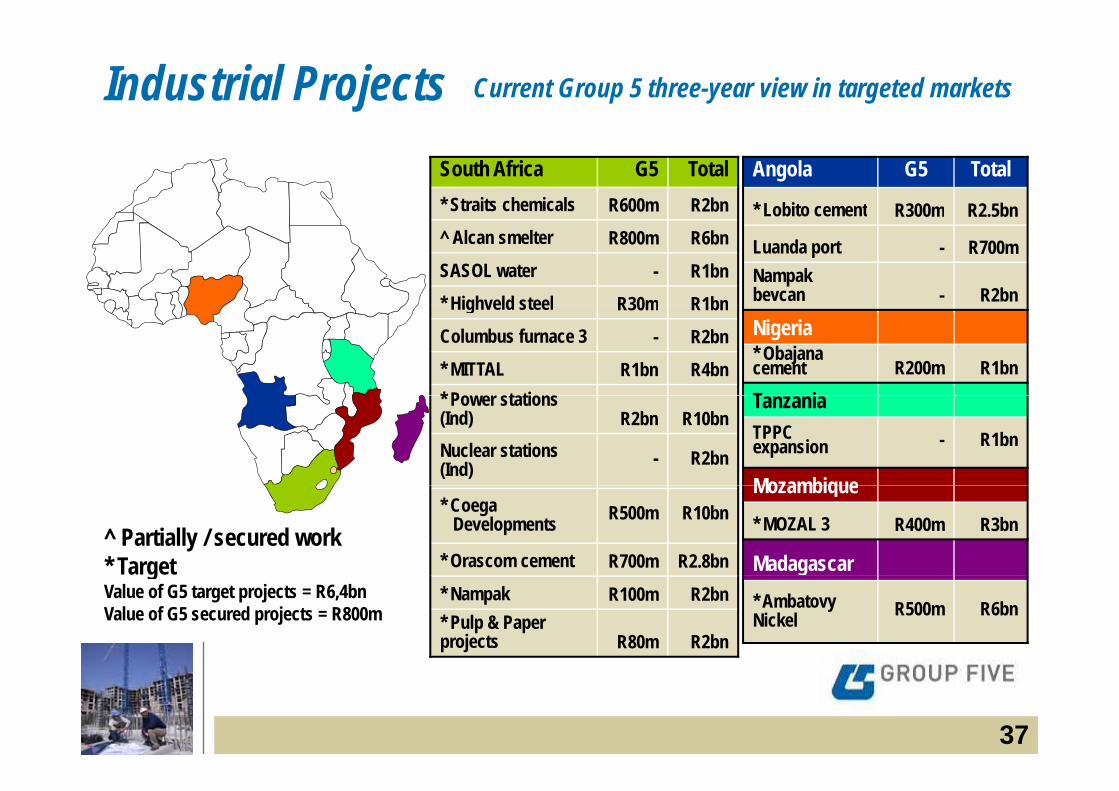
Current Group 5 three-year view in targeted marketsIndustrial ProjectsAngola G5 Total
* Lobito cement R300m R2.5bn
South Africa G5 Total* Straits chemicals R600m R2bn Lobito cement R300m R2.5bn
Luanda port - R700mNampak bevcan - R2bn
^ Alcan smelter R800m R6bnSASOL water - R1bn* Highveld steel R30m R1bn
Nigeria* Obajana cement R200m R1bn
T i
Highveld steel R30m R1bnColumbus furnace 3 - R2bn* MITTAL R1bn R4bn* P t ti Tanzania
TPPC expansion - R1bn
Mozambique
* Power stations (Ind) R2bn R10bnNuclear stations (Ind) - R2bn
Mozambique* MOZAL 3 R400m R3bn
Madagascar
* Coega Developments R500m R10bn
* Orascom cement R700m R2.8bn^ Partially / secured work* Target g
* Ambatovy Nickel R500m R6bn
* Nampak R100m R2bn* Pulp & Paper projects R80m R2bn
gValue of G5 target projects = R6,4bnValue of G5 secured projects = R800m
37
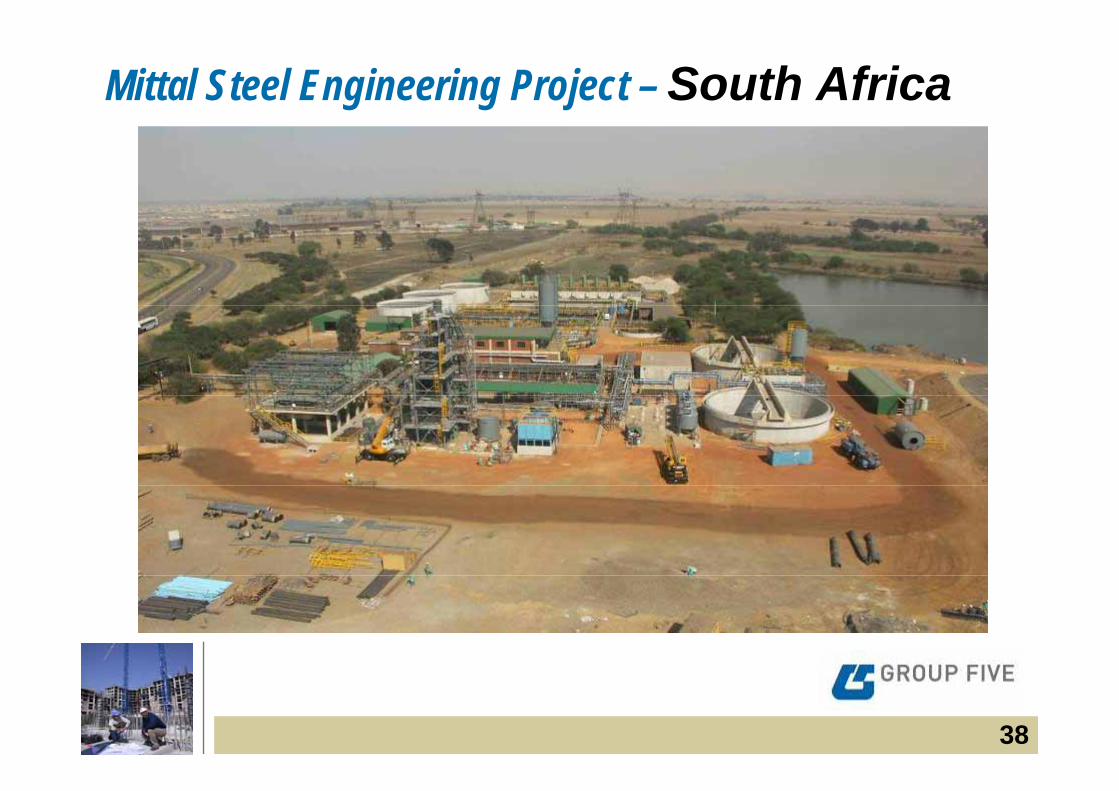
Mittal Steel Engineering Project – South Africa
38
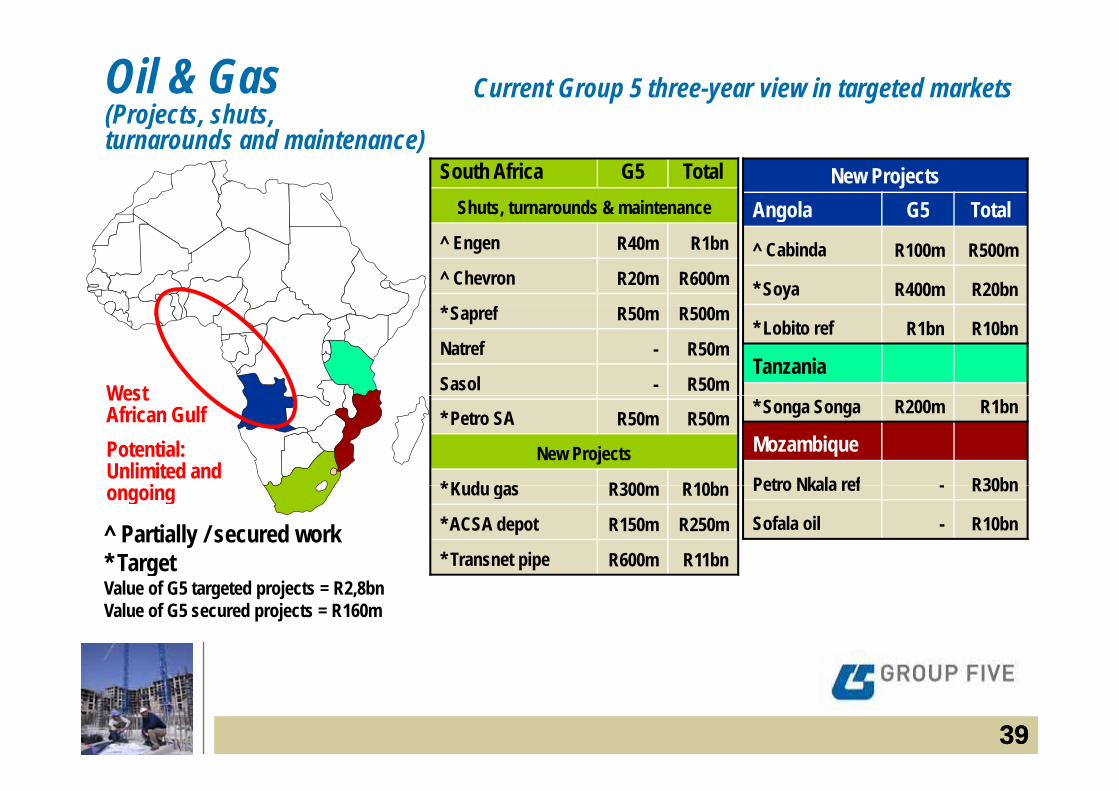
Oil & Gas (Projects, shuts,
Current Group 5 three-year view in targeted markets( j , ,turnarounds and maintenance)
New ProjectsAngola G5 Total
South Africa G5 TotalShuts, turnarounds & maintenance Angola G5 Total
^ Cabinda R100m R500m
* Soya R400m R20bn
,
^ Engen R40m R1bn
^ Chevron R20m R600m
West
* Lobito ref R1bn R10bn
Tanzania
* Sapref R50m R500m
Natref - R50m
Sasol - R50mWest African GulfPotential: Unlimited and
i
* Songa Songa R200m R1bn
Mozambique
Petro Nkala ref - R30bn
* Petro SA R50m R50m
New Projects
* K d R300 R10bongoing Petro Nkala ref - R30bn
Sofala oil - R10bn
* Kudu gas R300m R10bn
* ACSA depot R150m R250m
* Transnet pipe R600m R11bn^ Partially / secured work* TargetgValue of G5 targeted projects = R2,8bnValue of G5 secured projects = R160m
3939
Installations at Malongo base Cabinda – Angola
40
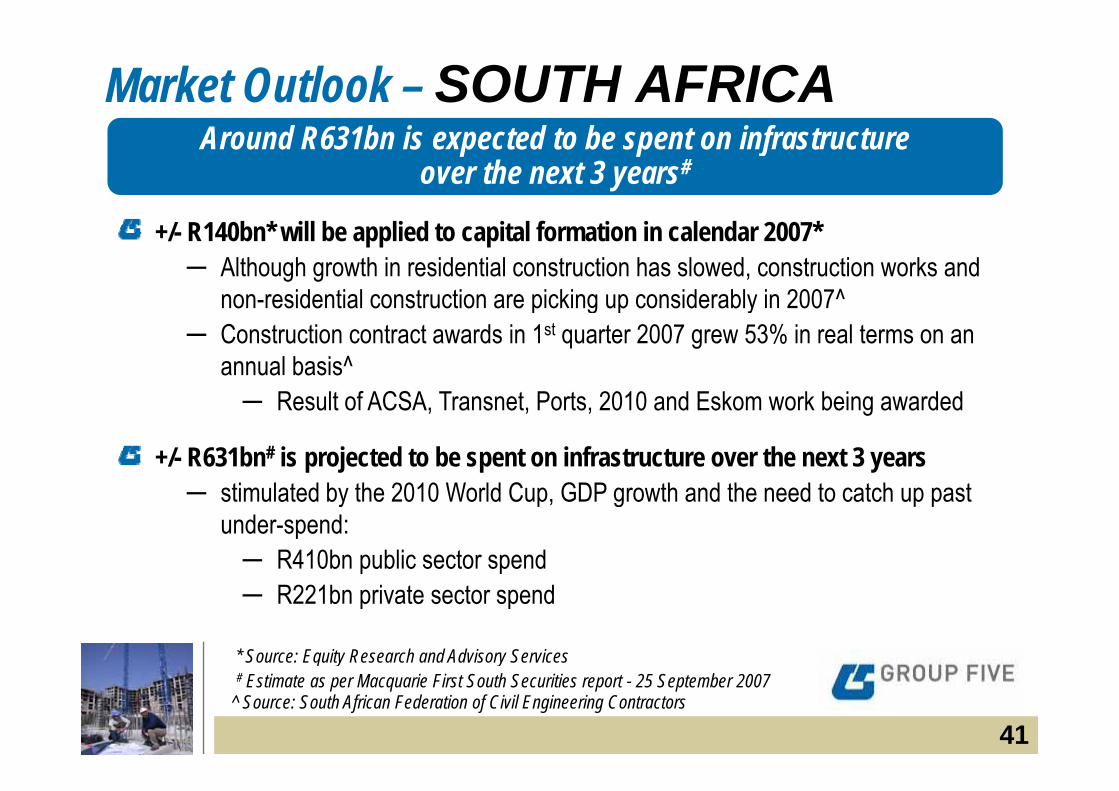
Market Outlook – SOUTH AFRICA1 fAround R631bn is expected to be spent on infrastructure
over the next 3 years#
+/- R140bn* will be applied to capital formation in calendar 2007*― Although growth in residential construction has slowed, construction works and
non-residential construction are picking up considerably in 2007^non residential construction are picking up considerably in 2007― Construction contract awards in 1st quarter 2007 grew 53% in real terms on an
annual basis^R lt f ACSA T t P t 2010 d E k k b i d d― Result of ACSA, Transnet, Ports, 2010 and Eskom work being awarded
+/- R631bn# is projected to be spent on infrastructure over the next 3 yearsti l t d b th 2010 W ld C GDP th d th d t t h t ― stimulated by the 2010 World Cup, GDP growth and the need to catch up past
under-spend:― R410bn public sector spend― R221bn private sector spend
* Source: Equity Research and Advisory Services
41
q y y
^ Source: South African Federation of Civil Engineering Contractors# Estimate as per Macquarie First South Securities report - 25 September 2007

Market Outlook – SOUTH AFRICA
Ci il E i i T 2025
Long Term SA Activity – SAFCEC simulated cycle from 2006 -2025*
Civil Engineering Turnover: 2025
O ti i ti iR bn (Real 2000)
40,000Optimistic view
30,000
35,000
Pessimistic view15 000
20,000
25,000
Growth momentum set to continue well past 20105,000
10,000
15,000
1970
p
1980 1990 2000 2010 2020 20251975 1985 1995 2005 20150
42Source: South African Federation of Civil Engineering Contractors
* Based on pattern of 1960 – 1975
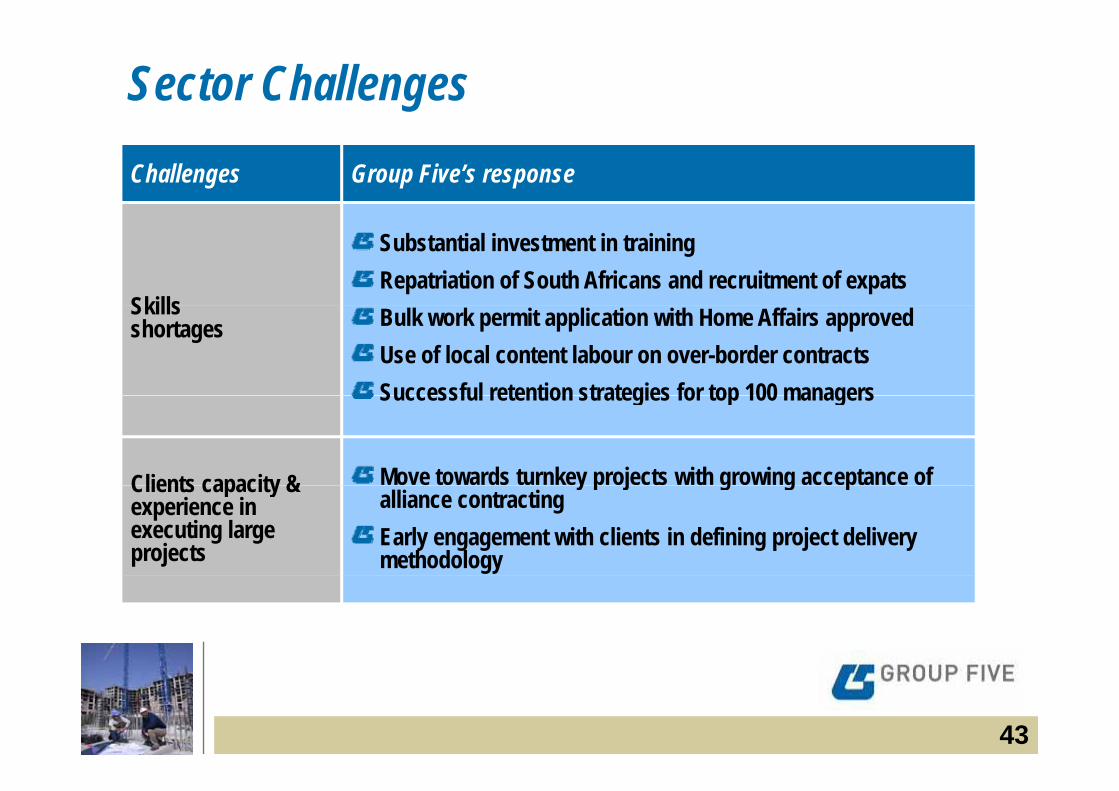
Sector ChallengesChallenges Group Five’s response
Skills
Substantial investment in trainingRepatriation of South Africans and recruitment of expats
Skills shortages Bulk work permit application with Home Affairs approved
Use of local content labour on over-border contractsSuccessful retention strategies for top 100 managersSuccessful retention strategies for top 100 managers
Clients capacity & Move towards turnkey projects with growing acceptance of Clients capacity & experience in executing large projects
y p j g g palliance contractingEarly engagement with clients in defining project delivery methodology
43
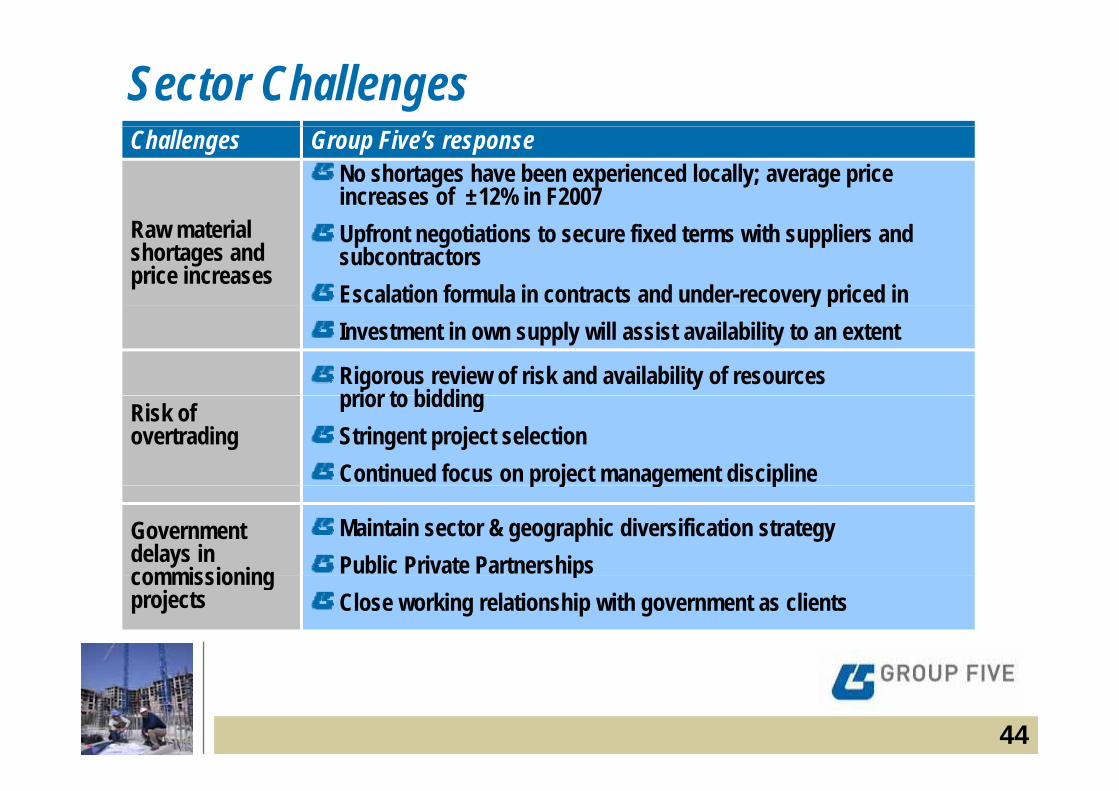
Sector ChallengesChallenges Group Five’s response
No shortages have been experienced locally; average price increases of ±12% in F2007
Raw material shortages and price increases
Upfront negotiations to secure fixed terms with suppliers and subcontractorsEscalation formula in contracts and under-recovery priced in y pInvestment in own supply will assist availability to an extent
Rigorous review of risk and availability of resources prior to bidding Risk of
overtradingprior to bidding Stringent project selection Continued focus on project management disciplinep j g p
Government delays in commissioning
Maintain sector & geographic diversification strategyPublic Private Partnershipscommissioning
projectsp
Close working relationship with government as clients
44
Appendix 2: Alliance Appendix 2: Alliance Partneringg
45
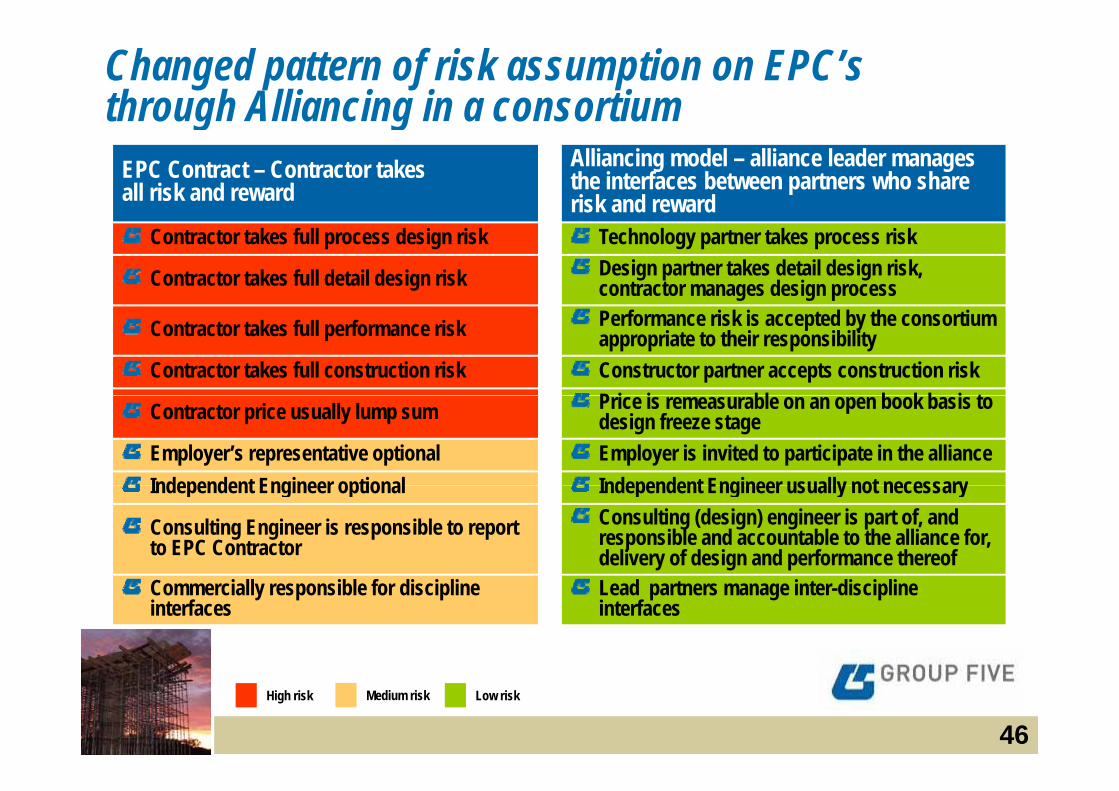
Changed pattern of risk assumption on EPC’s through Alliancing in a consortiumg g
EPC Contract – Contractor takes all risk and reward
Alliancing model – alliance leader managesthe interfaces between partners who share risk and reward
Contractor takes full process design risk Technology partner takes process risk
Contractor takes full detail design risk Design partner takes detail design risk, contractor manages design process
Contractor takes full performance risk Performance risk is accepted by the consortium appropriate to their responsibility
Contractor takes full construction risk Constructor partner accepts construction riskP i i bl b k b i t Contractor price usually lump sum Price is remeasurable on an open book basis to design freeze stage
Employer’s representative optional Employer is invited to participate in the allianceIndependent Engineer optional Independent Engineer usually not necessaryIndependent Engineer optional Independent Engineer usually not necessary
Consulting Engineer is responsible to report to EPC Contractor
Consulting (design) engineer is part of, and responsible and accountable to the alliance for, delivery of design and performance thereof
Commercially responsible for discipline interfaces
Lead partners manage inter-discipline interfaces
46High risk Medium risk Low risk