six core data wrangling activities ebook
TRANSCRIPT

Six Core Data Wrangling ActivitiesAn introductory guide to data wrangling with Trifacta

Today’s Data Driven CultureAre you inundated with data?
Today, most organizations are collecting as much data in one week as they used to collect in one year. Even though they have more data, they’re not using the bulk of it —most companies analyze less than 20% of their data. Why? Preparing diverse datasets for analysis is time-consuming and messy, often left to data engineers or data scientists.
2

Introducing, Trifacta Wrangler!With Trifacta Wrangler, analysts, researchers and data visualization specialists no longer need to be dependent on IT for data preparation. Trifacta empowers you to wrangle data yourself — allowing you to spend less time waiting and more time on your analysis.
Start wrangling your data by following the 6 steps of the process:
Discovering
Structuring
Cleaning
Enriching
Validating
Publishing
Discovering Structuring Cleaning Enriching Validating Publishing All3

Data Wrangling with TrifactaA step-by-step walk-through using Bay Area Bike Share data
Each of the six data wrangling steps will be demonstrated using Trifacta to wrangle Bay Area Bike Share and weather data, dating from August 29, 2014 to September 2, 2014 and the entire year of 2014
respectively. The Bay Area Bike Share is a program that includes 700 bicycles across 70 stations in the Bay Area for the purpose of providing residents and visitors transportation for going to work, to the
CalTrain station, and generally getting around. An analyst who works for Bay Area Bike Share might want to examine the data in order to see the most popular bike routes and stations to better plan bike
inventory and rotations.
We have two raw datasets pertaining to this topic: Trip and Weather collected from data.gov. The Bay Area Bike Share Trip dataset is essentially machine generated data from the bike systems that log
numerous data points, including the time and location of when and where the bike was picked up and dropped off, how long the bicyclist had to wait, and whether or not they were an official subscriber to the program. The weather dataset includes the maximum and minimum temperatures as well as humidity, sea
level pressure, wind speed, and other factors that would affect biking outdoors.
Discovering Structuring Cleaning Enriching Validating Publishing All4
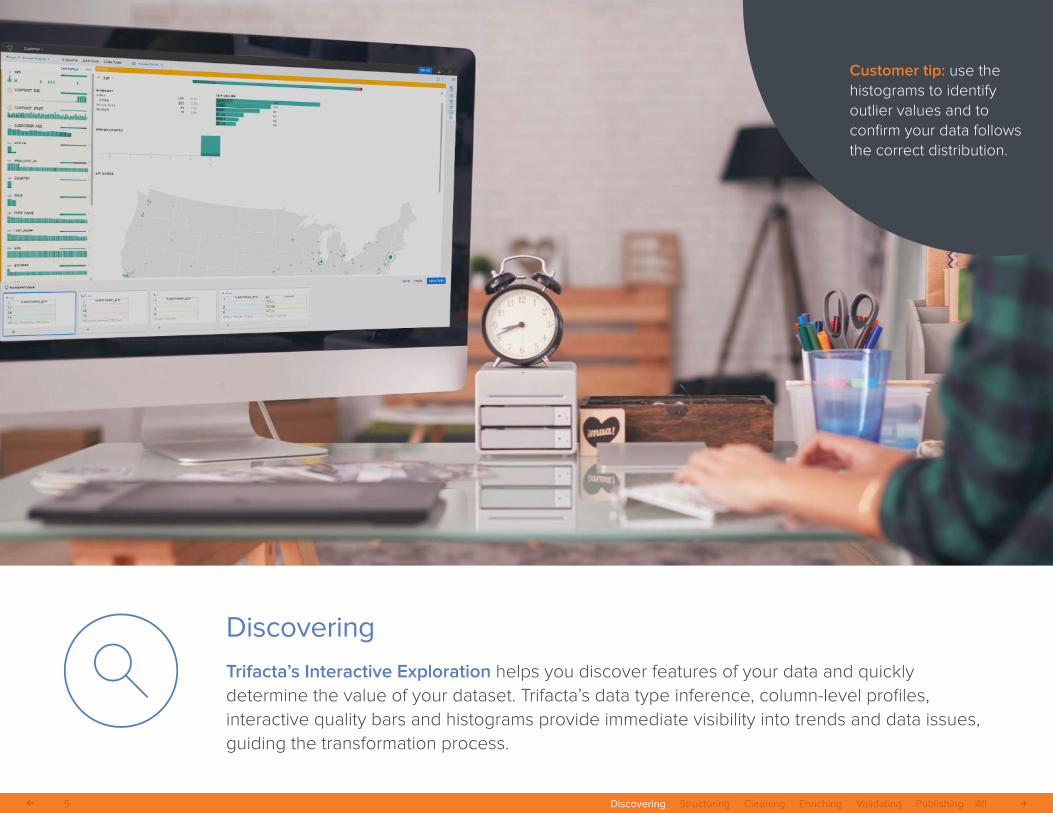
DiscoveringTrifacta’s Interactive Exploration helps you discover features of your data and quickly determine the value of your dataset. Trifacta’s data type inference, column-level profiles, interactive quality bars and histograms provide immediate visibility into trends and data issues, guiding the transformation process.
Customer tip: use the histograms to identify outlier values and to confirm your data follows the correct distribution.
Discovering Structuring Cleaning Enriching Validating Publishing All5
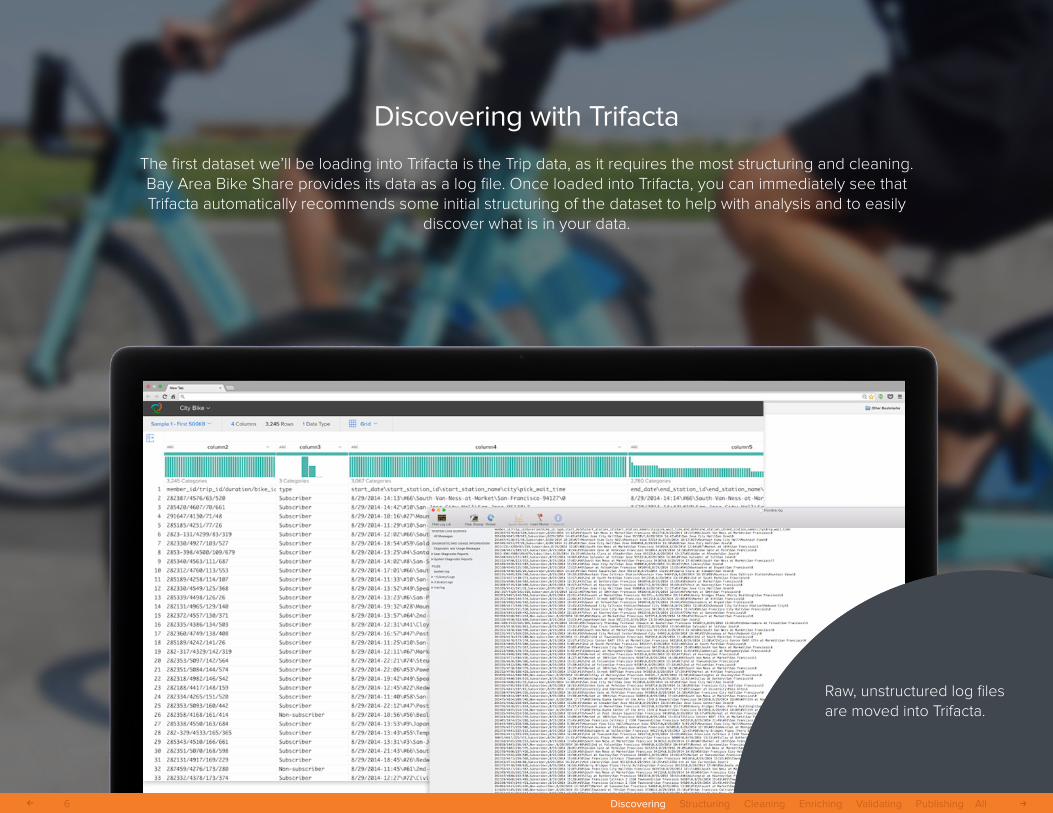
Discovering with Trifacta
The first dataset we’ll be loading into Trifacta is the Trip data, as it requires the most structuring and cleaning. Bay Area Bike Share provides its data as a log file. Once loaded into Trifacta, you can immediately see that Trifacta automatically recommends some initial structuring of the dataset to help with analysis and to easily
discover what is in your data.
Discovering Structuring Cleaning Enriching Validating Publishing All6
Raw, unstructured log files are moved into Trifacta.

Customer tip: Trifacta’s predictive transformation allows you to split a single data-rich column, such as one that stores addresses, into multiple columns. Analyzing street, city, state, and zip code separately can provide more meaningful geographic insights.
StructuringStructuring refers to actions that change the form or schema of your data. Splitting columns, pivoting rows and deleting fields are all forms of structuring.
Trifacta’s Predictive Transformation allows you to simply highlight sections of your data to get suggestions of the appropriate transforms based on the data you’re working with and the type of interaction you applied to the data.
Discovering Structuring Cleaning Enriching Validating Publishing All7
Discovering Structuring Cleaning Enriching Validating Publishing All8
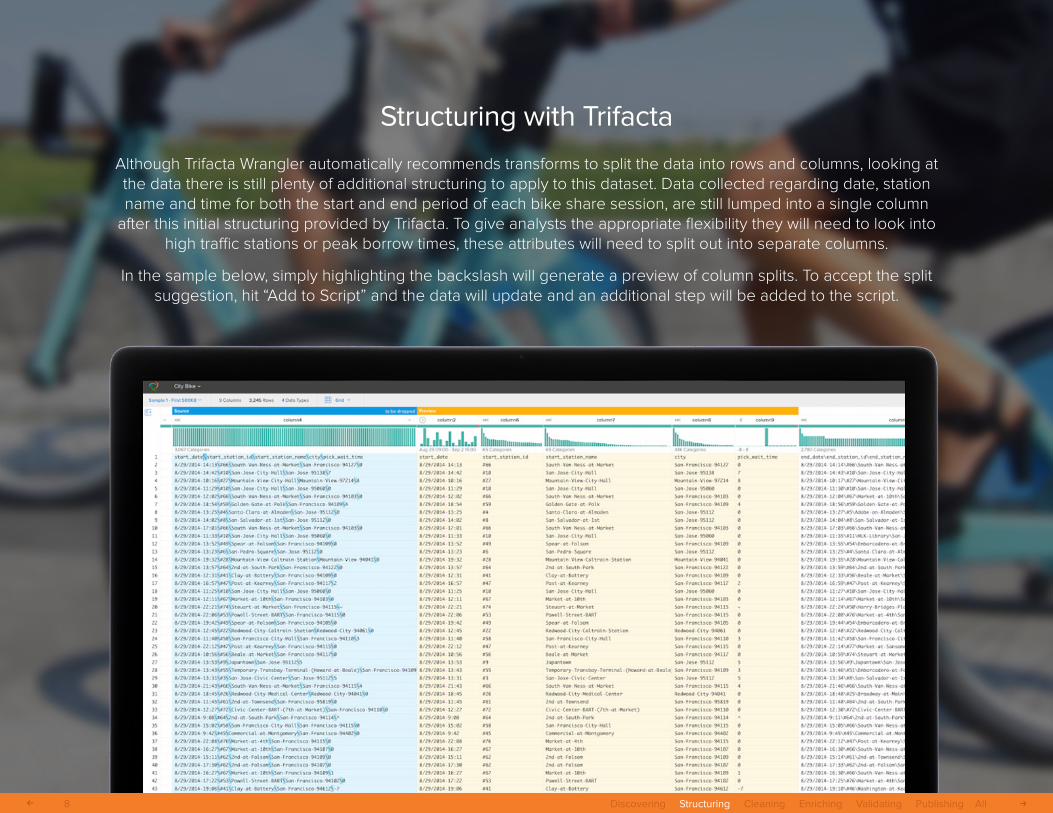
Structuring with Trifacta
Although Trifacta Wrangler automatically recommends transforms to split the data into rows and columns, looking at the data there is still plenty of additional structuring to apply to this dataset. Data collected regarding date, station name and time for both the start and end period of each bike share session, are still lumped into a single column
after this initial structuring provided by Trifacta. To give analysts the appropriate flexibility they will need to look into high traffic stations or peak borrow times, these attributes will need to split out into separate columns.
In the sample below, simply highlighting the backslash will generate a preview of column splits. To accept the split suggestion, hit “Add to Script” and the data will update and an additional step will be added to the script.
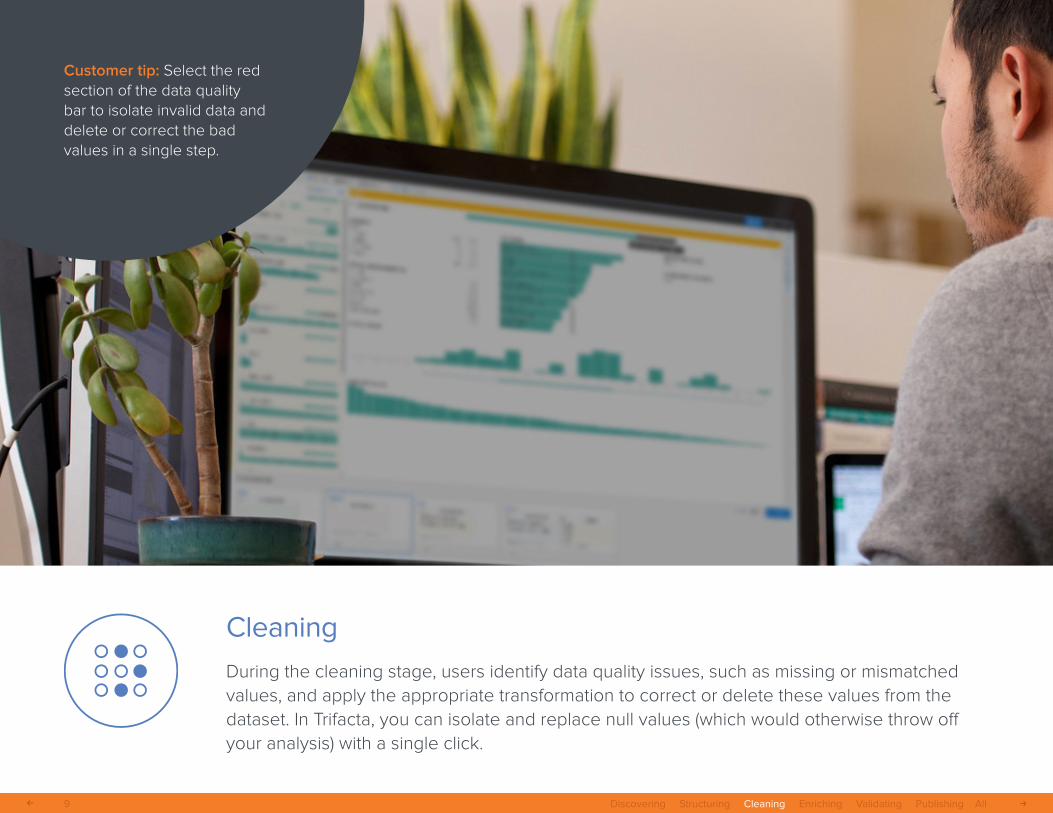
CleaningDuring the cleaning stage, users identify data quality issues, such as missing or mismatched values, and apply the appropriate transformation to correct or delete these values from the dataset. In Trifacta, you can isolate and replace null values (which would otherwise throw off your analysis) with a single click.
Customer tip: Select the red section of the data quality bar to isolate invalid data and delete or correct the bad values in a single step.
Discovering Structuring Cleaning Enriching Validating Publishing All9
Discovering Structuring Cleaning Enriching Validating Publishing All10
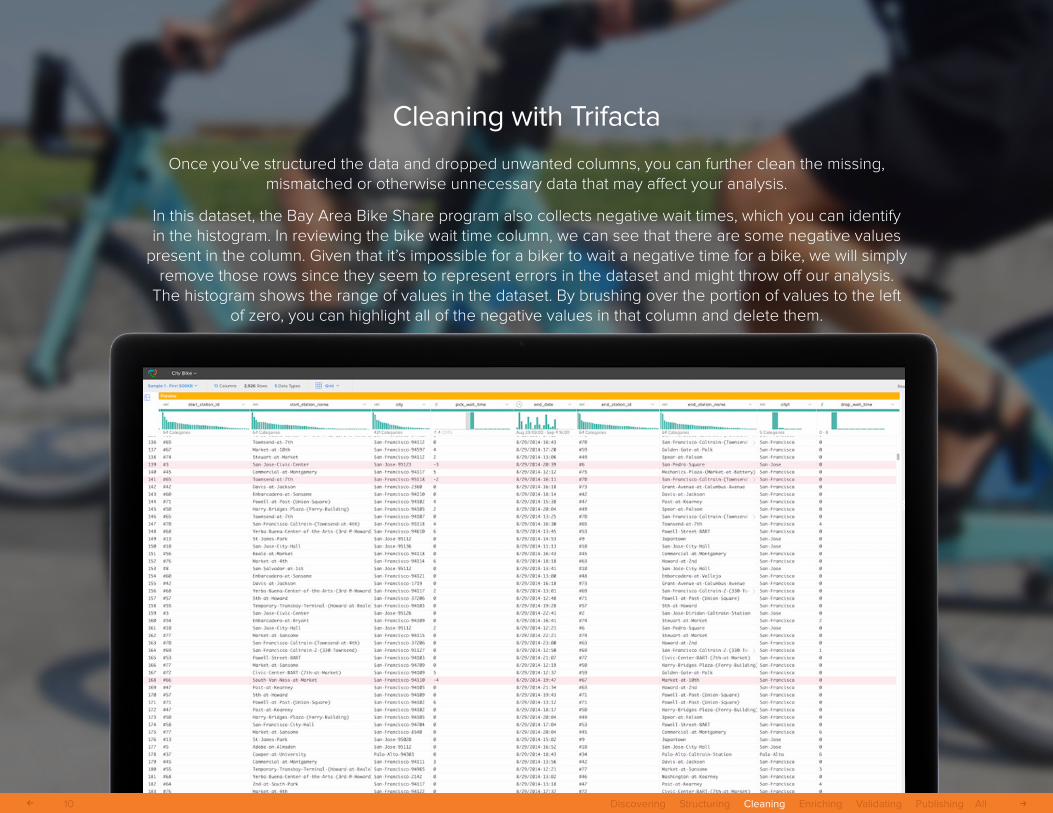
Cleaning with Trifacta
Once you’ve structured the data and dropped unwanted columns, you can further clean the missing, mismatched or otherwise unnecessary data that may affect your analysis.
In this dataset, the Bay Area Bike Share program also collects negative wait times, which you can identify in the histogram. In reviewing the bike wait time column, we can see that there are some negative values
present in the column. Given that it’s impossible for a biker to wait a negative time for a bike, we will simply remove those rows since they seem to represent errors in the dataset and might throw off our analysis.
The histogram shows the range of values in the dataset. By brushing over the portion of values to the left of zero, you can highlight all of the negative values in that column and delete them.

EnrichingThe data needed to make business decisions can often be spread across multiple files. In order to gather all the necessary insights, you need to enrich your existing dataset by joining and aggregating multiple data sources.
Trifacta’s data enrichment features allow you to easily execute lookups to data dictionaries or execute joins with disparate datasets. Rather than keying in a command, Trifacta’s intelligent join inference uses machine learning to rapidly identify appropriate join keys across your diverse datasets.Customer tip: A major CPG retailer used
Trifacta to reduce their analytics build time by 90%, primarily due to the simplicity and ease-of-use of Trifacta’s join interface. Joining 8 inventory forecasts is a breeze with Trifacta’s join key inference and live result previews.
Discovering Structuring Cleaning Enriching Validating Publishing All11
Discovering Structuring Cleaning Enriching Validating Publishing All12
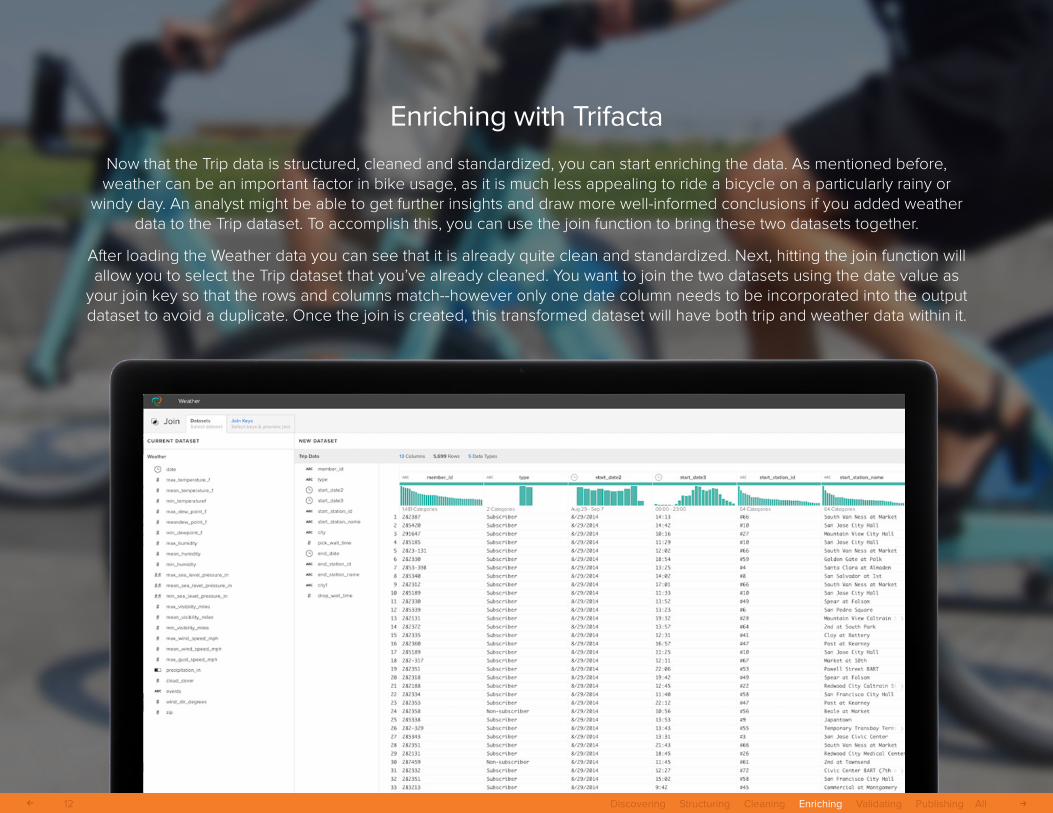
Enriching with Trifacta
Now that the Trip data is structured, cleaned and standardized, you can start enriching the data. As mentioned before, weather can be an important factor in bike usage, as it is much less appealing to ride a bicycle on a particularly rainy or
windy day. An analyst might be able to get further insights and draw more well-informed conclusions if you added weather data to the Trip dataset. To accomplish this, you can use the join function to bring these two datasets together.
After loading the Weather data you can see that it is already quite clean and standardized. Next, hitting the join function will allow you to select the Trip dataset that you’ve already cleaned. You want to join the two datasets using the date value as
your join key so that the rows and columns match--however only one date column needs to be incorporated into the output dataset to avoid a duplicate. Once the join is created, this transformed dataset will have both trip and weather data within it.

ValidatingTrifacta displays the final output of your transformation output in the Job Results view across the complete dataset. Here, you can do a final check for any missing or mismatched data that wasn’t corrected in the transformation process. After your data has been initially wrangled, you need to validate that your output dataset has the intended structure and content before publishing for broader analysis.
Customer tip: Data wrangling is an iterative process, so Trifacta allows you to review your result dataset for further refining based on direction from the job results window.
Discovering Structuring Cleaning Enriching Validating Publishing All13
Discovering Structuring Cleaning Enriching Validating Publishing All14
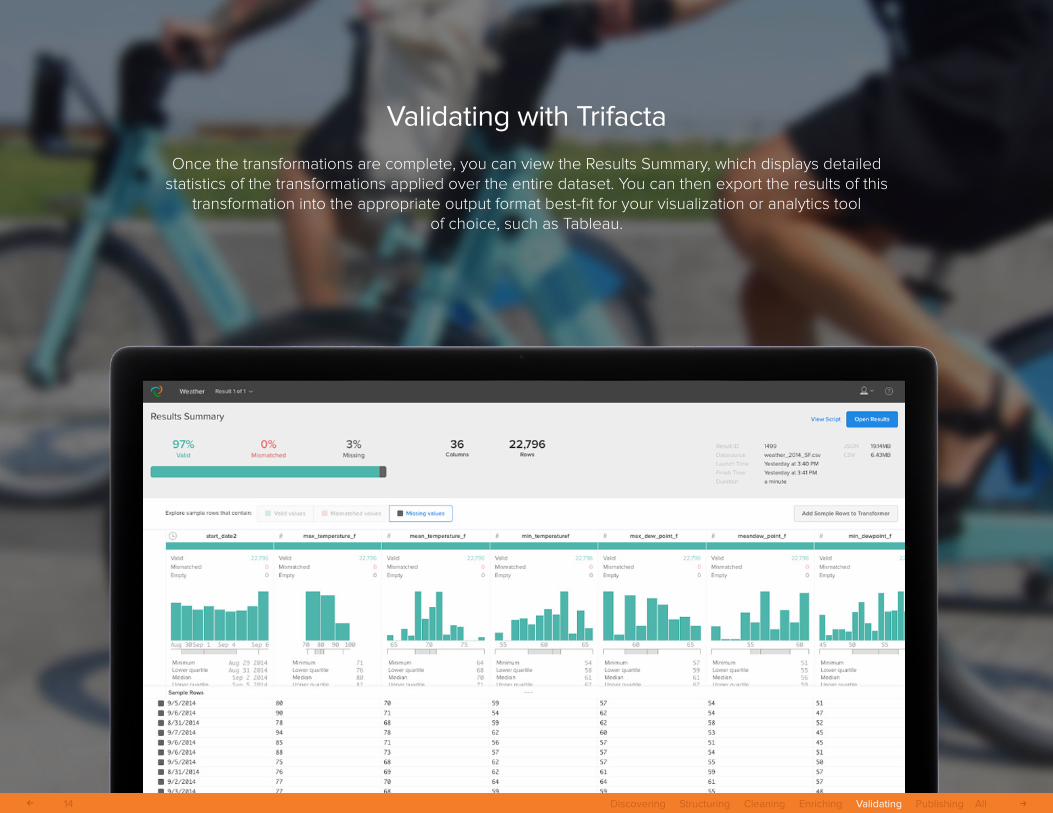
Validating with Trifacta
Once the transformations are complete, you can view the Results Summary, which displays detailed statistics of the transformations applied over the entire dataset. You can then export the results of this
transformation into the appropriate output format best-fit for your visualization or analytics tool of choice, such as Tableau.

PublishingWhen your data has been successfully structured, cleaned, enriched and validated, it’s time to publish your wrangled output for use in downstream analytics processes.
Through the wrangling process, a wider variety of data sources can be used in different statistics, analytics and data visualization applications. This broadens the usage of data throughout the organization and enhances the potential value of data to the business.
Discovering Structuring Cleaning Enriching Validating Publishing All15
Discovering Structuring Cleaning Enriching Validating Publishing All16
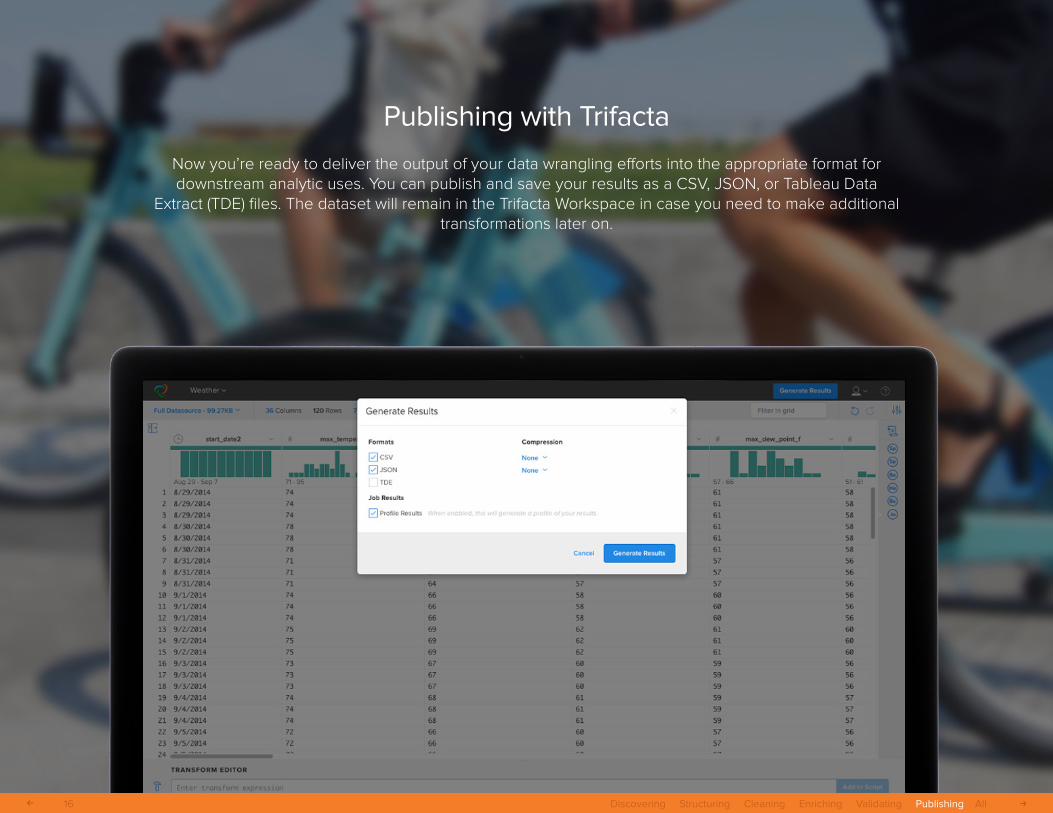
Publishing with Trifacta
Now you’re ready to deliver the output of your data wrangling efforts into the appropriate format for downstream analytic uses. You can publish and save your results as a CSV, JSON, or Tableau Data
Extract (TDE) files. The dataset will remain in the Trifacta Workspace in case you need to make additional transformations later on.

What Data Do You Need to Wrangle?Are you ready to wrangle your own data? Download Trifacta Wrangler and start visually exploring and preparing data today.
Resources: trifacta.com/learning
Support: trifacta.com/support
Blog: trifacta.com/blog
Discovering Structuring Cleaning Enriching Validating Publishing All17

About Trifacta
Trifacta was created to provide a unique experience for people who work with and analyze data. Trifacta allows people to explore their data so that it becomes a strategic asset instead of an
afterthought. Our vision brings human intuition and computational power together with machine learning that extracts patterns from user behavior. Our intuitive solution enables people of varying technical skills to wrangle messy, unstructured data with confidence. Learn why companies such
as PepsiCo, Orange, Sanofi, The Royal Bank of Scotland and GoPro use Trifacta to gain the insights they need to achieve competitive advantages in today’s data driven environment.
Start wrangling with Trifacta today at www.trifacta.com/start-wrangling/.
Discovering Structuring Cleaning Enriching Validating Publishing All18