six sigma and beyond stamatis
DESCRIPTION
The six sigma methology requires that a project be selected and an appropiate resolution be achieved in such a way that both the customer and organization will benefit-not a bad expectation. However, this is easier said than done. To select a project presupposes a need for improvement. The implication for that improvement is that either the customer is not satisfied with the product and/or status quo of whatever is happening 'right now' in the organization.TRANSCRIPT


SIX SIGMAAND BEYONDProblem Solving
andBasic Mathematics

SIX SIGMA AND
BEYONDA series by D.H. Stamatis
Volume IFoundations of Excellent Performance
Volume IIProblem Solving and Basic Mathematics
Volume IIIStatistics and Probability
Volume IVStatistical Process Control
Volume VDesign of Experiments
Volume VIDesign for Six Sigma
Volume VIIThe Implementing Process

ST. LUCIE PRESSA CRC Press Company
Boca Raton London New York Washington, D.C.
D. H. Stamatis
SIX SIGMAAND BEYONDProblem Solving
andBasic Mathematics

This book contains information obtained from authentic and highly regarded sources. Reprinted materialis quoted with permission, and sources are indicated. A wide variety of references are listed. Reasonableefforts have been made to publish reliable data and information, but the author and the publisher cannotassume responsibility for the validity of all materials or for the consequences of their use.
Neither this book nor any part may be reproduced or transmitted in any form or by any means, electronicor mechanical, including photocopying, microfilming, and recording, or by any information storage orretrieval system, without prior permission in writing from the publisher.
The consent of CRC Press LLC does not extend to copying for general distribution, for promotion, forcreating new works, or for resale. Specific permission must be obtained in writing from CRC Press LLCfor such copying.
Direct all inquiries to CRC Press LLC, 2000 N.W. Corporate Blvd., Boca Raton, Florida 33431.
Trademark Notice:
Product or corporate names may be trademarks or registered trademarks, and areused only for identification and explanation, without intent to infringe.
Visit the CRC Press Web site at www.crcpress.com
© 2002 by CRC Press LLC St. Lucie Press is an imprint of CRC Press LLC
No claim to original U.S. Government worksInternational Standard Book Number 1-57444-310-0
Library of Congress Card Number 2001041635Printed in the United States of America 1 2 3 4 5 6 7 8 9 0
Printed on acid-free paper
Library of Congress Cataloging-in-Publication Data
Stamatis, D. H., 1947-Six sigma and beyond : problem solving and basic mathematics, volume II
p. cm. — (Six Sigma and beyond series)Includes bibliographical references.ISBN 1-57444-310-0 (alk. paper)1. Quality control—Statistical methods. 2. Production management—Statistical
methods. 3. Industrial management. I. Title. II. Series.
TS156 .S73 2001658.5
′
62—dc21 2001041635 CIP
SL3100_frame_FM Page 4 Friday, August 31, 2001 10:09 AM

toTimothy,
the entrepreneur
SL3100_frame_FM Page 5 Friday, August 31, 2001 10:09 AM

SL3100_frame_FM Page 6 Friday, August 31, 2001 10:09 AM

Preface
Problem solving is an attempt to understand the nature of human interaction andthe differences in cognitive functioning of individuals which are observed again andagain. This volume is specifically designed to address the issue of cognitive func-tioning by reviewing selected literature on the topic, to provide a generic approachto problem solving, and to review the basic mathematics that most people woulduse in the process.
In all walks of life, at some time, all of us will likely use the process of problemsolving. While we all talk about it and we all use it, chances are we all mean differentthings by it. In this volume, I have attempted to organize the topic and provide astructured approach based on the scientific method.
In conjunction with six sigma methodology, I believe that it is fundamental tounderstand the process, not only because as a black belt one would use “an” approachto solve a specific concern, project, problem, etc., but because problem solving willhelp define the problem as well.
This volume is intended to be a manual rather than a text for understanding theinvestigation process of problem solving. Toward that end, it is written to nontech-nical as well as technical individuals. I have assumed that some readers may nothave post high-school education or speak fluent English. The exception is theIntroduction. In the Introduction, I dwell on the theoretical aspects of problemsolving. If it is too cumbersome, the reader may skip this section without losing anyunderstanding of the process. The literature review may enhance understanding, butit is not essential for use of the approach as explained in the following chapters.
One may challenge this assumption and claim that anyone pursuing six sigmashould have a basic understanding of problem-solving techniques and processes.From my experience, I can vouch that Fortune 500 companies have employees whoare not familiar with the process or techniques. (In fact, very recently, I was with aclient when I noticed that a training class of
basic math
was offered specifically forengineers. It was this experience that became the impetus for this volume, especiallythe inclusion of the basic mathematics in Part II.) The intent is not to embarrass orhumiliate anyone; rather it is to help facilitate the process of solving problems witha basic commonality of understanding. If the reader is already proficient, obviouslythe math portion of this volume may be skipped without any loss of continuity.
So, let us examine the issue of “problem solving.” The ability to solve problemsis a central prerequisite for human survival, but the mechanics of the process itselfoften remain a puzzle for most of us — a puzzle because problem solving is a verycomplex cognitive process, not necessarily a behavior that can be observed. Perhapsthe reason why several people find different, similar, or even the same solution tothe same problem.
SL3100_frame_FM Page 7 Friday, August 31, 2001 10:09 AM

This is a very important issue and it is the reason why this volume is in the formof a manual rather than a text. My hope is that readers will recognize the stage ofthe process they are involved with and as a consequence will pick the right spot fortheir analysis. In each step of the process, a variety of questions and flow charts areprovided to facilitate understanding. By no means do I believe that all options havebeen exhausted; rather I believe that an initial generic guideline to provide a solutionfor a given problem has been created.
D. H. Stamatis
SL3100_frame_FM Page 8 Friday, August 31, 2001 10:09 AM

About the Author
D. H. Stamatis, Ph.D., ASQC-Fellow, CQE, CMfgE,
is currently president ofContemporary Consultants, in Southgate, Michigan. He received his B.S. and B.A.degrees in marketing from Wayne State University, his Master’s degree from CentralMichigan University, and his Ph.D. degree in instructional technology and busi-ness/statistics from Wayne State University.
Dr. Stamatis is a certified quality engineer for the American Society of QualityControl, a certified manufacturing engineer for the Society of Manufacturing Engi-neers, and a graduate of BSIIs ISO 9000 lead assessor training program.
He is a specialist in management consulting, organizational development, andquality science and has taught these subjects at Central Michigan University, theUniversity of Michigan, and Florida Institute of Technology.
With more than 30 years of experience in management, quality training, andconsulting, Dr. Stamatis has served and consulted for numerous industries in theprivate and public sectors. His consulting extends across the United States, SoutheastAsia, Japan, China, India, and Europe. Dr. Stamatis has written more than 60 articles,presented many speeches at national and international conferences on quality. He isa contributing author in several books and the sole author of 12 books. In addition,he has performed more than 100 automotive-related audits and 25 preassessmentISO 9000 audits, and has helped several companies attain certification. He is anactive member of the Detroit Engineering Society, the American Society for Trainingand Development, the American Marketing Association, and the American ResearchAssociation, and a fellow of the American Society for Quality Control.
SL3100_frame_FM Page 9 Friday, August 31, 2001 10:09 AM

SL3100_frame_FM Page 10 Friday, August 31, 2001 10:09 AM

Acknowledgments
In a typical book, an author has several, if not many, individuals who helped in theprocess of completing it. In this mammoth work, so many individuals have helpedthat I am concerned that I might forget someone.
Sometimes, writing a book is a collective undertaking by many people. However,to write a book that conveys hundreds of thoughts, principles, and ways of doingthings would truly be a Herculean task for one individual. Since I am definitely notHercules or Superman, I depended on many people over the years to guide me andhelp me formulate my thoughts and opinions about many things, including this work.To thank everyone by name who has contributed to this work would be impossible,although I am indebted to all of them for their contributions. However, there aresome organizations and individuals who stand out. Without them this series wouldnot have been possible.
There were some individuals who actually pushed me to write this series ofbooks and have reviewed and commented on several of the drafts. There were alsoindividuals who helped solidify some of the items covered in this work throughlengthy discussions. Individuals who fall in these categories are M. Heaffy,H. Bajaria, J. Spencer, V. Lowe, L. Lemberson, R. Roy, R. Munro, E. Rice, andG. Tomlison. Their encouragement and thought-provoking discussions helped metremendously to formalize not only the content, but also the flow as well as thedepth of the material.
I would like to thank the Six Sigma Academy for granting permission for useof some of its material in comparing the classical approach to the new approach ofdefects as well as the chart of significant differences between three sigma, foursigma, five sigma, and six sigma; the American Marketing Association for grantingpermission to summarize the data articles from
Marketing News
;
the AmericanSociety for Training and Development for granting permission for use of the table,the Most Likely Influences of Program Development Practices, from
Training andDevelopment
; Tracom Co. for granting permission for use of the material on thefour social styles model; and the American Society for Quality (ASQ) for grantingpermission to summarize some key issues about teams from “Making Perfect Har-mony with Teams” published in
ONQ
magazine and some definitions and charac-teristics of quality from
The Certified Quality Manager Handbook
(1999).Additionally, I would like to thank Mr. C. H. Wong for his persistence over the
last four years to write this book. His faith in me and encouragement will never beforgotten; Dr. J. Farr for his thoughtful suggestions throughout the writing processand his insight on teams; Dr. W. Landrum for teaching me what teams are all aboutand why we must pursue the concept in the future. His futuristic insight has beenan inspiration. His practice of teams has been a model for me to follow; mycolleagues Dr. R. Rosa, Mr. H. Jamal, Dr. A. Crocker, and Dr. D. Demis, as well as
SL3100_frame_FM Page 11 Friday, August 31, 2001 10:09 AM

Mr. J. Stewart and Mr. R. Start for their countless hours of discussions in formulatingthe content of these volumes in its final format; and J. Malicki, C. Robinson, andS. Stamatis for computer work on the early drafts and final figures in the text.
I want to thank Ford Motor Company and especially, Mr. B. Kiger, Mr. R. H.Rosier, Mr. A. Calunas, and Ms. L. McElhaney for their efforts to obtain permissionfor using the questions of the Global 8D. Without their personal intercession, thebook would be missing an important contribution to problem solving.
As always, I would like to thank my personal inspiration, bouncing board,navigator, and editor, Carla, for her continued enthusiastic attitude during my mosttrying times. Especially for this work did she demonstrate her extraordinary patience,encouragement, and understanding by putting up with me.
Special thanks also go to the editors of the series for their suggestions and forimprovements to the text and its presentation.
Finally, my greatest appreciation is reserved for the seminar participants andstudents of Central Michigan University. Through their input, concerns, and discus-sions, I was able to formulate these volumes to become a reality. Without their activeparticipation and comments, these volumes would never have been completed.
SL3100_frame_FM Page 12 Friday, August 31, 2001 10:09 AM

List of Figures
FIGURE 1.1
Understanding “a” situation.
FIGURE 1.2
Team approach.
FIGURE 3.1
A pictorial view of a super generic five-step model.
FIGURE 3.2
The 14-step process improvement cycle model.
FIGURE 5.1
Something changed.
FIGURE 5.2
An overview of GPS0.
FIGURE 5.3
An overview of GPS1.
FIGURE 5.4
An overview of GPS2.
FIGURE 5.5
An overview of GPS3.
FIGURE 5.6
An overview of GPS4.
FIGURE 5.7
An overview of GPS5.
FIGURE 5.8
An overview of GPS6.
FIGURE 5.9
The events of GPS6.
FIGURE 5.10
An overview of GPS7.
FIGURE 5.11
An overview of GPS8.
FIGURE D.1
A typical problem solving worksheet.
FIGURE F.1
Path for root cause determination.
List of Tables
TABLE 1.1
Generalized stages of problem solving.
TABLE 3.1
Problem solving vs. process improvement selection chart.
TABLE 4.1
Most likely influences of program development practices on sample corecapabilities.
TABLE 4.2
Typical quality tools.
TABLE 5.1
Concern analysis report guidelines.
TABLE 16.1
Squares, square roots, cubes, and cube roots.
TABLE F.1
Comparison of root cause approaches.
SL3100_frame_FM Page 13 Friday, August 31, 2001 10:09 AM

SL3100_frame_FM Page 14 Friday, August 31, 2001 10:09 AM

Table of Contents
PART I
Problem Solving
Introduction
..............................................................................................................3
Chapter 1
Theoretical Aspects of Problem Solving...................................................................5Definition of Terms ..........................................................................................9Terms and Issues Related to Data Gathering ................................................14Importance of the Sample..............................................................................25References ......................................................................................................26Selected Bibliography ....................................................................................28
Chapter 2
Overview of Key Elements to Problem Solving.....................................................33The Road to Continual Improvement ............................................................33Chronic vs. Sporadic Problems .....................................................................34Three Typical Responses to Problems and the Antecedent ..........................35Nine Common Roadblocks to Effective Problem Solving ...........................37Six Key Ingredients Required to Correct Problems......................................39
Chapter 3
Problem-Solving and Process Improvement Cycles...............................................41Why a Team Approach?.................................................................................41Local Teams and Cross-Functional Teams....................................................42General Guidelines for Effective Team Problem Solving and Process
Improvement ................................................................................................43What Makes a Team Work ............................................................................43Examples of Problem-Solving Models..........................................................43The Process Improvement Cycle ...................................................................46Problem Solving vs. Process Improvement...................................................52
Chapter 4
The Quality Tools ....................................................................................................55Tools for Problem Solving.............................................................................55Quality Tools Inventory .................................................................................55The Seven Basic Tools...................................................................................55Using the Seven Basic Tools in Problem Solving ........................................57Seven Quality Control Management Tools ...................................................59Selected Bibliography ....................................................................................59
SL3100_frame_FM Page 15 Friday, August 31, 2001 10:09 AM

Chapter 5
The Global Problem Solving Process .....................................................................61General Overview ..........................................................................................61Do’s and Do Not’s .........................................................................................65
Do’s ....................................................................................................66Do Not’s .............................................................................................67
Concern Analysis Report ...............................................................................67Root Cause Issues ..........................................................................................69Verification .....................................................................................................71
Examples of “Snapshot” Verification (Reliability at 85%Confidence) ......................................................................................72
SPC Chart Subgroup and Sample Size .............................................73GPS Application Criteria ...............................................................................74Common Tasks...............................................................................................75Change and Never-Been-There Situations ....................................................75GPS Steps.......................................................................................................75
GPS0: Preparation..............................................................................77GPS1: Establish the Team/Process Flow...........................................78GPS2: Describe the Problem .............................................................82GPS3: Develop the Interim Containment Action (ICA) ...................85GPS4: Define and Verify Root Cause and Escape Point ..................88GPS5: Choose and Verify Permanent Corrective Actions (PCAs)
for Root Cause and Escape Point ...................................................93GPS6: Implement and Validate Permanent Corrective Actions
(PCAs)..............................................................................................95GPS7: Prevent Recurrence.................................................................98GPS8: Recognize Team and Individual Contributions....................102
References ....................................................................................................104
Chapter 6
Six Sigma Approach to Problem Solving .............................................................107Overview ......................................................................................................107First Week’s Project: Structure the Project — Goals, Objectives, and
Scope..........................................................................................................109Second Week’s Project: Structure the Project — Product-Based
Estimating ..................................................................................................110Third Week’s Project: Control the Project ..................................................112Design for Six Sigma (DFSS) .....................................................................113
PART II
Basic Mathematics
Chapter 7
The Value of Whole Numbers...............................................................................119
SL3100_frame_FM Page 16 Friday, August 31, 2001 10:09 AM

Chapter 8
Addition and Subtraction of Whole Numbers ......................................................123Addition........................................................................................................123Addition Exercises .......................................................................................124Subtraction ...................................................................................................125Application of Addition and Subtraction ....................................................127Exercises.......................................................................................................128Additional Exercises ....................................................................................129
Chapter 9
Multiplication and Division of Whole Numbers ..................................................131Multiplication ...............................................................................................131Multiplication Exercises...............................................................................133Additional Multiplication Exercises ............................................................135Division ........................................................................................................136Exercises.......................................................................................................142Additional Exercises ....................................................................................143
Chapter 10
Parts and Types of Fractions .................................................................................145Exercises.......................................................................................................146Additional Exercises ....................................................................................148
Chapter 11
Simple Form and Common Denominators of Fractions.......................................149Simplest Form ..............................................................................................149Simplest Form Exercises..............................................................................152Additional Exercises ....................................................................................153Common Denominators ...............................................................................154Common Denominator Exercises ................................................................155Additional Exercises ....................................................................................156Changing Fractions ......................................................................................157Changing Fractions Exercises......................................................................158
Chapter 12
Adding and Subtracting Fractions.........................................................................161Addition of Fractions ...................................................................................161Addition of Mixed Numbers........................................................................162Addition of Fractions with Unequal Denominators ....................................163Sum of a Group of Mixed and Whole Numbers.........................................164Applied Math Problems Using Addition of Fractions ................................164Exercises.......................................................................................................165Additional Exercises ....................................................................................166Subtraction of Fractions...............................................................................168Subtraction of Mixed Numbers ...................................................................169
SL3100_frame_FM Page 17 Friday, August 31, 2001 10:09 AM

Subtraction of Fractions of All Kinds .........................................................172Addition and Subtraction of Fractions ........................................................173Exercises.......................................................................................................175Additional Exercises ....................................................................................176
Chapter 13
Multiplication and Division of Fractions ..............................................................179Multiplication of Proper and Improper Fractions .......................................179Multiplication of Mixed Numbers...............................................................181Division of Fractions....................................................................................182Problems Calling for Any One of the Four Operations..............................185Exercises.......................................................................................................186Additional Exercises ....................................................................................187
Chapter 14
Ordering, Rounding, and Changing Decimals......................................................191Decimals Using Fractions............................................................................191Rounding Off ...............................................................................................194Rounding Off Exercises ...............................................................................195Additional Exercises ....................................................................................196Changing Decimals ......................................................................................197Exercises.......................................................................................................198
Chapter 15
The Four Operations in Decimals .........................................................................201Adding and Subtracting ...............................................................................201Multiplying Two Decimal Numbers ............................................................204Division with Decimals................................................................................206Division with Decimals Exercises ...............................................................211Applied Problems Using Decimal Operations ............................................212Exercises.......................................................................................................213Change a Fraction into a Decimal...............................................................214Exercises.......................................................................................................215
Chapter 16
Squares, Square Roots, Cubes, Cube Roots, and Proportions .............................217Square and Cube Numbers ..........................................................................218Exercises.......................................................................................................219Squares and Cube Roots ..............................................................................220Calculating the Square Root ........................................................................225Exercises.......................................................................................................228Additional Exercises ....................................................................................229Application of Square Root .........................................................................231Exercises.......................................................................................................234
SL3100_frame_FM Page 18 Friday, August 31, 2001 10:09 AM

Review Test ..................................................................................................235Solving Proportion Problems.......................................................................240Exercises.......................................................................................................241Additional Exercises ....................................................................................242
Chapter 17
Scientific Notation and Powers of Ten..................................................................245Numbers Greater than One ..........................................................................245
Factoring and Writing Numbers ......................................................245Factoring Exercises ......................................................................................247Placing a Decimal Point ..............................................................................247Numbers Less than One...............................................................................249
Changing Exponential Numbers to Standard Decimal Form .........249Writing Numbers Less Than One in Standard Form......................250
Chapter 18
Decimals ................................................................................................................253Numbers Greater Than One.........................................................................253Numbers Less Than One .............................................................................257Addition of Decimal Numbers ....................................................................259
Same Exponents...............................................................................259Different Exponents .........................................................................262
Exercises.......................................................................................................264Subtraction of Decimal Numbers ................................................................265
Same Exponents...............................................................................265Exercises.......................................................................................................265
Different Exponents .........................................................................266Multiplication of Decimal Numbers............................................................268Division of Decimal Numbers .....................................................................270
Chapter 19
The Metric System ................................................................................................273Exercises.......................................................................................................274Conversion of Measures...............................................................................275Exercises.......................................................................................................275Exercises.......................................................................................................276More Conversions of the Metric System.....................................................277Exercises.......................................................................................................283Exercises.......................................................................................................286Cumulative Exercises...................................................................................287
Chapter 20
International System of Units................................................................................289Meter ............................................................................................................290
SL3100_frame_FM Page 19 Friday, August 31, 2001 10:09 AM

Exercises.......................................................................................................291Cubic Meter..................................................................................................292Exercises.......................................................................................................293Kilogram.......................................................................................................294Exercises.......................................................................................................295Kelvin ...........................................................................................................296Exercises.......................................................................................................298Review Exercises on Mass, Grams, and Temperature ................................300Technical Units ............................................................................................302Exercises.......................................................................................................304
Chapter 21
Conversion of English Units to Metric Units .......................................................305Review Test ..................................................................................................305Inches to Centimeters...................................................................................307Exercises.......................................................................................................309Yards to Meters ............................................................................................310Exercises.......................................................................................................311Quarts to Liters and Pints to Liters .............................................................312Exercises.......................................................................................................313Metric Units of Length to U.S. Units..........................................................316Metric Units of Area to U.S. Units .............................................................317Exercises.......................................................................................................319Metric Units of Volume to U.S. Units.........................................................320Exercises.......................................................................................................322Cumulative Exercises for Length, Area, and Volume .................................323
PART III
Appendices
Appendix A
A Typical Cover Sheet for the GPS Process ........................................................327
Appendix B
GPS0. Preparation for Emergency Response Actions (ERAs): AssessmentQuestions .............................................................................................................329
Appendix C
GPS1. Establish the Team/Process Flow: Assessment Questions ........................331
Appendix D
GPS2. Describe the Problem: Assessment Questions ..........................................333
Appendix E
GPS3. Develop Interim Containment Action (ICA): Assessment Questions.......341
SL3100_frame_FM Page 20 Friday, August 31, 2001 10:09 AM

Appendix F
GPS4. Define and Verify Root Cause and Escape Point: AssessmentQuestions .............................................................................................................343
Appendix G
GPS5. Choose and Verify Permanent Corrective Actions (PCAs) for RootCause and Escape Point: Assessment Questions................................................351
Appendix H
GPS6. Implement and Validate Permanent Corrective Actions (PCAs):Assessment Questions .........................................................................................353
Appendix I
GPS7. Prevent Recurrence: Assessment Questions ..............................................355
Appendix J
GPS8. Recognize Team and Individual Contributions: AssessmentQuestions .............................................................................................................357
Selected Bibliography
..........................................................................................359
Index
......................................................................................................................361
SL3100_frame_FM Page 21 Friday, August 31, 2001 10:09 AM

SL3100_frame_FM Page 22 Friday, August 31, 2001 10:09 AM

Part I
Problem Solving
SL3100_frame_INTRO Page 1 Friday, August 31, 2001 10:10 AM

SL3100_frame_INTRO Page 2 Friday, August 31, 2001 10:10 AM

3
Introduction
The six sigma methodology requires that a project be selected and an appropriateresolution be achieved in such a way that both the customer and organization willbenefit — not a bad expectation. However, this is easier said than done. To select aproject presupposes a need for improvement. The implication for that improvementis that either the customer and/or the organization is not satisfied with the productand/or service or status quo of whatever is happening “right now” in the organization.
To select the problem is only half of the task. The other half is to resolve it. InVolume II, the focus is on the process of “how” to go about solving “a” problem,recognizing that more often than not, the solution is going to be through a team.Therefore, whoever is involved must understand the dynamics of team formationand performance. (This may be a good time to review Part II of Volume I.)
From a problem-solving perspective, a team is an entity made up of individualswho have some ownership of the problem, complement each other on the skillsnecessary to resolve the problem, and have knowledge of the process (both theproblem solving process and the process where the problem exists).
For the team to have positive results, three basic strategies must be understoodand planned for:
•
Solving the problem.
Solving the problem comprises eight coping strate-gies (seek organizational support; focus on the specificity of the problemwith excellent operational definition; physical interaction with all mem-bers; seek cooperative diversion; invest in excellent to good intrarelation-ships within the team; seek to belong in a winner environment; be willingto work hard and achieve results based on set criteria on a
a priori
basis;and focus on success) and represents a style of coping characterized byworking at a problem while remaining optimistic, fit, relaxed, and orga-nizationally connected.
•
Nonproductive coping
. Nonproductive coping comprises eight strategies(worry; seek to belong; wishful thinking; to not cope, ignore the problemin the sense of postponing the due date for any reason; reduce tension;keep to self; blame self). These strategies reflect a combination of non-productive avoidance behaviors which are empirically associated with aninability to cope. When this happens, the project falls apart.
SL3100_frame_INTRO Page 3 Friday, August 31, 2001 10:10 AM

4
Six Sigma and Beyond: Problem Solving and Basic Mathematics, Volume II
•
Reference to others
. Reference to others contains four strategies (seekorganizational support; seek professional help; seek spiritual support; seeksocial action) and can be characterized by turning to others for supportwhether they be peers, professionals, or deities.
To facilitate these strategies, Chapter 1 provides a somewhat detailed rationaleand a theoretical explanation of the problem-solving process. Also introduced aresome generic terminology and a path for problem solving.
In Chapter 2, the focus is on problem solving from a quality perspective.Introduced is the definition of a problem. Then progressively some of the issuesinvolved with quality problem solving are addressed.
Chapter 3, addresses some of the key concepts in team dynamics as they relateto problem solving. A discussion on the problem solving cycle follows and the pointis made that most of us keep regurgitating problems without really resolving them.Also emphasized is the process improvement cycle. Some of the issues involved arereviewed and a flow chart to show the continual improvement cycle is introduced.
Chapter 4 introduces some basic tools that are used in problem solving. Onlyan overview is given in this volume, recognizing that some of these tools will befully developed in Volumes III and IV and some additional advanced tools will beintroduced in Volumes V and VI.
In Chapter 5, a version of the methodology used in the automotive industry,specifically at Ford Motor Company, and known as the 8D methodology is intro-duced. It is called the Global Problem Solving (GPS) process, since its applicationmay be used in any industry. It is a very simple methodology, but demands atremendous amount of time to identify and recommend a solution. However, it isvery effective, when used properly.
Chapter 6 introduces some concepts and approaches of problem solving specificto the six sigma project methodology.
In Part II (Chapters 7 to 21), for the convenience of the reader who may not befamiliar with some of the basic math required in problem-solving environments —especially at the root-cause level, or the “floor” level — some basic math will beexplained.
The intent of this volume is to ensure that the reader becomes familiar with theprocess of problem solving, not necessarily with the actual use of specific tools.Explanation and use will be described in Volumes III, IV, V, and VI. Therefore, inessence, this volume attempts to identify the problem-solving process and, in fact,to crystallize the notions that problem solving (1) must be based on fact; (2) mustbe creative; and (3) must be based on the experience of people.
SL3100_frame_INTRO Page 4 Friday, August 31, 2001 10:10 AM

5
Theoretical Aspects of Problem Solving
This chapter introduces the problem solving process from a theoretical perspective.It addresses some fundamental issues that must be understood by anyone who isinvolved in solving a problem. It also establishes the rationale for a structure.
Problem solving can be broadly defined as meeting challenges. Indeed, this isthe core of what the six sigma methodology proposes to do, i.e., to reduce variabilityand increase profitability for the organization employing the initiative called “sixsigma.” Looking further into the definition of a “problem solver,” the
Oxford EnglishDictionary
notes that a problem solver “is challenged to accomplish a specifiedresult, often under prescribed conditions.”
It is our task, then, to find a consistent approach that can be repeated again andagain when a concern — an opportunity — arises. To appreciate this consistency,we must recognize that the way a situation is approached depends on a flow ofinformation similar to Figure 1.1.
In Figure 1.1, one can see that the response or decision is a function of the input(Sensory Input). But that is not all! That input has to be interpreted (Recognized)and that is the problem. Interpretation is a function of perceptual, cultural, andintellectual as well as emotional attributes that an individual brings with him/her tothe table of problem solving. It is this interpretation of the inputs that will guide theteam into a fruitful evaluation of the facts and data and ultimately the appropriatedecision. (For the reader who is interested in more detail about the scientific back-ground of the model of understanding, the following readings are suggested: Wundt,1973; Koffka, 1935; Kohler, 1925; Wertheimer, 1929; Chomsky, 1965, 1967; Newelland Simon, 1972; and many others.)
How do we go through this basic model? Generally, four steps are followed:
Step 1.
Preparation:
When the problem solver becomes involved with theproblem and searches for and accumulates relevant information
Step 2.
Incubation:
When there is no conscious effort to deal with the problem,but although the subject is not aware of it, work on the problem continues
Step 3.
Illumination:
The result of a successful incubationStep 4.
Verification:
When some elaboration of reality testing of the solutiontakes place
1
SL3100_frame_C01 Page 5 Friday, August 31, 2001 10:11 AM

6
Six Sigma and Beyond: Problem Solving and Basic Mathematics, Volume II
These four stages have been empirically and experimentally validated through thework of many investigators including Wallas (1926), Anderson (1975), Aiken (1973),and Skemp (1971). Table 1.1 presents some typical examples of supported researchgeneralizing the stages of problem solving.
The term “problem solving process” has traditionally been applied to the char-acteristics of problem solving performance. However, this is troublesome becauseit is a matter of choice as to how one pursues this process. For example, thebehaviorists usually focus on situational variables, the Gestaltists focus on built-inmechanisms in the subject, and information processing specialists study the charac-teristic requirements of the task itself. To be sure, all three dimensions are important,but to have the utmost result, all dimensions must occur simultaneously.
How does one prepare and ultimately go through the process of problem solving?The literature is abundant with references from Plato and Aristotle, who focused onthe notion of the human mind as the most important element of the process; toMedieval theology and Descartes, who pushed for the notion of the nature of man;to Hobbes in the 17th century; to Locke, Berkeley, and Hume in the 18th century;and to James and John Mill in the first part of the 19th century, who pushed thenotion of reason as the foundation for problem solving.
In 1927 it was Kohler who as one of the founders of Gestalt psychology soughtto explain the notion of “insight.” He used the term to describe the capacity shownby members of the human race to restructure a given problem situation to theiradvantage or to solve a task through recognition of the relationships and interactionsbetween its component parts.
In this volume the Gestalt approach to problem solving has been selected as themost appropriate and user friendly of most applications. (By no means does thissuggest that the other approaches are not significant.) The choice of the Gestalt
FIGURE 1.1
Understanding “a” situation.
SL3100_frame_C01 Page 6 Friday, August 31, 2001 10:11 AM

Theoretical Aspects of Problem Solving
7
TABLE 1.1
Generalized Stages of Problem Solving
Researcher Approach
Helmholtz (1984) 1. Investigation of performance in all directions2. Not consciously thinking about performance3. Appearance of “happy idea”
Dewey (1910) 1. Felt difficulty2. Location and definition3. Possible solutions4. Reasoning5. Acceptance or rejection
Wallas (1926) 1. Preparation2. Incubation3. Illumination4. Verification
Rossman (1931) 1. Observation of difficulty2. Analysis of the need3. Survey information4. Proposed solutions5. Birth of the new idea6. Experimentation to test promising solution;
perfection by repeating some or all previous stepsYoung (1940) 1. Assembly of material
2. Assimilation of material3. Incubation4. Birth of the idea5. Development to usefulness
Polya (1945) 1. Production2. Incubation3. Illumination4. Accommodation
Hutchinson (1949) 1. Preparation2. Frustration3. Insight4. Verification
Mawardi (1960) 1. Abstract thoughts (A)2. Instrumental thoughts (I)3. Metaphonic ideas (M)4. Orientation (O)
Osborn (1963) 1. Think of all aspects2. Select subproblem3. Gather data4. Select relevant data5. Think of possible help6. Select attacks7. Think of possible tests8. Select soundest test9. Imagine all possibilities
10. Decide final answer
SL3100_frame_C01 Page 7 Friday, August 31, 2001 10:11 AM

8
Six Sigma and Beyond: Problem Solving and Basic Mathematics, Volume II
approach is based fundamentally on the notion of such greats as Kohler (1927),Maier (1970), Durkin (1937), and others who contend that the lack of success inproblem solving is (1) biologically determined from an inability to integrate previousexperience and (2) a result of functional fixedness, a tendency to think of objectsas serving only in a limited “set,” which may have been established by previousexperiences, but may be inappropriate to a particular problem situation. It is amazingthat Durkin (1937) actually demonstrated that a solution to a complex puzzle wasfacilitated by prior experience with simpler ones.
It would be unfair to not also mention the efforts of the behaviorists in thisdiscussion. Indeed, C. L. Morgan (1894), Thorndike (1898, 1917), Woodworth andSchlosberg (1954), and Alexander Bain (1855, 1870) suggested that given a genuineproblem, there must be some exploratory activity, more or less in amount and higheror lower in intellectual level. This, of course, is another way to express the oldfamiliar statement about problem solving as the “trial and error” method. The worksof Gofer (1961), Dulany (1968), Kendler and Kendler (1961, 1962), Skinner (1966),Staats (1968), and others support the notion that problem solving is dependent uponpreviously acquired stimulus.
Although an ideal process of sequential operations might theoretically beassumed on the basis of the structure of the problem itself, at least for some well-defined tasks such as mathematical problems, this “ideal” process may bear littleresemblance to the structural elements which operate when individuals solve prob-lems. Processes which are presumed to operate on the basis of task requirements
Skemp (1971) 1. Assimilation2. Accommodation
Newell and Simon (1972) 1. Input translation2. Internal representation3. Method selection4. Implement and monitor5. Reformulate
Johnson (1972) 1. Seek information2. Represent and transform3. Organize and reorganize4. Judgmental processes
Anderson (1975) 1. Preparation and production2. Incubation and eureka or “aha” experience
Sternberg (1980a) 1. Encoding2. Inference3. Mapping4. Application5. Justification (verification)6. Response (communication)
TABLE 1.1
(Continued)
Generalized Stages of Problem Solving
Researcher Approach
SL3100_frame_C01 Page 8 Friday, August 31, 2001 10:11 AM

Theoretical Aspects of Problem Solving
9
alone must be regarded as incomplete because they fail to take person- and envi-ronment-related process determinants into consideration. Different individuals mightaddress the same task differently. They may differ in the amount of considerationand reflection on different solution possibilities and their utilization of external orinternal cues or perhaps in the capacity or use of memory storage and retrievalprocesses. Therefore, different methodologies have been developed to accommodateeach of these situations. The reader may want to explore some of these through thewritings of Lazerte (1933), process tracing; Maier (1931b), introspection; Ghiselin(1952), retrospection; Binet (1903), Bloom and Broder (1950), Luer (1973), Newelland Simon (1972), and Simon (1976), protocol analysis (thinking aloud).
Earlier a generalized format of problem solving was discussed; however, wemust also recognize that research continues to identify the best and most efficientway of solving problems as well as the root causes. One such approach has beenthe innovation of Osborn (1963), who suggested that there is a difference between“idea creation” and “idea evaluation.” This, of course, is what is now called the“brainstorming” technique. According to Osborn, there are ten steps. Steps 1, 3, 5,7, and 9 are the creative thought process and Steps 2, 4, 6, 8, and 10 are evaluative:
Step 1. Think of all phases of the problem.Step 2. Select the subproblem to be attacked.Step 3. Think of what data might help.Step 4. Select the most likely sources of data.Step 5. Dream of all possible ideas as keys to the problem.Step 6. Select the ideas most likely to lead to a solution.Step 7. Think of all possible ways to test.Step 8. Select the soundest ways to testStep 9. Imagine all possible contingencies.Step 10. Decide on the final answer.
For the process of problem solving to be effective, perhaps the most importantingredient in that process is the operational definition. In problem solving terminol-ogy, an operational definition is one that specifies the meaning of the concept bydenoting the measuring operations and suggests a criterion of whether or not a so-called empirical concept is a scientific concept (repeatable and reproducible by others)and whether or not it has been operationally defined. It must be understood that thedefinition in operational terms is not a theory, nor is it scientific in itself, but it providesthe essential basis for the measurements which make possible initially the identifica-tion of the phenomena for subsequent scientific investigation. Excellent operationsdefining a particular phenomenon serve to differentiate it from other phenomena.
DEFINITION OF TERMS
Just like anything else, problem solving has some important definitions. Everyoneinvolved should be familiar with them. Therefore, this section provides some keydefinitions, general terms, terms related to the gathering of data, and terms relatedto the interpretation of the data.
SL3100_frame_C01 Page 9 Friday, August 31, 2001 10:11 AM

10
Six Sigma and Beyond: Problem Solving and Basic Mathematics, Volume II
P
ROBLEM
S
OLVING
The lack of a generally acceptable definition of this term in the literature and thebroad and apparently indefinite scope of its use led Ernst and Newell (1969) to note:“Behind this vagueness … lies the absence of a science of problem solving that wouldsupport the definition of a technical term” (p. 1). Traditionally, the term
problemsolving
has been used to describe the behaviors applied by a motivated subject,attempting to achieve a goal, usually in an unfamiliar context, after initial lack ofsuccess (Johnson, 1972). Definitions of the term tend to maintain that a problemexists when an individual is confronted by a “difficulty” (Dewey, 1933), a “gap”(Bartlett, 1958; Kohler, 1927), a “conflict” (Duncker, 1945), “disequilibrium” (Piaget,1968), or a “deviation” from a familiar situation (Raaheim, 1974). While this typeof description would seem to be equally suitable to define such terms as searching,understanding, or learning, “much contemporary research continues to reflect thebasic Gestalt view that problem solving, by virtue of its emphasis on responsediscovery is something apart from learning” (Erickson and Jones, 1978, p. 62).
Historically and to the present
day, the term
problem solving
has been used withconsiderably greater frequency in reference to outcomes or products, particularlythe success/failure aspect of the activity, rather than the process per se. Problemsolving as a process became the focus of research with the weakening of interest ofresearch workers in the perceptual and experiential aspects of thought, as had beenpursued by associationists and Gestalt psychologists.
As was noted earlier, the Gestalt approach to research into problem solvingmight be described as subject oriented. The more recent, important contributions ofthe information processing and artificial intelligence studies, though concerned withthe investigation of the problem solving process itself, focused primarily on thedemand characteristics and structure of certain problem solving tasks (e.g., Newelland Simon, 1972; Scandura, 1973, 1977; and Wickelgren, 1974). The term problemsolving can refer to all overt and covert activities that take place to reach a solutionor otherwise accomplish a goal or purpose in a problem solving situation.
For the purposes of the six sigma methodology, the term
problem solving
is usedto broadly describe the results of the interaction of components from the followingfive domains of variables:
Step 1. The problem or task, TStep 2. The problem solver or subject, SStep 3. The situational circumstances or the environment in which the problem
is presented or presents itself, EStep 4. The behaviors or processes which take place between the point of
initial contact with the problem by S and the solution produced by S, XStep 5. The solution or product of the problem solving activity, P
Regardless of the type of problem or the manner in which task (T), subject (S),environment (E),
and process (X) variables interact, the product (P), whatever formit might take, is always a function of the interaction of variables from the remainingdomains. This relationship can be expressed by the mathematical function:
SL3100_frame_C01 Page 10 Friday, August 31, 2001 10:11 AM

Theoretical Aspects of Problem Solving
11
P(T) = f(T + S + E + X
)
where every variable may be represented by a number of domain components.It is imperative to not think of the product P as the dependent variable. Instead,
the aim is to investigate structural components of the problem solving process X,which in turn must be expected to be a function of variables from the remainingdomains; hence
X = f(T + S + P + E)
Although it is accepted that during problem solving the above suggested sets ofvariables may interact in many intricate ways, it seems legitimate and necessary todefine each of them separately.
P
ROBLEM
OR
T
ASK
These terms are used interchangeably. The term
problem
has traditionally served asa label for a variety of phenomena, ranging from mathematical tasks to problemsin real life. A common characteristic of all problems seems to be that they involvean aim which the problem solver wishes to accomplish, the means for which (i.e.,the required knowledge, skills, techniques, or behaviors) are not at his or her disposal.
To be confronted with a problem means to be faced with a difficulty or anobstacle that cannot be solved or dealt with in an already known or habitual manner;thus a reasonably general yet meaningful description of a problem or task might bethat it may arise from any stimulus situation in which an appropriate response isnot readily available. This definition is similar to many explanations of the termfound in the research literature. A problem is described as:
• Whatever — no matter how slight or commonplace in character — per-plexes and challenges the mind so that it makes belief at all uncertain(Dewey, 1933, p. 13)
• A question for which there is at the moment no answer (Skinner, 1966,p. 225)
• When a person is motivated toward a goal and his first attempt to reachit is unrewarding (Johnson, 1972, p. 133)
• A stimulus situation for which an organism does not have a ready response(Davis, 1973, p. 12)
• When a system has or has been given a description of something but doesnot yet have anything that satisfies the description (Reitman, 1965, p. 126)
The definition of a problem as a phenomenon that may arise in any stimulussituation in which an appropriate response is not readily available is broad enoughto cover physical, emotional, intellectual, and social problems. It can refer to prob-lems of varying complexity, to defined and ill-defined tasks, and to structured andunstructured problems. It serves to prevent the problem solver from avoiding orignoring the problem, but does not require the individual to recognize the task
SL3100_frame_C01 Page 11 Friday, August 31, 2001 10:11 AM

12
Six Sigma and Beyond: Problem Solving and Basic Mathematics, Volume II
“objectively.” The “objective” problem is the task as perceived by the individual.This position acknowledges that what is a problem for one person may not be foranother. The latter individual, in this case, has an appropriate response readilyavailable in a stimulus situation which might present a problem for the former person.In summary, it is suggested that the above presented definition of the term “problem”or “task” subsumes all types of problems without, however, obscuring the differencesthat may exist in different problem solving situations.
A further point of definition may require clarification. It would follow from theabove definition that a problem that does not elicit any reaction from the individualor a task that has been solved would cease to be a problem. The English languageunfortunately does not provide an alternative term to cover these types of situations.Frequently occurring tasks, such as the simple arithmetic “problem” 1 + 1 = 2, whichelicit well-rehearsed, often automatic responses, do not fall into the problem categorydefined above. Other languages provide alternative terms for these “problems” (e.g.,in Greek one would use “askese,” in German one would use “die Aufgabe,” and inFrench one would use “la tache”) which permit a clearer distinction between a“problem” which requires at least some effort in terms of productive thinking onthe part of the subject and what may be described as a simple exercise or routinestimulus-response association. The term “problem” as used in this volume does notinclude simple stimuli presented for automatic response.
P
ROBLEM
S
ITUATION
This concept was first used by Wertheimer (1923), who regarded it as consisting oftwo ingredients. These are the aim or solution, i.e., “that which is demanded,” andthe stimulus or materials, knowledge, skills, etc., i.e., “that which is given.” Theprocess of problem solving commences when what is given is brought into associ-ation with that which is demanded. This will include, for example, considerationsof how the givens might lead to a solution. For example, the “functional value”(Duncker, 1945; Kohler, 1917) of the givens might be assessed as done by Kohlerin the case of the sticks utilized by a chimpanzee to reach bananas.
S
UBJECT
This term refers to the individual who is attempting to solve a problem. The problemsolver cannot be considered to be a neutral agent. All variables — many of themunknown, some known, but not yet measurable, others constant — that determinethe subject’s behavior make up this domain.
Obvious examples of these variablesare motivation; memory; intelligence; general background and experience, includingexperience with problems of a certain type; and social and personality variables.
E
NVIRONMENT
The total problem solving environment includes physical, psychological, and socio-logical variables. The physical environment provides many perceptual cues andmemory associations that might be used by the problem solver to define, analyze,and understand the problem and to enlarge the set of available approaches to the task.
SL3100_frame_C01 Page 12 Friday, August 31, 2001 10:11 AM

Theoretical Aspects of Problem Solving
13
On the other hand, physical, psychological, and sociological variables and factorsresulting from their interaction may place certain constraints on the task, the solution,or the problem solving activity and directly or indirectly influence the process as awhole. The problem environment contains, of course, the experimenter with all ofhis or her characteristics. Task directions, definitions, etc. form part of the problemor task.
P
ROCESS
Problem solving is often referred to as a process. Yet the evidence for the occurrenceof this process is based on an examination of the end product, performance. Theoutcome of problem solving, i.e., the results of the process (or processes), not theprocesses themselves, are described.
The problem solving process, which begins with presentation of the problem, isterminated when the subject arrives at a correct solution; when the subject arrives atan incorrect solution believed to be correct; or when the experimenter ends the session.
P
RODUCT
OR
S
OLUTION
These terms are used interchangeably for the result of the problem solving activity.The term
product
would appear to be more suitable for research purposes becauseof the connotation of the term
solution
. One would, generally, expect a solution tobe “correct.” In the six sigma methodology, both terms are used for the result oroutcome of the problem solving attempted by subjects. The terms apply to both“correct” or “incorrect” outcomes.
P
ROBLEM
-S
OLVING
B
EHAVIOR
OR
O
PERATION
AND
P
ROBLEM
-S
OLVING
S
TRATEGY
Again, these terms are used interchangeably to denote any response or any part ofa response pattern that is observed during the subject’s problem solving activity, i.e.,can be identified on the basis of the subject’s problem solving protocol. It is acknowl-edged that many behaviors are unobservable and therefore will not be contained inthe protocol. The difference in processing rate per time unit between thought andspeech and the inability of speech to reflect parallel processes result in the fact that“thinking aloud” protocol contains a reduced version of the problem solving process,no matter how perfect the experimental conditions. Strictly speaking, use of the term“strategy” should perhaps be restricted to dynamic processes involved in perfor-mance which are made up of several operations or behaviors. On the other hand,the repeated use of a specific operation over time may well be conceived as a strategyrather than an operation.
Dynamic processes that perform specific operations are called “strategies.” Theidea is that elementary mental operations may be assembled into sequences andcombinations that represent the strategy developed for a particular task. It is oftendifficult to determine whether the elementary mental operations isolated are strate-gies or whether they are structures.
SL3100_frame_C01 Page 13 Friday, August 31, 2001 10:11 AM

14
Six Sigma and Beyond: Problem Solving and Basic Mathematics, Volume II
The chess master, for example, who has developed a strategy for analysis of thechess board over many years of practice, may be unable to modify it; thus it becomesmore structural in character. Indeed, high levels of skill seem to be characterized bythe development of a structural basis for what in most of us is a painfully assembledstrategy. Perhaps, this is precisely the reason why “problem solvers” are generallysought after rather than planners. It is the cumulative experience that the “problemsolver” brings into the situation to resolve the issue at hand. More often than not,a good problem solver operates from a pattern of processes rather than sequentialones. In fact, it is the pattern association of past experiences that drives new solutions.
TERMS AND ISSUES RELATED TO DATA GATHERING
Definitions of the
following terms are provided in an endeavor to increase the clarityof the description of the method and importance of data gathering.
S
TIMULUS
P
ASSAGE
This term refers to a single sheet of paper containing a diagram, a typed sentence,a paragraph, or paragraphs presenting the subject with the task. A typical stimuluspassage may be a flow chart of the process or some measurements of a process. Therationale of stimulus passages is to provide the means by which the subject may beacquainted with each task.
V
ERBALIZATION
OR
“T
HINKING
A
LOUD
”
The terms are used interchangeably to refer to the subject’s verbal expressions anddescriptions of his or her ongoing problem solving activity. Typically this is a versionof brainstorming.
P
ROTOCOL
A verbatim written transcript of the cassette recording made of all verbalizationsproduced by subjects during the problem solving session is produced. The protocolcontains a complete record of the description of problem solving provided by thesubject’s “thinking aloud.” It also contains evidence of any other verbal or verballyreported activities that occurred. A protocol, then, provides a description, keepingtime sequence intact, of problem solving performance as it occurred. On the otherhand, not every description of performance of a task constitutes a protocol.
A description of a task consisting of goals and outcomes is not sufficient. Theproblem solving protocols provide information, not only concerning the answers thesubjects provided, but also, and more importantly, they provide an indication of thesequence in which the problem solving behaviors occurred. Subjects may ask ques-tions, refer to the stimulus passage, compute, etc. in a particular order.
This approach to gathering data may be very helpful in customer surveys andmarket research studies as well as when someone is interested in identifying veryspecific tasks and interpretations of a particular job, project, etc.
SL3100_frame_C01 Page 14 Friday, August 31, 2001 10:11 AM
Theoretical Aspects of Problem Solving
15
Process components
are identified on the basis of the amount of use made byeach subject of certain problem solving behaviors or strategies and by investigatingtransition sequences of these behaviors at various temporal stages of the problemsolving activity.
Behavior or strategy use
is measured by the activity of the process as a wholein addition to the individual participation of team members. This participation is ofparamount importance, and it depends on the leadership of the team as well as onthe appropriate cross-functionality and multidiscipline of the team members. It isthis behavior and strategy that ultimately will (1) select the likely potential cause;(2) prevent recurrence; and (3) define the roles and team orientation.
Select the Likely Potential Causes
Once the problem has been described and the potential causes have been identified,the team should be evaluated. Are the right members on the team to investigate thepotential causes? Are technical advisors required to assist in any special studies?Are new team members needed? Is the authority to pursue the analysis of thepotential causes well defined? All of these questions must be answered to ensurethat the team will be successful in investigating the potential causes and determiningthe root cause.
A typical tool that is used is the cause-and-effect diagram, in conjunction withbrainstorming, to identify the potential causes to be investigated. What is the prob-ability that a potential cause could be responsible for the problem? Identify allpotential causes that could have been present and might have caused the problem.
Once all potential causes have been agreed on, choose several potential causesto investigate. If only one potential cause is investigated, a lot of time may be lostif that potential cause is not the cause of the problem. To expedite the investigationof potential causes, investigate several causes at the same time. Parallel actions onseveral potential causes will expedite the process.
If the problem is a manufacturing process, begin to establish a stable process.Once the process is stable, definition of the potential cause will be clarified. On theother hand, if engineering design causes are identified, screening experiments mayhelp identify the key variables which are affected by subsequent processes, androbust design actions may be appropriate.
Four or five potential causes to investigate should be identified. Identifyingseveral potential causes forces the team to address multiple causes rather than searchfor a single cause. An implicit part of the problem analysis is investigating potentialcauses in parallel rather than in series.
Prevent Recurrence
A second concern in the behavior and strategy phase is to make sure that the problemonce solved will not recur. The analysis begins with understanding what in theprocess allowed the problem to occur. A cause-and-effect diagram can be used tooutline the reasons the problem occurred. By asking “because?,” the cause-and-effectdiagram could be constructed.
SL3100_frame_C01 Page 15 Friday, August 31, 2001 10:11 AM

16
Six Sigma and Beyond: Problem Solving and Basic Mathematics, Volume II
Another effective tool is a process flow diagram. The process flow of the man-ufacturing or engineering process or even a service can be effective in identifyingwhere in the process the problem could have been prevented. Most of the time, toprevent recurrence of the problem, a change to the management system will berequired. Managers must understand why their system allowed a problem to develop.The same system will allow future problems to occur.
Management systems, practices, and procedures need to be fully understood tobe effective. Most of them are carry-overs from previous experiences and organiza-tional structures. Some are outdated and need to be revised. Understanding theelements of a management system can be achieved by maintaining an up-to-dateflow diagram of the system and process. Also, instructions should be easy to followby those who are part of the system.
Management systems, practices, and procedures should provide managementsupport for “never-ending improvement” in all areas and activities. The systemshould encourage individuals to participate freely in the problem solving process.It should help them understand more about their job and how each individual’s effortaffects the outcome of the final product on the customer satisfaction. The systemshould encourage everyone to learn something new, and it should recognize indi-vidual and team effort when these new skills are applied.
Changes in the management system may require documenting new standardprocedures, streamlining to remove obsolete procedures, and revising previous stan-dards. Any changes in the management system need to be communicated clearly toall customers.
To prevent recurrence, additional training is often required. Training may beneeded in statistical tools, new engineering or manufacturing technologies or disci-plines, better process, or project management. Some basic problem solving tools are
1.
Process flow diagram
. A process flow diagram (sometimes called map-ping) is a graphic presentation of the flow and sources of variation in aprocess. In manufacturing, a process flow is a graphic presentation of theflow and sources of variation of machines, materials, methods, and oper-ators from the start to the end of the manufacturing and/or assemblyprocess. To graphically display the total process, some standard symbolsare helpful in commonizing the process flow diagrams. While the symbolsused will vary from one application to another, it should be noted thatany process can be diagramed.
2.
Control charts
. The various types of control charts are graphic tools usedto separate controlled and uncontrolled variation in a process. All suchcharts have the same two basic functions:
• To establish whether or not a process is operating in a state of statisticalcontrol by identifying the presence of special causes of variation. Thispermits corrective actions to be taken.
• To maintain the state of statistical control once it is achieved. Thisallows for periodic recalculation of the control limits which may, inturn, lead to reduced variability within the process being charted.
SL3100_frame_C01 Page 16 Friday, August 31, 2001 10:11 AM

Theoretical Aspects of Problem Solving
17
There are two broad classifications of chart types. They are based on thetype of data for which they are appropriate. Charts for quantitative data(measurements of length, weight, time, etc.) include:
• Xbar and R charts• Xbar and S charts• Xbar and median charts• Individual X and R charts (charts for individuals, run charts)
Attribute-type data have only two possible values (pass/fail, go/no go,present/absent, etc.). The principal types of charts for such data include:
• P charts• NP charts• C charts• U charts
3.
Histograms.
A histogram is a pictorial representation of the distributionof measured or counted items. It is a quick way to establish the averageor middle value of a distribution, the variation or dispersion of the distri-bution, whether any outliers exist, and whether the distribution is bellshaped (normal). A histogram is a data collection device used to quantifyand establish the distribution of the problem, to quantify the size of aproblem, to highlight differences between the actual results and somestandard, etc., and for before and after comparisons.
4.
Stem and leaf plots
. This tool is a special case of the histogram and servesthe same purpose as the histogram, but has one significant advantage —it preserves the actual data values. In many cases this is a very desirablefeature. While the typical histogram depicts the distribution of the dataon which it is based, the data values cannot be reconstructed from thepicture. They must be provided separately or they are lost. The stem andleaf plot, however, serves the same purpose, gives the same picture, and,simultaneously, preserves the original data values.
5.
Check sheets
. A check sheet is a form on which data are recorded as thedata are collected. Check sheets are most often used to facilitate the datacollection process and to simplify data analysis. Check sheets sort the dataas the data are collected, providing construction of a histogram at the sametime. However, this tool will not show changes over time. A check sheetis used to collect data to verify the effectiveness of interim actions, toanalyze potential causes, and to verify the effectiveness of permanentsolutions. As a data collection tool, similar to histograms and Pareto charts,a check sheet is often a logical starting point in problem solving.
6.
Plots/graphs
. Plots and graphs of various kinds are pictorials formed fromwhat would otherwise be tables of numbers (data values). They are usedprimarily to allow the quick
identification of trends or patterns in data andto suggest appropriate techniques for further analysis. Therefore, they are
SL3100_frame_C01 Page 17 Friday, August 31, 2001 10:11 AM

18
Six Sigma and Beyond: Problem Solving and Basic Mathematics, Volume II
a very convenient way to summarize and visualize data. Plotting raw datais quick and simple and, by itself, provides no additional information notalready in the data. The advantage of a plot or graph is that it highlightstrends, etc. which are usually much more difficult to notice in an oftenintimidating table of numbers. With such a tool, the “reader” can quickly“see” a picture of what the data are “saying.” Plots and graphs also havea tendency to point out and quantify differences within the data and, inmany cases, to identify the areas of concern to the “reader.” Frequently,stratifying or separating the data by categories such as shift, time, sequence,or supplier will be of help in understanding the differences which wouldotherwise be lost by “lumping’’ all the data together. Since there are nouniversal rules for plotting, the user may wish to plot the same data inseveral ways to see what “story” emerges from the different plots.
7.
Pareto diagrams
. A Pareto diagram is a special type of vertical bar graphused to indicate which cause needs to be solved first in eliminating theproblem. In problem solving, the Pareto diagram separates the “vital few”from the “trivial many.” Quite often this diagram will also identify thecumulative contribution of the characteristics identified as a percentage.
8.
Scatter diagrams
. A scatter diagram is a plot between variables to illustratea possible relationship between the variables. The plot is constructed sothat the horizontal axis (x-axis) represents the measured values of onevariable and the vertical axis (y-axis) represents the measured values ofthe second variable. The strength of the relationship between variables 1and 2 is indicated by the direction and density of the cluster of plottedpoints. The scatter diagram can be used to show a correlation between asuspected cause and the effect being investigated. There must be, however,a rational (engineering, etc.) basis to suspect a cause-and-effect relation-ship since
correlation alone does not imply cause and effect
.
9.
Gage reproducibility and repeatability
. A gage study is performed toinvestigate the amount of variation added to the total process by themeasurement system. Most gage studies will quantify the amount ofvariation added to the process by the operator (reproducibility) and bythe precision (repeatability). If the combined variability of the operatorand the gage precision is “using up” too much of the blueprint tolerance,then the gage will need to be reworked. Gage studies are essential toproblem solving for manufacturing processes. In many cases, the gagemay be a large contributor to the production problem. There are severalmethods available for doing gage studies and each has its own appropriatearea of application.
10.
Capability indices
. Capability studies are performed on machines to estab-lish the ability of the machine to produce parts to blueprint specifications.The most common indices cited for machine capabilities are C
p
and C
pk
.The first capability index, C
p
, is the relationship between the engineeringblueprint tolerance and the machine variability or process spread. Theprocess capability index C
p
is calculated by:
SL3100_frame_C01 Page 18 Friday, August 31, 2001 10:11 AM

Theoretical Aspects of Problem Solving
19
C
p
= tolerance/process spread = tolerance/6
σ
where
σ
is the standard deviation of the process. The second capabilityindex, C
pk
, is a measure of how well the process distribution is centeredbetween the specification limits. The process location index, C
pk
, is cal-culated by:
C
pk
= absolute value of [sl – Xbar]/3
σ
where sl is the closest specification limit to Xbar, the process average.Both of these indices are used to define the process capability. Capabilitystudies can be used to define a problem or to verify permanent correctiveactions in the problem solving process. Either way, the process must bestable before its capability can be studied.
11.
Design of experiments (DOE).
DOE is a discipline which is intended toproduce experiments (tests) which are both effective and efficient. It is areplacement for the “one-change-at-a-time” method of experimentation.Designed experiments are effective because they are planned from thestart to answer the specific questions for which answers are needed. Theseexperiments are efficient because they get maximum use from minimumdata. The result is that better experiments are performed rather than simplydoing more of them and experiments produce the most information withthe least cost in dollars and time. The DOE process usually requires thecooperation of the experimenter, test operator, and perhaps a statisticianor consultant (thus a fringe benefit is the teamwork that results). Theexperimenter supplies the list of specific questions to be answered by theresearch and together they design an experiment which will ensure thecollection of data sufficient to get these answers with a minimum expen-diture of time and resources. The benefits of a designed experimentvis-à-vis the “one-at-a-time” approach include those already mentionedin addition to the ability to:
• Establish cause-and-effect relationships between several different vari-ables (simultaneously at different levels) and the outcome (effect) beingstudied.
• Eliminate (block out a screen for) confusing or confounding the effectsof two or more variables.
• Evaluate the interactions of two or more variables. (In fact, a designedexperiment is the
only
way to do this.)• Identify the variation due to planned changes while separating it from
the remaining, ever-present, variation.
The various kinds of designed experiments and the particular strengthsand weaknesses of each are too numerous to list here. The scope of theirapplications, however, ranges from the social sciences to engineering and
SL3100_frame_C01 Page 19 Friday, August 31, 2001 10:11 AM

20
Six Sigma and Beyond: Problem Solving and Basic Mathematics, Volume II
production applications to problem solving in general. A screening exper-iment is a type of designed experiment. It is most often used to evaluatemany factors in an experiment. In general, the screening experiment willonly look at the main effects and not investigate the possible “interaction”between variables. When first investigating a problem, a screening exper-iment is beneficial in identifying those potential causes that influence theeffect the most. This type of experiment is also called a fractional factorialdesign. These experiments have been popularized by Taguchi.
12.
Is/Is Not
. This approach helps in the definition of the problem. It is usedas part of the brainstorming session to focus on the true “problem” underconsideration.
13.
FMEAs
. Failure mode and effect analysis (FMEA) is a semiquantitativeanalytical technique
involving a well-disciplined, systematic approachstructured around usual problem-solving techniques. However, the mostimportant feature of FMEA is that it is done before an actual field problemoccurs. Therefore, it is a preventive rather than a detective approach.FMEA provides a means to prioritize the identified potential problemsfor resolution. It also provides documentation of “due-care” in a legalsense. Total FMEA consists of concept, design, manufacturing, assembly,and other FMEAs at system, subsystem, or component level. The actualFMEA implementation level depends upon available resources, associatedcomplexity, severity, etc. Usually, FMEAs are performed by cross-func-tional teams consisting of representatives from various activities. Properimplementation of the FMEA process will result in:
• Improved product reliability due to prevention of problem occurrence• Improved validity of analytical methods through documentation and
scrutiny• Retention of knowledge and experience• Sound knowledge and a database
While there are several FMEA techniques, e.g., tabular FMEA, fault treeanalysis (FTA), etc., most organizations use the tabular FMEA format. Itis considered to be one of the best procedures. The important features ofthe procedure are
• Identify part function and potential failure modes.• Identify the severity and the effect of the failure.• Identify the causes and their occurrences of these failure.• Identify the controls that are in place to find and to make sure that the
failure will not go to the customer. Calculate the risk priority number(RPN) which is the product of the following three ranking indices:
RPN = Severity × Occurrence × Detection
SL3100_frame_C01 Page 20 Friday, August 31, 2001 10:11 AM

Theoretical Aspects of Problem Solving 21
Each index ranges from 1 to 10 and specific values are assigned by theFMEA preparing team. The order of analysis may be in two forms: The first is
• The highest severity ranking takes priority.• The product of severity and occurrence takes the second priority.• Detection (in a sense the RPN) takes the third priority.• A higher RPN value indicates the need for corrective action.
The second is
• Identify the highest RPN and proceed with appropriate correctiveactions that will lower the RPN index.
In both cases, reevaluation is essential and the goal is to drive all numericalvalues as low as possible. Reevaluation is based on the corrective actionimplementation. If the values of the analysis are still very high, identifyfurther improvement actions and repeat the process as required. In theautomotive industry, FMEA has undergone some major changes, such asmaking FMEA a critical part of the “robustness” attitude. In some cases,because of the changing technology and its complication, items such as“repairability” to reflect availability, maintainability, and “serviceability”are considered in the evaluation. When that occurs, the FMEA processitself remains unchanged except for the revised RPN which is calculated as:
RPN = Occurrence × Severity × Detection × Repairability
14. Weibull analysis. This is a technique used to analyze and graphicallypresent field failure and life test data. With it, one can also estimate (withor without confidence intervals) the useful life of an item. The processbegins with collection of “run to failure” data which, with some relativelysimple (and perhaps computer assisted) calculations, produces the infor-mation required for plotting on a special kind of graph paper calledWeibull probability paper. The following information is then availablefrom the resulting plot:
• The percentage of the population which can be expected to fail belowa specified life
• The life value (Bq) below which q% are expected to fail (The user canselect an appropriate value for q. For example, the B10 life is that valueat which one can expect 10% of the population to fail.)
• The slope of the failure distribution line which provides an indicationof the type of failure (A slope of less than 1.0 indicates a decreasingfailure rate — sometimes called the infant mortality period. A slopeof approximately 1.0 indicates random failures and a slope greater than1.0 is indicative of “wear out” failures.)
SL3100_frame_C01 Page 21 Friday, August 31, 2001 10:11 AM

22 Six Sigma and Beyond: Problem Solving and Basic Mathematics, Volume II
An entire family of Weibull density functions can be individually distin-guished based on this last item (the slope). This permits wide applicationof the technique. The method is also quite useful for many series systemsand for comparing different designs, materials, or processes. Weibullprobability paper is used for analysis. This graph paper is a special plottingpaper: both scales are logarithmic and the horizontal scale is usually afunction of time (hours, miles, etc.) to failure. The vertical scale is acumulative percentage of failures. In the upper left corner, there is apreprinted compass-like scale with which to determine the slope of theWeibull distribution function for the particular item (part, etc.) understudy. A Weibull distribution plot always identifies failures. However, ifthe failures are subtracted from 1, then one can actually identify thereliability, as well.
An awareness of each of the above tools is a necessary minimum. Some personswill need considerably greater depth in one or more tools. These tools will beaddressed in the next chapter and in more detail in Volume IV. If concerns developregarding changes to the system, these issues will be addressed. A new team mayneed to be assigned with the authority to address the management system.
Define the Roles and Team Orientation
To maximize the effect of both behaviors and strategy in a problem solving envi-ronment, the team orientation and the roles of participants must be defined.
Use the team approach: Establish a small group of people with process/productknowledge, allocated time, authority, and skill in the required technical disciplinesto solve the problem and implement corrective actions. The group must have adesignated champion.
Describe the problem: Specify the internal/ external customer problem by identify-ing in quantifiable terms the who, what, when, where, why, how, and how many(5W2H) for the problem.
• Who. Identify individuals associated with the problem. Characterize cus-tomers who are complaining. Which operators are having difficulty?
• What. Describe the problem adequately. Does the severity of the problemvary? Are operational definitions clear (e.g., defects)? Is the measurementsystem repeatable and accurate?
• Where. If a defect occurs on a part, where is the defect located? (Uselocation check sheet.) What is the geographic distribution of customercomplaints?
• When. Identify the time the problem started and its prevalence in earliertime periods. Do all production shifts experience the same frequencies ofthe problem? What time of the year does the problem occur?
• Why. Any known explanation contributing to problem should be stated.
SL3100_frame_C01 Page 22 Friday, August 31, 2001 10:11 AM

Theoretical Aspects of Problem Solving 23
• How. In what mode of operation did the problem occur? What procedureswere used?
• How many. What is the extent of the problem? Is the process in statisticalcontrol (e.g., P chart)?
The above 5W2H questions are to help characterize the problem for further analysis.Some problems arise from customer complaints. An internal customer’s com-
plaint could involve one department complaining that they cannot effectively usethe output of another department. An external customer complaint could involve acustomer complaining to a dealer that the car transmission “shifts funny.” Toofrequently, the wrong problem is solved and the customer complaint is not addressed.It is imperative that the customer complaint be clearly understood. (That is theimportance of operational definition.) The only method to ensure this is to havedirect customer contact. For internal customers, it is advisable to have representativesfrom the complaining organization as part of the problem solving team. In manycases, this approach is the only way a problem can be truly solved. External customercomplaints typically require direct interviews to understand why the customer is notsatisfied. It is not unusual for a customer complaint to be misrepresented by acompany reporting system that classifies problems in prearranged standard catego-ries. Part of the 5W2H problem definition is to state the customer complaint clearly.
Implement and verify interim (containment) actions: Define and implement contain-ment actions to isolate the effect of problem from any internal /external customer untilcorrective action is implemented. Verify the effectiveness of the containment action.
Define and verify root causes: Identify all potential causes which could explainwhy the problem occurred. Isolate and verify the root cause by testing each potentialcause against the problem description and test data. Identify alternative correctiveactions to eliminate root cause.
Verify corrective actions: Through preproduction test programs, quantitatively con-firm that the selected corrective actions will resolve the problem for the customerand will not cause undesirable side effects. Define contingency actions, if necessary,based on risk assessment.
Implement permanent corrective actions: Define and implement the best permanentcorrective actions. Choose ongoing controls to ensure that the root cause is elimi-nated. Once in production, monitor long-term effects and implement contingencyactions, if necessary.
Prevent recurrence: Modify the management systems, operating systems, practices,and procedures to prevent recurrence of this and all similar problems.
Congratulate your team: Recognize the collective efforts of the team.To accomplish all of the tasks just mentioned, a team approach must be followed.
The team approach is illustrated in Figure 1.2. Whereas the team process is important,
SL3100_frame_C01 Page 23 Friday, August 31, 2001 10:11 AM

24 Six Sigma and Beyond: Problem Solving and Basic Mathematics, Volume II
it is just as important to be very conscious of the inhibitors that might creep intothe problem solving process. Lack of effective problem solving exists in nonmanu-facturing, manufacturing, and engineering environments. The following are a fewselected characteristics to ensure that the reader is aware as to what might happenif one is not cognizant of the mechanics of the process.
• Problem described incorrectly: A clear, thorough description of the prob-lem is necessary. A problem must be adequately described and be narrowenough in scope for the team to handle effectively.
• Problem-solving effort expedited: Steps were skipped in the problemsolving process to obtain a quick solution.
• Poor team participation: Not all team members participated effectively,so the team failed to consider all the causes of the problem.
• No logical process: The team lacked a disciplined system to prioritize,analyze, and review problems.
• Lack of technical skills: Team members were not trained in statistics andproblem solving methods.
• Management’s impatience: Management’s lack of knowledge of the prob-lem solving process often results in all levels of management demanding
FIGURE 1.2 Team approach.
SL3100_frame_C01 Page 24 Friday, August 31, 2001 10:11 AM

Theoretical Aspects of Problem Solving 25
to know exactly when a problem will be solved. This pressure causes theteam to make an inadequate analysis.
• Potential cause misidentified as a root cause: Sometimes a potential causeis quickly identified as a root cause, and the problem investigation isconcluded. However, the problem often recurs because the root cause wasnot eliminated.
• Permanent corrective actions not implemented: A root cause may beidentified, but no action was taken to implement the permanent correctiveactions. Permanent actions often require management approval of the costsand implementation of the action.
IMPORTANCE OF THE SAMPLE
To have a solution for a problem, there must be data to evaluate. The beginning ofthis process is to select appropriate and applicable data for the occasion. In VolumesIII and IV, this issue will be addressed in much more detail. However, this sectionwill give a cursory view of what is a “sample” and how to go about asking appropriatequestions of “stratification.”
The size of a sample/subgroup is important/critical to any statistical procedure.Sample size is important because it determines how much information (or how littleinformation) is being drawn from the process or population. The larger the samplesize, the more information is drawn from the process. As more information is drawnfrom the process, fewer errors are made in the estimates of the process parameters.Taken to an extreme, the sample size may be increased so that it approaches thepopulation size of the process or 100%. Although this would provide all of theinformation, it is extremely expensive and impractical. Besides the cost, a 100%inspection (a sampling plan that requires a 100% of the information) does notcontribute to the process improvement effort — 100% of the products must beproduced before the sampling plan is completed. This means that a tremendousinvestment must be made before a decision/interpretation may be made about thevalue of the process performance. Material will be consumed, energy will be used,and human resources will be wasted.
Sometimes it is necessary to reconfigure the sample and data in a way so thatthe information comes “alive” and communicates what is really happening in theprocess. That reconfiguration is called stratification analysis. Through stratificationanalysis the extent of the problem for all relevant factors can be determined. Apossible questioning scenario that might be used in formulating a stratificationstrategy is
• Is the problem the same for all shifts?• Do all machines, spindles, and fixtures have the same problems?• Do customers in various age groups or parts of the country have similar
problems?
The important stratification factors will vary with each problem, but most problemswill have several factors. Check sheets can be used to collect the data. Essentially,
SL3100_frame_C01 Page 25 Friday, August 31, 2001 10:11 AM

26 Six Sigma and Beyond: Problem Solving and Basic Mathematics, Volume II
this analysis seeks to develop a Pareto diagram for the important factors. The hopeis that the extent of the problem will not be the same across all factors. Thendifferences can lead to identifying a root cause.
When 5W2H and stratification analyses are performed, it is important to considera number of indicators. For example, a customer problem identified by warrantyclaims may also be reflected by various in-plant indicators. Also, customer surveysmay be able to define the problem more clearly. In some cases, the analysis of aproblem can be expedited by correlating different problem indicators to identify theproblem clearly.
It has been said that there are no new problems — only different manifestationsof old problems. In problem definition, it is often useful to quantify the problem insimilar situations. The criteria to match similar situations will vary with the type ofproblem. Identifying effective matches and evaluating the presence of the problemprovides useful information to generate potential causes and possible problem solu-tions. If the similarity analysis identifies a comparable situation where the problemdoes not exist, the analysis can focus on the differences in where the problem isoccurring and where it is not occurring.
Once the three types of analysis have been completed, it is sometimes possibleto divide the problem into separate problems. It is easier to address these smallerproblems because fewer root causes are involved. In the ideal case, a single rootcause would be responsible for each problem. If the problem is separated, differentteams may be required to address each problem.
All three elements of the problem definition are not used for every problem.However, collectively, the different analyses provide a comprehensive description.Complete specifications of the problem involve:
• Measurability• Criteria for success• A given condition for existence
REFERENCES
Aiken, L. R., Ability and creativity in mathematics. Review of Educational Research, 1973,43, 405–432.
Anderson, B. F., Cognitive Psychology: The Study of Knowing, Learning and Thinking. NewYork: Academic Press, 1975.
Bain, A., Mental Science, A Compendium of Psychology and the History of Philosophy. NewYork: Appleton, 1870.
Bain, A., The Senses and the Intellect. London: Parker, 1855.Bartlett, F., Thinking: An Experimental and Social Study. London: Allen and Unwin, 1958.Binet, A., L’Etude Experiimentale de l’Intelligence. Paris: Schleicher, 1903.Bloom, B. S. and Broder, L., Problem Solving Processes of College Students. Supplement to
Education Monographs, 73. Chicago: University of Chicago Press, 1950.Byrne, R., Planning meals: problem-solving on a real data-base. Cognition, 1977, 5, 287–332.Chomsky, N., Aspects of the Theory of Syntax. Cambridge, MA: MIT Press, 1965.Chomsky, N., The general properties of language, in C. H. Millikan and F. L. Darley, Eds.,
Brain Mechanisms Underlying Speech and Language. New York: Grune & Stratton, 1967.
SL3100_frame_C01 Page 26 Friday, August 31, 2001 10:11 AM

Theoretical Aspects of Problem Solving 27
Cofer, C. N., Ed., Verbal Behavior and Learning. New York: McGraw-Hill, 1961.Cronback, L. J., The two disciplines of scientific psychology. American Psychologist, 1957,
12, 671–684.Cronback, L. J., Beyond the two disciplines of scientific psychology. American Psychologist,
1975, 30, 116–128.Davis, G. A., Psychology of Problem Solving. New York: Basic Books, 1973.Dewey, J., How We Think. New York: Holt, Rinehart, & Winston, 1910.Dewey, J., How We Think: A Restatement of the Relation of Reflective Thinking to the
Education Process. Boston: Heath, 1933.Dulany, D. E., Jr., Awareness, rules and propositional control: a confrontation with S-R
behavior theory, in T. R. Dixon and D. L. Horton, Eds., Verbal Behavior and GeneralBehavior Theory. Englewood Cliffs, NJ: Prentice-Hall, 1968.
Duncker, K., On problem solving. Psychological Monographs, 1945, 58 (270).Durkin, H. E., Trial-and-error, gradual analysis and sudden reorganization, an experimental
study of problem solving. Archives of Psychology, 1937, 30 (210).Erickson, J. R. and Jones, M. R., Thinking. Annual Review of Psychology, 1978, 29, 61–90.Ernst, G. W. and Newell, A., GPS: A Case Study in Generality and Problem Solving. New
York: Academic Press, 1969.Ghiselin, B., Ed., The Creative Process. Berkeley: University of California Press, 1952.van Helmholtz, H., Vortrage and Reden, 5th ed. Braunschweig: Vieweg, 1894.Hutchinson, E. D., How to Think Creatively. New York: Abington Cokesbury, 1949.Johnson, D. M., Systematic Introduction to the Psychology of Thinking. New York: Harper &
Row, 1972.Kendler, H. H. and Kendler, T. S., Problems in problem solving research, in Current Trends
in Psychological Theory: A Bicentennial Program. Pittsburgh: University of PittsburghPress, 1961.
Kendler, H. H. and Kendler, T. S., Vertical and horizontal processes in problem solving.Psychological Review, 1962, 69, 1–16.
Koffka, K., Principles of Gestalt Psychology. New York: Harcourt, Brace & World, 1935.Kohler, W., Intelligenzprufungen an Menschenaffen. Berlin: Springer, 1917.Kohler, W., The Mentality of Apes (translated by E. Winter). New York: Harcourt, Brace &
World, 1925.Kohler, W., The Mentality of Apes. London: Routledge, 1927.Lazerte, M. E., The Development of Problem Solving Ability in Arithmetic: A Summary of
Investigations. Toronto: Clark Irwin, 1933.Luer, G., The development of strategies of solution in problem solving, in A. Elithorn and
D. Jones, Eds., Artificial and Human Thinking. Amsterdam: Elsevier Scientific, 1973.Maier, N. R. F., Reasoning in humans. II. The solution of a problem and its appearance in
consciousness. Journal of Comparative Psychology, 1931b, 12, 181–194.Mair, N. R. F., Problem Solving and Creativity in Individuals and Groups. Belmont, CA:
Brooks/Cole, Wadsworth, 1970.Mawardi, B. H., Thought sequences in creative problem solving. American Psychologist,
1960, 15, 429.Morgan, C. L., An Introduction to Comparative Psychology. London: Scott, 1894.Neisser, U., Cognitive Psychology. New York: Appleton-Century-Crofts, 1967.Newell, A. and Simon, H. A., Human Problem Solving. Englewood Cliffs, NJ: Prentice-Hall,
1972.Osbom, A. F., Applied Imagination, 3rd ed., New York: Scribner, 1963.Pellegrino, J. W. and Glaser, R., Cognitive correlates and components in the analysis of
individual difference. Intelligence, 1979, 3, 187–214.
SL3100_frame_C01 Page 27 Friday, August 31, 2001 10:11 AM

28 Six Sigma and Beyond: Problem Solving and Basic Mathematics, Volume II
Piaget, J., Six Psychological Studies. London: University of London Press, 1968.Polya, G., How to Solve It. Princeton, NJ: Princeton University Press, 1945.Raaheim, K., Problem Solving and Intelligence. Oslo/Bergen/Tromso: Universitetsforlaget,
1974.Reitman, W. R., Cognition and Thought. New York: John Wiley & Sons, 1965.Rossman, J., The Psychology of the Inventor. Washington: Inventor’s Publishing, 1931.Scandura, J. M., On higher order rules in problem solving. Journal of Educational Psychology,
1973, 10, 159–160.Scandura, J. M., Problem Solving: A Structural/Process Approach with Instructional Impli-
cations. New York: Academic Press, 1977.Simon, H. A., Identifying basic abilities underlying intelligent performance on complex tasks,
in L. B. Resnick, Ed., The Nature of Intelligence. Hillsdale, NJ: Lawrence ErlbaumAssociates, 1976.
Skemp, R. R., The Psychology of Learning Mathematics. Baltimore: Penguin Books, 1971.Skinner, B. F., An operant analysis of problem solving, in B. Kleinmuntz, Ed., Problem
Solving: Research, Method and Theory. New York: John Wiley & Sons, 1966.Staats, A. W., Learning, Language and Cognition. London: Holt, Rinehart & Winston, 1968.Sternberg, R. J., Sketch of a componential subtheory of human intelligence. The Behavioral
and Brain Sciences, 1980a, 3, 573–614.Thorndike, E. L., Animal intelligence: an experimental study of the associative processes in
animals. Psychological Monographs, Review Supplements, 1898, 6 (8).Thorndike, L. L., Reading as reasoning: a study of mistakes in paragraph reading. Journal
of Educational Psychology, 1917, 8, 323–332.Wallas, G., The Art of Thought. London: Jonathan Cape, 1926.Wertheimer, M., Untersuchungen zur Lehre von der Gestalt. Psychologische Forschung, 1923,
4, 301–351.Whitely, S. E., Information-processing on intelligence test items: some response components.
Applied Psychological Measurement, 1977, 1, 465–476.Wickelgren, W. A., How to Solve Problems. Elements of a Theory of Problems and Problem
Solving. San Francisco: W. H. Freeman, 1974.Woodworth, R. S. and Schlosberg, H., Experimental Psychology (Rev. ed.). London: Methuen,
1954.Wundt, W., Grundzuge der Physiologischen Psychologie. Leipzig: Breitkopf and Hartel, 1873.Young, J. W., Technique for Producing Ideas. Chicago: Advanced Publications, 1940.
SELECTED BIBLIOGRAPHY
Allen, M. J. and Yen, M., Introduction to Measurement Theory. Belmont, CA: Wadsworth,1979.
Allport, D. A., The state of cognitive psychology: a critical notice of W. G. Chase, Ed., “Visualinformation processing.” Quarterly Journal of Experimental Psychology, 1975, 27, 141–152.
Altman, J., Aspects of the criterion problem in small groups research. 11. The analysis ofgroup tasks. Acta Psychologica, 1966, 25, 199–221.
Anastasi, A., Individual differences. In D. L. Sills, Ed., Encyclopaedia of the Social Sciences,Vol. 7. New York: The Macmillan Co. & The Free Press, 1968.
Asch, S. E., Effects of group pressure upon modification and distortion of judgments. In E.E. Maccoby, T. M. Newcomb, and E. L. Hartley, Readings in Social Psychology, 3rd ed.New York: Holt, Rinehart & Winston, 1958.
SL3100_frame_C01 Page 28 Friday, August 31, 2001 10:11 AM

Theoretical Aspects of Problem Solving 29
Atkinson, R. C. and Shiffrin, R. M., Human memory: a proposed system and its controlprocesses. In K. W. Spence and J. T. Spence, The Psychology of Learning and Motivation:Advances in Research and Theory, Volume 2. New York: Academic Press, 1968.
Bainbridge, L., Analysis of verbal protocols from a process control task. In E. Edwards andF. P. Lees, Eds., The Human Operator in Process Control. London: Taylor & Francis,1974.
Bainbridge, L., Beishon, J., Hemming, J. H., and Splaine, M. A., A study of real-time humandecision-making using a plant simulator. In E. Edwards and F. P. Lees, Eds., The HumanOperator in Process Control. London: Taylor & Francis, 1974.
Bakan, D., A reconsideration of the problem of introspection. Psychological Bulletin, 1954,51, 105–118.
Bannedi, R. B., Theory of Problem Solving. New York: Elsevier, 1969.Bartlett, F., Thinking: An Experimental and Social Study. London: Allen & Unwin, 1958.Battig, W. F., Some factors affecting performance in a word formation problem. Journal of
Experimental Psychology, 1957, 55, 96–103.Benjafield, J., Evidence that “thinking aloud” constitutes an externalization of inner speech.
Psychonomic Science, 1969, 15, 83–84.Benjafield, J., Evidence for a two-process theory of problem solving. Psychonomic Science,
1971, 23, 397–399.Berlyne, D. E., Structure and Direction in Thinking. New York: John Wiley & Sons, 1965.Berner, E. S., Hamilton, L. A., and Best, W. R., A new approach to evaluating problem solving
in medical students. Journal of Medical Education, 1974, 49, 666–672.Bhaskar, R. and Simon, H. A., Problem solving in semantically rich domains: an example
from engineering thermodynamics. Cognitive Science, 1977, 1, 193–215.Bloom, B. S., Taxonomy of Educational Objectives. New York: Longman Green, 1956.Bourne, L. E., Jr., Ekstrand, B. R., and Dominowski, R. L., The Psychology of Thinking.
Englewood Cliffs, NJ: Prentice-Hall, 1971.Bower, G. and Trabasso, T., Concept identification, in R. C. Atkinson, Ed., Studies in Math-
ematical Psychology. Stanford: Stanford University Press, 1964.Braithwaite, R. B., Scientific Explanation: A Study of the Function of Theory, Probability and
Law in Science. Cambridge: Cambridge University Press, 1953.Bree, D. S., The distribution of problem solving times: an examination of the stages model.
British Journal of Mathematical and Statistical Psychology. 1975a, 28, 177–200.Bree, D. S., Understanding of structured problem solutions. Instructional Science, 1975b, 3,
327–350.Broadbent, D. E., Perception and Communication. New York: Pergamon Press, 1958.Brunswik, E., Perception and Representative Design of Psychological Experimentation. Ber-
keley, CA: University of California Press, 1956.Burack, B., The nature and efficacy of methods of attack on reasoning problems. Psychological
Monographs, 1950, 63 (313).Burke, R. J. and Maier, N. R. F., Attempts to predict success on an insight problem. Psycho-
logical Reports, 1965, 17, 303–310.Byers, J. L. and Davidson, R. E., The role of hypothesizing in the facilitation of concept
attainment. Journal of Verbal Learning and Verbal Behavior, 1967, 6, 595–600.Castellan, N. J., Pisoni, D. B., and Potts, G. R., Cognitive Theory, Volume 2. Hillsdale, NJ:
Lawrence Erlbaum Associates. 1977.Chi, M T. H., Glaser, R., and Rees, E., Expertise in problem solving. In R. J. Sternberg, Ed.,
Advances in the Psychology of Human Intelligence. Hillsdale, NJ: Lawrence ErlbaumAssociates, 1981.
SL3100_frame_C01 Page 29 Friday, August 31, 2001 10:11 AM

30 Six Sigma and Beyond: Problem Solving and Basic Mathematics, Volume II
De Groot, A., Perception and memory versus thought. Some old ideas and recent findings,in B. Kleinmuntz, Ed., Problem Solving: Research and Theory. New York: John Wiley& Sons, 1966.
De Kleer, J., Multiple representation of knowledge in a mechanics problem solver. Proceed-ings of the 5th Joint International Conference on Artificial Intelligence. Cambridge, MA:MIT Press, 1977.
Dewey, J., Logic: The Theory of Inquiry. New York: Holt, 1938.Dienes, Z. P. and Jeeves, M. A., Thinking in Structures. London: Hutchinson, 1965.Dodwell, P. C., Visual Pattern Recognition. New York: Holt, Rinehart & Winston, 1970.Dominowski, R. L., How do people discover concepts? In R. L. Solso, Ed., Theories of
Cognitive Psychology: The Loyola Symposium. Hillsdale, NJ: Lawrence ErlbaumAssociates, 1974.
Dreistadt, R., The use of analogies and incubation in obtaining insights in creative problemsolving. Journal of Psychology, 1969, 71, 159–175.
Duncan, C. P., Recent research on human problem solving. Psychological Bulletin, 1959, 56,397–429.
Elstein, A. S., Shulman, L. S., and Sprafka, S. A., Medical Problem Solving: An Analysis ofClinical Reasoning. Cambridge, MA: Harvard University Press, 1978.
Fleishman, E. A., Toward a taxonomy of human performance. American Psychologist, 1975,30, 1127–1149.
Fleishman, E. A., Systems for describing human tasks. American Psychologist, 1982, 37,821–834.
Fleishman, E. A. and Bartlett, C. J., Human abilities. Annual Review of Psychology, 1969,20, 349–380.
Forehand, G. A., Constructs and strategies for problem solving research. In B. Kleinmuntz,Problem Solving: Research, Methods and Theory. New York: John Wiley & Sons, 1966.
Fowler, W. and Fowler, F. G., The Concise Oxford Dictionary of Current English, 6th edition.Edited by J. B. Sykes. Oxford: Clarendon Press, 1978.
Gagne, R. M., Human problem solving: internal and external events. In B. Kleinmuntz, Ed.,Problem Solving: Research, Method, and Theory. New York: John Wiley & Sons, 1966.
Green, B. F., Current trends in problem solving. In B. Kleinmuntz, Ed., Problem Solving:Research, Method and Theory. New York: John Wiley & Sons, 1966.
Greeno, J. G., The structure of memory and the process of solving problems. In R. Solso,Ed., Contemporary Issues in Cognitive Psychology: The Loyola Symposium. Washington:Winston, 1973.
Greeno, J. G., Indefinite goals in well-structured problems. Psychological Review, 1976, 83,479–491.
Greeno, J. G., Process of understanding in problem solving. In N. J. Castellan, D. B. Pisom,and G. R. Potts, Eds., Cognitive Theory, Volume 2. Hillsdale, NJ: Lawrence ErlbaurnAssociates, 1977.
Greeno, J. G., A study of problem solving. In R. Glaser, Ed., Advances in InstructionalPsychology, Volume 1. Hillsdale, NJ: Lawrence Erlbaum Associates, 1978a.
Hafher, J., Influence of verbalization on problem solving. Psychological Reports, 1957, 3, 360.Hutchinson, E. D., How to Think Creatively. New York: Abingdon Cokesbury, 1949.Johnson, E. S., An information-processing model of one kind of problem solving. Psycho-
logical Monographs: General & Applied, 1964, 78 (581).Kaiser, H. F., Image analysis. In C. W. Harris, Ed., Problems in Measuring Change, Madison:
University of Wisconsin Press, 1963.Kleinmuntz, B., Ed., Problem Solving: Research, Method and Theory. New York: John Wiley
& Sons, 1966.
SL3100_frame_C01 Page 30 Friday, August 31, 2001 10:11 AM

Theoretical Aspects of Problem Solving 31
Kleinmuntz, B., Ed., Formal Representation of Human Judgment. New York: John Wiley &Sons, 1968.
Larkin, J. H. and Reif, F., Understanding and teaching problem solving in physics. EuropeanJournal of Science Education, 1979, 1, 191–203.
Lorge, I. and Solomon, H., Two models of group behavior in the solution of Eureka-typeproblems. Psychometrika, 1955, 20, 139–148.
Luchins, A. S., Mechanization in problem solving: the effect of Einstellung. PsychologicalMonographs, 1942, 54 (248).
Maier, N. R. F., Reasoning in humans. I. On direction. Journal of Comparative Psychology,1930, 10, 115–143.
Maier, N. R. F., The behavior mechanisms concerned with problem solving. PsychologicalReview, 1940, 47, 43–58.
Mandler, J. M. and Mandler, G., Thinking: From Association to Gestalt. New York: JohnWiley & Sons, 1964.
Marks, M. R., Problem solving as a function of the situation. Journal of ExperimentalPsychology, 1951, 47, 74–80.
Maslow, A. H., Motivation and Personality. New York: Harper & Row, 1954.Maxwell, A. E., Analyzing Qualitative Data. London: Chapman & Hall, 1975.Mayer, R. E., Comprehension as affected by structure of problem representation. Memory
and Cognition, 1976, 4, 249–255.Mayer, R. E. and Greeno, J. G., Effects of meaningfulness and organization on problem
solving and compatibility judgments. Memory and Cognition, 1975, 3, 356–362.Miller, G. A., The magical number seven, plus or minus two. Psychological Review, 1956,
63, 81–97.Piaget, J., Six Psychological Studies. London: University of London Press, 1968.Polya, G., How to Solve It, 2nd ed. New York: Doubleday, 1957.Reed, S. K., Facilitation of problem solving. In N. J. Castellan, D. B. Pisom, and G. R. Potts,
Eds., Cognitive Theory, Volume 2. Hillsdale, NJ: Lawrence Erlbaum Associates, 1977.Roth, B., The Effects of Overt Verbalization on Problem Solving. Unpublished Doctoral
Dissertation. New York University, 1966.Saugstad, P. and Raaheim, K., Problem solving, past experience and availability of functions.
British Journal of Psychology, 1960, 51, 97–104.Simon, H. A., The functional equivalence of problem solving skills. Cognitive Psychology,
1975, 7, 268–288.Staats, A. W. and Staats, C. K., Complex Human Behavior. New York: Holt, Rinehart &
Winston, 1963.Vernon, M. D., The Psychology of Perception, 2nd Edition. Harmondsworth, Middlesex:
Penguin, 1971.
SL3100_frame_C01 Page 31 Friday, August 31, 2001 10:11 AM

SL3100_frame_C01 Page 32 Friday, August 31, 2001 10:11 AM

33
Overview of Key Elements toProblem Solving
In this chapter, the essential elements of problem solving will be addressed fromstrictly a quality perspective. The definition of a problem will be introduced. Thenprogressively some of the issues involved with problem solving in quality will beaddressed.
THE ROAD TO CONTINUAL IMPROVEMENT
Everyone likes to improve in some way, shape, or form. To improve, among otherdefinitions, means to:
• Eliminate the waste of waiting• Eliminate wasted effort (motion)• Minimize inventory• Eliminate overproduction• Eliminate correction (repair)• Minimize material movement• Eliminate wasted processing• Minimize uniqueness• Eliminate overburden• Utilize the best-known method• Support the Just In Time (pull) system• Simplify the process• Optimize the system• Improve flexibility• Provide consistent direction• Focus on the process• Reduce variation• Reduce lead time• Improve uptime
2
SL3100_frame_C02 Page 33 Friday, August 31, 2001 10:12 AM

34
Six Sigma and Beyond: Problem Solving and Basic Mathematics, Volume II
• Maximize throughput• Improve understanding• Support the operator• Support management by sight• Reduce cost• Improve quality• Eliminate bottlenecks or constraints• Support small-lot production• Improve responsiveness• Reduce set-up time• Involve all impacted parties
The way we improve, however, is a function of many tasks and approaches. It isunfortunate that there is no silver bullet that will guarantee improvement on itsown. We have to be cognizant of that and be able to glean from several approachesand methodologies the best we can under specific circumstances for the specificproblem at hand. In six sigma methodology, just like in any other methodology,problem solving is an important activity for attaining continual process improve-ment. There are two approaches to this improvement. Both are evolutionary ratherthan revolutionary:
Kaizen:
Kaizen is a gradual,
relentless, incremental process improvement overtime.
Breakthrough:
Breakthrough is a sudden, significant improvement in processperformance achieved in a very short time interval.
Continual process improvement is best achieved by a combination of Kaizen andbreakthrough and, ideally, an organization should employ and encourage both.
To improve, something must be changed. However, often we want to changethings that present themselves as problems — or at least we see them as problems.What is a problem? In the Introduction, several definitions of a “problem” were given.However, in this chapter focus on the definition will be in the following manner:
• A problem is a
symptom
, not a cause or a solution.• A problem is a
gap
between what is happening and what we want tohappen.
• A problem is something that does not allow a goal to be achieved.• A problem could be
a mistake, a defect, an error, a missed deadline, alost opportunity,
or
an inefficient operation.
• A problem may be thought of as an
opportunity
.
CHRONIC VS. SPORADIC PROBLEMS
There are two kinds of problems, each presenting different opportunities:
SL3100_frame_C02 Page 34 Friday, August 31, 2001 10:12 AM

Overview of Key Elements to Problem Solving
35
• A
sporadic problem
is a sudden, elevated departure from a historic, sta-tus-quo level.
• A
chronic problem
is the difference between the historic level and theoptimum or zero level; a chronic problem is a chronic “disease” whichcan economically be eliminated.
Which problem is easier to solve —
sporadic
or
chronic
? Chronic problems aremuch easier to solve because of their repetitive nature. Sporadic problems, on theother hand, are very difficult to solve because they are not consistent and do notfollow a pattern. In both cases, one has to understand the process and the conditionsthat existed when the problem was identified. For both sporadic and chronic prob-lems, data must be generated to support the claim of their existence, and appropriateplanning to resolve these problems must be taken.
Most problem solving effort usually deals with chronic problems. Chronic prob-lems repeat, cause variation, and cause the process to be inconsistent. This volumewill focus on presenting the reader with a process to solve chronic problems.
THREE TYPICAL RESPONSES TO PROBLEMSAND THE ANTECEDENT
Problems are generally uncomfortable situations, demanding some form of changefrom the status quo. Because of that demand, we often try to circumvent problems by:
1.
Viewing
them as burdens and learning to live with them2.
Ignoring
them in the hope that they will disappear3.
Accepting
them as challenges or opportunities to improve
In the six sigma methodology, and in the spirit of continual improvement,obviously the first and second options are not options at all. The focus should alwaysbe in a positive direction, approaching the problem as an “opportunity.” To do this,the environment must be structured in a way that is conducive to problem solvinganalysis. A typical approach is to follow something like the following process.
Form a team with• Cross-functional members• Multidisciplinary members• Members who have ownership of the problem
Define the problem with• A process flow diagram to define the process• A Pareto analysis to select priority problems• Control charts to indicate special causes• Check sheets to define 5W2H• An action plan to coordinate problem definition actions
SL3100_frame_C02 Page 35 Friday, August 31, 2001 10:12 AM

36
Six Sigma and Beyond: Problem Solving and Basic Mathematics, Volume II
Implement interim (containment) actions with• Check sheets to evaluate effectiveness of actions• Control charts and histograms with intensive sampling for process
monitoring• An action plan to coordinate interim fixes
Define and verify root causes
Identify potential causes with
• Brainstorming to develop the potential causes• Cause-and-effect diagrams to identify and organize potential causes• FMEA to identify potential causes from observed failure mode
Analyze potential causes with
• A check sheet to collect data• Comparison plots, histograms, and stratified graphs to evaluate strat-
ification factors or different process or product parameters• Scatter plots to evaluate relationships between characteristics• Gage studies to evaluate the measurement system• An action plan to manage analysis steps
Validate root causes with
• Comparison plots, histograms, and stratified graphs to validate cause(e.g., with/without comparison)
• Stratified graphs to validate presence of root cause factors• An action plan to manage validation actions
Identify alternate solutions with
• Brainstorming to solicit ideas• An alternative solution cause-and-effect diagram to address poten-
tial solutions
Verify the effectiveness of the solution with• Control charts and histograms to evaluate process stability and
capability• Check sheets to collect product or process evaluation information• FMEA
Implement ongoing controls with• Control charts and check sheets to monitor process performance• Comparison plots to periodically ensure that stratification factors
are not influencing process output• Dimensional control plan
Prevent recurrence with• A process flow diagram to define the management system that did
not prevent the problem
SL3100_frame_C02 Page 36 Friday, August 31, 2001 10:12 AM

Overview of Key Elements to Problem Solving
37
• An action plan to coordinate needed changes• FMEA
NINE COMMON ROADBLOCKS TO EFFECTIVE PROBLEM SOLVING
We all strive to remain in an equilibrium. Whether in our personal lives, workenvironment, or some other situation, equilibrium is built into our human genetics.Why, then, do we fail to solve problems effectively so that we do not experiencethem again and again? Many theories for the answer exist; however, the followingare perhaps the most important in the work environment:
1.
Lack of time.
We seem to be optimistic about the time that is needed toresolve the problem or we are assigned too many projects at the sametime. As a consequence, we fail.
2.
Lack of ownership.
For some strange reason, time and again, the wrongpeople are assigned to the problem. As a consequence, they are trying tolearn the process rather than fixing the problem. By the time they areready to contribute to the solution, they are moved to a new position andthe cycle begins all over again.
3.
Lack of recognition.
Appropriate individuals who do perform are notrecognized. They are quite often the silent heroes who are overshadowedby individuals who have been identified as “super stars” or ones in the“fast track.” By not recognizing the appropriate individuals, the wrongmessage is sent to the rest of the employees that “good work” does notreally count — only connections and pedigree count.
4.
Error as a way of life.
This is a “cop out” option that has tremendousramifications in the work environment. This method of thinking perpetu-ates the status quo and is one of the biggest inhibitors to progress. If errorsare accepted as a way of life, our competitors will surpass us and ourcustomers will abandon us.
5.
Ignorance of the importance of a problem.
If the problem is not recognizedin time, the organization has a hidden problem. The problem is greater ifit is directly correlated with customer expectations and the organizationdoes not recognize it. In the six sigma methodology, great effort is givento recognizing that Y (customer’s wants, needs, and expectations) is indeedcorrelated with f(x) (the items that “should” appease the customer). Theimportance of the problem is of paramount significance and no one canafford to look the other way or ignore it.
6.
Belief that no one can do anything about some problems.
It is true thatsome problems do not have an easy answer. In fact, some problems maynot have a solution in the short run. However, that does not mean we areoff the hook and are not responsible. If indeed there is no solution insight, perhaps the problem is too big or has been assigned to the wrong
SL3100_frame_C02 Page 37 Friday, August 31, 2001 10:12 AM

38
Six Sigma and Beyond: Problem Solving and Basic Mathematics, Volume II
team. In any case, try to find a way to circumvent these obstacles. Afterall, if we do not, some one else will!
7.
Poor balance by upper management concerning cost, schedule, and qual-ity.
In the early 1980s, Deming identified with laser accuracy the problemwith management, i.e., “quarterly earnings.” As long as the emphasis ison quarterly earnings, there will be no true improvement. Cost, schedule,and quality will always be shuffled. It is sad when management cannotsee the trap that has been created. Sure, in the short run we will lookgreat, but in the long run, we will bleed to death. An example will provethe point. A Fortune 100 company for the year 2000 had over $5 billionin warranty costs, yet their target production quotes were met. This samecompany claims to have the customer as the driving force in decidingquality. Need we say more?
8.
People who try to protect themselves.
It is human nature to protect ourturf, but not at the expense of the organization. When it comes to problemsolving, quite often most people mean well, but are afraid to tell the truth.Again, it was Deming who blew the whistle on this situation in his 14“obligations of management” (specifically number eight: eliminate fear).Yet in this new millennium we continue to intimidate, harass, and blameindividuals for system failures. As long as fear exists, employees willcontinue to cover themselves. By doing this, the real problems, the realconcerns, and the real issues that should be reviewed and fixed are notuncovered. The following responses may indicate that someone is tryingto cover himself:
• We have never done it that way.• We are not ready for it yet.• We are doing all right without it.• We tried it once and it did not work.• It costs too much.• It is not our responsibility.• It will not work anyway.
9.
Head-hunting by management.
It is interesting to see how managementreacts to problem solving. Management believes that problem solving isindeed the “cure all” of all the difficulties in the organization. So, whena problem arises, management “picks” an individual with the most expe-rience in solving problems and assigns him/her the new task. Managementfails to recognize time and time again that the best return on money is toplan before a problem occurs. However, a good planner is the one whoalready knows the process. What a contradiction. By the time one learnsthe process, he/she is ready to move on to a new problem. Needless tosay, problem solvers are highly regarded in our culture, whereas plannersare considered a fifth wheel — a necessary overhead.
SL3100_frame_C02 Page 38 Friday, August 31, 2001 10:12 AM

Overview of Key Elements to Problem Solving
39
SIX KEY INGREDIENTS REQUIREDTO CORRECT PROBLEMS
How then can the inhibitors just given be avoided? To resolve problems, there mustbe commitment to these six ingredients:
1.
Awareness
of the importance of eliminating errors (waste) and the costof errors to the business
2.
Desire
to eliminate errors3.
Training
in proven, effective methods to solve and prevent problems4.
Failure analysis
to identify and correct the real root causes of problems5.
Follow-up
in tracking problems and action commitments6.
Recognition
to give liberal credit to all who participate
In addition, unless management plays an important role in the implementationprocess, nothing will happen. So, what must management do or provide? Minimumrequirements are
• A
motivating environment
conducive to effective, companywide problemsolving
• A real
opportunity
• A
systematic approach
(road map)•
Knowledge
of problem solving tools
SL3100_frame_C02 Page 39 Friday, August 31, 2001 10:12 AM

SL3100_frame_C02 Page 40 Friday, August 31, 2001 10:12 AM

41
Problem-Solving and Process Improvement Cycles
This chapter opens with a summary of some key concepts in team dynamics as theyrelate to problem solving. The problem-solving cycle will be discussed because mostof us recycle problems without really resolving them. The process improvementcycle and some of the issues involved will be emphasized, and a flow chart to showthe continual improvement cycle will be introduced.
As already mentioned in the literature review and the previous chapter, problemsolving is a process that is repeated primarily because a problem was not fixedproperly and/or completely the first time. To do that, a system must be in place thatis accurate, repeatable, and user friendly. That system turns out to be a structuredapproach. Why should a structured problem solving approach be used? A structured,systematic, problem solving approach:
• Illustrates the relative
importance
of problems• Shows the real
root causes
of problems• Helps problem solvers get “
UNSTUCK
,” know
where
they are, keep on
TRACK
and
persevere
to results• Helps
keep
problems solved• Establishes
accountability
and a
motivating
environment for problemsolving
• Produces consistently
better
solutions than unstructured approaches
However, for this structured approach to work, a team familiar with both theproblem solving process as well as the process improvement method must be inplace.
WHY A TEAM APPROACH?
• A goal of employee involvement (EI) is to give employees increasedinfluence over and responsibility for their own work. In recent years, a
3
SL3100_frame_C03 Page 41 Friday, August 31, 2001 10:12 AM

42
Six Sigma and Beyond: Problem Solving and Basic Mathematics, Volume II
major route to achieving this goal was creation of problem solving teams:groups of employees who meet on a regular basis to identify and solvework-related problems.
• Managers now realize that there is a vast, untapped potential in theiremployees’ minds. To remain competitive, it is essential to make effectiveuse of all the talents that the labor force has to
offer, both
physical andmental.
• Successful companies worldwide credit much of their success to thewidespread use of employee teams to generate improvements at all levelsin all departments.
• Employees need to be provided with challenging activities to keep theiractive minds fully utilized.
• Most employees want to participate in decision making and problemsolving activities that affect them.
• No one individual has all of the process and product knowledge plus thespecial skills and experience required for
optimal problem solving.• The most effective, proven problem solving and process improvement
methods and tools best lend themselves to a team approach.• A team will invariably generate more problems, more causes, and more
solutions than an individual can.• Everyone affected by a problem should be a part of the solution. This
assures a “buy-in” to the corrective action or solution put into place.• Teams have a distinct advantage over solo efforts: the mutual support that
arises among team members contributes to
TEAM
as an acronym (
TEAM
=
T
ogether
E
veryone
A
ccomplishes
M
ore through
synergy
and
consen-sus
). Quality improvement is hard work and takes a long time. It is easyfor one person’s commitment and enthusiasm to weaken during a longproject. The synergy that comes from people working together toward acommon objective is usually enough to sustain enthusiasm and support.Ray Kroc (founder of McDonald restaurants) said, “All of us are betterthan any one of us.”
LOCAL TEAMS AND CROSS-FUNCTIONAL TEAMS
• Local or department improvement teams (DITs) are comprised of allmembers of a department. These employees typically work in close prox-imity, experience common problems, and form a “natural work group.”Their purpose is to provide a focus and a means for all employees tocontribute to an ongoing activity aimed at improving the quality andproductivity levels of the department.
• Cross-functional or process improvement teams (PITs) are created tocontinuously improve quality, reduce waste,
and improve productivity ofa process that crosses many departmental lines. The PIT is made up ofexperienced, skilled problem solvers from all departments involved in andaffected by the process.
SL3100_frame_C03 Page 42 Friday, August 31, 2001 10:12 AM

Problem-Solving and Process Improvement Cycles
43
GENERAL GUIDELINES FOR EFFECTIVE TEAM PROBLEM SOLVING AND PROCESS IMPROVEMENT
Requirements for a team to function successfully are
• A team charter which specifies the team’s purpose and
enumerates theteam’s duties and responsibilities
• Selection of the proper team makeup• Selection of an effective team leader and team coordinator• Knowledge of the organization’s mission, goals, and objectives• Learning to work together as a team (“team building”)• Adequate training in problem solving and process improvement methods
and tools• Guidelines and ground rules for holding effective meetings and making
decisions• A suitable meeting place with support services, such as typing, copying,
information resources, etc.• Use of meeting agendas and minutes (recaps)• Liberal credit and recognition for team successes
WHAT MAKES A TEAM WORK
For a team to work, the following attributes must be present:
• A climate of trust• A commitment to common goals• Honest and open communication• Common agreement on high expectations for the team• Assumed responsibility for the work that must be done• A general feeling that one can influence what happens• Common access to information• A win/win approach to conflict management• Support for decisions that are made• A focus on process as well as results
EXAMPLES OF PROBLEM-SOLVING MODELS
In the introduction, a somewhat extensive literature review on the topic ofproblem solving was given. This section will focus on specific applications ofproblem solving processes that major companies have undertaken with measurablesuccess. Successful, continuously improving companies around the world use struc-tured problem solving systems, specifically:
• XEROX (6 steps)• GM (4 steps)
SL3100_frame_C03 Page 43 Friday, August 31, 2001 10:12 AM

44
Six Sigma and Beyond: Problem Solving and Basic Mathematics, Volume II
• DaimlerChrysler (7 steps)• Department of Defense (DoD) (6 steps)• Ford (8 steps)
Regardless of what system is used, the foundation of a system lies in the basicscientific method or a variation of it. For our purposes, a very basic and effectiveway, approaching the problem solving process through a five-step problem solving(opportunity) cycle (PSC), will be used. The five distinct steps are
• Select the problem.• Find the root cause.• Correct the problem.• Verify the correction.• Prevent recurrence … then recycle.
This process is easy to understand and remember. Now look at the implemen-tation process.
• Each step should be fully completed before beginning the next step. Astep should not be considered to be complete until the final sub-step iscarried out. (Detail provided in Steps 1 through 5.)
• There may be several iteration or feedback loops that must be properlyfollowed to complete the cycle.
Step 1
.
Select the problem (or opportunity) that represents a waste or bottleneck inthe area.
• Prepare a problem list.• Collect data to determine the magnitude of each problem.• Prioritize problems to determine which ones should be addressed first.
Almost always a “vital few” problems account for the greatest proportionof losses.
• Select the target problem. This is generally the problem whose solutionwill have the greatest beneficial impact.
•
Prepare a specific problem statement
(e.g., reduce shipping errors from3.1% to under 0.5% by the end of the third quarter). The problem statementrepresents the specific problem assignment or project commitment.
Step 2
.
Find the root cause of the problem. This analysis step is usually
the
crucialwork of the project. Problems
must
be solved at the root cause level if they are toremain completely and permanently corrected.
• Identify all possible causes of the problem.• If necessary, collect data to ascertain the failure mechanism.
• Select the most likely cause.
SL3100_frame_C03 Page 44 Friday, August 31, 2001 10:12 AM

Problem-Solving and Process Improvement Cycles
45
Step 3
.
Correct the problem, following a plan that will eliminate the problem or atleast reduce it to a level compatible with the team’s goal.
• Determine a temporary fix, if appropriate, to protect customers until apermanent fix can be implemented.
• Develop alternative solutions.• Select the best possible solution by narrowing down the alternatives using
a priority-setting approach and making a final consensus decision.• Develop an implementation or action plan which includes a time schedule
for implementation. Everyone who is involved in carrying out the solutionshould be consulted and should approve the plan. The plan should answerthe basic questions:
what? who? where? when? and how?
• Establish the method for measuring the success of the proposed solution.Remember, the criterion for success was established as part of the
problemstatement
in Step 1.• Gain management approval, if necessary, for implementation.
• Implement the action plan.
Step 4
.
Verify correction, using the criterion for success established in Step 1 andthe measuring method established in Step 3.
• Measure the impact of the solution.• Make a decision: Has the problem been solved to a level compatible with
the team’s goal? Have any unforeseen new problems been created by thesolution?
• If the correction is unsatisfactory, the team must go back to an earlierstep, selecting an alternative solution or possibly even selecting an alter-native root cause and then proceeding.
• If the correction is satisfactory, any temporary protective fix should beremoved.
Step 5
.
Prevent recurrence of the problem. This is an often overlooked aspect ofproblem solving. The benefits of preventing recurrence cannot be overstated.
• Develop innovative methods for mistake-proofing the system (i.e., Japa-nese “Poka-Yoke”).
• Alter systems and procedures to reflect the new, optimal practices.• Train all involved personnel in the new methods.• Publicize the results. Apply the knowledge gained to the rest of the product
line and to other company activities with similar conditions.• Continue to monitor the problem.• Recognize the team’s success.
• Prepare a final project report that describes the problem, the methodsused to correct it, and the quality-productivity gains achieved. Also, afinal team report should be made to management.
SL3100_frame_C03 Page 45 Friday, August 31, 2001 10:12 AM

46
Six Sigma and Beyond: Problem Solving and Basic Mathematics, Volume II
•
Recycle
.
Once the five steps have been completed, the team should returnto Step 1, select another significant problem for correction, and continueimprovement efforts.
A pictorial view of the super generic five-step model is illustrated in Figure 3.1.
THE PROCESS IMPROVEMENT CYCLE
When an organization undertakes six sigma methodology as an organizational ini-tiative, one reason is to improve and/or change the status quo, showing significantgains for the organization and the customer. To do that, focus must not only be onspecific tools, but also on the philosophy and main elements that will result in “real”
1. SELECT THE PROBLEM
⇒
Prepare problem list
⇒
Collect data
⇒
Prioritize problems
⇒
Select target problem
⇒
Prepare problem statement 2. ROOT-CAUSE ANALYSIS
⇒
Identify possible root causes
⇒
Collect data
⇒
Select most likely cause 3. CORRECT THE PROBLEM
⇒
Make temporary fix
⇒
Develop alternative solutions
⇒
Select best solution
⇒
Develop implementation plan RECYCLE
⇒
Establish measuring method
⇒
Gain management approval
⇒
Implement solution 4. VERIFY CORRECTION
⇒
Measure impact of solution
⇒
Decision: solution effective?
⇒
If necessary, loop back
⇒
Remove temporary fix 5. PREVENT RECURRENCE
⇒
Mistake proof system
⇒
Alter systems and procedures
⇒
Train involved personnel
⇒
Publicize results
⇒
Continue to monitor problem
⇒
Recognize team’s success
⇒
Prepare final project report
FIGURE 3.1
A pictorial view of the super generic five-step model.
SL3100_frame_C03 Page 46 Friday, August 31, 2001 10:12 AM

Problem-Solving and Process Improvement Cycles
47
improvement. Some basic tools and their application have been described. Now itis time to review the elements that will help in this initiative to improve the orga-nization’s effectiveness and customer satisfaction. The elements are really self-explanatory and do not need further analysis. However, they are critical for thesuccess of the six sigma initiative. The basic elements are
• Process behavior or voice of the process or process control (vs. parts control)• Quality at the source• Factual and analytical decision making• Decision making at the lowest appropriate level (presupposes empowerment)• Focused, organizational teamwork• Clear performance standards• Suppliers developed as extensions of the production system• Focus on prevention rather than detection• Maximum value for all customers (through minimizing variability, mini-
mizing waste, and controlling target)
Once these elements have been internalized, improvement may be pursued.However, this improvement must be structured and systematically approached. Why?Because in addition to what has already been said, this structured, systematic, processimprovement approach:
• Provides a more tightly focused process than the problem solving cycle(PSC), concentrating on improving the quality of a single process output(product or service)
• Lends itself particularly well to customer issues, since it builds andstrengthens ties between customer and supplier
• Provides a catalyst for never-ending improvement through continuousrefocusing on customer needs and expectations
• Affords a prime opportunity to utilize statistical process control (SPC)methods for process analysis, control, and improvement
• Focuses improvement efforts on product quality and waste reduction• Provides an enhanced motivational environment to improvement teams
for their improvement efforts
To optimize this process in conjunction with the problem solving cycle, a 14-stepprocess improvement cycle (PIC, Figure 3.2), is recommended:
Step 1
.
Identify the output.
• Prepare a statement which answers the question “What is to be done?”and consists of two parts: a tangible, specific noun followed by a verbdescribing what to do to produce the output.
• The statement should be neither too broad nor too specific, if it is to beuseful (e.g., Shaft Machined, Doughnut Fried, Muffler Installed, Bicycle
SL3100_frame_C03 Page 47 Friday, August 31, 2001 10:12 AM

48
Six Sigma and Beyond: Problem Solving and Basic Mathematics, Volume II
Assembled, Forecast Developed, Order Taken, Machine Repaired, OrderShipped, Report Typed, etc.).
Step 2.
Identify the customer.
• The (primary) customer is the next person in the work process — theperson who will receive your output as input and act on it.
• The customer may be either external or internal.• Secondary customers and end-users may be identified if their requirements
are of significance.
FIGURE 3.2
The 14-step process improvement cycle model.
SL3100_frame_C03 Page 48 Friday, August 31, 2001 10:12 AM

Problem-Solving and Process Improvement Cycles
49
Step 3.
Identify the customer requirements.
• What does the customer want, need, or expect from the output?• Customer requirements may be general or very specific.• Customer requirements often fall into categories such as: cost, accuracy,
timeliness, quantity, completeness, dimension, performance, appear-ance, etc.
• Supplier/customer interaction is essential. Customer and supplier specify,negotiate, and evaluate information before reaching an agreement, e.g.,Report needed ASAP; Expense cannot exceed the budget; Heat shieldmust withstand operating temperatures; Colors must match; Quickresponse time; etc.
Step 4.
Translate requirements into product specifications.
• Put the customer’s needs into language that reflects the supplier’s activeparticipation.
• Specifications should be measurable, realistic, and achievable and shouldbe reviewed with the customer to be certain both parties understand andagree about what the output should be, e.g., needed by 4:00 p.m. Friday;O.D. 1.625 ± .005 in.; Weight 5200 lb maximum; Type double-spaced, etc.
Step 5
.
Identify the work process.
• What are the process elements? A fishbone diagram used as a processanalysis map (PAM) may help identify the equipment, people, input,methods, and environmental factors in the work process.
• List step-by-step what must be done to achieve the output. Flow chartsare especially helpful.
• Identify or develop the needed documentation to describe or provideinstructions for the work process.
Step 6
.
Select the process measurements.
• Select the critical measurements for
process output
. These measurementsshould be derived from customer requirements and product specifications.They should permit an objective evaluation of the quality of output. Thesemeasurements should provide for early identification of potential as wellas actual problems, with stress on prevention rather than on detection oferrors or defects, e.g., cylinder O.D. in inches; cake weight in grams;transit time in days; response time in seconds; number cycles beforefailure; circuit resistance in ohms; etc.
• Also select measurements for key
process inputs,
e.g., raw materials,incoming parts, energy, supplies, information, etc.,
in-process factors
(
intermediate process outputs
), e.g., in-process conditions that impact onthe process output, such as temperature, pressure, time, etc.;
process
SL3100_frame_C03 Page 49 Friday, August 31, 2001 10:12 AM

50
Six Sigma and Beyond: Problem Solving and Basic Mathematics, Volume II
performance criteria,
such as scrap, rework, downtime, yield, delays,efficiency, etc. These measurements become the basis for process analysis,control, and improvement.
Step 7.
Determine the process capability.
• Can the existing process produce output which consistently meets thecontractural product specifications with minimal waste?
• The process is operated according to standard practices and output mea-surement data are collected and analyzed to provide a statistical evaluationof process control.
• Is there consistency and process capability (ability to meet specifications)?• This step is an important activity of statistical process control (SPC).
Step 8.
Decide: Is the process capable?
• If the evaluation indicates that specifications are
not
being met consistentlyand there is excessive waste (scrap, rework, delays, errors, etc.), the workprocess must be revamped or improved and problem solving is required.Proceed to Step 9.
• If the process capability assessment of Step 7 determines that the existingprocess
can
produce output which consistently meets specificationrequirements and does so with minimal waste, proceed to Step 10.
Step 9
.
Problem solve to improve the work process.
• Use the 5-step problem solving cycle (PSC) to revamp or improve theexisting process.
• If the process capability problem indicated in Step 7 is a lack of processcontrol (instability or inconsistency), indicated by sporadic deviations ofthe process average from the target, status quo, or historic level, thesolution is one of identifying the destabilizing (special/assignable) causesand eliminating them. After “special-cause” problem solving is completed,loop back to Steps 7 and 8 (reassess process control). If the problem issolved, proceed to Step 10; if not, continue to repeat the PSC at Step 9,as needed, until process control is achieved.
• If the process capability problem indicated in Step 7 is an
inherent
inabilityto meet specification requirements, the process system must be funda-mentally changed. This requires identifying those key process factors(common or random causes) which have a major impact on the qualityof process output and modifying them and their effects. After “com-mon-cause” problem solving is completed, loop back to Step 5 to redefinethe revised work process and proceed. If at Steps 7 and 8 the processcapability problem is solved, proceed to Step 10; if not, continue to repeatthe PSC at Step 9, as needed, until process capability is achieved.
SL3100_frame_C03 Page 50 Friday, August 31, 2001 10:12 AM

Problem-Solving and Process Improvement Cycles
51
• If repeated attempts still result in an incapable process, contact the cus-tomer who needs to know what to expect. A renegotiation of requirementsmay be possible. If not, the customer may want to find another supplier.
Step 10.
Produce the output, continuing to follow standard practices (or the newlyestablished practices which should be standardized for the new, revamped process).
Step 11.
Evaluate the results.
• Evaluation of results must be based on product specifications that thecustomer and supplier agreed to as part of Step 4. Those specificationsare a “template” against which results are compared.
• There is a major difference between this step and Step 7 (Determineprocess capability). This step evaluates how well you actually
did
(nothow well you are
capable
of doing). The emphasis is on
results
ratherthan on
process
.• There are two potential types of problems at this point: (1) the product
output
does not meet
specification requirements and (2) the productoutput
meets
specification requirements, but the
customer is dissatisfied
with the product.
Step 12.
Decide: Is there a problem?
• If evaluation of Step 11 indicates there is a problem, either type 1 or 2,problem solving must be carried out. Proceed to Step 13.
• If no problem exists, continue production and proceed to Step 14.
Step 13.
Problem solve to improve results.
• Use the 5-step problem solving cycle (PSC) to “troubleshoot” the problem.• If the problem with process output is type 1, i.e., the process output
doesnot
meet specification requirements, the cause of the problem is one ofnonconformance to standard practices (since the process was shown to becapable in Step 7). The solution to this type of problem lies in identifyingthe nonconforming practice(s) and restoring operations according toestablished standard practices at Step 10.
• If the problem with process output is type 2, i.e., the product output
meets
specification requirements, but the
customer is dissatisfied
with the product,the cause of the problem is usually one of (1) improper understanding ofcustomer requirements; (2) improper translation of requirements into spec-ifications; or (3) improper process monitoring (measurement). Any one ofthese causes requires looping back to Steps 3, 4, or 6 for corrective action.
Step 14. Recycle.
• At this point, there should be no evident problems in process capabilityor results. However, there may be opportunities for further quality
SL3100_frame_C03 Page 51 Friday, August 31, 2001 10:12 AM

52 Six Sigma and Beyond: Problem Solving and Basic Mathematics, Volume II
improvement of the process output, e.g., in terms of reduced variability.This could result in not merely meeting, but in exceeding customerexpectations.
• Customer needs and expectations are rarely static. They are likely tochange, especially in terms of becoming more restrictive. These opportu-nities for continuous process improvement require recycling to the PIC.
• Under any circumstances, continue to monitor the work process and theresults in order to maintain the required level of quality.
PROBLEM SOLVING VS. PROCESS IMPROVEMENT
At this juncture, be sure there is understanding, that there are major differencesbetween problem solving (PS) and process improvement (PI). A cursory comparisonfollows:
• The 5-step PSC and the 14-step PIC are proven, systematic approachesfor continual improvement. Both are extremely well-suited for team-ori-ented activity.
• Which systematic methodology should be used? (See Table 3.1.) In gen-eral, use PIC to improve the quality of a particular, currently existingoutput or to produce new output.
• Use PSC when there is a gap between what is currently happening andwhat should have happened.
• PSC is an integral and vital part of PIC (at Steps 9 and 13).• It is not always obvious which of the two methods should be used to
tackle a particular work issue. Skill and experience are required to makea better selection. The PSC/PIC selection chart (Table 3.1) compares thetwo methods and provides information to make the decision.
• Fortunately, no matter which method is selected, it will quickly becomeapparent whether or not the method is helping accomplish the objective.
SL3100_frame_C03 Page 52 Friday, August 31, 2001 10:12 AM

Problem-Solving and Process Improvement Cycles 53
TABLE 3.1Problem Solving vs. Process Improvement Selection Chart
Problem Solving Cycle (PSC) Process Improvement Cycle (PIC)
A general method for making achange in:
• Systems• Results• Conditions• Work process• Management process
A tightly focused method for ensuring conformance of:
• A specific product• A specific service
This method fosters:• Definition of problems• Analysis of data• Understanding of causes• Creative ideas• More alternatives• Teamwork• Commitment
This method fosters:• Elimination of unneeded work• Prevention of problems• Shared responsibility• Strong customer/supplier communication
lines• Evaluation of work processes• Confidence in results
Use this method when:• There is a gap between what is happening
and what should be happening• Moving from vague dissatisfaction to a
solvable, clearly defined problem• Unsure of how to approach an issue
Use this method when:• Improving the quality of a particular,
currently existing output• There is no agreed-upon customer
requirements for an output• Producing new output, the need for which has
recently been determinedSwitch to PIC when:
• The problem identified is a lack of quality or an inability to assess quality
• The recommended solution involves producing a specific output
Switch to PSC when:• Evaluation of process capability shows that
the current work process cannot produce conforming output
• Evaluation of results shows that the work process did not produce quality output
SL3100_frame_C03 Page 53 Friday, August 31, 2001 10:12 AM

SL3100_frame_C03 Page 54 Friday, August 31, 2001 10:12 AM

55
The Quality Tools
This chapter introduces some basic tools that are used in problem solving. Anoverview is given, recognizing that some of these tools will be fully developed inVolumes III and IV and some additional, advanced tools will be introduced inVolumes V and VI.
TOOLS FOR PROBLEM SOLVING
Teams need to learn and apply a number of quality tools, i.e., analytical techniques,to aid them in working through the five steps of the problem solving cycle. Thesetools are primarily used for collecting, analyzing, and understanding data or infor-mation. There are other tools that also help in the problem solving process. Not allof them are science based, but they do provide a very important input in the process.Table 4.1 summarizes some of these.
The core capabilities shown in Table 4.1 are only samples. With other capabil-ities, the importance may vary for each discipline. In Table 4.1 one may concludethat business practices have the most influence on the program and as such appro-priate tools should be used to evaluate the results for the project. The table is to beused in analysis of the tools early in the process to demonstrate the need of improve-ment in isolated cases. With this information, one can determine which capabilitiesneed to be acquired or developed to become more effective in each discipline.
QUALITY TOOLS INVENTORY
There are numerous quality tools that may be applied to problem solving. Some ofthese are very complex, advanced mathematical techniques, while others are quitesimple to learn and apply. Table 4.2 displays 38 of the most commonly used tools.For each tool listed, each step of the problem solving cycle (PSC) in which that toolcan be utilized is indicated. For example, the check sheet may be used in Step 1,Problem selection; Step 2, Root cause analysis; and Step 4 , Verification of correction.
THE SEVEN BASIC TOOLS
• Tools indicated by * in Table 4.2 are widely considered to be one of theseven basic tools:
1. Flow chart2. Check sheet
4
SL3100_frame_C04 Page 55 Friday, August 31, 2001 10:13 AM

56
Six Sigma and Beyond: Problem Solving and Basic Mathematics, Volume II
TABLE 4.1
Most Likely Influences of Program Development Practices on Sample Core Capabilities
The Nine Disciplines Core Capabilities
Practices
Art Science Business
Analysis Phase
Direction Strategic visioning x xMission development xPurpose definition x xProduct alignment and integrity xCompetency identification x
Differentiation Pricing strategy xQuality implementation x xPackaging concept xBrand identity xMarket strategy x x
Discovery Task or job analysis xAudience analysis xCompetitive analysis xMarket analysis x xCustomer feedback x x
Conception Phase
Diagnosis Investment planning xPortfolio analysis xCosting modeling xLife-cycle analysis xStrategic marketing x
Design Issue or argument definition xContent synthesis xAdult-learning theory x xInstructional systems designPredesign and design x
Development Print and video writing xEditing x xTailoring or customizing x xProject management xCultural adaptation x x
Implementation Phase
Delivery Graphics and layout xElectronic publishing xSoftware or video production x xAlpha and beta testing xInventory and product management x
SL3100_frame_C04 Page 56 Friday, August 31, 2001 10:13 AM

The Quality Tools
57
3. Pareto chart4. Cause-and-effect diagram (fishbone)5. Histogram6. Scatter diagram7. Control chart
• These tools can be
easily learned
and used by everyone in the organiza-tion; are
very effective
in achieving basic problem solving success; andare
essential
to any properly designed improvement strategy.• Basic instructions describing the tools and their use may be found in
Volumes III and IV (as well as any SPC book and/or basic statistics bookor in
The
Memory Jogger
).
USING THE SEVEN BASIC TOOLSIN PROBLEM SOLVING
Baking cookies is a rigid, step-by-step process. Similarly, the problem solving cycle(PSC) specifies a disciplined step-by-step approach for achieving the desired result.Each step of a cookie recipe specifies exactly which ingredients, utensils, andequipment are to be used and in precisely which order. However, the analogy betweenbaking cookies and solving problems breaks down. In each step of PSC, the teammust
decide
which “ingredients” (data and information) and which “utensils” (qual-ity tools) are the most appropriate and effective to use. A team of carpenters, buildinga house, following a blueprint, and selecting and using the right tools at the righttimes, is a much better analogy to a team following PSC.
For a team to become proficient at tool selection and use, considerable practiceand experience are required. Patience and perseverance become important virtues— they
will
pay off!
Documentation Record-keeping xFile management xTotal quality management x xFeedback systems x xOrganizational memory x
Deduction Program evaluation xCost/benefit analysis x xResearch and analysis xContinuous improvement xInternal return on investment x
TABLE 4.1
(Continued)
Most Likely Influences of Program Development Practices on Sample Core Capabilities
The Nine Disciplines Core Capabilities
Practices
Art Science Business
SL3100_frame_C04 Page 57 Friday, August 31, 2001 10:13 AM

58
Six Sigma and Beyond: Problem Solving and Basic Mathematics, Volume II
TABLE 4.2Typical Quality Tools
Problem Solving Cycle Step
Quality Tools InventoryBasicSeven
ProblemSelection
(1)
RootCause
Analysis(2)
Correction(3)
Verification(4)
PreventRecurrence
(5) Data
ANOVAAuditBrainstormingCause-and-effect diagramCheck sheetControl Chart
a
Customer complaint log and trackingCustomer feedback surveyDesign of experimentsEvolutionary operation (EVOP)Failure mode and effects analysis
(FMEA)Failure analysisFlow chartForce field analysisGoal settingGroup voteHistogramKey characteristic selectionMeasurement system evaluation
(MSE)Mind mapMistake proofingNominal group techniquePareto chartPilot runProcess capability studyProcess log/events logProcess potential studyProcess standardization and/orQualification cost of quality analysisQuality function deployment (QFD)Regression analysisResponse surface methodology
(RSM)Scatter diagramStatistical process control (SPC)StratificationTaguchi methodsTeam meeting guidelinesTest of hypothesis
***
*
*
X
*
*
XXXXXXXX
X
XXXXX
X
XX
XXX
XX
X
X
X
XXXX
XX
XX
XXXX
XX
XXX
XX
XXXXXX
X
X
X
X
X
X
XXXX
X
XXXXX
X
X
X
X
XXX
X
X
X
X
X
X
X
VAAAA
VAAA
VAVA
AAAA
VAVAV
A—AA—VAA
VA—V—VV
VVAVAV—VA
Note:
V, variable data; A, attribute data; *, one of the seven basic tools.
a
Control charts (variable, attribute, run, multivariable, box plots, pre-control, etc.).
SL3100_frame_C04 Page 58 Friday, August 31, 2001 10:13 AM

The Quality Tools
59
SEVEN QUALITY CONTROL MANAGEMENT TOOLS
1. Affinity diagram2. Relationship diagram3. Tree diagram4. Matrix chart5. Matrix data analysis chart6. Arrow diagram7. Process decision program chart
Use of the basic and management tools in the problem solving process is to maximizethe solution of the problem. This is done by following a prescribed methodology inthe particular tool of choice so that a plan can be developed to deal with thefundamental questions and concerns of the five-step approach. When the right toolis chosen, there will be appropriate answers to these questions:
1. What is the problem?2. What can be done about it?3. Can a “star” be put on the best plan?4. Can the plan be carried out?5. Did the plan work?
As important as these tools are, the underlying assumption is that managementsupports the effort for success. The following items are most important in theproblem solving process and unless they are at least considered, failure is on thehorizon. They are called factors for success:
• Management commitment• Employee involvement (ownership)• Cooperative worker/management relationship (not adversarial)• Something in it for the people• Time, energy, and determination• Appropriate communication (two-way)• Applicable training• Ability and freedom to pinpoint “real” problems and identify “real” causes• Appropriate team for “the problem”• Appropriate (reachable, realistic) goals and measurable performance• Appropriate and applicable frequent recognition, as well as feedback
SELECTED BIBLIOGRAPHY
Brassard, M. and Ritter, D.,
The Memory Jogger II
. Salem, NH: GOAL/QPC, 1994.Ishikawa, K.,
Guide to Quality Control
. White Plains, NY: Asian Productivity Organization(UNIPUB), 1982.
SL3100_frame_C04 Page 59 Friday, August 31, 2001 10:13 AM

SL3100_frame_C04 Page 60 Friday, August 31, 2001 10:13 AM

61
The Global Problem Solving Process
This chapter introduces a version of methodology used in the automotive industry,specifically at Ford Motor Company, known as 8D methodology. We have chosento call it the global problem solving (GPS) process, since its application may beused in any industry. GPS is a very simple methodology, but it demands an appro-priate amount of time to identify and recommend a solution. However, GPS is veryeffective when used properly.
GENERAL OVERVIEW
When there is a major problem or the response to a particular problem may requiresignificant time to reach a full solution, then serious consideration of a structuredapproach to the problem should be considered. Consider a structured approachbecause:
• It provides a systematic approach.• It provides a common methodology.• It is a fact-based, scientific approach.• It uses the team approach.• It builds up a database to understand and solve future, similar problems.
Perhaps one of the most innovative approaches to problem solving is the globalproblem solving (GPS) process. It is modeled after the approach used by Ford MotorCompany and, indeed, GPS has become the standard for analysis worldwide, at leastin manufacturing. It is a powerful process that has nine stages. This section sum-marizes the process; however, the reader is encouraged to review Appendices Bthrough J for general guidelines about questions that are necessary for the optimumsolution. (The questions are obviously only thought starters and do not present anexhaustive approach.)
GPS begins with questioning the process itself to determine whether or notthere actually is a legitimate problem. Then it considers possible emergency action.The problem at hand, more often than not, is called a “defect” (today called a
5
SL3100_frame_C05 Page 61 Friday, August 31, 2001 10:14 AM

62
Six Sigma and Beyond: Problem Solving and Basic Mathematics, Volume II
nonconformance item). A “defect” is a problem, a concern, an opportunity — anopportunity to improve. From the point of a “defect,” serious consideration of theprocess evaluates each step in a very formal way, so that a resolution can be reached.In the following paragraphs, the formal approach is summarized as a whole andthen each step is highlighted with specific considerations.
Problem description:
In this step, the team (1)
describes
the problem and its symp-toms, (2)
presents the rationale
for selecting a particular concern, and (3)
sets thebaseline
against which evaluations of actions will be measured. It also
summarizes
customer-related and in-plant indicators of the magnitude of the problem and refersto Pareto charts of TGW (things gone wrong), warranty, and/or in-plant indicatorsto provide a perspective on the importance of the area relative to other areas whichmight have been chosen for improvement action. The idea is to demonstrate withdata-based evidence that the project is of sufficient importance to merit devotingvaluable engineering resources to it.
For purposes of control, customer-oriented measures should be related to in-plant indicators. These include
SPC charts on selected characteristics, daily evalu-ation samples (sometimes called daily audits), and first run capability. Efforts shouldbe made to isolate unique contributing factors, such as charting data by shift toisolate shift-to-shift differences. Attention should be given to precise agreed-uponoperational definitions, particularly for “judgment” items, and care should be takento ensure that the measurement system is adequate.
In addition, data taken at different points in the production process may be bestsuited to answering different questions. For example, data taken on paint scratcheswould measure different things depending on whether data is taken
before
or
after
the repair booth. (If taken before the repair booth, data can measure the performanceof the paint operation; if taken after the repair booth, data measures the paint
and
repair system.) When using summary statistics, one should generally indicate thesize and time frame and precise source of the sample, e.g., “first run capability forshift #2 is 83% based on 500 pieces during week of April 8” or “#4 overall Paretorank based on second quarter data.” Despite small sample sizes, certain other mea-sures of the concern can also be used to indicate that there is an area that should beaddressed, e.g., audit results, internal and external complains, etc. These data, how-ever, should generally not be used for conclusive verification because their smallsample size prevents them from being an adequate tool to estimate change when theevent of interest has a small rate of occurrence. Keep in mind that this step summa-rized the evidence which establishes the
baseline
against which future progress dueto actions taken will be measured.
Specify potential root causes:
The purpose of this step is to
summarize
the effortsof the group to understand the problem described in the previous step by asking thequestion
why
?,
why
?,
why
? until it cannot be asked again. To aid in this process,highly recommended documents are
flowcharts
(present — what is done now —and ideal — how the process would work if it were perfect) and
cause and effectdiagrams
(also called fishbone or Ishakawa diagrams). In addition, Pareto charts toanalyze the sources of the problem and additional run and SPC charts to determine
SL3100_frame_C05 Page 62 Friday, August 31, 2001 10:14 AM

The Global Problem Solving Process
63
the magnitude of contributing factors are most helpful. For example, if the primarycomponent of poor paint quality was found to be dirt in the paint (from a Paretoanalysis of the problem description stage), this step would indicate the group’s effortsto determine exactly where the dirt was appearing on the item and where in theprocess dirt might enter the production system so that it would end up on at aparticular part. In other words,
why
was dirt in the paint?At this point, problem resolution sub-teams might be formed. A page of the GPS
report should indicate the core and resource person membership, their goal, theinitial level of the quality indicators, and the required resolution documents.
After the potential root cause has been identified, a short summary of the actionsis addressed. The action quite often is in the form of:
• Interim action to stop the concern from getting out of the source• Permanent action to stop the concern from recurring• Specific service action to correct any concerns that may have gone to the
customer, if required (
Note:
Special attention should be given to “serviceneeds.”)
Be as specific as possible in this step. Do not write “hole moved,” but instead write“drain hole moved 1/4 in. to right.” Be sure to indicate deviation and specific(whenever possible) drawing and service bulletin numbers. Include anticipated andactual completion dates. A corrective action chronology (CAC) is a useful methodto relate symptoms, root causes, actions, and verification.
Verification:
This is the step in which GPS write-ups have been found to be mostoften lacking and the area where management is placing increasing emphasis. Evi-dence of effective action is required for both interim and the permanent action, butnot service action (discussed on an exception basis only). Persons who are deeplyinvolved in the solution of a problem are sometimes too close to be objective aboutwhat constitutes good evidence that a problem has been adequately addressed. Thereare three elements of the adequacy of evidence:
• Common sense and consideration of natural variability of the process• Cause and effect (where and when to take samples)• Statistical theory (how many samples and what inferences should be made
from incomplete data)
Additionally, in this step the team must make clear if it is attempting to demonstrate:
• “Snapshot” verification and/or experimentation• Ongoing control at a new level
recognizing that both are frequently required for interim
and
permanent actions.Of the three elements of data-based evidence, common sense and the consider-
ation of natural variation are the most important. For example, a baseball generalmanager who had decided to send a player to the minors for poor batting would not
SL3100_frame_C05 Page 63 Friday, August 31, 2001 10:14 AM

64
Six Sigma and Beyond: Problem Solving and Basic Mathematics, Volume II
change his mind and offer the player a $2 million a year contract just because theplayer had three hits for four at bats in his most recent game. This
could
happen bychance even if the player had not improved at all. (Likewise the GPS team shouldput itself in the place of a suspicious external observer when determining “if”evidence passes the test of common sense.)
Next to common sense, considerations of cause and
effect are most importantin determining what data to take to verify that an action is effective. In other words,when a desirable result is obtained from a system, data gathering must be plannedin a way to be reasonably sure that the result was caused by the change made ratherthan a change in some other input in the system.
A hypothetical example is useful in illustrating the importance of
cause andeffect:
consider a decision to improve door closing efforts by a change in weather-stripping cross section. Sample parts at the “now” design level result in an improve-ment. The new design is adopted, but customer complaints do not decrease. Thereason is that the sample parts were made with a batch of raw material compoundwith a rubber formulation at the extreme end of the specification. It was the differencein chemistry that made the difference in closing efforts rather than the change indesign. It is very difficult to be reasonably sure that improvement seen in the trialwas due to the design change rather than the formulation change (or many otherconceivable differences between the sample parts and the regular production parts).One approach to prevent other factors from influencing results is to “block” theeffect of these other change in the test plan (perhaps using the design of experimentsapproach). Additionally, more confirmation generally should be obtained. This isaccomplished by monitoring the process over time and by taking steps to keep thesystem in statistical control at the new level. When the process is monitored over aperiod of time, the confidence level of members of the group that the design/processchange has had the desired effect is increased. This is why ongoing verification ispart of the GPS process for both interim and permanent actions.
The questions of determining which actions to select for both interim or perma-nent solutions should be answered with the help of data whenever appropriate.Ideally this will be done with design of experiments (DOE), a rigorous methodology(see Volume V) based on statistical theory which helps the engineer understand theimpact of changing a number of components simultaneously in a specific organizedmanner. With DOE, the engineer can often obtain the information sought by runningonly a fraction of the tests which would need to be run to obtain the same informationif one-factor-at-a-time testing were used. In addition, using Taguchi’s concept ofparameter design (robustness), the engineer can not only look at design and pro-cessing parameters which can be set, but he can also gain insight into how “robust”design alternatives are. A “robust” design is one which will consistently functionclose to target intent despite a wide range of uncontrollable factors — called noises(e.g., temperature, customer use, etc.). An example would be to design an installationprocedure which is “robust” against worker fatigue, i.e., a new part which is (almost)as easy to install the first time as after doing it 400 times a day. There are a varietyof data analysis methods to help achieve this result, including simple graphicaltechniques, separate analysis of averages and variance signal to noise ratios, and
SL3100_frame_C05 Page 64 Friday, August 31, 2001 10:14 AM

The Global Problem Solving Process
65
computerized nonlinear optimization techniques. Each approach has advantages anddisadvantages.
When DOE is not used, “snapshot” testing of a proposed action should generallybe employed before putting a proposed design/process change into production. Acommon use of “snapshot” testing is a go/no go type of test (e.g., does a revisedweatherstrip prevent water leaks better than the present design). The procedure,which requires a large amount of data, uses a chart which indicates the demonstratedestimated reliability at 85% confidence for a given sample size (total number ofrevised weatherstrips tested) and the number of parts which have leaks. This estimateis compared to the reliability estimate for the present design. Another form of“snapshot” testing is to look at measurement data for the new design (e.g., doorvelocity) and use statistical tables to compute confidence intervals for the differencein velocity between the two designs. This assists the engineer to decide if thedifference in performance is likely to be due to the difference in designs or to randomnoise (chance).
Note:
The use of statistical techniques for “snapshot” verificationassumes that common sense has been used and that proper consideration of the causeand effect influence has been made. In short, statistics can enhance, but never replace,engineering judgment (more about this in Volume III).
Statistical theory is also important in determining subgroup size and frequencyfor SPC charts, which can be very useful in both analyzing and verifying the problemin a process (more about this in Volume IV).
Prevention:
List the changes that will prevent recurrence of this and similar concernsin the future, e.g., use FMEAs, changes in supplier certification, and specific actionsto ensure engineering/manufacturing/supplier communications. These actions fre-quently require management action, sometimes upper management action, to pro-duce the changes in the system required to prevent recurrence of the concern on
any
part of
any
product in
any
plant.
Recognize your team:
Mention when and from whom the team received timely,honest feedback on the impact of their solution. Frequently, it is also useful toevaluate how the group problem solving process worked and how the process mightbe improved. Additionally, some teams celebrate success with a group event suchas a luncheon or attending a baseball game.
DO’S AND DO NOT’S
In a classic sense, GPS is a process. However, each of the individual steps that makeup this process is the “real” work. So, success as an output variable of the GPSprocess depends on the effort put into the individual steps. To be sure, GPS is aprocess that facilitates problem solution, but it is much more than that. It is also adocument that others (managers and engineers) may use for different needs. There-fore, the following “Do” and “Do Not” lists are reminders:
SL3100_frame_C05 Page 65 Friday, August 31, 2001 10:14 AM

66
Six Sigma and Beyond: Problem Solving and Basic Mathematics, Volume II
D
O
’
S
• Write sentences that are easily understood by nontechnical individuals.Presume
no
prior knowledge. Spell out acronyms, e.g., TGW (things gonewrong).
• Ensure that it is clear which product, part, concern, root cause, or actionhas been selected. Use item numbers (A, B, C), buzzwords, or separatewrite-ups when multiple root causes are involved.
• Provide enough information for an engineer to understand the thoughtprocess and solutions. Provide the engineer with information and thoughtstarters for similar problems that might be encountered in the future.
• Leave tracks so later (2 years from now) another engineer would be ableto obtain more information: reference specific part numbers, deviations,test reports, service bulletins, and plant dates.
• Distinguish fact from opinion.• If the concern has a prior history, indicate and explain.• Include timing risk estimate classification (TREC) if applicable.• Treat the GPS report as a living document.• Realize that only data collected over the long run can ensure that the
solution is “robust.”• Indicate the outlook for improvement.• Be sure a structure is established which will provide ongoing control after
the team leaves.• Ensure that the team leader has the necessary power to make things happen.• Have team members from all affected areas, i.e., those who will have to
implement the solution, and have available diverse resource people whocan generate and evaluate potential solutions or contribute unique skills.
• List clear responsibilities of team members.• Ensure the measurement system is adequate before it is used on the system.• Have useful, agreed-upon operational definitions, e.g., first run.• Include cost estimates whenever available.• Include a cause-and-effect diagram.• Relate in-plant indicators to customer-oriented indicators.• Distinguish “snapshot” from ongoing verification.• Prioritize.• “Clean your own house first.”• Understand customer concern. Be customer driven.• Drive analysis and data collection upstream.• Make charts on the floor and use them as a control document (not only
for display purposes)!• Use graphic data displays.• Ask why?, why?, why? (not who?, who?, who?) until why cannot be
asked again.• If there is a roadblock, ask why and seek an alternative.• Involve hourly workers.
SL3100_frame_C05 Page 66 Friday, August 31, 2001 10:14 AM

The Global Problem Solving Process
67
• Use data that are already (secondary data) available, i.e., repairmens’records.
• Include backup documents such as fishbone diagrams, Pareto charts, andcontrol charts.
• Include action plans.• Use design of experiments (DOE).• Use charts rather than numbers alone. Capture the time dimension.• Use variable (vs. attribute) data whenever possible.• Understand the system by using flowcharts.• Use common sense!• Label each chart: part, plant, time, quantity, and metric.• Remember that a dubious observer is to be convinced.• Inform others of the results.• Confirm “snapshot” verification with statistical process control.• Make chronologies and summaries.• Call a statistical resource person to help with a sampling plan before
collecting data.
D
O
N
OT
’
S
• “BS,” equivocate, or muddle.• Let the report become an end in itself.• Leave blanks. (Explain what has been done or what will be done.)• Confuse root cause with symptom.• Make charts for the sake of charts.• Forget that the team is limited only to statistical tools frequently used.• Fail to use many other useful techniques, e.g., exploratory data analysis
and regression.• Use warranty/TGW data for in-plant control.• Use “operator retrained” prevention.• Use P charts when U or C charts are called for.• Be afraid to recommend management system changes in the prevention
section.• Use statistics as “a drunk uses a lamppost, for support rather than
illumination.”
CONCERN ANALYSIS REPORT
Perhaps one of the most useful tools in problem solving is use of a concern report.The report serves as a guideline about the path that the team will follow and thetools that may be used in the problem solving process. It may be modified to projectthe needs of the team members. There is no standard form; however, Table 5.1 is athought starter.
SL3100_frame_C05 Page 67 Friday, August 31, 2001 10:14 AM

68
Six Sigma and Beyond: Problem Solving and Basic Mathematics, Volume II
TABLE 5.1
Concern Analysis Report Guidelines
Problem Solving Step Issue Tools
Preparation • Background information• Specific information about the
issue
• Interviews• Check sheets• Communication skills
Team • Selection of core members• Selection of resource persons• Definition of roles and
responsibilities• Notification of everyone affected
• Interviews• Communication skills
Problem description • Relate in-plant to customer-related data
• Define priority• Look for trends• Look for deviations from standard• Investigate who, what, where,
when• Establish baseline
• Brainstorming• Flow charts• Good grammar• Operational definitions• Engineering judgment• Data availability• Loss function• Market research• Gage capability• Analysis of variance• Key characteristic dimensional
calibration• Pareto chart• Survey results/test results• Run charts• SPC charts• TGW, warranty
Root cause • Study symptom and root cause• Identify priority• Identify top four or five• Dive into root cause• Review design history of this and
similar parts for approaches which may be useful or useless
• Brainstorming• Check sheets• Flow charts• Cause and effect diagrams• Data collection plan• Design of experiments• Pareto chart• Run chart• SPC charts• Scatter plots• Correlation• Regression• Exploratory data analysis• Repairmen’s records• Design history• EI team meetings• Plant personnel surveys• Professional literature• Parameter design
SL3100_frame_C05 Page 68 Friday, August 31, 2001 10:14 AM

The Global Problem Solving Process
69
ROOT CAUSE ISSUES
Root cause is something that everyone talks about, but few understand. Even fewerdo something about it. Because the root cause is ultimately the goal of any improve-ment initiative, take a closer look at the root cause by examining or becomingcognizant of some of the difficulties associated with this concept.
• Specifying root cause is a very difficult process.• Potential root causes are identified in the early stages of the study. Brain-
storming and cause-and-effect diagrams are useful at these stages.
Actions — Interim • Work plan• Deviation numbers• Plan for eliminating special
causes• Corrective action chronology• Status report of pending
modification or change
• Engineering judgment based on root cause and parameter design analysis
• Reliability analysis• Fractional factorial analysis• SPC• Internal and external statistical
consultants• Cost benefit analysis• Engineering economics
Actions — Permanent • Work plan• Deviation numbers• Plan for eliminating special
causes• Corrective action chronology• Change the documentation to
reflect new or modified “way”
• Engineering judgment based on root cause and parameter design analysis
• Reliability analysis• Fractional factorial analysis• SPC• Internal and external statistical
consultantsVerification • “Snapshot”/screening
experiments• Ongoing evidence of process
control at new “breakthrough” level
• Common sense, cause and effect and statistical theory
• Pilot study• SPC• Capability study
Prevention • Fundamental system changes• Inform activities that might
benefit from similar system change
• SPC
Recognize the team • Honest, accurate, and timely feedback
• Interpersonal skills• Communication skills
TABLE 5.1
(Continued)
Concern Analysis Report Guidelines
Problem Solving Step Issue Tools
SL3100_frame_C05 Page 69 Friday, August 31, 2001 10:14 AM

70
Six Sigma and Beyond: Problem Solving and Basic Mathematics, Volume II
• To determine that a cause is a root cause, ask why?, why?, why? Whenthe question why can no longer be asked, a root cause has been reached.
• There can be more than one root cause.• There are frequently chains of causality. Root cause analysis drives one
up the chain.• Sometimes several levels of causality should be addressed.• Root causes generally involve system changes — frequently changes in
management systems that are beyond the immediate control of the team.If these system changes are not made, this concern or a similar concernwill reoccur (or occur in another product or in another plant).
• Generally, if actions do not address the root causes, future work isguaranteed.
An example may prove the point. Often, the last link in a chain of causes islooked at as the root cause. For example, generally there is no objection to someonesaying, “Joe won the pool tournament because he sank a difficult shot.” In going upthe stream of causes, it could then be said:
• Joe won the pool tournament because he sank a difficult shot.• He sank the shot because it came off the second bank at the proper angle
and sufficient velocity.• It came off the second bank because it came off the first bank at the proper
angle and sufficient velocity.• It came off the first bank at the proper angle because the target ball was
struck by the cue ball at the proper angle and sufficient velocity.• The target ball was hit at the proper angle because the cue ball was struck
by the cue at the proper angle and sufficient velocity.
After going up the chain of causality, it would be tempting to say that the laststatement is the root cause of Joe winning the tournament. If this were so, all thatwould be necessary to win the tournament would be to be able to strike the cue ballat a certain angle at a certain velocity to make this bank shot, i.e., anyone who couldmake the bank shot would win the tournament. Clearly this is not the case. Joe hadto make a number of other shots to be in a position to have the bank shot describedas the winning shot. Investigating further, it might be said that the root causes ofJoe’s victory are
• Joe’s hand/eye coordination• Joe’s practice• Joe’s coaches and/or teachers• Joe’s physical and mental state at the time of the game• These same elements for each opponent Joe faced in the tournament
Looking at these potential root causes yields some basic prescriptions for anyonewho wants to win a pool tournament:
SL3100_frame_C05 Page 70 Friday, August 31, 2001 10:14 AM

The Global Problem Solving Process
71
• Seek out good teachers and coaches.• Have a positive mental attitude.• Come to the game rested and sober.• Practice, practice, practice.
The example from a pool tournament resulted in prescriptions for success whichare no surprise. Few people would think the way to win a tournament is to be ableto sink a single shot. This is because the recipe for success — the root cause — insports has been arrived at after centuries of trial and error and is now commonknowledge. The root causes for a new challenge are frequently not as obvious andpeople do not spend time going up the chain of causality. For example, to say a partis not installed to specifications because the installer did not install it to specificationsis like saying Joe won the tournament because he sank a shot. This, of course, leadsto “mistake proofing” which will be addressed in Volume VI.
VERIFICATION
As already discussed, there are three elements to verification:
1. Common sense2. Cause and effect3. Statistical theory
Ultimately, the only verification that counts is whether or not the customer
likes
theproduct. However, the time it takes to get this information makes this data unsuitablefor evaluations. In its place, statistical process control (SPC) of characteristics closelyrelated to customer-oriented measures should be used for verification of both interimand permanent actions. Common sense is the basis of all verification. For example,if a football coach had a record of 0-7, no one would offer him a 5-year contract ifhe won his next game — at best he might not be fired.
Essential to verifying the effectiveness of an action is having a baseline againstwhich future progress may be measured. This emphasizes the importance of havinga data gathering plan in place for key items.
The question then becomes how to select these actions. Ideally this is done withdesign of experiments (DOE), a rigorous methodology based on statistical theorywhich helps an engineer understand the impact (i.e., the cause and effect relationship)of a number of design/manufacturing decisions by simultaneously changing themin a specific, organized manner. With DOE, the engineer can frequently obtain theinformation needed by running only a small fraction of the tests needed to obtainthe same information using one-factor-at-a-time testing. Using Taguchi’s concept ofparameter design allows the engineer to look not only at design and processingparameters, which can be set, but to also determine how “robust” his design mightbe. A “robust” design performs consistently in the face of widely varying “noise”variables which an engineer cannot control or chooses to not control. (Recall the
SL3100_frame_C05 Page 71 Friday, August 31, 2001 10:14 AM

72
Six Sigma and Beyond: Problem Solving and Basic Mathematics, Volume II
design described earlier in this chapter which was “robust” against worker fatigue,i.e., the new part was as easy to install 400 times a day as it was to install once.)
When a DOE approach cannot be used to determine if an action is likely to havethe desired effect, the alternative is to use “snapshot” verification with care.
E
XAMPLES
OF
“S
NAPSHOT
” V
ERIFICATION
(R
ELIABILITY
AT
85% C
ONFIDENCE
)
Interpretation of test results:
For tests of a given sample size, use a classic sampletable (Oliver et al., 1972; Schafer 1967a; Schafer 1967b; similar tables may be foundin any statistic book and or reliability book). Because they are easily available, suchtables are not included. (Volume III will cover sampling more thoroughly.) However,the interpretation is always the same, given a certain confidence level. For purposes,of example, an 85% confidence is assumed which also happens to be the mostcommon. Use the tables by:
• Reading the number of samples tested in the “n” column on theleft-hand side.
• Reading the number of nonconforming (sometimes called failures) acrossthe column heading.
• Finding the resulting demonstrated reliability at 85% confidence wherethe row and column intersect.
Example 1:
A 50-part trial has 3 nonconforming pieces (pieces that do not pass ago/no-go test). This demonstrates 87.9% reliability at 85% confidence.
Example 2:
All parts in a 100-part trial pass a go/no-go test. This demonstrates 7.9%reliability at 85% confidence.
Determination of test size:
• Determine the reliability at 85% confidence to be demonstrated.• Find this number (or next largest value) in the zero nonconforming column.• Read minimum sample size from “n” column.
Example 1:
To demonstrate 99.5% reliability at 85% confidence in a go/no-go test,400 parts must be run and all must pass. If 1 part is nonconforming, demonstratedreliability drops to 99.1%.
Example 2:
To demonstrate 99.9% reliability at 85% confidence, 1500 parts mustbe run, all of which pass the go/no-go test.
Note 1. Sample sizes can be greatly reduced if variable data (e.g., pounds) areused rather than go/no-go data. Different statistical techniques are needed.
Note 2. Applying the results of “snapshot” testing, like all statistical meth-odologies, to future production assumes the tests are run against
SL3100_frame_C05 Page 72 Friday, August 31, 2001 10:14 AM

The Global Problem Solving Process
73
conditions which the production parts will actually encounter. If thisis not the case, actual reliability may be very
different. A connectionmade by an engineer who has time to finesse the operation mayperform better than that one made by an operator who must performthe operation in 15 seconds.
Note 3. One-at-a-time testing is an inefficient way to test design alternatives,especially for multiple changes. DOE is recommended.
Note 4. “Snapshot” verification gives only an indication of what is
likely
tooccur. Generally, it should be followed up by ongoing statisticaltechniques.
SPC C
HART
S
UBGROUP
AND
S
AMPLE
S
IZE
A special verification approach is done with SPC. Obviously, as already mentioned,statistical theory is important in determining the number of items to be looked at ina subgroup of an SPC chart. As a general rule, a p chart for attribute (go/no go) datashould have subgroups such that np (bar) is greater than or equal to 5 if the chartis to be interpretable, i.e., the rules of determining out-of-control situations can beused directly (for some applications, np 9 is recommended). An alternative minimumsample size (n) which does not allow for control chart interpretation, but whichensures that at least one nonconforming unit in every subgroup with at least 90%confidence is
n = –1/log[1 – p(bar)]
This formula is a special case of
n = log (1 – confidence)/log[1 – p(bar)]
In these formulas, p is the average proportion nonconforming, n is the desiredsample, log is the regular log of base 10, and “confidence” is the desired confidencelevel. For the other attribute charts, C and U, the “Rule of Five” also applies, i.e.,there should be at least 5 nonconformities per subgroup for interpretability (again,for some applications c
≥
9 is recommended). A few calculations quickly indicatethat use of attribute charts requires a great deal of data (more on this in Volumes IIIand IV).
For X-bar and R charts, the subgroup size and frequency determination are basedon the relationship between the variation between the pieces which are producedconsecutively, the period to period variability, and the capability of the process. Inall determinations of subgroup size and frequency, the economics of the time to takedata must also be considered, as well as sources of stratification, e.g., two sets ofmolds in an injection molding process. If only a “snapshot” is available at the timeof the report, the plan to collect control chart information should be indicated.
It is important to state the sample size and subgroup frequency when presentingverification. If in doubt about either the sample or the frequency or both, consultwith a statistician or internal/external consultant.
SL3100_frame_C05 Page 73 Friday, August 31, 2001 10:14 AM

74
Six Sigma and Beyond: Problem Solving and Basic Mathematics, Volume II
If verification is dependent on physical inspection, then cost considerations playa major role (Deming, 1982) and the following rule applies: if c
i
= cost of inspectionon a per part basis, and c
d
= cost of finding and fixing the defect at end, then theratio of c
i
/c
d
will determine the effectiveness of inspection. If the ratio is greaterthan the fraction defective (p), then inspect 100%; if the ratio is smaller, no inspectionis necessary; and if it is “1,” it is the break-even point.
GPS APPLICATION CRITERIA
Therefore, to be successful in the GPS process, the following must be consideredand reviewed, as appropriate:
• Control plan (This is actually a road map of the process when somethinghas gone amiss.)
• Attention to detail (Be sure the “current” process flow chart is understood.)• Accurate, timely, and meaningful data (the foundation of sound problem
resolution)• Analysis and technical expertise• Appropriate and applicable training• Maintenance• Follow appropriate and applicable standards, procedures, policies, etc.• Tenacity and commitment to results• Accountability and feedback• Worker involvement• Appropriate and applicable incentives and rewards• Bad work unknowingly “passed”• Focus on customer satisfaction
It is important to recognize that the GPS process is a summary process. Eventhough it may take several days and considerable work to complete the finding,analysis, and recommendations, the ultimate result should be written on
one
page.Working with this in mind will add even more to the discipline and to the processimprovement as a whole. A typical format for this type of cover sheet may be foundin Appendix A.
For GPS to be a viable option to solve problems, the following criteria must be met:
1. There is a definition of the symptom(s). (The symptom has been quantified.)2. GPS customer(s) who experienced the symptom(s) and, when appropriate,
the affected parties have been identified.3. Measurements taken to quantify the symptom(s) demonstrate that a per-
formance gap exists
and/or
priority (severity, urgency, growth) of thesymptom warrants initiation of the process.
4. The cause is unknown.5. Management is committed to dedicate the necessary resources to fix the
problem at the root cause level and to prevent recurrence.
SL3100_frame_C05 Page 74 Friday, August 31, 2001 10:14 AM

The Global Problem Solving Process
75
6. Management is committed to results at the root level.7. Symptom complexity exceeds the ability of one person to resolve.
COMMON TASKS
As one proceeds through the GPS process, it becomes obvious that there are commontasks in each of the individual steps. Tasks which require continual considerationthroughout the GPS process are
1. Document the changes.2. Review team composition.3. Review measurable(s).4. Determine if a service action is required.5. Review assessment questions.6. Update the GPS report.
In fact, these tasks are so common, yet powerful, that each step should begin witha review of each task to be sure that a previous task was accomplished or if somethingmust be done before the current task is undertaken.
CHANGE AND NEVER-BEEN-THERESITUATIONS
Things do go wrong. The question is why? More often than not, the reasons are
• Something was omitted. (There was not have enough time.)• Something was minimized. (It has always been done this way.)• Something is insufficient. (It’s what was asked for, isn’t it?)• Something was bypassed. (There was a check off, but the necessary related
content was not implemented.)
In short, when any one of these items occurs in an organization, there are “problems.”The problems cause “change” and that type of change falls into three categories:(1) something changed gradually; (2) something changed abruptly; and (3) some-thing changed in a way that is “new” — we have “never been there” (Figure 5.1).The level of investigation and problem solving will be different, depending on thechange being experienced. However, the process for both will be the same. Theprocess and each of its steps will be examined in detail in the next section.
GPS STEPS
There are common tasks in each GPS step that require continual considerationthroughout the GPS process. The tasks are so important that they should be reviewedat the beginning of
each
GPS step. Therefore, the common tasks are part of each step:
SL3100_frame_C05 Page 75 Friday, August 31, 2001 10:14 AM

76
Six Sigma and Beyond: Problem Solving and Basic Mathematics, Volume II
Common tasks:
• Document the changes.• Review team composition.• Review measurables.• Determine if a service action is required.• Review assessment questions.• Update the GPS report.
FIGURE 5.1
Something changed. - - - Actual performance, ____ Expected performance ordesired performance.
SL3100_frame_C05 Page 76 Friday, August 31, 2001 10:14 AM

The Global Problem Solving Process
77
GPS0: P
REPARATION
(F
IGURE
5.2)
Background:
Purpose
. In response to a symptom, evaluate the need for the GPS process.If necessary, provide an emergency response action (ERA) to protect thecustomer and initiate the GPS process.
Review the common tasks.
Tasks that need continual consideration throughoutthe preparation process:
1. Document the changes.2. Review team composition.3. Review measurable(s).4. Determine if service action is required.5. Review assessment questions.6. Update the GPS report.
FIGURE 5.2
An overview of GPS0.
SL3100_frame_C05 Page 77 Friday, August 31, 2001 10:14 AM

78 Six Sigma and Beyond: Problem Solving and Basic Mathematics, Volume II
Overview. Application criteria identify conditions that justify use of the GPSprocess. This justification is necessary to allocate resources because thedemand for resources in the form of people, time, money, experience, etc.is usually greater than what is currently available. Many problem solvingtechniques and processes are available. Matching the right problem withthe right process is one way to avoid wasting limited resources. Usingresources effectively is also important. GPS requires the use of manyresources, but it offers many benefits.
The focus of GPS0 is to be sure that there is a preliminary analysis of whetheror not a full-scale GPS or an ERA is necessary.
GPS1: ESTABLISH THE TEAM/PROCESS FLOW (FIGURE 5.3)
Background:
Purpose. Establish a small group of people with process and/or product knowl-edge, allocated time, authority, and skill in the required technical disciplinesto solve the problem and implement corrective actions. The group musthave a designated champion and team leader. This group begins the teambuilding process.
FIGURE 5.3 An overview of GPS1.
InputGPS Process Initiated
IdentifyChampion
Identify TeamLeader
Select TeamMembers
Determine Skillsand Knowledgeteam will need
Establish TeamGoals and
MembershipRoles
EstablishOperating
Procedures andWorking
Relationships ofthe Team
Output TeamEstablished
SL3100_frame_C05 Page 78 Friday, August 31, 2001 10:14 AM

The Global Problem Solving Process 79
Review the common tasks. Tasks that need continual consideration throughoutformation of the team and the process flow process:
1. Document the changes.2. Review team composition.3. Review measurable(s).4. Determine if a service action is required.5. Review assessment questions.6. Update the GPS report.
Overview. Problem solving implies that changes will be made to resolve anundesired condition. Comprehensive problem solving approaches acknowl-edge the need to make provisions for the entire problem solving effort.Such provisions may include blending the organization’s needs with theproblem solvers’ skills, behaviors, and personality styles. GPS1 addressessome of the requirements for successful problem solving efforts. Certainproblems can be tackled by one person, but generally speaking resolvinga concern at the systemic level requires a cross-functional group — a team.
A problem solving team may be created with specific tasks or objectives inmind. However, when persons with different experiences, skills, knowledge, andpriorities are assembled, human relations’ issues tend to arise and interfere withcompletion of assigned tasks.
The primary function of GPS1 is to prevent human relations’ issues from devel-oping. During GPS1, roles, goals, and responsibilities are clarified. In group problemsolving situations, the team is well advised to establish guidelines for group andindividual behaviors.
At a minimum, the owner of the concern (called the champion), the one withdecision-making authority, must be strongly committed to the problem solving effort.Fixing the problem at the root cause level and subsequent prevention efforts areimpossible without this commitment. The champion’s critical role is to empowerthe problem solver(s) to complete the prescribed problem solving steps. The cham-pion also helps remove barriers and procures resources needed to resolve the concern.
Champion. The champion has the authority to make (and implement) decisionsregarding containment actions, permanent corrective actions, and preven-tion of recurrence. The Champion also supports the problem solving effortsof the team throughout the process. One key duty is to set priorities:
• Task the team with the GPS method.• Help remove organizational barriers to the GPS method.• Help procure resources the team requires to complete the process.• Review assessing questions with the team.• Exercise authority to implement team recommendations.• Support the organization as a point of contact regarding the GPS
process.
SL3100_frame_C05 Page 79 Friday, August 31, 2001 10:14 AM

80 Six Sigma and Beyond: Problem Solving and Basic Mathematics, Volume II
• Forward the GPS report to concerned departments.
Team members. Team members are persons who are selected to participate onthe GPS team due to their expertise and knowledge. They are the subjectmatter experts who do the work of each objective. Team members mightchange during the GPS process. They are generally responsible for:
• Doing investigative work• Developing plans• Using judgment, skills, experience, and knowledge• Finding answers• Developing recommendations at each GPS step• Executing implementation actions
Team leader. The team leader is the individual responsible for guiding teammembers through the GPS process. This person has leadership and inter-personal skills:
• Lead the teams to complete each GPS objective• Develop agendas for meetings and team activities• Conduct meetings• Ask (generally does not answer) GPS process questions• Manage the team in accordance with established group effectiveness
guidelines• Support the champion as the primary point of contact
Recorder. The recorder is a team member who generates, holds, and publishesteam reports (such as meeting minutes, agendas, action plans, etc.):
• Control documents for the team• Tend to be an administrative support person for the team• Take responsibility for creating and distributing meeting minutes and
reports in a timely manner
Facilitator. The facilitator’s primary task is to assist the team with interpersonalrelationship issues such as resolving conflict, arriving at consensus (whenappropriate), confronting counterproductive group behaviors, etc. The facil-itator’s role is optional. The facilitator:
• Works with the team to resolve conflicts• Shows team members how to work together while maintaining indi-
vidual self-esteem• Coaches individual team members, the leader, and the champion on
how to be more effective in group situations• Helps the team develop group effectiveness guidelines• Provides feedback to the team on group performance behaviors
SL3100_frame_C05 Page 80 Friday, August 31, 2001 10:14 AM

The Global Problem Solving Process 81
• Helps the team apply techniques such as decision-making and creativeprocesses, etc., but is neutral in decision-making situations
Process guidelines. The purpose of GPS1 is to form and develop the teamwith the required experience for the GPS process. During GPS1, goals,roles, and responsibilities are developed and defined. Specific questionsmay be found in Appendix C.
• The type of problem usually defines required experience and skills and,therefore, who should be on the team.
• All members must contribute, use their experience, and help gather facts.• Team members may change as the team’s required experience changes.
An ideal team size is about seven, generally, but not necessarily, rang-ing from four to ten members.
• Team positions include leader, recorder, members, and facilitator.• The roles of persons on a GPS team are interdependent. No one person
can do it by himself/herself.• The champion owns the problem, supports the team’s efforts, uses
authority and influence to help the team with organizational barriers,and helps get resources needed by the team to complete each GPS step.
• The entire GPS team works with the champion’s help, involvement,and agreement.
• The champion should conduct the first meeting to describe what isneeded, why the problem needs to be resolved, and to outline what isexpected of the team.
• The leader is expected to lead the team, not have all the answers.Critical competencies for the leader are people-management and lead-ership skills.
• In GPS1, there are more questions than definitive answers about theproblem. This is normal. Better data regarding the problem will becreated as the team progresses through the GPS process. In GPS1, theteam members, the champion, and others are selected using the bestcurrently available information.
SL3100_frame_C05 Page 81 Friday, August 31, 2001 10:14 AM

82 Six Sigma and Beyond: Problem Solving and Basic Mathematics, Volume II
GPS2: DESCRIBE THE PROBLEM (FIGURE 5.4)
Background:
Purpose. Describe the internal/external customer problem by identifying “whatis wrong with what?” and detail the problem in quantifiable terms.
Review the common tasks. Tasks that need continual consideration throughoutthe problem identification process:
1. Document the changes.2. Review team composition.3. Review measurable(s).
FIGURE 5.4 An overview of GPS2.
Input: Teamestablished
Review available data
Go to GPS0.Application
criteria step foreach symptom
Can symptom besubdivided?
Does problemdescribe a
“somethingchanged”situation?
Does problemdescribe a
“never beenthere”
situation?
State symptom as anobject and a defect.
Use alternativemethods such
as DOE,process
improvementapproaches,innovation.
Document problem statement.
Is the “real” causeknown? (repeated whys)
Initiate development of problemdescription (Is/Is Not).
Identify process flow.
Identify additional data required.
Collect and analyzeadditional data.
No
Yes
Yes
No
No
Supplement GPSprocess with
alternative methods.
Review problemdescription with
customer andaffected parties.
OUTPUTProblem
description.
Use alternativemethods.
Yes
SuspendGPS
No
Use GPSprocess.Yes
No
Yes
No
Yes
SL3100_frame_C05 Page 82 Friday, August 31, 2001 10:14 AM

The Global Problem Solving Process 83
4. Determine if a service action is required.5. Review assessment questions.6. Update the GPS report.
Overview to define the “problem.” The word problem may refer to a cause,concern, defect, or consequences of the defect’s occurrence. The wordproblem is too general a term. GPS2 makes a clear distinction between thecause and the effect. The function of GPS2 is to factually describe theproblem. In GPS terminology, the problem is a deviation from expectation,a special cause, a distribution within control limits that are too wide, orany unwanted effect where cause is not known.
Gathering factual data. The GPS process is a data-driven process. The focusof GPS2 is to obtain an accurate and unbiased description of the object anddefect. The information collected during GPS2 is critical to successfulproblem resolution. Historically, problem solving proponents have advo-cated that defects be described using either rationally based or experientiallybased techniques. Each approach has advantages and limitations. The GPSprocess advocates a synergistic approach to problem description. The resultis a factually based, team-generated, problem description.
Time well spent. The time spent in GPS2 is always recovered (many-fold) bythe time saved in subsequent GPS steps. Unfortunately, this feature of GPS2is not obvious until later in the process. Teams that quickly pass throughor skip GPS2 (and so do not adequately describe the problem) have solvedthe wrong problem.
The initial GPS2 step develops a problem statement which is then expanded bya factual listing of the problem’s profile. Critical features of the problem are madevisible using an accurate process flow diagram which depicts the entire process(including any existing informal fixes). This body of information is further enhancedby developing a complete cause-and-effect (fishbone) diagram. Supplemental,effect-specific techniques (often experienced-based) are useful.
GPS2 includes various types of reports and description approaches. Completingall these fact-gathering techniques may seem excessive. In reality, the synergismcreated by combining these techniques is of enormous benefit for GPS3 throughGPS7. Remaining objectives tend to be realized more quickly, more effectively, andwith far less frustration. A significant byproduct of this synergism is the positiveeffect on behaviors of the team members. Team members appreciate each member’sexperience, resist the tendency to jump to conclusions, and realize the benefits ofteamwork. The need for a leader remains, but the team is prepared to proceed froma complete and factual (not opinionated) foundation.
Process guidelines. The purpose of GPS2 is to define the problem for whichthe root cause will eventually be determined.
• GPS2 is not intended to determine the root cause. The information willbe used later (at GPS4) to determine the root cause.
SL3100_frame_C05 Page 83 Friday, August 31, 2001 10:14 AM

84 Six Sigma and Beyond: Problem Solving and Basic Mathematics, Volume II
• GPS2 is the observations collection step.• GPS2 establishes the data that is the foundation for all other GPS steps.• GPS2 demands the team develop:
– A problem statement– A problem description using Is and Is Not (what, where, when,
how big?)– A process flow diagram– A cause-and-effect diagram (also known as a fishbone diagram)
• The problem may also need to be defined using additional approaches(e.g., SPC data, customer satisfaction, and field reports).
• To complete GPS2, the team may need to obtain missing information.• Recommended attachments to the GPS Report at GPS2 include Is/Is
Not and the cause-and-effect diagram.• The team and champion use their judgment to determine how much
information is sufficient.• The process flow diagram should include the initial actions taken to
compensate for the problem when it first occurred.– Note all temporary or informal fixes on the process flow. Do not
remove them — just note them.– Start where the defect can be first seen; then work back from there
to the beginning of the process.• Use one GPS per problem. Do not use a single GPS on many different
problems. Each problem probably has a different root cause.
SL3100_frame_C05 Page 84 Friday, August 31, 2001 10:14 AM

The Global Problem Solving Process 85
GPS3: DEVELOP THE INTERIM CONTAINMENT ACTION (ICA) (FIGURE 5.5)
Background:
Purpose. Define, verify, and implement the ICA to isolate effects of theproblem from any internal/external customer until permanent correctiveactions (PCAs) are implemented. Validate the effectiveness of the contain-ment actions.
Review the common tasks. Tasks that need continual consideration throughoutdevelopment of the ICA process:
1. Document the changes.2. Review team composition.3. Review measurable(s).
FIGURE 5.5 An overview of GPS3.
InputProblem Description
Is ICArequired?
Evaluation ERA.
Identify andchoose the “best”ICA and verify.
ICAVerified?
Develop action plan,implement andvalidate ICA.
ICA validated?
Continue monitoringICA effectiveness.
OUTPUTICAs established.
Go to GPS4.No
Yes
No
Yes
No
Yes
SL3100_frame_C05 Page 85 Friday, August 31, 2001 10:14 AM

86 Six Sigma and Beyond: Problem Solving and Basic Mathematics, Volume II
4. Determine if a service action is required.5. Review assessment questions.6. Update the GPS report.
Overview. GPS3 is an optional step in the GPS process. Its purpose is to protectthe customer until the problem is resolved at GPS6. The customer is who-ever receives your output as their input. The customer could be internal tothe company as well as external. If the customer cannot accept the defect(s),then an ICA is required.
How an ICA works. An ICA is intended to protect the customer from theproblem because a root cause is not yet known. An ICA is a temporarymeasure. It is an added non-value operation. Commitment to completingthe GPS remains in force. An ICA is effective when, from the customer’spoint of view, the defect is no longer evident. ICAs are often compared to“quick fixes” or “hidden factories,” but containment actions are actually:
• Verified to work before implementation• Validation that the ICA is working after implementation• Validated independently, in addition to the customer’s confirmation of
effectiveness• Documented to exist (i.e., made visible) by amendments to the orga-
nization’s process flow diagrams, procedures, process instructions, etc.• Replaced by a PCA at GPS6• Implemented without creating other trouble downstream• Formal temporary fixes (Care is exercised to ensure that all support-
ing functional areas/departments are involved in planning andimplementation.)
• Implemented only with the clear approval of the champion andcustomer
• Managed through comprehensive planning and follow up
Another important feature of GPS3 is that prudence may require containment action(an ERA) before GPSl and GPS2 are completed. However, after GPS2 is completed,the emergency response action (ERA) should be reviewed. The GPS2 data maysuggest a more effective ICA (GPS3).
The champion’s authority over ICAs. An ICA should not be implemented bya team without the champion’s knowledge or involvement. A subtle butsignificant feature of the GPS process is that the authority to implement anICA is retained by the champion. It is not delegated to the team. Likewise,the champion is responsible for cross-functional communications. Someteam problem solving guidelines imply the team itself would assume thisresponsibility. The GPS process promotes action within the organization’schain of command. It does not promote creation of an artificial commandstructure which bypasses the normal authority structure.
SL3100_frame_C05 Page 86 Friday, August 31, 2001 10:14 AM

The Global Problem Solving Process 87
Process guidelines. The purpose of GPS3 is to protect the customer whiledetermining the cause of the problem. Steps and questions during GPS3include:
• Is a GPS3 step necessary?• If implemented, can the GPS0 ERA be improved?• Which action(s) is (are) best?• Choose the best containment action.• Will the containment action work (i.e., eliminate 100% of the problem
from reaching the customer)? (Verification)• Follow the management cycle.• Plan (in detail) the containment action(s) and verify.• Implement the containment action.• Record the results.• Evaluate the ICA. Did it work? (Validation)• Document the actions and communicate how to do them to all who
need to know.• Continue to monitor the effectiveness of the ICA throughout the time
it is in place.• The champion must be involved before the ICA is implemented and
during implementation.• ICA is the only optional step in the entire GPS process.• ICA is temporary, not permanent. It is costly, not cost effective. It is
containment, not mistake proof.• ICA works against the problem, not the root cause.• Costs increase while the ICA is used.• ICA may be done while other members of the team work on GPS4
(determining root cause).• ICA may require additional members to be added to the team to
complete all of GPS3.• ICA looks like a quick fix, but its actions are documented, later
removed, and checked for effectiveness. The team must ensure that theactions will not create other problems for departments and customersdownstream of GPS3 action(s).
• More than one GPS3 action may be required to fully protect thecustomer (internal or external).
• After GPS3, the team’s membership might change. This is true at allsteps.
• ICA may occur before GPSl or GPS2. If done before GPS2, then GPS3ICA should be reviewed after the GPS2 data are compiled. Better GPS2data may prescribe the need for an improved GPS3 ICA.
SL3100_frame_C05 Page 87 Friday, August 31, 2001 10:14 AM

88 Six Sigma and Beyond: Problem Solving and Basic Mathematics, Volume II
GPS4: DEFINE AND VERIFY ROOT CAUSE AND ESCAPE POINT (FIGURE 5.6)
FIGURE 5.6 An overview of GPS4.
SL3100_frame_C05 Page 88 Friday, August 31, 2001 10:14 AM

The Global Problem Solving Process 89
FIGURE 5.6 Continued.
SL3100_frame_C05 Page 89 Friday, August 31, 2001 10:14 AM

90 Six Sigma and Beyond: Problem Solving and Basic Mathematics, Volume II
Background:
Purpose. Isolate and verify the root cause by testing each possible cause againstthe problem description and test data. Also isolate and verify the place inthe process where the effect of the root cause should have been detectedand contained (escape point).
Review the common tasks. Tasks that need continual consideration throughoutthe root cause verification and escape point determination process:
1. Document the changes.2. Review team composition.3. Review measurable(s).4. Determine if a service action is required.5. Review assessment questions.6. Update the GPS report.
FIGURE 5.6 Continued.
SL3100_frame_C05 Page 90 Friday, August 31, 2001 10:14 AM

The Global Problem Solving Process 91
Overview. If a situation was once problem-free, but now is not, then thesituation is considered a change-induced condition. Identifying this changeis called problem solving. Various problem solving techniques exist. Theyare based on three basic strategies:
1. Fact-based, deductive approaches2. Experientially based approaches3. Creative approaches
A working knowledge of various problem solving techniques is desirable. The singleverified reason that accounts for the problem is the root cause. It is the cause thatexplains all the facts about the problem. The root cause is verified by its ability tomake the problem come and go.
Determining root cause. Information compiled at GPS2 is used to identify aset of possible causes. At GPS4, the root cause is discovered. Problemsolving techniques are used to reduce the time and confusion to systemat-ically deduce the cause. All subsequent GPS objectives depend on theaccurate diagnosis of the root cause. Therefore, verification of the rootcause is critical to the success of the GPS process. Few things are moredamaging to the problem solving process than assigning blame. Blamingleads to defensiveness and facts are obscured or kept hidden. Misinforma-tion is often generated as a defensive measure.
Process guidelines. The purpose of GPS4 is to determine the root cause andescape point of the problem. The root cause and escape point are onlyidentified and verified during GPS4s, but will be fixed at GPS6.
• GPS4 is a problem-solving step.• GPS4 uses information collected during GPS2.• Root cause is the single verified reason that accounts for the problem.• Escape point is the earliest location in the process, closest to the root
cause, where the problem should have been detected but was not.• Verification helps to make certain that PCAs are directed at the root
cause and escape point. Time, money, effort, and resources are notwasted on false causes.
• Band-Aids™ can mask information needed to find the root cause.Watch for Band-Aid™ fixes.
• Usually, the root cause is one change that caused the problem. Ifprevious problems were never fixed at the root cause level, then theproblem may be the result of more than one change.
• Use deductive reasoning (first) to identify the possible causes. If thismethod does not work (due to missing information), then use cause-and-effect diagrams and team members’ experience to pursue otherpossible causes.
• Root cause cannot be identified without facts. The Is/Is Not data mustbe correct and the process flow diagram must be correct and up to date.
SL3100_frame_C05 Page 91 Friday, August 31, 2001 10:14 AM

92 Six Sigma and Beyond: Problem Solving and Basic Mathematics, Volume II
• The root cause should explain all known facts about the problem.Unexplained facts often indicate the presence of another root causethat creates a similar problem. Ideally, the problem should be made tocome and go to prove the root cause has been identified.
• When the root cause is uncovered, other troubles (which have goneunnoticed) are sometimes made visible. These other troubles create theneed for an improved ICA in GPS3 and/or a return to GPS2.
Success factors. In order to ensure success, the following must be present inthe organization:
• Management must create the right climate.• Management must recognized the need to prioritize problems.• Management must actively support the problem solving process.• Management must be committed to a system to carry out corrective
actions.
Management creates the right climate by:
• Having patience for results• Providing practice time• Demonstrating interest — even when failure is experienced• Stating expectations clearly• Allowing for risk
Management sets priorities by:
• Continuously improving the system• Having realistic expectations in every respect• Providing the appropriate resources• Communicating the significance of the problem with the team and every-
one concerned with the specific problem
Management demonstrates interest by:
• Giving authority and responsibility to the appropriate individuals to carryout the assigned task
• Always reviewing progress of project and asking coaching questions• Making sure that the process defined is adhered to• Being an implementation advocate• Providing a system to retain the “gained” knowledge• Providing the appropriate resources
SL3100_frame_C05 Page 92 Friday, August 31, 2001 10:14 AM

The Global Problem Solving Process 93
GPS5: CHOOSE AND VERIFY PERMANENT CORRECTIVE ACTIONS (PCAS) FOR ROOT CAUSE AND ESCAPE POINT (FIGURE 5.7)
Background:
Purpose. Select the best PCA to remove the root cause. Also select the bestPCA to eliminate escape. Verify that both decisions will be successful whenimplemented without causing undesirable effects.
Review the common tasks. Tasks that need continual consideration throughoutthe PCA choice and verification process for root cause and escape point:
1. Document the changes.2. Review team composition.3. Review measurable(s).4. Determine if a service action is required.5. Review assessment questions.6. Update the GPS report.
FIGURE 5.7 An overview of GPS5.
SL3100_frame_C05 Page 93 Friday, August 31, 2001 10:14 AM

94 Six Sigma and Beyond: Problem Solving and Basic Mathematics, Volume II
Overview. The GPS process is applied to fix a problem at the root cause leveland prevent its recurrence. In change-induced conditions, the root cause(s)is introduced by a change. In an overwhelming number of cases, the changewas introduced by someone’s decision. At the time of the decision, theproblem was not anticipated. The GPS5 objective is designed to avoid asimilar sequence of events. The historical function of GPS5 is to make thebest decision on how to remove the root cause variable that created thedefect. Because a decision can potentially lead to other effects, the decisionneeds to be thoroughly examined before its implementation at GPS6. Cus-tomers and managers must be involved. The decision is first examined forboth benefits and risks. Then the decision is tested (verified) to ensure thatit will be successful when implemented at GPS6. The GPS5 objective endswith a commitment to full-scale implementation of this decision at GPS6.The decision-making process depends on the experience of the decisionmakers and the criteria that is applied. This is especially true during therisk analysis phase of the decision-making process. Experience is alsocritical to the verification segment of GPS5. Experience guides how veri-fication should be conducted and how much data are appropriate.
Champion’s commitment. The champion must be committed to the decision.The decision is typically based on a synthesis of the champion’s criteriaand the detailed experience of the team members.
Process guidelines. The purpose of GPS5 is to select the best PCA(s) toeliminate the root cause and escape point.
• More than one PCA may be required to resolve 100% of the problem.• The GPS5 decision is not implemented until GPS6.• Consider having risk analysis conducted by those who must implement
the corrective action.• Implied actions of GPS5:
– Check the composition of the team. Does the team have the rightexperience to make the decision(s)?
– Decide what is the best permanent corrective action.– Evaluate each choice from both its benefits and liabilities.– Test, if necessary, the decision to determine that the choice (action)
will, in fact, work.– If this PCA cannot be implemented quickly, will the GPS3 ICA last
long enough?– Get approval (through the champion) to proceed with the choice.
Implement the decision at GPS6.• Sometimes the best PCAs cannot be implemented due to cost, limited
resources, etc. Sometimes the root cause cannot be eliminated. In thesecases, the best decision is to continue using the GPS3 ICA. Thismeasure is a compromise, but sometimes it is the only resolution. Thisshould be considered an exception for GPS5, not the norm.
• Even if the above action is appropriate, GPS6, GPS7, and GPS8 shouldstill be completed.
SL3100_frame_C05 Page 94 Friday, August 31, 2001 10:14 AM

The Global Problem Solving Process 95
• Sometimes the best PCA will require time before implementation. Inthis case, the GPS3 ICA will continue until it is replaced by the GPS6PCA. The GPS process permits a redesign of the ICA. This redesignedICA might be more effective and less costly than the initial GPS3 ICA.
• During GPS5 verification, the presence/evidence of another root causewhich was not discovered during GPS4 may be uncovered. This isindicated when the verified PCA does not remove 100% of theunwanted effect.
GPS6: IMPLEMENT AND VALIDATE PERMANENT CORRECTIVE ACTIONS (PCAS) (FIGURE 5.8)
Background:
Purpose. Plan and implement selected PCAs. Remove the ICA. Monitor thelong-term results.
FIGURE 5.8 An overview of GPS6.
SL3100_frame_C05 Page 95 Friday, August 31, 2001 10:14 AM

96 Six Sigma and Beyond: Problem Solving and Basic Mathematics, Volume II
Review the common tasks. Tasks that need continual consideration throughoutthe PCA implementation and validation process:
1. Document the changes.2. Review team composition.3. Review measurable(s).4. Determine if a service action is required.5. Review assessment questions.6. Update the GPS report.
Overview. In GPS5, the PCA was chosen and verified. In GPS6, the PCA isimplemented and the problem is corrected. In GPS6, the team is responsiblefor detailed planning, implementation, and evaluation.
Cross-functional participation. One of the major responsibilities of the cham-pion’s authority is the requirement that the champion must authorize makingchanges to resolve the problem. Generally, even relatively minor changeswill require cross-functional participation. For example, changing thelength of a purchased bolt impacts the documentation of purchasing, qualityassurance, material control, inventory control, engineering, and productiondepartments. In this example, the champion might be the production depart-ment manager, but the production department still requires communicationand close coordination. Cross-functional involvement at GPS6 also meanscross-functional planning to implement the GPS6 correction. During GPS6,team membership may expand temporarily to facilitate complete planning.This planning may or may not require a group meeting, but some form ofcontact with other departments is essential for successful implementation.At a minimum, the existing team must identify who (in which department)needs to be involved in planning implementation of GPS6.
Removing the ICA. Embedded in GPS6 is removal of the GPS3 ICA. The ICAis no longer needed because the PCA removes the root cause variable.Continuing the ICA wastes important resources. Furthermore, the ICA hasmasked the problem, so validation of the GPS6 PCA would be questionable.GPS6 planning must account for when to terminate the GPS3 ICA and howto validate results of the GPS6 PCA. Technically, this validation is contin-uous and ongoing, but validation is likely to be more frequent at first,tapering off over time. In simple terms, the events of GPS6 are expressedby the model illustrated in Figure 5.9. The team members’ and champion’sactive involvement occur at each event, although the activities of each tendto be different.
Reflecting the PCA. The critical task of updating all documents, procedures,process sheets, etc. is too frequently overlooked. The GPS6 PCA fixes aproblem by making changes. If the PCA change is not documented in thenormal systems, practices, and procedures, then additional corrections willlikely be necessary. A problem recurs when someone uses an obsoleteinstruction. Related problems also occur, such as ordering obsolete parts
SL3100_frame_C05 Page 96 Friday, August 31, 2001 10:14 AM

The Global Problem Solving Process 97
or being unable to order needed parts, because they were not recorded onthe bill of materials in the material control system.
Process guidelines. The purpose of GPS6 is to implement the decision madeat GPS5.
• PCA implementation is done via management systems. They are notbypassed.
• The implied action of GPS6 includes:– Check the composition of the team. Is the needed experience on
the team?– The decision needs to be planned, implemented, monitored, and
evaluated for effectiveness.– Any changes implemented during GPS6 must be documented (for-
mally) in process flow sheets, procedures, practices, instructions,standards, spec sheets, etc. in the departments which maintain suchrecords or documents.
• The three minimum items for any action plan are what?, who?,when due?
• GPS6 requires detail-oriented, hands-on people to be involved in plan-ning GPS6 actions.
• The GPS process does not supersede an organization’s procedures toimplement process changes or customer approval processes.
• Some changes may require approval by the customer(s) before thechanges can be made.
• No changes should be made without the champion’s direct approval.• Some persons may require training before implementation of the GPS6
change because their procedures may be affected.• During GPS6, the GPS3 action should be stopped because the ICA is
no longer necessary. Continued GPS3 actions may mask a portion ofthe defect that is still present.
• GPS6 is not completed until the PCA is validated (the customer nolonger experiences the problem). Prudence dictates that validation
FIGURE 5.9 The events of GPS6.
SL3100_frame_C05 Page 97 Friday, August 31, 2001 10:14 AM

98 Six Sigma and Beyond: Problem Solving and Basic Mathematics, Volume II
should occur at some point before the customer can experience theproblem.
• Long-term monitoring is appropriate after the GPS6 PCA isimplemented.
• Failure to document the correction created by the GPS6 PCA willeventually reintroduce the root cause. Failure to document the PCAtypically results in overstocking obsolete parts and stock-outs ofneeded parts.
• Consider adopting the following statement as a normal GPS6: Flawlessimplementation of the PCA, where things work right the first time.
GPS7: PREVENT RECURRENCE (FIGURE 5.10)
FIGURE 5.10 An overview of GPS7.
SL3100_frame_C05 Page 98 Friday, August 31, 2001 10:14 AM

The Global Problem Solving Process 99
Background:
Purpose. Modify the necessary systems including policies, practices, andprocedures to prevent recurrence of this problem and similar ones. Makerecommendations for systemic improvements, as necessary.
Review the common tasks. Tasks that need continual consideration throughoutdetermination of the GPS process to prevent recurrence:
1. Document the changes.2. Review team composition.3. Review measurable(s).4. Determine if a service action is required.5. Review assessment questions.6. Update the GPS report.
Overview. GPS7 is frequently cited as perhaps the most important step of theGPS process. During GPS7, the root cause of the GPS4 root cause is fixed.Behind every change that creates the need to do a GPS is at least onesystem, practice, or procedure that introduced the change. If the system,practice, or procedure remains the same, the same or a similar problemcausing change will be reintroduced. This can and should be prevented.
The following are some of the reasons why GPS7 is not always completed.Being aware of these reasons helps to identify steps an organization needs to taketo combat them.
Factors that inhibit completion of GPS7:
• GPS7 is not even attempted: After the problem is corrected, otherpriorities receive more attention.
• GPS7 develops into a blame session: Rather than focus objectively onwhat happened, attention drifts to who did/did not do something.Defensiveness sets in and objective review stops.
• The GPS process stopped at GPS3 containment: The root cause wasnever found. Prevention of the root cause is impossible because itremains unknown.
• The GPS process was never done: Someone penciled in a form thatbecame an GPS Report.
• Politics: Fixing systems is a low priority because it requires risking(forcing) a change.
• Fear: People perceive/know that spotlighting defective/inadequate sys-tem practices and procedures will result in reprisal.
• Not enough structure/authority: The champion is too low in the orga-nization’s power structure to implement necessary system revisions.Furthermore, this champion is unable to solicit involvement of thosewho do have the authority.
SL3100_frame_C05 Page 99 Friday, August 31, 2001 10:14 AM

100 Six Sigma and Beyond: Problem Solving and Basic Mathematics, Volume II
• Those who own the system(s) do not have to live with the conse-quences: The organization is unwilling to create consequences at theproper points of systems management.
• Systems maintenance and management is a low priority: Activity ismore important than prevention. Process control is not understood.
Basic questions. Some of these issues obviously exceed the scope of onechampion’s authority. However, they can be corrected. Some take consid-erable effort and time. The first step of any GPS7 objective is to accuratelyidentify (at least) the cause of the root cause — the system, process, etc.which introduced the root cause. This much the champion can prompt withthe team’s understanding of the first six objectives. GPS7 often requiresbringing together all former team members to answer two questions:
1. What went wrong to introduce the root cause in the first place?2. What needs to be fixed, modified, or reinforced to prevent it from
happening again?
GPS7 also implies opportunities, including the chance to suggest what a good systemshould look like and to identify places where a defect might be created.
The champion’s options in GPS7. Three paths may be followed after thesystemic issues are identified:
1. The champion uses his/her authority to correct the system, practice, orprocedure.
2. The champion takes the recommendation for systemic changes to thosewho have the authority to change the system, etc.
3. The need for systemic changes is acknowledged, but the organizationchooses to actively monitor the day-to-day operation of the system.This is done to better understand the whole system, rather than over-react to a single incident. Other GPSs might also be reviewed forrecommendations and observations of the system’s shortcomings.
A word of caution, however, is that the GPS process requires input at GPS7.The champion retains 51% of the vote. GPS7 does not dictate that the championimplement every recommendation. However, the champion works against his/herown best interest if ideas are discounted without serious consideration.
Process guidelines. The purpose of GPS7 is prevent recurrence of this rootcause and escape point.
• Approximately 95% of all root causes are introduced because of aprocedure, practice, instruction, or management system malfunction.
• These systems may have been ignored, they may have never workedinitially, or they may be too cumbersome or obsolete.
SL3100_frame_C05 Page 100 Friday, August 31, 2001 10:14 AM

The Global Problem Solving Process 101
• If the system is not fixed, it will create a similar kind of problem and/oranother root cause.
• Typically, the team is best able to identify the details of the systemicproblem.
• The team is chartered with both the responsibility and the authority toprovide feedback to management (through the champion) as to whichsystems contributed to the root cause and escape point.
• The team members draw from all the knowledge and experience gainedfrom the first six steps. The champion may have to take this informationto other areas within management to implement systemic recommen-dations because he/she may not have full authority to make changesas recommended.
• Not all team-identified prevent actions and systemic recommendationswill be the best and they should not be implemented. However, infairness to the team, reasons why these will not be implemented shouldbe communicated.
• If the team has skill, experience, and knowledge, the champion canask members to design and implement their preventative actions. If theteam does not have skill, etc., then the champion will request that otherareas of the organization design and implement the change(s).
• GPS7 works best when the people who use the systems have a handin the changes. Think in terms of simple, easy, and quick systemredesign. Usually, adding more words or instructions only adds toconfusion rather than removing it.
• GPS7 is best achieved by a face-to-face review between the championand the team.
• Team members should recognize that the champion may have to reflecton their recommendations before being able to suggest or approvechanges.
• The team should follow the format of observation first and recommen-dation second in the presentation to the champion.
• The team and champion should avoid creating a blame session.• Sometimes the systems that contributed to the root cause are so large
that no one individual in an organization or company owns all parts ofthat system, e.g., cost accounting systems, order entry systems, etc.may require a separate task force designated by the company to rede-sign them.
• The champion and team require cooperation and objectivity from eachother and from the rest of the organization to make GPS7 a success.
• The champion’s reputation and actions often precede him/her in theGPS7 face-to-face phase. Most teams will only put as much effort intothe GPS7 steps as they believe the champion will support.
• It is not uncommon for team members to feel threatened at GPS7.Therefore, the champion must communicate, before GPS7, his/herinterest in receiving legitimate feedback on systems, practices, and
SL3100_frame_C05 Page 101 Friday, August 31, 2001 10:14 AM

102 Six Sigma and Beyond: Problem Solving and Basic Mathematics, Volume II
procedures. The champion must be careful to not create unrealisticexpectations.
• The team needs to realize that champions often do not know every detailand consequence of all the systems, practices, and procedures they areexpected to manage. This is the team’s opportunity to objectively (notemotionally) point out flaws in day-to-day operations in procedures.
• The leader may have to point out that most GPS7 actions make lifeeasier in the workplace, not more difficult.
• Use of the “repeated why?” method is an effective technique duringGPS7. However, it may also be very frustrating for those trying toanswer it. Use it carefully.
GPS8: RECOGNIZE TEAM AND INDIVIDUAL CONTRIBUTIONS (FIGURE 5.11)
Background:
Purpose. Complete the team experience, sincerely recognize both team andindividual contributions, and celebrate.
FIGURE 5.11 An overview of GPS8.
SL3100_frame_C05 Page 102 Friday, August 31, 2001 10:14 AM

The Global Problem Solving Process 103
Review the common tasks. Tasks that need continual consideration throughoutthe recognition process:
1. Document the changes.2. Review team composition.3. Review measurable(s).4. Determine if a service action is required.5. Review assessment questions.6. Update the GPS report.
Overview. GPS8 is an important step. At the very least, it is a clear messagefor everyone to return to their full-time job. GPS8 says to everyone thatthe task team is now disbanded and no further study of this concern isjustified. More importantly, GPS8 is a way for the organization to providefeedback to those who did the work (GPS1 through GPS7).
• How the message is conveyed to the team is almost as important asthe message itself. It should be fit, focused, and timely. Recognitionat GPS includes noting the team’s contribution and efforts at all earliersteps. If recognition is omitted, team members interpret that theircontributions were not valued. If the GPS process was not implementedusing people, GPS8 could be left out.
• Volumes have been written on recognition — the need for it, how todo it, and how to do it well. This brief section is not an attempt torepeat or condense them. A more complete consideration of the subjectis well advised, but a few highlights are helpful.
Recognition.
• Encourages a repeat of the behavior• Works best when it is perceived to be sincere• Is expected when extra effort has been expended• Does not have to be expensive in dollars, but does require investment
in time: time to find out exactly what was done, time to express therecognition (personal time) etc.
• Is situational• Works best when the method of recognition is unique, a bit of a
surprise, and considered valuable (Value does not mean money. Oftenvalue means personalized, customized.)
• Recharges a person’s battery (It feels good. People tend to do thingsfor which they are recognized.)
• Several people can benefit from recognition: team members, the team’sleader, former team members who were released from the team, andthe recorder and facilitator (Each provided important services andmade contributions. Recognition is a way to encourage future partic-ipation. The more effectively recognition is used, the better the orga-nization’s results.)
SL3100_frame_C05 Page 103 Friday, August 31, 2001 10:14 AM

104 Six Sigma and Beyond: Problem Solving and Basic Mathematics, Volume II
Process guidelines. The purpose of GPS8 is to recognize the contributionsmade to the company or department by the GPS team.
• There is a difference between recognition and reward. Either or bothcan be used at GPS8.
• The responsibility for recognition is the champion’s. However, legiti-mate recognition opportunities exist between team members, the leaderand the team, the team and the champion, etc.
• Messages about organizational values are communicated to the rest ofthe organization by the GPS8 action. Failure to conduct GPS8 alsosends a message throughout the organization.
• Care must be taken that the GPS8 action is commensurate with thecontribution of that GPS team.
• Care must be taken that the GPS8 action is perceived by the teammembers to be a legitimate and sincere acknowledgment of their efforts.
• It is recommended that variety and creativity be applied in identifyingwhat the champion’s GPS8 actions are. Additional guidelines for suc-cess include:– Fit– Focus– Timeliness
• The action should fit the contribution of the team. Verbal recognitionshould focus (accurately describe) the team’s actions and contributions.The actions should also be completed in a timely manner.
• Make certain all members, both present and past, are included duringGPS8.
• GPS8 is an opportunity to encourage certain behaviors and actions. Ifthe team’s contributions at Steps GPS5, GPS6, and GPS7 are notacknowledged, then the team would rightly presume that these actionsdo not matter.
• If GPS8 actions are consistently the same and predictable, the GPSprocess will be perceived as another lip-service program. Generallyspeaking, people look for some legitimate, personal involvement of thechampion for the GPS step to be interpreted as sincere recognition.
REFERENCES
Deming, W. E., Quality, Productivity and Competitive Position. 1982. Boston, MA: MIT.Ford Motor Co., Team Oriented Problem Solving. (September 1987). Dearborn, MI: Ford
Motor Company/Power Train.Oliver, L. R. and Springer, M. D., A General Set of Bayesian Attribute Acceptance Plans.
American Institute of Industrial Engineers, Technical Papers, 1972.Orsini, J., Simple Rule to Reduce Total Cost of Inspection and Correction of Product in State
of Chaos, Doctorate dissertation, Graduate School of Business Administration, New YorkUniversity, 1982. Ann Arbor, MI: University Microfilms.
SL3100_frame_C05 Page 104 Friday, August 31, 2001 10:14 AM

The Global Problem Solving Process 105
Schafer, R. E., Bayesian Operating Characteristic Curves Reliability and Quality SamplingPlans. Industrial Quality Control, 14:118–122, 1967a.
Schafer, R. E., Bayes Single Sampling Plans for Attribute Based on the Posterior Risk. NavalResearch Logistical Quarterly, 14:81–88, 1967b.
SL3100_frame_C05 Page 105 Friday, August 31, 2001 10:14 AM

SL3100_frame_C05 Page 106 Friday, August 31, 2001 10:14 AM

107
Six Sigma Approach to Problem Solving
Volume I emphasized the importance of project selection and evaluation. This chap-ter will give an overview of what is required in the project based on 4 weeks oftraining and considerations from a problem solving perspective. An overview forthe DFSS (design for six sigma) problem solving process will also be given.
OVERVIEW
The life blood of the six sigma initiative in any organization is the “project.” Howone handles this project is the difference between success and failure. So “handling”is obviously the approach that one takes to resolve the problem identified as a“project.” A schematic overview of the project skills is illustrated in Figure 6.1.
Specifically, under planning the requirements of the project the focus is on the“what,” “who,” “how,” “when,” and “how much.” “What” is what the customerwants, translated into the project work breakdown structure. The more precise thedefinition of “what” is, the higher the probability of success will be. “Who” is whatthe organization is willing to do in allocating resources to complete the project.Another way to understand this is to think of it as a task/responsibility matrix.“How” is the technical requirements that will meet the “what” of the customer.“How” is very critical to the project because if there is no relationship between theproject and the customer’s expectations, there will be a mismatch in expectations.“When” defines the schedule of the project using the tools of project management(typical examples may be the networking chart, a Gantt chart, etc.). Finally, “howmuch” defines the best cost/benefit for every one concerned through estimates ofthe outcome of each alternative.
For uncertain events, concern is with the level of risk involved and whether ornot that risk — as identified — is properly executed and documented. Areas ofconcern are
Risk planning,
which defines• Requirements• Responsibilities
6
SL3100_frame_C06 Page 107 Friday, August 31, 2001 10:15 AM

108
Six Sigma and Beyond: Problem Solving and Basic Mathematics, Volume II
• Operational definitions• Resources• Procedures
Risk assessment,
which defines• Risk events• Analysis• Update assessments• Document findings
Risk handling,
which defines• Mitigation tasks for completion• Metrics• Report
Risk monitoring,
which defines• Metrics• Track status• Report
For the process improvement stage, concern is with systems engineering in thesense that the requirements cascade throughout the system. Issues in the “project”phase of the six sigma methodology are
• Requirement analysis (RA)• Functional analysis/allocation (FA)• System analysis and control (SA)• Verification (V)• Synthesis (S)
There is a continuing loop between RA and FA to optimize and understand therequirements. Also, there is a continuing loop between FA and SA, as well as FAand S to make sure there is balance and control, as well as optimum design,respectively. Finally, there is a continuing loop between S and RA to verify therequirements and the design.
FIGURE 6.1
Overview of project skills.
Facilitating the project
Production andinventory planning
– Resource plans– Production– Scheduling
Uncertain events
– Forecasting– Mitigating
Process Improvement
– Problem solving– Systems learning
SL3100_frame_C06 Page 108 Friday, August 31, 2001 10:15 AM

Six Sigma Approach to Problem Solving
109
Now that an overview of the process has been given, let us get closer to projectexpectations. The project’s analysis will follow the 3 weeks of traditional trainingin any six sigma program. For the first week of training, the participants are expectedto come with a preliminary project selected. The following is based on the firstweek’s input.
FIRST WEEK’S PROJECT: STRUCTURE THE PROJECT — GOALS, OBJECTIVES, AND SCOPE
W
HAT
Y
OU
W
ILL
D
O
Using established business goals and objectives, determine the
• Project objectives• Project route map• Project scope (Document logical, organizational, and deliverable scope.)
W
HY
Y
OU
W
ILL
D
O
I
T
The success of a project is measured by its ability to meet its goals. Clearly definedproject objectives should support the organization’s business goals and objectives.That is where the operational definition comes into play. The more exact and precisethe definition is, the better the project will be. At this stage, as project definitionbecomes more defined, identify a route map to establish the deliverables and tasksrequired to meet the objectives of the project.
Defining the scope of a project is somewhat like keeping a tarp down in thewind. The more stakes that are driven into the ground to pin the tarp down, thebetter. If the scope is clearly defined, success in managing the project and achievingproject goals and objectives is more likely.
H
OW
Y
OU
W
ILL
D
O
I
T
Translate established business goals and objectives into project objectives and scopeby completing the following:
• Review introduction and background materials regarding the project.Define the project objectives that will support some of the businessobjectives.
• Review excerpts from the methodology and make sure that they arefeasible.
• Logical scope: Identify candidate subprocesses affected by the project.• Organizational scope: Identify the organizations affected as well as the
personnel.
W
HAT
Y
OU
W
ILL
B
RING
B
ACK
Be prepared to present:
SL3100_frame_C06 Page 109 Friday, August 31, 2001 10:15 AM

110
Six Sigma and Beyond: Problem Solving and Basic Mathematics, Volume II
• Candidate project objectives and the business objectives they support• Logical and organizational scope• “First-cut” deliverables chosen from candidate route map phases
Based on project identification, how does problem solving interact? In this phase,focus is on the
define
portion of the
D
MAIC model. In other words, identify thecustomer, define their needs, specify deliverables, identify the CTQs, map the pro-cess, and link the CTQs. The tools used in this phase are primarily brainstorming,check sheets, cause-and-effect diagram, histogram, quality function deployment,surveys, focus groups, interviews, process flow chart, cause-and-effect matrix, andcorrelation.
SECOND WEEK’S PROJECT: STRUCTURE THE PROJECT — PRODUCT-BASED ESTIMATING
After the first week’s input, the initial project charter (IPC) was updated to includeproject goals and objectives and project scope. Also, as a result of investigation, theY = f(x) has been identified and it is time to proceed with the next assignment whichis the
measure
and
analysis
phase of the D
MA
IC model. Now complete the IPC bycompleting the effort estimate and develop a stage-level project work plan andschedule. In preparation for the estimate, meetings were held with appropriatepersonnel and issues and concerns were reviewed/discussed. As a result of thesesessions, some estimating element assumptions were collected and documented ona project planning worksheet.
W
HAT
Y
OU
W
ILL
D
O
• Produce a product-based estimate using estimating templates.• Generate a stage-level work plan in the form of a Gantt chart.• Define the roles necessary to staff the project.
W
HY
Y
OU
W
ILL
D
O
IT
• When structuring a project, take the opportunity to question whether ornot the project should be undertaken (make a go/no-go decision). Aproduct level estimate and stage level project work plan help to make thego/no-go decision.
• Identify the roles required to force thinking about the skill sets requiredto complete the project and begin the process of obtaining the commitmentof key project staff.
W
HAT
Y
OU
W
ILL
B
RING
B
ACK
Be prepared to present a stage-level Gantt chart. The goal is to assess the feasibilityof this request and determine the approximate number of full time equivalent (FTE)resources required for the project. Include the following:
SL3100_frame_C06 Page 110 Friday, August 31, 2001 10:15 AM

Six Sigma Approach to Problem Solving
111
• Total number of hours of effort for each stage• Total number of FTEs for each stage• Recommended alternative ways to structure the project
H
OW
Y
OU
W
ILL
D
O
I
T
1. Complete the product-based estimating template. Total the effort for eachoutput deliverable.a. Review the project risk factors and determine the potential impact on
producing the deliverables. Make adjustments to the product estimatesas necessary and determine the total effort for each stage. Be preparedto discuss any assumptions made. Hints to make it go faster:• Make the assumption that the risks areas identified apply to all
deliverables in the stage to which that risk area may apply.• Assume that the roles chosen will be applied to all deliverables for
each stage.b. Estimate the overall duration (elapsed time) for each stage by adding
up the deliverables for each stage and applying the appropriate numberof FTEs based on the roles chosen. Adjust the duration of each stageby varying the number of FTE resources assigned. Document theapproximate number of FTEs.
c. Sketch a rough stage-level Gantt chart for the project showing efforthours, total FTEs, and the numbers of each role for each stage and beprepared to present the results to the champion of the project or anyoneelse with ownership.
2. Develop an organization chart comprised of the project roles to beincluded in the project. This does
not
have to include the name of theperson who will be in that role.
At this stage, focus is on establishing capability and prioritizing the improve-ment. Of specific importance are
• Select a key product• Create a product tree• Define a performance variables• Create a process map• Measure performance variables• Establish performance capability analysis• Select performance variable• Benchmark performance metric• Discover best-in-class performance• Conduct gap analysis• Identify success factors• Define performance goals
The tools and techniques used primarily in this phase are benchmarking, processflow chart, gauge repeatability and reproducibility (R & R), gap analysis, product
SL3100_frame_C06 Page 111 Friday, August 31, 2001 10:15 AM

112
Six Sigma and Beyond: Problem Solving and Basic Mathematics, Volume II
tree diagram, FMEA, run charts, check sheets, sampling and stratification, Xbar andR chart, Xbar and S chart, ANOVA, C
p
and C
pk
, box plots, DPMO based on attributecharts (P, NP, C, and U), Pareto chart, histogram, and scatter plot.
THIRD WEEK’S PROJECT: CONTROL THE PROJECT
At this stage of the project, some of the preliminary requirements such as capabilityissues, goals, priorities, and best-in-class categories have been completed. Now enterinto the
improvement
and
control
phase of the DMA
IC
model. Focus in this phaseis on identifying causes and implementing controls. Specifically, they are
• Select a performance variable• Diagnose variable performance• Propose causal variables• Confirm causal variables• Establish operating limits• Verify performance improvement• Select a causal variable• Define control system• Validate control system• Implement control system• Audit control system• Monitor performance metrics
W
HAT
Y
OU
W
ILL
D
O
Experience will be gained with project management techniques: monitoring activity(determine project status), managing issues (resolve project issues), and managingscope.
W
HY
Y
OU
W
ILL
D
O
I
T
An ongoing project results in many interrelated issues and problems which requireclose monitoring. It is necessary for the “black belt” (project manager) to have theability to assess the status of the project and determine the cause of variances fromproject plans. This person must then choose appropriate alternatives for correctiveaction where necessary.
H
OW
Y
OU
W
ILL
D
O
I
T
• Review time schedules.• Review the appropriateness of tools and techniques used.• Review scope, objective, and results of the project.• Review the things gone wrong (TGW) and determine problems with the
project (if, indeed, there were any) and identify actions in the form of (1)issues, (2) change requests, and (3) plan adjustments.
• Review the things gone right (TGR) and monitor the process.
SL3100_frame_C06 Page 112 Friday, August 31, 2001 10:15 AM

Six Sigma Approach to Problem Solving
113
W
HAT
Y
OU
W
ILL
B
RING
B
ACK
Prepare a brief critical comment (one paragraph) on the current status of the project,including:
• Which week appeared to be a turning point? Was it a turning point forbetter or for worse?
• Based only on the data available, what appears to be the underlyingproblem? How was it solved?
• What additional information would be sought to determine if there areother underlying problems?
• Establish at least three issues associated with the project and its currentstatus.
Also include
• A record of the action plans for resolution of each issue.• A brief description of change requests, if any, that are necessary to get
the project back on track.
The tools and techniques used primarily in this phase are FMEA, project man-agement, brainstorming, payoff matrix, Kano model, DOE, pilot study, validationof baseline capability, process mapping for the “should be” process, cost/benefitanalysis, validation study, long-term measurement system analysis (MSA), mistakeproofing, control plan reaction plan, and appropriate control charts.
DESIGN FOR SIX SIGMA (DFSS)
The process for designing six sigma (see Volume VI) is based on:
• Definition• Characterization• Optimization• Verification
The
design
process is quite different than the traditional six sigma (SS)
approach
because the traditional DMAIC model focuses on
elimination
of the waste, whereasthe design for six sigma (DFSS) is focused on
prevention
of the defect. In thedefinition stage, the attempt to capture the voice of the customer is made in sucha way that selection of Y is critical to the customer and then progressively decom-poses the Y to Y
1
to y to y
1
and so on as well as decomposing the f(X) in a specificdefinition of X to X
1
to x to x
1
and so on, until a complete understanding ofcustomer requirements is accomplished and the appropriate operational definitionshave been defined.
In the characterization stage, two items are emphasized: measure and analysis.In the measure phase, these items are of concern:
SL3100_frame_C06 Page 113 Friday, August 31, 2001 10:15 AM

114
Six Sigma and Beyond: Problem Solving and Basic Mathematics, Volume II
• Select a key product.• Create a product tree.• Define performance variables.• Create process map.• Measure performance variables.• Establish performance capability.
In the analysis phase, these items are of concern:
• Select performance variables.• Benchmark performance metric.• Discover best-in-class performance.• Conduct gap analysis.• Identify success factors.• Define performance goal.
In the optimization stage, improving and controlling the design are the predom-inant factors. This is done through a reliability analysis which incorporates thechange concept, strengthening the design, performing parameter design experimen-tation, and ultimately tolerance design experimentation. Perhaps the most crucialpoint to experimentation in this stage is projection of the most probable point in agiven design. This is usually done with response surface methodology (RSM).
The optimization stage also calls for a cost/benefit analysis. This is done to besure that the proposed change is better than the status quo. An approach that maybe used for such an analysis is
• Layout the proposed process.• Identify where cost was removed from the process and where cost was
added if appropriate.• Sum the benefits as well as all the new costs for all alternatives identified.• Report costs/benefits by unit produced or time period (whichever is most
appropriate and applicable).
It is of the utmost importance for this cost/benefit analysis to be on the samemeasurable scale as the one initially done when the problem was identified. A goodexample is identification of DPMO. The way the opportunities are measured maygenerate a new number, but that number may be different than the original numberif the opportunities were not counted in the same way.
In the verification stage, verify the design not only to meet customer’s needs,wants, and expectations, but also to verify the integrity of the hardware to meet thedesign intent. To do this, design appropriate and applicable testing to be sure thedesign under consideration is “robust” and also to assess the design based onpredetermined scoring guidelines. In fact, it is these two characteristics that differsubstantially from the traditional six sigma approach. (Remember: six sigma is anapproach to problem solving using robustness thinking and statistical problem solv-ing techniques and evaluating process variation and measuring process capability.)
SL3100_frame_C06 Page 114 Friday, August 31, 2001 10:15 AM

Six Sigma Approach to Problem Solving
115
Typical advanced tools for DFSS are
• Monte Carlo simulation• Design of experiments — traditional and Taguchi (L
12
, L
18
, L
36
, and L
54
designs)• Axiomatic designs• Analytical reliability and robustness• TRIZ• Trade-off analysis• Pugh analysis
In the repertoire of the “black belt,” there are additional tools which are consideredto be quite advanced. In this chapter, some of the most common tools were listed;however, their explanation and application will be in Volumes III, V, and VI.
Chi square Analysis of varianceCross-tabulation tables Poison distributionRegression Response surface experimentPerformance tolerancing Full and partial factorialsTaguchi’s robustness Exponential distribution
t
-test F test
SL3100_frame_C06 Page 115 Friday, August 31, 2001 10:15 AM

SL3100_frame_C06 Page 116 Friday, August 31, 2001 10:15 AM

Part II
Basic Mathematics
SL3100_frame_C07 Page 117 Friday, August 31, 2001 10:16 AM

SL3100_frame_C07 Page 118 Friday, August 31, 2001 10:16 AM

119
The Value of Whole Numbers
Objective:
This chapter will demonstrate how to arrange whole numbers accordingto size.
Definitions:
1.
Place value:
the value of a position in a whole number2.
Whole number:
a number of whole objects being counted
Rule 1:
If two whole numbers have different place values filled, the one having themost places filled is larger.
Note:
The number in the place value farthest left must not be zero.
Example
:
Which is larger, 143 or 98?Answer: 143 because it has 3 place values filled; and 98 has 2 place values
filled.
What if the two numbers have the same number of place values filled?
Rule 2:
If two whole numbers have the same number of place values filled, thenumber having the largest number in the left-most place value is larger.
Example
: Which is larger, 701 or 598?Answer: 701 because 7 is larger than 5.
Example
: Which is larger, 86,943 or 91,043?Answer: 91,043 because 9 is larger than 8.
What if the two numbers have the same number of place values filled and theleft-most numbers in each are the same?
Rule 3:
If two numbers have the same number of place values filled and the left-most numbers are the same, then look at the second number from the left. If the
7
SL3100_frame_C07 Page 119 Friday, August 31, 2001 10:16 AM

120
Six Sigma and Beyond: Problem Solving and Basic Mathematics, Volume II
second numbers are the same, look at the third numbers, and so on, until there is adifference.
Example
: Which is larger, 913 or 945?Answer: 945 because 4 is larger than 1.
Example
:
Which is larger, 32,143 or 32,598?Answer: 32,598 because 5 is larger than 1.
Now, use the rules to arrange a group of numbers by size.
Example
:
Arrange the following numbers by size, with the the largest to theleft. Select the correct answer.
Answer: c [(c) and (d) are close until the third position; then 3,145 is largerthan 1,345].
EXERCISES
Directions:
Select the arrangement of numbers that is in order by size, with thelargest numbers to the left. If necessary, review the rules and exercises.
1,345 4,315 3,145 5,314
(a) 4,315 1,435 3,145 5,314(b) 3,145 1,345 5,314 4,315(c) 5,314 4,315 3,145 1,345(d) 5,314 4,315 1,345 3,145
1. (a) 1,763 3,176 6,713 7,316(b) 6,713 3,176 7,316 1,763(c) 7,316 6,713 3,176 1,763(d) 3,176 6,713 7,316 1,763
2. (a) 3,548 4,835 8,345 5,348(b) 8,345 5,348 4,835 3,548(c) 5,348 3,548 8,345 4,835(d) 4,835 8,345 3,548 5,348
3. (a) 7,216 6,721 1,762 2,671(b) 7,216 1,762 2,617 6,127(c) 7,216 6,217 2,167 1,672(d) 7,216 2,167 6,127 1,276
SL3100_frame_C07 Page 120 Friday, August 31, 2001 10:16 AM

The Value of Whole Numbers
121
Answers to the Exercises:
4. (a) 9,547 4,795 5,974 7,549(b) 9,547 7,549 4,795 5,974(c) 9.547 5,974 4,795 7,549(d) 9,547 7,549 5,974 4,795
5. (a) 8,241 4,281 1,842 2,841(b) 8,241 4,281 2,148 2,482(c) 8,241 4,281 2,841 1,284(d) 8,241 4,281 1,284 2,481
6. (a) 9,653 6,953 5,963 3,965(b) 9,536 6,953 6,963 5,965(c) 9,536 6,953 5,693 5,695(d) 9,653 3,953 5,693 3,596
7. (a) 8,754 7,584 5,874 4,875(b) 8,754 7,854 5,874 4,875(c) 8,754 8,854 5,784 4,875(d) 8,754 7,458 5,478 6,785
8. (a) 9,321 2,921 3,913 2,932(b) 9.321 3,921 2,391 2,392(c) 9,321 3,921 2,931 1,932(d) 9,321 3,921 1,139 2,293
9. (a) 85,430 85,403 85,304 85,434(b) 85,430 85,340 85,403 85,043(c) 85,430 85,403 85,340 85,304(d) 85,430 85,340 85,043 85,403
10. (a) 97,621 97,612 96,721 96,712(b) 97,612 97,621 96,721 96,712(c) 97,621 97,612 96,712 96,721(d) 97,612 97,621 96,217 96,127
1. c 2. b 3. c 4. d 5. c6. a 7. b 8. c 9. c 10. a
SL3100_frame_C07 Page 121 Friday, August 31, 2001 10:16 AM

SL3100_frame_C07 Page 122 Friday, August 31, 2001 10:16 AM

123
Addition and Subtraction of Whole Numbers
Objective:
This chapter will demonstrate how to add and subtract whole numbers.
Definitions:
1.
Applied problems:
problems written in words, about real life situations2.
Borrow:
a method used when subtracting numbers, where 10 is movedfrom one place value to the next lower place value
3.
Carry:
a method used in addition when groups of 10’s are moved fromone place value to the next higher place value
4.
One-place number:
a number having only a number in 1’s place5.
Two-place number:
a number having numbers in the 1’s place and the10’s place
6.
Sum:
the answer to an addition problem7.
Difference:
the answer to a subtraction problem
ADDITION
When working with quantities, there are times when quantities are made larger. Tokeep a record of these changes, it is necessary to know how to add numbers.
Rule 1:
To add numbers, the units — the tens, the hundreds, and so on, in that order— must be summed:
Units Tens Hundreds Thousands
(This is the sum.)
8
3
+ 5= 8--------
12
820------
123
54177---------
1,245
1231,368-------------
SL3100_frame_C08 Page 123 Friday, August 31, 2001 10:16 AM

124
Six Sigma and Beyond: Problem Solving and Basic Mathematics, Volume II
ADDITION EXERCISES
Directions:
Select the correct total (sum). If necessary, restudy the instructions andthe examples.
1.
(a)16 (b) 18 (c) 12 (d) 22
2. 8 + 1 + 3(a) 23 (b) 12 (c) 14 (d) 10
3.
(a) 13 (b) 18 (c) 27 (d) 21
4. 8 + 4 + 7 + 3(a) 22 (b) 36 (c) 14 (d) 25
5.
(a) 22 (b) 15 (c) 36 (d) 27
6. 3 + 2 + 8 + 7(a) 30 (b) 24 (c) 17 (d) 20
7. 8 + 7 + 3 + 6 + 9 + 1(a) 39 (b) 34 (c) 27 (d) 43
8. 4 + 6 + 0 + 1 + 8 + 3(a) 41 (b) 18 (c) 22 (d) 36
9.
(a) 143 (b) 118 (c) 240 (d) 160
10. 39 + 71 + 34(a) 235 (b) 206 (c) 218 (d) 144
7
5
+ 6-------
9
5
+ 7-------
6
5
8
+ 3-------
82
15
+ 63----------
SL3100_frame_C08 Page 124 Friday, August 31, 2001 10:16 AM

Addition and Subtraction of Whole Numbers
125
Answers to the addition exercises:
SUBTRACTION
This section will demonstrate how to subtract any number from any other numberthat is the same size or larger.
Definition:
The number 89 really means 8 tens and 9 ones, while the number 24means 2 tens and 4 ones. If 24 were subtracted from 89, the process would looklike this:
11.
(a) 1936 (b) 2015 (c) 1853 (d) 1992
12. 993 + 163 + 475(a) 1631 (b) 1805 (c) 2314 (d) 1436
13.
(a) 43,186 (b) 19,825 (c) 21,971 (d) 63,150
14.
(a) 18,410 (b) 27,443 (c) 19,318 (d) 22,176
15.
(a) 237,969 (b) 384,615 (c) 810,341 (d) 454,310
1. b 2. b 3. d 4. a 5. a6. d 7. b 8. c 9. d 10. d
11. d 12. a 13. c 14. d 15. a
803
415
+ 774--------------
5,413
1,854
8,470
+ 6,234------------------
9,345
8,465
1,903
+ 2,463------------------
54,643
18,459
70,213
+ 94,654---------------------
SL3100_frame_C08 Page 125 Friday, August 31, 2001 10:16 AM

126
Six Sigma and Beyond: Problem Solving and Basic Mathematics, Volume II
Rule:
A bottom number is subtracted from the one above it which is in the sameplace value. In other words, the bottom number is smaller than the top number.
Example
:
Answer
:
Now try another problem:
Caution:
When subtracting, the bottom number must be taken from the numberabove it. The order is important. In the example above, 9 cannot be subtracted from5, so borrow from the tens place. Look at the example below.
To review, revisit the process:
Example:
89
– 24----------
8 tens
– 2 tens6 tens
------------------
9 ones
4 ones5 ones = 65---------------------------
75
– 42----------
75
– 4233
----------
75
– 39----------
75
– 39
----------
7 tens
3 tens
--------------
5 ones
9 ones
---------------
76 tens
3 tenstens
----------------
5 ones10
9 onesones
-------------------
6 tens
3 tens3 tens--------------
15 ones
9 ones6 ones
------------------ 36=
75
– 39----------
7 5106
3 9""
------------------
61 5
–3 936
---------------
532
– 185-------------
SL3100_frame_C08 Page 126 Friday, August 31, 2001 10:16 AM

Addition and Subtraction of Whole Numbers
127
One 10 or 10 is borrowed from the 10’s place and addedto the 1’s place.
Now subtract 5 from 12 in the 1’s place.
One 100 or ten 10s are borrowed from 100’s place and
added to the 10’s place.
Now subtract 8 from 12 in the 10’s place
Subtract 1 from 4 in the 100’s place.
Answer:
The final answer is
347
.
Example:
There can be no borrowing from the 10’s place. So borrowone 100 from the 100’s place to get 10 in the 10’s place.
Now borrow 10 from 10’s place and add to 2 in the 1’splace.
Now subtract in each column.
Answer:
The final answer is
204
.
APPLICATION OF ADDITIONAND SUBTRACTION
This section will begin the demonstration of how to find answers to applied math-ematics problems using addition or subtraction.
52312
– 1 8 5------------------
5 212
– 1 8 57
------------------
54 21 21
– 1 8 57
-------------------
41212
– 1 8 547
------------------
41212
– 1 8 5
3 4 7------------------
302
– 98----------32 102
– 98-------------
32 109 21
– 98-----------------
32 109 21
– 98204
-----------------
SL3100_frame_C08 Page 127 Friday, August 31, 2001 10:16 AM

128
Six Sigma and Beyond: Problem Solving and Basic Mathematics, Volume II
Directions:
The applied problems in this lesson will be done either by adding,subtracting, or both. In most word problems there are terms that indicate whetherto add or subtract.
Words that mean to
add
: sumandtotalplusincreased bycombined
Words that mean to
subtract
: differencedecreased byminustake awayless
There are some suggested steps to solve a word problem:
Step 1. Read the problem carefully at least two times.Step 2. Be sure to understand the question.Step 3. Be sure to understand all the information given.Step 4. Draw a picture of the problem if possible.Step 5. Look for key words that indicate whether to add or subtract.
Example:
If one machine made 832 parts and another machine made 750, howmany parts were made in all?
Answer:
Question: How many total parts were made?Given: Parts were made by two different machines.Key Word: “How many … in all” means to
add
:832 + 750 = 1,582
EXERCISES
Directions:
Find the answer to each of the applied problems. If necessary, restudythe instructions and examples.
1. If a man works 4 hours on Monday, 4 hours on Tuesday, 8 hours onWednesday, 8 hours on Thursday, and 2 hours on Friday, how many hoursa week does he work?(a) 20 (b) 22 (c) 26 (d) 18
2. If a man begins a trip with $325 and returns with $94, how much did hespend?(a) $420 (b) $231 (c) $218 (d) $196
SL3100_frame_C08 Page 128 Friday, August 31, 2001 10:16 AM

Addition and Subtraction of Whole Numbers
129
3. If plant A, which produces 125 cars a day, produced 35 cars more thanplant B, how many cars does plant B produce?(a) 140 (b) 120 (c) 90 (d) 160
4. Matt’s gas tank can hold 25 gallons. It took 19 gallons to fill it. Howmany gallons were left in the tank before the refill?(a) 6 (b) 8 (c) 7 (d) 5
5. The number of parts shipped to four cities were 2718, 1845, 5240, and973. What was the total of parts shipped?(a) 11,208 (b) 10,776 (c) 9843 (d) 11,316
6. A factory produced 485 fewer parts this month than it produced last month.This month the production was 1738 parts. How many parts were pro-duced last month?(a) 2223 (b) 1253 (c) 2433 (d) 1903
7. If a tire costs $54, how much would four tires cost?(a) $258 (b) $216 (c) $89 (d) $325
8. If an inventory showed 12,500 sheets of blue index, what would theinventory show after filling an order of 1700 sheets?(a) 9800 (b) 9250 (c) 10,800 (d) 10,070
9. How many miles did a family travel during a two-week vacation toFlorida? The distance to the Florida motel was 1475 miles and while inFlorida they drove 573 miles.(a) 2918 (b) 4304 (c) 2813 (d) 3523
10. The mileage reading before a trip was 17,843 and after the trip the readingwas 19,307. How many miles were traveled?(a) 1425 (b) 1382 (c) 1464 (d) 1275
Answers to the exercises:
ADDITIONAL EXERCISES
Directions:
Select the correct answer to each of the applied problems.
1. A paper counter read 2125 before starting a count. After counting paperfor a period of time, the counter read 5089. How many sheets were countedduring that period of time?(a) 7815 (b) 2635 (c) 2964 (d) 7214
1. c 2. b 3. c 4. a 5. b6. a 7. b 8. c 9. d 10. c
SL3100_frame_C08 Page 129 Friday, August 31, 2001 10:16 AM

130
Six Sigma and Beyond: Problem Solving and Basic Mathematics, Volume II
2. A truck delivered a load containing 53 cases of towels, 25 cases of toilettissue, and 80 cases of table cloths. What was the total of pieces delivered?(a) 135 (b) 158 (c) 215 (d) 169
3. Resistors hooked up in a series were 200,000 ohm, 15,000 ohm, 65,000ohm, and 150,000 ohms. What was the total resistance from the resistors?(a) 385,000 (b) 573,000 (c) 280,000 (d) 430,000
4. A new chair costs $135. The salesman told a customer that if he boughtthree chairs, the price would be reduced $85. How much would thecustomer pay for the three chairs?(a) $470 (b) $405 (c) $185 (d) $320
5. How many square yards of carpet are needed in the following rooms?• Two bedrooms, each with 35 square yards• A kitchen with 75 square yards• A living room with 185 square yards• A den with 90 square yards(a) 318 (b) 420 (c) 185 (d) 27
Answers to the additional exercises:
1. c 2. b 3. d 4. d 5. b
SL3100_frame_C08 Page 130 Friday, August 31, 2001 10:16 AM

131
Multiplication and Division of Whole Numbers
To add the same number many times would result in a long, difficult additionproblem. Multiplication is a shorter process to find the answer to this type of additionproblem. Similarly, subtraction of the same number many times would also be along process. Division is a shorter process used to solve a long subtraction problem.
Objective:
This chapter demonstrates the operation of multiplication and division ofwhole numbers.
Definitions:
1.
Carrying:
the method of putting part of a number into the next higherplace value
2.
Digit:
the single symbol used to represent a number which is less than10 (The ten digits used in this system are 0, 1, 2, 3, 4, 5, 6, 7, 8, 9.)
3.
Division:
a method used to tell how many times a number can be sub-tracted from a second number
4.
Dividend:
the number (total) being divided5.
Divisor:
the number being divided into the dividend or the number beingsubtracted from the total
6.
Multiples of ten:
any number that 10 will divide evenly (no remainder)7.
Multiplication:
a method used to add the same number many times8.
Product:
the answer to a multiplication problem9.
Quotient:
the answer to a division problem
MULTIPLICATION
The correct way to multiply two numbers of any size will be demonstrated, beginningwith a two-digit number times a two-digit number, e.g., 28
×
15, and then larger
9
SL3100_frame_C09 Page 131 Friday, August 31, 2001 10:17 AM

132
Six Sigma and Beyond: Problem Solving and Basic Mathematics, Volume II
numbers. When numbers such as 20, 300, and 4000 are multiplied by a 1-digitnumber, notice the number of 0’s in the answer.
The same number of 0’s are on the right side of the answer as there are in thenumber being multiplied. This information will be used in the method of multiply-ing, shown next.
New word:
Numbers such as 20, 200, 3000, and 40,000 are called
multiples of ten
(10).
Rule:
When a given number is multiplied by a multiple of 10, the steps are
1. Multiply the given number by the non-zero part of the multiple of 10.(The part left of the string of zeros.)
2. Add the same number of zeros to the
product
as are in the
multiple of ten.
Example:
4000
×
84
×
8 = 32Now add the (3) 0’s.
Answer:
32,000
Example:
50,000
×
35
×
3 = 15Now add the (4) 0’s.
Answer:
150,000
Start the method with examples.
Example:
Answer:
This really means
Now add
20
× 6120---------
300
× 61800------------
4000
× 624,000----------------
48
× 32
-----------
481
× 296
--------
482
× 301440------------
48 2×+ 48 30×-----------------------
96
+ 14401536
----------------
SL3100_frame_C09 Page 132 Friday, August 31, 2001 10:17 AM

Multiplication and Division of Whole Numbers
133
Example:
Answer:
Example:
Answer:
MULTIPLICATION EXERCISES
Directions:
Find the product of each of the problems. If necessary, restudy theexamples and instructions.
This really means
Now add
This really means
Skip 4532
×
0
(it is = to 0 and adds nothing to our answer)
Now add
1.
(a) 385 (b) 715 (c) 485 (d) 595
146
× 297
--------------
146 7 plus×146 90 plus×
+ 146 200×---------------------------------
13 46
× 71022------------
14 546
× 9013,140----------------
1146
× 20029,200----------------
1022
13,140
+ 29,20043,362
---------------------
4532
× 306--------------
4532 6 plus×4532 0 plus×4532 300×--------------------------------
43 15132
× 627,192
------------------
45323
× 3061,359,600------------------------
27,192
+ 1,359,6001,386,792
----------------------------
35
× 17-----------
SL3100_frame_C09 Page 133 Friday, August 31, 2001 10:17 AM
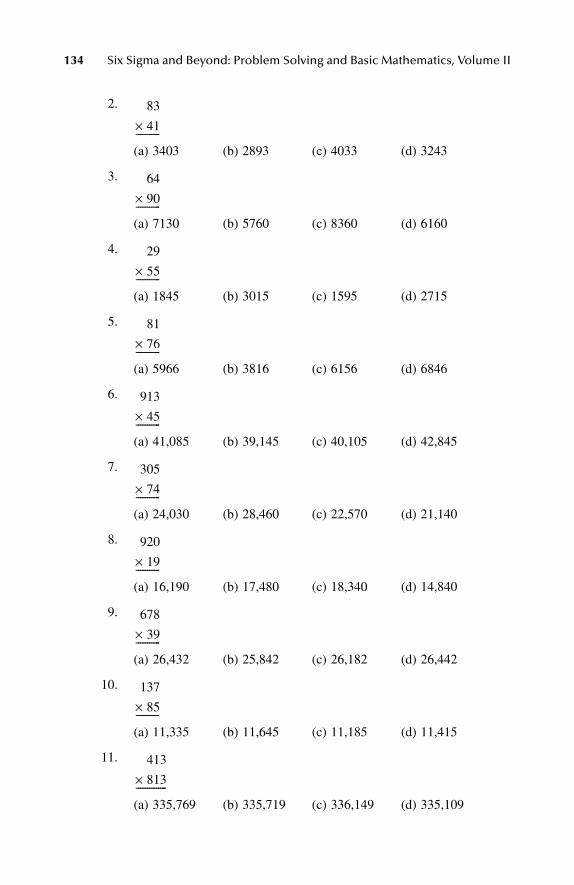
134
Six Sigma and Beyond: Problem Solving and Basic Mathematics, Volume II
2.
(a) 3403 (b) 2893 (c) 4033 (d) 3243
3.
(a) 7130 (b) 5760 (c) 8360 (d) 6160
4.
(a) 1845 (b) 3015 (c) 1595 (d) 2715
5.
(a) 5966 (b) 3816 (c) 6156 (d) 6846
6.
(a) 41,085 (b) 39,145 (c) 40,105 (d) 42,845
7.
(a) 24,030 (b) 28,460 (c) 22,570 (d) 21,140
8.
(a) 16,190 (b) 17,480 (c) 18,340 (d) 14,840
9.
(a) 26,432 (b) 25,842 (c) 26,182 (d) 26,442
10.
(a) 11,335 (b) 11,645 (c) 11,185 (d) 11,415
11.
(a) 335,769 (b) 335,719 (c) 336,149 (d) 335,109
83
× 41-----------
64
× 90-----------
29
× 55-----------
81
× 76-----------
913
× 45-----------
305
× 74-----------
920
× 19-----------
678
× 39-----------
137
× 85-----------
413
× 813--------------
SL3100_frame_C09 Page 134 Friday, August 31, 2001 10:17 AM

Multiplication and Division of Whole Numbers
135
Answers to the multiplication exercises:
ADDITIONAL MULTIPLICATION EXERCISES
Directions:
Find the product of each of the problems.
12.
(a) 85,644 (b) 85,144 (c) 87,844 (d) 86,044
13.
(a) 491,134 (b) 491,194 (c) 490,844 (d) 490,044
14.
(a) 5,581,388 (b) 5,580,848 (c) 5,580,188 (d) 5,581,888
15.
(a) 2,147,396 (b) 2,148,146 (c) 2,148,186 (d) 2,134,136
1. d 2. a 3. b 4. c 5. c6. a 7. c 8. b 9. d 10. b
11. a 12. a 13. b 14. d 15. b
1.
(a) 1985 (b) 2115 (c) 2045 (d) 1915
2.
(a) 2886 (b) 2846 (c) 2916 (d) 2938
3.
(a) 850 (b) 780 (c) 960 (d) 640
108
× 793--------------
538
× 913--------------
6709
× 832--------------
2849
× 754--------------
45
× 47-----------
81
× 36-----------
20
× 39-----------
SL3100_frame_C09 Page 135 Friday, August 31, 2001 10:17 AM

136
Six Sigma and Beyond: Problem Solving and Basic Mathematics, Volume II
Answers to the additional multiplication exercises:
DIVISION
Multiplication was described earlier as an easy way to add the same number manytimes. Division is an easy way to tell how many times a given number can besubtracted from a total. An explanation of some words and symbols now follows.
To divide 5 into 45 means to find how many 5’s can be subtracted from 45.
4.
(a) 1840 (b) 3030 (c) 3120 (d) 2920
5.
(a) 62,414 (b) 25,764 (c) 63,844 (d) 64,444
6.
(a) 31,626 (b) 33,626 (c) 43,626 (d) 38,626
7.
(a) 9130 (b) 10,330 (c) 9030 (d) 9230
8.
(a) 355,306 (b) 347,306 (c) 357,306 (d) 353, 306
9.
(a) 635,145 (b) 636,145 (c) 645,145 (d) 640,145
10.
(a) 4,147,232 (b) 4,197,212 (c) 4,287,212 (d) 4,187,212
1. b 2. c 3. b 4. c 5. b6. b 7. d 8. c 9. a 10. b
130
× 24-----------
339
× 76-----------
731
× 46-----------
355
× 26-----------
3842
× 93------------
1841
× 345--------------
4973
× 844--------------
SL3100_frame_C09 Page 136 Friday, August 31, 2001 10:17 AM

Multiplication and Division of Whole Numbers
137
Symbol: to divide 5 into 45Symbol: to divide 45 by 5 45
÷
5
Dividend: the number being divided intoDivisor: the number being divided into the dividendQuotient: the answer to the division problem
Very simple division such as
can be done just by knowing the multiplication tables.
because 2
×
3 = 6
because 5 × 5 = 25
because 7 × 9 = 63
Sometimes the divisor will not go into the dividend “evenly.” Therefore, use thesesteps:
1. Divide2. Multiply3. Subtract
Example 1:
Divide: Put the greatest number of 2’s that can be subtracted from 15 in thequotient over the 5.
Multiply: Every time a number is put in the quotient, multiply it by the divisorand write the answer under the part of the dividend that was divided into.
5 45
divisor
quotient
dividend
2 6 5 25 7 63
2 63
5 255
7 639
2 157
SL3100_frame_C09 Page 137 Friday, August 31, 2001 10:17 AM

138 Six Sigma and Beyond: Problem Solving and Basic Mathematics, Volume II
Subtract: The answer to the subtraction is called the remainder. The answer is
Now take the next step.
Example: In this example, as in most, two steps are added to the method.
Divide: Divide as many 5’s into the first number as possible; 5 will not gointo 2, so divide 5 into 24 four (4) times.
Multiply: Multiply the number put in the quotient (4) by the divisor (5) andplace the answer under the number divided into (24).
Subtract:
Bring down: Bring down the next number in the dividend (3) and place it nextto the remainder (4) of the subtraction.
2 157
14
2 157
141 7 R 1 (R is the remainder.)
5 243
1. Divide2. Multiply3. Subtract4. Bring down5. Repeat
5 2434
5 2434
204
5 2434
–204
SL3100_frame_C09 Page 138 Friday, August 31, 2001 10:17 AM

Multiplication and Division of Whole Numbers 139
Repeat the process: Do this by dividing 5 into 43.
Divide:
Multiply:
Subtract:
There is nothing more to bring down; therefore, the answer is 48 R 3:
This means that 243 equals 5 × 48 plus 3. Check to see:
5 × 48 + 240 + 3 = 243
Example:
Divide:
5 2434
2043
5 24348
2043
5 24348
204340
5 24348
2043
–403
5 24348 R 3
7 8139
7 81391
SL3100_frame_C09 Page 139 Friday, August 31, 2001 10:17 AM

140 Six Sigma and Beyond: Problem Solving and Basic Mathematics, Volume II
Multiply:
Subtract:
Bring down:
Divide and multiply:
Subtract:
Bring down:
Divide and multiply:
7 81391
7
7 81391
71
7 81391
711
7 813911
7117
7 813911
71174
7 813911
711743
SL3100_frame_C09 Page 140 Friday, August 31, 2001 10:17 AM

Multiplication and Division of Whole Numbers 141
Subtract and bring down:
Divide and multiply:
Subtract (and give answer):
The answer is 1162 R 5.There are two common errors made in these problems. A short example will
demonstrate both types of errors.
Example:
7 8139116
711743
7 8139116
7117434219
7 81391162
711743421914
7 81391162
7117434219145
6 45
SL3100_frame_C09 Page 141 Friday, August 31, 2001 10:17 AM

142 Six Sigma and Beyond: Problem Solving and Basic Mathematics, Volume II
Divide:
Quotient correct
Quotient too large
Quotient too small
Multiply and subtract:
Correct:
Too large:
Too small:
EXERCISES
Directions: Select the correct answer to each of the problems. If necessary, restudythe instructions and examples.
1. The weight of a freight shipment is 434 pounds. Each of the 7 boxes inthe shipment weighs the same amount. How much does each box weigh?(a) 52 lb (b) 62 lb (c) 58 lb (d) 65 lb
2. There are 18 machines stored in a warehouse. Each machine weighs 43pounds. What is the total weight of all the machines?(a) 774 lb (b) 854 lb (c) 1046 lb (d) 1932 lb
3. The number of parts produced were 218, 793, 452, and 516. How manyparts were produced in all?(a) 1676 (b) 1979 (c) 1840 (d) 2138
4. A man drives a route each day which is 37 miles long. How many milesdoes he travel in a 5-day week on his route?(a) 185 miles (b) 94 miles (c) 135 miles (d) 192 miles
6 457
6 458
6 456
6 457
423
6 458
48 Cannot subtract (clue to an error)
6 456
369 9 is bigger than 6 (clue to an error)
SL3100_frame_C09 Page 142 Friday, August 31, 2001 10:17 AM

Multiplication and Division of Whole Numbers 143
5. If 1056 parts are produced on one 8-hour shift, how many parts areproduced in 1 hour?(a) 138 parts (b) 114 parts (c) 125 parts (d) 132 parts
6. If a man can save 40 cents a day by changing his route to work, howmuch can he save in 1 month (22 days of work)?(a) 679 cents (b) 435 cents (c) 880 cents (d) 516 cents
7. If cities A, B, and C are on a line, and the distance from A to C is 875miles and the distance from A to B is 251 miles, how far is it from B to C?
(a) 636 miles (b) 635 miles (c) 518 miles (d) 624 miles
8. How many yards are in 1 mile if there are 5280 feet in 1 mile and 3 feetin 1 yard?(a) 15,840 yards (b) 1760 yards (c) 1184 yards (d) 21,046 yards
9. A large yard needs 2,145 feet of chain-link fence. If the fence comes in6-foot sections, how many sections are needed for the job (whole sectionsmust be ordered)?(a) 276 sections (b) 358 sections (c) 154 sections (d) 484 sections
10. 678 street-light fixtures were replaced in a city in 1 year. At a cost of$4.00 each, what was the total cost of replacing the street-light fixtures?(a) $2712.00 (b) $169.00 (c) $2138.00 (d) $545.00
Answers to the exercises:
ADDITIONAL EXERCISES
Directions: Select the correct answer to each of the problems.
1. When Pete bought his car, it had 23,015 miles. When he sold the car 4years later, it had 73,924 miles. How many miles were put on the carwhen Pete owned it?(a) 50,909 miles (b) 32,185 miles (c) 41,563 miles (d) 68,413 miles
2. What was the total golf score for nine holes if the scores on each holewere 5, 6, 3, 6, 5, 6, 3, and 4?(a) 43 (b) 38 (c) 47 (d) 39
1. b 2. a 3. b 4. a 5. d6. c 7. d 8. b 9. b 10. a
A B C
SL3100_frame_C09 Page 143 Friday, August 31, 2001 10:17 AM

144 Six Sigma and Beyond: Problem Solving and Basic Mathematics, Volume II
3. What was the total cost of four tires if each one costs $54.00 and the totaltax for all 4 was $9.00?(a) $273.00 (b) $239.00 (c) $184.00 (d) $225.00
4. The Marine Reserve collected 3380 toys to give to 845 children. Howmany toys would each child get?(a) 6 (b) 3 (c) 1 (d) 4
5. If a man bought a $900 piece of furniture by putting $100 down andpaying the rest off in 20 equal payments, how much would each paymentbe?(a) $35.00 (b) $28.00 (c) $49.00 (d) $40.00
Answers to the additional exercises:
1. a 2. b 3. d 4. d 5. d
SL3100_frame_C09 Page 144 Friday, August 31, 2001 10:17 AM

145
Parts and Types of Fractions
Objective:
Often it is necessary to work with numbers that are not whole numbers.For instance, a doorway was measured and it was found to be 33 3/4 inches wide.This chapter introduces fractional numbers. Their meaning and different forms offractions will be demonstrated.
When using fractions in problems, fractions must be in one form to multiply,but in a different form when presented as a final answer. This chapter will demon-strate how to recognize different fraction forms and also how to convert a fractionfrom one form to another.
Definitions:
1.
Denominator:
the bottom number in a fraction2.
Equal:
having the same value or meaning the same amount3.
Fraction:
a number between two whole numbers in its value4.
Improper fraction:
a fraction whose top number is equal to or larger thanthe bottom number
5.
Mixed number:
a whole number with a proper fraction written beside it6.
Proper fraction:
a fraction whose top number is smaller than its bottomnumber
7. Remainder: the number left over after a given number is divided byanother number as many times as possible
Parts:
In applied problems, there are times when a fraction is used to describe apart of a whole quantity. This chapter will demonstrate how to take informationabout the part of a total and the total and then write a fraction to show the comparisonbetween the two. Examples of the kinds of questions needing an answer will bepresented in the next section.
10
SL3100_frame_C10 Page 145 Friday, August 31, 2001 10:18 AM

146
Six Sigma and Beyond: Problem Solving and Basic Mathematics, Volume II
Example 1:
In a whole day of 24 hours, a person slept 7 hours. What fractionof the day did the person sleep?
Rule:
If amounts are not in the same measurements, rewrite them so they aregiven in the same measuring units. (The smallest of the two units given.)
Step 1. The denominator of the fraction is the number of units in one wholequantity. For Example 1, the denominator is 24.
Step 2. The numerator is the number of units in the part of units
asked for.
In Example 1, the question asked for hours slept which was 7, so thenumerator is 7.
Caution:
Be sure to understand what is
asked for.
Sometimes the given part is notthe numerator.
Answer:
7/24.
Example 2:
A test had 25 questions. If a person missed 4 questions, whatfraction of the test did the person get right?
Step 1. The denominator is 25.Step 2. The numerator is 21 because if the person missed 4 out of 25, then
the person must have gotten 21 right.
Answer:
21/25
Example 3:
If 12 ounces were lost from a quart bottle, what fraction of thequart is still in the bottle?
Rule:
Amounts must be in the same units.
12 ounces lost32 ounces total in 1 quart
Step
1. The denominator is 32.Step 2. The numerator is 20 because if 12 ounces are lost 20 ounces
remain.
Answer:
20/32.
EXERCISES
Directions:
Select the fraction that gives the comparison of the part asked for to thetotal. If necessary, restudy the instructions and examples.
SL3100_frame_C10 Page 146 Friday, August 31, 2001 10:18 AM

Parts and Types of Fractions
147
1. If a board was 8 feet long and a carpenter cut off 5 feet, what fraction ofthe board did the carpenter cut off?(a) 5/8 (b) 3/8 (c) 3/5 (d) 5/3
2. A man worked a total of 24 hours in a work week of 40 hours. Whatfraction of the whole week did he work?(a) 24/40 (b) 16/24 (c) 24/16 (d) 16/40
3. A football player ran 80 yards for a touchdown. What fraction of thelength of the football field did he run?(a) 20/80 (b) 20/100 (c) 80/100 (d) 80/20
4. A man had 100 dollars and spent 47 dollars. What fraction of his moneydid he spend?(a) 47/53 (b) 47/100 (c) 53/47 (d) 53/100
5. On a 10-question test, a girl missed 3. What fraction of the questions didshe get right?(a) 7/10 (b) 7/3 (c) 3/7 (d) 3/10
6. What fraction of a whole day of 24 hours is from 8:00 a.m. to 1:00 p.m.? (a) 6/24 (b) 5/24 (c) 19/24 (d) 4/24
7. A battery was expected to last 3 years, but it lost its charge after 25months. What fraction of its expected life did the battery last?(a) 25/36 (b) 11/36 (c) 11/25 (d) 25/11
8. A girl earned 200 dollars but 62 dollars was withheld for taxes. Whatfraction of her paycheck was take-home pay?(a) 138/200 (b) 62/138 (c) 138/62 (d) 168/200
9. A man was given 4 red flags, 3 blue flags, and 3 white flags. What fractionof the flags are blue?(a) 3/10 (b) 6/10 (c) 7/10 (d) 3/7
10. A car sticker price was $68,000. The dealer cost for the car was $42,000.What fraction of the sticker price is the dealer’s mark-up?(a) $26,000/$42,00 (b) $26,000/$68,000 (c) $26,000/$62,000(d) $42,000/$26,000
Answers to the exercises:
1. a 2. a 3. c 4. b 5. a6. b 7. a 8. a 9. a 10. b
SL3100_frame_C10 Page 147 Friday, August 31, 2001 10:18 AM

148
Six Sigma and Beyond: Problem Solving and Basic Mathematics, Volume II
ADDITIONAL EXERCISES
Directions:
Select the fraction that gives a comparison of the part asked for to thetotal.
1. Out of a total inventory of 98 cars on a dealer’s lot, 38 are Mustangs.Mustangs are what fraction of the total inventory?(a) 60/98 (b) 98/60 (c) 38/98 (d) 38/60
2. One day a paint store had 38 customers and 24 were professional painters.What fraction of the total number of customers were nonprofessionalpainters?(a) 24/14 (b) 24/38 (c) 14/38 (d) 14/24
3. If a man’s monthly paycheck is 780 dollars and 180 dollars goes for thehouse payment, what fraction of his paycheck can the man spend forthings other than the house payment?(a) 180/780 (b) 180/600 (c) 780/180 (d) 600/780
4. If in one order there were 5 defective parts and 80 good parts, what fractionof the total order is defective?(a) 5/75 (b) 5/85 (c) 80/85 (d) 5/80
5. If 14 quarts of oil are removed from a full 5-gallon can of oil, what fractionof the total oil is removed?(a) 14/20 (b) 5/14 (c) 6/14 (d) 6/20
Answers to the additional exercises:
1. c 2. c 3. d 4. b 5. a
SL3100_frame_C10 Page 148 Friday, August 31, 2001 10:18 AM

149
Simple Form and Common Denominators of Fractions
Objectives:
This chapter demonstrates two processes related to the number one.Neither multiplying nor dividing a number by one changes the number. This factallows changing the appearance of a fraction without changing its value.
To present an answer to any problem involving a fraction, the numbers in thefraction are reduced as much as possible to make the final answer easier to read.This chapter will also demonstrate how to properly reduce the numbers in a fraction.
To add fractions, the denominators must be equal. How to enlarge the numbersin the fraction so that the given fractions may be rewritten with the same denomi-nators will also be demonstrated.
Definitions:
1.
Common denominator of a set of fractions:
the number that can be dividedevenly by the denominator of every fraction of the set
2.
Equal fractions:
fractions having the same value as a number3.
Reduced form of a proper fraction:
a proper fraction whose numeratorand denominator cannot be evenly divided by any (the same) wholenumber other than one
4.
Simple form of a fraction:
a fraction in which the numbers in the fraction(numerator and denominator) are whole numbers and read the same foreveryone
SIMPLEST FORM
Imagine the confusion for a lumber salesman if a customer asked for a 4/8-inchsheet of plywood instead of calling it 1/2 inch. Whenever there is a problem with afraction, it is best to have that fraction written in the most simple way. This requiresmaking the numerator and denominator as small as possible. This section will
11
SL3100_frame_C11 Page 149 Friday, August 31, 2001 10:19 AM

150
Six Sigma and Beyond: Problem Solving and Basic Mathematics, Volume II
demonstrate how to write a proper fraction in its reduced form. Therefore, the taskis to take a fraction such as 12/51 and reduce its numbers as much as possible.
Rules:
To
reduce
a fraction to its lowest numbers, divide the numerator and denom-inator evenly by the same number as many times as possible. To use this rule, anumber must be found that will divide evenly into both 12 and 51.
Rule 1.
The number “2” will divide evenly into any number when its
far right
digitcan be divided evenly by 2.
Example:
12, 14, 18, and 84 can all be evenly divided by 2 because the farright digits (2, 4, 8, 4) can be evenly divided by 2.
Non-example:
19, 37, 41, and 43 cannot be evenly divided by 2 because thefar right digits (9, 7, 1, 3) cannot be evenly divided by 2.
Rule 2.
The number “5” will divide evenly into any number whose last digit is a 0or a 5.
Example:
10, 85, 30, and 45 can all be divided evenly by 5 because the lastdigits are either 0 or 5.
Non-example:
12, 43, 81, and 64 cannot be evenly divided by 5 because thelast digits are not 0 or 5.
Rule 3.
The number “3” will divide into any number when its repeated sum of digitsis a number that can be divided by 3.
Special note:
“Repeated sum of digits” means to add the digits of the given number;to next add the digits of that sum; and so on until only one digit results.
Example 1: 39Add digits 3 + 9 = 12Add digits 1 + 2 = 3
Answer: Since 3 can be divided by 3, 39 can be divided by 3.
Example 2: 276Add digits 2 + 7 + 6 = 15Add digits 1 + 5 = 6
Answer: Since 6 can be divided by 3, 276 can be divided by 3.
Example: 85Add digits 8 + 5 = 13Add digits 1 + 3 = 4
Answer: Since 4 cannot be divided by 3, neither can 85.
Now, go back to the main task of reducing fractions:
SL3100_frame_C11 Page 150 Friday, August 31, 2001 10:19 AM

Simple Form and Common Denominators of Fractions
151
Example 3:
4 can be divided by 2, 418 can be divided by 2, 3, 6, 9, 18Notice that both can be divided by 2
Answer: The fraction is “reduced” because no number divides into 2and 9.
Example 4:
12 can be divided by 2, 3, 4, 6, 1240 can be divided by 2, 4, 5, 8, 10, 20, 40Notice that both numbers can be divided by 2 and 4. Choose thelarger one.
Answer: The fraction is “reduced” because no number divides into 3and 10.
Example 5:
Note:
In this problem, because the numbers are so large, several reductions will bedone.
180 can be divided by 2, 5, 10 (maybe more)460 can be divided by 2, 5, 10
18 can be divided by 2, 3, 6, 9, 1846 can be divided by 2, 23, 46
Answer: The fraction is “reduced” because no number divides into 9and 23.
418------
418------ 2
2---÷ 2
9---=
1240------
1240------ 4
4---÷ 3
10------=
180460---------
180460--------- 10
10------÷ 18
46------=
1846------ 2
2---÷ 9
23------=
SL3100_frame_C11 Page 151 Friday, August 31, 2001 10:19 AM

152
Six Sigma and Beyond: Problem Solving and Basic Mathematics, Volume II
SIMPLEST FORM EXERCISES
Directions:
Select the correct reduced form of each of the proper fractions.
1. 4/12(a) 4/12 (b) 2/6 (c) 1/3 (d) 3/6
2. 10/40(a) 5/8 (b) 1/4 (c) 5/20 (d) 3/12
3. 15/30 (a) 5/6 (b) 3/10 (c) 5/10 (d) 1/2
4. 9/33(a) 9/33 (b) 3/11 (c) 1/8 (d) 2/22
5. 18/40(a) 9/20 (b) 9/15 (c) 3/10 (d) 18/40
6. 20/33(a) 20/33 (b) 5/6 (c) 10/11 (d) 4/8
7. 24/100(a) 12/50 (b) 6/25 (c) 8/33 (d) 24/100
8. 15/54(a) 15/54 (b) 3/5 (c) 5/9 (d) 5/18
9. 85/225 (a) 5/9 (b) 17/45 (c) 15/45 (d) 17/50
10. 63/70(a) 8/10 (b) 7/10 (c) 9/10 (d) 63/70
11. 30/450(a) 1/15 (b) 8/12 (c) 3/45 (d) 5/90
12. 44/96 (a) 8/15 (b) 2/9 (c) 11/24 (d) 4/18
13. 93/117(a) 18/23 (b) 93/117 (c) 31/39 (d) 13/37
14. 120/840(a) 6/42 (b) 1/7 (c) 8/19 (d) 12/84
15. 75/300(a) 1/4 (b) 4/14 (c) 7/42 (d) 3/12
SL3100_frame_C11 Page 152 Friday, August 31, 2001 10:19 AM

Simple Form and Common Denominators of Fractions
153
Answers to simplest form exercises:
ADDITIONAL EXERCISES
Directions:
Select the correct reduced form of the proper fractions.
Answers to the additional exercises:
1. c 2. b 3. d 4. b 5. a6. a 7. b 8. d 9. b 10. c
11. a 12. c 13. c 14. b 15. a
1. 5/15(a) 1/5 (b) 5/15 (c) 1/4 (d) 1/3
2. 4/14(a) 3/8 (b) 2/7 (c) 4/8 (d) 3/7
3. 12/30(a) 2/5 (b) 3/5 (c) 2/9 (d) 6/15
4. 24/40(a) 3/5 (b) 7/9 (c) 12/20 (d) 6/10
5. 32/80(a) 8/40 (b) 6/11 (c) 4/16 (d) 2/5
6. 18/63(a) 2/7 (b) 8/14 (c) 3/19 (d) 18/63
7. 42/120(a) 21/40 (b) 7/20 (c) 14/40 (d) 8/25
8. 55/200(a) 55/200 (b) 15/42 (c) 5/14 (d) 11/40
9. 130/145(a) 23/24 (b) 13/39 (c)130/145 (d) 26/29
10. 147/300(a) 38/120 (b) 147/300 (c) 53/95 (d) 49/100
1. d 2. b 3. a 4. a 5. d6. a 7. b 8. d 9. d 10. d
SL3100_frame_C11 Page 153 Friday, August 31, 2001 10:19 AM

154
Six Sigma and Beyond: Problem Solving and Basic Mathematics, Volume II
COMMON DENOMINATORS
Before fractions can be added or subtracted, the denominators of those fractionsmust be equal. If two fractions with different denominators are to be added, the formof the two fractions must be changed so that the denominators are equal. This sectiondemonstrates the method for changing the numbers in a fraction to obtain an equalfraction, but with a different denominator.
Directions:
Find the answer to a question:
Here the fraction 3/4 is rewritten as a fraction with 24 in the denominator. Rememberfrom the section on simplest form that the numbers in a fraction could be
reduced
by dividing both the numerator and denominator by the same
number. It is also safeto
increase
the numbers in a fraction by multiplying the numerator and denominatorby the same number. To write 3/4 as ?/24, multiply the numerator and denominatorof 3/4 by 6 because 4
×
6 = 24.
Example 1: Change 4/9 into ?/18. Multiply numerator and denominator of4/9 by 2 because 9
×
2 = 18.
Example 2: Change 2/3 into ?/147. Multiply numerator and denominator of2/3 by 49 because 3
×
49 = 147.
There is also another method that can be used to find the answer. Choose either one.
Example 3: Change 3/5 into ?/35.
Step 1. Divide the denominator of the old fraction into the denominator ofthe new fraction.
34--- ?
24------=
34--- ×
×66
1824------=
49--- ×
×22
818------=
23--- ×
×4949
98147---------=
5 357
SL3100_frame_C11 Page 154 Friday, August 31, 2001 10:19 AM

Simple Form and Common Denominators of Fractions
155
Step 2. Multiply the answer of Step 1 by the numerator of the old fraction.
7
×
3 = 21
Step 3. The numerator of the new fraction is the answer to Step 2 or 3/5 =21/35.
Example 4: Change 5/8 into ?/48.
Step 1. Step 2. 6
×
5 = 30Step 3. 5/8 = 30/48
COMMON DENOMINATOR EXERCISES
Directions:
Select the correct number for (x) which is the
numerator
of the “newfraction.” If necessary, restudy the directions and examples.
1. 1/2 = x/6(a) 2 (b) 3 (c) 4 (d) 5
2. 2/5 = x/20(a) 8 (b) 5 (c) 4 (d) 2
3. 3/8 = x/48(a) 18 (b) 22 (c) 16 (d) 24
4. 5/7 = x/21(a) 12 (b) 15 (c) 8 (d) 19
5. 7/8 = x/64(a) 39 (b) 42 (c) 56 (d) 18
6. 6/10 = x/90(a) 38 (b) 48 (c) 54 (d) 72
7. 8/9 = x/63(a) 64 (b) 81 (c) 40 (d) 56
8. 5/12 = x/48(a) 18 (b) 8 (c) 32 (d) 20
9. 4/6 = x/72(a) 34 (b) 26 (c) 48 (d) 55
10. 3/4 = x/120(a) 90 (b) 72 (c) 100 (d) 84
8 486
SL3100_frame_C11 Page 155 Friday, August 31, 2001 10:19 AM

156
Six Sigma and Beyond: Problem Solving and Basic Mathematics, Volume II
Answers to the common denominator exercises:
ADDITIONAL EXERCISES
Directions:
Select the number which is the numerator of the “new fraction.”
11. 5/7 = x/49(a) 9 (b) 24 (c) 18 (d) 35
12. 1/5 = x/45(a) 9 (b) 11 (c) 7 (d) 4
13. 2/6 = x/24(a) 8 (b) 6 (c) 12 (d) 15
14. 3/12 = x/144(a) 24 (b) 36 (c) 33 (d) 39
15. 5/18 = x/54(a) 18 (b) 10 (c) 20 (d) 15
1. b 2. a 3. a 4. b 5. c6. c 7. d 8. d 9. c 10. a
11. d 12. a 13. a 14. b 15. d
1. 1/3 = x/9(a) 4 (b) 3 (c) 2 (d) 5
2. 4/5 = x/40(a) 32 (b) 18 (c) 24 (d) 28
3. 3/4 = x/12(a) 10 (b) 7 (c) 8 (d) 9
4. 5/6 = x/54(a) 45 (b) 50 (c) 38 (d) 48
5. 2/9 = x/18(a) 3 (b) 4 (c) 2 (d) 5
6. 3/7 = x/28(a) 12 (b) 14 (c) 16 (d) 18
7. 3/8 = x/56(a) 33 (b) 24 (c) 18 (d) 21
8. 5/11 = x/55(a) 31 (b) 25 (c) 14 (d) 28
SL3100_frame_C11 Page 156 Friday, August 31, 2001 10:19 AM

Simple Form and Common Denominators of Fractions
157
Answers to the additional exercises:
CHANGING FRACTIONS
When adding or subtracting fractions, the denominators of all fractions must beequal. If the fractions being added or subtracted do not have equal denominators,they must be rewritten into fractions with equal denominators. Earlier in this section,changing a fraction into a fraction of equal value but with a larger denominator wasdemonstrated. In this section, rewriting fractions that have different denominatorsinto fractions that have the same denominator will be demonstrated, e.g., rewrite2/3 and 1/2 so that each have the same denominator.
Definition:
1.
Common denominator:
When fractions are rewritten to have the samedenominator, it is said that they have a common denominator.
Directions:
Step 1. Decide what the common denominator will be. A common denominatorcan be any number into which all of the given denominators divide evenly.In the case of 2/3 and 1/2, any of the following can be used as a commondenominator: 6, 12, 18, 24, 30, 36, 42, etc. Always use the smallest commondenominator if it is easy to find. In the example, use 6.
Special note:
A common denominator (not always the smallest) can be found bymultiplying the given denominators together.
Step 2. Change each fraction so that it has the common denominator as itsdenominator.
2/3 = ?/6 1/2 = ?/62/3 = 4/6 1/2 = 3/6
Therefore, 2/3 and 1/2 are now 4/6 and 3/6.
9. 4/13 = x/52(a) 16 (b) 18 (c) 12 (d) 10
10. 9/20 = x/140(a) 18 (b) 49 (c) 56 (d) 63
1. b 2. a 3. d 4. a 5. b6. a 7. d 8. b 9. a 10. d
SL3100_frame_C11 Page 157 Friday, August 31, 2001 10:19 AM

158
Six Sigma and Beyond: Problem Solving and Basic Mathematics, Volume II
Example 1: Rewrite 3/5 and 4/7 so that each has the same denominator.
Step 1. Choose a common denominator: 35 is the smallest number both 5and 7 will divide into evenly.
Step 2. Change each fraction:
3/5 = ?/35 and 4/7 = ?/353/5 = 21/35 and 4/7 = 20/35
Answer: 3/5 and 4/7 are now 21/35 and 20/35
Example 2: Rewrite 5/12 and 1/6 so that each has the same denominator.
Step 1. The common denominator is 12 because both 6 and 12 divideinto 12.
Step 2. Only one fraction needs to be changed (1/6) to get a common de-nominator.
1/6 = ?/121/6 = 2/12
Answer: 5/12 and 1/6 are now 5/12 and 2/12
Example 3: Rewrite 2/3, 3/4, and 1/8 as fractions with the same denominator.
Step 1. The smallest number that 3, 4, and 8 will all divide into is 24, so 24will be the common denominator.
Step 2. Rewrite each fraction:
2/3 = ?/24 3/4 = ?/24 1/8 = ?/242/3 = 16/24 3/4 = 18/24 1/8 = 3/24
Answer: 2/3, 3/4, and 1/8 become 16/24, 18/24, and 3/24
CHANGING FRACTIONS EXERCISES
Directions:
Select the set of fractions that is equal to the given set of fractions, buthas a common denominator.
1. 1/3; 1/2(a) 2/6; 3/6 (b) 3/12; 4/12 (c) 4/6; 3/6 (d) 4/12; 3/12
2. 2/5; 1/6(a) 7/11; 3/11 (b) 4/30; 8/30 (c) 12/30; 5/30 (d) 4/20; 3/20
SL3100_frame_C11 Page 158 Friday, August 31, 2001 10:19 AM

Simple Form and Common Denominators of Fractions
159
Answers to the changing fractions exercises:
3. 7/10; 3/5(a) 4/5; 3/5 (b) 7/10; 6/10 (c) 13/20; 12/20 (d) 21/30; 19/30
4. 3/5; 4/7(a) 21/35; 20/35 (b) 10/12; 9/12 (c) 15/32; 11/32 (d) 10/35; 9/35
5. 2/7; 5/8
(a) 16/15; 35/15 (b) 2/15; 5/15 (c) 2/56; 5/56 (d) 16/56; 35/56
6. 4/7; 2/14(a) 15/28; 4/28 (b) 8/14; 2/14 (c) 16/28; 5/28 (d) 4/7; 5/7
7. 6/11; 3/4(a) 24/44; 33/44 (b) 17/15; 7/15 (c) 24/11; 33/11 (d) 4/44; 11/44
8. 3/5; 4/9(a) 8/14; 13/14 (b) 27/45; 20/45 (c) 21/36; 16/36 (d) 18/30; 12/30
9. 3/10; 3/7(a) 13/17; 10/17 (b) 21/35; 15/35 (c) 21/70; 30/70 (d) 12/40; 15/40
10. 3/13; 2/5(a) 9/35; 14/35 (b) 15/18; 26/18 (c) 16/18; 7/18 (d) 15/65; 26/65
11. 1/3; 2/5; 1/10(a) 10/30; 12/30;3/30
(b) 5/15; 6/15;2/15
(c) 7/20; 8/20;2/20
(d) 13/40; 16/40;4/40
12. 2/3; 5/6; 1/12(a) 21/24; 20/24;2/24
(b) 12/18;15/18;2/18
(c) 8/12;10/12;1/12
(d) 10/30; 25/30;2/30
13. 3/8; 1/4; 3/16(a) 6/16; 4/16;3/16
(b) 12/32; 9/32;6/32
(c) 9/24; 6/24;5/24
(d) 5/16; 4/16;2/16
14. 2/9; 13/27; 1/3(a) 8/36; 3/36;7/36
(b) 6/27;13/27;9/27
(c) 2/9; 4/9;3/9
(d) 4/18; 3/18;6/18
15. 5/8; 2/3; 1/4(a) 10/16; 9/16;4/16
(b)18/24; 16/24;5/24
(c) 10/16;7/16;3/16
(d) 15/24; 16/24;6/24
1. a 2. c 3. b 4. a 5. d6. b 7. a 8. b 9. c 10. d
11. a 12. c 13. a 14. b 15. d
SL3100_frame_C11 Page 159 Friday, August 31, 2001 10:19 AM

SL3100_frame_C11 Page 160 Friday, August 31, 2001 10:19 AM

161
Adding and Subtracting Fractions
Objective:
Addition and subtraction are two of the four operations used with anytype of number. Because fractions are used in so many types of problems, such asmeasurement problems, it is important to know how to perform these operations.This chapter will demonstrate how to add and subtract fractions in several forms. Itwill also strengthen skills in reducing fractions and changing them from one formto another.
Definitions:
1.
Sum:
the answer to an addition problem
ADDITION OF FRACTIONS
To add fractions, the denominators of the fractions must be equal. This sectiondemonstrates how to add proper fractions which already have common denominators.
Rules:
Step a. Add the numerators to get the numerator of the answer.Step b. The denominator of the answer is the same as the denominator of the
given fractions.Step c. Write the answer in simple form.
Example 1: 2/7 + 3/7 = ?
Step a. The numerator is 5.Step b. The denominator is 7.Step c. The answer is 5/7.
Example 2: 1/8 + 3/8 + 5/8 = ?
Step a. The numerator is 9.
12
SL3100_frame_C12 Page 161 Friday, August 31, 2001 10:20 AM

162
Six Sigma and Beyond: Problem Solving and Basic Mathematics, Volume II
Step b. The denominator is 8.Step c. The answer is 9/8. The simple form is 1 1/8.
Example 3: 5/10 + 8/10 + 3/10 = ?
Step a. The numerator is 16.Step b. The denominator is 10.Step c. The answer is 16/10. The simple form is 1 3/5.
ADDITION OF MIXED NUMBERS
This section demonstrates how to add mixed numbers when the proper fraction partshave common denominators.
Example: 3 2/7 + 4 3/7 + 1 5/7 = ?
Rules:
Step a. Add all the proper fraction parts of the mixed number and write theanswer in simple form.
Step b. Add all the whole number parts of the mixed numbers.Step c. Add the whole number parts of Step a to the results of Step b.Step d. The final answer is a mixed number which is found by using the whole
number from Step c and the proper fraction part of the answer in Step a.
Example 1: 3 2/7 + 4 3/7 + 1 5/7 = ?
Step a. Add all the proper fractions: 2/7 + 3/7 + 5/7 = 10/7. The simpleform is 1 3/7.
Step b. Add all the whole number parts of the mixed numbers: 3 + 4 + 1 = 8Step c. Add the answer of Step b to the whole number part of the answer
to Step a: 8 + 1 = 9Step d. Find the answer:
Example 2: 4 3/8 + 5/8 + 2 4/8 = ?
Step a. 3/8 + 5/8 + 4/8 = 12/8. The simple form is 1 1/2.Step b. 4 + 2 = 6Step c. 6 + 1 = 7Step d. The answer is 7 1/2
9 3/7
answer toStep c
proper fractionpart of Step a
SL3100_frame_C12 Page 162 Friday, August 31, 2001 10:20 AM

Adding and Subtracting Fractions
163
Example 3: 14 + 3 2/13 + 8 10/13 + 9/13 = ?
Step a. 2/13 + 10/13 + 9/13 = 21/13 = 1 8/13Step b. 14+ 3 + 8 = 25Step c. 25 + 1 = 26Step d. The answer is 26 8/13
ADDITION OF FRACTIONS WITH UNEQUAL DENOMINATORS
In order to add fractions, the denominators of those fractions must be equal. In thefirst two sections, how to add fractions whose denominators were already equal wasdemonstrated. The next two sections will demonstrate how to add fractions whosedenominators are not equal.
Directions:
Step 1. Rewrite as many of the given fractions as necessary so that each givenfraction has the same denominator. (If you have forgotten how to do this;restudy Mod 6, lesson 1).
Step 2. Add the fractions and write the answers in simple form. (If you haveforgotten how to do this; restudy Mod 6, lesson 1).
Example 1: 2/3 + 3/4 = ?
Step 1. 12 is the common denominator.2/3 is equal to 8/12.3/4 is equal to 9/12.
Step 2. 8/12 + 9/12 = 17/12. The simple form is 1 5/12.
Example 2: 7/10 + 3/8 = ?
Step 1. 40 is the common denominator.7/10 is equal to 28/40.3/8 is equal to 15/40.
Step 2. 28/40 + 15/40 = 43/40. The simple form is 1 3/40.
Example 3: 5/8 + 3/4 + 7/16 = ?
Step 1. 16 is the common denominator.5/8 is equal to 10/16.3/4 is equal to 12/16.7/16 is equal to 7/16.
Step 2. 10/16 + 12/16 + 7/16 = 29/16. The simple form is 1 13/16.
SL3100_frame_C12 Page 163 Friday, August 31, 2001 10:20 AM

164
Six Sigma and Beyond: Problem Solving and Basic Mathematics, Volume II
SUM OF A GROUP OF MIXEDAND WHOLE NUMBERS
To add mixed numbers, the denominators of the proper fraction parts must be equal.This section will demonstrate how to find the sum of a group of mixed and wholenumbers when the denominators of the proper fraction part of the mixed numberare different.
Directions:
Step 1. Rewrite the proper fraction part of as many mixed numbers as necessaryso that each given mixed number has the same denominator in the properfraction part. (Review previous sections if necessary.)
Step 2. Add the whole and mixed numbers, and write answers in simple form.(Review previous sections if necessary.)
Example 1: 5 1/2 + 7 2/3 = ?
Step 1. 6 is the common denominator for 1/2 and 2/3.5 1/2 is equal to 5 3/6.7 2/3 is equal to 7 4/6.
Step 2. 5 3/6 + 7 4/6 = 12 7/6. The simple form is 13 1/6.
Example 2: 1 3/8 + 4 1/4 = ?
Step 1. 8 is the common denominator for 3/8 and 1/4.1 3/8 is equal to 1 3/8.4 1/4 equal to 4 2/8.
Step 2. 1 3/8 + 4 2/8 = 5 5/8. The simple form is 5 5/8.
Example 3: 5 2/3 + 4 3/8 + 9 5/12 = ?
Step 1. 24 is the common denominator for 2/3, 3/8, and 5/12.5 2/3 is equal to 5 16/24.4 3/8 is equal to 4 9/24.9 5/12 is equal to 9 10/24.
Step 2. 5 16/24 + 4 9/24 + 9 10/24 = 18 35/24. The simple form is 1911/24.
APPLIED MATH PROBLEMS USING ADDITIONOF FRACTIONS
This section contains applied math problems using addition of fractions. The prob-lems are written in words. One of the difficulties encountered is changing the wordsin applied problems into numbers.
SL3100_frame_C12 Page 164 Friday, August 31, 2001 10:20 AM

Adding and Subtracting Fractions
165
Directions:
Words that help decide if a problem can be solved by adding are sum,total, and plus. Suggested steps to solve math problems given in words or pictures are
Step 1. Read the problem carefully at least two times.Step 2. Be sure to understand what is to be found.Step 3. Be sure to understand all the information given.Step 4. Draw a picture of the problem if possible.Step 5. Look for key words that tell what mathematics operation is needed to
find the answer.
Example: A chef mixed 1/3 cup of sugar and 1/4 cup of flour. In cups,how much mixture did the chef have?
Question: How many cups of mixture of sugar and flour?Given: 1/3 cup sugar and 1/4 cup flourKey words: “Mixture” meaning the combination of 2 thingsOperation: Add
1/3 + 1/4 is 4/12 + 3/12 = 7/12Answer: 7/12 cup mixture.
EXERCISES
Directions:
Select the correct answer, written in simple form, to each of the additionproblems.
1. A certain pipe is 3 3/8 inches long. How long would 2 of these pipes beif lying end to end?(a) 6 3/4 in. (b) 5 1/3 in. (c) 3 3/4 in. (d) 6 3/8 in.
2. George mixed 3/10 of a gallon of oil with 4 1/2 gallons of gasoline. Howmany gallons of liquid mixture does he have?(a) 4 4/5 gal (b) 4 1/5 gal (c) 4 3/4 gal (d) 4 3/8 gal
3. One piece of metal weighs 5/6 of a pound and a second piece of metalweighs 3/8 of a pound. What is the total weight of the two pieces of metal?(a) 9/20 lb (b) 1 5/24 lb (c) 1 3/8 lb (d) 4/7 lb
4. What would the total thickness of wall covering be if the wallboard was1/2 inch thick and the paneling was 3/8 inch thick?(a) 1/4 in. (b) 2/5 in. (c) 1/2 in. (d) 7/8 in.
5. What would be the total distance around a triangle with sides of: 4 1/2,6 3/4, and 8 3/8 inches.(a) 18 13/24 in. (b) 18 7/8 in. (c) 19 5/8 in. (d) 19 1/8 in.
SL3100_frame_C12 Page 165 Friday, August 31, 2001 10:20 AM

166
Six Sigma and Beyond: Problem Solving and Basic Mathematics, Volume II
6. One piece of metal weighs 5 3/10 ounces and a second piece of metalweighs 13 9/10 ounces. What is the combined weight of the two piecesof metal?(a) 19 1/5 oz (b) 18 2/5 oz (c) 18 3/5 oz (d) 19 3/8 oz
7. What is the total horsepower delivered by three motors of 3/4, 1/2, and1/3 horsepower if all are working together (in parallel)?(a) 5/9 hp (b) 1 3/5 hp (c) 2 1/12 hp (d) 1 7/12 hp
8. What length of a bolt is covered by a washer of 1/16 inch width and anut of 1/4 inch width?(a) 1/10 in. (b) 3/8 in. (c) 5/16 in. (d) 7/32 in.
9. What is the total length of the boxes shown in the illustration?
(a) 1 7/8 in. (b) 1 11/24 in. (c) 2 3/8 in. (d) 1 11/32 in.
10. A brush 27/32 inch thick is covered with a 3/64 inch coating of copperon both sides. What is the total thickness of the brush and the coatings?(a) 15/16 in. (b) 17/64 in. (c) 39/64 in. (d) 57/64 in.
Answers to the exercises:
ADDITIONAL EXERCISES
Directions:
Select the correct answer, written in simple form, to each of the wordproblems.
1. Two packages weigh 3 2/5 ounces and 15 1/2 ounces. What is theircombined weight?(a) 18 7/10 oz (b) 18 3/7 oz (c) 18 3/10 oz (d) 18 9/10 oz
2. What is the distance around a rectangular lot 50 1/2 feet wide and 9 3/4feet long? (There are two widths and two lengths.)(a) 59 3/8 ft (b) 120 1/2 ft (c) 60 1/2 ft (d) 118 3/4 ft
1. a 2. a 3. b 4. d 5. c6. a 7. d 8. c 9. c 10. a
SL3100_frame_C12 Page 166 Friday, August 31, 2001 10:20 AM

Adding and Subtracting Fractions
167
3. The height of a door is 6 3/8 feet, and from the top of the door to theceiling, it is 2 1/2 feet. How far from the floor is the ceiling?(a) 8 1/2 ft (b) 8 7/8 ft (c) 8 3/4 ft (d) 8 7/16 ft
4. How many total gallons can be carried in three cans that hold 5 gallons,4 2/3 gallons, and 2 1/2 gallons?(a) 11 7/6 gal (b) 11 7/12 gal (c) 12 1/6 gal (d) 12 3/8 gal
5. How many feet of electrical cord are needed to make a lamp if 1 1/8 feetof cord are inside the lamp and 6 1/3 feet of cord are outside the lamp?(a) 7 11/24 ft (b) 7 5/24 ft (c) 7 2/11 ft (d) 8 1/3 ft
6. How many total hours were worked if on the first day a man worked 62/3 hours and on the second day he worked 4 3/10 hours?(a) 10 29/60 hr (b) 11 1/30 hr (c) 11 1/2 hr (d) 10 29/30 hr
7. On the first day, a stock rose 1 3/8 points, on the second day it rose 1/4points, and on the third day it rose 4 1/2 points. What was the total risein points in the three days?(a) 6 1/8 points (b) 6 1/4 points (c) 5 5/14 points (d) 5 3/8 points
8. What would be the total weight of two parts, one weighing 4 5/6 poundsand the other weighing 14 7/8 pounds?(a) 18 6/7 lb (b) 19 3/8 lb (c) 12/14 lb (d) 19 17/24
9. A carpenter has three boards that measure 7 7/32 inches, 4 5/16 inches,and 5 3/8 inches. What is the total length of all three boards?(a) 18 3/32 in. (b) 17 9/32 in. (c) 16 29/32 in. (d) 16 7/32 in.
10. Find the distance between the arrows shown in the figure:
(a) 4 5/16 in. (b) 4 1/2 in. (c) 4 1/6 in. (d) 4 3/8 in.
Answers to the additional exercises:
1. d 2. b 3. b 4. c 5. a6. d 7. a 8. d 9. c 10. a
2 3/16”
2 1/8”
SL3100_frame_C12 Page 167 Friday, August 31, 2001 10:20 AM

168
Six Sigma and Beyond: Problem Solving and Basic Mathematics, Volume II
SUBTRACTION OF FRACTIONS
Subtraction is one of the four operations used with any type of number. Subtractionof fractions is a very common operation in any group of problems with measurements.
Objective:
The rules and requirements for subtracting fractions are very much thesame as for addition of fractions. Common denominators are needed. This sectiondemonstrates how to subtract one proper fraction from another when both have thesame denominator.
Directions:
An example of the type of problem in this lesson is
(This problem could also be written as 10/15 – 3/15.)
Notice two things:
1. The denominators are the same.2. The top fraction’s numerator is larger than the numerator of the bottom
fraction.
Steps:
For both ways to write the subtraction problem:
Step 1. Subtract the numerator of the bottom (or the right) fraction from thenumerator of the top (or the left) fraction to get the numerator of the answer.
Step 2. The denominator in the answer is the same as the common denominatorof the two given proper fractions
Step 3. Write the answer in simple form.
Example 1: Done both ways.
10/15 – 3/15 or
Step 1. The numerator is 7.
Step 2. The denominator is 15.Step 3. The answer is 7/15.
Example 2: 13/20 – 7/20 = ?
10/15
– 3/15---------------
10/15
– 3/15---------------
10
– 37
------- or 10 3– 7=
SL3100_frame_C12 Page 168 Friday, August 31, 2001 10:20 AM

Adding and Subtracting Fractions
169
Step 1. The numerator is 6.
13 – 7 = 6
Step 2. The denominator is 20.
6/20
Step 3. The simple form is 3/10.
Example 3:
Step 1. The numerator is 10.
Step 2. The denominator is 35.Step 3. The answer is 10/35. The simple form is 2/7.
SUBTRACTION OF MIXED NUMBERS
In subtracting mixed numbers, as in adding mixed numbers, the fractions must havecommon denominators. Be careful in subtraction, unlike addition, to subtract the
bottom
or right fraction from the
top
or left fraction. In subtraction,
order
counts.This presents a special problem when subtracting fractions, solved by using a fancytype of “borrowing.”
Directions:
This is a complicated concept. The discussion will be divided intotwo parts.
P
ART
1
An example is
Steps:
Step 1. Subtract the right (or bottom) proper fraction from the left properfraction (or top).
20/35
– 10/35------------------
20
– 10----------
10 4/7 – 3 1/7 or
10 4/7
– 3 1/7-----------------
SL3100_frame_C12 Page 169 Friday, August 31, 2001 10:20 AM

170
Six Sigma and Beyond: Problem Solving and Basic Mathematics, Volume II
Step 2. Subtract the right (or bottom) whole number from the left wholenumber (or top).
Step 3. Write the answer in simple form.
Example 1: 10 4/7 – 3 1/7 = ?
Step 1. 4/7 – 1/7 = 3/7Step 2. 10 – 3 = 7Step 3. The answer is 7 3/7 in simple form.
Example 2:
Step 1. 9/10 – 3/10 = 6/10Step 2. 12 – 4 = 8Step 3. The answer is 8 6/10. The simple form is 8 3/5.
P
ART
2
In Part 1, it was always possible to subtract the bottom proper fraction from the topproper fraction. In Part 2, it is
not
possible to subtract until a special type ofborrowing takes place, e.g., it is not possible to subtract the bottom proper fractionfrom the top:
Special caution:
Because the order of subtraction is important,
never
subtract the
top
numerator from the
bottom
number. The above example will be used to demon-strate how to borrow from the whole number 10 to make the proper fraction on topbig enough to subtract 4/7 from it.
10 1/7 means 10 + 1/7
10 1/7 same as 9 + 1 + 1/7
10 1/7 same as 9 + 1 1/7
10 1/7 same as 9 + 8/7
10 1/7 same as 9 8/7
12 9/10
– 4 3/10--------------------
10 1/7
– 8 4/7-----------------
Meaning of mixed number.
Take a 1 from 10.
Write mixed numbers.
Change to improper fraction.
Write as mixed number.
SL3100_frame_C12 Page 170 Friday, August 31, 2001 10:20 AM

Adding and Subtracting Fractions
171
So the problem is
which can be solved:
Steps:
Step 1. Take a 1 away from the whole number.Step 2. The 1 joins the proper fraction to form a mixed number.Step 3. The mixed number is changed to an improper fraction.Step 4. The original whole number is rejoined to the improper fraction to make
a mixed number.Step 5. Subtract as in Part 1.
Example 1:
Step 1. 5 3/8 same as 4 + 1 + 3/8Step 2. 5 3/8 same as 4 + 1 3/8Step 3. 5 3/8 same as 4 + 11/8Step 4. 5 3/8 same as 4 11/8Step 5. Subtract.
Example 2:
Step 1. 12 4/10 same as 11 + 1 + 4/10Step 2. 12 4/10 same as 11 + 1 4/10Step 3. 12 4/10 same as 11 + 14/10Step 4. 12 4/10 same as 11 14/10Step 5. Subtract
10 1/7
– 8 4/7----------------- becomes
9 8/7
– 8 4/7-----------------
9 8/7
– 8 4/71 4/7
-----------------
5 3/8
– 3 7/8-----------------
4 11/8
– 3 7/81 4/8
----------------- (The simple form is 1 1/2.)
12 4/10
– 8 7/10--------------------
SL3100_frame_C12 Page 171 Friday, August 31, 2001 10:20 AM

172
Six Sigma and Beyond: Problem Solving and Basic Mathematics, Volume II
Example 3:
Step 1. 14 same as 13 + 1Step 2. 14 same as 13 + 8/8Step 3. 14 same as 13 8/8Step 4. Subtract
SUBTRACTION OF FRACTIONS OF ALL KINDS
This section will demonstrate how to subtract fractions of all types with differentdenominators. This section is a combination of items already mastered.
Directions:
Step 1. If necessary, rewrite fractions to have common denominators.Step 2. Subtract and give the simple form of answer; the steps are brief because
some rules and steps learned earlier have been combined. Several examplesfollow.
Example 1.
Step 1. The common denominator is 20.9/10 same as 18/20.3/4 same as 15/20.
Step 2.
Example 2.
Step 1. The common denominator is 9.
11 14/10
– 8 7/103 7/10
--------------------- (The simple form is 3 7/10.)
14
– 3 3/8-----------------
13 8/8
– 3 3/810 5/8----------------
(The simple form is 10 5/8.)
9/10
– 3/4---------------
18/20
– 15/203/20
------------------ (The simple form is 3/20.)
5 6/9
– 1/3------------
SL3100_frame_C12 Page 172 Friday, August 31, 2001 10:20 AM

Adding and Subtracting Fractions
173
5 6/9 stays 5 6/9.1/3 same as 3/9.
Step 2.
Example 3.
Step 1. The common denominator is 21.9 3/7 same as 9 9/21.1 2/3 same as 1 14/21.
Step 2.
Example 4. 12 – 4 3/8 = ?
Step 1. The common denominator is 8.
Step 2.
ADDITION AND SUBTRACTIONOF FRACTIONS
This section demonstrates applied math problems with addition and subtraction offractions. Addition and subtraction are mixed in this section to gain practice, notonly in subtracting fractions, but also in knowing when to subtract.
Directions:
The biggest problem in solving applied problems is to be able to readeither the given words or labeled picture and to set up the math problem correctly.A word or two in a word problem usually indicates whether to add or subtract.
Words that mean to
add:
sumtotalandplusmoreincreased by
5 6/9
– 3/95 3/9------------
(The simple form is 5 1/3.)
9 3/7
– 1 2/3-----------------
9 9/21
– 1 14/21
-----------------------8 30/21
– 1 14/21 7 16/21
----------------------- (The simple form is 7 16/21.)
12
– 4 3/8
-----------------
11 8/8
– 4 3/87 5/8
-----------------
Borrowed 1 from 12 to make 8/8
(The simple form is 7 5/8.)
SL3100_frame_C12 Page 173 Friday, August 31, 2001 10:20 AM

174
Six Sigma and Beyond: Problem Solving and Basic Mathematics, Volume II
Words that mean to
subtract:
minuslesstake awaydifferenceremovereduced by
Some suggested steps to solve a math problem given in words or labeled pictures are:
Step 1. Read the problem carefully at least two times.Step 2. Be sure to understand what is to be found.Step 3. Be sure to understand all the information given.Step 4. Draw a picture of the problem if possible.Step 5. Look for key words that tell what mathematics operation is needed to
find the answer.
Example:
If a board 35 3/4 inches long is cut from an 8-foot board, how manyinches of board are left?
Step 1. Read.Step 2. Find the number of inches left on a board.Step 3. The whole board is 8 feet; 35 3/4 inches is to be cut off.Step 4. Drawing with key words.
Solution:
Subtract: 8 feet – 35 3/4 inches (First rewrite 8 feet as inches, 8
×
12 = 96.)
Answer: The simple form is 60 1/4 inches.
Cut off Amount left
35 3/4 in. ?
8 ft
96
– 35 3/4--------------------
95 4/4
– 35 3/4 60 1/4
--------------------
SL3100_frame_C12 Page 174 Friday, August 31, 2001 10:20 AM

Adding and Subtracting Fractions
175
EXERCISES
Directions:
Select the correct answer to each of the problems. If necessary, restudythe instructions and examples.
1. At 8:00 a.m. Wednesday, the water level was 48 3/4 inches. By 10:00 a.m.,it had dropped to 32 1/2 inches. How far did the water level drop in inches?(a) 16 2/4 (b) 16 1/2 (c) 16 1/4 (d) 15 3/4
2. A new motor brush was 1 5/8 inches long. Find the length of the brushafter it had been worn down by 9/16 inches.(a) 1 1/2 in. (b) 1 4/8 in. (c) 1 1/16 in. (d) 1 1/8 in.
3. How long does a piece of drill rod (a rod from which a drill is made)need to be to make 2 drill bits if each drill bit is 1 7/8 inches long?(a) 3 1/4 in. (b) 2 14/16 in. (c) 3 3/4 in. (d) 2 7/8 in.
4. A full gas tank will hold 20 3/10 gallons. If 13 9/10 gallons was neededto refill the tank after a trip, how much gas was burned on the trip?(a) 7 1/10 gal (b) 6 2/5 gal (c) 6 1/10 gal (d) 7 3/10 gal
5. A woman worked 2 1/4 hours in the morning and 3 4/5 hours in theafternoon. How long, in total, did she work that day?(a) 5 5/9 hr (b) 6 1/20 hr (c) 5 3/4 (d) 6 3/8 hr
6. A door was 31 3/8 inches wide. A carpenter planed off 11/16 inches. Howwide is the door now?(a) 30 11/16 in. (b) 31 8/16 in. (c) 30 5/8 in. (d) 31 1/2 in.
7. If it is 4 5/8 miles from the beach to a house and if the trip were madethree times, how many miles were traveled?(a) 13 7/8 mi (b) 12 5/8 mi (c) 13 1/8 mi (d) 12 15/24 mi
8. Sue had 7/12 of a yard of cloth before using 1/6 of a yard. How muchcloth (in yards) does she have left?(a) 2/12 yards (b) 1 yard (c) 5/12 yards (d) 1/2 yards
9. A contractor will add a 42 1/3-foot section of stockade fence to his presentfence. If the present fence is 72 3/4 feet long, how long will it be withthe addition?(a) 114 13/24 ft (b) 115 1/12 ft (c) 114 8/12 ft (d) 114 2/3 ft
10. A section of insulated telephone cable 45 9/10 feet long was cut from a1,000-foot reel. How much cable is left on the reel?(a) 954 1/10 ft (b) 954 9/10 ft (c) 955 9/10 ft (d) 145 9/10 ft
SL3100_frame_C12 Page 175 Friday, August 31, 2001 10:20 AM

176
Six Sigma and Beyond: Problem Solving and Basic Mathematics, Volume II
Answers to the exercises:
ADDITIONAL EXERCISES
Directions:
Select the correct answer, written in simple form, to each of the appliedproblems.
1. The figure shows an end view of a piece of steel cut from a strip of givenwidth and bent to make a
U
-bracket. How long does a piece of steel needto be to make this bracket? Add 3/16 inch for each bend to the measuresalready given.
(a) 21 5/8 in. (b) 21 3/4 in. (c) 20 13/48 in. (d) 21 10/16 in.
2. A piece of plywood 80 3/16 inches long must be trimmed by 9 3/4 inchesto fit between two shelf supports. What will be the finished length?(a) 70 7/16 in. (b) 71 3/4 in. (c) 71 7/16 in. (d) 70 in.
3. If 17 7/20 gallons were drained from a full 50-gallon tank of fuel oil, howmuch oil would still be in the tank?(a) 33 7/20 gal (b) 32 3/8 gal (c) 33 gal (d) 32 13/20 gal
4. Find the length of pipe needed to fill a 27 1/4-inch space if the pipe mustalso have a 2 3/8-inch overlap on each end.(a) 22 1/2 in. (b) 31 8/24 in. (c) 32 3/4 in. (d) 31 1/3 in.
5. A copper contact was insulated with the following: one 5/8-inch piece ofmica, one piece of 1/4 inch fiber, and one piece of 1/16-inch press board.What was the total thickness of the insulation?(a) 1/4 in. (b) 3/8 in. (c) 15/16 in. (d) 7/28 in.
6. A piece of metal 7/16 inches thick was ground down to a thickness of3/32 inch. In inches, how much metal was ground off of the 7/16-inchpiece?(a) 1/2 in. (b) 4/16 in. (c) 11/32 in. (d) 1/4 in.
1. c 2. c 3. c 4. b 5. b6. a 7. a 8. c 9. b 10. a
• How long does a piece of steel need to be to make the bracket?
• Add 3/16 inch for each bend to the measures already given.
SL3100_frame_C12 Page 176 Friday, August 31, 2001 10:20 AM

Adding and Subtracting Fractions
177
7. What was the loss in value of a stock that opened at 37 points and closedat 35 5/8 points?(a) 2 1/8 points (b) 2 3/8 points (c) 1 5/8 points (d) 1 3/8 points
8. A shelf has to be built to allow room for three boxes of the followinglengths: 27 1/2 inches, 15 3/8 inches, and 17 1/16 inches. How wide mustthe inside dimension of the shelf be?(a) 60 1/8 in. (b) 59 5/16 in. (c) 59 5/26 in. (d) 59 15/16 in.
9. An electronics kit includes a wire 17 1/2 feet long. If the first project inthe kit calls for 2 7/8 feet, how much is left for the other project?(a) 14 7/8 ft (b) 14 5/8 ft (c) 15 1/8 ft (d) 15 ft
10. What is the inside diameter (distance across a circle) of the conduit in theillustration if the outside diameter is 2 3/8 inches and the walls are 3/16inches thick?
(a) 2 1/4 in. (b) 2 3/8 in. (c) 1 7/8 in. (d) 2 in.
Answers to the additional exercises:
1. b 2. a 3. d 4. a 5. c6. c 7. d 8. d 9. b 10. d
SL3100_frame_C12 Page 177 Friday, August 31, 2001 10:20 AM

SL3100_frame_C12 Page 178 Friday, August 31, 2001 10:20 AM

179
Multiplication and Division of Fractions
Objective:
Multiplication and division in any number system are operations used todo addition and subtraction more easily. To perform multiplication and division offractions, the fractions do not have to be rewritten to have common denominators.However, some form changes have to be made. This chapter demonstrates how tomultiply and divide fractions and how to discover when these operations are calledfor in applied problems.
Definitions:
1.
Of:
“of” between a fraction and another number indicates to multiply2.
Over:
indicates to divide
MULTIPLICATION OF PROPERAND IMPROPER FRACTIONS
When adding and subtracting fractions, the fractions must have common denomi-nators. This is not true when multiplying fractions. However, fractions must be inproper or improper form before they can be multiplied. This section will demonstratehow to multiply proper and improper fractions. As always, the answer to any fractionproblem must be written in simple form.
Directions:
Step 1. The numerator of the answer is found by multiplying the numeratorof the given fractions.
Step 2. The denominator of the answer is found by multiplying the denominatorof the given fraction.
Step 3. The answer is written in simple form.
Some examples are
13
SL3100_frame_C13 Page 179 Friday, August 31, 2001 10:20 AM

180
Six Sigma and Beyond: Problem Solving and Basic Mathematics, Volume II
Example 1: 3/7
×
4/5 = ?
Step 1. 3
×
4 = 12Step 2. 7
×
5 = 35Step 3. The answer is 12/35; the simple form is 12/35.
Example 2: 10/12
×
4/5 = ?
Step 1. 10
×
4 = 40Step 2. 12
×
5 = 60Step 3. The
answer is 40/60; the simple form is 2/3.
Short-cut to reducing the answer:
There is a short-cut that can help obtain thesimple form of the answer without doing a large reducing step after multiplyingnumerators and denominators. Before the numerators and denominators are multi-plied, reduce the numerator of any of the fractions and any of the denominators asmany times as possible. Repeat Example 2 using the short-cut:
10/12
×
4/5 = ?
Short-cut: 10
2
/12
×
4/5
1
Reduce 10/5 to 2/1 by 510
2
/12
3
×
1
4/5
1
Reduce 4/12 to 1/3 by 4Now 10/12
×
4/5 has become 2/3
×
1/1
Answer: 2/3.
Note:
If the short-cut is used, the answer after multiplying numerators and denom-inators will be in the simple form. No more reducing will be necessary.
Example 3: 8/10
×
9/50 = ?
Short-cut:
4
8/10
×
9/50
25
Reduce by 28
2
/10
5
×
9/25 Reduce by 22/5
×
9/25
Answer: 18/125 (The answer is in simple form.)
Example 4: 15/8
×
10/3 = ?
Short-cut: 15
5
/8
×
10/3
1
Reduce by 35/8
4
×
10
5
/3
1
Reduce by 25/4
×
5/1
Answer: 25/4 (The simple form is 6 1/4.)
SL3100_frame_C13 Page 180 Friday, August 31, 2001 10:20 AM

Multiplication and Division of Fractions
181
MULTIPLICATION OF MIXED NUMBERS
This section will demonstrate how to multiply fractions when the fractions are givenin the form of mixed numbers and how to multiply fractions given in any form bywhole numbers.
Directions:
Four examples will be used in this lesson:
Example 1: 2 1/4
×
3/8Example 2: 5 3/5
×
8 4/7Example 3: 4
×
9/10Example 4: 6 5/8
×
10
Note:
When multiplying with mixed numbers, first change the mixed numbers intoimproper fractions and multiply.
Example 1: 2 1/4
×
3/8 = ?
Step 1. Rewrite and change 2 1/4 to an improper fraction.Step 2. 9/4
×
3/8 = 27/32Step 3. The simple form is 27/32.
Example 2: 5 3/5
×
8 4/7 = ?
Step 1. Rewrite, changing mixed numbers to improper fractions.
28/5
×
60/7
Step 2. Reduce, using the short-cut.28/5
1
×
60
12
/7 Reduce by 528
4
/5
1
×
60
12
/7
1
Reduce by 7
Step 3. 4/1
×
12/1 = 48/1 (The simple form is 48.)
Note:
To multiply fractions by whole numbers, rewrite the whole number with thegiven whole number as the numerator and 1 as the denominator; then multiply.
Example 3: 4
×
9/10 = ?
Step 1. Rewrite 4 as a fraction.4/1
×
9/10
Step 2. Reduce, using the short-cut.2
2
/1
×
9/10
5
Reduce by 2
SL3100_frame_C13 Page 181 Friday, August 31, 2001 10:20 AM

182
Six Sigma and Beyond: Problem Solving and Basic Mathematics, Volume II
Step 3. 2/1
×
9/5 = 18/5 (The simple form is 3 3/5.)
Example 4. 6 5/8
×
10 = ?
Step 1. Rewrite 10 as a fraction and 6 5/8 as an improper fraction.
53/8
×
10/1
Step 2. Reduce, using the short-cut.
53/8
4
×
10
5
/1 Reduce by 2
Step 3. 53/4
×
5/1 = 265/4 (The simple form is 66 1/4.)
Example 5. 1 3/8
×
6
×
9/10 = ?
Step 1. Rewrite and change 1 3/8 to improper fraction and change 6 to afraction.
11/8
×
6/1
×
9/10
Step 2. Reduce, using the short-cut.
11/8
4
×
6
3
/1 Reduce by 2
Step 3. 11/4
×
3/1
×
9/10 = 297/40 (The simple form is 7 17/40.)
DIVISION OF FRACTIONS
Dividing fractions, like multiplying, does not require the fractions to have commondenominators. In this section, division of fractions is by making several changes inthe way the problem is written and then by multiplying.
Directions:
Break the method into Part 1 and Part 2. Part 1 will be division of properand improper fractions, e.g.,
• 9/10
÷
3/4• 3/8
÷
1/4• 8/20
÷
2/3
Part 2 will be division of mixed numbers, whole numbers, and other fractions, e.g.,
• 4 1/2
÷
3/4• 10 3/8
÷
3
SL3100_frame_C13 Page 182 Friday, August 31, 2001 10:20 AM

Multiplication and Division of Fractions
183
• 15
÷
2 1/3• 9 3/5
÷
2 1/2
Before beginning, there must be a clear meaning for the symbol “
÷
” — “
÷
” indicates
divided by.
Example 1: 10
÷
5 means10 divided by 5 or
5 into 10 or
Example 2: 3/4
÷
1/2 means 3/4 divided by 1/2
Note:
The number left of
÷
is the dividend (or the left number) and the number rightof
÷
is the divisor (or the right number) .
Therefore, in Example 2, 3/4 is the dividend and 1/2 is the divisor.
Part 1:
To divide proper or improper fractions:
Step 1. Rewrite the division problem and turn the right fraction up-side-down;change the
÷
symbol into
×
.Step 2. Multiply the fractions.Step 3. Write the answer in simple form.
Some more examples will now be provided.
Example 1: 9/10
÷
3/4 = ?
Step 1. 9/10
×
4/3
Step 2. 9
3
/10
5
×
4
2
/3
1
Reduce by 3 and 23/5
×
2/1 = 6/5
Step 3. The simple form is 1 1/5.
Example 2: 3/8
÷
1/4 = ?
Step 1. 3/8
×
4/1
Step 2. 3/8
2
×
41/13/2 × 1/1 = 3/2
Step 3. The simple form is 1 1/2.
Example 3: 8/20 ÷ 2/3 = ?
5 10
SL3100_frame_C13 Page 183 Friday, August 31, 2001 10:20 AM

184 Six Sigma and Beyond: Problem Solving and Basic Mathematics, Volume II
Step 1. 8/20 × 3/2
Step 2. 84/20 × 3/21
41/205 × 3/11/5 × 3/1 = 3/5
Step 3. The simple form is 3/5.
Part 2: To divide with mixed numbers or whole numbers:
Step 1. Change all mixed numbers to improper fractions. Change the wholenumber to an improper fraction with:
(a) the whole number as the numerator(b) “1” as the denominator.
Steps 2 to 4. Now there is a division problem like those in Part 1: follow thesteps in Part 1.
Example 1: 4 1/2 ÷ 3/4 = ?
Step 1. 9/2 ÷ 3/4Step 2. 9/2 × 4/3Step 3. 39/21 × 42/31
3/1 × 2/1Step 4. The simple form is 6 (3/1 × 2/1 = 6/1).
Example 2: 10 3/8 ÷ 3 = ?
Step 1. 83/8 ÷ 3/1Step 2. 83/8 × 1/3Step 3. 83/8 × 1/3 = 83/24Step 4. The simple form is 3 11/24.
Example 3: 15 ÷ 2 1/3 = ?
Step 1. 15/1 ÷ 7/3Step 2. 15/1 × 3/7Step 3. 15/1 × 3/7 = 45/7Step 4. The simple form is 6 3/7.
Example 4: 9 3/5 ÷ 2 1/2
Step 1. 48/5 ÷ 5/2Step 2. 48/5 × 2/5Step 3. 48/5 × 2/5 = 96/25Step 4. The simple form is 3 21/25.
SL3100_frame_C13 Page 184 Friday, August 31, 2001 10:20 AM

Multiplication and Division of Fractions 185
PROBLEMS CALLING FOR ANY ONE OFTHE FOUR OPERATIONS
This section provides instruction and practice in solving applied problems. So far,the “how” to multiply and divide fractions have been discussed and demonstrated.The last chapter described “how” to add and subtract fractions. This section willprovide applied problems calling for any one of the four mathematics operations.
The exercises include only problems for multiplying and dividing fractions. Theextra exercises include problems for adding, subtracting, multiplying, or dividingfractions.
Directions: Problems calling for multiplication of fractions are very common. Divi-sion of fractions is a less common practice. There are several terms found in wordproblems that indicate multiplying: product, times, and or. It is common for “of” toappear between a fraction and another number. Words that indicate division mightbe quotient, divided by, into, or over.
The steps to follow to solve any word problem in mathematics are:
Step 1. Read the problem carefully at least two times.Step 2. Be sure to understand what is to be found.Step 3. Be sure to understand all the information given.Step 4. Draw a picture of the problem if possible.Step 5. Look for key words that tell what mathematics operation is needed to
find the answer.
Example 1: If a person makes $240 a week take-home pay, and 3/4 of itgoes toward living expenses, how much is left for savings andpocket money?
Step 1. Read twice.Step 2. How much money can be used for savings and pocket money?Step 3. $240 is take-home pay and 3/4 of $240 is for bills.Step 4.
Step 5. “of” appears between 3/4 and $240.
Solution: 3/4 × 240/13/14 × 26400/13/1 × 60/1 = 180/1$180 is used for bills.$60 is used for savings.
Bills Bills
Savings in Pocket Bills
SL3100_frame_C13 Page 185 Friday, August 31, 2001 10:20 AM

186 Six Sigma and Beyond: Problem Solving and Basic Mathematics, Volume II
EXERCISES
Directions: Select the correct answer to each of the applied problems. Each problemin this set of exercises is solved either by multiplying or dividing with fractions. Ifnecessary, restudy the instructions and examples.
1. A computer teletype can print out 13 2/3 lines in 1 minute. At this rate,how many lines can be printed out in 4 1/2 minutes?(a) 61 1/2 lines (b) 64 3/4 lines (c) 57 2/3 lines (d) 52 1/3 lines
2. A strip of molding 32 1/4 inches long is to be cut into 6 pieces of equallengths. What is the length of each piece?(a) 10 3/4 in. (b) 3 1/2 in. (c) 1 3/8 in. (d) 5 3/8 in.
3. A drill press operator needs 1 1/3 minutes to drill through 1 inch of metal.How long would it take the operator, in minutes, to drill through 7/8 inchof metal?(a) 13/20 min (b) 1 11/21 min (c) 1 1/6 min (d) 2 1/6 min
4. How many whole pieces of cable 9 1/4 feet long can be cut from a pieceof cable 39 3/4 feet long?(a) 2 (b) 3 (c) 4 (d) 5
5. A carpenter uses an auger bit to drill a hole 1 5/16 inches deep. If the bitadvances 3/32 inches on each turn, how many turns are needed to drillthe hole?(a) 12 (b) 10 (c) 14 (d) 8
6. A standard barrel contains 31 1/2 gallons. How many gallons are in abarrel that is 3/5 full?(a) 14 2/3 gal (b) 18 9/10 gal (c) 24 gal (d) 21 3/4 gal
7. The height of 1 step in a flight of stairs was 9 3/4 inches high. If the flighthad 13 steps, how high, in inches, was the total flight?(a) 137 5/8 in. (b) 94 1/2 in. (c) 126 3/4 in. (d) 148 3/8 in.
8. Weight bars are used to hold sheets of paper together in a tablet beforethe ends are glued. How many bars 7/16 inches wide can be placed sideby side in a space 5 1/4 inches wide?(a) 4 bars (b) 8 bars (c) 12 bars (d) 14 bars
9. Find the total height and width of the storage space in this set of drawers.The height of each storage space is 9 3/8 inches and the width of eachbox is 6 3/4 inches.
SL3100_frame_C13 Page 186 Friday, August 31, 2001 10:20 AM

Multiplication and Division of Fractions 187
(a) height 65 5/8 in. (b) height 36 3/8 in. (c) height 36 3/8 in.width 20 1/4 in. width 18 3/4 in. width 20 1/4 in.
(d) height 46 1/2 in.width 18 3/4 in.
10. Parts A, B, C, and D are of equal length. How long is A?
(a) 4 3/4 in. (b) 2 1/4 in. (c) 16/87 in. (d) 5 7/16 in.
Answers to the exercises:
ADDITIONAL EXERCISES
Directions: Select the correct answer to each of the applied problems. Each problemin this set can be solved by adding, subtracting, multiplying, or dividing fractions.
1. How many boards 3/4 inch thick are in a pile 20 1/4 inches high?(a) 12 boards (b) 38 boards (c) 15 boards (d) 27 boards
2. A bushing is to be force-fitted into a gear. The hole in the gear is 2 9/16inches in diameter and the bushing is 1/32 inch larger. What is the diameterof the bushing?(a) 2 5/16 in. (b) 2 5/8 in. (c) 2 19/32 in. (d) 2 9/16 in.
1. a 2. d 3. c 4. c 5. c6. b 7. c 8. c 9. a 10. d
SL3100_frame_C13 Page 187 Friday, August 31, 2001 10:20 AM

188 Six Sigma and Beyond: Problem Solving and Basic Mathematics, Volume II
3. A hole was drilled 5/16 inch deep into a piece of metal 1 1/4 inches thick.What is the distance from the bottom of the drilled hole to the other sideof the metal?(a) 1 1/16 in. (b) 1 9/16 in. (c) 9/16 in. (d) 15/16 in.
4. If an auger advances 3/32 of an inch on every turn, how far does it advanceon 10 turns? (a) 13/32 in. (b) 30/32 in. (c) 3/8 in. (d) 15/16
5. An order of 27,000 bolts was damaged in shipping to a customer. If 3/250of the shipment was ruined, how many bolts were wasted because ofdamage?(a) 543 bolts (b) 412 bolts (c) 118 bolts (d) 324 bolts
6. In making a bolt 2 3/8 inches long, 1/8 inch extra is needed because ofwaste. How many inches of bars are needed to make 25 bolts?(a) 59 3/4 in. (b) 62 1/2 in. (c) 54 in. (d) 50 3/8 in.
7. A wiring job needed 14 pieces of 1/2 inch conduit, each 6 1/2 feet long,and 10 pieces of conduit, each 4 3/8 feet long. Find the total number offeet of conduit needed.(a) 134 3/4 ft (b) 184 1/2 ft (c) 163 9/16 ft (d) 144 ft
8. A certain alloy is 2/3 aluminum. How many pounds of aluminum are in64 pounds of alloy?(a) 42 2/3 lb (b) 15 3/8 lb (c) 61 3/4 lb (d) 53 2/3 lb
9. In a certain job, cable lengths of 4 1/2 feet, 15 2/3 feet, and 10 5/8 feetwere needed. What is the length of cable needed?(a) 30 19/24 ft (b) 31 2/3 ft (c) 29 8/13 ft (d) 29 3/4 ft
10. Find the length of distance D from the figure.
(a) 1 3/8 in. (b) 1 15/16 in. (c) 1 3/8 in. (d) 1 7/16 in.
SL3100_frame_C13 Page 188 Friday, August 31, 2001 10:20 AM

Multiplication and Division of Fractions 189
Answers to the additional exercises:
1. d 2. c 3. d 4. d 5. d6. b 7. a 8. a 9. a 10. d
SL3100_frame_C13 Page 189 Friday, August 31, 2001 10:20 AM

SL3100_frame_C13 Page 190 Friday, August 31, 2001 10:20 AM

191
Ordering, Rounding, and Changing Decimals
Chapter 14 will describe how to use decimal numbers to solve mathematical problems.
Objective:
Understanding decimals and how to use them is important for anyonewho works with numbers: (1) in the United States, there has been a shift to the metricsystem of measures and problems in metrics can be solved with decimal numbers,and (2) calculators owned by many companies and persons use decimals only.
Decimals may be used when there are numbers other than whole numbers.Fractions are also used for numbers other than whole numbers. Fractions and dec-imals are two ways to write these “in-between” types of numbers.
Definitions:
1.
Decimal
(or
decimal number
): a number written as a whole number witha decimal point next to one of the digits
2.
Decimal point:
a dot placed in the number to locate the starting point forthe place values
3.
Key digit:
one digit right of the “last digit” in any decimal number; a termused when rounding off numbers
4.
Last digit:
the digit in the place value to which a given decimal numberis being rounded
5.
Place value:
the number value given to a location in a decimal number6.
Rounding off:
a method of giving a simple number close to the next givennumber
DECIMALS USING FRACTIONS
This section will explain decimals by using fractions. Every decimal can be writtenas a fraction. This fact helps in understanding and reading decimals.
Directions:
The U.S. money system is a decimal system and it will be used to explaindecimal numbers.
14
SL3100_frame_C14 Page 191 Friday, August 31, 2001 10:21 AM

192
Six Sigma and Beyond: Problem Solving and Basic Mathematics, Volume II
Therefore:
• A cash register receipt of $ .04 means 4 cents, and 4 cents is 4/100 of adollar: .04 is the same as 4/100.
• A cash register receipt of $ .38 means 38 cents which is 38/100 of a dollar:.38 is the same as 38/100.
• A cash register receipt of .60 means two things:(a)6 dimes or 6/10 of a dollar(b)60 cents or 60/100 of a dollar.6 is the same as 6/10 and 60/100.
Place values of the numbers to the right of the decimal point in decimal numbersare illustrated in the chart:
Methods to write a decimal as a fraction:
Method 1. Write a decimal number less than one as a fraction.
Step 1. The numerator of the fraction is the set of numbers to the
right
ofthe decimal point:(a)
Beginning
with the
left-most
non-zero digit(b)
Ending
with the
right-most
non-zero digitStep 2. The denominator of the fraction is the place value number of the
right-most non-zero
digit.Step 3. Reduce the fraction.
Example: .102
Step 1. The numerator is 102.
Facts about the U.S. Money System
1. There are 100 cents in 1 dollar.2. 1 cent is 1/100 of a dollar.3. There are 10 dimes in 1 dollar.4. 1 dime is 1/10 of a dollar.
10 1 1/10 1/100 1/1,000 1/10,000 1/100,000 1/1,000,000
tens
ones
tenths
hundreths
thousandths
ten thousandths
hundred thousandths
millionths
.
SL3100_frame_C14 Page 192 Friday, August 31, 2001 10:21 AM

Ordering, Rounding, and Changing Decimals
193
Step 2. The denominator is 1,000 because the “2” is in the 1/1000’s place.
Step 3. Reduce:
Example: .085
Step 1. The numerator is 85.Step 2. The denominator is 1000.
Step 3.
Example: .0004
Step 1. The numerator is 4.Step 2. The denominator is 10,000.
Step 3. Reduce:
Method 2. Write a decimal number that is larger than one as a fraction.
Step 1. The whole number part of a fraction (a mixed number) is the entirewhole number to the left of the decimal point in the decimalnumber.
Step 2. The proper fraction part of the mixed number is found as de-scribed in Method 1.
Example: Change 4.3 to a mixed number.
Step 1. The whole number part is 4.Step 2. .3 means 3/10: 4.3 is the same as 4 3/10.
Example: Change 12.25 to a mixed number.
Step 1. The whole number part is 12.Step 2. .25 is 25/100 which equals 1/4: 12.25 is the same as 12 1/4.
Special note:
Any whole number, such as 758, automatically has a decimal pointjust to the
right
of the digit farthest to the right. So, 758 could be written 758.0(with a decimal).
Example: 17 is the same as 17.0.
Example: 124 is the same as 124.0.
1021000------------ 51
500---------=
851,000------------- 17
200---------=
410,000---------------- 1
2,500-------------=
SL3100_frame_C14 Page 193 Friday, August 31, 2001 10:21 AM

194
Six Sigma and Beyond: Problem Solving and Basic Mathematics, Volume II
ROUNDING OFF
There are times when an exact answer is not required, but rather an “about” numberor an approximate number is needed. For example, if the almanac says a city has apopulation of 120,000, this is a number that is only close to the real populationwhich might actually be 121,168. In this section, “rounding off” an exact numberto an approximate number, close to the real number, will be demonstrated.
Directions:
In the method presented for rounding off numbers, two special termsare used. Work through an example.
Example 1: Round 1284 off to the 100’s place.The
last digit
is 2 (2 is in the 100’s place)The
key digit
is 8.
Steps to round off any decimal number:
Step 1. Recopy all digits to the left of the
last digit.
1_ _ _
Step 2. Replace all digits to the
right
of the
last digit
with zeros.
1_00
Step 3. Put the number into the
last digit’s
place by:(a) Putting in the last digit itself if the key digit is 4 or less.(b) Putting in one number larger than the last digit if the key digit
is 5 or larger.
1300(A “3” must be put in because the key digit “8” was bigger than 5.)
Example 2: Round 67,549 off to the 10’s place.
Step 1. Recopy all digits to the left of the 10’s place.
67,5_ _
Step 2. Digits to the right of the 10’s place.
67,5_0
Step 3. Digit in the 10’s place. (This digit must be a “5” because the keydigit (next to the one to the right) is bigger than 5, so the “last dig-it” is increased by 1. The answer is 67,550.)
SL3100_frame_C14 Page 194 Friday, August 31, 2001 10:21 AM

Ordering, Rounding, and Changing Decimals
195
Example 3: Round 843,107 off to the 10,000’s place.
Step 1. Digits to the left of the 10,000’s place.
8_ _,_ _ _
Step 2. Digits to the right of the 10,000’s place.
8_0,000
Step 3. Digit in the 10,000’s place. (Must be a “4” because the next digitto its right is less than 5. The answer is 840,000.)
ROUNDING OFF EXERCISES
Directions:
Select the number equal to the given number, rounded off to the givenplace value. If necessary, restudy the directions and examples.
1. 87.5 rounded to 10’s place(a) 90 (b) 80 (c) 88 (d) 87
2. 94.13 rounded to 1/10’s place(a) 95 (b) 94.1 (c) 94 (d) 94.2
3. 123.43 rounded to 10’s place(a) 120 (b) 100 (c) 130 (d) 123.4
4. 42.75 rounded to one’s place(a) 43 (b) 42.8 (c) 42 (d) 42.7
5. 9.9581 rounded to 1/100’s place(a) 9.958 (b) 9.96 (c) 10 (d) 9.95
6. 8,745,134 rounded to 10,000’s place(a) 8,740,000 (b) 8,700,000 (c) 8,750,000 (d) 8,800,00
7. 3.1932 rounded to tenth’s place(a) 3.19 (b) 3.1 (c) 3.2 (d) 3.21
8. 543.4 rounded to hundred’s place(a) 550 (b) 540 (c) 600 (d) 500
9. 84.1754 rounded to thousandth’s place.(a) 84.176 (b) 84.18 (c) 84.1754 (d) 84.175
SL3100_frame_C14 Page 195 Friday, August 31, 2001 10:21 AM

196
Six Sigma and Beyond: Problem Solving and Basic Mathematics, Volume II
10. 571.04 rounded to ten’s place.(a) 571.0 (b) 571 (c) 570 (d) 580
Answers to the rounding off exercises:
ADDITIONAL EXERCISES
Directions:
Select the number equal to the given number, rounded off to the givenplace value.
1. 38.4 rounded to 1’s place(a) 38 (b) 39 (c) 40 (d) 38.4
2. 1.79 rounded to 1/10’s place(a) 1.7 (b) 1.79 (c) 2 (d) 1.8
3. 4.348 rounded to hundredth’s place(a) 4.35 (b) 4.3 (c) 4.4 (d) 4.34
4. 625.039 rounded to hundred’s place(a) 600 (b) 700 (c) 625.04 (d) 630
5. 37.13 rounded to one’s place (a) 40 (b) 37 (c) 38 (d) 37.1
6. 37,184 rounded to 1000’s place(a) 38,000 (b) 37,200 (c) 38,200 (d) 37,000
7. 417.893 rounded to 1/100’s place(a) 417.893 (b) 417.89 (c) 417.9 (d) 400
8. 857.13 rounded to 100’s place(a) 900 (b) 860 (c) 857.13 (d) 800
9. 914,318 rounded to ten thousandth’s place(a) 914,000 (b) 900,000 (c) 920,000 (d) 910,000
10. 84.743 rounded to one’s place(a) 85 (b) 84.7 (c) 84 (d) 84.8
1. a 2. b 3. a 4. a 5. b6. c 7. c 8. d 9. d 10. c
SL3100_frame_C14 Page 196 Friday, August 31, 2001 10:21 AM

Ordering, Rounding, and Changing Decimals
197
Answers to the additional exercises:
CHANGING DECIMALS
When working with metric measurements, decimal numbers are used. It is necessaryto determine which of two decimal numbers is larger, e.g., is .89 meters larger orsmaller than .099 meters? This section will demonstrate how to write a group ofdecimal numbers in order of size.
Directions:
The rules for ordering decimals will be given three sections. The rulesare simple and easy to understand.
Example:
Which is larger: 0843 or .91?
Rule 1.
The decimal number having a non-zero digit in the place value farthest tothe left is larger.
Answer: .91 is larger than .0843 because the “9” in .91 is in a place valuefarther to the left than the “8” in .0843
Example: Which is larger: 1.004 or .9834?Answer: 1.004 because “1” is further left than “9”
Example: Which is larger: .0783 or .0535?
Rule 2.
If two decimal numbers have their left-most non-zero digits in the sameplace value positions, then the decimal number with the largest left-most non-zerodigit is larger.
Answer: .0783 is larger than .0535 because the “7” in .0783 is larger thanthe “5” in .0535
Example: Which is larger: 12.349 or 40.999?Answer: 40.999 because the “4” in 40.999 is larger than the “1” in 12.349
Example: Which is larger: 1.37 or 1.934 ?
Rule 3.
If two decimal numbers have the
same
left-most non-zero digit in the
same
place value position, then look one place to the right in each number until a higherdigit is reached.
1. a 2. d 3. a 4. a 5. b6. d 7. b 8. a 9. d 10. a
SL3100_frame_C14 Page 197 Friday, August 31, 2001 10:21 AM

198
Six Sigma and Beyond: Problem Solving and Basic Mathematics, Volume II
Answer: 1.934 is larger than 1.37 because “9” in the tenth’s place of 1.934is larger than “3” in the tenth’s place of 1.37
Example: Which is larger: 37.438 or 37.449?Answer: 37.449 because the “4” in the 1/100’s place of 37.449 is larger
than the “3” in the 1/100’s place of 37.438
EXERCISES
Directions:
Select the proper order by size, with the largest number on the left. Ifnecessary, restudy the instructions and examples.
1. (a) .0432 43.2 4.32 432(b) .432 4.32 43.2 432(c) 4.32 .0432 .432 432(d) 43.2 4.32 .432 .0432
2. (a) .196 196 19.6 1.96(b) 1.96 19.6 .196 196(c) 196 19.6 1.96 .196(d) 19.6 196 .196 1.96
3. (a) 587 5.87 58.7 .0587(b) 58.7 5.87 .587 .0587(c) 5.87 587 .587 58.7(d) .587 58.7 .0587 587
4. (a) 417 41.7 4.17 .417(b) 417 4.17 41.7 .417(c) 417 .417 41.7 4.17(d) 417 .0417 41.7 .417
5. (a) 69.3 6.93 693 .693(b) 693 6.93 69.3 .693(c) 69.3 693 6.93 .693(d) 693 69.3 6.93 .693
6. (a) 54.1 .541 51.4 5.41(b) 514 54.1 51.4 5.41(c) 5.41 541 51.4 54.1(d) 514 51.4 54.1 5.14
7. (a) 972 97.2 92.7 9.72(b) 972 97.2 9.27 9.72(c) 97.2 9.27 9.72 .927(d) 927 92.7 97.2 9.27
SL3100_frame_C14 Page 198 Friday, August 31, 2001 10:21 AM

Ordering, Rounding, and Changing Decimals
199
Answers to the exercises:
8. (a) 9.38 1.46 5.38 .097(b) 27.3 17.41 .98 .435(c) 32.17 4.85 .094 .715(d) 8.54 7.32 9.18 .44
9. (a) 7.314 3.82 4.09 .38(b) 9.38 4.093 3.604 8.714(c) 7.314 7.013 6.38 5.21(d) 8.24 9.36 8.39 4.24
1. d 2. c 3. b 4. a 5. d6. b 7. a 8. b 9. c
SL3100_frame_C14 Page 199 Friday, August 31, 2001 10:21 AM

SL3100_frame_C14 Page 200 Friday, August 31, 2001 10:21 AM

201
The Four Operations in Decimals
Objective:
This chapter demonstrates the four operations of addition, subtraction,multiplication, and division with decimal numbers. These operations should be donewith pencil and paper for times when a calculator is not available. Therefore, do notuse a calculator for this chapter. In addition to demonstrating the decimal operations,exercises with applied problems using decimals will be provided.
Definitions:
1.
Centimeter
(cm): A metric unit of length, about 3/8 inch2.
Column:
A vertical (up and down) row3.
Diameter:
The distance from one side of a circle to the other through thecenter
4.
Factors:
Numbers that are being multiplied5.
Millimeter
(mm): A metric unit of length, about 1/16 inch6.
Place holders:
Zeros used to fill in place values in decimal numbers7.
Powers of ten:
Numbers such as 10; 100; 1,000; 10,000; etc.8.
Product:
The answer to a multiplication problem9.
Vertical:
Up and down
ADDING AND SUBTRACTING
All four mathematic operations can be used with decimal numbers. In fact, calcu-lators use only decimal numbers.
Directions to add decimals:
Step 1. Write all numbers in a vertical column with all the decimal pointsaligned under each other.
Step 2. Insert zeros on the right end of any numbers to make all right ends even.Step 3. Insert a decimal point under all other decimal points where the answer
will be.Step 4. Add the numbers as if adding whole numbers.
15
SL3100_frame_C15 Page 201 Friday, August 31, 2001 10:22 AM

202
Six Sigma and Beyond: Problem Solving and Basic Mathematics, Volume II
Caution:
Be sure all same-place values are aligned over each other before adding!!
Example 1: 2.74 + 18.3 = ?
Step 1.
Step 2.
Step 3.
Step 4.
Answer: 21.04
Example 2: 48 + 7.84 + .196 = ?
Step 1.
Step 2.
Step 3.
Step 4.
Answer: 56.036
2.74
+ 18.3------------------Write numbers in a column.
2.74
+ 18.30------------------Insert zeros to make right ends even.
2.74
+ 18.30 .
------------------Insert decimal point in answer.
2.7411
+ 18.3021.04
------------------Add.
48.
7.84
+ .196---------------------Write numbers in a column.
48.000
7.840
+ .196--------------------- Insert zeros.
48.00
7.840
+ .196 .
---------------------Insert decimal point in answer.
4181.0100
7.8 00
+ .19656.036
-----------------------Add.
SL3100_frame_C15 Page 202 Friday, August 31, 2001 10:22 AM

The Four Operations in Decimals
203
Directions to subtract decimals:
Step 1. Write the two numbers in a vertical column with the two decimalpoints aligned under each other.
Step 2. Insert zeros on the right ends of any numbers to make the right endseven.
Step 3. Insert a decimal point under the other two decimal points where theanswer will be.
Step 4. Subtract the numbers as if subtracting whole numbers.
Example 1: 10.89 – 4.71 = ?
Step 1.
Step 2.
Step 3.
Step 4.
Answer: 6.18
Example 2: 17.8 – 4.37 = ?
Step 1.
Step 2.
Step 3.
10.89
– 4.71---------------Write numbers in a column.
10.89
– 4.71---------------Insert zeros (none needed).
10.89
– 4.71 .
---------------Insert decimal point in answer.
10.89
– 4.716.18
---------------Subtract.
17.8
– 4.37---------------Write numbers in a column.
17.80
– 4.37---------------Insert zeros.
17.80
– 4.37.
---------------Insert decimal points in answer.
SL3100_frame_C15 Page 203 Friday, August 31, 2001 10:22 AM

204
Six Sigma and Beyond: Problem Solving and Basic Mathematics, Volume II
Step 4.
Answer: 13.43
MULTIPLYING TWO DECIMAL NUMBERS
This section will demonstrate multiplying two decimal numbers together. Whendecimal numbers were added and subtracted it was important to keep all decimalpoints in a vertical line. This is not the case when multiplying decimal numbers.There is a new rule for locating the decimal point in the product of two decimalnumbers.
Example 1:
Step 1. Multiply the factors as if they were both whole numbers. In the ex-ample, multiply 745 by 38.
Step 2. To put the decimal point in the product:(a) Add the number of digits to the right of the decimal point in
each factor.(b) Starting to the right of the far right digit in the product from
Step 1, count over a number of times equal to the numberfound in (a) and put a decimal point.
In Example 1, factor 7.45 has 2 digits to the right of the decimal point: factor 3.8has 1 digit to the right of the decimal point:
2 + 1 = 3
Therefore, count over 3 times and put a decimal point:
17. 87 01
– 4. 37
13. 43------------------
Subtract.
7.45
× 3.8---------------
745
× 385960
223528310------------------
------------------
28.310321
SL3100_frame_C15 Page 204 Friday, August 31, 2001 10:22 AM

The Four Operations in Decimals
205
Answer: 28.31
Example 2:
Step 1.
Step 2.
Answer: .1176
Example 3:
Step 1.
Step 2.
Answer: .2025
Example 4:
Step 1.
14.7
× .008---------------
147
× 81176------------
Multiply.
14.7
.008.1176-------------
1
+ 3 4
--------
Count digits and move decimal point.
4 3 2 1
.375
× .54---------------
375
× 541500
187520250---------------
---------------Multiply.
.375
× .54.20250----------------
3
+ 2 5
-------
Count digits and move decimal point.
5 43 2 1
.018
× .004---------------
18
× 472
--------Multiply.
SL3100_frame_C15 Page 205 Friday, August 31, 2001 10:22 AM

206
Six Sigma and Beyond: Problem Solving and Basic Mathematics, Volume II
Step 2.
Answer: .000072
Note:
Four zeros needed to be added to fill in the place values. The zeros are called
place holders
.
DIVISION WITH DECIMALS
This section demonstrates division with decimal numbers. Division with decimalsis much like long division of whole numbers; however, there are two additional rulesfor the decimal points.
Directions:
First, review the meaning of three terms for the numbers in any divisionproblem:
or 12 ÷ 6 = 2
Definitions:
1.
Dividend:
The number being divided (12 in the example)2.
Divisor:
The number being divided into the dividend (6 in the example)3.
Quotient:
The answer to the division problem (2 in the example)
This set of instructions will be divided into three parts:
Part 1: Divisors are whole numbers and the quotient has no remainder.Part 2: Divisors are decimal numbers and the quotient has no remainder.Part 3: The quotient has a remainder.
P
ART
1
The examples in this section are
Example 1:
Example 2:
Example 3: 309.54 ÷ 134
.018
× .004.000072-------------------
3
+ 3 6
-------
Count digits and move decimal point.
5432 16
6 122
6 1.38
37 46.25
SL3100_frame_C15 Page 206 Friday, August 31, 2001 10:22 AM

The Four Operations in Decimals
207
Example 1:
Step 1. Put the decimal point in the quotient above the decimal point in thedividend.
Step 2. Divide as if dividing whole numbers.
Answer: .23
Example 2:
Step 1.
Step 2.
Answer: 1.25
Example 3: 309.54
÷
134 = ?
Step 1.
Step 2.
Answer: 2.31
6 1.38.
6 1.38.23
1 2 18 18
37 46.25
37 46.25. Put decimal point in quotient.
37 46.251.25
Divide.3792748585
134 309.54. Put decimal point in quotient.
134 309.542.31
Divide.268415402134134
SL3100_frame_C15 Page 207 Friday, August 31, 2001 10:22 AM

208
Six Sigma and Beyond: Problem Solving and Basic Mathematics, Volume II
P
ART
2
The examples in this section are
Example 1:
Example 2:
Example 3: 8.9388 ÷ 2.34
Example 1:
Step 1. Move the decimal point in the divisor over next to the divisionsymbol or to the right end of the divisor.
Step 2. Move the decimal point in the dividend the same number placesright as the decimal point in the divisor was moved.
Now the example is
Step 3. Divide as in Part 1.
Answer: 4.3
Example 2:
Steps 1-2.
.05 .215
1.6 3.84
.05 .215
.05 .215 2 places
5. 21.5
5. 21.5201515
4.3
1.6 3.84
1.6 3.84 Move the decimals.
16 38.4
SL3100_frame_C15 Page 208 Friday, August 31, 2001 10:22 AM

The Four Operations in Decimals
209
Step 3.
Answer: 2.4
Example 3: 8.9388
÷
2.34 = ?
Steps 1-2.
Step 3.
Answer: 3.82
P
ART
3
The examples are
Example 1: Rounded off to 1/100’s
Example 2: Rounded off to 1/10’s
Example 3: .816
÷
4.23 Rounded off to 1/100’s
The examples are of division when the divisor process never ends and if it werestopped, there would be a remainder.
Example 1:
Step 1. Move decimal points in the divisor and dividend if necessary.
16 38.4.
Divide.
16 38.42.4
326464
2.34 8.9388 Move the decimals.
2 2
234 893.88.
70219181872
468468
9 1.3
4.3 7.9
9 1.3 (No moves necessary.)
SL3100_frame_C15 Page 209 Friday, August 31, 2001 10:22 AM

210
Six Sigma and Beyond: Problem Solving and Basic Mathematics, Volume II
Step 2. Place the decimal point in the quotient above the decimal point inthe dividend.
Step 3. Divide until there is a digit in one place beyond the place valuewhere the answer must be rounded.
Note:
Zero may be added to the right end of the dividend to continue the divisionbeyond the given dividend.
Step 4. Round the quotient to the stated place value: round .144 to 1/100s.
Answer: .14
Example 2: Round to 1/10s.
Step 1.
Step 2.
Step 3.
Step 4. Round 1.83 to 1/10s.
Answer: 1.8
9 1.3.
9 1.300.144
940364036
(Two zeros were added.)
4.3 7.9
4.3 7.9 Move decimals.
1
43 79.
43 79..
Put decimal in quotient.
43 79.001.83
Divide.43360344160129
SL3100_frame_C15 Page 210 Friday, August 31, 2001 10:22 AM

The Four Operations in Decimals
211
Example 3: .816
÷
4.23 Round to 1/100s
Step 1. Move decimals.
Step 2.
Step 3.
Step 4. Round .192 to 1/100s.
Answer: .19
DIVISION WITH DECIMALS EXERCISES
Directions:
Select the correct answer to each of the following division problems. Ifnecessary, restudy the instructions and the examples.
1. (Round to 1/10s place.)(a) .15 (b) 13. (c) 1.3 (d) 1.5
2. (Round to 1/10s place.)(a) 11.9 (b) 12 (c) 13 (d) 12.6
3. (Round to 1/100s place.)(a) .4 (b) .35 (c) .36 (d) .38
4. 72.45 ÷ 23 (Round to 1/100s place.)(a) 3.09 (b) 3.15 (c) 2.84 (d) .314
5. (Round to 1/100s place.)(a) 18.73 (b) 31.41 (c) 2.78 (d) 3.56
4.23 .816
4.23 .816
423 81.6
2 2
423 81.6.
Put decimal in quotient.
423 81.600.192
Divide.42 339 3038 071 230 846
7 10.5
8 100.8
13 4.55
2.4 8.544
SL3100_frame_C15 Page 211 Friday, August 31, 2001 10:22 AM

212
Six Sigma and Beyond: Problem Solving and Basic Mathematics, Volume II
6. (Round to 1/100s place.)(a) 5.19 (b) 4.86 (c) 5.43 (d) 5.21
7. (Round to 1/100s place.)(a) .15 (b) .18 (c) .17 (d) .16
8. (Round to 1/100s place.)(a) 5.24 (b) 5.3 (c) 5.25 (d) 4.81
9. (Round to 1/100s place.)(a) 108.05 (b) 106.34 (c) 107.09 (d) 108.06
10. (Round to 1/1000s place.)(a) 2.90 (b) 2.92 (c) 2.913 (d) 2.938
Answers to the division with decimals exercises:
APPLIED PROBLEMS USING DECIMAL OPERATIONS
So far adding, subtracting, multiplying, and dividing decimals have been demon-strated. This section will use the operations to solve applied problems.
Directions:
Some suggested steps to solve any written applied problem.
Step 1. Read the problem carefully at least two timesStep 2. Be sure to understand what is to be found.Step 3. Be sure to understand all the given information.Step 4. Draw a picture of the problem if possible.Step 5. Look for key words that indicate what mathematics operation is needed
to find the answer.
Several terms found in written applied problems indicate a certain operation:
1. d 2. d 3. b 4. b 5. d6. d 7. d 8. a 9. a 10. c
Add Subtract Multiply Divide
sumandtotalmore thanplusincreasecombine
lessdifferenceminusless thanreduce
productoftimesby
quotientoverinto
.84 4.3764
9 1.43
1.4 7.34
.75 81.04
1.49 4.34
SL3100_frame_C15 Page 212 Friday, August 31, 2001 10:22 AM

The Four Operations in Decimals
213
EXERCISES
Directions:
Select the correct answer to each of the following applied problems. Ifnecessary, restudy the instructions and examples.
1. Find the total amount of current used by an iron using 5.3 amps and aradio using .7 amps.(a) 5.8 amps (b) 7.4 amps (c) 6.0 amps (d) 3.71 amps
2. What is the difference in the widths of two wires if one wire has a widthof .373 inches and the other wire has a width of .173 inches?(a) .31 in. (b) .2 in. (c) .546 in. (d) .417 in.
3. If a certain light bulb used .84 amps, how many amps would 12 of thesebulbs use?(a) 10.08 amps (b) 10.008 amps (c) 10.8 amps (d) 18 amps
4. If a farmer places 15 fence posts evenly spaced over a distance of 188feet, how many feet are between each post? (Round to 1/10s.)(a) 12.5 ft (b) 13 ft (c) 11.67 ft (d) 13.2 ft
5. If the distance between the outside circle and the inside circle is .0023inch, what is the diameter (distance across) of the inside circle?
(a) 3.7514 in. (b) 3.518 in. (c) 3.7454 in. (d) 3.7461 in.
6. A man who works 38.25 hours a week and is paid $6.72 per hour earnshow much money before taxes are taken out?(a) $263.76 (b) $245.57 (c) $257.04 (d) $284.75
7. How wide is distance d as shown in the diagram?
(a) 5.481 in. (b) 5.184 in. (c) 4.184 in. (d) 7.251 in.
3.75”
SL3100_frame_C15 Page 213 Friday, August 31, 2001 10:22 AM

214 Six Sigma and Beyond: Problem Solving and Basic Mathematics, Volume II
8. How many boards .375 inch thick are stacked in a pile that is 22.875inches high? (Round to 1’s place.)(a) 63 (b) 75 (c) 58 (d) 61
9. A board is 81.3 centimeters long. If 23.7 centimers are cut off of theboard, how long is the remaining piece?(a) 57.6 cm (b) 48.2 cm (c) 17.9 cm (d) 63.2 cm
10. A certain metal drill bit advances .013 millimeters with each turn. Howmany turns are necessary to drill through a piece of metal 4.34 millimetersthick? (Round to 1/10s place.)(a) 438.4 (b) 333.8 (c) 812.1 (d) 356
Answers to the exercises:
CHANGE A FRACTION INTO A DECIMAL
A special application of the division of decimals is changing a fraction into a decimal.This section will demonstrate how to change any fraction into a decimal numberrounded to any stated place value.
Directions:
1. To change a proper fraction into a decimal, divide the denominator intothe numerator and round it off to the stated place value.
2. To change a mixed number to a decimal, write the whole number that isleft of the decimal point, and write the decimal for the proper fractionpart to the right of the decimal.
Example 1: Change 3/4 to a decimal rounded to 1/100s place.
Answer: .75
1. c 2. b 3. a 4. a 5. c6. c 7. b 8. d 9. a 10. b
4 3 Divide.
4 3.00.75
2 8 20 20
SL3100_frame_C15 Page 214 Friday, August 31, 2001 10:22 AM

The Four Operations in Decimals 215
Example 2: Change 7/11 to a decimal rounded to 1/100s place.
Answer: .64
Example 3: Change 4 3/8 to a decimal rounded to 1/100s.
Answer: 4.38
Below is a table of the most common equal fraction-decimal values. They shouldbe memorized.
EXERCISES
Directions: Select the correct decimal, rounded to the stated place value, equal toeach of the fractions. If necessary, restudy the instructions and examples.
1. 2/5 (Round to 1/10s place.)(a) .3 (b) .2 (c) .4 (d) .5
Fraction Decimal
1/4 .251/3 .333 (approx.)1/2 .52/3 .667 (approx.)3/4 .75
11 7 Divide.
11 7.000.636
6 6 40 33 70 66 4
8 3 Divide.
8 3.000375
2 4 60 56 40 40
Rounded to .38.
SL3100_frame_C15 Page 215 Friday, August 31, 2001 10:22 AM

216 Six Sigma and Beyond: Problem Solving and Basic Mathematics, Volume II
2. 4/7 (Round to 1/100s place.)(a) .56 (b) .47 (c) .46 (d) .57
3. 3/8 (Round to 1/1,000s place.)(a) .38 (b) .375 (c) .37 (d) .385
4. 5/12 (Round to 1/10s place.)(a) .6 (b) .2 (c) .4 (d) .5
5. 7/11 (Round to 1/100s place.)(a) .64 (b) .63 (c) .72 (d) .71
6. 1 3/4 (Round to 1/100s place.)(a) 1.75 (b) 1.43 (c) 1.67 (d) 1.34
7. 3 4/9 (Round to 1/100s place.)(a) 3.33 (b) 3.67 (c) 3.49 (d) 3.44
8. 10 2/15 (Round to 1/100s place.)(a) 10.14 (b) 10.12 (c) 10.11 (d) 10.13
9. 14 5/7 (Round to 1/100s place.)(a) 14.64 (b) 14.71 (c) 14.67 (d) 14.57
10. 43 2/3 (Round to 1/100s place.)(a) 43.33 (b) 43.24 (c) 43.75 (d) 43.67
Answers to the exercises:
1. c 2. d 3. b 4. c 5. a6. a 7. d 8. d 9. b 10. d
SL3100_frame_C15 Page 216 Friday, August 31, 2001 10:22 AM

217
Squares, Square Roots, Cubes, Cube Roots, and Proportions
Objective:
The focus of this section is to find the square and square root of numbers.Because these are advanced skills, this section was placed near the end of the basicmath material. Finding the square or cube of a number is a common application inmany area and volume formulas as well as in statistics. Squares and square rootsare also used in the “Rule of Pythagoras” which is a simple method to find the lengthof the hypotenuse of a right triangle when the other two sides are known. Anothercommon application is the calculation of variance and standard deviation.
In many problems, a change in one quantity causes a change in a related quantity.Examples are problems such as gear/ratio, pulleys, scale models, gas mileage, etc.This chapter will demonstrate how to determine if a problem can be solved with aproportion and if so, how to do it.
Definitions:
1.
Cube:
the result after multiplying three of the given numbers together2.
Cube root:
the number of which a given number is the cube3.
Rule of Pythagoras:
a method used to find the length of a hypotenusewhen the lengths of the other two sides are given
4.
Square:
the product found by multiplying two of the given numberstogether
5.
Square root:
the number which when squared will produce a given number6.
Proportion:
a math statement that two ratios are equal7.
Proportional figures:
figures of the same shape and same size8.
Proportional quantities:
quantities that act the same or exactly the oppo-site by the same factor
9.
Ratio:
a comparison of two numbers10.
Similar figures
(or scale modes): figures of the same shape and same size;same as proportional figures
16
SL3100_frame_C16 Page 217 Friday, August 31, 2001 10:23 AM

218
Six Sigma and Beyond: Problem Solving and Basic Mathematics, Volume II
SQUARE AND CUBE NUMBERS
This section demonstrates how to square a number and how to cube a number. Thesetwo skills are often used in statistics as well as in finding areas and volumes.
Square of a number:
The square of a number is the product of that number timesitself one time.
Example 1: What is the square of 5?
5
×
5 = 25
Answer: 25
Example 2: What is the square of 4 2/3?
4 2/3
×
4 2/314/3
×
14/3 = 196/9
Answer: 21 7/9
Squaring a number:
Squaring a number is to obtain the square of the number.
Cube of a number:
The cube of a number is the product of the square of the numberand the number itself or the product of multiplying three of the numbers together.
Cubing a number:
Cubing a number is to obtain the cube of the number.
Example 3: Find the cube of 8.
8
×
8
×
8 = 512
Answer: 512
Example 4: Find the cube of 4.7.
4.7
×
4.7
×
4.7 = 103.823
Answer: 103.823
Example 5: Find the cube of 3 1/4.
13/4
×
13/4
×
13/4 = 2197/64
Answer: 34 21/64 or 34.328
SL3100_frame_C16 Page 218 Friday, August 31, 2001 10:23 AM

Squares, Square Roots, Cubes, Cube Roots, and Proportions
219
EXERCISES
Directions:
Select the correct value of the square or cube of each of the followingnumbers. Round any decimal answers off to the 1/100s place. If necessary, restudythe instructions and examples.
1. Find the square of 9.(a) 81 (b) 27 (c) 18 (d) 729
2. Find the cube of 3.(a) 18 (b) 6 (c) 9 (d) 27
3. What is the result of cubing 11?(a) 22 (b) 121 (c) 33 (d) 1331
4. What is the square of .8?(a) .64 (b) .51 (c) 1.6 (d) 6.4
5. Find the square of 1/2.(a) 1 1/2 (b) 1/4 (c) 3/4 (d) 1/8
6. Find the cube of 1/2.(a) 1/16 (b) 1/4 (c) 3/4 (d) 1/8
7. What is the square of 4.3?(a) 341.88 (b) 8.6 (c) 18.49 (d) 12.9
8. What is the cube of 1.8?(a) 3.6 (b) 5.83 (c) 3.24 (d) 5.4
9. What is the result of squaring 6 3/4?(a) 20 1/4 (b) 45 9/16 (c) 83 9/16 (d) 13 1/2
10. What is the result of cubing 2 1/3?(a) 3 1/27 (b) 24 17/29 (c) 18 3/8 (d) 12 19/27
11. What is the square of 8?(a) 64 (b) 512 (c) 24 (d) 16
12. What is the cube of 10?(a) 100 (b) 30 (c) 20 (d) 1000
13. Find the square of 4.5.(a) 91.13 (b) 9 (c) 20.25 (d) 13.5
SL3100_frame_C16 Page 219 Friday, August 31, 2001 10:23 AM

220
Six Sigma and Beyond: Problem Solving and Basic Mathematics, Volume II
14. Find the cube of 9 1/3.(a) 813 1/27 (b) 27 (c) 729 1/27 (d) 87 1/9
15. What is the result of squaring 19.4?(a) 376.36 (b) 38.8 (c) 7301.38 (d) 58.2
Answers to the exercises:
SQUARES AND CUBE ROOTS
The opposite of finding the square of a number is to find the square root. The sameis true for cubing a number and finding the cube root. Finding the square root orcube root of a number is a skill used mostly in algebra problems and statistics.
Square root of a number:
The square root is a number which when squared willproduce a given number.
Example 1: What is the square root of 9?
Answer: 3 because the square of 3 is 9.
Example 2: What is the square root of 36?
Answer: 6 because the square of 6 is 36.
New symbol:
Example 3: What number is equal to?
Answer: 9 because the square of 9 is 81.
Example 4: What number is equal to?
Answer: This problem is different because no whole number squaredequals 40 (6 squared is 36; 7 squared equals 49).
1. a 2. d 3. d 4. a 5. b6. d 7. c 8. b 9. b 10. d
11. a 12. d 13. c 14. a 15. a
symbol for square root
16 square root of 16
75 square root of 75
81
40
SL3100_frame_C16 Page 220 Friday, August 31, 2001 10:23 AM

Squares, Square Roots, Cubes, Cube Roots, and Proportions
221
Therefore, the square root of 40 is between 6 and 7. The method below describeshow to find the square root of any whole number from 1 to 100 using Table 16.1.(Example 4 will be the model.)
Step 1. Locate the given number in one of the columns labeled “No.” (Forthe example, find 40 under “No.”)
Step 2. Read the number two columns to the right of the given number un-der “Square Root.” This number is the square root of the givennumber. (For the example, 6.325 is the square root of 40.)
Note:
All the square roots in Table 16.1 are rounded off to the 1/100s place.
Example 5: Find the value of
Answer: 8.367
Example 6: Find the value of
Answer: 9.539
Another feature of Table 16.1 is the column marked “Sq.” This column givesthe square of the numbers to the left of it in the “No.” column.
1. Look under “Sq.” to 441. This is the square of 21.2. Look under “Sq.” to 5476. This is the square of 74.
Note:
If 441 is the square of 21, then 21 must be the square root of 441. Therefore,every number under “No.” is the square root of the number next to it under “Sq.”
To find the square root of whole numbers more than 100:
Step 1. Find the given number that is more than 100 under the column la-beled “Sq.” in Table 16.1.(a) If the given number is found, go to Step 2.(b) If the given number is not found, stop. This table cannot be
used.Step 2. Look at the number just to the left of the given number in the col-
umn labeled “No.” — the square root of the given number.
Example 7: Find the value of
Step 1. Find 841 under “Sq.”Step 2. Look left under “No.” and see 29.
Answer: 29
70
91
841
SL3100_frame_C16 Page 221 Friday, August 31, 2001 10:23 AM

222
Six Sigma and Beyond: Problem Solving and Basic Mathematics, Volume II
TABLE 16.1
Squares, Square Roots, Cubes, and Cube Roots (1–100)
No. Sq.SquareRoot Cube
CubeRoot
1 1 1.000 1 1.0002 4 1.414 8 1.2603 9 1.732 27 1.4424 16 2.000 64 1.5875 25 2.236 125 1.7106 36 2.449 216 1.8177 49 2.646 343 1.9138 64 2.828 512 2.0009 81 3.000 729 2.080
10 100 3.162 1,000 2.15411 121 3.317 1,331 2.22412 144 3.464 1,728 2.28913 169 3.606 2,197 2.35114 196 3.742 2,744 2.41015 225 3.873 3,375 2.46616 256 4.000 4,096 2.52017 289 4.123 4,913 2.57118 324 4.243 5,832 2.62119 361 4.359 6,859 2.66820 400 4.472 8,000 2.71421 441 4.583 9,261 2.75922 484 4.690 10,648 2.80223 529 4.796 12,167 2.84424 576 4.899 13,824 2.88425 625 5.000 15,625 2.92426 676 5.099 17,576 2.95227 729 5.196 19,683 3.00028 784 5.291 21,952 3.03729 841 5.385 24,389 3.07230 900 5.477 27,000 3.10731 961 5.568 29,791 3.14132 1,024 5.657 32,765 3.17533 1,039 5.745 35,937 3.20334 1,156 5.831 39,304 3.24035 1,225 5,916 42,875 3.27136 1,296 6,000 46,656 3.30237 1,369 6.083 50,653 3.33238 1,444 6,184 54,872 3.36239 1,521 6,245 59,319 3.39140 1,600 6,325 64,000 3.42041 1,681 6.403 68,921 3.44342 1,764 6.481 74,088 3.476
SL3100_frame_C16 Page 222 Friday, August 31, 2001 10:23 AM

Squares, Square Roots, Cubes, Cube Roots, and Proportions
223
43 1,849 6.557 79,507 3.50344 1,936 6.633 85,184 3.53045 2,025 6.703 91,125 3.55146 2,116 6.782 97,336 3.58347 2,029 6.856 103,823 3.60948 2,304 6.928 110,592 3.63149 2,401 7.00 117,649 3.65950 2,500 7.071 125,000 3.68451 2,601 7.141 132,651 3.70852 2,704 7.211 140,603 3.73253 2,880 7.280 148,877 3.75654 2,916 7.348 157,464 7.78055 3,025 7.416 166,375 3.80356 3,136 7.483 175,616 3.82657 3,249 7.550 185,193 3.84858 3,364 7.616 195,112 3.87159 3,481 7.631 205,379 3.89360 3,600 7.746 216,000 3.91561 3,721 7.810 226,981 3.93562 3,844 7.874 238,328 3.95863 3,969 7.937 250,047 3.97964 4,096 8.000 262,144 4.00065 4,225 8.062 274,625 4.02166 4,356 8.124 287,496 4.04167 4,489 8.185 300,763 4.05268 4,624 8.246 314,432 4.08269 4,761 8.307 328,509 4.10270 4,900 8.367 343,000 4.12171 5,041 8.426 357,911 4.14172 5,184 8.485 373,248 4.16073 5,329 8.544 389,017 4.17974 5,476 8.602 405,224 4.19875 5,625 8.660 421,875 4.21776 5,776 8.718 438,976 4.23677 5,929 8.775 456,533 4.25478 6,084 8.832 474,552 4.27379 6,241 8.888 493,039 4.29180 6,400 8.944 512,000 4.30981 6,561 9.000 531,441 4.32782 6,724 9.055 551,368 4.34483 6,839 9.110 571,787 4.36284 7,056 9.165 592,704 4.380
TABLE 16.1
(Continued)
Squares, Square Roots, Cubes, and Cube Roots (1–100)
No. Sq.SquareRoot Cube
CubeRoot
SL3100_frame_C16 Page 223 Friday, August 31, 2001 10:23 AM

224
Six Sigma and Beyond: Problem Solving and Basic Mathematics, Volume II
Example 8: Find the value of
Answer: 92
Example 9: Find value of
Answer: Cannot be found using Table 16.1.
Cube root:
The cube root of a given number is that number whose cube is the givennumber.
Symbol:
symbol for cube root
To find the cube root of a given whole number from 1 to 100 using Table 16.1:
Step 1. Locate the given number in one of the columns marked “No.”Step 2. See the number four columns to the right of the given number un-
der “Cube Root.”
Example 10: Find the cube root of 45.
85 7,225 9.220 614,125 4.39786 7,396 9.274 636,056 4.41487 7,569 9.327 658,503 4.43188 7,744 9.381 681,472 4.44889 7,921 9.434 704,969 4.46590 8,100 9.487 729,000 4.48191 8,281 9.539 753,571 4.49392 8,464 9.592 778,638 4.51493 8,649 9.611 804,357 4.53194 8,836 9.695 830,584 4.54795 9,025 9.747 857,375 4.56396 9,216 9.798 884,736 4.57997 9,409 9.849 912,673 4.59598 9,604 9.899 941,192 4.61099 9,801 9.950 970,299 4.626
100 10,000 10.00 1,000,000 4.632
Note:
No., number; Sq., square.
TABLE 16.1
(Continued)
Squares, Square Roots, Cubes, and Cube Roots (1–100)
No. Sq.SquareRoot Cube
CubeRoot
8464
3000
3
SL3100_frame_C16 Page 224 Friday, August 31, 2001 10:23 AM

Squares, Square Roots, Cubes, Cube Roots, and Proportions
225
Step 1. Locate 45 under “No.”Step 2. Read 3.557 under Cube Root.
Answer: 3.557
Example 11: Find the value of
Step 1. Locate 66 under “No.”Step 2. See 4.041 under Cube Root.
Answer: 4.041
CALCULATING THE SQUARE ROOT
There are several methods for finding the square root of a number. One is to useTable 6.1, another is to use a calculator with a square root function, and the thirdis to actually calculate the number. This calculation method will be presented in thissection. This method is difficult to remember. The steps in this method will includean example.
Example 1: Find the square root of 579.1. Round answer to the 1/10s place
.
To find the square root of any decimal number, with the resultrounded to a given place value:
Step 1. Write the symbol over the given number.
Step 2. Mark off pairs of digits in both directions from the decimal point.
Step 3. Put a decimal point in the answer above the decimal point in thegiven number.
Step 4. Over the group of numbers farthest left (a pair or single), put thelargest number whose square is not larger than the number in theleft group.
2 is the largest number whose square (4) is not larger than 5.
663
579
5, 79.10, 00,
5, 79.10, 00,.
5, 79.10, 00,.2
SL3100_frame_C16 Page 225 Friday, August 31, 2001 10:23 AM

226
Six Sigma and Beyond: Problem Solving and Basic Mathematics, Volume II
Step 5. Square the first number on top (2) and put the result (4) under thenumber in the far left group and subtract.
Step 6. Add the barrier (a line) to the left of the answer (1) to thesubtraction.
Step 7. Double the entire number on top (2), write it (4) to the left of thebarrier, leaving one space (place value) to the left of the barrierempty (
).Step 8. Bring down the next pair of numbers (79), putting them to the
right of the answer to the subtraction (1) of Step 5.
Step 9. Divide the number to the left of the barrier (4
|1) into the numberto the right of the barrier (179).(a) The result (4) goes over the pair of numbers last brought
down (79).(b) The number in the blank spot (
) left of the barrier (4) mustbe the same as the new answer on top (4).
(c) Multiply the answer (4) times the whole number to the left ofthe barrier (44); put down the product (like long division).
All other steps. Repeat steps 6 to 9 over and over until the answer has num-bers in the place values asked for.
Answer: 24.06
5, 79.10, 00,.2
41
5, 79.10, 00,.2
41
barrier
5, 79.10, 00,.2
41 794
5, 79.10, 00,.24
41 794 4 1 76
3
SL3100_frame_C16 Page 226 Friday, August 31, 2001 10:23 AM

Squares, Square Roots, Cubes, Cube Roots, and Proportions
227
Example 2: Find the square root of 8.16. Round answer to the 1/100s place.
Steps 1–3.
Steps 4–6.
Steps 7–8.
Step 9.
Other steps:
Answer: 2.86
Example 3: Find . Round answer to 1/10s place.
Steps 1–5.
8. 16, 00, 00,.
8. 16, 00, 00,2.
44
8. 16, 00, 00,2.
44 164
8. 16, 00, 00,2. 8
44 164 3 84
32
8. 16, 00, 00,2. 8 5 6
44 164 8 3 84
3200282537500342363264
5 6 0
5 7 0 6
4178
SL3100_frame_C16 Page 227 Friday, August 31, 2001 10:23 AM

228
Six Sigma and Beyond: Problem Solving and Basic Mathematics, Volume II
Steps 6–9.
All other steps:
Answer: 64.6
EXERCISES
Directions:
Select the correct value of the square root, rounded to the given placevalue, for each number. Do not use a calculator. If necessary, restudy the instructionsand examples.
1. to 1/10s place.(a) 5.9 (b) 6.71 (c) 6.9 (d) 5.8
2. to 1/10s place.(a) 24.1 (b) 269.1 (c) 26.9 (d) 23.2
3. to 1s place.(a) 132 (b) 130 (c) 131 (d) 129
4. to 1/100s place.(a) 3.06 (b) 4.02 (c) 4.18 (d) 3.19
41, 78.00, 006 .
365
41, 78.00, 006 4.
365 784 96 82
12
41, 78.00, 006 4.63
365 784 96 82 00
12
77 164 84 003 87 69 96 31
12 8
12 92
47
538.5
17360
9.38
SL3100_frame_C16 Page 228 Friday, August 31, 2001 10:23 AM

Squares, Square Roots, Cubes, Cube Roots, and Proportions
229
5. to 1/1000s place.(a) .695 (b) .656 (c) .614 (d) .718
6. to 1/10s place.(a) 9.8 (b) 9.4 (c) 8.7 (d) 9.2
7. to 1/1000s place.(a) 2.220 (b) 3.104 (c) 3.106 (d) 2.008
8. to 1s place.(a) 85 (b) 90 (c) 89 (d) 87
9. to 1/1000s place.(a) 14.213 (b) 14.108 (c) 13.829 (d) 13.146
10. to 1/1000s place.(a) .985 (b) .914 (c) .991 (d) .875
11. to 1/10s place.(a) 9.5 (b) 8.1 (c) 9.7 (d) 9.8
12. to 1/1000s place.(a) 1.715 (b) 1.675 (c) 1.780 (d) 1.438
13. to 1/10s place.(a) 19.9 (b) 20.4 (c) 20.18 (d) 19.4
14. to 1s place.(a) 302 (b) 309 (c) 315 (d) 306
15. to 1/100s place.(a) .90 (b) .92 (c) .91 (d) .93
Answers to the exercises:
ADDITIONAL EXERCISES
Directions:
Select the correct value for the square root or the cube root for each ofthe following whole numbers from Table 16.1. In the answers, the choice “not in”means the square or cube root is not in the table. If necessary, restudy the instructionsand examples.
1. c 2. d 3. a 4. a 5. b6. d 7. a 8. b 9. c 10. c
11. a 12. c 13. b 14. d 15. b
.43
85
4.93
8143
191.25
.982
90
3.17
417
93417
.845
SL3100_frame_C16 Page 229 Friday, August 31, 2001 10:23 AM

230
Six Sigma and Beyond: Problem Solving and Basic Mathematics, Volume II
1. Find the square root of 4.(a) 16 (b) 1 (c) 2 (d) 64
2. What is the square root of 49?(a) not in (b) 2401 (c) 3.659 (d) 7
3. Find the cube root of 8.(a) 2 (b) 64 (c) 2.828 (d) 4
4. What is the value of ?(a) 4 (b) 8 (c) not in (d) 32
5. Find the square root of 18.(a) 2.621 (b) 9 (c) 4.243 (d) not in
6. Find the cube root of 22.(a) 4.690 (b) 6.104 (c) 2.802 (d) 7.333
7. Find the square root of 84.(a) 21 (b) 9.165 (c) 42 (d) 4.380
8. What is the value of ?(a) 16.917 (b) 121 (c) 18.213 (d) not in
9. What is the value of ?(a) 4.362 (b) 8.741 (c) 9.110 (d) 27.231
10. Find the square root of 784.(a) not in (b) 28 (c) 19.4 (d) 392
11. Find the square root of 16.(a) 4 (b) 2.520 (c) 8 (d) 2
12. What is the value of ?(a) not in (b) 6 (c) 18 (d) 3.302
13. What is the cube root of 27?(a) 5.196 (b) 9 (c) 3 (d) not in
14. Find the square root of 14.(a) 7 (b) 5.106 (c) 2.410 (d) 3.742
64
242
833
36
SL3100_frame_C16 Page 230 Friday, August 31, 2001 10:23 AM

Squares, Square Roots, Cubes, Cube Roots, and Proportions
231
15. What is the square root of 79?(a) 9.27 (b) 4.291 (c) 8.888 (d) 38.51
16. What is the value of ?(a) 6.782 (b) 5.804 (c) 3.583 (d) 15.351
17. Find the square root of 6241.(a) 810.4 (b) 79 (c) 3120 (d) not in
18. What is the value of ?(a) 4.563 (b) 4841 (c) not in (d) 9.747
19. What is the cube root of 25?(a) 8.333 (b) 5 (c) 625 (d) 2.924
20. Find the square root of 8000.(a) 90.18 (b) not in (c) 4000 (d) 40
Answers to the additional exercises:
APPLICATION OF SQUARE ROOT
This section illustrates square roots used in an applied situation involving any righttriangle. To illustrate the application, the names of the sides of a right triangle mustbe known. A right triangle is a triangle which has one right angle and special namesfor the sides.
Hypotenuse:
The side opposite the right angle.
Legs:
The two sides of the triangle that form the right angle.
1. c 2. d 3. a 4. b 5. c6. c 7. b 8. d 9. a 10. b
11. a 12. b 13. c 14. d 15. c16. c 17. b 18. d 19. d 20. b
Sides of a right triangle.
463
95
SL3100_frame_C16 Page 231 Friday, August 31, 2001 10:23 AM

232
Six Sigma and Beyond: Problem Solving and Basic Mathematics, Volume II
Example 1: Find the length of the hypotenuse in the right triangle:
To find the length of the hypotenuse of a right triangle when the lengths of bothlegs are known:
Step 1. Find the square of each leg and add the squares.Step 2. Find the square root of the answer from Step 1.
Solve Example 1.
Step 1. The square of 2 is 4.The square of 5 is 25.Add the squares = 29.
Step 2. Find the square root of 29. (Round to 1/10s place.)
Answer: 5.4
Note:
To find the needed square roots use either (a) Table 16.1 or (b) manualcalculation (use the method in Calculating the Square Root).
Example 2: Find the length of the hypotenuse in the triangle. (Round theanswer to 1/10s place.)
Step 1. The square of 17 is 289.The square of 6 is 36.Add the squares = 325.
Step 2. Find the square root of 325.
Answer: 18.0
SL3100_frame_C16 Page 232 Friday, August 31, 2001 10:23 AM

Squares, Square Roots, Cubes, Cube Roots, and Proportions 233
Example 3: Find the length of the hypotenuse in the triangle. (Round answerto nearest 1 inch.)
Step 1. 1 ft 9 in. is 21 in.2 ft 2 in. is 26 in.21 squared is 441.26 squared is 676.Add the squares = 1117.
Step 2. Find the square root of 1117.
Answer: 33 inches (2 feet, 9 inches)
Example 4: Find the length of the hypotenuse in the triangle below. Provideanswer to nearest 1/10 inch written as a decimal.
Step 1. Change both leg lengths to decimals. (Round to 1/100s place.)
3 3/8 = 3.38.2 1/4 = 2.25.
The square of 3.38 is 11.42.The square of 2.25 is 5.06.
The sum of the squares is 16.48.Step 2. Find the square root of 16.48. (Round to 1/10s place.)
Answer: 4.1 inch
SL3100_frame_C16 Page 233 Friday, August 31, 2001 10:23 AM

234 Six Sigma and Beyond: Problem Solving and Basic Mathematics, Volume II
EXERCISES
Directions: Select the correct value for the length of the hypotenuse in each of thefollowing right triangles. If necessary, restudy the instructions and examples. Roundall decimal answers off to the 1/10s place. Use Table 16.1. Solve all exercises beforelooking at the answers.
1.(a) 5.3 ft (b) 7.2 ft (c) 10.0 ft (d) 8.4 ft
2.(a) 12.1 in. (b) 14.6 in. (c) 13.5 in. (d) 11.2 in.
3.(a) 7.1 in. (b) 6.4 in. (c) 8.3 in. (d) 5.9 in.
4.(a) 9.3 ft (b) 10.5 ft (c) 11.8 ft (d) 12.4 ft
SL3100_frame_C16 Page 234 Friday, August 31, 2001 10:23 AM

Squares, Square Roots, Cubes, Cube Roots, and Proportions 235
5.(a) 5 7/8 in. (b) 4 7/8 in. (c) 6 3/4 in. (d) 6 1/4 in.
Answers to the exercises:
REVIEW TEST
Directions: The test is to determine if the skills in this chapter have been mastered.
I. Select the correct value for the square or cube in each exercise. Roundany decimal answers off to the 1/100s place.1. Find the square of 14.
(a) 196 (b) 874 (c) 169 (d) 2,744
2. What is the cube of 12?(a) 24 (b) 36 (c) 144 (d) 1,728
3. What is the result of squaring 23.4?(a) 848.45 (b) 547.56 (c) 1,474.9 (d) 70.2
4. Find the cube of 1/2.(a) 1 (b) 1/8 (c) 3/2 (d) 1/4
5. Find the square of 4 7/8.(a) 18 19/64 (b) 21 15/64 (c) 16 21/64 (d) 23 49/64
6. Find the square of 18.(a) 5832 (b) 54 (c) 36 (d) 324
7. Find the cube of 6.(a) 36 (b) 216 (c) 12 (d) 18
8. What is the square of 9.4?(a) 88.36 (b) 18.8 (c) 28.2 (d) 318.10
1. b 2. d 3. a 4. b 5. a
4 1/2”
Round to1/16”
?
SL3100_frame_C16 Page 235 Friday, August 31, 2001 10:23 AM

236 Six Sigma and Beyond: Problem Solving and Basic Mathematics, Volume II
9. What is the result of cubing 5.3?(a) 148.88 (b) 45.9 (c) 84.65 (d) 28.09
10. Find the square of 5 3/8.(a) 28 57/64 (b) 25 9/64 (c) 32 19/64 (d) 18 15/64
II. Select the correct answer to each exercise. Use Table 16.1.11. Find the square root of 81.
(a) 9 (b) 4.327 (c) 40.5 (d) 6,561
12. What is the value of ?(a) 21 (b) 3.476 (c) 6.481 (d) 1,674
13. Find the cube root of 17.(a) 8.103 (b) 2.571 (c) 5.67 (d) 4.123
14. Find the square root of 75.(a) 8.66 (b) not in (c) 8.165 (d) 4.217
15. Find the value of .(a) 30.667 (b) 3.958 (c) 7.874 (d) not in
16. Find the square root of 25.(a) 9.81 (b) 5 (c) 6.104 (d) 2.924
17. What is the value of ?(a) 2 (b) 8 (c) not in (d) 4
18. What is the square root of 55?(a) 3.803 (b) not in (c) 4.175 (d) 7.416
19. Find the cube root of 78.(a) 26 (b) 8.832 (c) not in (d) 4.273
20. What is the value of ?(a) 62 (b) 45.108 (c) not in (d) 1922
III. Select the correct value of the square root rounded to the givenplace value of each exercise. Do not use a calculator.21. to 1/10s place.
(a) 17.8 (b) 16.3 (c) 17.3 (d) 16.9
22. to 1s place.(a) 87 (b) 86 (c) 85 (d) 81
42
623
643
3844
318
7500
SL3100_frame_C16 Page 236 Friday, August 31, 2001 10:23 AM

Squares, Square Roots, Cubes, Cube Roots, and Proportions 237
23. to 1/ 1000s place.(a) 2.079 (b) 2.888 (c) 2.715 (d) 2.984
24. to 1/100s place.(a) 6.94 (b) 6.58 (c) 7.18 (d) 7.24
25. to the 1s place.(a) 894 (b) 902 (c) 917 (d) 951
26. to 1/10s place.(a) 16.3 (b) 16.4 (c) 16.6 (d) 16.5
27. to 1/1000s place.(a) 3.019 (b) 2.646 (c) 2.184 (d) 3.451
28. to 1/100s place.(a) .31 (b) .41 (c) .43 (d) .39
29. to 1s place.(a) 172 (b) 165 (c) 164 (d) 171
30. to 1/10s place.(a) 84.0 (b) 84.2 (c) 84.1 (d) 84.3
IV. Select the correct value of the square root, rounded to the given placevalue, of each exercise. Do not use a calculator.
31.(a) 10.1 in. (b) 9.3 in. (c) 7.4 in. (d) 8.6 in.
32.(a) 11.0 in. (b) 7.8 in. (c) 10.4 in. (d) 8.9 in.
33.(a) 6.9 in. (b) 7.1 in. (c) 6.8 in. (d) 6.6 in.
8.34
52.4
814163
275
7
.184
27 148,
7 085,
SL3100_frame_C16 Page 237 Friday, August 31, 2001 10:23 AM

238 Six Sigma and Beyond: Problem Solving and Basic Mathematics, Volume II
34.(a) 12.7 ft (b) 13.8 ft (c) 10.7 ft (d) 11.4 ft
35.(a) 8 1/8 in. (b)7 1/4 in. (c) 7 3/8 in. (d) 8 3/16 in.
36.(a) 13.1 in. (b) 10.8 in. (c) 12.4 in. (d) 11.6 in.
37.(a) 10.3 in. (b) 7.4 in. (c) 8.4 in. (d) 9.9 in.
38.(a) 17.1 in. (b) 16.3 in. (c) 15.6 in. (d) 12.1 in.
SL3100_frame_C16 Page 238 Friday, August 31, 2001 10:23 AM

Squares, Square Roots, Cubes, Cube Roots, and Proportions 239
39.(a) 14.4 in. (b) 10.1 in. (c) 10.8 in. (d) 11.6
40.(a) 12.83 in. (b) 8.11 in. (c) 13.75 in. (d) 13.38 in.
Answers to the review test:
Question Answer
1 a2 d3 b4 b5 d6 d7 b8 a9 a
10 a11 a12 c13 b14 a15 b16 b17 d18 d19 d20 a21 a
SL3100_frame_C16 Page 239 Friday, August 31, 2001 10:23 AM

240 Six Sigma and Beyond: Problem Solving and Basic Mathematics, Volume II
SOLVING PROPORTION PROBLEMS
Objective: This section describes a proportion and how to find a missing number ina proportion. This section requires solving a simple equation such as .38x = 4.54.To solve for “x” in this case, divide both sides of the equation by .38. The result isx = 4.54/.38 = 11.95.
Examples: 1/2 = 3/6, 4/12 = 1/3, 3/8 = 9/24
In each example, the two ratios are actually the same number if both are reduced.The number in the left top times the number in the right bottom equals the numberin the right top times the number in the left bottom, e.g.,
1/2 = 3/6 4/12 = 1/3 3/8 = 9/24
1 × 6 = 3 × 2 4 × 3 = 1 × 12 3 × 24 = 9 × 8
The process is called cross multiplication. From this, the answer for a missingnumber (x) in a proportion in the examples below may be found:
1. 3/x = 7/5 2. 5/8 = x/10 3. 4/9.3 = 7.5/x
22 a23 b24 d25 b26 c27 b28 c29 b30 b31 d32 d33 d34 a35 a36 b37 d38 d39 b40 b
Question Answer
SL3100_frame_C16 Page 240 Friday, August 31, 2001 10:23 AM

Squares, Square Roots, Cubes, Cube Roots, and Proportions 241
To find the value of the missing number in a proportion:
Step 1. Cross multiply and write an equation.a. Multiply left top by right bottom.b. Multiply right top by left bottom.c. Write the result of (a) equal to the result of (b).
Step 2. Solve the equation for the value of the missing number.
Example 1: 3/x = 7/5
Step 1. 3 × 5 = 7 × x15 = (7) (x) or just 7x15 = 7x
Step 2. 15 ÷ 7 = x
Answer: 2 1/7 = x
Example 2: 5/8 = x/10
Step 1. 5 × 10 = x × 850 = 8x
Step 2. 50 ÷ 8 = x
Answer: 6 1/4 = x
Example 3: 1.4/5.3 = 7.5/x
Step 1. 1.4 × x = 7.5 × 5.31.4x = 39.75
Step 2. x = 39.75 ÷ 1.4
Answer: x = 28.4 (Rounded off to 1/10s place.)
EXERCISES
Directions: Select the correctly written ratio for each of the comparisons.
1. Output to time in minutes if a machine can produce 42 times per hour.(a) 42/1 (b) 7/10 (c) 42/60 (d) 60/42
SL3100_frame_C16 Page 241 Friday, August 31, 2001 10:23 AM

242 Six Sigma and Beyond: Problem Solving and Basic Mathematics, Volume II
2. Area of triangle A to area of triangle B.
(a) 4/1 (b) 1/4 (c) 1/2 (d) 2/1
3. Cost in cents to weight in ounces if oranges cost $1.50 for 6 pounds.(a) 5/2 (b) 1/25 (c) 25/16 (d) 2/5
4. Output to labor costs in dollars if in 1 day 4 men working 8 hours at $7.00per hour make 18 units.(a) 4/7 (b) 9/14 (c) 9/112 (d) 9/28
5. Cost of owning a car in dollars to time of ownership in years if a car costs$6,000 and all other costs in a 4-year period were $800.(a) 3/425 (b) 1700/1 (c) 425/3 (d) 1/200
Answers to the exercises:
ADDITIONAL EXERCISES
Directions: Select the correct value for the missing number in each of the propor-tions. Round any decimal answer to the 1/10s place. If necessary, restudy theinstructions and examples.
1. 3/x = 5/8(a) 10 3/8 (b) 1 7/8 (c) 13 1/3 (d) 4 4/5
2. 7/10 = n/9(a) 7 7/9 (b) 8 3/4 (c) 6 3/10 (d) 12 6/7
3. 85/40 = 35/x(a) 5 2/7 (b) 9 7/18 (c) 25 3/40 (d) 16 8/17
1. b 2. d 3. c 4. c 5. b
SL3100_frame_C16 Page 242 Friday, August 31, 2001 10:23 AM

Squares, Square Roots, Cubes, Cube Roots, and Proportions 243
4. p/20 = 1/8(a) 10 7/8 (b) 2/5 (c) 2 1/2 (d) 60
5. 3 1/2 /5 = 7/x(a) 5 1/4 (b) 10 (c) 2 3/4 (d) 15 1/2
6.
(a) 10 3/8 (b) 4 7/78 (c) 75 1/4 (d) 7/178
7.
(a) 8 9/10 (b) 7 3/4 (c) 52 9/14 (d) 17 97/112
8. .8/M = 2.4/12(a) 12.8 (b) 36 (c) .2 (d) 4
9. U/3.5 = 4.6/12.3(a) 16.2 (b) 9.4 (c) 1.3 (d) 24.8
10. 24.1/8 = 8.3/V(a) 2.8 (b) 25.0 (c) 23.2 (d) 19.0
Answers to the additional exercises:
1. d 2. c 3. d 4. c 5. b6. b 7. d 8. d 9. c 10. a
1 3/83 1/4------------ T
9 2/3------------=
3 1/25 3/4------------ 10 7/8
S---------------=
SL3100_frame_C16 Page 243 Friday, August 31, 2001 10:23 AM

SL3100_frame_C16 Page 244 Friday, August 31, 2001 10:23 AM

245
Scientific Notation and Powers of Ten
When working with numbers there will be times when it is necessary to work withvery large and very small numbers. A method will now be demonstrated to makethis task easier. The method is called scientific notation or powers of ten.
Definitions:
1.
Scientific notation:
a method to keep track of the decimal point in largeor small numbers or when changing from one metric unit to another
2.
Powers of ten:
another name for scientific notation3.
Factor:
any number that is multiplied by another number to obtain a finalanswer which is called a product
4.
Factoring:
the process of multiplying numbers together5.
Exponent:
a number written above and to the right of another number,telling how many times the number is used as a factor
6.
Exponential numbers:
any decimal number written using an exponent
NUMBERS GREATER THAN ONE
F
ACTORING
AND
W
RITING
N
UMBERS
Objective:
This section demonstrates the correct method of factoring and writingnumbers using exponents.
Practice:
If 50 can be written as 5
×
10, how can the following numbers be written?
1. 30(a) 3
×
1 (b) 3
×
10 (c) 3
×
100Answer: b
2. 500(a) 5
×
10 (b) 5
×
100 (c) 50
×
100Answer: b
17
SL3100_frame_C17 Page 245 Friday, August 31, 2001 10:24 AM

246
Six Sigma and Beyond: Problem Solving and Basic Mathematics, Volume II
3. 2000(a) 2
×
100 (b) 21
×
10 (c) 2
×
1000Answer: c
4. 100(a) 10
×
10 (b) 10
×
1 (c) 10
×
100Answer: a
Because 100 can be written as 10
×
10, 100 can be
factored
into
2
equal parts. Also1000 can be written 10
×
10
×
10. Therefore, 1000 can be factored into
3
equal parts.These equal parts can be indicated by using exponents. An exponent is a number
written above and to the right of another number and it tells how many times thenumber is used as a factor.
Examples:
1 = 10
0
10 = 10
1
100 = 10
2
or 10
×
101000 = 10
3
or 10
×
10
×
10
If 1000 can be written as 10
3
and 2000 can be written as 2
×
1000, then 2000 canalso be written as 2
×
10
3
(1000 = 10
3
).
Note:
There are 3 zeros in 1000. The exponent of 10 is also 3.
Practice:
How can the following numbers be written?
1. 300(a) 3
×
10
1
(b) 3
×
10
2
(c) 3
×
10
3
Answer: b
2. 500(a) 5
×
10
2
(b) 50
×
10
2
(c) 5
×
10
1
Answer: a
3. 3000(a) 30
×
10
1
(b) 30
×
10
3
(c) 3
×
10
3
Answer: c
4. 80000(a) 800
×
10
3
(b) 80
×
10
2
(c) 8
×
10
4
Answer: c
SL3100_frame_C17 Page 246 Friday, August 31, 2001 10:24 AM

Scientific Notation and Powers of Ten
247
FACTORING EXERCISES
Directions:
Select the correct answers. If necessary, restudy the instructions andexamples.
1. 70(a) 7
×
1 (b) 7
×
10
1
(c) 7
×
100
2. 40(a) 4
×
100 (b) 4
×
1 (c) 4
×
10
1
3. 600(a) 6
×
10
1
(b) 6
×
100 (c) 6
×
1
4. 900(a) 9
×
10
0
(b) 9
×
10
1
(c) 9
×
100
5. 2000(a) 2
×
1000 (b) 2
×
100 (c) 2
×
10
1
6. 700(a) 7
×
10
1
(b) 7
×
10
2
(c) 7
×
10
3
7. 4000(a) 4
×
10
2
(b) 4
×
10
3
(c) 4
×
10
4
8. 90(a) 9
×
10
1
(b) 9
×
10
2
(c) 9
×
10
3
9. 80000(a) 8
×
10
2
(b) 8
×
10
3
(c) 8
×
10
4
10. 5000(a) 5
×
10
2
(b) 5
×
10
3
(c) 5
×
104
Answers to the factoring exercises:
PLACING A DECIMAL POINT
Objective: This section will demonstrate the correct method of placing a decimalpoint in standard numbers and standard exponents.
1. b 2. c 3. b 4. c 5. a6. b 7. b 8. a 9. c 10. b
SL3100_frame_C17 Page 247 Friday, August 31, 2001 10:24 AM

248 Six Sigma and Beyond: Problem Solving and Basic Mathematics, Volume II
Remember: If a decimal point is not shown in a number, always assume that thereis a decimal point at the far right end of the number.
Examples:
15 = 15. 650 = 650.
Practice: Using the examples as reference, how should the following numbers bewritten?
1. 15(a) 1.5 (b) .15 (c) 15.Answer: c
2. 65(a) .65 (b) 65. (c) 6.5Answer: b
3. 725(a) 72.5 (b) 725. (c) .725Answer: b
4. 1050(a) 1050 (b) 10.50 (c) 105.0Answer: a
The number 15 can also be written as 1.5 × 101 (1.5 × 101 = 15). The number 65can also be written as 6.5 × 101 (6.5 × 101 = 65).
Also 150 can be written as 1.5 × 100 and 650 as 6.5 × 100 (1.5 × 100 = 150 and6.5 × 100 = 650).
Therefore, if 100 can be written as 102 (10 × 10), 150 can be written as 1.5 ×10² and 650 can be written as 6.5 × 10².
Note: The decimal point has been moved to the left the same number of placesshown by the exponent.
1.5 × 10² and 6.5 × 10² are examples of numbers written in standard exponentialform. Standard exponential form always has one number to the left of the decimalpoint.
150. 1.50 102×= 650. 6.50 102×=
SL3100_frame_C17 Page 248 Friday, August 31, 2001 10:24 AM

Scientific Notation and Powers of Ten 249
Examples:
1.5 × 10² 6.5 × 10²
Practice: Using the examples as a reference, how should the following numbers bewritten in standard exponential form?
1. 450(a) 45 × 101 (b) 4.5 × 10² (c) .45 × 103
Answer: b
2. 275(a) 2.75 × 10³ (b) 27.5 × 101 (c) 2.75 × 10²
Answer: c
3. 8050(a) 8.05 × 10³ (b) 80.50 × 10² (c) 805 × 101
Answer: a
4. 525(a) 5.25 × 10⁴ (b) 5.25 × 10³ (c) 5.25 × 10²
Answer: c
Remember: Standard exponential form always has one number to the left of thedecimal point.
NUMBERS LESS THAN ONE
CHANGING EXPONENTIAL NUMBERS TO STANDARD DECIMAL FORM
Objective: This section demonstrates the correct method of changing exponentialnumbers back to standard decimal form.
Remember: There will be times when exponential numbers need to be rewritten intostandard form.
To change 6.5 × 10² back to standard form, first look at the exponent. In thiscase, it is 2. This means that the decimal point was shifted to the left 2 places. Ifthe decimal point is moved back to its original place, it would have to be moved tothe right 2 places.
Note: The decimal point has been moved to the right the same number of places asshown by the exponent.
6.5 102× 6 50.=
SL3100_frame_C17 Page 249 Friday, August 31, 2001 10:24 AM

250 Six Sigma and Beyond: Problem Solving and Basic Mathematics, Volume II
Examples:
Practice: Using the examples as a reference, change the following exponentialnumbers to standard decimal form.
1. 7.5 × 10²
(a) 75 (b) 750 (c) 7500Answer: b
2. 6.25 × 10³
(a) 6250 (b) 625 (c) 62.5Answer: a
3. 5 × 10³
(a) 50 (b) 500 (c) 5000Answer: c
4. 9.1 × 10⁴
(a) 910 (b) 9100 (c) 91000Answer: c
WRITING NUMBERS LESS THAN ONE IN STANDARD FORM
Objective: This section will demonstrate the correct method of writing numbers lessthan one in standard exponential form.
Remember: Standard exponential form always has one number to the left of thedecimal point.
Examples:
1.5 × 10⁻² 6.5 × 10⁻²
Remember: Use negative exponents (10–2) to represent numbers less than one.
1 = 100 .01 = 10–2 or 1/100.1 = 10–1 or 1/10 .001 = 10–3 or 1/1000
To change a number less than one to standard exponential form, move thedecimal point to the right enough places to get the number to standard exponentialform. The number of places that the decimal point has to be moved will always beequal to the exponent.
1.5 102 1 50.=× 7.25 102× 7 25.=
SL3100_frame_C17 Page 250 Friday, August 31, 2001 10:24 AM

Scientific Notation and Powers of Ten 251
Examples:
Practice: Using the examples as a reference, change the following numbers tostandard exponential form.
1. .0035(a) 3.5 × 10⁻³ (b) 35 × 10–3 (c) 350Answer: a
2. .0275(a) 2.75 × 10⁻² (b) 2750 (c) 27.50 × 10⁻³
Answer: a
3. .06(a) 60 × 10–3 (b) 6.0 × 10⁻³ (c) 6 × 10⁻²
Answer: c
4. .0072(a) 7.2 × 10⁻² (b) 7.2 × 10⁻³ (c) 7.2 × 10⁻⁴
Answer: b
Practice: Using the examples as a reference, change the following numbers tostandard decimal form.
1. 7.5 × 10–2 =(a) .75 (b) .075 (c) .0075Answer: b
2. 6.25 × 10–3 =(a) .00625 (b) .625 (c) .000625Answer: a
3. 5 × 10–3 =(a) .005 (b) .05 (c) .0005Answer: a
4. 9.1 × 10–4 =(a) .0091 (b) .0910 (c) .00091Answer: c
01.5 1.5 10 2–×= 06.5 6.5 10 2–×=
SL3100_frame_C17 Page 251 Friday, August 31, 2001 10:24 AM

SL3100_frame_C17 Page 252 Friday, August 31, 2001 10:24 AM

253
Decimals
Whenever working with scientific notation, or powers of ten, it is sometimes nec-essary to change numbers from their standard form to perform many basic mathe-matics operations. These changes are accomplished by shifting the decimal point.
Definitions:
1.
Addition:
the sum of two numbers2.
Subtraction:
a process of taking a smaller amount from a larger amountto find the difference between the two amounts (numbers)
3.
Multiplication:
the process to find the result of adding a certain numberto itself a certain amount of times
4.
Product:
a number that is the result of multiplying (In 4
×
8 = 32, 32 isthe product.)
5.
Digit:
any number from 0 through 96.
Division:
the process of determining how many times one number iscontained in another
7.
Divisor:
the number by which another number is divided (In 32
÷
8 = 4,8 is the divisor.)
8.
Dividend:
the number into which another is divided (In 32
÷
8 = 4, 32 isthe dividend.)
9.
Quotient:
the answer to a division problem (In 32
÷
8 = 4, 4 is thequotient.)
NUMBERS GREATER THAN ONE
Objective:
This section will demonstrate the correct method to compare exponentialnumbers greater than one and to shift the decimal point without changing the valueof the number. It is often necessary to compare numbers written in exponential formand to determine which number is larger and which number is smaller.
Keep in mind that it is usually the
exponent
that determines whether a numberis larger or smaller:
10
5
is larger than 10
4
and 1.5
×
10
3
is larger than 2.5
×
10
2
18
SL3100_frame_C18 Page 253 Friday, August 31, 2001 10:24 AM

254
Six Sigma and Beyond: Problem Solving and Basic Mathematics, Volume II
When the exponents are the same, look at the decimal number to determine whichnumber is larger:
26.5
×
10
2
is larger than 10.5
×
10
2
Practice:
Using the examples as a reference, which numbers are largest?
1. (a) 6.27
×
10
2
(b) 8.59
×
10
2
(c) 4.1
×
10
3
Answer: c
2. (a) 9.826
×
10
4
(b) 5.29
×
10
6
(c) 1.1
×
10
5
Answer: b
3. (a) 1.5
×
10
5
(b) 8.724
×
10
3
(c) 4.79
×
10
4
Answer: a
4. (a) 3.462
×
10
4
(b) 9.2
×
10
4
(c) 2
×
10
5
Answer: c
So far, all of the numbers in this section have been written in standard exponentialform; however, there are times when numbers are used that are not written in standardform. In the number 225.5
×
10
3
, notice that it is written in exponential form, butit is not written in standard form.
Practice:
Standard exponential form
always
has one number to the left of the decimalpoint. To change this number to standard form,
shift
the decimal point two placesto the left:
Is 2.255
×
10
3
the same as 225.5
×
10
3
? It is not. By shifting the decimal point, thevalue of the number has been changed. To keep the number value the same, theexponent must be changed by the
same
amount.The decimal point was moved two places to the left:
If the decimal point is shifted to the left, the exponent must increase by the sameamount: 10
3
must now become 10
5
or 2.255
×
10
5
= 225.5
×
10
3
.If 49.5
×
10
3
were to be changed to standard form, the decimal point wouldhave to be shifted 1 place to the left. What would the correct answer be?
(a) 4.95
×
10
4
(b) 4.95
×
10
3
(c) 4.95
×
10
2
2.25 5 103×
2.25 5 103×
SL3100_frame_C18 Page 254 Friday, August 31, 2001 10:24 AM

Decimals
255
The correct answer is a.
Remember:
When the decimal point is shifted, the exponent must change by the
same
amount.
Example: Change .6452
×
10
3
to standard form.
(a) 6.452
×
10
4
(b) 6.452
×
10
2
(c) 6.452
×
10
5
Answer: b
Practice:
Using the examples as a reference, change the following exponentialnumbers into standard form.
1. 395.4
×
10
2
=(a) 3.954
×
10
3
(b) 3.954
×
10
4
(c) 3.954
×
10
1
Answer: b
2. .463
×
10
6
=(a) 4.63
×
10
4
(b) 4.63
×
10
5
(c) 4.63
×
10
7
Answer: b
3. 2725.1
×
10
4
=(a) 2.7251
×
10
7
(b) 2.7251
×
10
1
(c) 2.7251
×
10
8
Answer: a
4. .0325
×
10
6
=(a) 3.25
×
10
5
(b) 3.25
×
10
4
(c) 3.25
×
10
8
Answer: b
Sometimes it will be necessary to change numbers from standard form to analternate form of scientific notation. To change 5.555
×
10
6
to an exponential numberneeding an (
×
10
4
) exponent, it cannot be written as 5.555
×
104 because 5.555 ×10⁴ does not equal 5.555 × 10⁶.
To change the exponent, the decimal point must also be changed. When changingthe exponent, the decimal number has to be changed by the same amount. To change(× 106) into (× 104), the exponent has been decreased by 2. This means our decimalmust be increased by 2 places.
Practice: Using the examples as a reference, change the numbers written in standardform into an alternate form.
5.555 106× 5 55.5 104×=
SL3100_frame_C18 Page 255 Friday, August 31, 2001 10:24 AM

256 Six Sigma and Beyond: Problem Solving and Basic Mathematics, Volume II
1. 2.52 × 105 =(a) 2.52 × 10⁴ (b) 252 × 103 (c) 25.2 × 10³
Answer: b
2. 7.923 × 106 =(a) 7923 × 103 (b) 792.3 × 10³ (c) 79.23 × 10⁴
Answer: a
3. 6.362 × 107 =(a) 636.2 × 10⁶ (b) 636.2 × 10³ (c) 6362 × 104
Answer: c
4. 86 × 104 =(a) 860 × 103 (b) 86 × 103 (c) 8600 × 104
Answer: a
To change an exponent from a smaller number to a larger number, the decimalmust also be changed by the same amount. To change 5.555 × 10⁴ to an exponentialnumber needing an (× 106) exponent, it cannot be written as 5.555 × 10⁶ because5.555 × 106 does not equal 5.555 × 10⁴. To change × 104 into × 106, the exponenthas been increased by two. This means the decimal must be decreased by two.
Practice: Using the examples as a reference, change the numbers written in standardform into an alternate form.
1. 2.52 × 105 =(a) 25.2 × 10⁷ (b) .252 × 106 (c) 252 × 108
Answer: b
2. 7.923 × 106 =(a) .7923 × 107 (b) 7923. × 107 (c) 792.3 × 10⁵
Answer: a
3. 6.326 × 107 =(a) 63.62 × 10⁷ (b) .6362 × 108 (c) .6362 × 106
Answer: b
4. 8.6 × 105 =(a) 86 × 106 (b) .86 × 104 (c) .86 × 106
Answer: c
5.555 104× .05 55 106×=
SL3100_frame_C18 Page 256 Friday, August 31, 2001 10:24 AM

Decimals 257
NUMBERS LESS THAN ONE
Objective: This section will demonstrate the correct method of comparing exponen-tial numbers less than one and shifting the decimal point without changing the valueof the number. It may also be necessary to compare numbers less than one whichare written in exponential form and to determine which number is larger and whichnumber is smaller.
Remember: It is usually the exponent that determines whether the number is largeror smaller.
Also remember: When working with numbers less than one, use negative exponents.(If negative numbers are troublesome review Chapter 17, Numbers Less Than One.)Compare the following two numbers and determine which one is larger:
(a) –5 or (b) –9
The answer is a.
Hint: In terms of temperature, (a) would be 5 degrees below zero. Because 5 belowzero is warmer than 9 below zero, 5 below zero is a higher temperature, or –5 is alarger number than –9.
Using the illustration, which of the numbers is smaller?
(a) –1 or (b) –4
The answer is b.
Practice: Use the same idea when working with exponents.
Which is larger?(a) 10–5 (b) 10–9
Answer: a
Which is smaller?(a) 10–1 (b) 10–4
Answer: b
–9 –8 –7 –6 –5 –4 –3 –2 –1 0 1 2 3 4 5 6 7 8
Smaller Larger
SL3100_frame_C18 Page 257 Friday, August 31, 2001 10:24 AM

258 Six Sigma and Beyond: Problem Solving and Basic Mathematics, Volume II
Which is larger?(a) 2.65 × 10⁻⁶ (b) 3.75 × 10⁻³
Answer: b
Which is smaller?(a) 3.27 × 10⁻⁵ (b) 6.73 × 10⁻²
Answer: a
Practice: Using the examples as a reference, determine which of the numbers is thelargest.
1. (a) 6.24 × 10⁻⁵ (b) 8.75 × 10⁻⁶ (c) 4.39 × 10⁻⁴
Answer: c
2. (a) 2.375 × 10⁻² (b) 8.673 × 10⁻⁶ (c) 1.45 × 10⁻³
Answer: a
3. (a) 5.75 × 10⁻⁸ (b) 1.27 × 10⁻⁴ (c) 5.27 × 10⁻²
Answer: c
4. (a) 2.365 × 10⁻¹ (b) 4.72 × 10⁻⁵ (c) 6.314 × 10⁻⁸
Answer: a
All of the numbers above are written in standard exponential form. However, therewill be times when numbers not written in standard form are used.
In the number 437.5 × 10⁻⁴, notice that it is written in exponential form, but itis not written in standard form. To change this number into standard form, shift thedecimal point two places to the left:
Is 4.375 × 10⁻⁴ the same as 437.5 × 10⁴? It is not. By shifting the decimal point,the value of the number has been changed. To keep the number value the same, thenegative exponent must also be changed by the same amount. Move the decimalpoint two places to the left:
If the decimal point is shifted to the left, the exponent must increase by the sameamount: 10–4 must now become 10–2.
4.375 × 10–2 = 437.5 × 10⁻⁴
4.37 5 10 4–×
4.37 5 10 4–×
SL3100_frame_C18 Page 258 Friday, August 31, 2001 10:24 AM

Decimals 259
Remember: –2 is larger than –4.If 55.5 × 10⁻³ were changed to standard form, the decimal point would be shifted
1 place to the left. What would the correct answer be?
(a) 5.55 × 10⁻⁴ (b) 5.55 × 10⁻³ (c) 5.55 × 10⁻²
The answer is c.
Remember: When the decimal point is shifted, the exponent must change by thesame amount.
Change .7651 × 10–3 to standard form. What would the answer be?
(a) 7.651 × 10⁻² (b) 7.651 × 10⁻⁴ (c) 7.651 × 10⁻³
The answer is b.
Practice: Using the examples as a reference, change the exponential numbers intostandard form.
1. 927.5 × 10–3 =(a) 9.275 × 10⁻¹ (b) 9.275 × 10⁻⁵ (c) 9.275 × 10⁻²
Answer: a
2. .723 × 10–6 =(a) 7.23 × 10⁻⁵ (b) 7.23 × 10⁻⁸ (c) 7.23 × 10⁻⁷
Answer: c
3. 8756.2 × 10–7 =(a) 8.7562 × 10⁻³ (b) 8.7562 × 10⁻⁴ (c) 8.7562 × 10⁻¹⁰
Answer: b
4. .8 × 10–5 =(a) 8 × 10⁻⁴ (b) 8 × 10⁻⁶ (c) 8 × 10⁻⁵
Answer: b
ADDITION OF DECIMAL NUMBERS
SAME EXPONENTS
Objective: This section will demonstrate the correct method to add numbers inscientific notation when the numbers have the same exponents. There are twoimportant rules to remember when adding numbers written in scientific notation:
1. Decimal points must line up with each other.2. Exponents must be the same.
SL3100_frame_C18 Page 259 Friday, August 31, 2001 10:24 AM

260 Six Sigma and Beyond: Problem Solving and Basic Mathematics, Volume II
First work with Rule 1. It has already stated that if a decimal point is not shown ina number, always assume that there is one at the far right end of the number.
Examples:
15 = 15. 650 = 650.
When adding 2 + 2 = 4, it is actually
2. + 2. = 4. or
The decimal points are lined up. If adding 23.2 + 1.35 = 24.55 or
The decimal points are lined up. Not
The decimal points are not lined up.
Practice: Using the examples as a reference, choose the correct answer to theaddition problems.
1. 26.5 + 18.6 =(a) 45.1 (b) 4.51 (c) 27.96Answer: a
2. 39.7 + 2.81 =(a) 67.8 (b) 6.78 (c) 42.51Answer: c
3. 101.32 + 1.01 =(a) 102.33 (b) 202.32 (c) 111.42Answer: a
4. .0235 + 47.3 =(a) 282.3 (b) 708 (c) 47.3235Answer: c
2.
+ 2.4.
---------
23.2
+ 1.3524.55
---------------
23.2
+ 1.35367
---------------
SL3100_frame_C18 Page 260 Friday, August 31, 2001 10:24 AM

Decimals 261
If 2.54 × 10³ were to be written as a standard number, it would be 2540. If 6.32× 10³ were to be written as a standard number, it would be 6320.
Therefore, 2540 + 6320 would equal 8860 or
Also, adding 2.54 × 10³ + 6.32 × 10³ would equal 8.86 × 10³ or
When adding exponential numbers, be sure decimal points are lined up and expo-nents are the same (× 103 = × 103). When adding exponents, the answer will havethe same exponent.
Examples:
In both examples, the decimals line up.
Practice: Using the examples as a reference, choose the correct answer to theaddition problems.
1. 15.6 × 10³ + 12.2 × 103 =(a) 27.8 × 10⁶ (b) 27.8 × 10³ (c) 278 × 103
Answer: b
2. .135 × 104 + 13.2 × 104 =(a) 13.335 × 10⁴ (b) 267 × 104 (c) 26.7 × 10⁸
Answer: a
3. .025 × 10–2 + 1.13 × 10–2 =(a) 113.25 × 10⁻² (b) 11.3025 × 10⁻⁴ (c) 1.155 × 10⁻²
Answer: c
4. 1.271 × 10⁻⁶ + .312 × 10–6 =(a) 1.583 × 10⁻⁶ (b) 1.583 × 10⁻¹² (c) 1583 × 10–6
Answer: a
2540
+ 63208860
-----------------
2.54 103×
6.32 103×8.86 103×------------------------
8.86 103× 8860=
2.54 103×
+ 6.32 103×8.86 103×
------------------------------
13.7 10 4–×
+ 1.3 10 4–×15.0 10 4–×
-----------------------------
SL3100_frame_C18 Page 261 Friday, August 31, 2001 10:24 AM

262 Six Sigma and Beyond: Problem Solving and Basic Mathematics, Volume II
DIFFERENT EXPONENTS
Objective: This section will demonstrate the correct method to add numbers writtenin scientific notation when the numbers do not have the same exponents. Twoimportant rules to remember when adding numbers written in scientific notation are
1. Decimal points must line up with each other.2. Exponents must be the same.
This section uses Rule 2. How to shift decimal points and how to change exponentsso exponential numbers do not change in value has already been demonstrated.
Remember: Any time an exponent is changed, the decimal point must be shifted bythe same amount.
Examples:
1. To change 37.45 × 10⁴ to an exponent of 103, shift the decimal point oneplace to the right:
2. To change 863.95 × 10⁴ to an exponent of 106, shift the decimal pointtwo places to the left:
3. To change 9.035 × 10⁻³ to a negative exponent of 10–4, shift the decimalpoint one place to the right:
4. To change 3.76 × 10⁻⁶ to a negative exponent of 10–4, shift the decimalpoint two places to the left:
Practice: Using the examples as a reference, choose the correct answer for theproblems.
37.4 5 103×
8.63 95 106×
9 0 35 104×
.03 76 104–
×
SL3100_frame_C18 Page 262 Friday, August 31, 2001 10:24 AM

Decimals 263
1. 8.47 × 107 =(a) 84.7 × 10⁸ (b) .847 × 108 (c) .0847 × 105
Answer: b
2. 96.31 × 104 =(a) 9.631 × 10³ (b) 963.1 × 10³ (c) 9631 × 103
Answer: b
3. .0175 × 10–4 =(a) .000175 × 10–2 (b) 1.75 × 10⁻² (c) .0017 × 10–5
Answer: a
4. 1.267 × 10–6 =(a) 12.67 × 10⁻⁵ (b) 126.7 × 10⁻⁴ (c) 12.67 × 10⁻⁷
Answer: c
Keeping in mind the two rules, exponential numbers with different exponentsmay be added. To add 3.57 × 10⁴ + 6.36 × 10⁵, first change one of the exponentsso that both of them will be the same.
Change × 104 to × 105.
(104 was changed to 105 and the decimal was shifted one place to the left.) Now.357 × 105 + 6.36 × 105 = 6.717 × 10⁵ or
Note: Decimal points are lined up and exponents are the same.
Practice: Using the examples as a reference, solve the addition problems. (Alwayschange the first exponent when necessary.)
1. 4.63 × 10⁴ + 83.17 × 106 =(a) 83.2163 × 10⁶ (b) 8.32163 × 10⁴ (c) 87.80 × 10⁶
Answer: a
2. 25.4 × 10² + 38.65 × 104 =(a) 41.19 × 10⁴ (b) 38.904 × 10⁴ (c) 411.9 × 10⁴
Answer: b
3.57 104× .3 57 105×=
.357 105×
+ 6.36 105×6.717 105×
--------------------------------
SL3100_frame_C18 Page 263 Friday, August 31, 2001 10:24 AM

264 Six Sigma and Beyond: Problem Solving and Basic Mathematics, Volume II
3. .014 × 10–3 + 3.51 × 10–2 =(a) 3.65 × 10⁻² (b) 3.524 × 10⁻² (c) 3.5114 × 10⁻²
Answer: c
4. .273 × 10–4 + 4.73 × 10–6 =(a) 32.03 × 10⁻⁶ (b) 7.46 × 10⁻⁶ (c) 4.7573 × 10⁻⁶
Answer: a
EXERCISES
Directions: In each exercise, select the correct answer. If necessary, restudy theinstructions and examples. (Always change the first exponent when necessary.)
1. 2.59 × 10⁴ + 6.73 × 105 =(a) 6.989 × 10⁵ (b) 32.63 × 10⁵ (c) 9.32 × 10⁵
2. 26.95 × 10⁷ + 8.24 × 105 =(a) 277.74 × 10⁵ (b) 2703.24 × 105 (c) 10.935 × 10⁵
3. .043 × 102 + 6.37 × 104 =(a) 10.67 × 10⁴ (b) 6.37043 × 10⁴ (c) 49.37 × 10⁴
4. 28.3 × 10⁻⁴ + .814 × 10–6 =(a) 1.097 × 10⁻⁶ (b) 3.614 × 10⁻⁶ (c) 2830.814 × 10–6
5. 5.37 × 10⁻¹ + .37 × 10–4 =(a) 53.737 × 10⁻⁴ (b) 5370.37 × 10–4 (c) .0907 × 10–4
6. 27.23 × 10⁵ + 18.43 × 103 =(a) 2115.3 × 103 (b) 2741.43 × 103 (c) 18.45723 × 10³
7. 476.1 × 10² + 37.43 × 105 =(a) 37.9061 × 10⁵ (b) 476.43 × 10⁵ (c) 3790.61 × 105
8. 8.3 × 10⁴ + 4.7 × 106 =(a) 37.70 × 10⁴ (b) 13.00 × 10¹⁰ (c) 4.783 × 10⁶
9. .123 × 10–4 + .432 × 10–1 =(a) .432123 × 10–1 (b) 123.432 × 10⁻¹ (c) 456 × 10–1
10. 31.41 × 10⁻³ + 2.17 × 10–6 =(a) 2.74141 × 10⁻⁶ (b) 31412.17 × 10–6 (c) 314.1217 × 10⁻⁶
Answers to the exercises:
1. a 2. b 3. b 4. c 5. b6. b 7. a 8. c 9. a 10. b
SL3100_frame_C18 Page 264 Friday, August 31, 2001 10:24 AM

Decimals 265
SUBTRACTION OF DECIMAL NUMBERS
SAME EXPONENTS
Skills to remember are how to shift the decimal point to make all numbers haveidentical exponents and how to subtract decimal numbers. First, do a simple sub-traction of a decimal number. (Review the process in Chapters 7, 11, and 14.)
EXERCISES
Directions: In each exercise, select the correct answer. If necessary, restudy theinstructions and examples.
1. 47.6 – 21.35 =(a) 26.25 (b) 262.5 (c) 45.465
2. 87.25 – 6.37 =(a) 8.088 (b) 80.88 (c) 23.55
3. 925.01 – 31.3 =(a) 61.201 (b) 612.01 (c) 893.71
4. .136 – .0275 =(a) 13.5725 (b) .1085 (c) 1.085
5. 2601.01 – 6.937 =(a) 19.064 (b) 190.64 (c) 2594.073
6. 814.01 × 10⁴ – 21.375 × 104 =(a) 792.635 × 10⁴ (b) 600.26 × 10⁴ (c) 600.26 × 10⁸
7. 143.075 × 10⁹ – 19.62 × 109 =(a) 141.113 × 10⁹ (b) 123.455 × 209 (c) 12.3455 × 10⁹
8. 600.35 × 10⁶ – 1.0754 × 106 =(a) 49.281 × 10⁶ (b) 589.596 × 10⁶ (c) 599.2746 × 10⁶
9. .147 × 10–2 – .0641 × 10–2 =(a) .0829 × 10–2 (b) .829 × 10–2 (c) .14059 × 10–2
10. 16.301 × 10⁻⁸ – .01395 × 10–8 =(a) 16.1615 × 10⁻⁸ (b) 149.06 × 10⁻¹⁶ (c) 16.28705 × 10⁻⁸
Answers to the exercises:
1. a 2. b 3. c 4. b 5. c6. a 7. b 8. c 9. a 10. c
SL3100_frame_C18 Page 265 Friday, August 31, 2001 10:24 AM

266 Six Sigma and Beyond: Problem Solving and Basic Mathematics, Volume II
DIFFERENT EXPONENTS
Objective: This section will demonstrate the correct method to subtract numberswritten in scientific notation when the numbers do not have the same exponents.Two important rules to remember when subtracting numbers written in scientificnotation are:
1. Decimal points must line up with each other.2. Exponents must be the same.
This section will use Rule 2.How to shift decimal points and how to change exponents so that exponential
numbers did not change in value was demonstrated earlier.
Remember: Any time an exponent is changed, the decimal point must be shifted bythe same number.
Examples:
1. To change 63.27 × 10⁵ to an exponent of 104, shift the decimal point oneplace to the right:
2. To change 435.71 × 10⁶ to an exponent of 108, shift the decimal pointtwo places to the left:
3. To change 7.057 × 10⁻⁵ to a negative exponent of 10–6, shift the decimalpoint one place to the right:
4. To change 9.34 × 10⁻⁴ to a negative exponent of 10–2, shift the decimalpoint two places to the left:
63 2.7 104
×
4.35 71 108
×
7 0 57 10–6
×
.09 34 10–2
×
SL3100_frame_C18 Page 266 Friday, August 31, 2001 10:24 AM

Decimals 267
Practice: Using the examples as a reference, choose the correct answer for theproblems.
1. 9.45 × 105 =(a) .945 × 106 (b) 94.5 × 10⁶ (c) .945 × 107
Answer: a
2. 26.45 × 107 =(a) 2645 × 106 (b) 2.645 × 10⁶ (c) 264.5 × 10⁶
Answer: c
3. .0247 × 10–6 =(a) 2.57 × 10⁻⁴ (b) .000247 × 10–4 (c) .00247 × 10–7
Answer: b
4. 2.643 × 10–3 =(a) 26.43 × 10⁻⁴ (b) 26.67 × 10⁻² (c) 126.7 × 10⁻¹
Answer: a
Keeping in mind the two rules, exponential numbers with different exponentsmay be subtracted. To subtract 6.23 × 10³ from 8.27 × 10⁴, first change one of theexponents to make both of them the same.
Change × 103 to 104
(103 was changed to 104 and the decimal was shifted one place to the left.)Now 8.27 × 10⁴ – .623 × 104 = 7.647 × 10⁴ or
Note: Decimal points line up and exponents are the same.
Practice: Using the examples as a reference, solve the subtraction problems. (Alwayschange the first exponent when necessary.)
1. 6.24 × 10³ – 8.71 × 102 =(a) 53.69 × 10² (b) 615.29 × 10² (c) 2.47 × 10²
Answer: a
6.23 103× .6 23 104×=
8.270 104×
– .623 104×7.647 104×
-----------------------------
SL3100_frame_C18 Page 267 Friday, August 31, 2001 10:24 AM

268 Six Sigma and Beyond: Problem Solving and Basic Mathematics, Volume II
2. 33.4 × 10³ – .3101 × 104 =(a) 33.0899 × 10⁴ (b) 3.0299 × 10⁴ (c) 30.299 × 10⁴
Answer: b
3. .215 × 10–3 – 1.37 × 10–4 =(a) .078 × 10–4 (b) 20.13 × 10⁻⁴ (c) .78 × 10–4
Answer: c
4. 8.76 × 10⁻⁶ – .0123 × 10–4 =(a) .0753 × 10–4 (b) .753 × 10–4 (c) 8.7477 × 10⁻⁴
Answer: a
MULTIPLICATION OFDECIMAL NUMBERS
Objective: This section will demonstrate the correct method to add the exponentpart of numbers written in scientific notation when solving problems in multiplica-tion. To facilitate understanding, the multiplication process will be broken down intotwo separate parts. One part is adding the exponents together and the other part ismultiplication of the decimal portion.
This section will present the exponent part. All that has to be done with the exponentpart is to add the exponents together.
Example: To multiply 2 × 104 by 2 × 104, simply separate the exponent part fromthe decimal part and add the exponents together:
104 × 104 = 108
It is that simple.
Practice: Using this example as a reference, solve the problems.
1. 103 × 102 =(a) 106 (b) 105 (c) 102
Answer: b
2. 107 × 104 =(a) 103 (b) 1028 (c) 1011
Answer: c
3. Multiply 108 by 103 =(a) 1024 (b) 105 (c) 1011
Answer: c
SL3100_frame_C18 Page 268 Friday, August 31, 2001 10:24 AM

Decimals 269
4. 102 times 105 =(a) 105 (b) 1010 (c) 107
Answer: c
The same process is used with negative exponents.
Example: To multiply 2 × 10–3 by 2 × 10–4, simply separate the exponent part fromthe decimal part and add the exponents together.
10–3 × 10–4 = 10–7
Practice: Using this example as a reference, solve the problems.
1. Multiply 10–5 by 10–2 =(a) 10–3 (b) 10–7 (c) 10–10
Answer: b
2. 10–7 × 10–4 =(a) 10–28 (b) 10–3 (c) 10–11
Answer: c
3. 10–1 × 10–5 =(a) 10–6 (b) 105 (c) 10–5
Answer: a
4. 10–2 × 10–5 =(a) 10–7 (b) 10–3 (c) 10–10
Answer: a
To work with both positive and negative exponents, still add them together, but theanswer must have the sign of the larger exponent.
Example: To multiply 2 × 10–5 by 2 × 103, again simply separate the exponent partfrom the decimal part and add the exponents together.
10–5 × 103 = 10–2
–5 is the larger numeral of the two, so the answer is also (–) negative.
Exercise: Using this example as a reference, solve the problems.
1. 10–7 × 103 =(a) 104 (b) 10–10 (c) 10–4
Answer: c
SL3100_frame_C18 Page 269 Friday, August 31, 2001 10:24 AM

270 Six Sigma and Beyond: Problem Solving and Basic Mathematics, Volume II
2. Multiply 105 by 10–3 =(a) 10–2 (b) 102 (c) 10–15
Answer: b
3. 103 times 10–6 =(a) 1018 (b) 103 (c) 10–3
Answer: c
4. 10–2 × 108 =(a) 106 (b) 10–16 (c) 1010
Answer: a
DIVISION OF DECIMALNUMBERS
Objective: This lesson is to demonstrate the correct method to subtract the exponentpart of numbers written in scientific notation when solving division problems.
The division process will be much easier if it is in two separate parts. One partis subtracting the exponents and the other part is division of the decimal portion.This section will only present the exponent part. Simply subtract the exponents fromone another.
Always subtract the exponent of the number being used to “divide by” (divisor)from the number being “divided into” (dividend).
Example: Looking only at the number with an exponent to divide 4 × 104 by 2 ×102, simply separate the exponent part from the decimal part and subtract the divisorexponent from the dividend exponent:
104 ÷ 102 = 102
The rule for subtracting exponents is easy to remember. Just change the sign of thenumber being subtracted and add. The answer always has the sign of the larger digit.
104 ÷ 102 = 102 (4 – 2 = 2)
4 is the larger digit and 4 is positive, therefore, the answer is positive.
Exercise: Based on this example, solve the problems.
1. 105 ÷ 103 =(a) 108 (b) 102 (c) 10–2
Answer: b
SL3100_frame_C18 Page 270 Friday, August 31, 2001 10:24 AM

Decimals 271
2.
(a) 10–10 (b) 10–4 (c) 1010
Answer: a
3. 104 divided by 10–2 =(a) 102 (b) 10–6 (c) 106
Answer: c
4. 10–3 ÷ 10–5 =(a) 10–8 (b) 102 (c) 10–2
Answer: b
10 7–
103----------
SL3100_frame_C18 Page 271 Friday, August 31, 2001 10:24 AM

SL3100_frame_C18 Page 272 Friday, August 31, 2001 10:24 AM

273
The Metric System
Now that there has been practice using the powers of ten or scientific notation, asystem of measurement based entirely on the number 10 will be described. Thissystem is known as the metric system. The metric system is a decimal system.
The metric system originated in France about 1800. Only in the last few yearshas there been much interest in changing to the metric system in the United States.The United States is the only major country in the world that does not already usethe metric system, making measurements in foreign trade more complicated.
Definitions:
1.
Prefix:
letters added to the beginning of a word which change its meaning2.
Symbol:
a letter that represents a word or a prefix3.
Length:
the measure of how long something is4.
Mass:
the measure of how heavy something is (“Mass” is the same as“weight.”)
5.
Weight:
the measure of how heavy something is (“Weight” is the same as“mass.”)
6.
Volume:
the amount of space inside something (“Volume” is the same as“Capacity.”)
7.
Capacity:
the amount of space inside something (“Capacity” means thesame as “ Volume.”)
8.
Area:
the size of a surface
The metric system uses 10 as its base, and the units of measure are determined byadding prefixes to the terms for the standard measures. The following table providesthe most commonly used prefixes and their symbols, meanings, and values. (Lesscommon prefixes will be introduced later.)
Prefix Symbol Value
kilo- k 1000 or 10
3
deci- d .1 or 10
–1
centi- c .01 or 10
–2
milli- m .001 or 10
–3
19
SL3100_frame_C19 Page 273 Friday, August 31, 2001 10:25 AM

274
Six Sigma and Beyond: Problem Solving and Basic Mathematics, Volume II
When writing symbols for metric measures, always use lower-case (small) letters(unless the prefix is a person’s name; then it is capitalized.) Consider the followingmetric measures. Note that as prefixes are added, the value of the standard measurechanges to the value given in the table above.
Length Measure (standard unit: 1 meter or 1 m)1 kilometer (km) = 1000 m1 decimeter (dm) = .1 m1 centimeter (cm) = .01 m1 millimeter (mm) = .001 m
Weight (mass) Measure (standard unit: 1 gram or 1 g)1 kilogram (kg) = 1000 g1 decigram (dg) = .1 g1 centigram (cg) = .01 g1 milligram (mg) = .001 g
Volume Measure (standard unit: 1 liter or 1 L)1 kiloliter (kL) = 1000 L1 deciliter (dL) = .1 L1 centiliter (cL) = .01 L1 milliliter (mL) = .001 L
EXERCISES
Directions:
In each exercise select the correct answer. If necessary, restudy theinstructions and examples.
1. A decimeter is equal to(a) 10 meters (b) .10 meters (c) .01 meters
2. A kilogram is equal to(a) .1000 grams (b) 10,000 grams (c) 1000 grams
3. Which is the largest measure?(a) milliliter (b) liter (c) kiloliter
4. A centigram is equal to(a) 10
–2
grams (b) 10
–1
grams (c) 10 grams
5. The prefix “deci-” means(a) one (b) ten (c) tenth
Answers to the exercises:
1. b 2. c 3. c 4. a 5. c
SL3100_frame_C19 Page 274 Friday, August 31, 2001 10:25 AM

The Metric System
275
CONVERSION OF MEASURES
Objective:
This section will demonstrate conversion from higher or lower measuresof value by dividing by powers of ten or scientific notation. Repeating the table fromthe previous section, convert from higher to lower values or lower to higher values,using the table.
To determine how many millimeters are in 1 meter, simply look at the table andsee that 1 millimeter is equal to 10
–3
or 1/1000 of a meter. To determine how manymillimeters are in 1 meter, simply divide 10
–3
into 1 (1 = 10
0
).
Remember:
When dividing exponents, change the sign of the exponent in the divisorand add the exponents.
To determine how many milliliters there are in a kiloliter, again simply look atthe table and see that 1 mL = 10
–3
L and 1 kL = 10
3
L:
There are 1,000,000 mL in 1 kL.
EXERCISES
Directions:
In each exercise, select the correct answer. If necessary, restudy theinstructions and examples.
1. How many centiliters are in 25 liters?(a) 2500 cL (b) 250 cL (c) 25000 cL
2. How many kilograms are in 800 g?(a) 800
×
10
3
kg (b) 8
×
10
–1
kg (c) 8
×
10 kg
3. How many grams are in 3.6
×
10
3
milligrams?(a) 3.6 g (b) 360 g (c) .360 g
Prefix Symbol Value
kilo- k 1000 or 10
3
deci- d .1 or 10
–1
centi- c .01 or 10
–2
milli- m .001 or 10
–3
100
10 3–---------- 100 3–( )– 100 3+ 103= = = (1000 mm = 1 m)
103
10 3–---------- 103 3+ 106= =
SL3100_frame_C19 Page 275 Friday, August 31, 2001 10:25 AM

276
Six Sigma and Beyond: Problem Solving and Basic Mathematics, Volume II
4. Convert 400 km to millimeters.(a) 400
×
10
3
km (b) 400
×
10
6
(c) 400
×
10
–3
5. How many millimeters are in 90 centimeters?(a) 90
×
10
2
(b) 9
×
10
–1
(c) 9
×
10
2
Answers to the exercises:
The same method is used to determine how many kilograms are in 10,000 grams.Looking at the chart (if necessary), a kilogram is 10
3
grams and 1 gram is 10
0
gram.Therefore, 10
4
(remember 10,000 = 10
4
)
÷
10
3
=
There are 10 kg in 10,000 g.
EXERCISES
Directions:
Using the examples as a reference, solve the problems. Use the table ifnecessary.
1. How many centimeters are in a meter?(a) 10 (b) .1 (c) 100Answer: c
2. How many mL are in 40 cL?(a) 400 (b) 4
×
10
–1
(c) 40Answer: a
3. How many kilograms are in 300 milligrams?(a) 300 (b) 300
×
10
–6
(c) 300
×
10
6
Answer: b
1. a 2. b 3. a 4. b 5. c
104
103-------- 104 – – 3 101= =
100
10 2–---------- 100=
4010 2–
103----------× 40 10 or 400×=
SL3100_frame_C19 Page 276 Friday, August 31, 2001 10:25 AM

The Metric System
277
4. How many g are in 3 kg?(a) 300 (b) 30,000 (c) 3000Answer: c
MORE CONVERSIONS OF THE METRIC SYSTEM
Objective:
This section will build on the basic material presented in the previoussection, adding more detail and specifications, such as linear and weight measure.
Review Test:
I. Select the correct answer.1. A metric volume measure:
(a) liter (b) pint (c) millimeter
2. A U.S. measure of length:(a) ounce (b) meter (c) yard
3. A metric measure of area:(a) kilometer (b) square centimeter (c) milliliter
4. A U.S. measure of weight:(a) gram (b) pound (c) kilogram
5. A metric linear measure:(a) centiliter (b) centimeter (c) kilogram
II. Select the correct answer.6. Convert a megameter into kilometers.
(a) 100 km (b) 1000 km (c) 10 km
7. How many micrograms are in 45 centigrams?(a) 450
µ
g (b) 45
µ
g (c) 450,000
µ
g
8. 80 decameters is equal to how many centimeters?(a) 8
×
10
4
(b) 8
×
10
3
(c) 8
×
10
–4
30010 3–
103----------× 300 10 6–× (3 10 4– standard form)=×=
3103
100--------× 3 103× or 3000=
SL3100_frame_C19 Page 277 Friday, August 31, 2001 10:25 AM
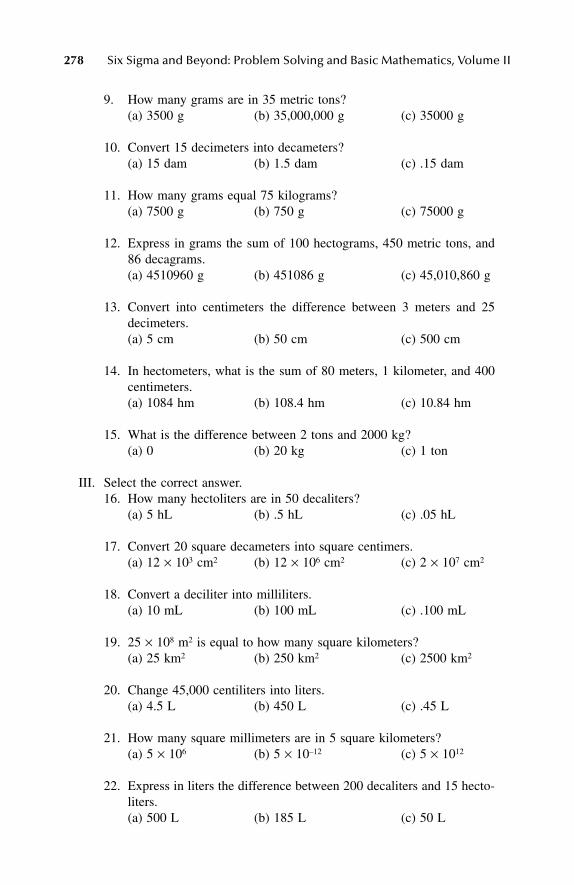
278
Six Sigma and Beyond: Problem Solving and Basic Mathematics, Volume II
9. How many grams are in 35 metric tons?(a) 3500 g (b) 35,000,000 g (c) 35000 g
10. Convert 15 decimeters into decameters?(a) 15 dam (b) 1.5 dam (c) .15 dam
11. How many grams equal 75 kilograms?(a) 7500 g (b) 750 g (c) 75000 g
12. Express in grams the sum of 100 hectograms, 450 metric tons, and86 decagrams.(a) 4510960 g (b) 451086 g (c) 45,010,860 g
13. Convert into centimeters the difference between 3 meters and 25decimeters.(a) 5 cm (b) 50 cm (c) 500 cm
14. In hectometers, what is the sum of 80 meters, 1 kilometer, and 400centimeters.(a) 1084 hm (b) 108.4 hm (c) 10.84 hm
15. What is the difference between 2 tons and 2000 kg?(a) 0 (b) 20 kg (c) 1 ton
III. Select the correct answer.16. How many hectoliters are in 50 decaliters?
(a) 5 hL (b) .5 hL (c) .05 hL
17. Convert 20 square decameters into square centimers.(a) 12
×
10
3
cm
2
(b) 12
×
10
6
cm
2
(c) 2
×
10
7
cm
2
18. Convert a deciliter into milliliters.(a) 10 mL (b) 100 mL (c) .100 mL
19. 25
×
10
8
m
2
is equal to how many square kilometers?(a) 25 km
2
(b) 250 km2 (c) 2500 km2
20. Change 45,000 centiliters into liters.(a) 4.5 L (b) 450 L (c) .45 L
21. How many square millimeters are in 5 square kilometers?(a) 5 × 10⁶ (b) 5 × 10–12 (c) 5 × 10¹²
22. Express in liters the difference between 200 decaliters and 15 hecto-liters.(a) 500 L (b) 185 L (c) 50 L
SL3100_frame_C19 Page 278 Friday, August 31, 2001 10:25 AM

The Metric System 279
23. Convert into square decameters the difference between 4 square kilo-meters and 325 square hectometers.(a) 7.5 × 10⁴ dam2 (b) 7.5 × 10⁵ dam2 (c) 7.5 × 10³ dam2
24. Express in milliliters the sum of 86 milliliters, 110 centiliters, and45 deciliters.(a) 1636 mL (b) 4696 mL (c) 5686 mL
25. Express in square meters the sum of 50 square decameters, 8.5 × 10⁵
square centimers, and 35 square meters.(a) 5120 m2 (b) 512 m2 (c) 5885 m2
Answers to the review test:
The metric system appears to be more difficult to use than the U.S. system.However, by “thinking metric,” it actually is easy to use.
There are 9 used units in the metric system compared to 11 in the U.S. system.Both systems are compared:
1. a 2. c 3. b 4. b 5. b6. b 7. c 8. a 9. b 10. c
11. c 12. a 13. b 14. c 15. a16. a 17. c 18. b 19. c 20. b
21. c 22. a 23. c 24. c 25. a
U.S. Metric
Linear Measure
12 in. = 1 ft 10 mm = 1 cm36 in. = 1 yd 1000 mm = 1 m3 ft = 1 yd 100 cm = 1 m5280 ft = 1 mi 1000 m = 1 km1760 yd = 1 mi
Volume16 oz = 1 pt 1000 mL = 1 L32 oz = 1 qt2 pt = 1 qt4 qt = 1 gal8 pt = 1 gal
Weight (mass)16 oz = 1 lb 1000 g = 1 kg2000 lb = 1 ton 1000 kg = 1 ton
SL3100_frame_C19 Page 279 Friday, August 31, 2001 10:25 AM

280 Six Sigma and Beyond: Problem Solving and Basic Mathematics, Volume II
In the metric system all measurements are multiples of ten. This importantcharacteristic makes understanding and calculations much easier.
Example: A man needs lumber in the following sizes: 2 ft 10 1/2 in., 7 ft 7 13/16in., 5 ft 6 in., and 3 ft 9 5/8 in. To find the total length of lumber needed, first changethe fractions of inches to sixteenths, and then add the measurements:
Using metric measurements, 5 pieces of lumber in the following sizes would beneeded: 876, 2332, 1676, and 1159 mm.
To find the total, add:
This example illustrates how easy it is to use the metric system. Using the metricsystem is also easy for weight, volume, and area measurements. The next sectionscontain additional problems using metric measurements for length, weight (mass),volume, and area.
Measurements are often given for large quantities. In the metric system, largequantities are multiples or fractions of the 10 base. Several tables will provide themultiples for the practice and exercise problems.
Area
144 in.2 = 1 ft2 100 mm2 = 1 cm2
9 ft2 = 1 yd2 10,000 cm2 = 1 m2
1296 in.2 = 1 yd2 1,000,000 mm2 = 1 m2
3097,600 yd2 = 1 mi2 1,000,000 m2 = 1 km2
Common Length (Linear) Measures
Unit Abbreviation Meter Equivalent
Megameter Mm 1,000,000 or 106
Myriameter mym 10,000 or 104
U.S. Metric
2 ft 10 8/16 in.
7 ft 7 13/16 in.
5 ft 6 in.
3 ft 9 10/16 in.17 ft 32 31/16 in.----------------------------------------------
= 19 ft 9 15/16 in.
876
2332
1676
11596043------------
mm or 6.043 m
SL3100_frame_C19 Page 280 Friday, August 31, 2001 10:25 AM

The Metric System
281
Practice:
Using the method in the last section, solve the problems.
1. How many km are in 10 dam?(a) 10
×
10
–4
(b) 1
×
10
–1
(c) 1
×
10
–2
Answer: b
2. Convert 1 mym into mm.(a) 10
–6
(b) 10
8
(c) 10
7
Answer: c
3. 20 mm is equal to how many dm?(a) .2 (b) .02 (c) 2Answer: a
Kilometer km 1000 or 10
3
Hectometer hm 100 or 10
2
Decameter dam 10 or 10
1
Meter m 1 or 10
0
Decimeter dm 1/10 or 10
–1
Centimeter cm 1/100 or 10
–2
Millimeter mm 1/1000 or 10
–3
Micrometer
µ
m 1/1,000,000 or 10
–6
Common Weight (Mass) Measures
Unit Abbreviation Gram Equivalent
Metric ton Mt or t 1,000,000 or 10
6
Kilograms kg 1000 or 10
3
Hectogram hg 100 or 10
2
Decagram dag 10 or 10
1
Common Length (Linear) Measures
(Continued)
Unit Abbreviation Meter Equivalent
10 10×1 103×------------------ 102 10 3–× 1 10 1– km×= =
104
10 3–---------- 107=
20 10 3–×1 10 1–×---------------------- 20 10 2–× .2= =
SL3100_frame_C19 Page 281 Wednesday, September 5, 2001 11:24 AM

282 Six Sigma and Beyond: Problem Solving and Basic Mathematics, Volume II
Practice: Using the method in the previous section, solve the problems.
1. How many grams are in 4 metric tons?(a) 4,000,000 (b) 400 (c) 4000Answer: a
2. How many decigrams are in 400 milligrams?(a) .4 (b) 40 (c) 4Answer: c
3. Convert 100 kilograms into decigrams.(a) 100 × 104 (b) 10 × 104 (c) 10 × 106
Answer: a
To work problems involving metric measures of the same kind, it is necessaryto convert all of them into a common measurement.
Example: To add the following length measures, 10 mm, 45 dm, and 150 cm, firstconvert them to a common length. For this example use centimeters. To do this, usethe same method as in earlier sections.
1. 10 mm equals how many cm?
Gram g 1 or 100
Decigram dg 1/10 or 10–1
Centigram cg 1/100 or 10–2
Milligram mg 1/1000 or 10–3
Microgram µg 1/1,000,000 or 10–6
Common Weight (Mass) Measures
Unit Abbreviation Gram Equivalent
4 106×105
----------------- 4 101× or 40=
400 10 3–×10 1–
------------------------- 400 10 2– or 4×=
100 103×10 1–
----------------------- 100 104×=
10 10 3–×10 2–
---------------------- 10 1– or 1=
SL3100_frame_C19 Page 282 Friday, August 31, 2001 10:25 AM

The Metric System 283
2. 45 dm equals how many cm?
3. 150 cm equals 150 cm.1 + 450 + 150 = 601 cm or
Practice: Using the examples as a reference, solve the problems.
1. Express in grams the sum of 30 dg, 25 hg, and 50 kg.(a) 7503 g (b) 30,030 g (c) 52,503 gAnswer: c
2. Express in decimeters the sum of 200 cm, .85 hm, and 800 mm.(a) 860 dm (b) 878 dm (c) 1058 dmAnswer: b
3. Express in meters the difference between 800 hm and 4000 dam.(a) 400 m (b) 4000 m (c) 40,000 mAnswer: c
EXERCISES
Directions: Select the correct answer. Feel free to restudy the instructions andexamples.
1. How many dam are in 600 mm?(a) .06 (b) 6 (c) 60
2. Convert 8 hg into mg.(a) 8 × 10⁻¹ (b) 8 × 10⁵ (c) 800
3. 1 dm equals how many m?(a) 10 (b) 100 (c) .1
4. How many meters are in 5 km?(a) 50 (b) 5000 (c) 500
45 10 1–×10 2–
---------------------- 45 10× or 450 cm=
1
450
+ 150601
-------------- cm
SL3100_frame_C19 Page 283 Friday, August 31, 2001 10:25 AM

284 Six Sigma and Beyond: Problem Solving and Basic Mathematics, Volume II
5. Convert 100 cg into kg.(a) .001 (b) .01 (c) .1
6. 10 kg equals how many dg?(a) 10,000 (b) 100,000 (c) 1000
7. Express in grams the sum of 2 kg, 4 dag, and 100 cg.(a) 2041 g (b) 241 g (c) 2410 g
8. Express in decimeters the sum of 1,000 mm, 100 cm, and 2 m.(a) 400 dm (b) 4 dm (c) 40 dm
9. What is the difference between 50 km and 300 hm?(a) 2000 m (b) 20,000 m (c) 200,000 m
10. Express in grams the difference between 100 hg and 900 dag.(a) 100 g (b) 800 g (c) 1000 g
Answers to the exercises:
Other common measures in the metric system will now be introduced. Squarefeet, square yards, and square miles are area measures in the U.S. system. Below isa table of common metric area measures.
Remember: A meter is the standard measure of length in the metric system.
Practice: Using the method in the previous section, solve the problems.
1. Convert 10 hm2 into m2.(a) 1000 (b) 10,000 (c) 100,000Answer: c
1. a 2. b 3. c 4. b 5. a6. b 7. a 8. c 9. b 10. c
Common Area Measures
Unit AbbreviationSquare Meter
Equivalent
Square kilometer km2 1,000,000 or 106
Square hectometer hm2 10,000 or 104
Square dekameter dam2 100 or 102
Square meter m2 1 or 100
Square centimeter cm2 1/10,000 or 10–4
Square millimeter mm2 1/1,000,000 or 10–6
SL3100_frame_C19 Page 284 Friday, August 31, 2001 10:25 AM

The Metric System 285
2. How many mm2 are in .45 dam2?(a) 4.5 × 10⁷ (b) .45 × 10–5 (c) 45 × 107
Answer: a
3. Change 250 dam2 into m2.(a) 25 × 102 m2 (b) 2500 m2 (c) 25,000 m2
Answer: c
To work problems with metric measures of the same kind, it is necessary to convertall of them to a common measurement.
Example: To add the following volume measurements, 4 dkL, 80 dL, and 150 cL,first convert to a common volume. For this example, change them to centiliters.
1. 4 daL equals how many cL?
2. 80 dL equals how many cL?
3. 150 cL equals 150 cL.
Therefore, 4000 + 800 + 150 = 4950 cL or
10 104×100
-------------------- 100,000=
.45 102×10 6–
--------------------- .45 108 or 4.5 107××=
250 102×100
----------------------- 25,000=
4 101×10 2–
----------------- 4 103× or 4000 cL=
80 10 1–×10 2–
---------------------- 800 cL=
4000
800
+ 1504950--------------
cL
SL3100_frame_C19 Page 285 Friday, August 31, 2001 10:25 AM

286 Six Sigma and Beyond: Problem Solving and Basic Mathematics, Volume II
Practice: Using the above examples as a reference, solve the problems.
1. Express in liters the sum of 2 kL, 400 cL, and 3000 dL.(a) 2304 L (b) 234 L (c) 504 LAnswer: a
2. Express in dam2 the difference between 86 km2 and 2300 hm2.(a) 6300 dam2 (b) 63,000 dam2 (c) 6.3 × 10⁵ dam2
Answer: c
3. 210 daL + 4000 dL + 9000 mL = _________ cL.(a) 250,900 cL (b) 259,000 cL (c) 214,900 cLAnswer: a
EXERCISES
Directions: In each of these exercises, select the correct answer. If necessary, restudythe instructions and examples.
1. Convert 750 L into hL.(a) 75 hL (b) 7.5 hL (c) .75 hL
2. How many deciliters are in 84 decaliters?(a) 8.4 × 10³ (b) 84 × 103 (c) 8.4 × 10²
3. 2.5 × 10⁶ mL equals how many kL?(a) 25 kL (b) 250 kL (c) 2.5 kL
4. Express 19 km2 in hm2.(a) 1900 hm2 (b) 19,000 hm2 (c) 190 hm2
5. How many mm2 are in 1 m2?(a) 1000 mm2 (b) 10,000 mm2 (c) 1,000,000 mm2
6. Convert 10 hm2 into cm2.(a) 10 × 108 cm2 (b) 10 × 104 cm2 (c) 1,000,000 cm2
7. Express in daL the difference between 14,500 daL and 4750 daL.(a) 9750 daL (b) 97,500 daL (c) 120,250 daL
8. Express in hm2 the sum of 25 m2, 4500 cm2, and 250 dam2. (a) 5025 × 1018 hm2 (b) 2.502545 hm2 (c) 5,025 × 1012 hm2
9. What is the difference between 20 hL and 450 dL?(a) 255 L (b) 1955 L (c) 25.5 dL
SL3100_frame_C19 Page 286 Friday, August 31, 2001 10:25 AM

The Metric System 287
10. In square meters express 2 km2, 40 dam2, and 100,000 cm2. (a) 200,410 m2 (b) 204,010 m2 (c) 2,004,010 m2
Answers to the exercises:
CUMULATIVE EXERCISES
Directions: Solve the following problems.
I. Select the correct answer.1. A U.S. measurement of volume:
(a) quart (b) inch (c) milliliter
2. A metric measurement of length:(a) kiloliter (b) foot (c) millimeter
3. A U.S. measurement of area:(a) gallon (b) square inch (c) cubic inch
4. A metric measurement of mass:(a) liter (b) area (c) gram
5. A metric measurement of area:(a) square (b) square hectometer
II. Select the correct answer.6. How many m are in 30 hm?
(a) 300 m (b) 3000 m (c) 30,000 m
7. Convert 25 g into kg.(a) 2.5 kg (b) .25 kg (c) .025 kg.
8. Convert a cm into µm.(a) 1000 µm (b) 10,000 µm (c) 100 µm
9. 8 t is equal to how many dag?(a) 8 × 10⁵ (b) 8 × 10⁶ (c) 8 × 10⁴
10. Change 2500 centimeters into meters.(a) 25 m (b) 2500 m (c) 25,000 m
1. b 2. a 3. c 4. a 5. c6. a 7. a 8. b 9. b 10. c
SL3100_frame_C19 Page 287 Friday, August 31, 2001 10:25 AM
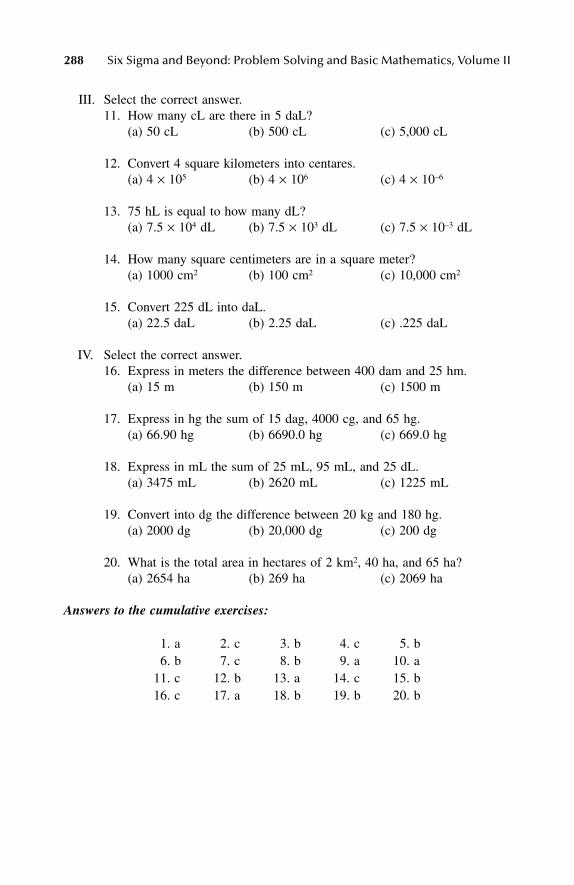
288 Six Sigma and Beyond: Problem Solving and Basic Mathematics, Volume II
III. Select the correct answer.11. How many cL are there in 5 daL?
(a) 50 cL (b) 500 cL (c) 5,000 cL
12. Convert 4 square kilometers into centares.(a) 4 × 10⁵ (b) 4 × 10⁶ (c) 4 × 10⁻⁶
13. 75 hL is equal to how many dL?(a) 7.5 × 10⁴ dL (b) 7.5 × 10³ dL (c) 7.5 × 10⁻³ dL
14. How many square centimeters are in a square meter?(a) 1000 cm2 (b) 100 cm2 (c) 10,000 cm2
15. Convert 225 dL into daL.(a) 22.5 daL (b) 2.25 daL (c) .225 daL
IV. Select the correct answer.16. Express in meters the difference between 400 dam and 25 hm.
(a) 15 m (b) 150 m (c) 1500 m
17. Express in hg the sum of 15 dag, 4000 cg, and 65 hg.(a) 66.90 hg (b) 6690.0 hg (c) 669.0 hg
18. Express in mL the sum of 25 mL, 95 mL, and 25 dL.(a) 3475 mL (b) 2620 mL (c) 1225 mL
19. Convert into dg the difference between 20 kg and 180 hg.(a) 2000 dg (b) 20,000 dg (c) 200 dg
20. What is the total area in hectares of 2 km2, 40 ha, and 65 ha?(a) 2654 ha (b) 269 ha (c) 2069 ha
Answers to the cumulative exercises:
1. a 2. c 3. b 4. c 5. b6. b 7. c 8. b 9. a 10. a
11. c 12. b 13. a 14. c 15. b16. c 17. a 18. b 19. b 20. b
SL3100_frame_C19 Page 288 Friday, August 31, 2001 10:25 AM
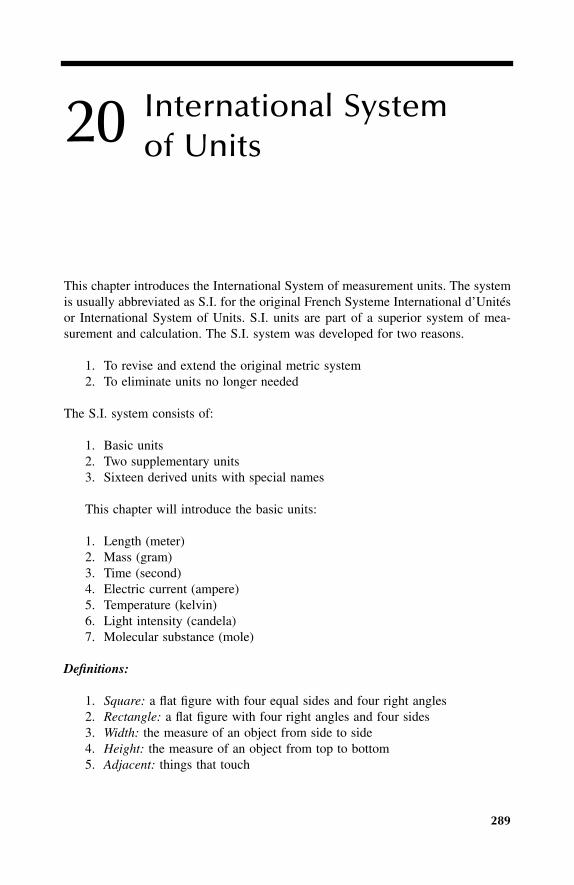
289
International Systemof Units
This chapter introduces the International System of measurement units. The systemis usually abbreviated as S.I. for the original French Systeme International d’Unitésor International System of Units. S.I. units are part of a superior system of mea-surement and calculation. The S.I. system was developed for two reasons.
1. To revise and extend the original metric system2. To eliminate units no longer needed
The S.I. system consists of:
1. Basic units2. Two supplementary units3. Sixteen derived units with special names
This chapter will introduce the basic units:
1. Length (meter)2. Mass (gram)3. Time (second)4. Electric current (ampere)5. Temperature (kelvin)6. Light intensity (candela)7. Molecular substance (mole)
Definitions:
1.
Square:
a flat figure with four equal sides and four right angles2.
Rectangle:
a flat figure with four right angles and four sides3.
Width:
the measure of an object from side to side4.
Height:
the measure of an object from top to bottom5.
Adjacent:
things that touch
20
SL3100_frame_C20 Page 289 Friday, August 31, 2001 10:26 AM

290
Six Sigma and Beyond: Problem Solving and Basic Mathematics, Volume II
6.
Weight:
the measure of how heavy an object is (“Weight” means almostthe same as “mass.”)
7.
Mass:
the measure of how heavy an object is (“Mass” means almost thesame as “weight.”)
8.
Temperature:
the measure of how hot an object is9.
Degree:
a unit used to measure temperature (The symbol for degree is °.)10.
Energy:
the power of certain forces of nature to do work11.
Acceleration:
the rate at which speed is increased12.
Force:
power or energy that can do or make something13.
Pressure:
the force exerted against a surface14.
Circuit:
the complete path of an electrical current15.
Current:
the flow of electricity in a wire or other conductor16.
Resistance:
the opposition of one force or thing to another17.
Cycle:
a complete set of events, returning to the original state18.
Frequency:
the number of complete cycles of current19.
Density:
the amount of mass of an object for each unit of area or volume
METER
The S.I. unit for length and area is the meter (m). By using prefixes, shorter or longerlengths can be expressed. Originally, the meter was one ten-millionth of the distanceof the line passing from the equator to the North Pole through Paris. Today, themeter is defined as the length of 1,650,763.73 wavelengths in a vacuum of theorange-red line in the spectrum of krypton 86. A standard bar of this length is safelystored at the National Bureau of Standards in Washington, D.C.
A meter is 39.37 in. or about 3 1/3 in. longer than a yard. The prefixes from theprevious chapter make it easy to express very long and very short lengths.
The S.I. unit for area is the square meter (m
2
). Simply, a square meter is a squarewhose sides measure 1 m each. If a surface is a square and has sides measuring 2 meach, it is said to have an area of 4 m
2
. The area of a square surface is found bysquaring (or multiplying by itself) the measure of one of the sides. Therefore, ifeach side of a square measures 6 m, the area is 36 m
2
, because 6
×
6 = 36.By using prefixes, areas of very small squares may be found. For example, if a
square has sides measuring 1 mm each, the square has an area of 1 square millimeter(mm
2
); also if each side of a square measures 5 cm, the area of the square is 25 cm
2
or (5 cm
×
5 cm = 25 cm
2
).
Practice:
Using the examples as references, solve the problems:
1. What is the area of a square with sides measuring 7 mm each?(a) 14 mm
2
(b) 49 mm (c) 49 mm
2
Answer: c (7 mm
×
7 mm = 49 mm
2
)
2. What is the area of a square with sides measuring 3 cm each?(a) 9 cm (b) 9 cm
2
(c) 6 cm
2
Answer: b (3 cm
×
3 cm = 9 cm
2
)
SL3100_frame_C20 Page 290 Friday, August 31, 2001 10:26 AM

International System of Units
291
The area of a rectangular surface may be found using a similar method. If arectangle has two sides measuring 3 m and two sides measuring 4 m, it has an areaof 12 m
2
. To find the area of a rectangle, multiply the measure of one of the sidesby the measure of an adjacent side (sides touch each other).
If one side of a rectangle measures 2 cm, and an adjacent side measures 5 cm,the area of the rectangle is 10 cm
2
: 2 cm
×
5 cm = 10 cm
2
. When finding the areaof a rectangle, be sure the measures of adjacent sides are expressed in the same unit.Consider a rectangle that has one side measuring 50 cm and an adjacent sidemeasuring 3 m. Change one of the measures so that both are expressed in eithermeters or centimeters: 50 cm could be changed to .5 meters; then multiply by 3 m.The area of a rectangle is 1.5 m
2
.This problem could also be solved by changing 3 m to 300 cm and then multi-
plying by 50 cm. The area of the rectangle is 1500 cm
2
. Both answers are correct.If one side of a rectangle measures 20 dm and an adjacent side measures 3 m,
what is the area of the rectangle expressed in square meters? The answer is 6 m
2
20 dm = 2 m: 2 m
×
3 m = 6 m
2
.
Practice:
Using the examples, answer the questions:
1. What is the area of a rectangle with two sides measuring 3 m and twosides measuring 12 m?(a) 36 m
2
(b) 15 m
2
(c) 36 mAnswer: a (12 m
×
3 m = 36 m
2
)
2. What is the area of a rectangle with one side measuring 5 cm and anadjacent side measuring 3 cm?(a) 8 cm
2
(b) 15 cm
2
(c) 15 cmAnswer: b (5 cm
×
3 cm = 15 cm
2
)
3. What is the area in m
2
of a rectangle with two sides measuring 3 km andtwo sides measuring 3 m?(a) 9 m
2
(b) 9000 m
2
(c) 6 m
2
Answer: b (3 km = 3000 m; 3000 m
×
3 m = 9000 m
2
)
4. What is the area in mm of a rectangle with one side measuring 3 cm andan adjacent side measuring 5 mm
2
?(a) 15 mm
2
(b) 150 mm
2
(c) 1.5 mm
2
Answer: b (3 cm = 30 mm; 30 mm
×
5 mm = 150 mm
2
)
EXERCISES
Directions:
Select the correct answer. If necessary, restudy the instructions andexamples.
1. What is the area of a square with sides measuring 4 cm each?(a) 8 cm
2
(b) 4 cm
2
(c) 16 cm
2
SL3100_frame_C20 Page 291 Friday, August 31, 2001 10:26 AM

292
Six Sigma and Beyond: Problem Solving and Basic Mathematics, Volume II
2. What is the area of a rectangle with two sides measuring 5 m and twosides measuring 7 m?(a) 35 m
2
(b) 12 m
2
(c) 24 m
2
3. What is the area in cm
2
of a rectangle with one side measuring 2 m andan adjacent side measuring 3 cm?(a) 600 cm
2
(b) 6 cm
2
(c) 60 cm
2
4. The square meter is a measure of(a) volume (b) length (c) area
5. What is the area in m
2
of a rectangle with two sides measuring 5 m andtwo sides measuring 3 km?(a) 15 m
2
(b) 15000 m
2
(c) 1500 m
2
Answers to the exercises:
CUBIC METER
In the S.I. system, the cubic meter (m
3
) is the standard measure of volume. A cubicmeter is a square box with each side measuring 1 meter. To find the volume of abox, multiply together the length of the box, the width of the box, and the heightof the box. Look at a few examples:
Example 1:
a square box.
The length is 3 m, the width is 3 m, and the width is 3 m.Volume is length
×
width
×
height: 3 m
×
3 m
×
3 m. The volume of the box is 27 m
3
.
Example 2:
a rectangular box.
The length is 30 mm, the width is 2 cm, and theheight is 1 cm. Before multiplying length
×
width
×
height, all three measurementsmust be expressed in the same unit. Change 30 mm to 3 cm and multiply length
×
width
×
height to find the volume. The volume of the box is 3 cm
×
2 cm
×
1 cmor 6 cm
3
.
Example 3:
a square box.
The length is 1 dm, the width is 1 dm, and the height is1 dm. The volume of the box is 1 dm
×
1 dm
×
1 dm or 1 dm
3
or “one cubic decimeter.”Cubic decimeter is a unique measure of volume. Another name for a cubic
decimeter is liter. A liter (1000 cm
3
= 1 liter) is a little larger than a quart. A liter
1. c 2. a 3. a 4. c 5. b
SL3100_frame_C20 Page 292 Friday, August 31, 2001 10:26 AM

International System of Units
293
is used as the standard measure of liquid volume in the metric system and can beexpressed as very small or very large units of volume by using prefixes: 1 cubiccentimeter equals 1 milliliter or 1 cm
3
= 1 mL.
Practice:
1. What is the volume of a square box with sides measuring 5 m each?(a) 10 m
3
(b) 25 m
3
(c) 125 m
3
Answer: c (5 m
×
5 m
×
5 m = 125 m
3
)
2. What is the volume in cm
3
of a rectangular box with a length of 2 cm, awidth of 2 mm, and a height of 2 m?(a) 8 cm
3
(b) 80 cm
3
(c) 800 cm
3
Answer: b (2 mm = .2 cm; 2 m = 200 cm; 2 cm
×
.2 cm
×
200 cm = 80 cm
3
)
3. What is the volume in m
3
of a rectangular box with a length of 3 m, awidth of 2 m, and a height of 400 cm?(a) 2400 m
3 (b) 240 m3 (c) 24 m3
Answer: c (400 cm = 4 m; 3 m × 2 m × 4 m = 24 m3)
EXERCISES
Directions: Select the correct answer. If necessary, restudy the instructions andexamples.
1. What is the volume of a square box with sides measuring 3 cm each?(a) 9 cm3 (b) 27 cm3 (c) 6 cm3
2. What is the volume of a rectangular box with a length of 3 cm, a heightof 4 cm, and a width of 5 cm? (a) 12 cm3 (b) 60 cm3 (c) 60 cm2
3. What is the S.I. standard unit of volume?(a) square meter (b) cubic decimeter (c) cubic meter
4. What is the volume in m3 of a rectangular box with a length of 2 m, awidth of 20 cm, and a height of 200 mm?(a) 8 m3 (b) .8 m3 (c) .08 m3
5. What is the volume in cm3 of a rectangle with a length of 3 cm, a widthof 2 mm, and a height of .5 m?(a) 30 cm3 (b) 5.5 cm3 (c) 3 cm3
Answers to the exercises:
1. b 2. b 3. c 4. c 5. a
SL3100_frame_C20 Page 293 Friday, August 31, 2001 10:26 AM

294 Six Sigma and Beyond: Problem Solving and Basic Mathematics, Volume II
KILOGRAM
“Gram” is derived from the Latin word “gramma,” meaning “a small weight” (1 gramis about .04 ounces). All units of weight in the metric system are based on the gram.The gram unit of mass is the kilogram: a kilogram is equal to 1000 grams and1 kilogram is about 2.2 pounds.
The gram is such a small unit of weight that it is often not practical to use it.Therefore, the kilogram is the standard unit. The gram is often used to weigh smallthings. For instance, a teaspoon contains about 5 grams. The kilogram is used tomeasure bigger things. For example, 150 pounds is about 68 kilograms. To weighextremely large objects, such as an elephant, use the metric ton. One metric tonequals 1000 kg. An elephant weighs about 5 metric tons or 5000 kilograms.
Many prefixes can be added to the word “gram” to indicate larger weights:
10 grams (g) = 1 dekagram (dag) = 101
100 grams (g) = 1 hectogram (hg) = 102
1000 grams (g) = 1 kilogram (kg) = 103
1,000,000 grams (g) = 1 metric ton (t or MT) = 106
Very small weights may also be expressed by adding prefixes to the word “gram:”
1/10 gram (g) = 1 decigram (dg) = 10–1
1/100 gram (g) = 1 centigram (cg) = 10–2
1/1000 gram (g) = 1 milligram (mg) = 10–3
1/1,000,000 gram (g) = a microgram (µg) = 10–6
Still another way of conversion is from pounds to ounces and vice versa:
1 pound = 16 ounces1 kilogram = 1000 grams
Example 1: There are approximately 2.2 pounds in a kilogram. To know how manykilograms are in 17 pounds, simply multiply 2.2 by 17. There are 37.4 kilogramsin 17 pounds.
Example 2: To know how many pounds are in 52 grams, first determine how manykilograms are in 52 grams. Because 1,000 grams is equal to 1 kilogram, 52 gramswould equal .052 kg. The number of pounds can now be determined using themethod described above: .052 kg × 2.2 lb/kg = .1144 lb. There are .1144 pounds in52 grams.
Example 3: How many ounces are in 12 kilograms? There are 26.4 pounds in 12kilograms (12 × 2.2 = 26.4). To change from pounds to ounces, multiply the numberof pounds by 16: 26.4 × 16 = 422.4 oz. There are 422.4 ounces in 12 kilograms.
SL3100_frame_C20 Page 294 Friday, August 31, 2001 10:26 AM

International System of Units 295
Example 4: How many ounces are in 4 grams?
4 grams = .004 kilograms.004 kg × 2.2 = .0088 pounds
.0088 × 16 = .1408 ounces
There are .1408 ounces in 4 grams.
Practice: Refer to the examples, solve the following problems:
1. How many pounds are in 3 kilograms?(a) 5.2 (b) 6.6 (c) 66Answer: b (2.2 × 3 = 6.6)
2. How many ounces are in 4 kilograms?(a) 8.8 (b) 64 (c) 140.8Answer: c (2.2 × 4 = 8.8 lb, 8.8 × 16 = 140.8 oz)
3. How many pounds are in 300 grams?(a) 660 (b) .3 (c) .66Answer: c (300 g = .3 kg, .3 × 2.2 = .66)
4. How many ounces are in 14 grams?(a) .0308 (b) .4928 (c) 492.8Answer: b (14 g = .014 kg, .014 × 2.2 = .0308, .0308 × 16 = .4928)
EXERCISES
Directions: Select the correct answer. If necessary, restudy the instructions andexamples.
1. A gram weighs(a) more than a (b) less than a (c) the same as a
pound pound pound
2. A pair of men’s shoes has a mass of about(a) 1 g (b) 1 kg (c) 50 kg
3. A car has a mass of about(a) 50 kg (b) 100 kg (c) 1 MT
4. 500 grams equals(a) 50 dag (b) 2 kg (c) .5 hg
5. 1 milligram equals(a) 10–1 g (b) 10–2 g (c) 10–3 g
SL3100_frame_C20 Page 295 Friday, August 31, 2001 10:26 AM

296 Six Sigma and Beyond: Problem Solving and Basic Mathematics, Volume II
6. How many pounds are in 17 kilograms?(a) 37.4 lb (b) 19.2 lb (c) 3.74 lb
7. How many ounces are in 6 kilograms?(a) 13.2 oz (b) 212 oz (c) 211.2 oz
8. How many ounces are in 11 grams?(a) .0242 oz (b) .3872 oz (c) 387.2 oz
9. How many pounds are in 400 grams?(a) .88 lb (b) 880 lb (c) 8.8 lb
10. How many ounces are in 3.3 grams?(a) .00726 oz (b) .11616 oz (c) 116.16 oz
Answers to the exercises:
KELVIN
In the S.I. system, Kelvin is the standard unit for temperature, named after the Englishphysicist, Lord William Thomson Kelvin. The scale is based on the average kineticenergy per molecule of a perfect gas. Zero is equal to –273.16° Centigrade or –459.69°Fahrenheit. Zero temperature on the Kelvin scale represents absolute zero, meaningmolecular motion has ceased. There is no upper limit on temperature because noneis known. To convert a Celsius temperature to Kelvin, simply add 273.16 to theCelsius temperature. The symbol used for the Kelvin temperature scale is “K.”
The four temperature scales are
1. The Celsius scale (from which the centigrade scale was developed) isbased on the boiling point of water of 0° and the freezing point of 100°.This scale is no longer in use as originally designed. Instead the letter“°C” is used to designate the centigrade scale.
2. The Centigrade scale is based on 100. The freezing point of water is 0°and the boiling point 100°. This scale is the opposite of the Celsius scale.The distance between the freezing and boiling points in Fahrenheit andReaumur is 180° and 80°, respectively.
3. The Fahrenheit scale is a temperature scale in which zero is defined by amixture of equal weight of snow and common salt. The freezing point is32° and the boiling point is 212° and the symbol for is “°F.” Both freezingand boiling are measured under standard atmospheric pressure.
4. The Reaumur scale defines 0° as the temperature of melting ice and 80°as the temperature of boiling water. This scale is not used.
1. b 2. b 3. c 4. a 5. c6. a 7. c 8. b 9. a 10. b
SL3100_frame_C20 Page 296 Friday, August 31, 2001 10:26 AM

International System of Units 297
In 1948, the International Committee on Weights and Measures and the NationalBureau of Standards decided to discontinue the Celsius scale and to use the centi-grade scale (now known as the Celsius or the centigrade scale). To convert Celsiusto Fahrenheit, use: C° = (F° – 32)5/9. To convert Fahrenheit to Celsius, use: F° =(9/5 C°) + 32.
Example 1: What is 65 degrees Fahrenheit on the centigrade scale?
C = (65 – 32)5/9 = 18.338°C
Example 2: What is 105 degrees Celsius on the Fahrenheit scale?
F = 9/5(105) + 32 = 221°F
Example 3: What is 86 degrees Celsius on the Kelvin scale?
K = 86 + 273.16 = 359.16 K
Example 4: What is 150 K on the °C scale?
To convert from Kelvin to Celsius, use the formula from the previous page in reverse.Use C = K – 273.16, C = 150 – 273.16 = –123.16°C.
Another method to change from a temperature expressed in degrees Celsius toone expressed in degrees Fahrenheit is to multiply the number of degrees Celsiusby 1.8. Then add 32 to the answer. This is then the number of degrees Fahrenheit.
Example 5: How many degrees Fahrenheit are in 60°C? Multiply 60 by 1.8: 60 ×1.8 = 108. Then add 32 to the answer: 108 + 32 = 140. If the temperature is 60°C,it can be expressed as 140°F.
Practice: Refer to examples, solve the problems:
1. How many degrees Fahrenheit are in 75°C?(a) 135°F (b) 167°F (c) 192.6°FAnswer: b (75 × 1.8 = 135, 135 + 32 = 167°F)
2. How many degrees Fahrenheit are in –5°C?(a) 23°F (b) –9°F (c) 27°FAnswer: a (–5 × 1.8 = –9, –9 + 32 = 23°F)
To change from a temperature expressed in Kelvin to one expressed in degreesFahrenheit, first change from Kelvin to degrees Celsius. Do this by subtracting273.16 from the Kelvin number. Then change this new answer from Celsius toFahrenheit using the method explained at the beginning of this section.
SL3100_frame_C20 Page 297 Friday, August 31, 2001 10:26 AM

298 Six Sigma and Beyond: Problem Solving and Basic Mathematics, Volume II
Example 6: To change from 328.16 K to degrees Fahrenheit, first change to degreesCelsius: 328.16 – 273.16 = 55°C. Then change 55°C to degrees Fahrenheit:
55 × 1.8 = 9999 + 32 = 131°F
Answer: 131°F in 55°C.
Example 7: Change 358.66 K to degrees Fahrenheit:
358.66 – 273.16 = 85.50°C85.5 × 1.8 = 153.9°
153.9 + 32 = 185.9°F
Answer: 358.66 K = 185.9°F.
Practice: Refer to the examples, solve the following problems.
1. How many °F are in 284.66 K?(a) 20.7°F (b) 52.7°F (c) 78.3°FAnswer: b (284.66 – 273.16 = 11.5, 11.5 × 1.8 = 20.7, 20.7 + 32 = 52.7°F)
2. How many °F are in 300 K?(a) 8.0312°F (b) 48.312°F (c) 80.312°FAnswer: c (300 – 273.16 = 26.84, 26.84 × 1.8 = 48.312, 48.312 + 32 =80.312°F)
EXERCISES
Directions: Select the correct answer. If necessary, restudy the introduction and theexamples.
1. The coldest something can be is(a) 0°C (b) 0°F (c) 0 K
2. In the Celsius system, water boils at (a) 100°C (b) 212°C (c) 273.16°C
3. In the Kelvin system, how many units are between the boiling point ofwater and the freezing point of water?(a) 273.16 (b) 100 (c) 373.16
4. –459.69°F equals(a) 0°K (b) 0°C (c) 0 K
SL3100_frame_C20 Page 298 Friday, August 31, 2001 10:26 AM

International System of Units 299
5. Which two systems are most similar?(a) Celsius and (b) Celsius and (c) Fahrenheit and
Fahrenheit Kelvin Celsius
6. The standard S.I. measure of temperature is(a) Fahrenheit (b) Celsius (c) Kelvin
7. Absolute zero is(a) 0°C (b) 0 K (c) 0°F
8. Zero degrees Celsius equals(a) 212°F (b) 0°F (c) 273.16 K
9. The boiling point of water is (a) 373.16 K (b) 212 K (c) 100 K
10. The freezing point of water is (a) 0 K (b) 273.16 K (c) 32 K
11. Convert 25°C to °F.(a) 77°F (b) –414.688°F (c) 45°F
12. Convert 276 K to °C.(a) 37.112°C (b) 28.4°C (c) 2.84°C
13. How many °F are in 52.16 K?(a) –365.8°F (b) 429.8°F (c) 365.8°F
14. How many °F are in 712.66 K?(a) 439.5°F (b) 823.1°F (c) 791.1°F
15. Convert 521.56 K to °F.(a) 248.4°F (b) 447.12°F (c) 479.12°F
16. Change 280 K to °C.(a) 44.312°C (b) 6.84°C (c) 68.4°C
17. Change 272 K to °F.(a) 29.912°F (b) –2.088°F (c) 34.008°F
18. Change 65°C to °F.(a) –342.688°F (b) 149°F (c) 117°F
19. How many °F are in 290 K?(a) 554°F (b) 30.312°F (c) 62.312°F
SL3100_frame_C20 Page 299 Friday, August 31, 2001 10:26 AM

300 Six Sigma and Beyond: Problem Solving and Basic Mathematics, Volume II
20. How many °F are in 305 K?(a) 31.84°F (b) 57.312°F (c) 89.312°F
Answers to the exercises:
REVIEW EXERCISES ON MASS, GRAMS,AND TEMPERATURE
Directions: Try to answer each problem correctly from memory alone.
I. Select the correct answer.1. A gram weighs
(a) more than an ounce (b) less than an ounce (c) the same as anounce
2. A kilogram weighs(a) more than a pound (b) less than a pound (c) the same as a
pound
3. A whale would most likely be weighed in what unit?(a) grams (b) kilograms (c) metric tons
4. A key would most likely be weighed in what unit?(a) grams (b) kilograms (c) metric tons
5. A newborn baby would have a mass of about(a) 3 grams (b) 3 kilograms (c) 3 milligrams
6. Which of the following units would most likely be used to weigh achair?(a) grams (b) kilograms (c) decigrams
7. Which of the following is not a unit of mass?(a) quintal (b) metric ton (c) liter
8. 1,000,000 grams is equal to (a) one microgram (b) one metric ton (c) one quintal
9. 17 centigrams is equal to(a) .17 grams (b) 1.7 milligrams (c) .000017 metric
tons
1. c 2. a 3. b 4. c 5. b6. c 7. b 8. c 9. a 10. b
11. a 12. c 13. a 14. b 15. c16. b 17. a 18. b 19. c 20. c
SL3100_frame_C20 Page 300 Friday, August 31, 2001 10:26 AM

International System of Units 301
10. 10 grams is equal to how many kilograms?(a) 1 kilogram (b) .01 kilogram (c) .001 kilogram
II. Select the correct answer.11. What is the standard S.I. unit of temperature?
(a) Fahrenheit (b) Celsius (c) Kelvin
12. The freezing point of water is(a) 0° Fahrenheit (b) 0° Celsius (c) 0 Kelvin
13. The boiling point of water is(a) 100° Fahrenheit (b) 212° Celsius (c) 373.16 K
14. Absolute zero is(a) 0° Fahrenheit (b) 0° Celsius (c) 0 K
15. Zero degrees Celsius is equal to (a) 0° Kelvin (b) 273.16 Kelvin (c) 32° Kelvin
16. The coldest temperature is(a) absolute zero (b) Kelvin (c) the freezing
point
17. Zero Kelvin equals(a) –459.69°F (b) 0°C (c) –100°C
18. In the Celsius system, how many degrees are between the boilingpoint and the freezing point of water?(a) 180°C (b) 273.16°C (c) 100°C
19. Which is the coldest?(a) 0°C (b) 0°K (c) 0°F
20. 100 K is the same as(a) 373.16°C (b) 212°C (c) –173.16°C
Answers to the review exercises:
1. b 2. a 3. c 4. a 5. b6. b 7. c 8. b 9. a 10. b
11. c 12. b 13. c 14. c 15. b16. a 17. a 18. c 19. b 20. c
SL3100_frame_C20 Page 301 Friday, August 31, 2001 10:26 AM

302 Six Sigma and Beyond: Problem Solving and Basic Mathematics, Volume II
TECHNICAL UNITS
This section introduces some of the derived units in the S.I. system. Many derivedunits are technical and hard to comprehend. However, it is important to recognizeand understand them.
There are many derived S.I. units. Simply, a derived unit is one that has at leasttwo characteristics. It is formed by multiplying or dividing a base unit by one or moreother units. Square meter is a derived unit (the meter) multiplied by another unit(again, the meter). This section describes 16 derived units which have special names.
When studying derived units, remember the standard S.I. units:
1. Length (meter, m)2. Mass (kilogram, kg)3. Time (second, s)4. Electrical current (ampere, A)5. Temperature (Kelvin, K)6. Light intensity (candela, c)7. Molecular substance (mole, mol)
The 16 derived units are
1. Energy — work, heat, quantity (joule, J)2. Force (newton, N)3. Pressure (pascal, Pa)4. Power (watt, W)5. Electrical charge — quantity of electricity (coulomb, C)6. Electrical potential difference — voltage, electromotive force (volt, V, E)7. Electrical resistance (ohm, Ω)8. Electrical conductance (siemens, S)9. Electrical capacitance (farad, F)
10. Electrical inductance (henry, H)11. Frequency (hertz, Hz)12. Magnetic flux (weber, Wb)13. Magnetic flux density (tesla, T)14. Luminous flux (lumen, lm)15. Illumination (lux, lx)16. Customary temperature (degree celsius, °C)
Each of the derived units will now be briefly described.
1. Joule: measures energy. The joule is used to measure the amount of workdone. It is a very small amount of energy. For everyday use, kilowatthoursare more practical.
2. Newton: the amount of force which will give a mass of 1 kilogram anacceleration of 1 meter per second squared. If an apple is tossed into theair and then caught, the amount of force that hits the hand is about 1 newton.
SL3100_frame_C20 Page 302 Friday, August 31, 2001 10:26 AM

International System of Units 303
3. Pascal: the same as newton per square meter. A pascal describes the forcein a certain area, such as tire pressure. It is an extremely small amountof pressure.
4. Watt: measures power or the rate at which work is being done. A watt isequal to the flow of 1 ampere at a pressure of 1 volt. A watthour is theamount of electrical energy used to keep a 1 watt unit working for 1 hour.About 746 watts equal 1 horsepower.
5. Coulomb: measures the quantity of electricity flowing past a section of acircuit in 1 second when the current is 1 ampere.
6. Volts: a “push” that moves a current of 1 ampere through a resistance ofone ohms.
7. Ohm: measures resistance to the passage of an electrical current. The ohmmeasures how well something “conducts.” A good conductor of electricityhas little resistance to the flow of electricity. A poor conductor has sig-nificant resistance.
8. Siemens: measures conductance. Conductance is the opposite of resistancewhich is measured by the ohm. The siemens was formerly called “mho”(ohm spelled backward).
9. Farad: measures electrical capacity. Because farad is a very large unit,often in work done, the microfarad is used (one millionth of a farad).
10. Henry: measures electrical inductance. Inductance is when a current pro-duces an electrical effect on a force in a circuit.
11. Hertz: measures frequency. A hertz is the frequency of one cycle persecond.
12. Weber: measures magnetic flux. Magnetic flux are the lines of force thatsurround a magnet.
13. Tesla: measures flux density (magnetic field strength). A tesla is thedensity of 1 weber per square meter.
14. Lumen: measures luminous flux. To better understand lumen, consider thefollowing example. If a candle is placed in the center of a globe, a lumenis the amount of light that falls on one square foot of the globe’s insidesurface.
15. Lux: measures illumination of how bright or dull an object is. Footcandleis an older unit of illumination.
16. Degree Celsius: See the section on Kelvin.
SL3100_frame_C20 Page 303 Friday, August 31, 2001 10:26 AM

304 Six Sigma and Beyond: Problem Solving and Basic Mathematics, Volume II
EXERCISES
Directions: Select the correct answer. If necessary, restudy the overview anddefinitions.
1. The abbreviation for ohm is(a) 0 (b) ° (c) Ω
2. A measure of frequency is(a) hertz (b) henry (c) farad
3. A watt is(a) more power than (b) less power than (c) the same amount as
a horse power a horsepower a horsepower
4. The opposite of resistance is (a) conductance (b) ohm (c) volt
5. Which is not a measure of illumination?(a) lux (b) lumen (c) footcandle
Answers to the exercises:
1. c 2. a 3. b 4. a 5. b
SL3100_frame_C20 Page 304 Friday, August 31, 2001 10:26 AM

305
Conversion of English Units to Metric Units
The previous chapter introduced the S.I. system of measurements and conversionfrom a smaller unit to a larger unit. This chapter presents conversions from inchesto centimeters, from yards to meters, and from quarts to liters, including squaredand cubic units.
Definitions:
1.
Decimal point:
the period in a number indicating the value of the number2.
Yard:
a measurement of length (36 inches; 3 feet)3.
Pint:
a measurement of volume equal to half of a quart4.
Quart:
a measurement of volume (2 pints; 1/4 gallon)5.
Inch:
a measurement of length
REVIEW TEST
I. Select the correct answer:1. How many centimeters are in 7 inches?
(a) 17.5 cm (b) 177.8 cm (c) 17.78 cm
2. How many millimeters are in 2 inches?(a) 5.08 mm (b) 50.08 mm (c) 50.8 mm
3. How many meters are in 75 inches?(a) 190.50 m (b) 19.050 m (c) 1.9050 m
4. How many cm
2
are in 2 in.
2
?(a) 13 cm
2
(b) 12.90 cm
2
(c) 129.0 cm
2
5. How many mm
2
are in 16 in.
2
?(a) 10,320 mm
2
(b) 1032 mm
2
(c) 103.20 mm
2
21
SL3100_frame_C21 Page 305 Friday, August 31, 2001 10:27 AM

306
Six Sigma and Beyond: Problem Solving and Basic Mathematics, Volume II
6. Convert 17 cm
2
into mm
2
.(a) 109.65 mm
2
(b) 1700 mm
2
(c) 170 mm
2
7. How many m
2
are there in 235 in.
2
?(a) 1,515.75 m
2
(b) 15.1575 m
2
(c) .151575 m
2
8. How many cm
3
are in 12 in.
3
?(a) 1968 cm
3
(b) 196.8 cm
3
(c) 19.68 cm
3
9. How many m
3
are in 22 in.
3
?(a) 360.8 m
3
(b) .3608 m
3
(c) .0003608 m
3
10. A box has a volume of 252 in.
3
. How many dm
3
does the box contain?(a) 4.1328 dm
3
(b) 413.28 dm
3
(c) 4132.8 dm
3
II. Select the correct answer:11. How many meters are there in 3.5 yards?
(a) 3.2004 m (b) 32.004 m (c) 3.24 m
12. How many kilometers are in 859 yards?(a) 785.4696 km (b) .7854696 km (c) 7.854696 km
13. How many kilometers are in 21 yards?(a) .0192024 km (b) 192.024 km (c) 19.2024 km
14. How many square meters are in 13 square yards?(a) 13.836 m
2
(b) 10.868 m
2
(c) 18.68 m
2
15. Convert 11 square yards to square meters.(a) 9.196 m
2
(b) 11.836 m
2
(c) .9196 m
2
16. Convert 122 square yards to square kilometers.(a) 101.992 km
2
(b) 101,922 km
2
(c) .000101992 km
2
17. Convert 17 square yards to square decimeters.(a) 1421 dm
2
(b) 142.12 dm
2
(c) 14.212 dm
2
18. How many cubic meters are in 7 cubic yards?(a) 5.3515 m
3
(b) 53.515 m
3
(c) 7.7645 m
3
19. How many cm
3
are in .06 yd
3
?(a) .04587 cm
3
(b) 45,873 cm
3
(c) 4.587 cm
3
20. If a box has a height of 2 yards, a width of 3 yards, and a length of4 yards, how many cubic meters does it contain?(a) 18.3480 m
3
(b) 1834.8 m
3
(c) 24 m
3
SL3100_frame_C21 Page 306 Friday, August 31, 2001 10:27 AM

Conversion of English Units to Metric Units
307
III. Select the correct answer:21. How many liters are in 8 quarts of milk?
(a) 3.8463 L (b) 7.5704 L (c) .75704 L
22. How many liters are in 5 quarts?(a) 5.9643 L (b) 47.315 L (c) 4.7315 L
23. Convert 58 pints to liters.(a) 274.442 L (b) 27.4442 L (c) 27.5442 L
24. Convert 17 quarts to liters.(a) 8.04372 L (b) 16.0871 L (c) 16.871 L
25. Convert 15 pints to liters.(a) 7.0974 L (b) 70.974 L (c) .70974 L
Answers to the review test:
INCHES TO CENTIMETERS
Objective:
This section will demonstrate how to convert a measure expressed ininches to a measure expressed in centimeters.
To change from U.S. inches to centimeters, multiply the number of inches by2.54. A 12-in. ruler has a length of 30.48 cm because 12
×
2.54 = 30.48. Inchesmay also be changed to millimeters. To determine how many millimeters are in a12-in. ruler, remember that the ruler contained 30.48 cm and convert 30.48 to mm:a 12-in. ruler contains 304.8 mm.
Practice:
Refer to the examples and solve the problems.
1. How many centimeters are in 7 inches?(a) 17.5 cm (b) 177.8 cm (c) 17.78 cmAnswer: c (7
×
2.54 = 17.78 cm)
2. How many decimeters are in 14 inches?(a) 35.56 dm (b) 3.556 dm (c) 3556 dmAnswer: b (14
×
2.54 = 35.56, 35.56 cm = 3.556 dm)
I. 1. c 2. c 3. c 4. b 5. a6. b 7. c 8. b 9. c 10. a
II. 11. a 12. b 13. a 14. b 15. a16. c 17 a 18. a 19. b 20. a
III. 21. b 22. c 23. b 24. b 25. a
SL3100_frame_C21 Page 307 Friday, August 31, 2001 10:27 AM

308
Six Sigma and Beyond: Problem Solving and Basic Mathematics, Volume II
3. How many meters are in 18 feet (216 inches)?(a) 548.64 m (b) .54864 m (c) 5.4864 mAnswer: c (216
×
2.54 = 548.64, 548.64 cm = 5.4864 m)
If a unit of area is expressed in in.
2
, how can the unit be changed to cm
2
? Donot multiply by 2.54; instead multiply by 6.45 (2.54
×
2.54 = 6.45). A rectangle thatis 7 in. long and 4 in. wide has an area of 28 in.
2
. To determine out many cm
2
,multiply 28 by 6.45. This rectangle has an area of 180.60 cm
2
.To determine how many dm
2
are in a rectangle that measures 38 in.
2
, you wouldconvert your answer from cm
2
to dm
2
(180.60 cm
2
= 1.8060 dm
2
). Looking closelyat the conversion just made, notice the decimal point has been moved two placesinstead of just one. When using
squared
measurements, always move the decimalpoint two more places than when using measurements of length.
Examples:
25 cm
2
= .25 dm
2
25 cm
2
= .0025 m
2
25 cm
2
= .00025 dam
2
Practice:
Refer to the examples and solve the following problems.
1. How many cm
2
are there in 2 in.2?(a) 13 cm
2
(b) 12.90 cm
2
(c) 129.0 cm
2
Answer: b (6.45
×
2 = 12.90 cm
2
)
2. How many mm
2
are in 6 cm
2
?(a) 60 mm
2
(b) 600 mm
2
(c) .06 mm
2
Answer: b (6
×
100 = 600)
3. How many mm
2
are in 6 in.
2
?(a) 38.70 mm
2
(b) 387.0 mm
2
(c) 3870 mm
2
Answer: c (6.45
×
6 = 38.70, 38.70 cm
2
= 3870 mm
2
)
To change a unit of volume expressed in.
3
, multiply the number of in.
3
by 16.4.If a box has a volume of 8 in.
3
, the volume in cm
3
is 131.2 cm
3
: 8
×
16.4 = 131.2cm
3
(.06102
×
cm
3
= in.
3
)To determine the mm
3
in this same box, convert 131.2 cm
3
to mm
3
: 131.2 cm
3
= 131,200 mm
3
. When using
cubic
measurements, move the decimal point threemore places than when using measurements of length.
25 cm
3
= .025 dm
3
25 cm
3
= .000025 m
3
Practice:
Refer to the examples and solve the problems.
SL3100_frame_C21 Page 308 Friday, August 31, 2001 10:27 AM

Conversion of English Units to Metric Units
309
1. If a box has a volume of 72 in.
3, how many cm3 does it contain?(a) 1180.8 cm3 (b) 118.08 cm3 (c) 1188 cm3
Answer: a (72 × 16.4 = 1180.8 cm3)
2. How many mm3 are in 8 cm3?(a) 80 mm3 (b) 700 mm3 (c) 8000 mm3
Answer: c (8 × 1000 = 8000)
3. How many dm3 are in 12 in.3?(a) 196.8 dm3 (b) 1.968 dm3 (c) .1968 dm3
Answer: c (16.4 × 12 = 196.8, 196.8 cm3 = .1968 dm3)
EXERCISES
Directions: Select the correct answer. If necessary, restudy the instructions andexamples.
1. How many centimeters are in 17 inches?(a) 43.18 cm (b) 431.8 cm (c) 42.5 cm
2. How many millimeters are in 2 inches?(a) 5.08 mm (b) 50.08 mm (c) 50.8 mm
3. How many meters are in 48 inches?(a) 121.92 m (b) 1.2192 m (c) .12192 m
4. How many cm2 are in 14 in.2?(a) 90.30 cm2 (b) 903 cm2 (c) 9050 cm2
5. How many mm2 are in 16 in.2?(a) 103.20 mm2 (b) 1032 mm2 (c) 10,320 mm2
6. How many dm2 are in 4 in.2?(a) 25.80 dm2 (b) .2580 dm2 (c) 10.16 dm2
7. How many m3 are in 120 cm3?(a) 1968 m3 (b) 1.2 m3 (c) .00012 m3
8. How many cm3 are in 13 in.3?(a) 213.2 cm3 (b) 2.132 cm3 (c) 2132 cm3
9. How many m3 are in 22 in.3?(a) 360.8 m3 (b) .3608 m3 (c) .0003608 m3
10. How many dm3 are in a rectangular box with a length of 12 in., a widthof 2 in., and a height of 3 in.?(a) 72 dm3 (b) 1180.8 dm3 (c) 1.1808 dm3
SL3100_frame_C21 Page 309 Friday, August 31, 2001 10:27 AM

310 Six Sigma and Beyond: Problem Solving and Basic Mathematics, Volume II
Answers to the exercises:
YARDS TO METERS
Objective: This section will introduce the method used to change measurementsexpressed in yards to measurements expressed in meters.
The method used to change a measurement from yards to meters is similar tothat used to change from inches to centimeters. The only difference is that multi-plication is by different numbers.
When changing a measurement of length expressed in yards to a measurementexpressed in meters, multiply the number of yards by .9144. If an object is 3 yardslong, it is 2.7432 meters long because 3 × .9144 = 2.7432. Yards can also be changedto other metric units, such as decimeters. If an object is 3 yards long, it is 27.432decimeters long because 2.7432 meters = 27.432 decimeters.
Practice: Refer to the examples and solve the problems.
1. How many meters are in 3.5 yards?(a) 3.2004 m (b) 32.004 m (c) 3.24 mAnswer: a (3.5 × .9144 = 3.2004 m)
2. Convert 6 yards to decimeters.(a) 6.9114 dm (b) 5.4864 dm (c) 54.864 dmAnswer: c (6 × .9114 = 5.4864, 5.4864 m = 54.864 dm)
3. How many kilometers are in 800 yards?(a) 731.52 km (b) .73152 km (c) .073152 kmAnswer: b (800 × .9144 = 731.52, 731.52 m = .73152 km)
To change a unit of area expressed in square yards to one expressed in squaremeters, multiply the number of square yards by .863. For example, 17 square yards= 14.212 square meters because 17 × .836 = 14.212 m2. To determine squaredecimeters, convert 14.212 m2 to 1421.2 dm2.
Remember: Move the decimal point two extra places.
Practice: Refer to the examples and answer the problems.
1. How many m2 in 13 square yards?(a) 13.836 m2 (b) 10.868 m2 (c) 18.38 m2
Answer: b (13 × .836 = 10.868 m2)
1. a 2. c 3. b 4. a 5. c6. b 7. c 8. a 9. c 10. c
SL3100_frame_C21 Page 310 Friday, August 31, 2001 10:27 AM

Conversion of English Units to Metric Units 311
2. How many km2 in 725 square yards?(a) .0006061 km2 (b) 60.61 km2 (c) 725.836 km2
Answer: a (725 × .836 = 606.1 m2 = .0006061 km2)
3. Convert 2 square yards to cm2.(a) 1.672 cm2 (b) 167.2 cm2 (c) 16,720 cm2
Answer: c (2 × .836 = 1.672, 1672 m2 = 16,720 cm2)
To change a unit of volume from cubic yards to cubic meters, multiply the numberof cubic yards by .7645: 24 cubic yards equals 18.348 cubic meters because .7645× 24 = 18.348 m2. To change to a different unit, such as cubic centimeters, movethe decimal point the necessary number of places: 24 yd3 equals 18,348,000 cm3.
Remember: Move the decimal point three extra places.
Practice: Refer to the examples and answer the problems.
1. How many m3 are in 12 cubic yards?(a) 9.174 m3 (b) 91.74 m3 (c) 12.7645 m3
Answer: a (.7645 × 12 = 9.174 m3)
2. Convert 117 cubic yards to km3.(a) 89.4465 km3 (b) .894465 km3 (c) .0000000894465 km3
Answer: c (117 × .7645 = 89.4465, 89.4465 m3 = .0000000894465 km3)
3. How many dm3 are in 3 cubic yards?(a) 2.2935 dm3 (b) 2,293.5 dm3 (c) 22.935 dm3
Answer: b (.7645 × 3 = 2.2935, 2.2935 m3 = 2,293.5 dm3)
EXERCISES
Directions: Select the correct answer. If necessary restudy the instructions andexamples.
1. How many meters are in 7 yards?(a) 7.9144 m (b) 6.4008 m (c) 64.008 m
2. How many kilometers are in 859 yards?(a) 785.4696 km (b) .7854696 km (c) 7.854696 km
3. How many decimeters are in 4 yards?(a) 36.576 dm (b) 4.9144 dm (c) 3.6576 dm
4. Convert 11 yd2 into m2.(a) 9.196 m2 (b) 11.836 m2 (c) .9196 m2
SL3100_frame_C21 Page 311 Friday, August 31, 2001 10:27 AM

312 Six Sigma and Beyond: Problem Solving and Basic Mathematics, Volume II
5. Convert 17 yd2 into dm2.(a) 14.212 dm2 (b) 142.12 dm2 (c) 1,421.2 dm2
6. How many km2 are in 5,721 square yards?(a) 4782.756 km2 (b) 4.782756 km2 (c) .004782756 km2
7. How many m3 are in 8 cubic yards?(a) 6.116 m3 (b) 8.7645 m3 (c) 61.16 m3
8. How many dm3 are in .7 cubic yards?(a) .53515 dm3 (b) 5.3515 dm3 (c) 535.15 dm3
9. How many m3 are in .06 cubic yards?(a) .04587 m3 (b) 45,870 m3 (c) 4.587 m3
10. If a box is 9 yards long, 3 yards wide, and 2 yards high, how many dm3
does it contain?(a) 54 dm3 (b) 41.283 dm3 (c) 41,283 dm3
Answers to the exercises:
QUARTS TO LITERS AND PINTS TO LITERS
Objective: This section will introduce the method to change U.S. liquid quarts toliters and U.S. liquid pints to liters.
To change a measurement of liquid expressed in quarts to a measurementexpressed in liters, multiply the number of quarts by .9463: 3 quarts of water is2.8389 liters of water because .9463 × 3 = 2.8389.
Practice: Refer to the examples and solve the problems.
1. How many liters are in 2 quarts of milk?(a) 2.9463 L (b) 1.8926 L (c) 18.926 LAnswer: b (2 × .9463 = 1.8926 L)
2. How many liters are in 8 quarts of water?(a) 8.9463 L (b) 7.5704 L (c) .75704 LAnswer: b (8 × .9463 = 7.5704 L)
3. Convert 4 pints to liters.(a) 1.89264 L (b) 4.47316 L (c) 18.9264 LAnswer: a (4 × .47316 = 1.89264 L)
1. b 2. b 3. a 4. a 5. c6. c 7. a 8. c 9. a 10. c
SL3100_frame_C21 Page 312 Friday, August 31, 2001 10:27 AM

Conversion of English Units to Metric Units 313
4. Convert 15 pints to liters.(a) .70974 L (b) 70.974 L (c) 7.0974 LAnswer: c (15 × .47316 = 7.0974 L)
EXERCISES
Directions: Solve the problems.
I. Select the correct answer:1. Convert 17 inches into centimeters.
(a) 43.18 cm (b) 20.32 cm (c) 4.318 cm
2. How many millimeters are in 12 inches?(a) 30.48 mm (b) 304.8 mm (c) 3048 mm
3. How many meters are in 78 inches?(a) 1.9812 m (b) 198.12 m (c) 89.54 m
4. How many cm2 are in 45 in.2?(a) 290.25 cm2 (b) 2902.5 cm2 (c) 29.25 cm2
5. How many m2 are in 300 in.2?(a) .1935 m2 (b) 193.5 m2 (c) 1935 m2
6. Convert 17 square inches to square decimeters.(a) 109.65 dm2 (b) 10.965 dm2 (c) 1.0965 dm2
7. Convert 12 in.3 to cm3.(a) 196.8 cm3 (b) 1968 cm3 (c) 19.68 cm3
8. How many dm3 are in 19 in3?(a) 311.6 dm3 (b) 31.16 dm3 (c) .3116 dm3
9. Convert 712 in.3 to m3.(a) 116.768 m3 (b) 11,676.8 m3 (c) .0116768 m3
10. If a box has a height of 5 inches, a width of 2 inches, and a lengthof 4 inches, what is the volume in cubic decimeters?(a) .0656 dm3 (b) .656 dm3 (c) 6.56 dm3
II. Select the correct answer:11. How many meters are in 3 yards?
(a) 2.7432 m (b) 27.432 m (c) 3.9144 m
12. Convert 21 yd to km.(a) .0192024 km (b) 19.2024 km (c) 1.92024 km
SL3100_frame_C21 Page 313 Friday, August 31, 2001 10:27 AM

314 Six Sigma and Beyond: Problem Solving and Basic Mathematics, Volume II
13. Convert 30 yd to dm.(a) 2.7432 dm (b) 273.42 dm (c) 27.432 dm
14. How many m2 are in 5 yd2?(a) 41.8 m2 (b) 5.836 m2 (c) 4.18 m2
15. Convert 12 yd2 to dm2.(a) 10.032 dm2 (b) 100.32 dm2 (c) 1,003.2 dm2
16. Convert 700 yd2 to km2.(a) .0005852 km2 (b) .5852 km2 (c) 585.2 km2
17. Convert 5 yd3 to m3.(a) 3.8225 m3 (b) 5.7645 m3 (c) 38.225 m3
18. Convert .06 yd3 to dm3.(a) .04587 dm3 (b) 45,870 dm3 (c) 45.87 dm3
19. Convert 1,776 yd3 to km3.(a) 1.357742 km3 (b) .000001357752 km3 (c) 1357.752 km3
20. A box has a height of 5 yards, a width of 4 yards, and a length of 6yards. What is the volume of this box in cubic meters?(a) 120 m3 (b) 91.74 m3 (c) 917.4 m3
III. Select the correct answer:21. How many liters are in 5 quarts?
(a) 4.718 L (b) 2.3658 L (c) 4.7315 L
22. How many liters are in 7 pints?(a) 6.6241 L (b) 3.31212 L (c) 33.1212 L
23. Convert 12 pints to liters.(a) 5.67792 L (b) 11.3556 L (c) 56.7792 L
24. Convert 13 quarts to liters.(a) 61.5108 L (b) 12.319 L (c) 12.3019 L
25. Convert 2 pints to liters.(a) 9.4632 L (b) .94632 L (c) 1.8926 L
26. How many feet are in 15 decimeters?(a) 4.9212 ft (b) 16.404 ft (c) 1.6404 ft
27. Convert 1.3 meters into inches.(a) 1.42168 in (b) 4.26504 in. (c) 51.1810 in.
SL3100_frame_C21 Page 314 Friday, August 31, 2001 10:27 AM

Conversion of English Units to Metric Units 315
28. Convert 55 hm into ft.(a) 6014.8 ft (b) 60.148 ft (c) 18045.5 ft
29. How many yards are in 17 meters?(a) 1.85912 yd (b) 18.5912 yd (c) 15.5448 yd
30. Convert 27 cm to in.(a) 10.62900 in. (b) .295272 in. (c) 29.5272 in.
31. How many yd2 are in 200 dam2?(a) 23,920 yd2 (b) 71,760 yd2 (c) 717.6 yd2
32. How many in.2 are in 2 m2?(a) 2.392 in.2 (b) 86.112 in.2 (c) 3100.032 in.2
33. How many yd2 are in 3 hm2?(a) 35,880 yd2 (b) 358.8 yd2 (c) .0003588 yd2
34. Convert 12 square meters into square yards.(a) 14.352 yd2 (b) 143.52 yd2 (c) 1.4352 yd2
35. Convert 12 dam2 into ft2.(a) 12,916.8 ft2 (b) 129.168 ft2 (c) 1.29268 ft2
36. Change 5 cubic meters to cubic inches.(a) 176.5 in.3 (b) 2118 in.3 (c) 305,121 in.3
37. Convert 17 cubic decimeters to cubic feet.(a) 60.01 ft3 (b) 6001 ft3 (c) .6004 ft3
38. Convert 1 m3 to in.3.(a) 35.3 in.3 (b) 423.6 in.3 (c) 61024.32 in.3
39. How many in.3 are in 25 dm3?(a) 88.25 in.3 (b) 1059 in.3 (c) 1525.5 in.3
40. Convert 12 cubic decameters to cubic feet.(a) 423,780 ft3 (b) 423.6 ft3 (c) 42.36 ft3
41. Convert 12 liters to pints.(a) 12.6804 pt (b) 24 pt (c) 25.3608 pt
42. Convert 20 liters to quarts.(a) 2.134 qt (b) 21.134 qt (c) 211.34 qt
43. How many gallons are in 28 liters?(a) 29.5876 gal (b) 7 gal (c) 7.3976 gal
SL3100_frame_C21 Page 315 Friday, August 31, 2001 10:27 AM

316 Six Sigma and Beyond: Problem Solving and Basic Mathematics, Volume II
44. How many gallons are in 8 liters?(a) 8.4536 gal (b) 2.1136 gal (c) 2 gal
45. How many pints are in 5 liters?(a) 5.2835 pt (b) 10 pt (c) 10.567 pt
Answers to the exercises:
METRIC UNITS OF LENGTH TO U.S. UNITS
Objective: This section introduces the method of changing from a metric unit oflength to a U.S. unit of length.
It will be helpful to remember:
36 in. = 1 yd3 ft = 1 yd
1760 yd = 1 mi
Also, keep in mind the metric units of length. To change a measurement from metersto U.S. yards, multiply the number of meters by 1.0936, e.g., 7 meters = 7.6552yards because 7 × 1.0936 = 7.6552.
Example: To determine how many feet are in 7 meters, multiply the number ofyards by 3 because there are 3 feet in a yard. Therefore, 7 meters = 22.9656 feet(7.6552 × 3 = 22.9656).
Example: To determine many inches are in 7 meters, multiply the number of yardsby 36 because there are 36 inches in a yard. There are 275.5872 inches in 7 meters(7.6552 × 36 = 275.5872).
Example: To change 215 km to miles, first, change 215 km to 215,000 meters:215,000 × 1.0936 = 235,124 yards. Divide 235,124 by 1760 to determine the numberof miles: 1760 yards equals 1 mile (235.24 ÷ 1760 = 133.59318 miles).
I. 1. a 2. b 3. a 4. a 5. a6. c 7. a 8. c 9. c 10. b
II. 11. a 12. a 13. b 14. c 15. c16. a 17. a 18. c 19. b 20. b
III. 21. c 22. b 23. a 24. c 25. b26. a 27. c 28. c 29. b 30. a31. a 32. c 33. a 34. a 35. a36. c 37. c 38. c 39. c 40. a41. c 42. b 43. c 44. b 45. c
SL3100_frame_C21 Page 316 Friday, August 31, 2001 10:27 AM

Conversion of English Units to Metric Units 317
Example: To change 17 cm to inches, first, change 17 cm to .17 m: 17 × 1.0936 =.185912 yards; .185912 × 36 = 6.692832 in.
Practice: Refer to the examples and solve the problems.
1. How many yards are in 12 meters?(a) 13.0936 yd (b) 13.1232 yd (c) 12.1232 ydAnswer: b (12 × 1.0936 = 13.1232 yd)
2. How many feet are in 15 decimeters?(a) 4.9212 ft (b) 16.404 ft (c) 1.6404 ftAnswer: a (15 dm = 1.5 m, 1.5 × 1.0936 = 1.6404 yards, 1.6404 × 3 =4.9212 ft)
3. How many miles are in 14 kilometers?(a) 15,310.4 mi (b) 8.6990909 mi (c) 26,946,304 miAnswer: b (14 km = 14,000 m, 14,000 × 1.0936 = 15,310.4 m, 15,310.4÷ 1760 = 8.6990909 mi)
METRIC UNITS OF AREA TO U.S. UNITS
Objective: This section demonstrates how to change from a metric unit of area to aU.S. unit of area. The following facts will be helpful.
1296 square inches = 1 square yard9 square feet = 1 square yard
3,097,600 square yards = 1 square mile
These numbers are different from the ones given at the beginning of this section.One square yard is the area of a square with all sides measuring one yard: 1 yard= 36 inches. One square yard is the area of a square with all sides measuring 36 in.To find the area of a square, multiply the measure of one side by itself. The area ofthe square is 36 in. × 36 in. = 1296 in.2. The area of this same square is equal toone square yard. Therefore, 1 square yard must equal 1296 square inches.
By a similar method, other equivalents may be obtained. Become familiar withthe following:
Unit Abbreviation Square Meters
Square kilometer km2 1,000,000 square metersSquare hectometer hm2 10,000 square metersSquare decameter dam2 100 square metersSquare meter m2 1 square meterSquare decimeter dm2 1/100 square meterSquare centimeter cm2 1/10,000 square metersSquare millimeters mm2 1/1,000,000 square meters
SL3100_frame_C21 Page 317 Friday, August 31, 2001 10:27 AM

318 Six Sigma and Beyond: Problem Solving and Basic Mathematics, Volume II
Most of the information in the matrix should be familiar; however, some of the termsare new.
To change square meters (m2) to U.S. yards, simply multiply the number ofsquare meters by 1.196. If something, has an area of 5 m2 and the number of squareyards is needed, multiply 5 × 1.196: 5 × 1.196 = 5.98. There are 5.98 square yardsin 5 square meters.
Example: To change 7 m2 to square feet, first, convert square meters to square yards:7 × 1.196 = 8.372. There are 8.372 square yards in 7 square meters. Now determinesquare feet. Do this by multiplying the number of square yards by 9: 8.372 × 9 =75.348. There are 75.348 square feet in 7 m2.
Now change from 12 square decimeters to square yards. First, change square deci-meters to square meters:.
1. 12 dm2 = .12 m2. Now, it is simply a process of changing .12 m2 to squareyards.
2. 12 × 1.196 = .14352. There are .14352 square yards in 12 squaredecimeters.
Example: How can 5 km2 be changed to mi2? First, express 5 km2 in m2: 5 km2 =5.000.000 m2. Then multiply the number of m2 by 1.196: 5,000,000 × 1.196 =5,980,000. The answer is now in square yards. To determine the number of squaremiles, divide this answer by 3,097,600: 3,980,000 ÷ 3,097,600 = 1.9305263. Thereare 1.9305268 mi2 in 5 km2.
Practice: Refer to the examples and tables and solve the problems.
1. Change 17 hm2 to yd2.(a) .00203320 yd2 (b) 20.3320 yd2 (c) 203,320 yd2
Answer: c (17 hm2 = 170,000 m2; 170,000 × 1.196 = 203,320 yd2)
2. Change 7 square centimeters to square inches.(a) .0008372 in.2 (b) 1.0850112 in.2 (c) 10,850.112 in.2
Answer: b (7 cm2 = .0007 m2, .0007 × 1.196 = 0008372 yd2, .0008372 ×1296 = 1.0850112 in.2)
3. How many ft2 are in 200 dam2?(a) 23,920 ft2 (b) 215,280 ft2 (c) 717.6 ft2
Answer: b (200 dam2 = 20,000 m2, 20,000 × 1.196 = 23,920 yd2, 23,920× 9 = 215,280 ft2)
Additional helpful information is
1728 cubic inches = 1 cubic foot46656 cubic inches = 1 cubic yard
27 cubic feet = 1 cubic yard
SL3100_frame_C21 Page 318 Friday, August 31, 2001 10:27 AM

Conversion of English Units to Metric Units 319
and
EXERCISES
Directions: Select the correct answer. If necessary, restudy the instructions andexamples.
1. Convert 16 meters to yards.(a) 14.6304 yd (b) 17.4976 yd (c) 16.4976 yd
2. How many feet are in 22 meters?(a) 24.0592 ft (b) 721.776 ft (c) 72.1776 ft
3. Convert 1.3 meters to inches.(a) 1.42168 in. (b) 4.26504 in. (c) 51.18048 in.
4. Convert 25 dm into ft.(a) 2.734 ft (b) 82.02 ft (c) 8.202 ft
5. Convert 7 km into yd.(a) 7655.2 yd (b) 765.52 yd (c) 76.552 yd
6. How many ft are in 700 cm?(a) 7.6552 ft (b) 22.9656 ft (c) 229.656 ft
7. Convert 55 hm into ft.(a) 6014.8 ft (b) 60.148 ft (c) 18,044.4 ft
8. How many miles are in 3000 meters?(a) 3280.8 mi (b) 1.8640909 mi (c) 1.5586363 mi
9. How many miles are there in 75 kilometers?(a) 46.602272 mi (b) 82.019998 mi (c) 466.02272 mi
10. Convert 23 mm to in.(a) .9055008 in. (b) .7571232 in. (c) .0160272 in.
Unit Abbreviation Cubic Meters
Cubic kilometer km3 1,000,000,000Cubic hectometer hm3 100,000Cubic decameter dam3 1000Cubic meter m3 1Cubic decimeter dm3 1/1000Cubic centimeter cm3 1/1,000,000Cubic millimeter mm3 1/1,000,000,000
SL3100_frame_C21 Page 319 Friday, August 31, 2001 10:27 AM

320 Six Sigma and Beyond: Problem Solving and Basic Mathematics, Volume II
11. Convert 17 m2 to yd2.(a) 14.212 yd2 (b) 20.332 yd2 (c) 23.32 yd2
12. Convert 2.3 dam2 to yd2.(a) .027508 yd2 (b) 2.7508 yd2 (c) 275.08 yd2
13. How many in.2 are in 2 m2?(a) 2.392 in.2 (b) 86.112 in.2 (c) 3,100.032 in.2
14. Convert 17 dm2 to ft2.(a) 6099.6 ft2 (b) 18,298.8 ft2 (c) 1.82988 ft2
15. Convert 300 mm2 to in.2.(a) .4650048 in.2 (b) 4.650048 in.2 (c) 465.0043 in.2
16. How many mi2 are in 25 km2?(a) 16,988.636 mi2 (b) 9.6526342 mi2 (c) .00962526 mi2
17. How many yd2 are in 3 hm2?(a) 35,880 yd2 (b) 358.8 yd2 (c) .0003588 yd2
18. How many in.2 are in 35 cm2?(a) .150696 in.2 (b) 5.425056 in.2 (c) .004186 in.2
19. Convert 11 m2 to ft2.(a) 13.156 ft2 (b) 39.468 ft2 (c) 118.404 ft2
20. Convert 500 km2 to mi2.(a) 19.305268 mi2 (b) 193.05268 mi2 (c) 598 mi2
Answers to the exercises:
METRIC UNITS OF VOLUMETO U.S. UNITS
Objective: This section demonstrates changing from a metric unit of volume to aU.S. unit of volume.
Remember: the facts from the last two sections.
1. b 2. c 3. c 4. c 5. a6. b 7. c 8. b 9. a 10. a
11. b 12. c 13. a 14. c 15. a16. b 17. a 18. b 19. c 20. b
SL3100_frame_C21 Page 320 Friday, August 31, 2001 10:27 AM

Conversion of English Units to Metric Units 321
To change a measurement of 7 cubic meters to cubic feet, multiply the numberof cubic meters by 35.3157: 7 cubic meters = 247.2 cubic feet because 7 × 35.316= 247.2 cubic feet.
To change 16 cubic meters to cubic yards, first find the number of feet: 16 ×35.315 = 565.04. There are 565.04 feet in 16 cubic meters. Now convert 565.04 feetto cubic yards by dividing the number of cubic feet by 27: 565.04 ÷ 27 = 20.9274.There are 20.9274 cubic yards in 16 cubic meters.
Example: To change 4 cubic meters to cubic inches, use a similar method. First,determine the number of cubic feet: 4 × 35.315 = 141.26 cubic feet. Then change141.26 cubic feet to cubic inches by multiplying the number of cubic feet by 1728:141.26 × 1728 = 244,097.28 cubic inches.
Example: To change 2 cubic decameters to cubic yards, first change cubic decame-ters into cubic meters: 2 dam3 = 2000 m3. Next change 2000 m3 into cubic feet:2000 × 35.315 = 70,630 ft3. Finally, convert 70,630 ft3 to cubic yards: 70,630 ÷ 27= 2615.926 yd3.
Practice: Refer to the examples and solve the problems.
1. Change 5 cubic meters to cubic inches.(a) 176.5 in.3 (b) 2,118 in.3 (c) 305121.6 in.3
Answer: c (5 m3 × 35.315 = 176.575 ft3, 176.575 × 1728 = 305121.6 in.3)
2. Change 12 cubic decimeters to cubic feet.(a) .42378 ft3 (b) 423.6 ft3 (c) 4236 ft3
Answer: a (12 dm3 = .012 m3, .012 × 35.315 = .42378 ft3)
3. Change 573 cm3 to cubic inches.(a) 34.966935 in.3 (b) .0202269 in.3 (c) 349.520832 in.3
Answer: a (573 cm3 = .000573 m3, 000573 × 35.315 = .0202354 ft3,.0202354 × 1728 = 34.966935 in.3)
Sometimes it is necessary to change from a metric unit of volume to U.S. unitof liquid volume. To make the conversion, the following information is needed.
1 quart = 2 pints4 quarts = 1 gallon
To change from metric liters to U.S. liquid quarts, multiply the number of litersby 1.0567. To change 17 liters to quarts, multiply 17 by 1.0567. There are 17.9639quarts in 17 liters.
Example: To change 23 liters to pints, first determine how many quarts are in 23liters: 23 × 1.0567 = 24.3041 quarts. Then multiply the number of quarts by 2 toget the number of pints: 24.3041 × 2 = 48.6082. There are 48.6082 pints in 23 liters.
SL3100_frame_C21 Page 321 Friday, August 31, 2001 10:27 AM

322 Six Sigma and Beyond: Problem Solving and Basic Mathematics, Volume II
To change 36 liters to gallons, first determine the number of quarts: 36 × 1.0567= 38.0412. To convert quarts to gallons, divide by 4: 38.0412 ÷ 4 = 9.5103. Thereare 9.5103 gallons in 36 liters.
Practice: Refer to the examples and solve the problems.
1. How many quarts are in 7 liters?(a) 7.3969 qt (b) 8.372 qt (c) 73.969 qtAnswer: a (7 × 1.0567 = 7.3969 qt)
2. How many gallons are in 16 liters?(a) 4 gal (b) 16.9072 gal (c) 4.2268 galAnswer: c (16 × 1.0567 = 16.9072, 16.9072 ÷ 4 = 4.2268 gal)
3. Convert 12 liters to pints.(a) 12.6804 pt (b) 24 pt (c) 25.3608 ptAnswer: c (12 × 1.0567 = 12.6804, 12.6804 × 2 = 25.3608 pt)
EXERCISES
Directions: Select the correct answer. If necessary, restudy the instructions andexamples.
1. Convert 1 cubic decameter to cubic feet.(a) 35.3 ft3 (b) 35,315 ft3 (c) 3.53 ft3
2. Convert 1 cubic meter to cubic inches.(a) 35.3 in.3 (b) 423.6 in.3 (c) 61,024.32 in.3
3. Change 31 cubic decimeter to cubic yards.(a) .40529629 yd3 (b) 109.43 yd3 (c) 405.29629 yd3
4. How many cubic yards are in 3 cubic meters?(a) 3.92222 yd3 (b) 3.9444 yd3 (c) 11.8333 yd3
5. How many cubic feet are in 17 cubic decimeters?(a) .6001 ft3 (b) 6001 ft3 (c) 600.1 ft3
6. Convert 20 liters to quarts.(a) 2.134 qt (b) 21.1340 qt (c) 211.34 qt
7. Convert 19 liters to pints.(a) 20.0773 pt (b) 40.1546 pt (c) 38 pt
8. Convert 24 liters to gallons.(a) 6 gal (b) 6.3402 gal (c) 25.3608 gal
SL3100_frame_C21 Page 322 Friday, August 31, 2001 10:27 AM

Conversion of English Units to Metric Units 323
9. How many gallons are in 28 liters?(a) 29.5876 gal (b) 7 gal (c) 7.3969 gal
10. How many pints are in 3 liters?(a) 6 pt (b) 3.1701 pt (c) 6.3402 pt
Answers to the exercises:
CUMULATIVE EXERCISES FOR LENGTH, AREA,AND VOLUME
Directions: Select the correct answer. If necessary, restudy the instructions andexamples.
I. Select the correct answer:1. How many feet are in 4 decimeters?
(a) 1.31232 ft (b) .43744 ft (c) 13.1232 ft
2. How many in. are in 11 cm?(a) 433.0656 in. (b) .120296 in. (c) 4.3307 in.
3. Convert 12 dam to yd.(a) 13.1232 yd (b) 131.232 yd (c) 1.31232 yd
4. How many yards are in 1 mile?(a) 1760 yd (b) 1296 yd (c) 1728 yd
5. Convert 17 dm to in.(a) 66.929 in. (b) 1.85912 in. (c) 669.2832 in.
II. Select the correct answer:6. How many square yards are in 1 square mile?
(a) 1760 yd2 (b) 3,097,600 yd2 (c) 1296 yd2
7. How many yd2 are in 1 dam2?(a) 1.196 yd2 (b) 11.96 yd2 (c) 119.6 yd2
8. How many ft2 are in 1 m2?(a) 1.196 ft2 (b) 3.588 ft2 (c) 10.764 ft2
9. How many in.2 are in 1 dm2?(a) 4.3056 in.2 (b) 15.50016 in.2 (c) 430.56 in.2
1. b 2. c 3. a 4. a 5. a6. b 7. b 8. b 9. c 10. c
SL3100_frame_C21 Page 323 Friday, August 31, 2001 10:27 AM

324 Six Sigma and Beyond: Problem Solving and Basic Mathematics, Volume II
10. Convert 1.2 hm2 to yd2.(a) 14,352 yd2 (b) 1.4352 yd2 (c) 143.52 yd2
III. Select the correct answer:11. Convert 1 cm3 to m3.
(a) 1/1,000,000 m3 (b) 1,000,000 m3 (c) 1000 m3
12. Change 5 dm3 to in.3.(a) 17.65 in.3 (b) 2,541.6 in.3 (c) 305.122 in.3
13. Change 17 dm3 to ft3.(a) 6.001 ft3 (b) .600355 ft3 (c) 600355 ft3
14. Convert 12 dam3 to yd3.(a) 4236 yd3 (b) 470.666 yd3 (c) 15696 yd3
15. How many in.3 are in 1.5 m3?(a) 52.95 in.3 (b) 91,536.48 in.3 (c) 635.4 in.3
IV. Select the correct answer,16. How many pints are in 3 liters?
(a) 6.3402 pt (b) 3.1701 pt (c) 6 pt
17. How many gallons are in 32 liters?(a) 8 gal (b) 33.8144 gal (c) 8.4536 gal
18. How many quarts are in 7 liters?(a) 7.2969 qt (b) 7.3969 qt (c) 7.4169 qt
19. How many gallons are in 56 liters?(a) 14.7938 gal (b) 14 gal (c) 4.2268 gal
20. Convert 17 liters to pints.(a) 34 pt (b) 17.9639 pt (c) 35.9278 pt
Answers to the cumulative exercises:
I. 1. a 2 c 3. b 4. a 5. a
II. 6. b 7. c 8. c 9. b 10. a
III. 11. a 12. c 13. b 14. c 15. b
IV. 16. a 17. c 18. b 19. a 20. c
SL3100_frame_C21 Page 324 Friday, August 31, 2001 10:27 AM

Part III
Appendices
SL3100_frame_APPX Page 325 Friday, August 31, 2001 10:27 AM

SL3100_frame_APPX Page 326 Friday, August 31, 2001 10:27 AM

327
Appendix A:A Typical Cover Sheet for the GPS Process
A cover sheet summarizes the individual steps of the GPS process. There are manyvariations and no particular cover sheet is better than any other. The goal of thecover sheet is to present information in a structured way. Obviously, detailed back-up information of the work should be kept for future reference.
Identification number: Department:
Target date: Completion date:
GPS0.
Describe the situation and the emergency response action:
GPS1.
Team:
GPS2.
Describe the problem:
GPS3.
Develop the interim containment action:
GPS4.
Define and verify root cause and escape point:
GPS5.
Choose and verify permanent corrective action (root cause/escape point):
GPS6.
Implement and validate permanent corrective actions:
GPS7.
Prevent recurrence:
GPS8.
Recognize team:
SL3100_frame_APPX Page 327 Friday, August 31, 2001 10:27 AM

SL3100_frame_APPX Page 328 Friday, August 31, 2001 10:27 AM

329
Appendix B: GPSO.Preparation for Emergency Response Actions (ERA): Assessment Questions
Typical questions are
• Are ERAs necessary?• Is a service action required as part of the emergency response?• How was the ERA verified?• How was the ERA validated?
GPS application criteria:
How well does the proposed GPS meet the applicationcriteria?
• Is there a definition of the symptom(s)? Has the symptom been quantified?• Have the GPS customer(s) who experienced the symptom(s) and the
affected parties (when appropriate) been identified?• Have measurements which were taken to quantify the symptom(s) dem-
onstrated that a performance gap exists and/or has the priority (severity,urgency, growth) of the symptom warranted initiation of the process?
• Is the cause unknown?• Is management committed to dedicating the necessary resources to
fix
theproblem at the root cause level and to prevent recurrence?
• Does the symptom complexity exceed the ability of one person to resolvethe problem?
Other:
Will the new GPS duplicate an existing GPS?
Common Tasks:
• Have all changes been documented (e.g., FMEA, control plan, processflow)?
SL3100_frame_APPX Page 329 Friday, August 31, 2001 10:27 AM

330
Six Sigma and Beyond: Problem Solving and Basic Mathematics, Volume II
• Is the team composed of the appropriate members to proceed to the nextstep?
• Have the measurable(s) been reviewed?• Has it been determined if a service action is required?
The essence of GPS0 is to be sure an investigation is needed and, if so, todetermine the extent of the investigation.
SL3100_frame_APPX Page 330 Friday, August 31, 2001 10:27 AM

331
Appendix C: GPS1.Establish the Team/Process Flow: Assessment Questions
Warm up:
• When and where will the team meet?• What has been done to make the meeting room user-friendly?• What has been done to encourage team members to build relationships
with each other?• What has been done to encourage team members to focus on the team’s
activity?• Has the purpose of the meeting been stated?• Has the team received the agenda for the meeting?
Membership:
Are people affected by the problem represented?
• How is the GPS customer’s viewpoint represented?• Does each person have a reason to be on the team?• Is the team large enough to include all necessary input, but small enough
to act effectively?• Does team membership reflect the problem’s current status?• Do team members agree on membership?
Product/process knowledge:
What special skills or experience does the team requireto function effectively?
Operating procedures and working relationships:
Have team goals and membershiproles been clarified?
• Does the team have sufficient decision-making authority to accomplishits goals?
• How will information from the team be communicated internally andexternally?
• Do all members agree with and understand the team’s goals?
SL3100_frame_APPX Page 331 Friday, August 31, 2001 10:27 AM

332
Six Sigma and Beyond: Problem Solving and Basic Mathematics, Volume II
Roles:
• Has the designated champion of the team been identified?• Has the team leader been identified?• Are team members’ roles and responsibilities clear?• Is a facilitator needed to coach the process and manage team consensus?
Common tasks:
Have all changes been documented (e.g., FMEA, control plan,process flow)?
• Is the team composed of the appropriate members to proceed to the nextstep?
• Have the measurable(s) been reviewed?• Has the team determined if a service action is required?
The essence of GPS1 is to define the team. Specifically, the team must be cross-functional and multidisciplinary and the appropriate roles must be assigned foroptimum results.
SL3100_frame_APPX Page 332 Friday, August 31, 2001 10:27 AM

333
Appendix D: GPS2.Describe the Problem: Assessment Questions
Symptom:
Can the symptom be subdivided?
Problem statement:
• Has a specific problem statement been defined (object and defect)?• Have “repeated whys” been used?• What iswrong with what?• Is it known for certain why the problem is
occurring?
Problem description:
• Has “Is/Is Not analysis” been performed (what, where, when, how big)?• When has this problem appeared before?• Where in the process does this problem first appear?• What, if any, pattern(s) is (are) there for this problem?• Are similar components and/or parts showing the same problem?• Has the current process flow been identified? Does this process flow
represent a change?• Have all required data been collected and analyzed?• How does the ERA affect the data?• Is there enough information to evaluate for potential root cause?• Is there physical evidence of the problem?• Has a cause-and-effect diagram been completed?
Type of problem:
Does this problem describe a “something-changed” or a “never-been-there” situation?
Review of problem description:
• Has the problem description been reviewed for completeness with theGPS customer and affected parties? (Has concurrence been obtained fromthe GPS customer and the affected parties?)
SL3100_frame_APPX Page 333 Friday, August 31, 2001 10:27 AM

334
Six Sigma and Beyond: Problem Solving and Basic Mathematics, Volume II
• Should this problem be reviewed with executive management?• Should financial reserves be set aside?• Should any moral, social, or legal obligations related to this problem be
considered?
Common tasks:
• Have all changes been documented (e.g., FMEA, control plan, processflow)?
• Does the team have the appropriate members to proceed to the next step?• Have the measurable(s) been reviewed?• Has the team determined if a service action is required?
The essence of GPS2 is to force the team to come up with the “real” problem.The real problem must be unambiguous, valid, objective, measurable, repeatable,and verifiable. To focus on this definition, the following discussion may be of help.
Problem description
— To develop the correct problem statement:
Ask:
“What is wrong with what?”
Ask next:
“Is it known why this is happening?”
If the answer is “no,” the answer to “What is wrong with what?” is the problemstatement. If the answer is “yes,” repeat the question, “What’s wrong with what?”until reaching the statement where the cause is unknown. To develop the problemdescription, apply the Is/Is Not method using the following questions:
Is Is Not
What
• Name the object having trouble.• Name the trouble/problem the
object is having.
What
• Name objects that are similar inshape, composition, form, or func-tion that could have the same trou-ble, but do not.
• Name other kinds of trouble orproblems this object could be expe-riencing, but is not.
Where
• Name the place where this objecthaving trouble can be found.
• Name the place where this problemfirst appeared.
• Name all other places where thisproblem occurs (or has occurred).
Where
• Name other places where this objectcan be found having no trouble.
• Name places where the problemcould have first appeared, but didnot.
• Name similar places where thisproblem has never occurred.
SL3100_frame_APPX Page 334 Friday, August 31, 2001 10:27 AM

Appendix D: GPS2.
335
Where
(continued)
• Where on the object does the prob-lem occur (inside, outside, top, bot-tom, etc.)?
• Where in the process flow did theproblem first develop?
• Describe all other places where theobject and the trouble can be found.
Where
(continued)
• Where on the object could the prob-lem occur, but does not?
• Where in the process could theproblem have first developed, butdid not?
• Use similar units of measure todescribe where the object and thetrouble are absent.
When
• With respect to time, when did thetrouble/problem first occur?
• Describe the above informationwith regard to day, month, year,time of day, etc.
• Describe any patterns with regardto time.
• Describe when in the process thetrouble/problem first occurred.
• Describe when in the life cycle theproblem first occurred.
• Describe other places in the processand life cycle where the trou-ble/problem was observed.
Note:
Consider all units of time, e.g.,hours, days, minutes, seconds, shifts,periods, quarters, years, etc. Also con-sider sequences in operations as theywould occur in a process flow diagram.
When
• Using the same unit of time, whencould the trouble and/or problemhave first occurred, but did not?
• Describe the above information,matching day, month, year, time ofday, etc. to when the trouble did notoccur.
• Use corresponding units of mea-sure to describe when the troubledid not occur.
• Describe when in the process thetrouble/problem could have firstoccurred, but did not.
• Describe when in the life cycle theproblem could have first occurred,but did not.
• Describe other places in the processor life cycle when it could havebeen observed, but was not.
How Big
• Describe the size of the prob-lem/trouble/effect.
• Describe the number of objects thathave or have had the trouble/prob-lem/effect.
• Describe the magnitude of the trou-ble in terms of percentages, rates,patterns, trends, yield, dimensions,etc.
• Describe the number of defects perobject.
• Describe the physical dimensionsof the defect or problem.
How Big
• Using a similar unit of measure,describe the limits of the prob-lem/trouble/effect.
• Describe the number of objects thatcould have had the trouble/prob-lem/effect, but did not.
• Describe what the magnitude couldhave been, but was not.
• Describe what the defects couldhave been, but were not.
• Describe the physical dimensionsthe defect could demonstrate, buthas not.
Is Is Not
SL3100_frame_APPX Page 335 Friday, August 31, 2001 10:27 AM

336
Six Sigma and Beyond: Problem Solving and Basic Mathematics, Volume II
Ask:
“Are there any other facts that do not appear on the Is/Is Not tool?”
Ask next:
“Who can describe the Is/Is Not facts?”
Developing the problem description — process overview:
Step 1.
Develop the problem statement.• Develop a simple, concise statement to describe who or what object
illustrates the specific defect that has been chosen for determinationof the root cause.
• The statement is intended to be a starting point for further description;the statement must be very concise and clearly perceived.
• Use the “repeated whys” to indicate the lowest rung in what might bea series of events, a chain reaction, etc.
Step 2
. Develop the problem description.• Describe in quantifiable, factual terms the extent of the defect. List all
facts with regard to who, what, where, when, and how big (magnitude).• Describe in quantifiable, contrasting dimensions where the symptom
is not manifested or visible.
Step 3.
Identify information which needs to be confirmed or collected.
Obtain information from knowledgable people by asking the questions in Step 2.
Developing the problem description — process detail:
Step 1:
Develop the problem statement.
Ask:
“What is wrong with what?” Then identify the effect/defect on the object.
Ask next:
“Why is that happening on that object?”
Verify that the answer which has been provided is correct and not just an assumedreason. Repeat the first question over and over until the question cannot be answeredwith certainty. If the cause is unknown and needs to be found, the root cause thenthe last object and defect with unknown cause become the operational statement.Proceed to Step 2 to define the full extent (or profile) of the defect in factual terms.
Example of “Repeated Whys” Technique:
1. I had an automobile accident. Why?2. I couldn’t see clearly. Why?3. My diet is poor (and it has affected my vision). Why?4. My teeth hurt (so I eat the wrong food). Why? I don’t know why my teeth
hurt.
SL3100_frame_APPX Page 336 Friday, August 31, 2001 10:27 AM

Appendix D: GPS2.
337
Problem statement:
My teeth hurt.
Step 2:
Develop the problem description. Not every question will apply toevery problem.
What Is
• What is the specific name(s) of the object that has the defect?• What kind of defect is it?• Is there more than one kind of defect? (If so, separate.)• Is the reason for this defect known? (Are you certain?)
What Is Not
• What objects are similar to “Is” in shape, composition, size, function, etc.,but do not have the same defect?
• What other objects could show the same kind of defect, but do not?
Where Is
• Point out exactly where the defect can be found. What is the location? Isit necessary to go to more than one place? What is the name of this placeor places?
• Where in the procedure or process is the defect first seen?• Where in the life cycle of this object is this defect first seen?• Where on the object is the defect observed? Is this the only place? (Think
inside/outside, end to end.) How is the location defined?
When Is
• Was this object ever free of defects? Has this problem existed since thestart (day one deviation/common cause conditions)?
• When did this defect first occur? (Use year, month, week, day, hour,minute, second, if possible.)
• Does the defect occur all the time or just part of the time? Look for anddefine any patterns with respect to time.
• When else did it happen (year, month, day, etc.)?• Does it still happen? Is it continuous? When did it stop?• Is it stopping and starting? Define frequency (e.g., only on third shift,
only begins after seven hours).
How Big Is
• What is the magnitude of this defect? How can this defect be measured(e.g., length, width, weight, decibels, units of force, etc.)?
• How many defects per object?
SL3100_frame_APPX Page 337 Friday, August 31, 2001 10:27 AM

338
Six Sigma and Beyond: Problem Solving and Basic Mathematics, Volume II
1. Statement: What is wrong with what?
2. Problem description (Use a form similar to the following.)
FIGURE D.1
A typical problem solving worksheet.
• Compare results (parts, scrap reports, percents, averages, anything elsethat tells about quality with quantity).
• Are there any patterns or trends with regard to the number of objectsaffected or the unit of measure of this defect?
Notes:
• Who has more information about this defect?• Use a question about the process. Avoid using questions that can be
answered with “yes” or “no.”
To facilitate the questions in Step 2, it is recommended that the team develop aproblem solving worksheet. A typical worksheet is shown in Figure D.1. The contentsof this worksheet should cover the IS and IS NOT conditions as well as the infor-mation needed.
Comparative analysis:
Step 3A:
Uncover differences. Differences are• Facts• Unique to the IS• Facts that have not already been stated in the IS column
Ask:
To uncover differences ask “What is different, unique, peculiar, special or trueonly of the Is when compared to the companion Is Not?”
The guidelines to develop differences are
1. List all facts without prejudice to cause or potential cause.
Problem description Is Is Not Get Information
What
Where
When
How Big
SL3100_frame_APPX Page 338 Friday, August 31, 2001 10:27 AM

Appendix D: GPS2.
339
2. Consider categories of people, methods, materials, machines, measure-ment, and mother nature (environment).
Step 3B:
Identify changes. Changes are• Facts• Related to differences
Ask:
to uncover changes ask “What has changed in, on, around, or about thedifference and when did the change occur?”
The guidelines to develop changes are
1. List all changes that occurred which are related to the difference regardlessof date or the potential for cause.
2. Consider the categories of people, methods, materials, machines, mea-surement and mother nature (environment).
Step 4:
Develop possible causes (change-how theories). Theories are• Statements of ways that the changes may have created the trouble• A limited form of brainstorming• A simple listing of
possible
causes, not
probable
causes
Ask:
to develop theories ask “How could this change have caused the effect on theobject?” or, “in what ways might this change have caused the effect on the object?”
The guidelines for developing change-how theories are
1. List each theory individually.2. Do not reject or qualify the theory based on its practicality or probability.3. List single change/single variability theories first.4. Develop more complex variability theories second.5. Continue to prompt the problem-solving group with the above question
until all possible theories are developed.6. Defer critical thinking until the next step.
Step 5:
Make a trial run of the theories. Trial runs are• Critical evaluations of theories against the sets of Is/Is Not data• A test of the plausibility, not remote possibility, of each theory• A test of the likelihood of the theory• A process of elimination
Ask:
to test the theory ask “Does the change-how theory explain both the IS and theIS NOT?”
Guidelines for a trial run:
1. Test the theory against each individual set of Is and Is Not.2. If the theory accounts for both Is and Is Not phenomena, record with a
plus (+) symbol.
SL3100_frame_APPX Page 339 Friday, August 31, 2001 10:27 AM

340
Six Sigma and Beyond: Problem Solving and Basic Mathematics, Volume II
3. If the theory cannot plausibly explain either the Is or the Is Not phenom-enon, record the result with a minus (–) symbol and note the reason forthe rejection.
4. Test the theory against all sets of Is and Is Nots. Do not stop testing atheory prematurely.
5. Test all the theories in and of themselves. Consider each “change-how”theory a separate theory.
6. Avoid testing interactive changes and highly complex theories until theend of the trial runs. Test simple theories first.
7. If the plausibility of the theory is uncertain ( + or –), use a question mark(?) to record the uncertainty. Note why the theory is uncertain.
Step 6:
Verify the root cause.• Describe the optimum method to passively, and then actively, verify
the root cause.• Conduct verification in the appropriate setting.• Record the results.
SL3100_frame_APPX Page 340 Friday, August 31, 2001 10:27 AM

341
Appendix E: GPS3.Develop Interim Containment Action (ICA): Assessment Questions
Before ICA implementation:
• Are ICAs required?• Is a service action required as part of the ICA?• What can be learned from the ERA that will help select the “best” ICA?• Based on consultation with the GPS customer and champion, have criteria
been established for ICA selection?• Based on the criteria established, does the ICA provide the best balance
of benefits and risks?• How does choice of this ICA satisfy the following conditions?
1. The ICA protects the customer 100 percent from the effect.2. The ICA is verified.3. The ICA is cost-effective and easy to implement.
Planning:
• Have the appropriate departments been involved in planning this decision?• Have appropriate advanced product quality planning (APQP) tools (e.g.,
FMEA, control plans, instructions) been considered?• Have plans, including action steps, been identified (who needs to do what
by when)?• Has a validation method been determined?• Does the customer have a concern with this ICA (is customer approval
required)?• Has what could go wrong with the plan been identified and have preventive
and contingency actions been considered?• Are implementation resources adequate?
Post implementation:
Does validation data indicate that the GPS customer is beingprotected?
SL3100_frame_APPX Page 341 Friday, August 31, 2001 10:27 AM

342
Six Sigma and Beyond: Problem Solving and Basic Mathematics, Volume II
Common tasks:
Can the ICA effectiveness be improved?
• Have all changes been documented (e.g., FMEA, control plan, processflow)?
• Does the team have the appropriate members to proceed to the next step?• Have the measurable(s) been reviewed?• Has the team determined if a service action is required?
SL3100_frame_APPX Page 342 Friday, August 31, 2001 10:27 AM

343
Appendix F: GPS4.Define and Verify Root Cause and Escape Point: Assessment Questions
General:
• Has factual information in the problem description been updated?• What sources of information have been used to develop the potential root
cause list?
Root cause:
• Is there a root cause (a single verified reason that accounts for theproblem)?
• What factor(s) changed to create this problem? What data are availablethat indicate any problem in the manufacturing or design process?
• How was this root cause verified?• Does this root cause explain all facts compiled at GPS2?• Has the root cause analysis gone far enough (is it necessary to know why
this root cause happened)?
Potential root cause:
• Is there more than one potential root cause?• Does each item on the potential root-cause list account for all known data?
Has each item been verified (used to make the defect come and go)?• How was assignment of percent contribution determined?• Combined, do the items on the potential root-cause list account for 100
percent of the problem (is the desired performance level achievable)?• If the level is achievable, has the team considered and reviewed with the
champion the benefit of developing a separate problem description (and,by definition, a separate GPS) for each potential root cause?
SL3100_frame_APPX Page 343 Friday, August 31, 2001 10:27 AM

344
Six Sigma and Beyond: Problem Solving and Basic Mathematics, Volume II
• If the level is not achievable, has the team considered and reviewed withthe champion the benefit of alternate problem-solving approaches?1. Approaches independent of an GPS?2. Approaches as a compliment to an GPS?
Escape point:
• Does a control system exist to detect the problem?• Has the current control system been identified? Does this control system
represent a change from the original design?• Is there verification that the control system is capable of detecting the
problem?• Is the identified control point closest to the root cause/potential root cause?• Is there a need to improve the control system?
Common tasks:
• Have all changes been documented (e.g., FMEA, control plan, processflow)?
• Does the team have the appropriate members to proceed to the next step?• Have the measurable(s) been reviewed?• Has the team determined if a service action is required?
Root cause analysis:
Root cause analysis is based on a questioning process focusingon the what, where, when, and how big and answering the following concerns aboutthe cause — Is/Is Not, differences, changes, and test.
Determine the root cause of the problem (Figure F.1):
Determination of the root cause:
In cases when “should” and “actual” were oncethe same, but now are different, the root cause will be a change of some type. Thedefinition of root cause is the single verified reason that accounts for the problem.
Approaches for determining root cause:
Two deductive approaches are availableto direct the problem solver to the root cause. Both approaches are based on athorough defect profile built around the problem statement. Both deductiveapproaches are a series of questions that yield answers to which another questionis applied. The result is a steady reduction in the number of possible causes to beinvestigated. For comparison, the steps of the two approaches are shown in TableF.1, having been anchored by the scope (problem statement and problem description).
Method A should be used when
all
changes are known. Method B’s advantageis that it provides a hint about where to investigate for hidden changes. The additionalstep eliminates consideration of changes common to both the Is and Is Not compar-isons listed in the problem description.
SL3100_frame_APPX Page 344 Friday, August 31, 2001 10:27 AM

Appendix F: GPS4.
345
FIGURE F.1
Path for root cause determination.
1. Develop the problem statement
2. Develop the problem description using
3A. List changeson timeline
List differences
List changes indifferences
4. Develop theories
5. Trial run theories
Is/Is Not method
3B. Comparativeanalysis
6. Verify root cause
SL3100_frame_APPX Page 345 Friday, August 31, 2001 10:27 AM

346 Six Sigma and Beyond: Problem Solving and Basic Mathematics, Volume II
Using either Method A or B, the problem solver may have to collect missinginformation. The following list of questions may be used to gather information frompeople who do the work and are familiar with details of the problem. Frequently,these people have essential information that they do not recognize as significant.
Problem-solving questions and guidelines:
Step 1: Develop the problem statement.
Ask:
1a. “What is wrong with what? “1b. “Is the cause of that defect on that object known (for certain)?” (see note)
If the answer to 1b is “no,” use the answer to 1a as the problem statement.
Note: Use “repeated whys” to reach the correct problem statement by repeating 1buntil a “cause is unknown” statement has been reached.
Step 2: Develop the problem description using the Is/Is Not method.
Ask:2a. “What … Is the effect?”
“Where … Is the effect?”“When … Is the effect?”“How Big … Is the effect?”
2b. “What … Is Not the effect?”“Where … Is Not the effect?”“When … Is Not the effect?”“How Big … Is Not the effect?”
TABLE F.1Comparison of Root Cause Approaches
Approach A Approach B
1. Establish a problem statement.2. Develop a problem description.3. List ALL known changes on a timeline.4. Develop theories based upon the changes.5. Trial run the theories.6. Verify the root cause/potential root cause.
1. Establish a problem statement.2. Develop a problem description.3a. List differences.3b. List changes in differences (only).4. Develop theories based upon the changes.5. Trial run the theories.6. Verify the root cause/potential root cause.
Note: The two approaches are identical except Method B has an addition inserted in the third step.
SL3100_frame_APPX Page 346 Friday, August 31, 2001 10:27 AM

Appendix F: GPS4. 347
Notes: Answers to 2b are contrasting information/data based on the specific itemsin 2a. All answers must be facts. Answers to 2b should be similar in category, shape,function, form, and composition to its counterpart in 2a. (If 2a states an incrementin time, then 2b should also be the same increment in time when the problem oreffect is not visible or present.)
Step 3: List all known changes on a timeline (Method A).
Ask: “What is unique, peculiar, different, distinctive, unusual about Is?”
Notes: The information must be factual, true only about the Is, not already listed inthe Is column of the problem scope section. Consider features such as people,methods, material, machines, and mother nature. Do not rule out any facts that arevalid answers to the question. If it is a fact, write it down.
Step 3: Comparative analysis (Method B).
Step 3a: List differences.
Ask: “What is unique, peculiar, different, distinctive, unusual about Is?”
Notes: The information must be factual, true only about the Is; and not already listedin the IS column of the problem scope section. Consider features such as people,methods, material, machines, and mother nature. Do not rule out any facts that arevalid answers to the question. If it is a fact, write it down.
Step 3B: List changes in differences.
Ask: “What has changed in, on, around, or about this difference?”
Notes: When asking a question, name the difference. (If the difference is an electricmotor, ask: “What has changed inside, on, around, or about the electric motor?”)Consider changes in people, methods, material, machines, and mother nature. Therest of the steps are identical for Method A and Method B.
Step 4: Develop theories based on the changes (Method A or B).
Ask: “In what ways might this change create the defect on the object?” or “Howcould this change create the defect on the object?” Write the answer in a“change-how” format.
Notes: Problem solvers should use the actual names of the changes, defect, andobject when asking the question. This is superior to using generic words for thedefect, change, and object.
SL3100_frame_APPX Page 347 Friday, August 31, 2001 10:27 AM

348 Six Sigma and Beyond: Problem Solving and Basic Mathematics, Volume II
In Step 4 (theory development), a recommended technique is to list all possi-bilities, no matter how strange they may sound initially. With groups, it better thandebating the practicality; this debate will occur in Step 5.
During Step 4, the problem solver is theorizing about the specific mechanismor variable that caused the defect. Beware of using generalities such as “out of spec,”“poor quality,” or “something is wrong” as the variable introduced by the changewhich in turn, created the defect on the object from Step 1, the problem statement.
Step 5: Trial run the theories using the test matrix. Test each theory againsteach discrete set of Is/Is Nots listed in the Problem Description (Step 2)for every element of “what,” “where,” “when,” and “how big.”
Ask: “Does this “change-how “ theory completely explain both the Is and Is Not?”
Notes: The question asked is “if this theory is the cause of the effect, do the factualdata in the problem description fully explain why the effect manifests itself in theIs dimension, but never manifests itself in the Is Not dimension?” There are threepossible outcomes:
1. Explains fully: If the data fully explain why the effect manifests itself inthe Is dimension, but never manifests itself in the Is Not dimension, thena plus (+) symbol should be entered in the test matrix for that element.This theory fully explains this element.
2. Cannot explain: If the data cannot explain why the effect manifests itselfin the Is dimension and/or never manifests itself in the Is Not dimension,then a minus (–) symbol should be entered in the test matrix for thatelement. This theory definitely does not explain this element, and thereforecannot be the cause.
3. Insufficient data: If the theory can explain the effect, but there are insuf-ficient data to fully explain why the effect manifests itself in the Isdimension and/or never manifests itself in the Is Not dimension, then aquestion mark (?) symbol should be entered in the test matrix for thatelement. A comment should be added at that point to indicate the furtherdata collection or analysis that is required. This theory could explain thiselement, but more data or analysis are required.
Repeat the test question against each pair of Is/Is Nots until a minus symbol isencountered for a theory; then it should be discounted and a further theory examined.Use of the minus (–) symbol is to exclude nonfeasible theories from further consid-eration. If only one theory passes through the trial run (with all pluses or a combi-nation of pluses and questions marks), then proceed to Step 6 to verify the roofcause included in this theory.
In practice, particularly where multiple potential root causes are considered,more than one theory may pass the trial run with a combination of pluses andquestion marks. In those cases, and where it is feasible and practical to do so, collect
SL3100_frame_APPX Page 348 Friday, August 31, 2001 10:27 AM

Appendix F: GPS4. 349
and analyze the missing data and reexamine the theory to resolve the question marks(?) to either pluses (+) or minuses (–) and proceed as above. If it is not feasible orpractical to collect and analyze the missing data, proceed to Step 6, starting withthe theory with the most pluses (+).
Step 6: Verify root cause. Verification of possible causes can only occur wherethe defect is occurring. Root cause verification cannot be done on a prob-lem-solving form. Verification can be done in two ways: passive or active.Passive verification is by observation. With passive verification, look forthe presence of the root cause/potential root cause without changing any-thing. If the presence of the root cause/potential root cause variable cannotbe proved, then chances are great that this possible cause is not the rootcause. Active verification is a process in which the problem solver seeks tomake the defect come and go using the variable thought to be the rootcause/potential root cause. Both coming and going are important tests toconfirm root cause/potential root cause.
Helpful supplemental tools: The two deductive approaches to determine root causeare based on the availability of all relevant facts. Also assume the two deductiveapproaches contain “myths” or information that are not fact. Sometimes, despite thebest efforts of asking the right questions to the appropriate people, the necessaryfacts cannot be found. Additional information may be obtained from:
• Statistical process control data• Process flow diagrams• Process flow cause-and-effect diagram• Possible causes listed on a cause-and-effect diagram• An expert’s experience• Part analysis of the defect• Distinction analysis• Group brainstorming• Force field analysis
There are benefits and liabilities for each when used with a purely deductive method.
SL3100_frame_APPX Page 349 Friday, August 31, 2001 10:27 AM

SL3100_frame_APPX Page 350 Friday, August 31, 2001 10:27 AM

351
Appendix G: GPS5.Choose and Verify Permanent Corrective Actions (PCAs) for Root Cause and Escape Point: Assessment Questions
Before the PCA decision:
• What criteria have been established for choosing a PCA for the root causeand escape point? Does the champion agree with these criteria?
• Is a service action required as part of the PCA?• What choices have been considered for the PCAs?• Have better choices been overlooked?• What features and benefits would the perfect choice offer? How can these
benefits be preserved?• Do members of this team have the appropriate experience on this team
to make this decision?• What risks are associated with this decision and how should they be
managed?• Does the champion concur with the PCA selections?
Verification:
• What is the evidence (proof) that this will resolve the concern at theroot-cause level?
• Did verification approaches make allowances for variations in the fre-quency (or patterns) created by the cause?
• Which variables were measured during the verification step? Do theseindicators constitute sound verification?
After the PCA decision:
• What are the possibilities that this choice, once implemented, will createother troubles?
SL3100_frame_APPX Page 351 Friday, August 31, 2001 10:27 AM

352 Six Sigma and Beyond: Problem Solving and Basic Mathematics, Volume II
• Can the customer live with this resolution?• Will containment continue to be effective until the choice can be imple-
mented?• What resources will be required for PCA implementation? Are these
resources available?• What departments will need to be involved in the planning and imple-
mentation of this decision?• Have actions been considered to improve the ICA prior to PCA imple-
mentation?
Common tasks:• Have all changes been documented (e.g., FMEA, control plan, process
flow)?• Does the team have the appropriate members to proceed to the next step?• Have the measurable(s) been reviewed?• Has the team determined if a service action is required?
SL3100_frame_APPX Page 352 Friday, August 31, 2001 10:27 AM

353
Appendix H: GPS6.Implement and Validate Permanent Corrective Actions (PCAs): Assessment Questions
Planning:
• What departments are needed to implement the PCAs?• Are representatives of those departments on the team to plan and imple-
ment their parts?• What customer and/or supplier involvement is needed?• Who will do the planning for the customer? For the supplier?• Has an action plan been defined (responsibilities assigned, timing estab-
lished, required support determined)?• Are the necessary resources available to implement this plan? What is
needed?• At what point(s) is this plan vulnerable to “things-gone-wrong?” What
can be done to prevent them?• What are appropriate contingent actions?• What will trigger contingent actions?• How is completion of the plan being monitored?• When will the ICA be removed?• How will this plan be communicated to those who have a need to know?
What training will be required?• What measurable(s) will be used to validate the outcome of the PCAs
(short-term and long-term)?
Validation:
• Has the ICA been discontinued?• Has the unwanted effect been totally eliminated?• How can this be conclusively proved?• How will long-term results continue to be monitored? What is the mea-
surable? Is this the best way to prove the root cause has been eliminated?
SL3100_frame_APPX Page 353 Friday, August 31, 2001 10:27 AM

354 Six Sigma and Beyond: Problem Solving and Basic Mathematics, Volume II
• How have the findings been confirmed with the customer?• Have all systems, practices, procedures, documents, etc. been updated?
Do they accurately reflect what is to be done from here on?
Common tasks:
• Have all changes been documented (e.g., FMEA, control plan, processflow)?
• Does the team have the appropriate members to proceed to the next step?• Have the measurable(s) been reviewed?• Has the team determined if a service action is required?
SL3100_frame_APPX Page 354 Friday, August 31, 2001 10:27 AM

355
Appendix I: GPS7.Prevent Recurrence: Assessment Questions
Problem history:
• How and where did this problem enter the process?• Why did the problem occur at this place/point and how did it escape?
(Why was it not detected?)• Did confusion or lack of knowledge contribute to the creation of this root
cause? Did it contribute to the escape?• What policies, methods, procedures, and/or systems allowed this problem
to occur and escape?• Were Band-Aid™ fixes uncovered in the processes? Where? What do they
compensate for?• Have the affected parties been identified?
Prevent actions (this problem and similar problems):
• What needs to be done differently to prevent recurrence of the root cause?Of the escape?
• Is a service action required as part of the prevent actions?• What evidence exists to indicate the need for a process improvement
approach (i.e., focused improvement, reengineering)?• Who is best able to design improvements in any of the systems, policies,
methods, and/or procedures that resulted in this root cause and escape?• What is the best way to perform a trial run with these improvements?• What practices need standardization?• What plans have been written to coordinate prevent actions and standard-
ize the practices: who, what, and when?• Does the champion concur with the identified prevent actions and plans?• How will these new practices be communicated to those affected by the
change?• Have the practices been standardized?• What progress check points have been defined to assess system improve-
ments?
SL3100_frame_APPX Page 355 Friday, August 31, 2001 10:27 AM

356 Six Sigma and Beyond: Problem Solving and Basic Mathematics, Volume II
Systemic prevent recommendations:
• What management policy, system, or procedure allowed this problem tooccur or escape?
• Are these practices beyond the scope of the current champion?• Who has responsibility for these practices?• Does the current champion agree with the systemic prevent recommen-
dations of the team?
Lessons learned: What data have been submitted to the organization’s lessonslearned database?
Common tasks:
• Have all changes been documented (e.g., FMEA, control plan, processflow)?
• Does the right team have the right members to proceed to the next step?• Have the measurable(s) been reviewed?• Has the team determined if a service action is required?
SL3100_frame_APPX Page 356 Friday, August 31, 2001 10:27 AM

357
Appendix J: GPS8.Recognize Team and Individual Contributions: Assessment Questions
GPS report:
• Has the GPS report been updated and published?• Is the GPS paperwork complete and have other members of the organi-
zation (who have a need to know), and the customer, been informed ofthe status of this GPS?
• Are the GPS report and its attachments retained in the historical filesystem?
Recognition planning:
• Is there a complete list of all team members, current and past?• Were there significant contributions by individual team members? What
were they?• Are there opportunities to provide recognition from leader to team, team
member to team member, team to leader, and team to champion?• What are some different ways to communicate the recognition message?• Are there any non-team members whose contributions to the GPS process
justify inclusion at recognition time?
Recognition implementation:
• Are all current and past team members being recognized?• Do the results achieved by the team warrant some (e.g., company news-
letter)?• Does the recognition satisfy the fit, focus, timely criteria?• GPS8 is intended to be positive. What are the chances that it might backfire
and become negative?
SL3100_frame_APPX Page 357 Friday, August 31, 2001 10:27 AM

358 Six Sigma and Beyond: Problem Solving and Basic Mathematics, Volume II
Lessons learned:
• What has been learned as individuals and as a team? About each other?About problem-solving? About teamwork?
• How did the organization benefit by the completion of this GPS process?• Review each GPS objective. What was done well?• What sort of things should be repeated if conditions bring them together
to escape on another GPS?• Are there changes to business practices that should be considered, based
on information learned in this GPS?
Warm down:
• Has all unfinished business been finalized?• Has each person had an opportunity to express appreciation to other team
members?• Has each person made a final statement?• Has there been an appropriate celebration? What was it?
SL3100_frame_APPX Page 358 Friday, August 31, 2001 10:27 AM

359
Selected Bibliography
Adams, M. and Spann, M. (May 2000). Continuous process improvement when it countsmost.
Quality Progress
, pp. 74–80.Anderson, M. J. and Kraber, S. L. (July 1999). Eight keys to successful DOE.
Quality Digest
,pp. 39–44.
Backman, G. (January 2000). Brainstorming deluxe.
Training & Development
, pp. 15–17.Chaudhry, A. M. (June 1999). To be a problem solver, be a classicist.
Quality Progress
, pp.53–59.
Cotnareanu, T. (December 1999). Old tools — new uses.
Quality Progress
, pp. 48–52.Draper, E. and Ames, M. (February 2000). Enhanced quality tools.
Quality Progress
, pp.41–46.
Natarajan, R. N., Matz, R. E., and Kurosaka, K. (February 1999). Applying QFD to internalservice system design.
Quality Progress,
pp. 65–70.Wilkins, J. O. and Plsek, P. E. (May 2000). Putting Taguchi Methods to work to solve design
flaws.
Quality Progress
, pp. 55–60.
SL3100_frame_BIB Page 359 Friday, August 31, 2001 10:28 AM

SL3100_frame_BIB Page 360 Friday, August 31, 2001 10:28 AM

361
Index
A
Additiondecimals, 201–204fractions, 161–174whole numbers, 123–128
Affinity diagrams, 59Application criteria, for global problem solving
(GPS), 74–75, 78Area
metric–English conversions, 317–320S.I. measurements, 290–292
Arrow diagrams, 59Assessment (problem description), 333–340
B
Band-Aid
™
fixes, 91Behaviorism, 8
C
Capability indices, 18–19Cause-and-effect, correlation versus, 18Cause-and-effect (fishbone) diagrams, 15, 57Cause selection, 15Celsius temperature scale, 296–297Centigrade temperature scale, 296–297Centimeter–inch conversions, 307–310Chain of causality, 69–71Champions, 79, 86, 100Change situations, 75Charts
control, 16–17, 57flow, 55–56
Gannt, 111matrix, 59matrix data analysis, 59Pareto, 18, 57process decision program, 59
Check sheets, 17, 55–56Chronic versus sporadic problems, 34–35Common tasks, for global problem solving (GPS),
75, 82, 85, 90, 93, 99, 103Concern analysis report, 67–69Continual improvement concept, 33–34Control charts, 16–17, 57Coping
nonproductive, 3problem-solving, 3
Core capabilities, 56–57Correlation versus cause/effect, 18Cover sheet, for global problem solving (GPS)
process, 327Cross-functional participation, 96Cube numbers, 218–220Cube roots, 220–226Cubic meter (volume), 292–293Customer identification, 48Customer requirements, 49
D
DaimlerChrysler 7-step cycle, 44Data gathering, 14–25, 83
potential-cause selection, 15preventing recurrence, 15–22protocol, 14–15stimulus passage, 14team approach, 22–25verbalization or “thinking aloud,” 14
SL3100_frame_INDEX Page 361 Wednesday, September 5, 2001 3:39 PM

362
Six Sigma and Beyond: Problem Solving and Basic Mathematics, Volume II
Decimal point placement, 240–247Decimals
addition, 201–204, 259–264applied problems, 212division, 206–212, 270–271multiplication, 204–206, 268–270numbers greater than one, 253–256numbers less than one, 257–259ordering, rounding, and changing, 191–199subtraction, 201–202, 265–268
Deming, W. Edwards, 38Density function, Weibull, 22Department improvement teams (DITs), 42Department of Defense (DoD) 6-step cycle, 44Design for six sigma (DFSS) approach, 107–115,
see also
Six sigma (DFSS) approachDesign of experiments (DOE), 19–20, 71–72Diagrams
affinity, 59arrow, 59cause-and-effect (fishbone), 15, 57flow, 16Pareto, 18, 57process flow, 16relationship, 59scatter, 18, 57tree, 59
Distribution, Weibull, 22Division
decimals, 270–271fractions, 179–185whole numbers, 131–140
DMAIC model, 110–112, 113DOE (design of experiments) process, 19–20,
71–72
E
8D methodology, 4,
see also
Global Problem Solving (GPS)
Emergency response actions (ERAs), 329–330Employee involvement, 22–25, 41–53,
see also
Team approach
English–metric conversions, 305–324,
see also
Metric–English conversions
Environment (problem-solving), 12–13Escape point identification, 88–92Experiments, design of (DOE), 19–20, 71–72
F
Facilitator, 80–81Factoring, 245–247
Fahrenheit temperature scale, 296, 297–298Failure mode and effect analysis (FMEA), 20–21Fear, 38Fishbone (cause-and-effect) diagrams, 15, 575W2H approach, 22–23, 25, 107Floor (root cause) level, 4,
see also
Root causeFlow charts, 55–56Flow diagram, 16FMEA (failure mode and effect analysis), 20–21Ford Motor Company, 4, 44
global (8D) problem solving process, 61–104,
see also
Global problem solving (GPS) process
Fractionsaddition and subtraction, 161–174multiplication and division, 179–185parts and types of, 145–148simplest form and common denominators,
149–159Full time equivalent (FTE) resources, 110–112Functional analysis/allocation (FA), 108
G
Gage studies, 18Gannt chart, 111General Motors (GM) 4-step cycle, 43Gestalt approach, 6–8Global problem solving (GPS) process, 61–104
application criteria, 74–75assessment (problem description), 333–340change and never-been-there situations, 75common tasks, 75concern analysis report, 67–69cover sheet for, 327do’s and do not’s, 65–67emergency response actions (ERAs),
329–330general overview, 61–65implementation/validation assessment
questions, 353–354individual and team recognition assessment
questions, 357–358interim containment action (ICA) assessment
questions, 341–342permanent corrective actions (PCAs)
assessment questions, 351–352recurrence prevention assessment questions,
355–356root cause and escape point assessment
questions, 343–349root cause issues, 69–71steps, 75–104
1: establish team/process flow, 78–81
SL3100_frame_INDEX Page 362 Wednesday, September 5, 2001 3:39 PM

Index
363
2: describe problem, 82–843: develop interim containment actions
(ICAs), 85–874: define and verify root cause and escape
point, 88–925: choose and verify permanent corrective
actions (PCAs), 93–956: implement and validate permanent
corrective actions (PCAs), 95–987: prevent recurrence, 98–1028: recognize team and individual
contributions, 102–104team/process flow assessment, 331–332verification, 71–74
Gram/kilogram, 294–296Graphs, 17–18
H
Head-hunting, 38Histograms, 17, 57
I
Illumination step, 5Implementation, of permanent corrective actions
(PCAs), 95–98Implementation/validation assessment questions,
353–354Importance, ignorance of, 37Improvement, continual, 33–34Inch–centimeter conversions, 307–310Incubation step, 5Indices, capability, 18–19Initial project charter (IPC), 109–110Insight, 6Interim containment actions (ICAs), 85–87,
96assessment questions, 341–342
International system of units (S.I. units),289–304
cubic meter, 292–293kelvin, 296–300kilogram, 294–296meter, 290–292technical (derived) units, 302–304
Is/is not analysis, 20
K
Kelvin (temperature), 296–300Kilogram/gram (weight), 294–296
L
Length (linear) measurementsEnglish–metric conversions, 307–310,
316–317metric, 280–281S.I., 290–292
Liquid, metric measurements, 285–286Liter–quart/pint conversions, 312–313
M
Managementin creating problem-solving climate, 92demonstration of interest by, 92fear and self-protection in, 38head-hunting by, 38quarterly earnings emphasis of, 38in setting priorities, 92
Management systems, 16Mass (weight) measurements
metric, 281–283S.I., 294–296
Mathematics,
see also
Measurements and individual subtopics
decimalsaddition, 201–204, 259–264applied problems, 212division, 206–212, 270–271multiplication, 204–206, 268–270numbers greater than one, 253–256numbers less than one, 257–259ordering, rounding, and changing, 191–199subtraction, 201–204, 265–268
fractionsaddition and subtraction, 161–174multiplication and division, 179–185parts and types of, 145–148simplest form and common denominators,
149–159proportion, 240–241scientific notation and powers of 10, 245–251
decimal point placement, 240–247factoring, 245–247numbers greater than one, 245–247numbers less than one, 240–251
square and cube numbers, 218–220square and cube roots, 220–226square root applications, 231–234square root calculation, 225–229whole numbers
addition and subtraction, 123–128multiplication and division, 131–140value of, 119–121
SL3100_frame_INDEX Page 363 Wednesday, September 5, 2001 3:39 PM
364
Six Sigma and Beyond: Problem Solving and Basic Mathematics, Volume II
Matrix charts, 59Matrix data analysis charts, 59Measurement
cubic meter (volume), 292–293definitions and principles, 289–290English–metric conversions, 305–324,
see also
Metric–English conversions
area units, 317–320cumulative exercises, 323–324inches to centimeters, 307–310length units, 316–317quarts and pints to liters, 312–316review test, 305–307volume units, 320–323yards to meters, 310–312
international system of (S.I.), 289–304cubic meter, 292–293kelvin, 296–300kilogram, 294–296meter, 290–292technical (derived) units, 302–304
kelvin (temperature), 296–300kilogram/gram (weight), 294–296meter (length and area), 290–292metric system, 273–288,
see also
Metric system
process, 49–50technical (derived) units, 302–304
Meter,
see also
Metric systemcubic, 292–293as S.I. unit, 290–292
Meter–yard conversions, 310–312Metric–English conversions, 305–324
area units, 317–320inches to centimeters, 307–310length units, 316–317quarts and pints to liters, 312–316review test, 305–307volume units, 320–323yards to meters, 310–312
Metric system, 273–288common linear measures, 280–281common weight (mass) measures,
281–283conversion of measures within, 275–280
Multiplicationdecimals, 204–206, 268–270fractions, 179–185whole numbers, 131–140
N
Never-been-there situations, 75Nonproductive coping, 3
O
Ordering, rounding, and changing, 191–199Output identification, 47–48Ownership, lack of, 37
P
Pareto charts, 57Pareto diagram, 18Permanent corrective actions (PCAs)
assessment questions, 351–352choosing and verifying, 93–95implementation and validation, 95–98
Plots, 17–18stem and leaf, 17
Powers of ten, 245–251Preparation step, 5Problem (task) definition, 11, 83Problem description, 82–84, 333–340Problems
chronic versus sporadic, 34–35six key ingredients for corection of, 39three typical responses to, 35–37
Problem situation, 11, 12Problem solving
basic model, 5–9as compared with process improvement,
52data gathering for, 14–25,
see also
Data gathering
definition of, 10–11design for six sigma (DFSS) approach,
107–115,
see also
Six sigma (DFSS) approach
generalized stages of, 7–8global (Ford Motor Company, 8D) approach,
61–104,
see also
Global problem solving (GPS) process
key elements in, 33–39nine common roadblocks to effective,
37–38quality tools, 55–59sample for, 25–26steps of, 5strategies for, 3terminology of, 9–25,
see also
Data gathering; Terminology
theoretical aspects, 5–26,
see also
Theoretical aspects
Problem-solving behavior (operation, strategy), defined, 13–14
Problem-solving process, 13Problem-solving subject, 11
SL3100_frame_INDEX Page 364 Wednesday, September 5, 2001 3:39 PM

Index
365
Problem statement, 44Process capability, 50Process decision program charts, 59Process flow diagram, 16Process guidelines, 81, 83–84, 87, 91–92, 94–95,
100–102Process improvement, as compared with problem
solving, 52Process-improvement cycle, 46–52,
see also
Team approach
Process improvement teams (PITs), 42Process measurements, 49–50Process output, 49Product (solution) defined, 13Product specifications, 49Proportion, 240–241Protocol, 14–15Purpose statements, 84, 90, 93, 95, 99
Q
Quality tools, 55–59application of, 57–58inventory of, 55management, 59seven basic, 55–57
Quarterly earnings emphasis, 38Quart/pint–liter conversions, 312–313
R
Reamur temperature scale, 296Recognition, 65, 102–104
assessment questions, 357–358lack of, 37
Recorder, 80Recurrence prevention, 15–22, 98–102
assessment questions, 355–356Recycling of process, 51–52Relationship diagrams, 59Reliability at 85% confidence, 72–73Repeatability and reproducibility (R&R),
111–112Requirement analysis (RA), 108Response surface methodology (RSM), 114Risk assessment, 108Risk handling, 108Risk monitoring, 108Risk planning, 107–108Root cause and escape point, 4, 69–71
assessment questions, 343–349identification, 88–92
S
Sample, importance of, 25–26Sample size, 72–73Scatter diagrams, 18, 57Scientific notation and powers of ten, 245–251
decimal point placement, 247–240factoring, 245–247numbers greater than one, 245–247numbers less than one, 240–251
Self-protective approaches, 38Sensory Input, 5–6Six sigma (DFSS) approach, 107–115
design process, 113–115overview, 107–109week 1: structuring: goals, objective, and
scope, 109–110week 2: structuring: product-based estimating,
110–112week 3: controlling the project, 112–113
Snapshot verification, 72–73Solution (product), 13SPC verification, 73–74Sporadic versus chronic problems, 34–35Square and cube numbers, 218–220Square and cube roots, 220–226Square root applications, 231–234Square root calculation, 225–229Stem and leaf plots, 17Stimulus passage, 14Strategies
nonproductive coping, 3problem solving, 3reference to others, 4
Subject (problem solver), 12Subtraction
decimals, 201–204fractions, 161–174whole numbers, 123–128
Success factors, 92Synthesis, 108System analysis and control (SA), 108Système Internationale (S.I.) units, 289–304,
see also
International system of units (S.I.)
T
Task (problem) defined, 11Team(s)
local (department-improvement) and cross-functional (process improvement), 42
required attributes of, 43TEAM acronym, 42
SL3100_frame_INDEX Page 365 Wednesday, September 5, 2001 3:39 PM

366
Six Sigma and Beyond: Problem Solving and Basic Mathematics, Volume II
Team approach, 22–25, 41–53general guidelines for, 43importance of, 41–42problem-solving models for, 43–46
Team leader, 80Team members, 80Team/process flow, 78–81, 331–332Technical (derived) S.I. units, 302–304Temperature
scales of measurement, 296S.I. measurements, 296–300
Terminology, 9–14behavior, operation, or strategy, 13–14of data gathering, 14–25,
see also
Data gathering
environment, 12–13problem or task, 11–12problem situation, 12problem solving, 10–11process, 13product or solution, 13subject, 12
Theoretical aspects, 5–26Things gone wrong/right (TGW/TGR), 112“Thinking aloud” (verbalization), 14Time, lack of, 37Tree diagrams, 59
V
Validation, of permanent corrective actions (PCAs), 95–98
Verbalization (“thinking aloud”), 14
Verification, 5, 71–74, 108elements of, 71–72snapshot, 72–73SPC chart subgroup and sample size,
73–74Volume
metric–English conversions, 320–323metric measurements, 285–286S.I. measurements, 292–293
W
Weibull analysis, 21–22Weight (mass) measurements
metric, 281–283S.I., 294–296
5W2H approach, 22–23, 25, 107Whole numbers
addition and substraction, 123–128multiplication and division, 131–140value of, 119–121
Work process identification, 49Work process improvement, 50–51
X
Xerox (6-step) system, 43
Y
Yard–meter conversions, 310–312
SL3100_frame_INDEX Page 366 Wednesday, September 5, 2001 3:39 PM
