six sigma case study (procurement) -...
TRANSCRIPT

22 Sep. 2017 1
Six Sigma Case Study (Procurement): Reduce COD and Improve Average Credit Period
Prepared by: Salam Khader
22 Sep. 2017
Salam Khader Almost 20 years of experience in Six Sigma
Lean Six Sigma Black Belt Project Leader and QA Process Control Manager
Expert in business process re-engineering
Able to solve problems that can lead to improved efficiency and reduced costs
Experienced in applying continuous improvement tools (5S, FMEA, Kaizen, KPIs, VA/ VE, SPC, etc…)
Trainer in process improvement tools and methods
2

22 Sep. 2017
Human Recourses: Repetitive Motion Injuries
Daimler Chrysler BR Line: Efficiency Improvement
BR/DR line: Excessive Free Lever Torque
General Motor GMT 800: High Pedal Parking Brake interference with the Mag-Beam
FORD VN-127Cell: Full factorial DOE to Maximize the Slippage Load
Chevrolet N -Truck: Efficiency Improvement
General Motor GMJ Line: Increase P/O/H and Reduce Overtime
Paint & Degreasing Operations : Incorrect Standard in Routing for Every Part
3
Samples of Six Sigma Projects Executed in USA
Twenty plus extremely successful Six Sigma projects in the Industrial sector such as:

22 Sep. 2017
Samples of Six Sigma Projects Executed in Kuwait
Procurement: Reduce COD and Improve Average Credit Period
Human Resources: Employees Turnover (Non-manual Regular)
Finance: Unbilled Revenue
Equipment: Cranes Downtime and Idle Time
Procurement: Just in Time Delivery of Project Material
Equipment: Earth Moving Equipment Breakdowns and Downtime
Procurement: Delivery of Materials through LPOs
Instant Access: Equipment Breakdowns and Idle Time
Fabrication: Reduce Weld Defects
4

22 Sep. 2017
Agenda
Vital Information and Project Definition
Primary & Secondary Metrics
Cause & Effect Analysis (Fish Bone Diagram)
XY Matrix and Vital X’s
Process Flowchart for Procurement
Identification of Root Causes
Primary & Secondary Metrics (After the implementation)
How to Sustain and Improve the Results?
5

22 Sep. 2017
Financial Benefits & Controller - Mohd Zaghloul (FAMC) / Philip Thomas (FAM) - Total indirect savings on bank interest @ 8.75% (estimated approx. KD 0.5 million) on the total value of procurement for the year 2007
Metric Baseline and Goal - Project start (baseline):
- % COD: 20% - Avg. credit period: 46 days
- Project completion (Goal): - % COD: < 10% - Avg. credit period: >= 60 Days
Project Name: “Reduce COD and Improve Avg Credit Period” Improve Procurement Cash Flow by reducing the % Cash On Delivery (COD) payments and increasing the average credit period for local purchase orders.
Champion Ali Sakkijha (PDM Corporate) Team Members Salam Khader (Black Belt) T. Bala (PUH - Corporate) Fayez Al Fakhoury (P&MCM – Kuwait) Sam George (Sr. Buyer) Shibu Madathil (PD Office Administrator)
Metrics - Primary: % COD Payments - Secondary: Average Credit Period
Vital Information
6
22 Sep. 2017
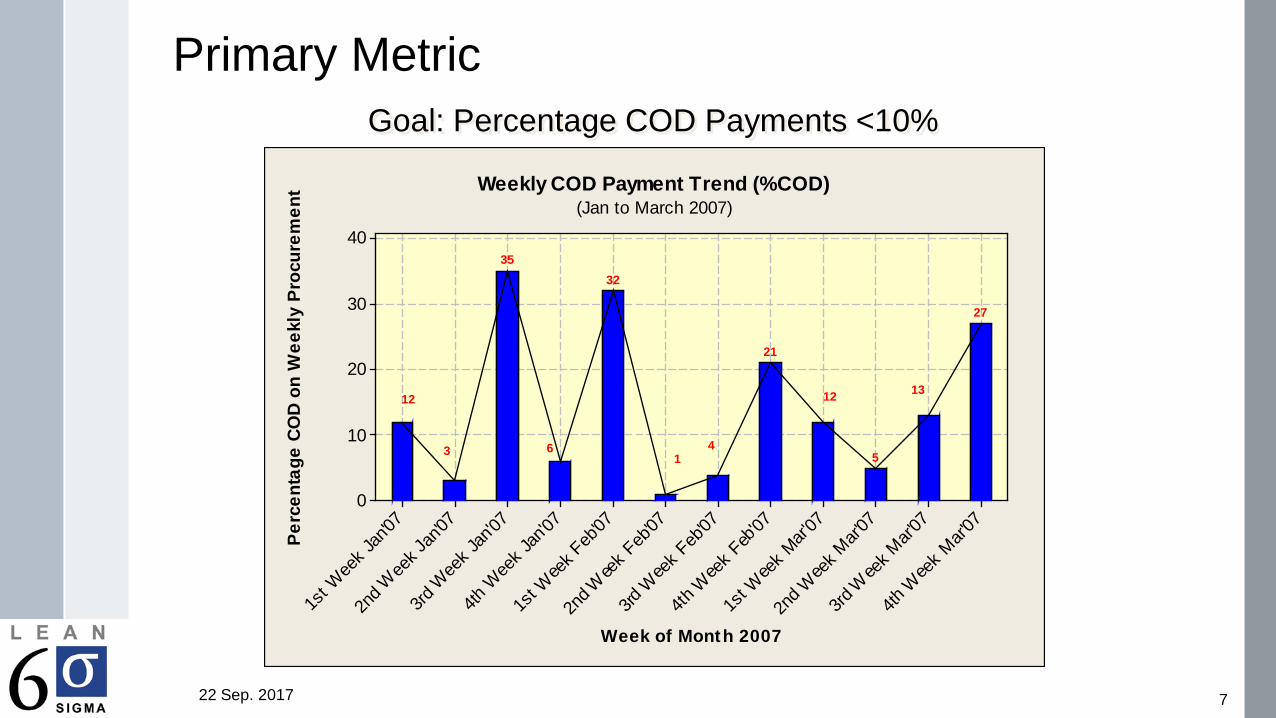
Goal: Percentage COD Payments <10%
Primary Metric
Week of Month 2007
Perc
enta
ge C
OD
on W
eekl
y Pr
ocur
emen
t
4th W
eek M
ar'07
3rd W
eek M
ar'07
2nd W
eek M
ar'07
1st W
eek M
ar'07
4th W
eek F
eb'07
3rd W
eek F
eb'07
2nd W
eek F
eb'07
1st W
eek F
eb'07
4th W
eek J
an'07
3rd W
eek J
an'07
2nd W
eek J
an'07
1st W
eek J
an'07
40
30
20
10
0
27
13
5
12
21
41
32
6
35
3
12
Weekly COD Payment Trend (%COD)(Jan to March 2007)
7
22 Sep. 2017
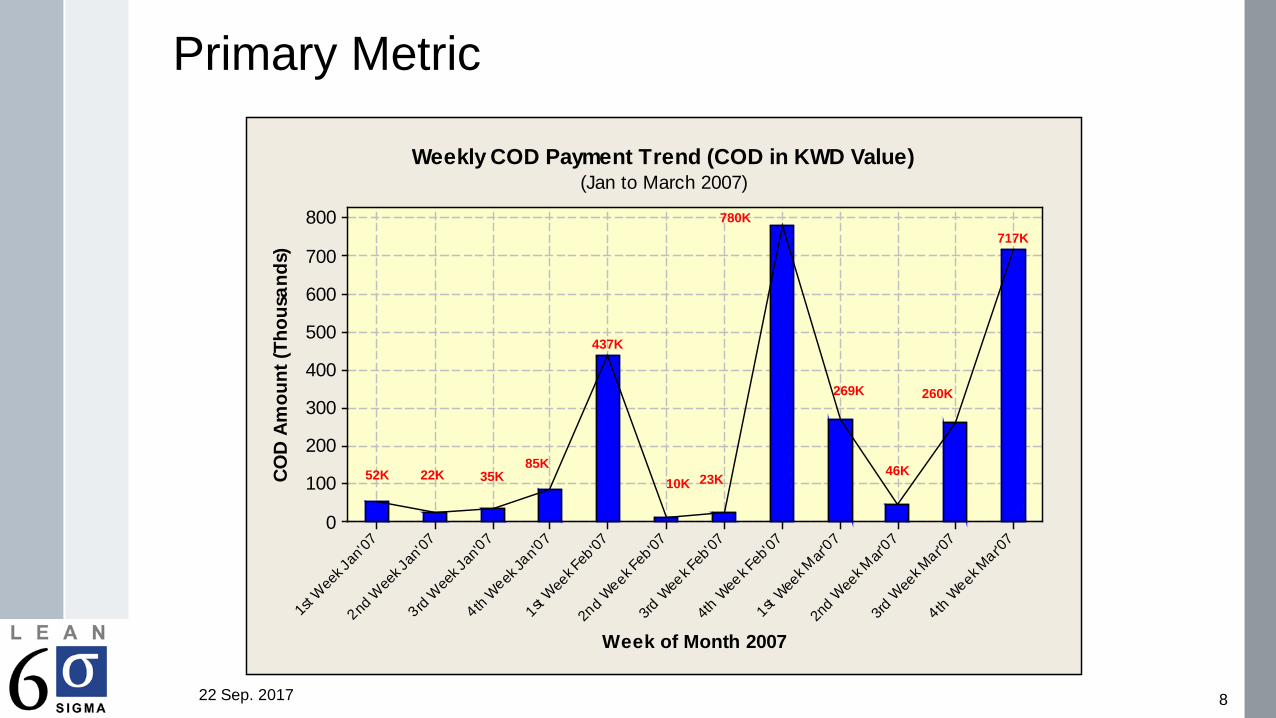
Primary Metric
Week of Month 2007
COD
Amou
nt (T
hous
ands
)
4 th W
eek M
a r'07
3rd W
eek M
a r'07
2nd
Week M
ar'0 7
1st W
eek M
ar'0 7
4th W
eek F
eb'07
3rd W
eek F
eb'07
2nd
Week F
eb'07
1st W
eek F
eb'07
4 th W
eek Ja
n'07
3 rd W
eek J
an'07
2nd W
eek J
an'07
1st W
eek J
an'07
800
700
600
500
400
300
200
100
0
717K
260K
46K
269K
780K
23K10K
437K
85K35K22K52K
Weekly COD Payment Trend (COD in KWD Value)(Jan to March 2007)
8

22 Sep. 2017
Secondary Metric
40
45
50
55
60
65
70
75
January February March April May
48.25 48.5 47.5 48
50
Did not meet the Goal
Avg
Cre
dit P
erio
d (D
ays)
9
Goal: Average Credit Period >= 60 Days

22 Sep. 2017
Fish Bone Diagram
ReduceCOD AndImproveAvgCreditPeriod
Market
Measurement
Methods
Maintenance
Machines
Personnel
Delay in MRV Approv al
Lack of commitment
Lack of confidence
Poor understanding of
Lack of Experience
Lack of Training
Commercial Knowledge
Negotiation Skills
ERP/ATS breakdown
Relationship withProj ects
Supplier relationships
Low v alue for moneyTesting & comm
Material Test CertificateWarranty Certificate
3rd Party inspectionWrong receiv ed material
Material deliv eredIncomplete PO Terms
Delay in MRVDirect deliv ery to
FAD Payment cycleAmendments to PO
Lack of planning
Contract conditions
Client Specific request
Poor Quality
Sole source
Complex specs
Economies of scale
Unrealistic deliv ery time
Fluctuation in Currency
Fluctuation in Materalprice
Market demand
Lack of competition
Political Situation
Cause and Effect for Procurement Cash Flow
10

22 Sep. 2017
XY Matrix
List of Vital X’s 1. Delay in MRV preparation
2. Delay in MRV approval from PM
3. FAD payment cycle
4. Lack of planning for required material
5. Negotiation skills
6. Supplier relationships
11

22 Sep. 2017
Process Flowchart
(1) Prepare Material Requisition and forward to Procurement Department
(2) Prepare/Forward RFQ and Collect Quotation from Suppliers
(3) Evaluation of Quotation and Negotiation with qualified suppliers
Yes Check
Commercial Conditions
(4) Issue Purchase Order to Suppliers
(6) Material Receipt at Stores
Check Material as per LPO
Inspection for Material
Quality
(3a) Renegotiate with Supplier
No
(5) Supplier Delivers Material to Store
(7) Return to Supplier
No
No
(5a) Supplier Submits Invoice to FAD
(8) Store Keeper Prepares MRV
(8a) MRV Approval by PM
(8b) MRV Submission to FAD
Yes
Yes
Match LPO & MRV
& Invoice
Yes
(4b) PO Copy to FAD
(4a) PO Copy to Stores
(9) FAD to post MRV / Invoice / PO in ATS system before 25th of Every Month
(10) Payment to Supplier
(10a) Hold Payment & clarify with PD/Stores
VA VA VA VA
NVA
NVA
VA
VA
VA
NVA
VA
VA
VA NVA
VA
VA VA VA VA
NVA
No
12

22 Sep. 2017
(9) FAD to post MRV / Invoice / PO in ATS system before 25th of every month
NVA
Input:
1. FAD cycle on bi-weekly
basis. 2. Payment due date to be
calculated from actual delivery date.
Output:
1. Timely payment to Supplier
Input:
1. Supplier Relationship 2. Negotiation Skills
Output:
1. Better Credit Terms 2. Avoid PO Amendments
Input:
1. MRV to be submitted
without delay on daily basis
Output:
1. Timely payment to Supplier
(3a) Renegotiate with Supplier
NVA
(8b) MRV Submission to FAD
VA
(1) Prepare Material Requisition and forward to Procurement Department
Input:
1. Proper planning
2. Consolidation of Requirement
Output:
1. More Negotiation Leverage for Better Credit Terms
VA
Identification of Root Causes
13

22 Sep. 2017
Month
Num
ber o
f Day
s
Jun'2
007
May
'2007
Apr'2
007
Mar
'2007
Feb'2
007
Jan'2
007
18
16
14
12
10
8
6
4
2
0
MRV_Month
May'2007Jun'2007
Jan'2007Feb'2007Mar'2007Apr'2007
1413
16
1213
8
Average Delay in MRV Preperation (Jan - Jun 2007)(KN - Kuwait)
1.1 Delay in MRV Preparation
14

22 Sep. 2017
(Summary of results of a survey conducted among storekeepers)
Ratin
gReasons for Delay
Count17.1 16.6 16.0 14.9 14.9 11.4 9.1
Cum % 17.1 33.7
3.0
49.7 64.6 79.4 90.9 100.0
2.9 2.8 2.6 2.6 2.0 1.6Percent
Lack of M
anpower
Project Manager la
te approval
Supplier Q
uality problems
Delay in In
spectio
n
Missing documents fro
m Suppliers
IT Net W
ork
Non availability o
f LPO at
Stores
5
4
3
2
1
0 0
1.62
2.62.62.82.93
Analysis on Reason for MRV Delay From Stores
1.2 Delay in MRV Preparation
15

22 Sep. 2017
Based on the results of the Survey conducted among Store Keepers, It has been concluded that “Delay in MRV Approval from PM” is not effecting the COD Payments.
16
2. Delay in MRV Approval from PM
22 Sep. 2017
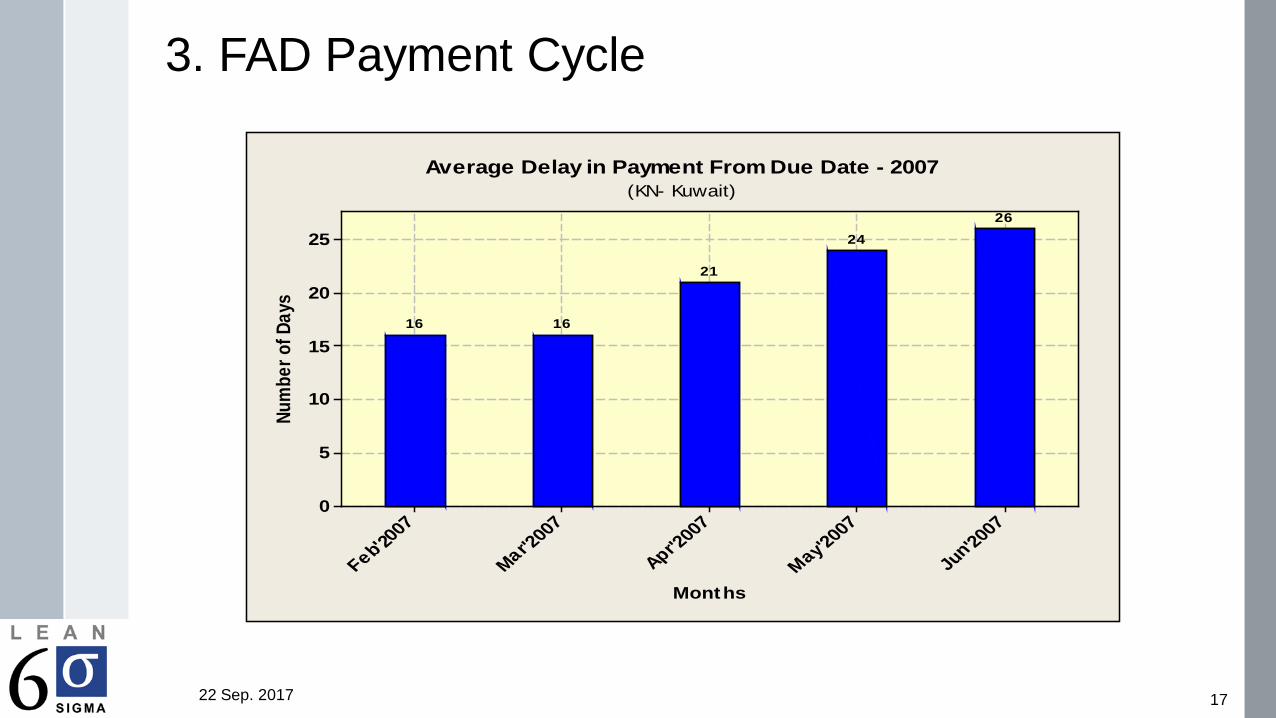
3. FAD Payment Cycle
Months
Num
ber o
f Day
s
Jun'20
07
May'200
7
Apr'200
7
Mar'200
7
Feb'200
7
25
20
15
10
5
0
2624
21
1616
Average Delay in Payment From Due Date - 2007(KN- Kuwait)
17
22 Sep. 2017
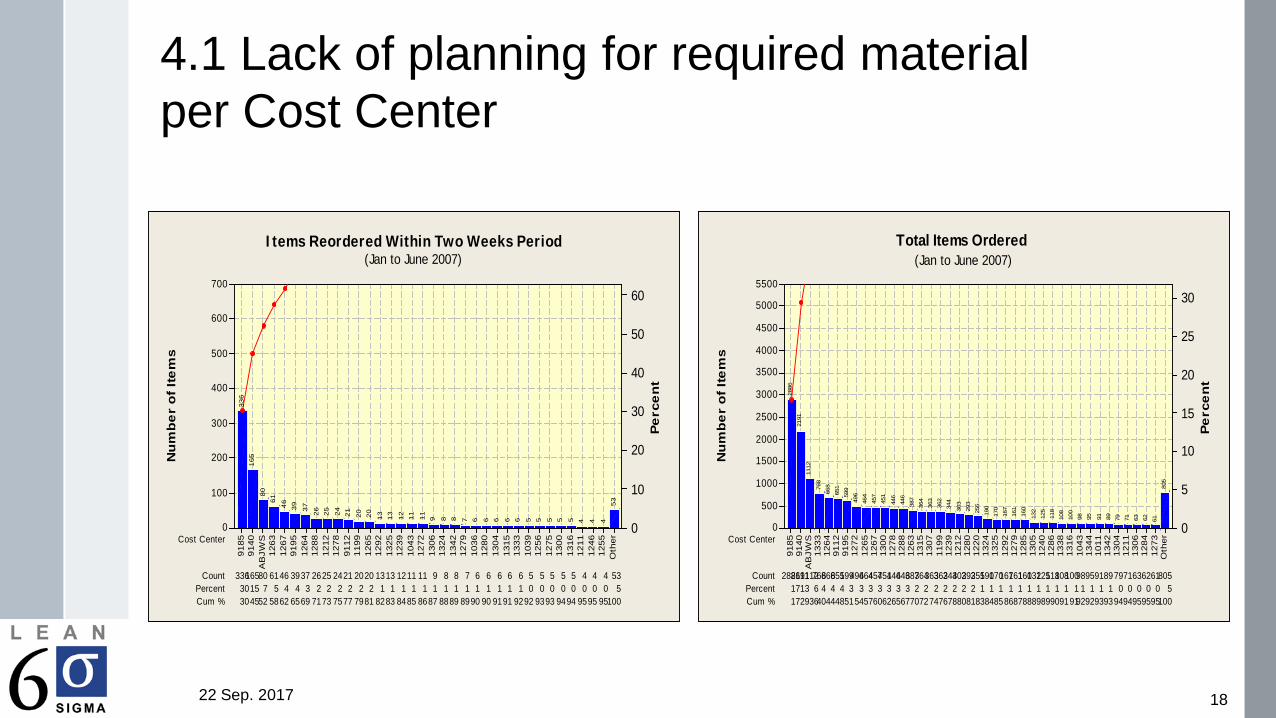
4.1 Lack of planning for required material per Cost Center
Nu
mb
er
of
Ite
ms
Pe
rce
nt
Cost Center
Count 464
72747678808183848586
457
87888989909191929293
451
939494959595100
4464463873643633623442886 3032932551901701671611601321252191 118108100989591897971631112 6261805Percent 1713 6 4 4 4
7683 3 3 3 3 3 3 2 2 2
6682 2 2 2 1 1 1 1 1 1
6511 1 1 1 1 1 1 1 1 0
5990 0 0 0 5
Cum % 17293640
496
44485154576062656770
Oth
er12
7312
8413
0612
1113
0413
4210
1113
4410
4313
1613
3812
8612
4013
0512
8512
7912
9213
2513
2412
2012
8012
1212
3911
9913
0713
1512
6312
8812
7813
0012
6712
6512
7291
9591
1212
6413
33A
BJW
S91
4091
85
5500
5000
4500
4000
3500
3000
2500
2000
1500
1000
500
0
30
25
20
15
10
5
0
805
616263717989919598100
108
118
125
132
160
161
167
170
190
255
293
303
344
362
363
364
387
446
446
451
457
464
49659
9
651
66876
8
1112
2191
2886
Total Items Ordered (Jan to June 2007)
Nu
mb
er
of
Ite
ms
Pe
rce
nt
Cost Center
Count 25
9191 9292 9393 9494 9595
24
95100
21 2020 1313 1211 11336 9 8 8 7 6 6 6 6 6 5165 5 5 5 5 4 4 4 53Percent 30
8015 7 5 4 4 3 2 2 2 2
612 2 1 1 1 1 1 1 1 1
461 1 1 1 1 1 0 0 0 0
390 0 0 0 5
Cum % 304552 58
37
62 6569 7173 7577 7981 82
26
83 8485 8687 8889 8990 90O
ther
1255
1246
1211
1316
1300
1275
1256
1039
1333
1315
1304
1280
1036
1279
1342
1324
1306
1272
1043
1239
1325
1292
1265
1199
9112
1278
1212
1288
1264
9195
1267
1263
AB
JWS
9140
9185
700
600
500
400
300
200
100
0
60
50
40
30
20
10
0
53444555556666678891111121313202021242526373946
6180
165
336
Items Reordered Within Two Weeks Period(Jan to June 2007)
18

22 Sep. 2017
4.2 Lack of planning for required material per Business Lines
Nu
mb
er
of
Ite
ms
Pe
rce
nt
Business Lines
Count28.9 23.6 17.9 10.5 8.6 6.6 3.9
Cum % 28.9 52.5
5077
70.4 80.9 89.5 96.1 100.0
4147 3142 1842 1519 1153 683Percent
Oth
er
AB
J F
ab
Wo
rksh
op
Op
era
tio
ns
E&
FM
In
du
stri
al
Ma
int
(Po
we
r)
Pe
tro
leu
m &
Ch
em
ica
l
E&
FM
Fa
cili
tie
s M
an
ag
em
en
t
EP
C O
pe
rati
on
s (B
uil
din
g S
erv
ice
s)
Eq
uip
me
nt
Div
isio
n
20000
15000
10000
5000
0
100
80
60
40
20
0683115315191842314241475077
Total Items Ordered(Jan 2007 to June)
Nu
mb
er
of
Ite
ms
Pe
rce
nt
Business Lines
Count52.3 21.3 9.2 5.3 5.1 3.6 3.2
Cum % 52.3 73.6
388
82.7 88.0 93.1 96.8 100.0
158 68 39 38 27 24Percent
Oth
er
E&
FM
In
du
stri
al
Ma
int
(Po
we
r)
AB
J F
ab
Wo
rksh
op
Op
era
tio
ns
Pe
tro
leu
m &
Ch
em
ica
l
EP
C O
pe
rati
on
s (B
uil
din
g S
erv
ice
s)
E&
FM
Fa
cili
tie
s M
an
ag
em
en
t
Eq
uip
me
nt
Div
isio
n800700600500400300200100
0
1008060
4020
02427383968
158
388
Items Reordered Within One Week Period(Jan 2007 to June)
19

22 Sep. 2017
5. Negotiation Skills
Payment Terms for Credit Period
Num
ber o
f Sup
plie
rs
9 0 Day
s
75 Day
s
60 Day
s
45 Day
s
30 Day
s
15 Day
sCOD
400
300
200
100
0
VariableAfter NegotiationBefore Negotiation
75
1
263
21
178
6
98
00
97
0
427
5
113
Payment Terms Before & After Negotiations - 2007
Before Negotiation
After Negotiation
20
22 Sep. 2017
% B
usin
ess
Line
Perc
ent
Business Line
Count45.5 24.2 11.1 7.1 5.1 4.0 3.0
Cum % 45.5 69.7
45
80.8 87.9 92.9 97.0 100.0
24 11 7 5 4 3Percent
Othe r
E& FM- In
dus tri
al M
aint
(Pow
er)
Fabric
ation
Wor
ksho
p Ope
rati o
ns
E& FM
- I ndu
s trial
Ma in
t
Petrol e
um &
Che
mical
EPC Ope
ratio
ns (B
uildi
ng Ser
v ices)
E& F
M- Fac
ili ties
Man
agem
ent
100
80
60
40
20
0
100
80
60
40
20
0345711
24
45
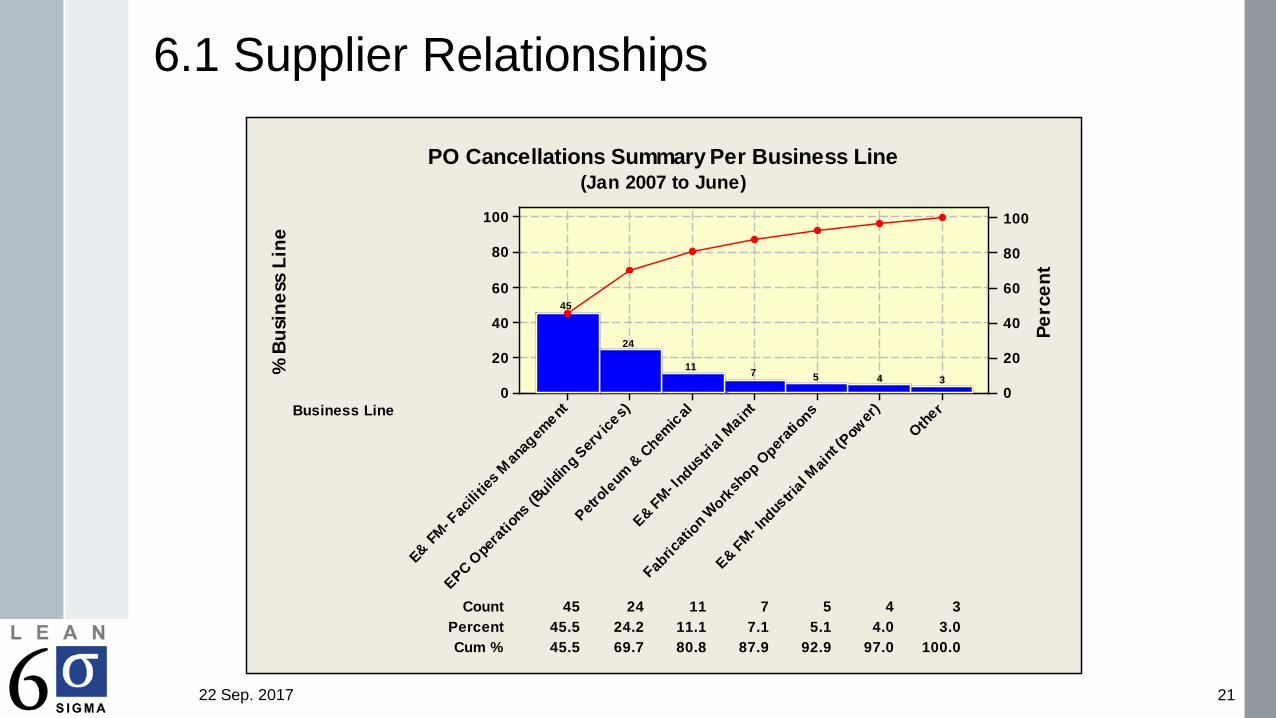
PO Cancellations Summary Per Business Line(Jan 2007 to June)
6.1 Supplier Relationships
21
22 Sep. 2017
% P
O C
ance
llatio
ns
Perc
ent
Reasons for PO Cancellation
Count12.0 7.0 6.0 3.0 5.0
Cum % 67.0 79.0 86.0 92.0
67
95.0 100.0
12 7 6 3 5Percent 67.0
Oth
er
Wro
ng M
ater
ial S
uppl
y
Item
Spe
cific
atio
n C
hang
ed
PO P
rice
Dis
crep
ancy
Item
Not
Ava
ilabl
e w
ith S
uppl
ier
Mat
eria
l Not
Req
uire
d
100
80
60
40
20
0
100
80
60
40
20
02367
12
67
236712
67
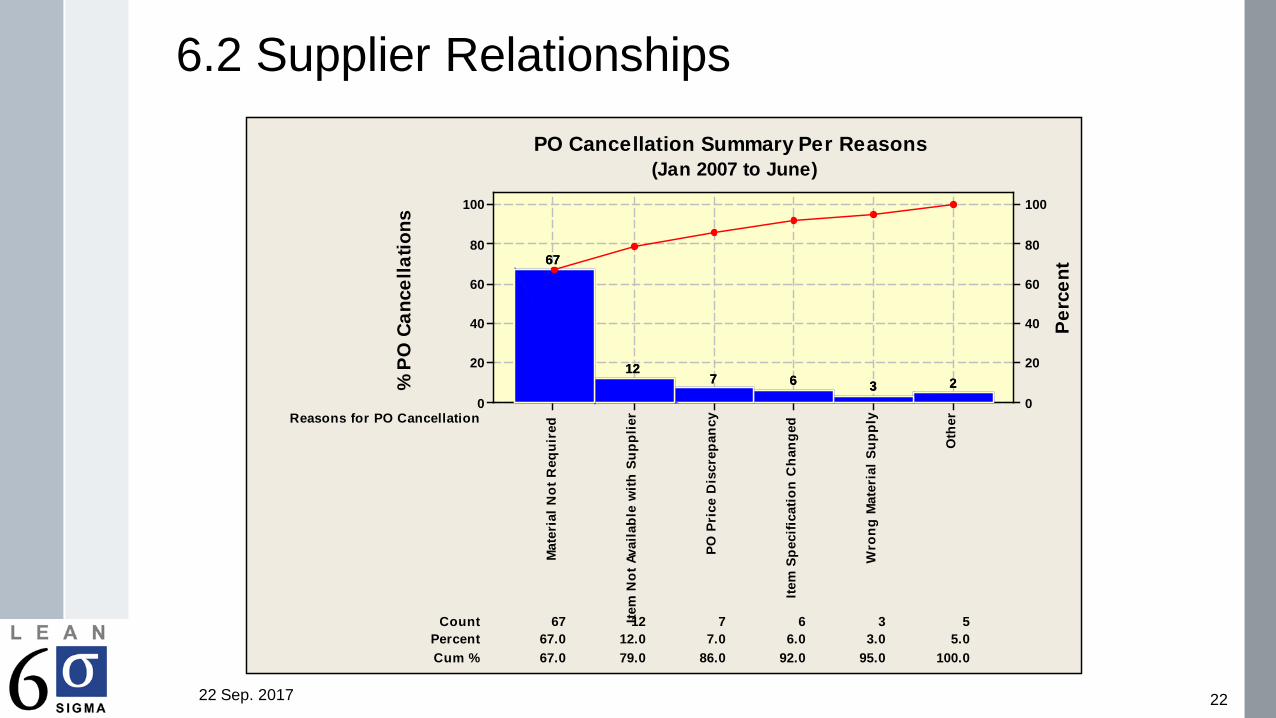
PO Cancellation Summary Per Reasons(Jan 2007 to June)
6.2 Supplier Relationships
22

22 Sep. 2017
Results
23

22 Sep. 2017
Goal: Percentage COD Payments <10%
Primary Metric
Week of Month 2007
Perc
enta
ge C
OD
on W
eekl
y Pr
ocur
emen
t
2nd Week A
ug'07
1st Week
Aug'07
4th Week
July'07
3rd Wee
k July'0
7
2nd W
eek J
ul y'07
1st Wee
k Jul y
'07
4th Week J
une'07
3rd Week J
une'07
2nd W
eek June'07
1st Week J
une'07
4th Week M
ay'07
3rd Week M
ay'07
2nd Week M
ay'07
1st W
eek May'0
7
4th W
eek A
pr'07
3rd W
eek A
pr'07
2nd Week
Apr'
07
1st Week
Apr'0
7
4th W
eek M
ar'07
3rd W
eek M
ar'07
2nd W
eek M
ar'07
1st Wee
k Mar'0
7
4th Week F
eb'07
3rd Week F
eb'07
2nd Week F
eb'07
1st Week F
eb'07
4t h W
eek Jan'07
3rd W
eek Jan'0
7
2nd Week
Jan'07
1st Week
Jan'07
40
30
20
10
0
2110
5
0114
0.34
21
8
1
656
27
13
5
12
21
41
32
6
35
3
12
Weekly COD Payment Trend (%COD)(Jan 2007 To Present)
GoalPrimary Metric: % COD Payments < 10%
24

22 Sep. 2017
Primary Metric
Week of Month 2007
COD
Amou
nt (T
hous
ands
)
2nd W
eek A
ug'0
7
1st W
eek A
ug'07
4th W
eek Ju
ly'07
3rd W
eek Ju
ly'07
2nd W
eek Ju
ly'07
1st W
eek Ju
ly'07
4th W
eek J
une'0
7
3rd W
eek J
une'0
7
2nd W
eek J
une'0
7
1st W
eek J
une'0
7
4th W
eek May
'07
3rd W
eek May
'07
2nd W
eek May
'07
1st W
eek May
'07
4th W
eek A
pr'07
3rd W
eek A
pr'07
2nd W
eek A
pr'07
1st W
eek A
pr '07
4th W
eek M
ar'07
3rd W
eek M
ar'07
2nd W
eek M
ar'07
1st W
eek M
ar'07
4th W
eek F
eb'07
3rd W
eek F
eb'0
7
2nd W
eek F
eb'0
7
1st W
eek F
eb'07
4th W
eek J
an'07
3rd W
eek J
an'07
2nd W
eek J
an'07
1st W
eek J
an'07
900
800
700
600
500
400
300
200
100
023K18K13K5K
108K
3K12K12K
92K
4K
91K
18K10K
166K
23K42K37K86K
717K
260K
46K
269K
780K
23K10K
437K
85K
35K22K52K
Weekly COD Payment Trend (COD in KWD Value)(Jan 2007 To Present)
25
22 Sep. 2017
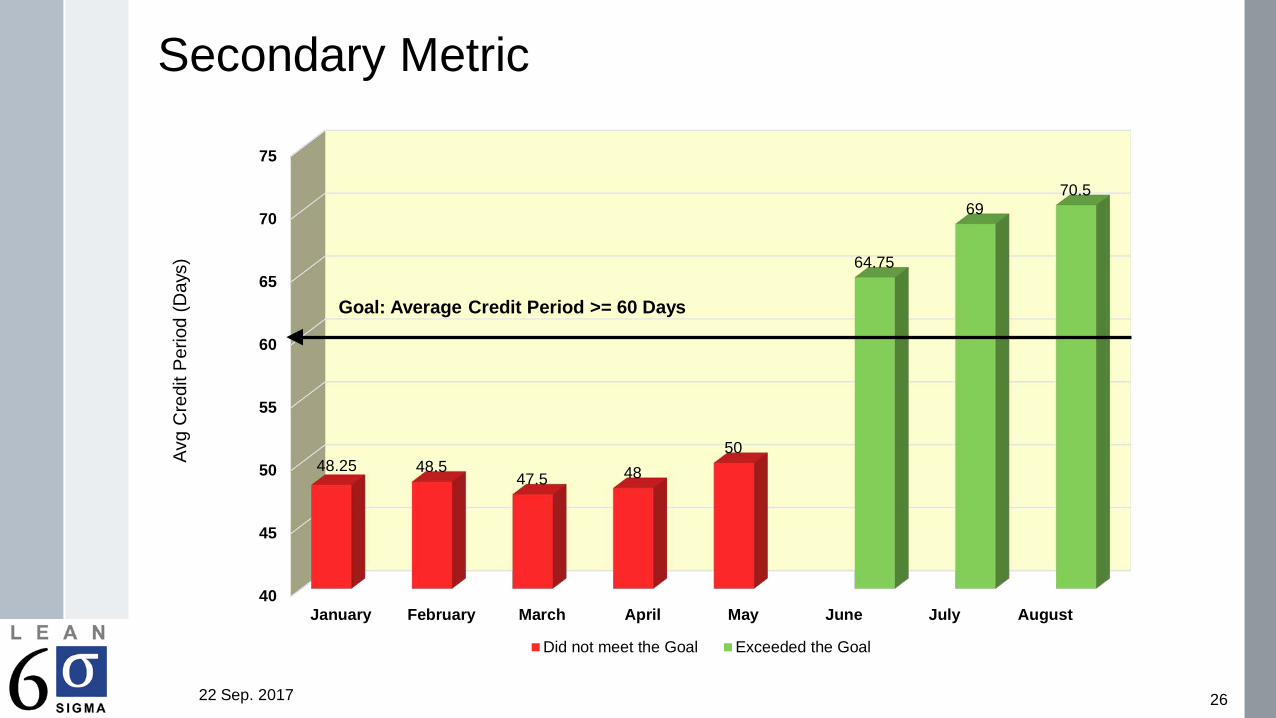
Secondary Metric
40
45
50
55
60
65
70
75
January February March April May June July August
48.25 48.5 47.5 48
50
64.75
69 70.5
Did not meet the Goal Exceeded the Goal
Avg
Cre
dit P
erio
d (D
ays)
26
Goal: Average Credit Period >= 60 Days

22 Sep. 2017
Week of Month 2007
Avg
Cred
it/LP
O
2nd W
eek A
ug'07
3rd W
eek J
uly'07
4th W
eek J
une'0
7
1st W
eek J
une'0
7
2nd W
eek M
ay'07
3rd W
eek A
pr'07
4th W
eek M
ar'07
1st W
eek M
ar'07
2nd W
eek F
eb'07
3rd W
eek J
an'07
75
70
65
60
55
50
45
72
69
71
696969
676768
59
55
51
4847
49
474848
4647
48494949
484847
50
47
49
(Jan 2007 to Present)
Time Series Plot of Avg Credit/ LPO
Goal Avg. Credit Period >= 60 Days
Weekly Average Credit/ LPO
27

22 Sep. 2017
Week of Month 2007
Valu
e in
Sav
ings
(Tho
usan
ds K
WD)
2nd W
eek Au
g'07
3rd W
eek July'07
4th W
eek Ju
n e'07
1st W
eek J
une'07
2nd Wee
k May
'07
3rd W
eek Ap
r'07
4th W
eek M
ar'07
1st W
eek M
ar'07
2nd Wee
k Feb
'07
3rd W
eek Ja
n'07
0.8
0.7
0.6
0.5
0.4
0.3
0.2
0.1
0.0
570K
548K
520K
0.49
9
461K
428K
404K
378K
365K
327K
312K
285K
271K
250K
229K
204K
197K
188K
173K
152K
132K
123K
101K
67K
59K
47K
36K
21K
13K
5K
(Jan 2007 to Present)
Time Series Plot of Savings on Credit
Goal.5 Million KWD
Weekly Cumulative Savings on Credit Terms
28

22 Sep. 2017
How to sustain and improve the results? Procurement:
1. Develop and implement a checklist to monitor the negotiation process.
2. Maintain a log (by storekeeper) to monitor the receipt of LPOs on site prior to material receipt.
Material Control:
1. Discuss with IT to amend the software generated Material Receipt Voucher (MRV) form to reflect the “Actual Date of Receipt” entered in the system.
2. MRVs to be prepared & submitted to Finance Department within 2 days from the date of material receipt at stores.
3. Establish and implement a system for continuously monitoring delays in MRV preparation.
4. Add delays in MRV preparation as a KPI in the performance of the Material Control Unit.
29

22 Sep. 2017
How to sustain and improve the results? Finance:
1. Calculate the “Effective Due Date” of payment from the actual date of material receipt at stores.
2. Consider bi-weekly payment processing cycle instead of monthly payment cycle (25th of every month).
Operations: 1. Enhance day to day material planning to achieve Negotiation Leverage.
2. Reduce frequent PO cancellations to avoid conflicts with Suppliers. 3. Ensure timely completion of Material Inspection. 4. Instruct respective Project staff not to collect Supplier invoices at Project site.
Six Sigma: 1. Training of Senior Management (Champions Training) 2. Implement Six Sigma concept in selective areas of concern across the company for
continuous improvement.
30

22 Sep. 2017
Questions?
31