six strategies beating brazil - boston consulting group · leading advisor on business strategy. we...
TRANSCRIPT

Six Strategies for Beating Brazil’s Supply Chain Complexities

The Boston Consulting Group (BCG) is a global management consulting firm and the world’s leading advisor on business strategy. We partner with clients from the private, public, and not-for-profit sectors in all regions to identify their highest-value opportunities, address their most critical challenges, and transform their enterprises. Our customized approach combines deep in sight into the dynamics of companies and markets with close collaboration at all levels of the client organization. This ensures that our clients achieve sustainable compet itive advantage, build more capable organizations, and secure lasting results. Founded in 1963, BCG is a private company with 85 offices in 48 countries. For more information, please visit bcg.com.
April 2017
Flávia Takey, Flávio Magalhães, Silvia Sonneveld, Douglas Woods, and Renato Basso
Six Strategies for Beating Brazil’s Supply Chain Complexities

2 Six Strategies for Beating Brazil’s Supply Chain Complexities
AT A GLANCE
Brazil is a tough environment in which to manage a consumer packaged goods (CPG) supply chain in ordinary times, and the recent political and economic upheaval has only exacerbated the difficulty. Top-performing CPG companies are willing to break the rules to overcome complexity.
Brazil’s Rugged Supply Chain LandscapeThe typical supply chain tradeoffs—such as aiming for economies of scale over service levels—don’t always work. Brazil’s geographic expanse and widespread population fuel channel fragmentation. Taxes are high and tax policies are complex and volatile, so tax considerations often drive key supply chain decisions. For many products, demand is heavily concentrated at the end of the month, creating havoc with inventory and warehouse capacity and pushing up transportation costs.
Six StrategiesSix strategies, when applied holistically, can help companies achieve supply chain success in Brazil: seek portfolio simplicity, segment the supply chain, gain agility by integrating the sales and operations planning process, make the supply chain more flexible, collaborate to generate added value, and stay focused on operational excellence.

The Boston Consulting Group 3
As the world’s fifth largest country (in geographic size and population), Brazil is a vital playing field for consumer packaged goods (CPG) companies.
Its explosive economic growth over the past few decades catapulted the country into the ranks of the world’s ten largest consumer markets. But operating in Brazil is not for the faint-hearted. And that’s not only because of the country’s recent economic and political upheaval; even at the best of times, Brazil is a tough envi-ronment in which to manage a CPG supply chain, for a variety of reasons— geographic, structural, and practical.
BCG benchmarked the 17 leading CPG companies in Brazil—local entities as well as multinationals. (See the sidebar “About the Study.”) The ways in which compa-nies operating there cope with supply chain complexity range as widely as their performance. Consider the gamut of results in these key performance metrics:
• Inventory levels vary from 10 days to 141 days (that is, they vary by a factor of 14).
• Warehousing costs range from as little as $0.11 per case to $4.28 per case (a factor of 40).
• Transportation costs run anywhere from $49.25 per ton to $1,665.50 per ton (a factor of 34).
• Customer cycle times range from 1 day to 14 days (a factor of 14).
• Case fill rates vary from 85% to 99.6% (roughly 15 percentage points).
Clearly, the impressive results that some companies achieve prove that difficult op-erating conditions need not constrain performance.
As part of our study, we sought to understand the strategies and initiatives that made the difference for the top performers. All of the leaders shared one trait: the willingness to depart from conventional supply chain practice, sometimes in counterintuitive ways. Our findings reveal that successful industry executives focus their efforts on breaking the rules to overcome the complexities and thereby apply their resources and competitive strengths to greater advantage. We identified a wide variety of workarounds, including novel distribution strategies, tactics for creating virtual scale, and ways to adapt network optimization to fluctuations in tax rates.
Leaders share one trait: the willingness to depart from conventional supply chain practice—sometimes in counterintuitive ways.
4 Six Strategies for Beating Brazil’s Supply Chain Complexities
Considering the practices we uncovered, as well as our work with clients, we have formulated a set of six strategies for supply chain success in Brazil: seek portfolio simplicity, segment the supply chain, gain agility by integrating the sales and opera-tions planning process, make the supply chain more flexible, collaborate to gener-ate added value, and stay focused on operational excellence.
Brazil’s Rugged Supply Chain LandscapeTraditional supply chain management involves several fairly standard tradeoffs. Achieving economies of scale in transportation costs generally means sacrificing service, for example, and direct store delivery ensures higher service levels but drives up transportation costs. True supply chain winners are those capable of breaking these standard tradeoffs with unconventional approaches. This certainly holds true in Brazil, except that winning there is particularly challenging, for three major reasons:
• Brazil’s geographic expanse and widespread population mean that the distribu-tion of goods is fragmented across many channels.
• Taxes are high relative to logistics costs, and tax policies are complex and volatile. Companies often make taxes the determining factor in key supply chain decisions.
BCG’s Supply Chain Benchmarking for Consumer Packaged Goods in Brazil followed the quantitative approach used in the firm’s study of the US market that has been con-ducted in partnership with the Grocery Manufacturers Association (GMA) since 2012.
Seven of our 17 participants also participated in the most recent US study, the 2015 BCG/GMA Supply Chain Benchmarking Study, and more than half are multinationals. Our sample encompassed 28 distinct cate-gories within the food and beverage, beauty and personal care, and home care segments and ranged from category leaders to recent market entrants. The diversity of our sample allowed comparisons between compa-nies with wide-ranging revenues (from about $4.75 million to $3.56 billion in
gross sales), diverse go-to-market strategies, and different outbound supply chain models (such as whole-sale, direct store delivery, and direct sale).
We examined major outbound supply chain management processes during the period July 2014 to June 2015, including sales and operations planning, primary (plant-to-warehouse) and secondary (warehouse-to-store) transportation, and warehousing. To obtain a meaningful comparison of the most important cost and service KPIs, we ensured that metrics matched and, where necessary, we normalized the data. In addition to a survey, we conducted in-depth interviews with senior operations executives at the participating companies to gain deeper insights into their challenges, practices, and solutions.
ABOUT THE STUDY

The Boston Consulting Group 5
• Demand for many products is concentrated in the last week of the month. This causes havoc with inventory and warehouse capacity and drives up transporta-tion costs.
These complexities combine to pose challenges that are unlike those found in any other market, developed or developing.
Geography makes fragmentation high and scale elusive. Brazil’s sheer size com-pounds logistical complexity. Providing coverage to remote locales makes fragmen-tation across channels unavoidable.
Unlike in most major markets, large retail outlets are not the main sales channel for beauty and personal care products in Brazil. More than 4.5 million sales representa-tives cover this segment. In fact companies use the direct-sales channel for these categories more in Brazil than in any other key market in the world; direct sales ac-counts for 26% of sales in Brazil versus 13% in China, 7% in the US, and 3% in West-ern Europe. (See Exhibit 1.) Another striking difference between most major mar-kets and Brazil relates to the sale of food and beverage products; in Brazil, they are sold predominantly through independent retailers (such as mom-and-pop outlets and local grocery chains with a small number of stores), which account for about
36
5342
51
18
9
189
17
1525
8
267
13
716
9
40
60
0
20
100
80
22
Brazil Western EuropeUSChina
53
63% of retail sales by value
Other channelsInternet retail salesDirect salesDrugstore salesSpecialist retailer salesCash and carry store, hypermarket, and supermarket
EXAMPLEIN BRAZIL, THE SALE OF BEAUTY AND PERSONAL CARE PRODUCTS DEPENDS MUCH MORE ON
THE DIRECTSALES CHANNEL THAN ON THE AUTOSERVICE CHANNEL
Sources: Euromonitor, BCG analysis.Note: Because of rounding, not all percentages total 100%.
Exhibit 1 | The Mix of Sales Channels in Brazil Is Distinct from That in Other Key Markets

6 Six Strategies for Beating Brazil’s Supply Chain Complexities
40% of total revenue. Overall, the top three retailers in Brazil account for just 17% of total food and beverage revenue, while in the US, the top three retailers com-mand about 45% of the total. (See Exhibit 2.) And the difference between Brazil and other major emerging markets is equally stark: large retailers (hypermarkets, supermarkets, and big-box stores) represent a smaller share of food and beverage revenue in Brazil than in countries like China and India.
Selling in a fragmented market requires higher service levels and shorter order-to-delivery cycles—in other words, overall agility. Consider beauty and personal care, where direct sales and direct store delivery predominate. Direct-sales reps work on a presale model with no inventory, which means that service and agility are the basis of their competitive advantage. For all kinds of products, small outlets (such as mom-and-pop stores and drugstores) carry limited inventory and have limited working capital, so they run a greater risk of being out of stock on items than large retailers. (When they are not served well, they often have no choice but to switch to other brands in order to keep their shelves stocked.)
As a result, costs and inventory levels are higher for CPGs that sell mostly through direct sales or direct store delivery. For instance, the costs for beauty and personal care companies that sell via direct sales are 3.7 times higher than those for compa-nies that sell through traditional channels such as hypermarkets and supermarkets. Such companies also typically require 1.5 times more inventory.
61%
100%
1%
0%
14%
19%
4%
33%
48%
100%
13%
2%
1%
2%
Conveniencestores
Drugstores
Direct sales1
Bakeries
Cash and carrystores2
Hypermarketsand
supermarkets
TOTAL
7.3
28
4,500
63
1K
30.9
41.3
20,200
NA
84.5
1.6
21.2
The top threerepresent
~17% of the total
The top threerepresent
~45% of the total
OutletNumber of
outlets(thousands)
Number ofoutlets
(thousands)
PERCENTAGE OF SALES IN 2015, BY TYPE OF OUTLETBRAZIL VERSUS US
Sources: Planet Retail; Abras; Abrafarma; Abihpec; QiuntilesIMS; Sindicom; Abad; Associação da Indústria de Panificação e Confeitaria do Estado de São Paulo; Direct Selling Association; BCG analysis. Note: NA = not available. Because of rounding, not all percentages total 100%.1Number of individual sales representatives.2Cash and carry is a retail format similar to wholesale for individual shoppers.
Exhibit 2 | Unlike their US Peers, Brazil’s Big Retailers Do Not Dominate in Food and Beverage Sales

The Boston Consulting Group 7
Moreover, because Brazil’s high degree of fragmentation makes economies of scale hard to achieve through sales channels, CPG companies must find economies else-where. By increasing the density of distribution points, they are able to contain sec-ondary transportation costs. Yet even where scale is possible, it’s not necessarily beneficial. In most markets, scale helps contain plant-to-warehouse (primary) trans-portation costs, but not in Brazil. That’s because tax complexity trumps economies of scale. Companies must adopt workarounds to circumvent tax complexity; specifi-cally, the shortest distance between two points can mean incurring more in-state taxes than a less direct route.
Taxes are high and complex, and subsidies are ever changing. Taxes disproportion-ately influence network optimization in Brazil, for a few reasons. Taxes represent a much higher share of costs than logistics; for the companies in our sample, taxes account for roughly 17% of gross sales, and logistics costs account for about 7% of sales. (See Exhibit 3.) Moreover, tax regimes are extremely complex and subsidies are volatile, so network optimization is often counterintuitive and short-lived.
Each of Brazil’s 26 states has its own tax structure, which varies not only by catego-ry of goods but also by origin and destination. For instance, a company in São Paulo shipping its product to Rio de Janeiro would pay about 12% in value-added tax (VAT). But if the destination state was Goiás, the tax would be only 7%.
Sales tax rates are also volatile, in part because they represent one of the most im-portant revenue sources for the state governments. As recently as 2015, 20 states raised the VATs and excise taxes on at least ten CPG categories. Indeed, in the cur-rent economy, governments are straining harder than ever to raise taxes.
7
0
10
20
30
40
Sales taxes(% of sales)Average: 17%
3
Total costs (% of gross sales)
Logistics costs(% of sales)Average: 7%
Logistics costs1Sales taxesRespondents
212330
2831
25
9 3
11
15
116
1714141718
1520182319
674
78
14
710
3
14
8
13
47766
94
74
8
Sources: BCG’s 2015 Supply Chain Benchmarking Study of Consumer Packaged Goods in Brazil; BCG analysis. Note: Three of the 17 participating companies are excluded here because they chose not to provide revenue information.1Logistics costs include primary and secondary transportation and warehousing costs.
Exhibit 3 | Sales Taxes Exceed Logistics Costs—and Often Drive Decisions
8 Six Strategies for Beating Brazil’s Supply Chain Complexities
The complexity of the Brazilian tax system also makes it possible for state govern-ments to engage in fiscal wars to lure large manufacturers to their states. Because each state can negotiate tax concessions, every company needs to consider its tax liability and what that liability means for its costs. Our study found that for the largest CPG companies, tax concessions have become a prerequisite for operating in Brazil. Clearly, some companies have been able to negotiate better subsidies on tax rates than others. We analyzed effective (actual) versus standard tax rates for a bas-ket of representative consumer products in São Paulo—the locus of most consumer demand—and found that most CPG companies have managed to negotiate lower- than-standard rates. They do so by promising to bring jobs, new infrastructure, and overall economic activity to the area. Beyond the cost implications, though, is an-other issue: tax considerations, which complicate network design. To minimize their tax bills, CPG companies often forsake efficiency in network design, which, of course, prevents them from fully leveraging scale in primary transportation and warehousing. For example, one company in the study ships all of its goods from its São Paulo plant to its Minas Gerais distribution center before delivering them to customers back in São Paulo, adding an extra 370 miles and six to seven hours to the trip. Another built a plant in the northeast primarily to supply Brazil’s south-eastern and southern markets, making delivery routes as long as 1,200 miles.
Frequent changes to subsidies on tax rates and tax complexity make network opti-mization a more frequent exercise for CPG companies; 75% of our study partici-pants have redesigned their network at least once in the past five years, and 20% carried out more than three redesigns during the same period.
Demand is concentrated at the end of the month. Several CPG companies report-ed that 40% or more of their monthly sales to retailers and distributors occur at the end of the month. This phenomenon stems largely from the incentives that companies offer their salespeople to meet monthly targets. The growing pressure to meet monthly targets in a recessionary economy incentivizes sales teams to offer aggressive discounts to their customers at the end of the month; customers consequently reserve their demand for goods to take advantage of this beneficial time frame. This end-of-the-month squeeze is exacerbated by roughly three de-cades of consumer habit: the extreme inflation of the 1980s prompted consumers to stock up in the first week of the month, as soon as they received their monthly paycheck. Even though inflation has long since been tamed (10.7% in 2015, 6.3% in 2016), the behavior is ingrained and has resurged somewhat during the recent economic crisis. So, retailers and distributors rush to fill inventory in preparation for the new month. The high degree of retail fragmentation makes it hard for CPG companies to coordinate incentives and work with retailers to smooth out demand.
Such extreme demand concentration, of course, creates a challenge for supply chain managers. To guarantee high product availability in this period, companies end up being saddled with excess inventory, wide fluctuations in warehouse capacity utilization, and high transportation costs. (See Exhibit 4.) Their transportation partners must maintain larger fleets that can meet end-of-the-month demand but that sit idle much of the remaining time. Partners also incur additional costs associated with overnight fees and return trips because of retailers’ warehouse capacity constraints.
To minimize their tax bills, CPG
companies often forsake efficiency in
network design.

The Boston Consulting Group 9
Voices from the Survey: How Respondents Are Coping with the Obstacles A number of the companies participating in our study have proven to be resource-ful in coping with Brazil’s unique supply chain challenges. They revealed their tech-niques to us.
Overcoming Scale Limitations. Here’s what some respondents are currently doing to address the scale limitations created by geographic distance and channel fragmentation:
• They rethink their go-to-market model. One direct sales company expanded its network of distribution centers, strategically locating them to establish a pickup system for more than half of its representatives. Some of these centers are in areas that are costly to serve (such as the favelas, or slums, of large metropolitan areas). Customers receive a discount on the final price along with dramatically faster delivery times. This new model has also simplified secondary transportation. Another company leverages its network of retail stores as additional storage locations for its direct sales channel (home delivery accounts), allowing the two parties to split the margin. This strategy balances incentives fairly between the stores and the sales representatives, and it relieves sales reps of the burden of carrying inventory.
• They invest in operational-excellence programs with transportation partners. A small food company implemented an operational-excellence program focused on small and midsize transportation partners. The program not only ensures full truckloads for those small entities—thus maximizing their operational efficiency—but also grants them a negotiating advantage.
% of sales per week
Week 5
24
Week 4
39
Week 3
21
Week 2
11
Week 1
5
80
75
0
90
85
% of capacity utilization per day
88
Average:81%
77
Days of the month
63% OF MONTHLY SALES OCCUR IN THE LASTTWO WEEKS OF THE MONTH …
… CAUSING CAPACITY UTILIZATION TO VARY BY 10 PERCENTAGEPOINTS WITHIN A MONTH
Sources: BCG’s 2015 Supply Chain Benchmarking Study of Consumer Packaged Goods in Brazil; BCG analysis.
Exhibit 4 | The Flurry of Sales at Month’s End Wreaks Havoc on Capacity Utilization
10 Six Strategies for Beating Brazil’s Supply Chain Complexities
• They create virtual scale. Two food companies with complementary product portfolios whose factories and distribution centers were located nearby joined forces to share a transportation network. They realized scale benefits by consolidating cargo volume and negotiating collectively with the service provider. In another example, a small, direct-sales-based company selects transportation providers that are already serving product segment leaders. In Brazil, direct-sales representatives often handle multiple brands; in this case, the smaller company piggybacks on segment leaders’ volumes to enjoy dramatical-ly lower transportation costs. (For more on creating virtual scale, see A Hard Road: Why CPG Companies Need a Strategic Approach to Transportation, BCG Focus, July 2015.)
Reducing Tax Complexity. Some companies optimize end-to-end supply chain costs by integrating tax mitigation and network optimization. One cosmetics company analyzes its network optimization process every six months, reassessing key vari-ables such as tax rates and demand forecasts so that it can, if necessary, adjust the areas that its distribution centers cover. In this way, it proactively hunts for improve-ment opportunities and is able to react swiftly to changes in taxation. The depart-ment tasked with this effort not only provides analytical expertise but also has helped to open up communications between the company’s legal and supply chain teams. The legal team can now better understand product cost structures and the implications of local regulations.
Combating the End-of-the-Month Crunch. Companies shared three ways of coping with the end-of-the-month demand crunch:
• They adjust customer discounts to smooth out demand. Some direct-sales-based companies stagger the closing dates of their product catalogs each month by region. This reduces the number of customers that wait until month’s end to be eligible for discounts, and it spreads out incentive target dates for sales- people. Other companies segment their customer base and offer special incen-tives to high-volume representatives in order to better anticipate the timing of reps’ orders.
• They provide end-to-end incentives to optimize margins. Some companies adopt end-to-end margin optimization tactics at both the commercial and the supply chain levels. They offer sales and shipping discounts to customers that buy earlier in the month. They also hold salespeople accountable for sales lost as a consequence of service-level shortcomings and the higher costs associated with concentrated demand.
• They enhance supply chain flexibility and agility. One company manages big swings in end-of-the-month demand by adopting a push-pull form of strategic planning enabled by its flexible manufacturing system. The company’s sales and operations planning (S&OP) system, which is well integrated with manufactur-ing, can forecast demand with a high degree of accuracy. This allows the compa-ny to coordinate production and the supply chain to adjust to demand fluctua-tions such as end-of-the-month spikes. In addition, the company ships a high volume of products directly from the plant. This centralizes inventory, thus
One company manages big swings in end-of-the-month
demand by adopting a push-pull form of strategic planning.
The Boston Consulting Group 11
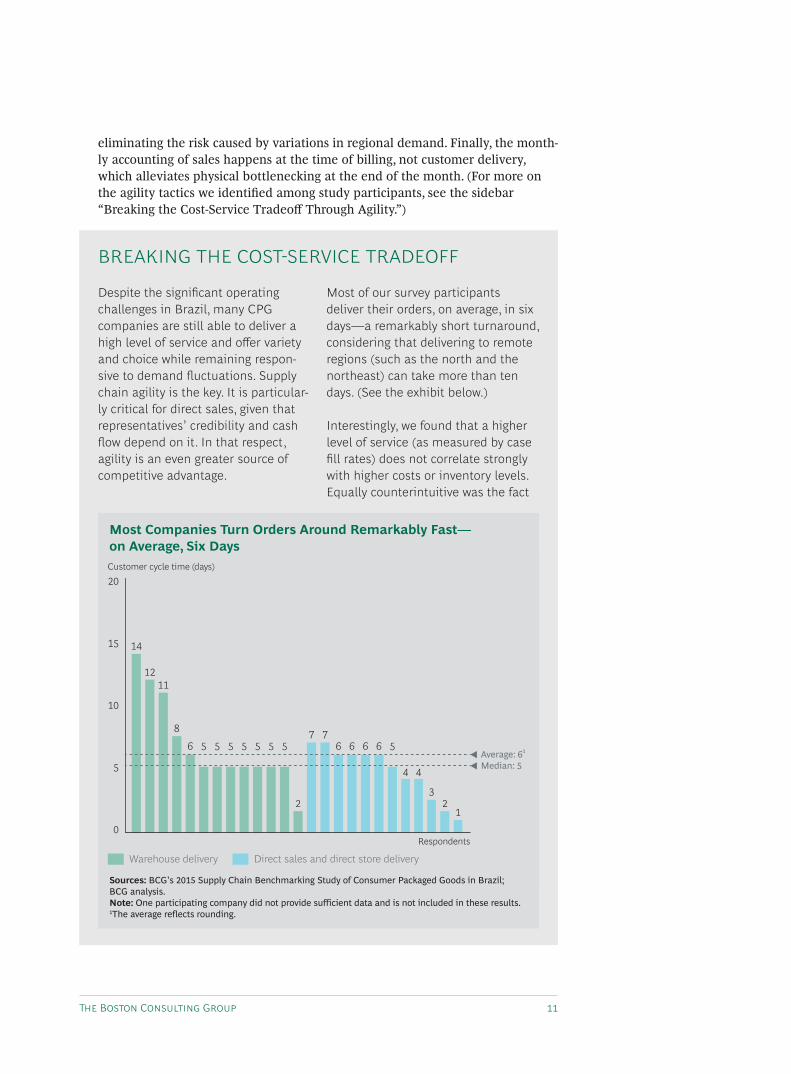
eliminating the risk caused by variations in regional demand. Finally, the month-ly accounting of sales happens at the time of billing, not customer delivery, which alleviates physical bottlenecking at the end of the month. (For more on the agility tactics we identified among study participants, see the sidebar “Breaking the Cost-Service Tradeoff Through Agility.”)
Despite the significant operating challenges in Brazil, many CPG companies are still able to deliver a high level of service and offer variety and choice while remaining respon-sive to demand fluctuations. Supply chain agility is the key. It is particular-ly critical for direct sales, given that representatives’ credibility and cash flow depend on it. In that respect, agility is an even greater source of competitive advantage.
Most of our survey participants deliver their orders, on average, in six days—a remarkably short turnaround, considering that delivering to remote regions (such as the north and the northeast) can take more than ten days. (See the exhibit below.)
Interestingly, we found that a higher level of service (as measured by case fill rates) does not correlate strongly with higher costs or inventory levels. Equally counterintuitive was the fact
14
1211
8
6 5 5 5 5 5 5 5
2
7 76 6 6 6 5
4 4
32
10
5
10
15
20Customer cycle time (days)
Respondents
Median: 5Average: 61
Warehouse delivery Direct sales and direct store delivery
Sources: BCG’s 2015 Supply Chain Benchmarking Study of Consumer Packaged Goods in Brazil; BCG analysis.Note: One participating company did not provide sufficient data and is not included in these results.1The average reflects rounding.
Most Companies Turn Orders Around Remarkably Fast— on Average, Six Days
BREAKING THE COST-SERVICE TRADEOFF
12 Six Strategies for Beating Brazil’s Supply Chain Complexities
Six Strategies for Supply Chain SuccessHigh-performing companies clearly demonstrate ingenuity in Brazil’s tough operat-ing environment. But even they can do better. Most of the 17 companies we stud-ied—high performers included—have room to streamline supply chain costs while improving service levels. For the total sample, we uncovered potential savings of 15% to 20% in total supply chain costs and 10% to 20% in inventory reduction.
Achieving sustainable supply chain success requires more than just applying indi-vidual tactics or strategies in isolation from core operating processes. This is espe-cially true amid a period of change, as Brazil is currently experiencing, during which leaders implement sweeping reforms to stabilize and strengthen the coun-try’s economy and political institutions.
Drawing on our study findings as well as our client experience, we have formulated a set of six tenets for supply chain success in Brazil. Applying any of them individu-ally can certainly yield advantages, but in combination, their effects can be power-ful and long lasting.
Seek portfolio simplicity. To offset the inherent complexities in the Brazilian mar- ket, companies must reduce portfolio complexity. This means more than just elim- inating SKU laggards. It also means redesigning or harmonizing the formulas and packaging of high-velocity items so that companies continue to offer the variety that customers need while reducing operational complexity. To be sure, some cat- egories demand more variety and innovation than others. But it is possible to limit variety to a level that is feasible for retailers to carry and yet satisfies consumers.
that in this market, high forecasting accuracy alone is not enough to keep inventories low.
How do we explain these results? The CPG companies in our study keep their portfolios simple. With fewer SKUs, less value-diluting new-product development, and fewer promotions, forecasting and inventory manage-ment become far less complicated. In addition, these companies seek agility in their S&OP processes.
One food company, for example, has instituted twice-weekly short-term forecast reviews, rather than relying solely on standard monthly forecast-
ing with a 12-month horizon. It has also tied forecasting to actual orders and updates from the commercial and manufacturing and sourcing teams, enabling it to sharpen supply- demand analysis and continually hone accuracy. Sales targets and manufacturing schedules are adjust-ed based on these periodic reviews. Finally, the company optimizes its manufacturing lines for low batches and fast changeovers so that it can react quickly to schedule changes.
BREAKING THE COST-SERVICE TRADEOFF(continued)

The Boston Consulting Group 13
The most effective way to achieve simplicity is to foster a holistic mindset that is shared by the sales and marketing and operations teams. Leaders need to encour-age both sides to work together to find the best solutions for the entire company. Together, the teams should establish a structured process for reviewing the current product portfolio, implementing changes in product formulations and packaging that reduce manufacturing and transportation costs and benefit the consumer. Ulti-mately, the teams can change the approach to product development to achieve sus-tainable results.
For example, supply chain and manufacturing teams can create standardized pack-age sizes or formats for R&D and marketing to choose from when designing new products. By standardizing, the company can still convey the same level of quality and variety to consumers, while avoiding major changes in existing lines and the costs and efforts associated with changeovers. BCG client experience worldwide shows that this strategy can yield up to 5% in top-line growth, along with 3% to 5% margins. (For more on portfolio simplicity, see “Less Can Be More for Product Port-folios: Attacking Complexity While Enhancing the Value of Diversity,” BCG article, August 2014.)
Segment the supply chain. Best-practice companies recognize that there is no one-size-fits-all supply chain configuration to serve a market with so many distribu-tion channels. Supply chains should therefore be segmented by customer type, order type, or product type or by any other grouping that makes business sense. Some food and beverage and cosmetics companies we studied segment their customers by postal code, selecting the best transportation mode from a wide variety of options that include motorcycles, minivans, long-haul trucks, and even boats. This approach requires a deep knowledge of the customer base and the ability to deal with multiple transportation providers. Another strategy involves segmenting by customer type or product category to differentiate service levels according to margin and volumes. Companies can then gain the ability to price differently, according to service level.
Any segmentation strategy should be governed by two goals: making the best use of assets and maximizing value creation for customers. In our client work, we have found that supply chain segmentation leads to greater forecasting accuracy (with improvements of 10% to 15%) and 10% to 30% less inventory waste.
It’s well established that high-margin, low-volume CPG companies can gain competitive advantage with service- and agility-focused supply chains, whereas low-margin, high-volume companies profit more by leveraging scale in a cost-efficient supply chain. But multicategory companies can realize big benefits by aligning supply chain strategy with the product category. Several larger companies in our study seek to optimize logistics costs and service for all product categories and customers, regardless of the category’s dynamics or the company’s competitive position. The result is less-than-optimal service and margins. In contrast, one multicategory participant has significantly improved service levels and trimmed costs by segmenting categories according to velocity and profitability level. For each category, the company defined service levels and the route to market required to meet those levels and minimize the total cost to serve. (For more on segmentation,
There is no one-size-fits-all supply chain configuration to serve a market with so many distribution channels. Instead, segment supply chains by customer type, order type, or product type or by any other grouping that makes business sense.

14 Six Strategies for Beating Brazil’s Supply Chain Complexities
see “Segmentation in the Consumer Supply Chain: One Size Does Not Fit All,” BCG article, December 2015.)
We believe that the need for supply chain segmentation will continue to grow as the Brazilian market evolves. BCG studies show that most of Brazil’s consumption growth over the next ten years will come from small to midsize towns in the na-tion’s interior. (See Capturing Retail Growth in Brazil’s Rising Interior, BCG Focus, April 2015.) This trend will also favor direct sales and e-commerce and cause fur-ther channel fragmentation. In addition, most CPG companies operating in Brazil are rethinking their go-to-market strategies with an omnichannel approach that in-cludes digital sales. Companies will have to adjust their supply chains, because the cost to serve direct-sales and digital channels for the less densely populated interior, based on current models, is too great.
Gain agility by integrating S&OP planning. With sales concentrated at the end of the month and demand patterns likely to become even more erratic, companies need more accurate demand forecasting. Equally important is an integrated, cross-func-tional S&OP process. By leveraging all the data they track—consumer demand, customer sales and inventories, real-time order flows, price changes, and promo-tions—companies can make the S&OP process more robust. The use of analytics can increase forecast accuracy by 10% to 15%. Big data can also boost S&OP agility; companies can immediately factor new developments into forecasts and conduct more frequent reviews that enable a more timely response to changing conditions.
Greater forecasting accuracy will not necessarily lead to higher service levels or lower inventories. The forecast in itself is merely a decision-making tool. But with-out a structured process and governance to coordinate the entire supply chain—from manufacturing and logistics to sales—forecasting can easily miss important in-puts. An integrated approach helps companies respond more nimbly to demand fluctuations and maintain their desired inventory and service levels.
Make the supply chain more flexible. A more agile S&OP process requires a flexible supply chain. Manufacturing, for instance, should seek opportunities for product line segmentation to optimize production, whether for product variety and fast changeovers, late manufacturing, different inventory policies that ensure safety stocks in central hubs, or other such needs. A flexible supply chain also calls for close coordination with transportation providers, to allow companies to expand and contract capacity in response to demand fluctuations.
Collaborate to generate added value. CPG companies should consider three ways of collaborating that can unlock added value in supply chains:
• Collaborating with Retailers Beyond Just the Largest Key Accounts. Throughout the world, CPG companies have realized considerable value by collaborating with their key customers: developing joint business plans for automated ordering, partnering in demand and sales forecasting, and adopting integrated systems for more transparent inventory management. Brazil’s grocery sector provides an example: The top three grocery retailers account for about 17% of the market. To take advantage of the collaboration strategy, CPG compa-
Throughout the world, CPG companies have realized considerable
value by collaborating with key customers.

The Boston Consulting Group 15
nies need to extend their partnerships to the midtier regional chains that dominate the regional (state) markets. Doing so, of course, means adapting traditional models of collaboration so that they are cost effective and easily replicated.
• Forging Partnerships with Industry Peers. Peer partnerships are one way to build virtual scale in transportation and warehousing—with certain precondi-tions. Companies must partner only with peers whose product categories are noncompetitive yet compatible and with which no regulatory restrictions would arise (such as transporting food and cleaning products in the same truck). Partners should also have similar go-to-market models. Once they’ve established their compatibility, companies must negotiate the structure and terms of their partnership, defining roles and responsibilities and quantifying the investment requirements and benefits. Finally, both sides must be able to deliver top performance without disrupting each other’s operations.
• Teaming Up with Third-Party Logistics Providers. Most of the participants in our study use third-party transportation and warehouse services. There is no clear performance gain in doing so, but in a volatile market, using third-party providers gives CPG companies flexibility and eases the burden of asset owner-ship. Beyond these benefits, though, deeper partnership—such as developing lean capabilities in warehousing processes and implementing joint improvement projects—can generate tangible value.
Stay focused on operational excellence. Cost efficiency is a fundamental require-ment for any CPG supply chain, especially when operating in a recessionary market. None of the other five tenets can be applied without sound, reliable operations. Companies need to remain focused on operational excellence, by implementing lean principles not only in manufacturing but also throughout the entire spectrum of supply chain processes. (Companies can achieve this by, for example, concentrating delivery points where there are many small orders, to allow for more efficient truck routes and higher load factors.)
However, as the operating environment—everywhere, not just in Brazil—grows increasingly complex, lean methods can deliver only so much. To attain the next level of supply chain performance improvements, companies need to embrace big data and advanced analytics. By doing so, companies can visualize delivery routes, simplify distribution networks, and even pinpoint future demand. Big data and ana-lytics can also help companies better utilize assets, carry out preventive mainte-nance, and conduct near-real-time supply planning. (See “Making Big Data Work: Supply Chain Management,” BCG article, January 2015.)
In good times, Brazil’s operating environment presents unique supply chain chal-lenges. As the country continues to grapple with an ailing economy and political
turbulence, these challenges are even more daunting. The government’s recently announced Investment Partnership Program, designed to attract private-sector in-vestment in infrastructure development, is certainly a positive sign, but dramatic improvements will take time.
Lean methods can deliver only so much.To attain next-level supply chain perfor-mance improvements, companies need to embrace big data and advanced analytics.

16 Six Strategies for Beating Brazil’s Supply Chain Complexities
Each of the six tenets of supply chain success, from portfolio simplicity to opera-tional excellence, suggests that a wealth of opportunities are available to offset Bra-zil’s inherent market obstacles and companies’ own handicaps. These practices can help CPG companies of all sizes achieve higher levels of service without hurting profitability. And those that can weather Brazil’s turbulent times will be better poised to win market share and more consumer goodwill over the long run.

The Boston Consulting Group 17
AppendixThe following tables provide further survey results, broken out by participants’ means of distribution (warehouse delivery versus direct sales or direct store delivery). The data include supply chain characteristics, performance, costs, and complexity management and network design.
Source: BCG’s 2015 Supply Chain Benchmarking Study of Consumer Packaged Goods in Brazil.
table 2 | Supply Chain Performance
Warehouse Delivery Direct Sales and Direct Store Delivery
Topic Metric First
Quartile Median Third
Quartile Average First
Quartile Median Third
Quartile Average
Service level Case fill rate (%) 90.0 95.0 97.0 93.6 97.7 98.6 99.1 97.8
Service level Ontime delivery (scheduled arrival time, or SAT) (%)
94.0 94.5 95.3 94.8 93.2 96.9 97.0 94.7
Service level Customer cycle time (days) 4.8 5.2 7.6 6.7 3.6 5.3 6.1 4.8
Warehousing Cases picked (per man hours) 151.1 243.3 253.0 209.3 9.7 33.2 539.5 256.2
Warehousing Loose cases picked (%) 4.3 28.0 30.0 23.0 100.0 100.0 100.0 88.3
Warehousing Average capacity utilization (%) 71.5 76.0 87.6 77.6 70.5 79.0 84.5 78.2
Inventory Days inventory on hand 19.9 28.0 38.6 36.2 81.5 97.2 103.6 97.1
Inventory Days forward coverage 18.3 27.3 43.0 32.0 40.0 51.3 76.0 60.8
S&OP National monthly forecast accuracy (%) 64.0 69.0 79.3 68.9 60.7 70.1 79.7 70.0
Source: BCG’s 2015 Supply Chain Benchmarking Study of Consumer Packaged Goods in Brazil.
table 1 | Supply Chain Profile
Warehouse Delivery Direct Sales and Direct Store Delivery
MetricFirst
Quartile MedianThird
Quartile AverageFirst
Quartile MedianThird
Quartile Average
Number of plants owned 1.0 2.0 3.0 2.4 2.0 2.0 6.0 4.2
Number of copackers 1.0 2.0 5.0 4.0 5.0 7.0 14.0 12.7
Number of plants 2.0 3.0 6.3 4.8 5.5 8.0 15.8 12.7
Number of distribution centers (DCs) owned 2.0 2.0 3.5 2.5 2.0 3.0 4.0 5.9
Number of third-party logistics (3PL) DCs 3.0 4.0 6.0 4.3 2.0 7.0 13.0 8.4
Number of DCs 3.0 4.0 8.0 5.5 2.8 4.0 10.8 8.9
Number of outlets served 701.0 1,691.0 3,480.0 2,497.1 38,881.0 265,524.0 907,696.5 547,807.0
Number of distributors 39.0 55.0 138.5 103.5 8.3 15.5 22.8 15.5

18 Six Strategies for Beating Brazil’s Supply Chain Complexities
Source: BCG’s 2015 Supply Chain Benchmarking Study of Consumer Packaged Goods in Brazil.
Source: BCG’s 2015 Supply Chain Benchmarking Study of Consumer Packaged Goods in Brazil.1Percentage of SKUs launched in the 12 months ending in June 2015.
table 3 | Supply Chain Costs
table 4 | Complexity Management and Network Design
Warehouse Delivery Direct Sales and Direct Store Delivery
MetricFirst
Quartile MedianThird
Quartile AverageFirst
Quartile MedianThird
Quartile Average
Primary transportation costs (% of sales) 0.5 1.2 1.6 1.3 0.5 0.9 1.2 0.9
Secondary transportation costs (% of sales) 2.8 3.1 4.3 3.6 1.6 3.4 5.2 3.6
Warehousing transporta-tion costs (% of sales) 1.1 1.9 2.5 1.9 2.1 2.8 3.5 3.3
Sales taxes (% of sales) 10.9 14.9 17.7 14.6 15.7 22.5 26.3 19.8
Transportation costs (% of sales) 3.5 4.5 5.7 4.8 2.9 4.6 5.9 4.6
Total supply chain costs (% of sales) 5.7 6.4 7.5 6.7 4.9 7.5 8.9 7.9
Primary transportation costs/ton (R$) 89.1 154.6 237.0 168.7 103.5 157.7 196.3 167.2
Secondary transportation costs/ton (R$) 367.3 546.7 838.4 674.0 233.1 1,089.20 2,977.76 1,965.36
Warehousing costs/ton (R$) 123.7 219.0 375.9 316.1 310.6 1,247.84 2,377.29 2,250.76
Total transportation costs/ton (R$) 509.4 715.0 986.4 802.2 475.9 1,519.14 3,122.30 2,208.20
Total supply chain costs/ton (R$) 720.0 928.0 1,301.14 1,118.27 749.2 1,942.27 5,919.48 4,468.60
Warehouse Delivery Direct Sales and Direct Store Delivery
Topic Metric First
Quartile Median Third
Quartile Average First
Quartile Median Third
Quartile Average
Complexity reduction Number of SKUs 45.0 104.5 356.25 363.06 133.3 434.0 2,010.0 1,095.6
Complexity reduction Innovation rate (%)1 4.1 8.5 19.8 13.1 19.0 23.2 24.0 20.5
Network optimization
Number of times network was redesigned in past five years
2.0 2.0 3.0 2.45 1.0 1.0 2.0 1.7
The Boston Consulting Group 19
About the AuthorsFlávia Takey is a principal in the São Paulo office of The Boston Consulting Group and a core member of the Operations practice and the Consumer practice’s retail sector. She has worked extensively on supply chain issues for consumer packaged goods companies operating in Brazil. She has also advised US companies on category management and complexity reduction, demand forecasting, sales and operations planning, manufacturing strategy, and asset optimization and operational efficiency—generally in connection with large transformation programs. You may contact her by e-mail at [email protected].
Flávio Magalhães is a partner and managing director in the firm’s São Paulo office and the leader of the Operations practice in South America. His experience spans consumer goods, retail, industrial goods, and oil and gas topics, with a particular focus on lean methods, the supply chain, and procurement. He has guided a wide variety of strategic assessments and large transformation programs. You may contact him by e-mail at [email protected].
Silvia Sonneveld is a partner and managing director in BCG’s São Paulo office and the leader of BCG’s Consumer practice and its retail sector in Brazil. She is a core member of the firm’s Consumer and People & Organization practices and leads BCG’s Women’s Initiative in South America. Her expertise includes transformation in retail grocery, category management, pricing and promotion optimization, and joint value creation strategies between manufacturers and retailers. You may contact her by e-mail at [email protected].
Douglas Woods is a partner and managing director in the firm’s São Paulo office. He leads the firm’s Health Care practice in Brazil, is a core member of the Consumer and Strategy practices, and is a member of the People & Organization practice. His expertise spans growth strategies, consumer insight, go-to-market and channel design, marketing ROI, and organization. You may contact him by e-mail at [email protected].
Renato Basso is a project leader in BCG’s São Paulo office. A core member of the Operations practice in Brazil and South America, he is an expert on lean manufacturing and supply chain management in the consumer goods and process industries. You may contact him by e-mail at [email protected].
AcknowledgmentsThe authors offer their sincere thanks to their BCG colleagues Claudio Knizek, Eduardo Leone, Daniel Azevedo, Felipe Alves, Gustavo Cañas, Vanessa Barros, Ingrid Roehrs, Lucas De Brito, Mariana Ogawa, Julia Guarnieri, André Lebarbenchon, Anna Damico, Adriana Paranhos, and Kelli Gould for their contributions to this report. They also thank Jan Koch for her writing assistance and Katherine Andrews, Gary Callahan, Catherine Cuddihee, Kim Friedman, Abby Garland, and Sara Strassenreiter for their contributions to editing, design, and production.
For Further ContactIf you would like to discuss this report, please contact one of the authors.

To find the latest BCG content and register to receive e-alerts on this topic or others, please visit bcgperspectives.com.
Follow bcg.perspectives on Facebook and Twitter.
© The Boston Consulting Group, Inc. 2017. All rights reserved.4/17

Abu DhabiAmsterdamAthensAtlantaAucklandBangkokBarcelonaBeijingBerlinBogotáBostonBrusselsBudapestBuenos AiresCalgaryCanberraCasablancaChennai
ChicagoCologneCopenhagenDallasDenverDetroitDubaiDüsseldorfFrankfurtGenevaHamburgHelsinkiHo Chi Minh CityHong KongHoustonIstanbulJakartaJohannesburg
KievKuala LumpurLagosLimaLisbonLondonLos AngelesLuandaMadridMelbourneMexico CityMiamiMilanMinneapolisMonterreyMontréalMoscowMumbai
MunichNagoyaNew DelhiNew JerseyNew YorkOsloParisPerthPhiladelphiaPragueRio de JaneiroRiyadhRomeSan FranciscoSantiagoSão PauloSeattleSeoul
ShanghaiSingaporeStockholmStuttgartSydneyTaipeiTel AvivTokyoTorontoViennaWarsawWashingtonZurich
bcg.com