sixth national communication under the un...
TRANSCRIPT
Ministry for the Environment, Land and Sea
Sixth National Communication under the UN
Framework Convention on Climate Change
Italy
December 2013
GENERAL SUPERVISOR:
Corrado Clini - Ministry for the Environment, Land and Sea (IMELS)
GENERAL COORDINATION AND EDITING
Roberto Binatti, Giulia Dramis, Mara Angeloni –Ministry for the Environment, Land and Sea (IMELS)
Riccardo De Lauretis, Mario Contaldi –Institute for Environmental Protection and Research (ISPRA)
AUTHORS:
Chapter 1 – Executive Summary
Chapter’s lead authors
Chapter 2 - National circumstances
Lead author: Andrea Gagna (ISPRA). Contributing authors: Antonella Bernetti (ISPRA), Antonio
Caputo (ISPRA), Eleonora Di Cristofaro (ISPRA), Barbara Gonella (ISPRA), Ernesto Taurino
(ISPRA), Marina Vitullo (ISPRA).
Chapter 3 – Greenhouse gas inventory
Lead authors: Daniela Romano (ISPRA) and Chiara Arcarese (ISPRA). Contributing Authors:
Antonella Bernetti (ISPRA), Antonio Caputo (ISPRA), Mario Contaldi (ISPRA), Riccardo De Lauretis
(ISPRA), Eleonora Di Cristofaro (ISPRA), Andrea Gagna (ISPRA), Barbara Gonella (ISPRA), Ernesto
Taurino (ISPRA), Marina Vitullo (ISPRA).
Chapter 4 – Policies and measures
Lead author: Monica Pantaleoni (ISPRA). Contributing authors: Riccardo De Lauretis (ISPRA),
Eleonora Di Cristofaro (ISPRA), Domenico Gaudioso (ISPRA), Barbara Gonella (ISPRA), Ernesto
Taurino (ISPRA), Marina Vitullo (ISPRA).
Chapter 5 – Projections and effects of policies and measures
Lead author: Antonio Caputo (ISPRA). Contributing authors: Mario Contaldi (ISPRA), Riccardo De
Lauretis (ISPRA), Eleonora Di Cristofaro (ISPRA), Barbara Gonella (ISPRA), Monica Pantaleoni
(ISPRA), Emanuele Peschi (ISPRA), Daniela Romano (ISPRA), Ernesto Taurino (ISPRA), Marina
Vitullo (ISPRA).
Chapter 6 – Vulnerability assessment, climate change impacts and adaptation measures
Lead authors: Sergio Castellari (CMCC/INGV), Silvia Medri (CMCC) and Sara Venturini (CMCC).
Contributing authors: Daniela Pasella (IMELS), Luisa Pierantonelli (IMELS).
Chapter 7 – Financial resources and transfer of technology, including information under
Articles 10 and 11 of the Kyoto Protocol
Lead authors: Emanuela Vignola (IMELS) and Alessandro Negrin (IMELS). Contributing authors:
Giorgia Caropreso (IMELS), Alessandro Celestino (IMELS), Carmen Glorioso (IMELS), Roberta Ianna
(IMELS), Vanessa Leonardi (IMELS), Alessandro Peru (IMELS), Federica Sprovieri, (IMELS), Fiamma
Valentino (IMELS), Margherita Vitale (IMELS).
Chapter 8 – Research and systematic observations
Lead authors: Sergio Castellari (CMCC/INGV), Silvia Medri (CMCC) and Fabrizio Ciciulla (USAM-
CNMCA). Contributing authors: Vincenzo Artale (ENEA), Francesco Apadula (RSE Spa), Sandro
Calmanti (ENEA), Paolo Cristofanelli (ISAC-CNR), Franco Desiato (ISPRA), Alcide di Sarra (ENEA),
Nadia Pinardi (University of Bologna/INGV), Antonello Provenzale (ISAC-CNR), Mariangela Ravaioli
(ISMAR CNR), Paolo Ruti (ENEA).
Chapter 9 – Education, training and public awareness
Lead author: Stefania Fusani (ISPRA). Contributing authors: Sandra Moscone (ISPRA), Stefania
Calicchia (ISPRA), Daniela Antonietti (ISPRA), Fabrizio Ciocca (ISPRA), Antonella Ceccarelli
(ISPRA), Antonietta Licenziato (ISPRA), Maria Alessia Alessandro (ISPRA), Patrizia Polidori (ISPRA).
Annex – First Biennial Report
Lead authors: Monica Pantaleoni (ISPRA), Emanuele Peschi (ISPRA), Marina Vitullo (ISPRA),
Emanuela Vignola (IMELS), Alessandro Negrin (IMELS), Stefania Fusani (ISPRA), Antonio Caputo
(ISPRA), Daniela Romano (ISPRA).
4
Summary 1 Executive Summary ............................................................................................................ 7
1.1 National Circumstances .................................................................................................... 7 1.2 Greenhouse Gas Inventory ............................................................................................... 9 1.3 Policies and measures .................................................................................................... 12 1.4 Projections and effects of policies and measures ................................................................ 13 1.5 Vulnerability assessment, climate change impacts and adaptation measures ........................ 14 1.6 Financial resources and transfer of technology, including information under Articles 10 and 11 of
the Kyoto Protocol ................................................................................................................... 15 1.7 Research and systematic observations ............................................................................. 15 1.8 Education, training and public awareness ......................................................................... 16
2 NATIONAL CIRCUMSTANCES ............................................................................................ 18 2.1 Introduction ................................................................................................................. 18 2.2 Generic information ....................................................................................................... 18 2.3 Sector specific information ............................................................................................. 27
3 GREENHOUSE GAS INVENTORY ........................................................................................ 38 3.1 Greenhouse gas emission trends ..................................................................................... 38 3.2 National System for preparing the Italian Greenhouse Gas Inventory .................................. 46 3.3 National registry ........................................................................................................... 55
4 POLICIES AND MEASURES ................................................................................................ 59 4.1 Policy making process .................................................................................................... 59 4.2 Main policies and measures ............................................................................................ 63 4.3 Cross Sectoral policies ................................................................................................... 63 4.4 Energy Sectors ............................................................................................................. 67 4.5 No energy sectors ......................................................................................................... 89 4.6 Summary of policies and measures ................................................................................. 95 4.7 Costs analysis ............................................................................................................. 104 4.8 Minimization of adverse effects in accordance with art.2 paragraph 3 of the Kyoto Protocol .. 104 4.9 Aviation and marine bunker fuels .................................................................................. 105
5 PROJECTIONS AND EFFECTS OF POLICIES AND MEASURES ............................................. 108 5.1 Introduction ............................................................................................................... 108 5.2 WM scenario ............................................................................................................... 110 5.3 WAM scenario ............................................................................................................. 112 5.4 Sector emissions ......................................................................................................... 113 5.5 Emissions from energy use ........................................................................................... 114 5.6 Emissions from other sectors ........................................................................................ 123 5.7 The Kyoto mechanisms ................................................................................................ 129 5.8 Energy scenarios and effects of policies and measures ..................................................... 130 5.9 Total effect of policies up to 2012 .................................................................................. 134 5.10 Total effect of policies post 2012 ................................................................................... 135 5.11 Sensitivity analysis and uncertainty ............................................................................... 137 5.12 Comparisons with previous National Communications ...................................................... 138
6 VULNERABILITY ASSESSMENT, CLIMATE CHANGE IMPACTS AND ADAPTATION MEASURES .
....................................................................................................................................... 141 6.1 Expected impacts of climate change and vulnerability assessment ..................................... 141 6.2 Adaptation ................................................................................................................. 150 6.3 References ................................................................................................................. 161
7 FINANCIAL RESOURCES AND TRANSFER OF TECHNOLOGY, INCLUDING INFORMATION UNDER ARTICLES 10 AND 11 OF THE KYOTO PROTOCOL ....................................................... 167
7.1 Provision of New and additional resources ...................................................................... 167 7.2 Multilateral cooperation on climate change ..................................................................... 167 7.3 Bilateral cooperation with developing countries ............................................................... 172 7.4 Scientific co-operation ................................................................................................. 184
8 RESEARCH AND SYSTEMATIC OBSERVATION ................................................................. 197
5
8.1 Introduction ............................................................................................................... 197 8.2 General policy on research and systematic observation .................................................... 197 8.3 Observation ................................................................................................................ 201 8.4 Major Italian research institutions and organisations working in the field of Climate and Climate
Change ................................................................................................................................ 201 8.5 Major funding bodies in the field of Climate Change ......................................................... 202 8.6 Research .................................................................................................................... 204 8.7 Systematic observation ................................................................................................ 232
9 EDUCATION, TRAINING AND PUBLIC AWARENESS ......................................................... 242 9.1 Education and Public awareness .................................................................................... 242 9.2 Public access to information ......................................................................................... 252 9.3 Public participation ...................................................................................................... 253 9.4 Training ..................................................................................................................... 255 9.5 International cooperation ............................................................................................. 260
ANNEX ................................................................................................................................... 267
6
Foreword
I am pleased to present the Italian Sixth National Communication under the United Nations Framework Convention on Climate Change. The National Communication also contains information required under the Kyoto Protocol and the first submission of the Biennial report as an Annex. This Communication comes after an important period of environmental policy re-thinking and re-shaping, hinged in the National plan for the reduction of greenhouse gas emissions and the National Energy Strategy both approved in March 2013.
The new policy framework reflects a structural change of the economic and environmental paradigm undertaken in the last years: the aim of such change was to substantially move from a “simple” objective
of decoupling economic growth and emissions to a more “complex” objective of fostering growth with clean technologies development. Green technological novelty, subsequent industrial applications and market diffusion can boost productivity and stabilize economic recovery.
The National plan for the reduction of greenhouse gas emissions and the National Energy Strategy are essential to meet Italian commitments up to 2020. In particular regarding the Kyoto Protocol target,
although measures implemented so far together with the economic crisis resulted in a noticeable decrease in emission levels in the last years a gap needs to be filled in: 2008-2012 average value shows National emissions have fallen 3.7 percent referred to 1990 assigned amount level. The most updated estimates show that, taking into account the means already available, the gap still to
be addressed is about 1% of the target. The National plan for the reduction of GHG emissions provides for the mechanism to close such gap. The Ministry for the Environment delivers a report containing such estimates and the possible ways to close the gap to the Committee for Economic Planning (CIPE) who is in charge for taking resolution. For the period beyond Kyoto projections show that emissions up to 2020 will go on increasing, and
additional measures are needed to meet Italian targets under the “Climate – Energy package”. The National plan for the reduction of greenhouse gas emissions identifies a number of additional measures to meet the medium term goals already established and their full implementation will ensure the respect of such goals while putting the country on the right path towards the decarbonisation. There are also clear evidences that there is a need to adapt to climate change impacts: a process to elaborate the national strategy for adaptation to climatic change has been started.
Whereas Italy will continue its efforts to reduce greenhouse gas emissions at national level, Italy believes that enhancing international cooperation with a view to reduce global emissions so as to hold the increase in global temperature below 2 degrees Celsius, will continue to be a major global challenge. Italy has invested significant resources to help developing countries adapt to climate change and develop
on a low-emission path and wishes that future climate change negotiations will contribute to define an institutional framework to enhance such international cooperation. In such respect Italy welcomes the result of the latest United Nations climate conference of held in Warsaw and is ready to do its part to prepare the ground for the adoption by 2015 of a new legally-binding global agreement containing emission commitments by all countries and enhancing the institutional framework to promote sustainable development both in developing and developed countries.
Corrado Clini UNFCCC National Focal Point
7
1 Executive Summary
1.1 National Circumstances
In Italy the protection of the environment, ecosystem and cultural resources are under the exclusive
competences of the central Government. The Italian Ministry for the Environment Land and Sea (IMELS)
is also responsible for the implementation of the Kyoto Protocol; under this framework, it has started the
process for the adoption of the national strategy for adaptation to climatic change. The Inter-Ministerial
Committee for Economic Planning (CIPE) is a collective governmental body chaired by the President of
the Council of Ministers whose competences include also the climate change. In fact, the committee is in
charge for taking the resolutions concerning the national plan for the reduction of emissions of gases
responsible for the greenhouse effect. The latest CIPE resolution was adopted in 2013 in order to enable
Italy to reach the goals set by the EU legislation by 2020.
Demographic and social trends of countries are generally considered among the main driving forces for
the emissions trends. Although changes in the national population have occurred over the last 20 years
they have not directly affected the national trend of emissions significantly. According to the results of
the 15th national survey, the national population in 2011 has increased compared to 2001, due to the
migratory movements. The aging trend of population has been increasing because of a low birth rate and
a continuous growth of the elders. Italy is the second European Union country with the oldest population.
The two factors combined points out that the proportion of population of working age has been shrinking
and even positive migratory movements from abroad cannot avoid the imbalance in the ratio of the
young to the elders from occurring. The family size has been decreasing. In the period 1991-2011, the
number of dwellings, the population and the number of families have increased at different growth rates.
So, even if new buildings are more energy efficient, the increase of number of families and dwellings has
also contributed to increasing residential energy demand through the last two decades.
Due to the climate profile, domestic heating is required through winter months and the use of air
conditioning systems during summer months has been increasing in the last decade. As far as
temperature is concerned, year 2012 was the 4th Italian warmest year since 1961. Since the ‘80s a
change in the temperature trend for Italy has been identified: a more clear warming period had started in
the last century. The indicators about extreme temperature trends confirm the positive thermal deviation
of the year 2012. As for the average sea surface temperature the deviation from the reference period has
been always positive for the last 16 years. In 2012 the highest sea surface temperature values were
recorded over the whole time series. To date no statistically significant trend in national precipitation or
concerning extremes of precipitation can be depicted. Changes of the average sea level are statistically
not significant too; no relevant changes in the Mediterranean sea level have in fact been recorded
compared to the reference time period.
Italy was the world’s ninth largest economy in 2012. During the last decade a global financial and
economic crisis hit the advanced economies thus resulting in 2007-2009 into severe recession in the EU,
Japan and the United States. Although a general recovery in the economies could be observed by the end
of 2009 and in 2010, the growth rate of the major advanced economies, since 2011, has been
decelerating especially in Europe. Between 2012 and 2013, Italy, like many advanced economies, has
moved into recession again. As a consequence Italy’s Gross Domestic Product (GDP) in 2010 got back to
the value of 2001. The driving sector of the national economy is the service sector, the industry related
activities have been declining, agriculture and constructions have kept almost the same values up to
8
2010.
Italy is also the world’s ninth largest exporter of goods and the twelfth largest importer of goods. The
Italian trade balance registered a deficit in 2009 and 2010 and a surplus in 2011 and 2012. The
percentage change of exports of goods turned positive in 2010 but it had been decreasing since then. At
a world scale the Italian exports and imports have been losing market shares. In 2010-2012 the Italian
exports of goods were driven by: pharmaceuticals, energy products, metal products, iron & steel
products and shoes. The imports of goods showed an increasing trend from 1990 to 2007 and a
fluctuating trend afterwards, due to the fluctuation of the domestic demand through the last years. In
2012 Italian imports came mainly from the EU and East Asia. In the same year, the main imported goods
were energy products, chemical products and mechanical equipments.
Compared with others European countries, Italy’s energy primary consumption is characterized by a
major use of oil and gas, a structural electricity imports, a weak coal contribution and the absence of
nuclear power. The share of renewable energy in Italy’s energy supply mix has been gradually increasing
since 1990 and it is higher compared with the OECD’s average, mostly due to hydropower.
In 2011, primary energy demand was about -2% compared to 2010, consumptions in the transport
sector are stable; consumptions in the civil sector has increased driven mainly by the consumptions in
the service sector; energy consumptions in the industry sector have been decreasing since 2004
(consumptions in the petrochemical sector and to the energy consumptions for mechanics, textile and
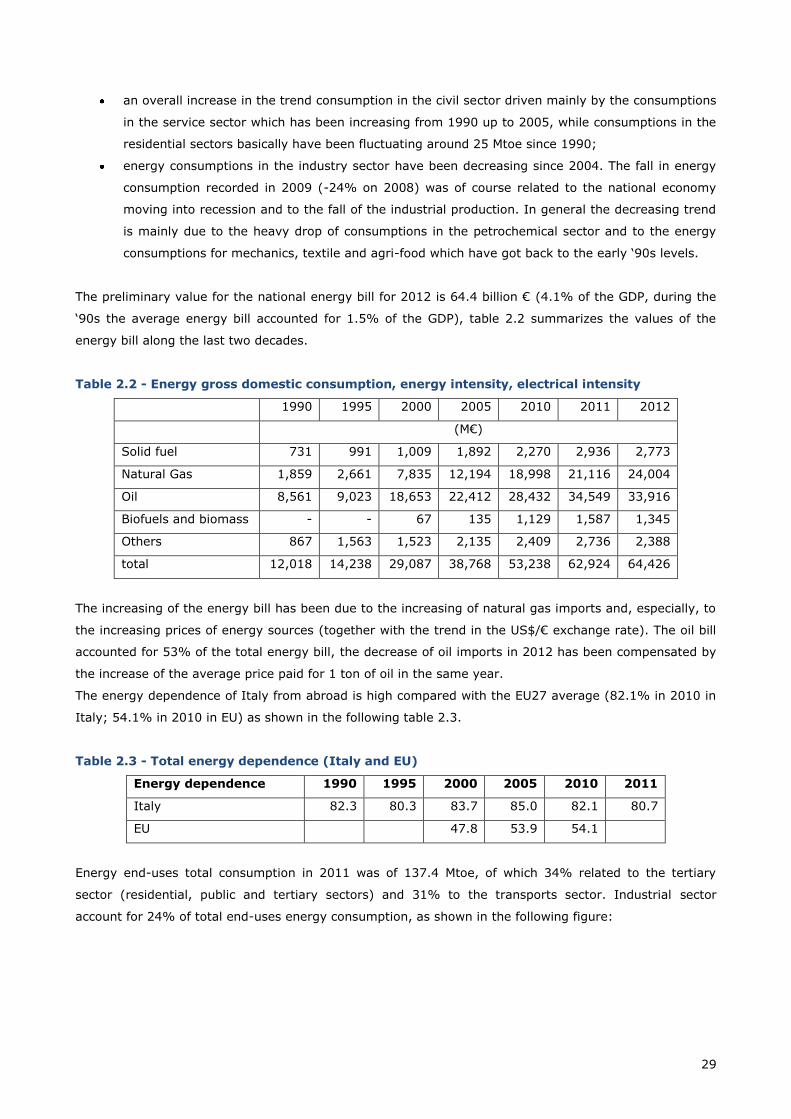
agri-food which have got back to the early ‘90s levels). The preliminary value for the national energy bill
for 2012 is 4.1% of the GDP, during the ‘90s the average energy bill accounted for 1.5% of the GDP.
The energy dependence of Italy from abroad is high compared with the average of the EU27 countries (in
2010, 82.1% in Italy and 54.1% in EU). In 2011 34% of the energy end-uses total consumption was
related to the tertiary sector, 31% to the transports sector and 24% to the industrial sector. Concerning
the electric sector, more than 80% of the production is provided by thermoelectric power plants, the rest
is covered by renewable energy sources (hydropower, wind, photovoltaic and landfill gas) whose weight
has grown in the latest years. Italy’s energy intensity is lower than the EU average mainly due to the
shift of the Italian economy from industrial activities to services. Despite the improvement of energy
efficiency in the industry sector, the gap with the EU average has reduced in the recent years because
consumption patterns in the civil sector have become more energy intensive.
As for passenger transportation, there is still the world highest concentration of private cars per capita.
About 84% of the Italian population goes to work by private transportation means. The mobility demand
and, particularly, the road transportation share have constantly increased in the period from 1990 to
2011. The number of vehicles for road transportation has kept growing steadily over the last two
decades, and the circulating passenger car fleet has been gradually aging.
The energy demand in the transportation sector has increased in the period 1990-2010, with significant
increases in the consumption of natural gas, diesel, jet fuel and electricity. Transport sector keeps
depending almost completely on oil. Under the EU legislation setting standards and mandatory targets in
the manufacturing of new cars CO2 emission per km from new cars is targeted to decrease over time, in
Italy CO2 emissions from passenger cars have been decreasing along the last two decades (2011
emissions level is the same as in 1996).
Main drivers of greenhouse gases emissions trends for Agriculture are the number of animals, the
variation of cultivated surface/crop production and use of nitrogen fertilizers. Trends and changes of
these parameters at national level have been affected also by the implementation of a Common
9
Agricultural Policy (CAP) in the European legislation. Changes in livestock populations have occurred since
1990. The total agricultural area, the utilized agricultural area and the number of agricultural holdings
have been decreasing since 1982, resulting in the noticeable increase of the average size of the Italian
agricultural holdings along the same years. As for the use of fertilizers, in the last decade the decrease in
the use of mineral products with a corresponding increase of organic formulated products is in line with
the CAP and it is also a consequence of the trend of the fertilizers market prices.
In Italy over the last two decades changes in the land use has resulted in the increase of the forested
area, of the grassland area and of the settlement area; the reduction of cropland area compared to 1990
areas is also observed. The Italian forested surface was about 35.8% of our national land surface in
2010. Although the forest expansion has been decreasing during the last decade, the Italian forested
area is spreading due to the dismissal of agriculture practices, mostly in mountain zones, and to the
natural conversion of cultivated lands and grazing into forests. In 2012, forested areas affected by fires
amount to approximately 47.6% of the total land surface burned by fire in the same year.
The production of municipal waste in Italy increased between 1990 and 2005, while it has remained
approximately around 32 Mtonnes since then although a reduction trend can be observed for the last
years in Italy, driven mainly by changes in life style and consumption patterns more than the
enforcement of waste legislation. The international crisis of the economy has contributed too. In 2011
approximately 31.38 Mtonnes of municipal waste were produced, corresponding to 528 kg/year per
person. The production of industrial waste has been increasing since 1990: it accounted for about 3.8
Mtonnes in 1990; it was about 8.1 Mtonnes in 2011. Although separate collection rates vary across the
country, an increasing overall trend since 1996 can be observed but figures are still lower than national
targets set by the legislation. Since early ‘90s landfilling as a waste disposal practice has been decreasing
thanks also to changes into national policies which support other waste treatments (e.g. incineration;
mechanical-biological treatment; composting; anaerobic digestion; etc). The number of incineration
plants has increased in 2011; more than 95% of the total amount of incinerated waste was treated in
installations with energy recovery systems. The production of special waste has been increasing since
1990; the correlation between special waste production trend and the Italian GDP trend is good, so
especially for the last years the ups and downs in the special waste production trend are related to the
trend of the national economy. It is worth noting that the amount of special waste destined to the
recovery of material has been increasing for the last years and the landfilling of special waste has been
reducing for the same years.
1.2 Greenhouse Gas Inventory
Total national greenhouse gas emissions, expressed in CO2-equivalent, excluding emissions and removals
from land use, land use change and forestry (LULUCF), have decreased by 5.8% between 1990 and
2011, varying from 519 to 489 million tons (Mt) of CO2-equivalent. The year 1990 is the base year set by
Italy for all greenhouse gases.
The most important greenhouse gas, CO2, which accounts for 84.7% of total emissions in CO2-equivalent
in 2011, shows a decrease by 4.7% between 1990 and 2011. In the energy sector, in particular, CO2
emissions, in 2011, are 2.8% lower than in 1990. CH4 and N2O emissions are equal to 7.5% and 5.5%, of
the total CO2-equivalent greenhouse gas emissions, in 2011, respectively. CH4 levels have decreased by
16.4% from 1990 to 2011, while N2O has decreased by 28.1%. As to the other greenhouse gases, HFCs
10
account for 1.9% of total emissions, PFCs and SF6 are equal to 0.3% and 0.1% of total emissions,
respectively.
The distribution of the different sectors in terms of total emissions remains nearly unvaried over the
period considered.
Specifically, the energy sector is the largest contributor to national total GHG emissions with a share, in
2011, of 82.7%. Emissions from this sector have decreased by 3.2% from 1990 to 2011. Substances with
decrease rates were CO2, whose levels reduced by 2.8% from 1990 to 2011 and accounts for 97.1% of
the total in the energy sector, and CH4 which showed a reduction of 25.3% but its share out of the
sectoral total is only 1.7%; N2O, on the other hand, showed an increase of 6.8% from 1990 to 2011 but
it is not relevant on total emissions, accounting for 1.2%. In terms of total CO2 equivalent, in the period
1990-2011, energy industries emissions have decreased by 4.4%, accounting for 32.4% of total
emissions. On the other hand, an increase in emissions was observed in the transport sector, and in the
other sectors, about 14.3% and 9.7%, from 1990 to 2011, respectively; in 2011 these sectors,
altogether, account for 50.4% of total emissions.
For the industrial processes sector, emissions showed a decrease of 17.6% from the base year to 2011.
By substance, CO2 emissions account for 63.8% and reduced by about 29.0%, CH4 decreased by 46.4%,
but it accounts only for 0.2%, while N2O, whose levels share 0.9% of total industrial emissions,
decreased by 95.6%. The decrease in emissions is mostly to be attributed to a decrease in chemical
industry and metal production emissions. The decrease of GHG emissions in the chemical industry (-
81.1%) is due to the decreasing trend of the emissions from nitric acid and adipic acid production (this
last process sharply reduced its emissions, due to a fully operational abatement technology). Emissions
from metal production decreased by 57.8% mostly for the different materials used in the pig iron and
steel production processes. A considerable increase was observed in F-gases emissions (about 250.5%),
whose level on total sectoral emissions is 35.1%.
It should be noted that, except for the motivations explained, the economic recession has had a
remarkable influence on the production levels of most of the industries affecting the energy and industrial
process sectors, with a consequent notable reduction of total emissions, especially in the last three years.
Emissions from the solvent and other product use sector, which refer to CO2 and N2O emissions,
decreased by 32.5% from 1990 to 2011. The reduction is mainly related to a decrease by 34.3% in CO2
emissions, which account for 65.2% of the sector. The reduction in CO2 levels is explained by the
decrease of emissions from paint application sector (-35.6%), which accounts for 50.4% of total CO2
emissions from this sector, and to the decrease of emissions from other use of solvents in related
activities (-23.8%), such as domestic solvent use other than painting, application of glues and adhesives,
printing industries, fat edible and non edible oil extraction, vehicle dewaxing, glass wool enduction, which
account for 43.9% of the total. The level of N2O emissions shows a decrease of 29.0%, accounting for
34.8% of total emissions in the sector in 2011.
For agriculture, emissions refer to CH4 and N2O levels, which account for 43.1% and 56.9% of the
sectoral total, respectively. The decrease observed in the total emissions (-17.7%) was mostly due to the
decrease of CH4 emissions from enteric fermentation (-12.4%), which account for 32.1% of sectoral
emissions. Main drivers behind these downward trends are the reduction in the number of animals,
especially cattle which have decreased by 23.9 between 1990 and 2011 and contribute with 77.7% to
total CH4 from enteric fermentation. A decrease of N2O from agricultural soils (-21.1%) was also
observed, which accounts for 45.8% of sectoral emissions affected by the variation in cultivated
11
surface/crop production as well as the use of nitrogen fertilizers. In addition, there has been a significant
increase in the recovery of the amount of biogas produced from animal manure and used in the energy
sector for the production of electricity and combined electricity and heat production in the last years thus
contributing to the reduction of total emissions.
Finally, emissions from the waste sector decreased by 10.9% from 1990 to 2011, mainly due to a
decrease in the emissions from solid waste disposal on land (-17.8%), which account for 71.5% of waste
emissions. The most important greenhouse gas in this sector is CH4 which accounts for 87.5% of the
sectoral emissions and shows a decrease of 11.4% from 1990 to 2011. N2O emission levels increased by
5.0%, whereas CO2 decreased by 53.8%; these gases account for 11.2% and 1.3%, respectively.
Italy has established a national system, which includes all institutional, legal and procedural
arrangements for estimating emissions and removals of greenhouse gases, as well as reporting and
archiving inventory information.
The National System for the Italian Greenhouse Gas Inventory was established by the Legislative Decree
n° 51 of March 7th 2008. The Institute for Environmental Protection and Research (ISPRA) is the single
entity in charge of the development and compilation of the national greenhouse gas emission inventory.
The Institute annually draws up a document which describes the national system including all updated
information on institutional, legal and procedural arrangements for estimating emissions and removals of
greenhouse gases and for reporting and archiving inventory information; the plan is submitted to the
Italian Ministry for the Environment, Land and Sea (IMELS) for approval.
As for the official consideration of the inventory, the Italian Ministry for the Environment, Land and Sea is
responsible for endorsement and for communication to the Secretariat of the UN Framework Convention
on Climate Change and the Kyoto Protocol. The inventory is also submitted to the European Commission
in the context of the Greenhouse Gas Monitoring Mechanism.
A complete description of the Italian National System can be found in the document “National
Greenhouse Gas Inventory System in Italy. Year 2013”, publicly available on website at the following
address:
http://www.isprambiente.gov.it/en/publications/reports?set_language=en
As single entity, ISPRA is responsible for all aspects of national inventory preparation, reporting and
quality management. A specific unit of the Institute is in charge of the management of the emission
inventory. Activities include the collection and processing of data from different data sources, the
selection of appropriate emissions factors and estimation methods, the compilation of the inventory
following the QA/QC procedures, the assessment of uncertainty, the preparation of the National
Inventory Report and the reporting through the Common Reporting Format, the response to the review
processes, the updating and data storage. The website address where all the information related to the
inventory can be found is: http://www.sinanet.isprambiente.it/it/sia-ispra/serie-storiche-emissioni.
ISPRA is also responsible for the administration of the national section of the Union Registry under the
European Directive 2009/29/EC, as set out by the Legislative Decree N. 30 of 13 March 2013. The
Institute performs these tasks under the supervision of the national Competent Authority.
The registry is operated by the European Union through the centralization of the EU ETS operations into a
single European Union registry, as established by the Directive 2009/29/EC. With a view to increase
efficiency in the operations of their respective national registries, the EU Member States who are also
Parties to the Kyoto Protocol (25) plus Iceland, Liechtenstein and Norway decided to operate their
12
registries in a consolidated manner in accordance with all relevant decisions applicable to the
establishment of Party registries, in particular Decision 13/CMP.1 and decision 24/CP.8.
1.3 Policies and measures
The policies and measures taken by Italy to mitigate climate change are driven by the commitment
undertaken under:
- the Kyoto Protocol target for the period 2008-2012: in the framework of the EU Burden Sharing
Agreement, Italy has committed to reduce its greenhouse gas emissions by 6.5% below base-
year levels (1990).
- the “EU Climate Energy Package” for the period 2013-2020: the 8th and 9th March 2007
conclusion of the European Council named “Integrated Energy and Climate Change Package”
(IECCP) commits to European Member States to achieve by 2020, 20% reduction of EU
greenhouse gas emissions compared to 1990, 20% reduction in energy use to be achieved by
improving energy efficiency, 20% use of renewable energy, 10% use of biofuels in the transport
sector. A comprehensive set of legislation act was agreed at EU level and is being implemented to
reach those objectives and according with that all the national emissions should be divided,
starting from year 2013, in two main sectors:
EU – ETS sector: the EU-ETS was established by the Directive 2003/87/EC, this directive has
been recently amended by the Directive 2008/101/EC of 19 November 2008 in order to
include the aviation sector and by Directive 2009/29/EC of 23 April 2009 that introduces
substantive changes in the scheme. The most important one relates to the cap-setting
procedure, where the new system will be no longer based on national-cap setting but on an
EU single wide cap to be allocated to each operator on the basis of benchmarks.
ESD (Effort Sharing Decision) sector: at 2020 Italy should reduce of 13% the GHG emissions,
respect the 2005, in all the sectors not covered by the EU ETS, such as transport, civil,
agriculture and waste, according with the “Decision n. 406/2009/EC of the European
Parliament and of the Council of 23 April 2009 on the effort of Member States to reduce their
greenhouse gas emissions to meet the Community’s greenhouse gas emission reduction
commitments up to 2020 (ESD)”.
At national level to achieve the Kyoto Protocol and also the EU 2020 targets (IECCP) an updated national
strategy has been approved by the CIPE (Inter-Ministerial Committee for Economic Planning) the 8th of
March 2013, with the Deliberation n. 17/2013. Moreover, the 8th march 2013 the Ministry of Economic
Development and the Ministry of Environment, Land and Sea have approved a decree outlining a new
“National Energy Strategy”. This strategy identifies a path to achieve the 2020 targets, related to energy
efficiency and renewable energy use, and contains a list of measures that should be implemented; this
list of the measures is consistent with ones reported in the CIPE resolution
The policies and measures envisaged in Annex 1 of the CIPE deliberation are included into the “With
measure scenario”, whereas the measures reported in Annex 2 are included into the “With Additional
Measure scenario”; these measures take into account the EU, national and local policies and could be
gathered in three main groups:
- Cross sectoral policies include the Legislative Decree N. 28 of 3rd March 2011 that defines the
mechanisms, the incentives and the institutional, financial and legal tools necessary to achieve
the 2020 targets regarding the renewable energy use; the 28th December 2012 decree, the so
13
called “Conto Termico” decree, that implements the incentive scheme introduced by Legislative
Decree 28/2011, in particular encourages small-scale energy efficiency measures and the
production of thermal energy from renewable sources; the White Certificates system, aimed at
promoting energy efficiency and delivering emission reductions in all the energy end-use sectors,
this measure is implemented up to 2016 and a further extension till 2020 is foreseeable, so after
2016 it has been considered as planned ; the “Fondo Rotativo di Kyoto”; the legislative decree
20/2007 on the ecodesign of energy-using products and the structural funds 2007-2013, both
considered as implemented measures.
- Energy measures that include cogeneration currently supported by incentive schemes, energy
efficiency of thermoelectric power plants; energy efficiency in the civil sector through specific
actions targeted for existing and new buildings and appliances; mandatory use of biofuels and
infrastructural projects considered as implemented measures, intermodal and fleet update
measures in the transport sector.
- No Energy measures that include implementation of the most advanced technology to reduce the
N2O emissions in plants for the production of nitric acid; emission reduction from agricultural soil
and electricity generation from animal waste in the agriculture sector; compliance with separate
collection targets and reduction of biodegradable waste disposed into landfills in the waste sector.
All this measures have been considered implemented.
The total GHG reduction for the implemented measure can be estimated as 37.85 Mt CO2eq at 2015 and
51.09 Mt CO2eq at 2020, regarding the planned measures the reduction impact can be estimated as
11.81 Mt CO2eq at 2015 and 65.97 Mt CO2eq at 2020.
1.4 Projections and effects of policies and measures
The Italian target under the Kyoto Protocol is to reduce total GHG emissions by 6.5% over the 2008-2012
periods with respect to 1990. After the review of the Italian initial report under the Kyoto Protocol
(FCCC/IRR/2007/ITA) the objective has been established as 483.255 MtCO2/year. The emissions for
the latest available inventory year (2011) reports 5.8% decrease with reference to 1990. The
Kyoto objective for EU (EU-15) is to attain an 8% emissions reduction. The target will be met
taking into account the measures for the forestry sector and the use of flexible mechanisms.
Two Scenarios of greenhouse gas emissions to 2020/2030 has been estimated, with starting year 2010,
the WM (with measures) and WAM (with additional measures). The former includes all measures
implemented or adopted up to 2010, while the latter includes all planned measures. The scenario has
been geared taking account of the most recent energy scenarios, briefly described in the paragraph
“Energy scenarios and effects of policies and measures”, and specific estimates on non-energy source
emissions.
Scenarios data are reported by sector and by gas, with a brief explanation of trends. The expected
effect of the use of Kyoto mechanisms is also reported. Moreover the effect on 2020 EU target is
reported.
The GHGs emissions from the combustion of energy sources are drawn from the Markal – Italy model,
based on the well known Markal software. The WM scenario shows that gross inland consumption in
2020, estimated according to Eurostat methodology, will be about 184 Mtoe, with an average yearly
growth rate of 0.7% from 1990, compared with an estimated average growth rate of 0.2% in 2000-
2010. In 2030 the increase in gross inland consumption compared to 2010 is about 7.7 Mtoe. According
14
to the WAM scenario there will be a decrease of gross inland consumption of 10.1 Mtoe from 2010 to
2020 and a slight increase of 0.4 Mtoe up to 2030.
As concerns the Kyoto target, in the 2008-2012 period the yearly average of total emissions estimated
taking into account all the reductions achievable by existing measures (including the purchase of CERs /
ERUs), will be equal to 497.1 Mt CO2. The contribution of ETS sectors to meet the Kyoto Protocol target is
201.6 MtCO2/year, corresponding to the total quantity of AAU allocated to the sector. The distance from
the Kyoto objective is equal, on average, to the sum of the allocated emissions to ETS sector and the
actual emissions of non ETS sector. According to the latest emission estimates available in April 2013,
this “gap” is equal to 20.2 MtCO2/year. In addition, to reach the Kyoto target should be considered the
Removal Units (RMUs) by LULUCF activities pursuing article 3, paragraph 3 and 4 of the Kyoto Protocol.
Also total effects of policies for the post-2012 period, with reference to the 2020 EU objectives, are
evaluated. Considering the emissions according to the WM scenario the targets should be achieved in
2013 and 2015, while the gap should be about 3.1 MtCO2eq in 2020. The mitigation options identified to
"fill" the gap account for about 65.97 Mt CO2 in 2020.
The scenario takes into account the effects of the ongoing economic crisis that hit all national activities
and the evolution trend is based on planned recovery from the economic crisis and development of low
carbon technologies, mainly for the electricity generation sector. It comes in particular from certain
assumptions relating to social, demographic and economic circumstances of the country, assumptions
used to determine the evolution of the demand for energy services, which is the basis of the scenarios.
Finally, an historical review of projections from different National Communications is reported. The
effects of economic crisis started in 2008 has shocked the previous projections for 2010 and for the
Kyoto period for energy and no energy sectors, though the methodology (IPCC guidelines) to estimate
the emissions of other gases than CO2 and from no energy sectors has changed over years, therefore
projections have been developed with different methodology and assumptions and cannot be compared.
1.5 Vulnerability assessment, climate change impacts and adaptation measures
Italy along with the other Mediterranean countries most likely will undertake particularly negative impacts
over the next decades, which, coupled with the effect of anthropogenic stress on natural resources, make
Italy particularly vulnerable to the future climate change.
Expected impacts of climate change and key vulnerabilities for Italy can be identified as the following:
worsening of the existing conditions of high stress on water resources;
alterations of the hydro-geological regime;
increasing soil degradation, higher risk of soil erosion, landslide and desertification;
higher risk of forest fires and droughts over the forests;
higher risk of biodiversity and natural ecosystems loss;
higher risk of flooding and erosion of coastal zones;
reduction of agriculture productivity;
increase of negative effects on human health;
increase of losses in other key national economic sectors (energy, tourism, infrastructure,
transport and urban settlements);
increase of negative impacts on cultural heritage.
The Italian Ministry for the Environment, land and sea (IMELS) has the primary responsibility for the
establishment and preparation of a national strategy and/or action for adaptation to climate change. The
15
IMELS focuses on the integration (mainstreaming) of adaptation into sectoral policies, while Regional
Governments are entrusted with the implementation of local adaptation plans of action; some regions
have started working on adaptation, particularly with respect to aspects such as research and monitoring.
Italy has started in 2012 an institutional process toward a National Adaptation Strategy (NAS), which
most likely will be concluded in the first semester of 2014. In this context an impacts and vulnerability
assessment has been elaborated with a large contribution by the most relevant national scientific
institutions and a participated process has been put in place in order to consider the public opinion.
Several adaptation measures have been already carried out in the context of environment protection,
natural hazards prevention, sustainable management of natural resources and health protection. These
measures range from legal frameworks to monitoring, surveillance of early impacts and early warning
systems to practical actions. Implemented adaptation is most developed in the following national sectors:
human health, coastal protection, agriculture, desertification and water resources.
1.6 Financial resources and transfer of technology, including information under Articles 10
and 11 of the Kyoto Protocol
The Italian Government deems that achieving significant GHG emission reductions requires a progressive
diffusion of new technologies, especially in developing countries. Therefore, its approach has been always
keen to promote technology transfer as international response to the global climate change challenge.
The Italian Government has increased its efforts on international activities on climate change, over the
past four years. Italian’s priorities on this issue are mostly addressed to:
• sustain the multilateral funds, dedicated to reduce the impact of human activities on climate
change, and support to adaptation measures;
• support mitigation and adaptation in most vulnerable countries, particularly: Balkan region, Brazil,
China, and Pacific Small Islands;
• strengthen the capacity building of least developing countries.
Many of the Italian adaptation, mitigation, capacity building and technology transfer programmes are
administrated by bilateral agreements. However, Italy plays a pivotal role in some significant multilateral
organizations, through such as the Global Bioenergy Partnership and the Mediterranean Renewable
Programme.
Italy has always taken part in high level meetings on climate change as well as in international economic
fora, namely Group of Eight 8, Group of Twenty and Major Economies Forum. In this context, it has
contributed to reaching several results, such as: the constitution of REDD+ mechanism.
Italy has provided a total amount of about 192 million € of new and additional financial resources for
climate change programmes in developing countries, since the Fifth National Communication.
For the elaboration of this Communication, Italy has used the UNFCCC’s common tabular format of the
biannual report for the year 2011-2012, and previous tabular format for the years 2009-2010.
1.7 Research and systematic observations
The Italian system aimed to climate research and systematic observation includes several universities,
public and private institutions and organizations. A comprehensive observational climate network is
present in Italy and contributes significantly to international programs involving ocean and space-based
measurements. The climate research covers different aspects, such as climate observations, climate
16
modelling, climatic impacts assessments and mitigation and adaption policies and technologies. The
major Italian funding bodies for climate research are Ministries and National Agencies.
1.8 Education, training and public awareness
The trend in the awareness-raising initiatives specifically dedicated to climate change, over the last three
years, had a decline at national level, compared to previous years, while it increased at local level. On the
other hand, there is a growing commitment to raise awareness on sustainable use of resources, in
particular energy and renewable energy.
Starting from the assumption that working with young people is the most effective tool to build up a
conscious citizenship in relation to environmental issues and in order to set up an effective educational
path, it is essential to carry out a proper training of trainers and to update courses on specific
environmental issues. To this aim, the National Programme for Environmental Education, Information and
Training (IN.F.E.A), coordinated by the Ministry for the Environment Land and Sea and by the Regions,
has been an effective operational tool at National level for the promotion and realization of educational
interventions on the territory.
However, the real key actors in promoting and implementing innovative methods for teaching and
learning and raising awareness on climate change issues in Italy are the Municipalities, the Regional and
Provincial Administrations and Regional Environmental Agencies (ARPAs). Among these, the most
engaged in education and training activities are the Trentino and the Emilia Romagna Regions.
Besides local administrations, an important role is also played by the NGOs which are very active in
public participation and awareness initiatives on the theme of climate change, especially towards young
people.
In this National Communication, as recommended by the ERT, the activities and initiatives organized by
the citizens and/or by the Environmental NGOs, in addition to those ones promoted by national and local
public administrations were also reported, as requested by, and accordingly to, UNFCCC guidelines.
The major economic crisis that Italy has been going through for some years now did not allow
concentrating more efforts in many new large investments in international cooperation projects
specifically dedicated to spreading awareness on climate change.
However, cooperation activities are continuing in the framework of existing Memorandum of
Understanding (MoU), such as the Sino-Italian Cooperation Program for Environmental Protection and
bilateral agreements between the Italian Ministry for the Environment, Land and Sea and the Ministries of
Environment /Energy of the Balkan countries.
It is also worth mentioning the commitment of the Italian Civil Protection Department in implementing
two important projects, with EU financing, for climate-related capacity development and strengthening
institutional capacity in developing country Parties: the Euromed Programme on “Prevention,
Preparedness and Response to Natural and Man-made Disasters” (PPRD South), aimed at improving Civil
Protection at international, national and local levels, in the South Mediterranean Region, and 'EVRECA!
project “European Volunteers for Response of Emergencies in the Caribbean” whose main objective is to
define guidelines and standards for the recruitment and training of volunteers in the field of emergency
management and Disaster Risk Reduction (DRR) activities.
Furthermore, it should be highlighted the important contribution of the EvK2CNR Committee, an
autonomous, non-profit Italian association, which promotes scientific and technological research in key
high-mountain regions. Among its activities EvK2CNR launched the SHARE project “Stations at High
17
Altitude for Research on the Environment” an observational network of international and institutional
collaborating partners (UNEP, WMO, NASA, ESA and IUCN) with the aim to promote continuous scientific
observations in key high-mountain regions able to contribute to knowledge on regional and global climate
change.
18
2 NATIONAL CIRCUMSTANCES1
2.1 Introduction
This chapter contains relevant information concerning Italy which helps understanding the national data
on emissions trend (which are presented in chapter 3 of this document) and the factors that produce
them. The main drivers of the emissions trend, according to the IPCC, are discussed, too, specifically:
population dynamics; the rate of urbanization; the mobility for work and study reasons; employment
rate; national economy indicators and a short analysis of the most significant macro sectors.
2.2 Generic information
2.2.1 Government profile
Italy is a bicameral parliamentary Republic administratively divided into 20 Regions which are part of the
constitutional structure of the State. Thus in Italy a sovereign public entity coexists with other territorial
entities, Provinces and Municipalities are lower-level territorial entities too.
The Constitutional law n.3 of 2001 has deeply modified the attributions of powers between the central
and the local Governments with the aim to establish a system of administrative federalism. The Regions
have legislative powers for matters not expressly reserved to the exclusive competence of the central
Government and have the responsibility to administer matters on which they legislate. The Constitutional
Law also rearranged the distribution of administrative functions foreseeing an enhanced administrative
role for municipalities.
The protection of the environment, of the ecosystem and cultural resources are under the exclusive
competences of the central Government. In particular the Italian Ministry for the Environment Land and
Sea (IMELS) was established in 1986 as the Italian Ministry for the Environment and Territory and
renamed as IMELS in 2006. The IMELS is responsible for sustainable development, protection of territory,
pollution and industrial risks, international protection of the environment, appraisal of environmental
impact, nature conservation, waste and cleanup, and protection of seas and inland waters. The IMELS is
also committed to promoting and supporting international partnership and cooperation towards global
sustainable development. In some other sectors as the energy production, transport and distribution, the
central Government and the Regions have concurrent legislative powers. Regarding climate change the
IMELS is responsible for elaborating the national plan for the reduction of greenhouse gas emissions to be
proposed for adoption to the Inter-Ministerial Committee for Economic Planning2 (CIPE) – a collective
governmental body chaired by the President of the Council of Ministers3. The IMELS has also started the
process to elaborate the national strategy for adaptation to climatic change (see chapter 6 of this
document) pursuant to the adoption of the EU adaptation strategy in April 2013.
The national energy policy is within the competences of the Italian Ministry of Economic Development,
the determination of the policy at the specific sector level is based on the general guidelines set by the
Government as a whole and by Parliament.
1 Lead author: Andrea Gagna (ISPRA); Contributing authors: Antonella Bernetti (ISPRA), Antonio Caputo (ISPRA),
Eleonora Di Cristofaro (ISPRA), Barbara Gonella (ISPRA), Ernesto Taurino (ISPRA), Marina Vitullo (ISPRA). 2 http://www.cipecomitato.it/it/index.html 3 CIPE’s resolution n. 17/2013 was adopted to enable Italy to contribute in the achievements of the goals set by
Decision EC/406/2009 (on the efforts of Member States to reduce their GHG emissions to meet the EU’s GHG emission
reduction commitments up to 2020). The measures to be taken are discussed in chapter 4 of this document.
19
2.2.2 Population profile, urban structure and building stock
Demographic and social trends in countries are generally considered among the main driving forces for
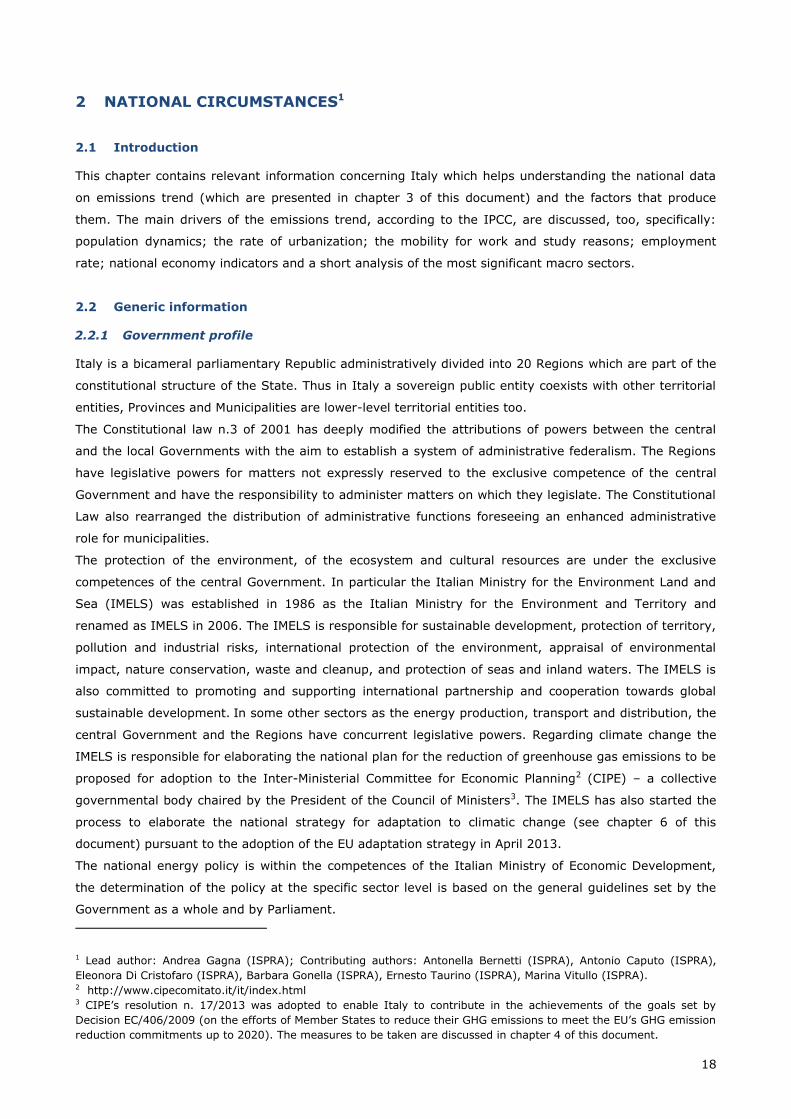
the emissions trends. Although changes in the national population have occurred (Figure 2.1) over the
last 20 years they have not directly affected the national trend of emissions significantly. The national
population was 56.744 million in 1991 (13th national survey) and 56.960 million in 2001 (14th national
survey) while it was 59.433 million on October 2011 when the 15th national survey was carried out by the
Italian national institute of statistics (ISTAT)4. According to the results of the survey the increase in
population, 4.3% compared to 2001, is due to the migratory movements that counterbalance the
negative natural trend. In 2011 there were approximately 3 million people more than in 2002 living in
Italy; the peaks in migratory movements occurred in 2003-2004, in 2007-2008 and in 2009-2010. Since
2007 the overall trend has been decreasing, in particular in 2011 it was -13.8% compared to 20105. The
Italian population is expected to reach 63.5 million in 2031.
Figure 2.1 - The population of Italy along the last two decades
Source: ISTAT (the Italian National Institute of Statistics)
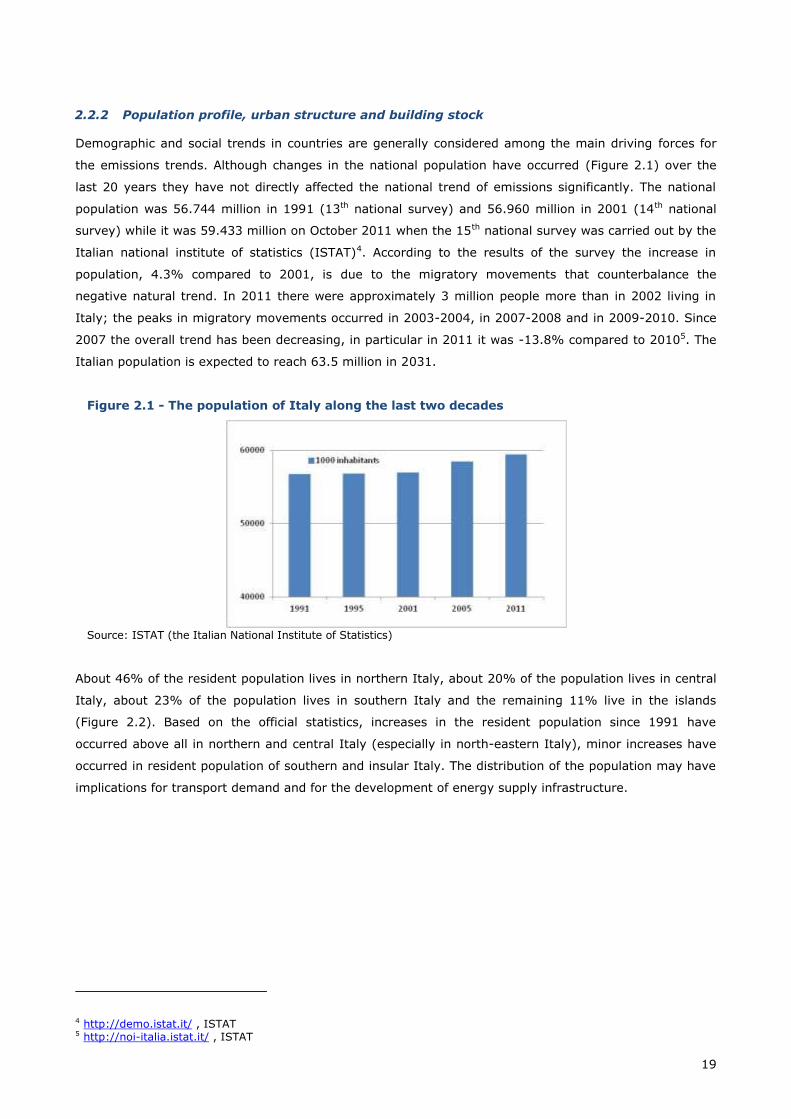
About 46% of the resident population lives in northern Italy, about 20% of the population lives in central
Italy, about 23% of the population lives in southern Italy and the remaining 11% live in the islands
(Figure 2.2). Based on the official statistics, increases in the resident population since 1991 have
occurred above all in northern and central Italy (especially in north-eastern Italy), minor increases have
occurred in resident population of southern and insular Italy. The distribution of the population may have
implications for transport demand and for the development of energy supply infrastructure.
4 http://demo.istat.it/ , ISTAT 5 http://noi-italia.istat.it/ , ISTAT
20
Figure 2.2 - Distribution of the Italian population among four statistical regions
Source: ISTAT, the Italian National Institute of Statistics
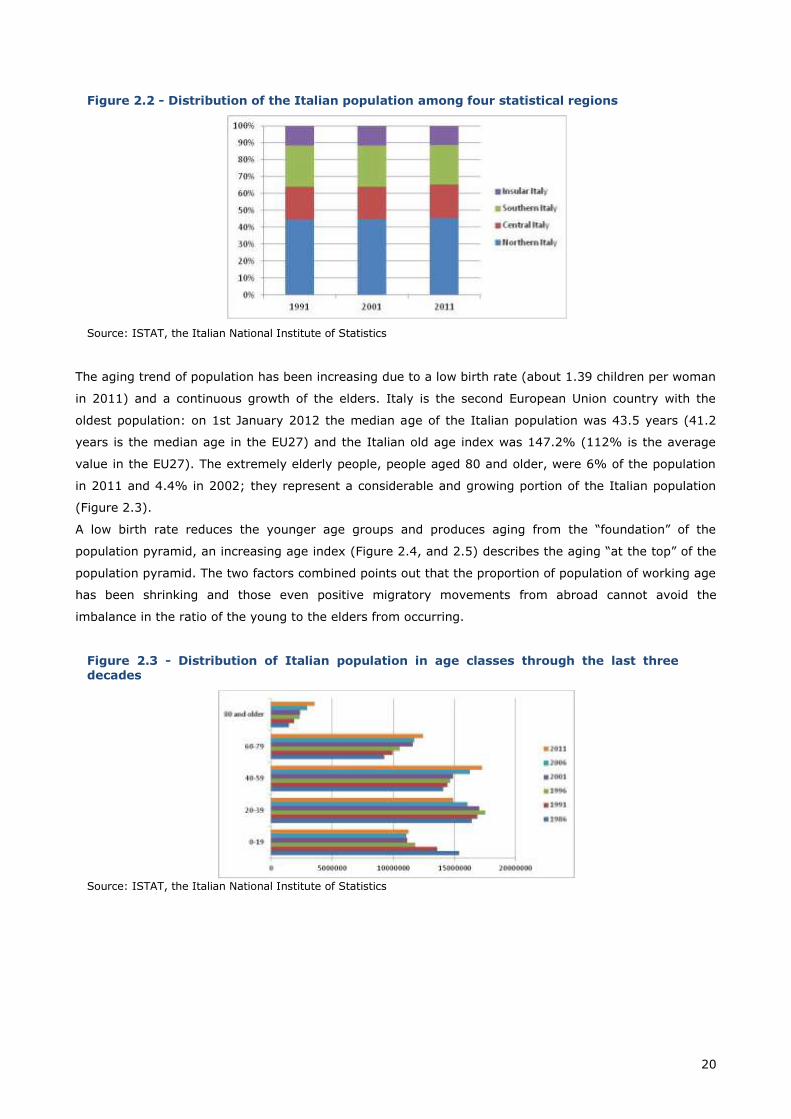
The aging trend of population has been increasing due to a low birth rate (about 1.39 children per woman
in 2011) and a continuous growth of the elders. Italy is the second European Union country with the
oldest population: on 1st January 2012 the median age of the Italian population was 43.5 years (41.2
years is the median age in the EU27) and the Italian old age index was 147.2% (112% is the average
value in the EU27). The extremely elderly people, people aged 80 and older, were 6% of the population
in 2011 and 4.4% in 2002; they represent a considerable and growing portion of the Italian population
(Figure 2.3).
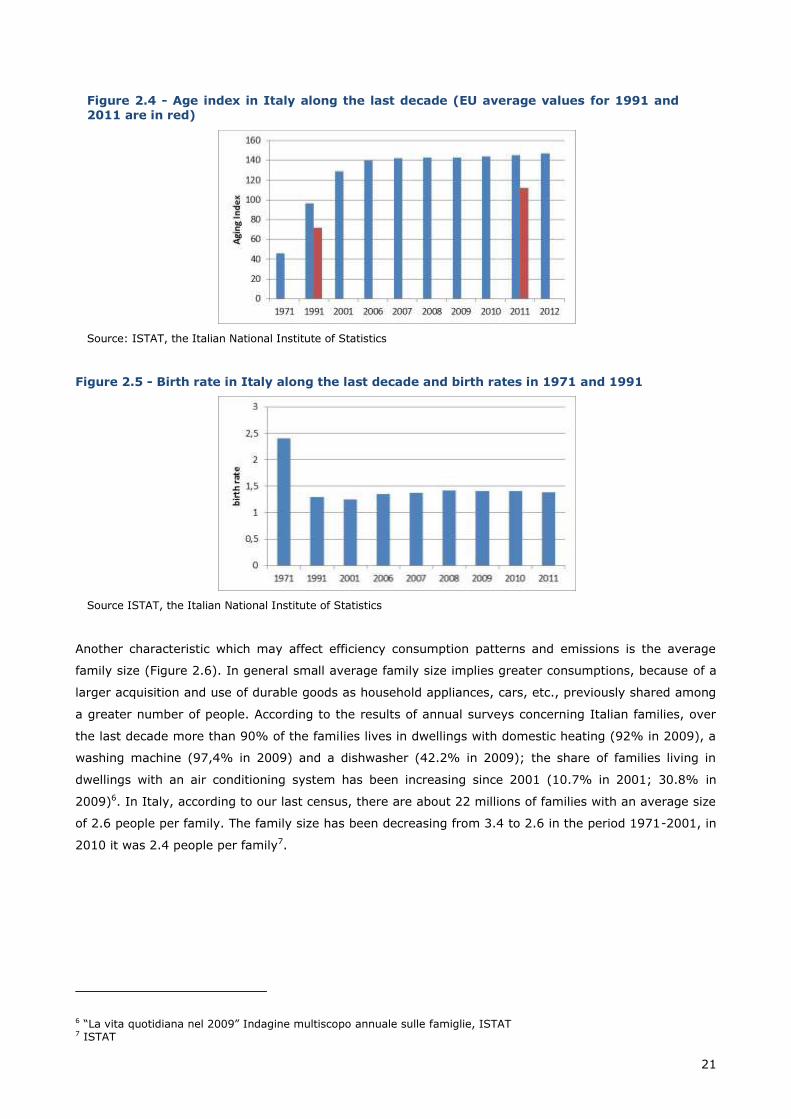
A low birth rate reduces the younger age groups and produces aging from the “foundation” of the
population pyramid, an increasing age index (Figure 2.4, and 2.5) describes the aging “at the top” of the
population pyramid. The two factors combined points out that the proportion of population of working age
has been shrinking and those even positive migratory movements from abroad cannot avoid the
imbalance in the ratio of the young to the elders from occurring.
Figure 2.3 - Distribution of Italian population in age classes through the last three decades
Source: ISTAT, the Italian National Institute of Statistics
21
Figure 2.4 - Age index in Italy along the last decade (EU average values for 1991 and 2011 are in red)
Source: ISTAT, the Italian National Institute of Statistics
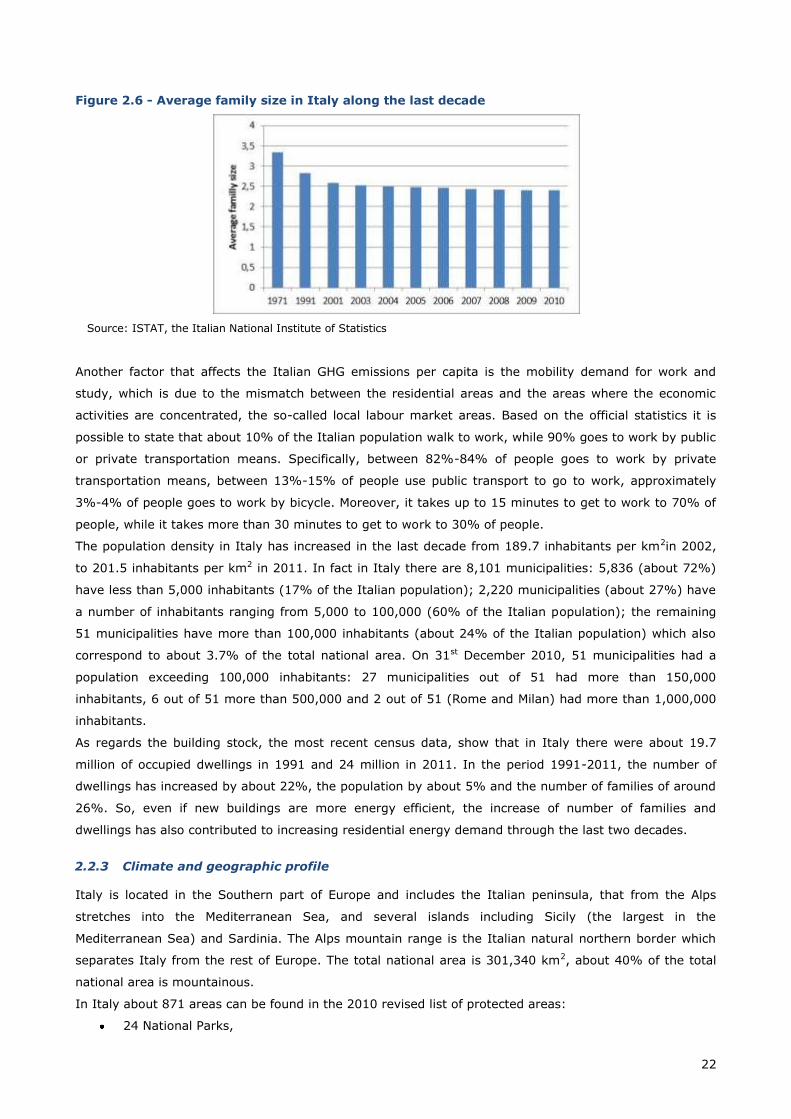
Figure 2.5 - Birth rate in Italy along the last decade and birth rates in 1971 and 1991
Source ISTAT, the Italian National Institute of Statistics
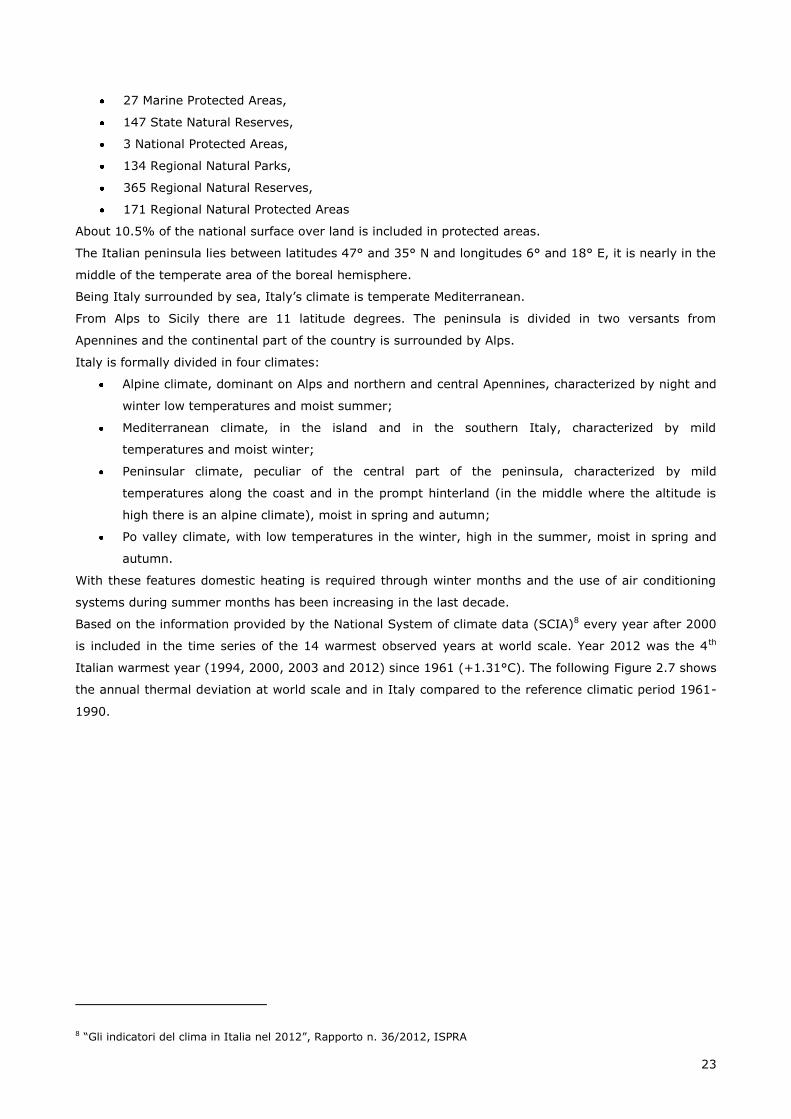
Another characteristic which may affect efficiency consumption patterns and emissions is the average
family size (Figure 2.6). In general small average family size implies greater consumptions, because of a
larger acquisition and use of durable goods as household appliances, cars, etc., previously shared among
a greater number of people. According to the results of annual surveys concerning Italian families, over
the last decade more than 90% of the families lives in dwellings with domestic heating (92% in 2009), a
washing machine (97,4% in 2009) and a dishwasher (42.2% in 2009); the share of families living in
dwellings with an air conditioning system has been increasing since 2001 (10.7% in 2001; 30.8% in
2009)6. In Italy, according to our last census, there are about 22 millions of families with an average size
of 2.6 people per family. The family size has been decreasing from 3.4 to 2.6 in the period 1971-2001, in
2010 it was 2.4 people per family7.
6 “La vita quotidiana nel 2009” Indagine multiscopo annuale sulle famiglie, ISTAT 7 ISTAT
22
Figure 2.6 - Average family size in Italy along the last decade
Source: ISTAT, the Italian National Institute of Statistics
Another factor that affects the Italian GHG emissions per capita is the mobility demand for work and
study, which is due to the mismatch between the residential areas and the areas where the economic
activities are concentrated, the so-called local labour market areas. Based on the official statistics it is
possible to state that about 10% of the Italian population walk to work, while 90% goes to work by public
or private transportation means. Specifically, between 82%-84% of people goes to work by private
transportation means, between 13%-15% of people use public transport to go to work, approximately
3%-4% of people goes to work by bicycle. Moreover, it takes up to 15 minutes to get to work to 70% of
people, while it takes more than 30 minutes to get to work to 30% of people.
The population density in Italy has increased in the last decade from 189.7 inhabitants per km2in 2002,
to 201.5 inhabitants per km2 in 2011. In fact in Italy there are 8,101 municipalities: 5,836 (about 72%)
have less than 5,000 inhabitants (17% of the Italian population); 2,220 municipalities (about 27%) have
a number of inhabitants ranging from 5,000 to 100,000 (60% of the Italian population); the remaining
51 municipalities have more than 100,000 inhabitants (about 24% of the Italian population) which also
correspond to about 3.7% of the total national area. On 31st December 2010, 51 municipalities had a
population exceeding 100,000 inhabitants: 27 municipalities out of 51 had more than 150,000
inhabitants, 6 out of 51 more than 500,000 and 2 out of 51 (Rome and Milan) had more than 1,000,000
inhabitants.
As regards the building stock, the most recent census data, show that in Italy there were about 19.7
million of occupied dwellings in 1991 and 24 million in 2011. In the period 1991-2011, the number of
dwellings has increased by about 22%, the population by about 5% and the number of families of around
26%. So, even if new buildings are more energy efficient, the increase of number of families and
dwellings has also contributed to increasing residential energy demand through the last two decades.
2.2.3 Climate and geographic profile
Italy is located in the Southern part of Europe and includes the Italian peninsula, that from the Alps
stretches into the Mediterranean Sea, and several islands including Sicily (the largest in the
Mediterranean Sea) and Sardinia. The Alps mountain range is the Italian natural northern border which
separates Italy from the rest of Europe. The total national area is 301,340 km2, about 40% of the total
national area is mountainous.
In Italy about 871 areas can be found in the 2010 revised list of protected areas:
24 National Parks,
23
27 Marine Protected Areas,
147 State Natural Reserves,
3 National Protected Areas,
134 Regional Natural Parks,
365 Regional Natural Reserves,
171 Regional Natural Protected Areas
About 10.5% of the national surface over land is included in protected areas.
The Italian peninsula lies between latitudes 47° and 35° N and longitudes 6° and 18° E, it is nearly in the
middle of the temperate area of the boreal hemisphere.
Being Italy surrounded by sea, Italy’s climate is temperate Mediterranean.
From Alps to Sicily there are 11 latitude degrees. The peninsula is divided in two versants from
Apennines and the continental part of the country is surrounded by Alps.
Italy is formally divided in four climates:
Alpine climate, dominant on Alps and northern and central Apennines, characterized by night and
winter low temperatures and moist summer;
Mediterranean climate, in the island and in the southern Italy, characterized by mild
temperatures and moist winter;
Peninsular climate, peculiar of the central part of the peninsula, characterized by mild
temperatures along the coast and in the prompt hinterland (in the middle where the altitude is
high there is an alpine climate), moist in spring and autumn;
Po valley climate, with low temperatures in the winter, high in the summer, moist in spring and
autumn.
With these features domestic heating is required through winter months and the use of air conditioning
systems during summer months has been increasing in the last decade.
Based on the information provided by the National System of climate data (SCIA)8 every year after 2000
is included in the time series of the 14 warmest observed years at world scale. Year 2012 was the 4th
Italian warmest year (1994, 2000, 2003 and 2012) since 1961 (+1.31°C). The following Figure 2.7 shows
the annual thermal deviation at world scale and in Italy compared to the reference climatic period 1961-
1990.
8 “Gli indicatori del clima in Italia nel 2012”, Rapporto n. 36/2012, ISPRA
24
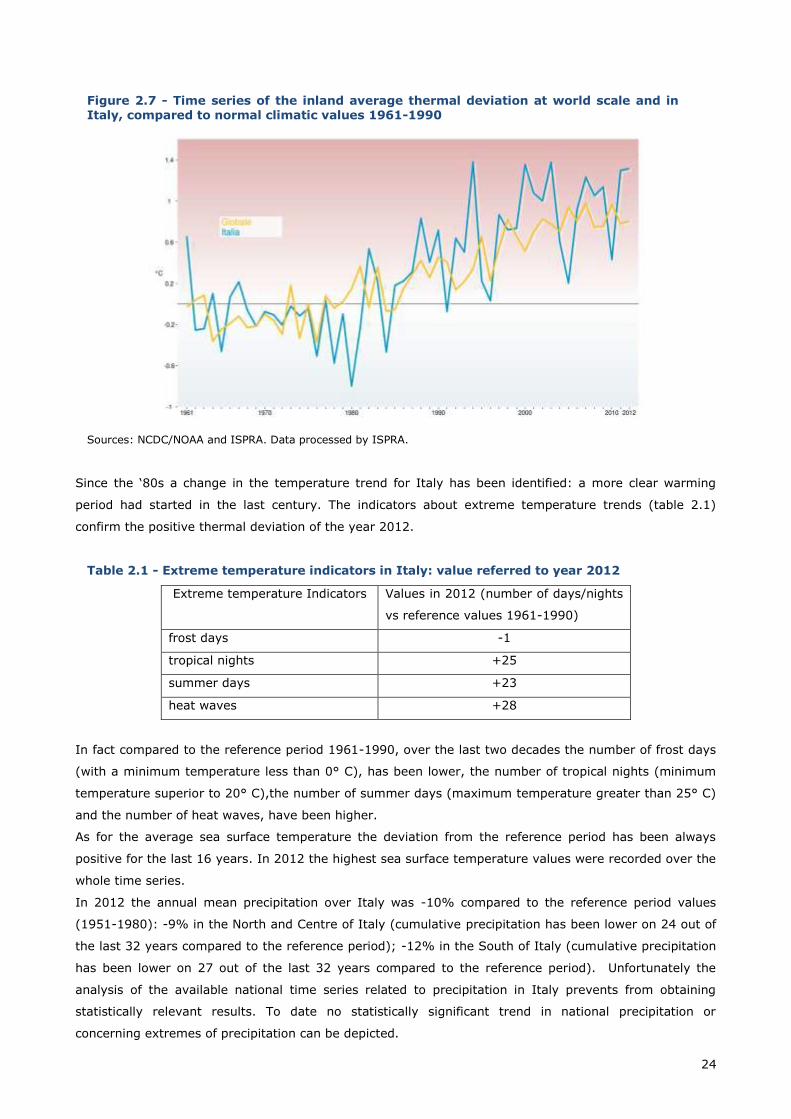
Figure 2.7 - Time series of the inland average thermal deviation at world scale and in Italy, compared to normal climatic values 1961-1990
Sources: NCDC/NOAA and ISPRA. Data processed by ISPRA.
Since the ‘80s a change in the temperature trend for Italy has been identified: a more clear warming
period had started in the last century. The indicators about extreme temperature trends (table 2.1)
confirm the positive thermal deviation of the year 2012.
Table 2.1 - Extreme temperature indicators in Italy: value referred to year 2012
Extreme temperature Indicators Values in 2012 (number of days/nights
vs reference values 1961-1990)
frost days -1
tropical nights +25
summer days +23
heat waves +28
In fact compared to the reference period 1961-1990, over the last two decades the number of frost days
(with a minimum temperature less than 0° C), has been lower, the number of tropical nights (minimum
temperature superior to 20° C),the number of summer days (maximum temperature greater than 25° C)
and the number of heat waves, have been higher.
As for the average sea surface temperature the deviation from the reference period has been always
positive for the last 16 years. In 2012 the highest sea surface temperature values were recorded over the
whole time series.
In 2012 the annual mean precipitation over Italy was -10% compared to the reference period values
(1951-1980): -9% in the North and Centre of Italy (cumulative precipitation has been lower on 24 out of
the last 32 years compared to the reference period); -12% in the South of Italy (cumulative precipitation
has been lower on 27 out of the last 32 years compared to the reference period). Unfortunately the
analysis of the available national time series related to precipitation in Italy prevents from obtaining
statistically relevant results. To date no statistically significant trend in national precipitation or
concerning extremes of precipitation can be depicted.
25
Changes of the average sea level are statistically not significant too, no relevant changes in the
Mediterranean sea level have in fact been recorded compared to the reference time period.
2.2.4 Economic profile and industry
Italy was the fifth largest economy by nominal GDP in the world in 1990 and its rank has been decreasing
since then. Italy is the world’s ninth largest economy, in 2012 the GDP at current prices was 1,565,916,
million € against 1,578,497 million € in 2011.
During the last decade a global financial and economic crisis hit the advanced economies in 2007-2009
thus resulting into severe recession in the EU, Japan and the United States. By the end of 2009 and in
2010 a general recovery in the economies appeared to pick up but since 2011 the growth rate of the
major advanced economies, especially in Europe, has been decelerating (Figure 2.8). Between 2012 and
2013, Italy, like many advanced economies, has moved into recession again: GDP fell by 5.5% in 2009
and by 2,4% in 2012.
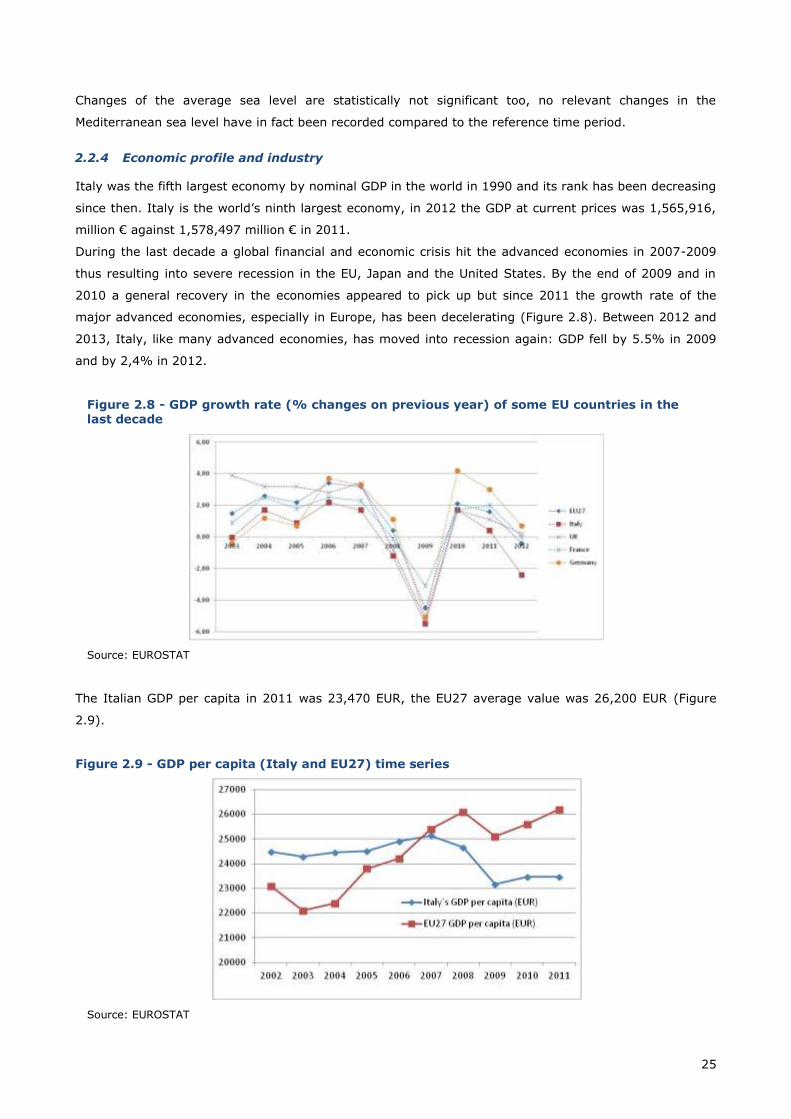
Figure 2.8 - GDP growth rate (% changes on previous year) of some EU countries in the last decade
Source: EUROSTAT
The Italian GDP per capita in 2011 was 23,470 EUR, the EU27 average value was 26,200 EUR (Figure
2.9).
Figure 2.9 - GDP per capita (Italy and EU27) time series
Source: EUROSTAT
26
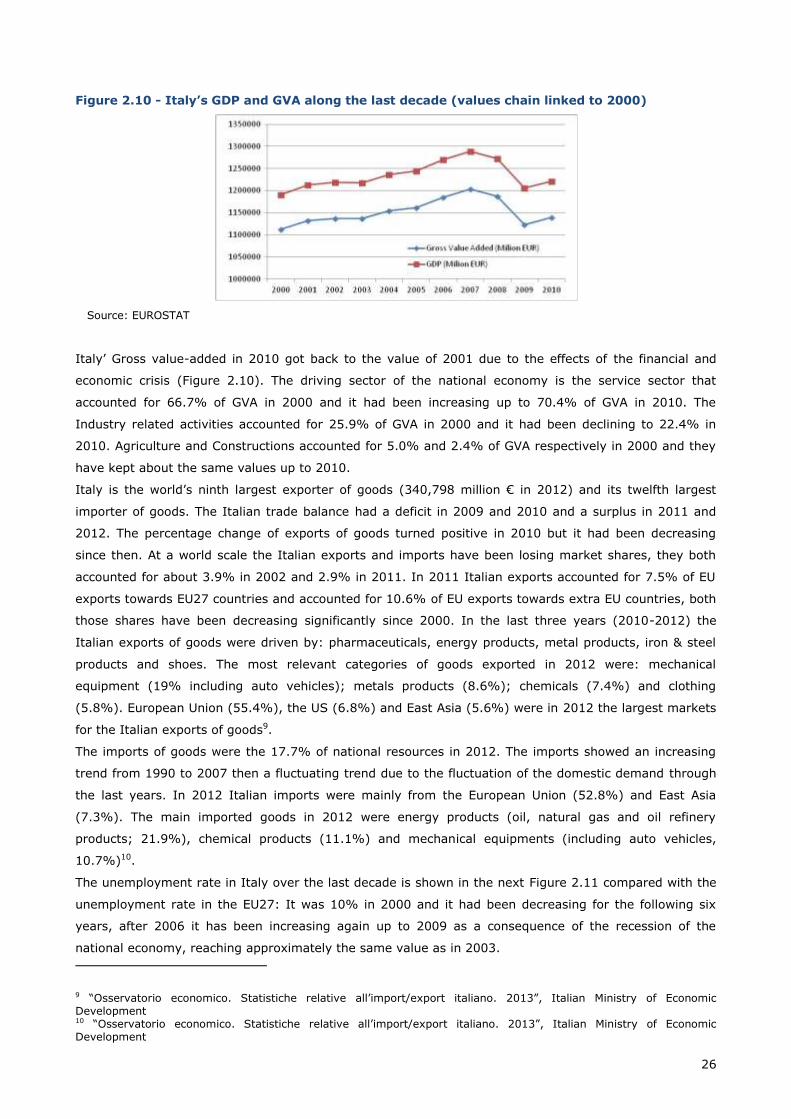
Figure 2.10 - Italy’s GDP and GVA along the last decade (values chain linked to 2000)
Source: EUROSTAT
Italy’ Gross value-added in 2010 got back to the value of 2001 due to the effects of the financial and
economic crisis (Figure 2.10). The driving sector of the national economy is the service sector that
accounted for 66.7% of GVA in 2000 and it had been increasing up to 70.4% of GVA in 2010. The
Industry related activities accounted for 25.9% of GVA in 2000 and it had been declining to 22.4% in
2010. Agriculture and Constructions accounted for 5.0% and 2.4% of GVA respectively in 2000 and they
have kept about the same values up to 2010.
Italy is the world’s ninth largest exporter of goods (340,798 million € in 2012) and its twelfth largest
importer of goods. The Italian trade balance had a deficit in 2009 and 2010 and a surplus in 2011 and
2012. The percentage change of exports of goods turned positive in 2010 but it had been decreasing
since then. At a world scale the Italian exports and imports have been losing market shares, they both
accounted for about 3.9% in 2002 and 2.9% in 2011. In 2011 Italian exports accounted for 7.5% of EU
exports towards EU27 countries and accounted for 10.6% of EU exports towards extra EU countries, both
those shares have been decreasing significantly since 2000. In the last three years (2010-2012) the
Italian exports of goods were driven by: pharmaceuticals, energy products, metal products, iron & steel
products and shoes. The most relevant categories of goods exported in 2012 were: mechanical
equipment (19% including auto vehicles); metals products (8.6%); chemicals (7.4%) and clothing
(5.8%). European Union (55.4%), the US (6.8%) and East Asia (5.6%) were in 2012 the largest markets
for the Italian exports of goods9.
The imports of goods were the 17.7% of national resources in 2012. The imports showed an increasing
trend from 1990 to 2007 then a fluctuating trend due to the fluctuation of the domestic demand through
the last years. In 2012 Italian imports were mainly from the European Union (52.8%) and East Asia
(7.3%). The main imported goods in 2012 were energy products (oil, natural gas and oil refinery
products; 21.9%), chemical products (11.1%) and mechanical equipments (including auto vehicles,
10.7%)10.
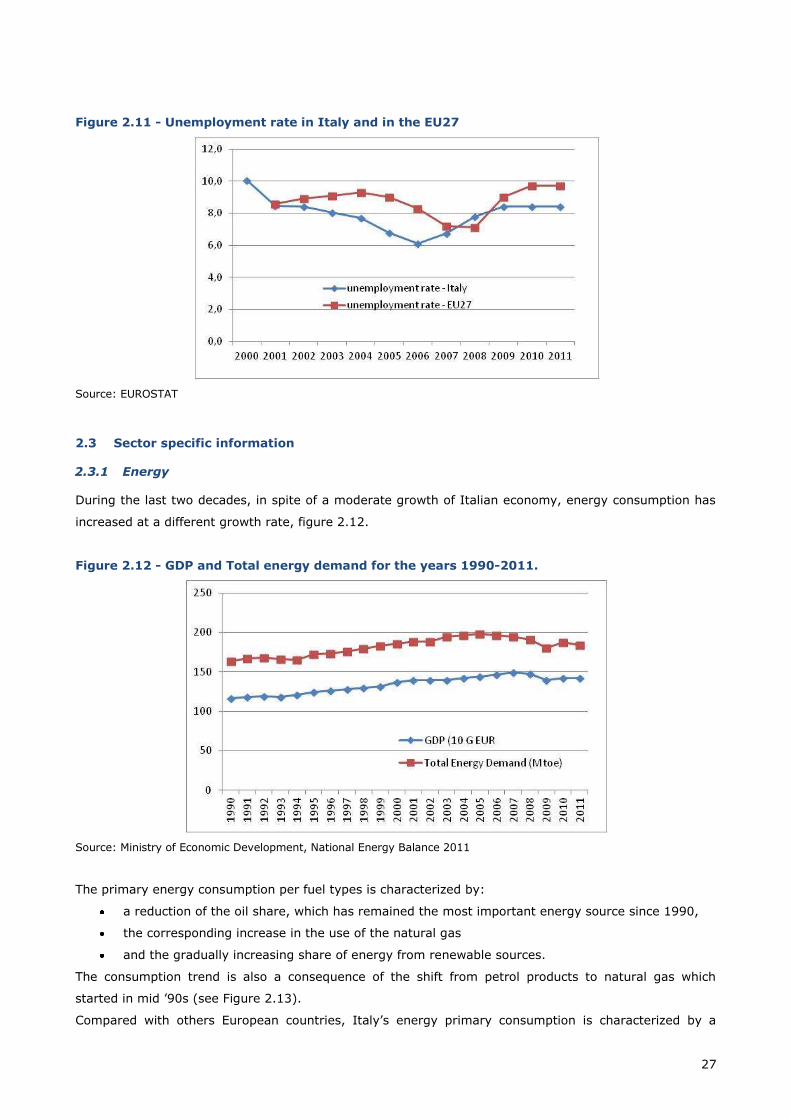
The unemployment rate in Italy over the last decade is shown in the next Figure 2.11 compared with the
unemployment rate in the EU27: It was 10% in 2000 and it had been decreasing for the following six
years, after 2006 it has been increasing again up to 2009 as a consequence of the recession of the
national economy, reaching approximately the same value as in 2003.
9 “Osservatorio economico. Statistiche relative all’import/export italiano. 2013”, Italian Ministry of Economic Development 10 “Osservatorio economico. Statistiche relative all’import/export italiano. 2013”, Italian Ministry of Economic Development
27
Figure 2.11 - Unemployment rate in Italy and in the EU27
Source: EUROSTAT
2.3 Sector specific information
2.3.1 Energy
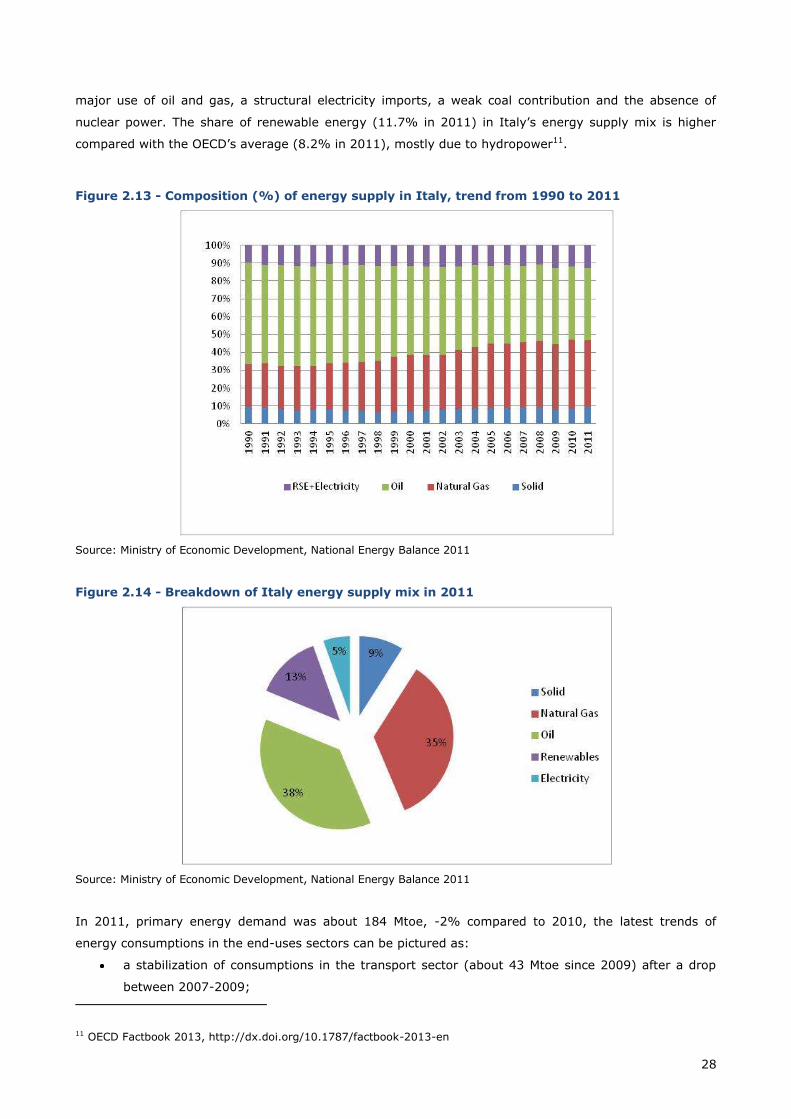
During the last two decades, in spite of a moderate growth of Italian economy, energy consumption has
increased at a different growth rate, figure 2.12.
Figure 2.12 - GDP and Total energy demand for the years 1990-2011.
Source: Ministry of Economic Development, National Energy Balance 2011
The primary energy consumption per fuel types is characterized by:
a reduction of the oil share, which has remained the most important energy source since 1990,
the corresponding increase in the use of the natural gas
and the gradually increasing share of energy from renewable sources.
The consumption trend is also a consequence of the shift from petrol products to natural gas which
started in mid ’90s (see Figure 2.13).
Compared with others European countries, Italy’s energy primary consumption is characterized by a
28
major use of oil and gas, a structural electricity imports, a weak coal contribution and the absence of
nuclear power. The share of renewable energy (11.7% in 2011) in Italy’s energy supply mix is higher
compared with the OECD’s average (8.2% in 2011), mostly due to hydropower11.
Figure 2.13 - Composition (%) of energy supply in Italy, trend from 1990 to 2011
Source: Ministry of Economic Development, National Energy Balance 2011
Figure 2.14 - Breakdown of Italy energy supply mix in 2011
Source: Ministry of Economic Development, National Energy Balance 2011
In 2011, primary energy demand was about 184 Mtoe, -2% compared to 2010, the latest trends of
energy consumptions in the end-uses sectors can be pictured as:
a stabilization of consumptions in the transport sector (about 43 Mtoe since 2009) after a drop
between 2007-2009;
11 OECD Factbook 2013, http://dx.doi.org/10.1787/factbook-2013-en
29
an overall increase in the trend consumption in the civil sector driven mainly by the consumptions
in the service sector which has been increasing from 1990 up to 2005, while consumptions in the
residential sectors basically have been fluctuating around 25 Mtoe since 1990;
energy consumptions in the industry sector have been decreasing since 2004. The fall in energy
consumption recorded in 2009 (-24% on 2008) was of course related to the national economy
moving into recession and to the fall of the industrial production. In general the decreasing trend
is mainly due to the heavy drop of consumptions in the petrochemical sector and to the energy
consumptions for mechanics, textile and agri-food which have got back to the early ‘90s levels.
The preliminary value for the national energy bill for 2012 is 64.4 billion € (4.1% of the GDP, during the
‘90s the average energy bill accounted for 1.5% of the GDP), table 2.2 summarizes the values of the
energy bill along the last two decades.
Table 2.2 - Energy gross domestic consumption, energy intensity, electrical intensity
1990 1995 2000 2005 2010 2011 2012
(M€)
Solid fuel 731 991 1,009 1,892 2,270 2,936 2,773
Natural Gas 1,859 2,661 7,835 12,194 18,998 21,116 24,004
Oil 8,561 9,023 18,653 22,412 28,432 34,549 33,916
Biofuels and biomass - - 67 135 1,129 1,587 1,345
Others 867 1,563 1,523 2,135 2,409 2,736 2,388
total 12,018 14,238 29,087 38,768 53,238 62,924 64,426
The increasing of the energy bill has been due to the increasing of natural gas imports and, especially, to
the increasing prices of energy sources (together with the trend in the US$/€ exchange rate). The oil bill
accounted for 53% of the total energy bill, the decrease of oil imports in 2012 has been compensated by
the increase of the average price paid for 1 ton of oil in the same year.
The energy dependence of Italy from abroad is high compared with the EU27 average (82.1% in 2010 in
Italy; 54.1% in 2010 in EU) as shown in the following table 2.3.
Table 2.3 - Total energy dependence (Italy and EU)
Energy dependence 1990 1995 2000 2005 2010 2011
Italy 82.3 80.3 83.7 85.0 82.1 80.7
EU 47.8 53.9 54.1
Energy end-uses total consumption in 2011 was of 137.4 Mtoe, of which 34% related to the tertiary
sector (residential, public and tertiary sectors) and 31% to the transports sector. Industrial sector
account for 24% of total end-uses energy consumption, as shown in the following figure:
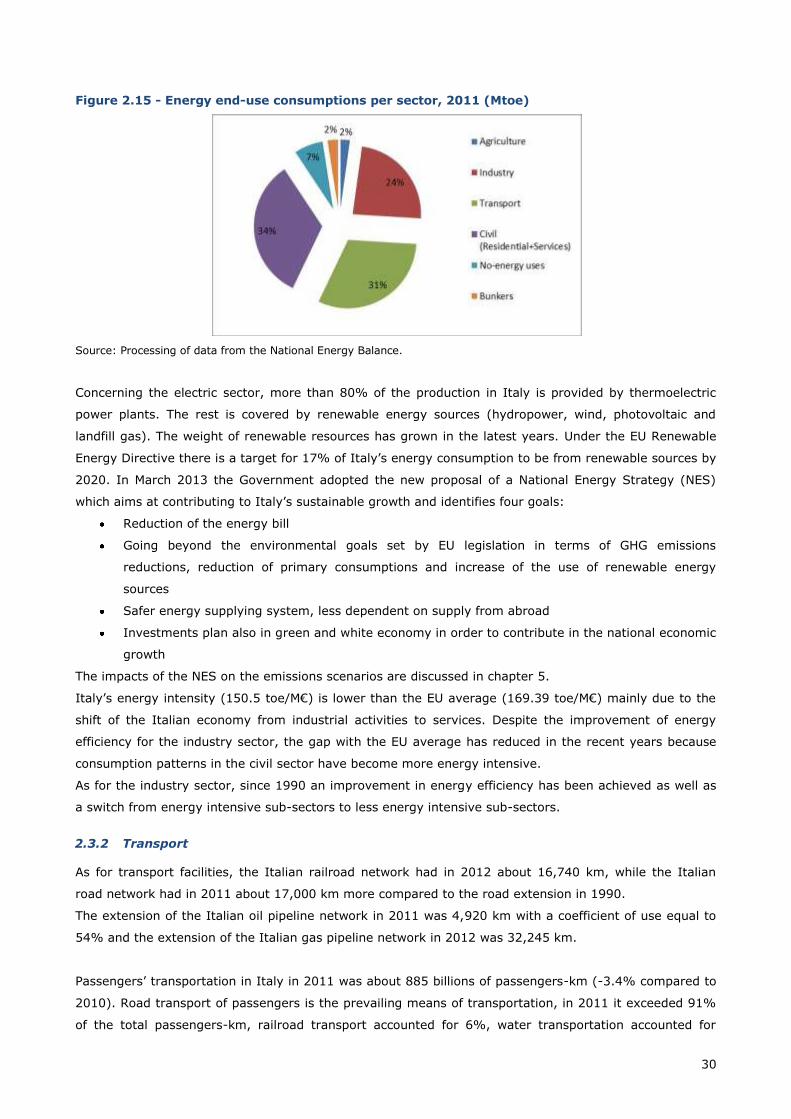
30
Figure 2.15 - Energy end-use consumptions per sector, 2011 (Mtoe)
Source: Processing of data from the National Energy Balance.
Concerning the electric sector, more than 80% of the production in Italy is provided by thermoelectric
power plants. The rest is covered by renewable energy sources (hydropower, wind, photovoltaic and
landfill gas). The weight of renewable resources has grown in the latest years. Under the EU Renewable
Energy Directive there is a target for 17% of Italy’s energy consumption to be from renewable sources by
2020. In March 2013 the Government adopted the new proposal of a National Energy Strategy (NES)
which aims at contributing to Italy’s sustainable growth and identifies four goals:
Reduction of the energy bill
Going beyond the environmental goals set by EU legislation in terms of GHG emissions
reductions, reduction of primary consumptions and increase of the use of renewable energy
sources
Safer energy supplying system, less dependent on supply from abroad
Investments plan also in green and white economy in order to contribute in the national economic
growth
The impacts of the NES on the emissions scenarios are discussed in chapter 5.
Italy’s energy intensity (150.5 toe/M€) is lower than the EU average (169.39 toe/M€) mainly due to the
shift of the Italian economy from industrial activities to services. Despite the improvement of energy
efficiency for the industry sector, the gap with the EU average has reduced in the recent years because
consumption patterns in the civil sector have become more energy intensive.
As for the industry sector, since 1990 an improvement in energy efficiency has been achieved as well as
a switch from energy intensive sub-sectors to less energy intensive sub-sectors.
2.3.2 Transport
As for transport facilities, the Italian railroad network had in 2012 about 16,740 km, while the Italian
road network had in 2011 about 17,000 km more compared to the road extension in 1990.
The extension of the Italian oil pipeline network in 2011 was 4,920 km with a coefficient of use equal to
54% and the extension of the Italian gas pipeline network in 2012 was 32,245 km.
Passengers’ transportation in Italy in 2011 was about 885 billions of passengers-km (-3.4% compared to
2010). Road transport of passengers is the prevailing means of transportation, in 2011 it exceeded 91%
of the total passengers-km, railroad transport accounted for 6%, water transportation accounted for
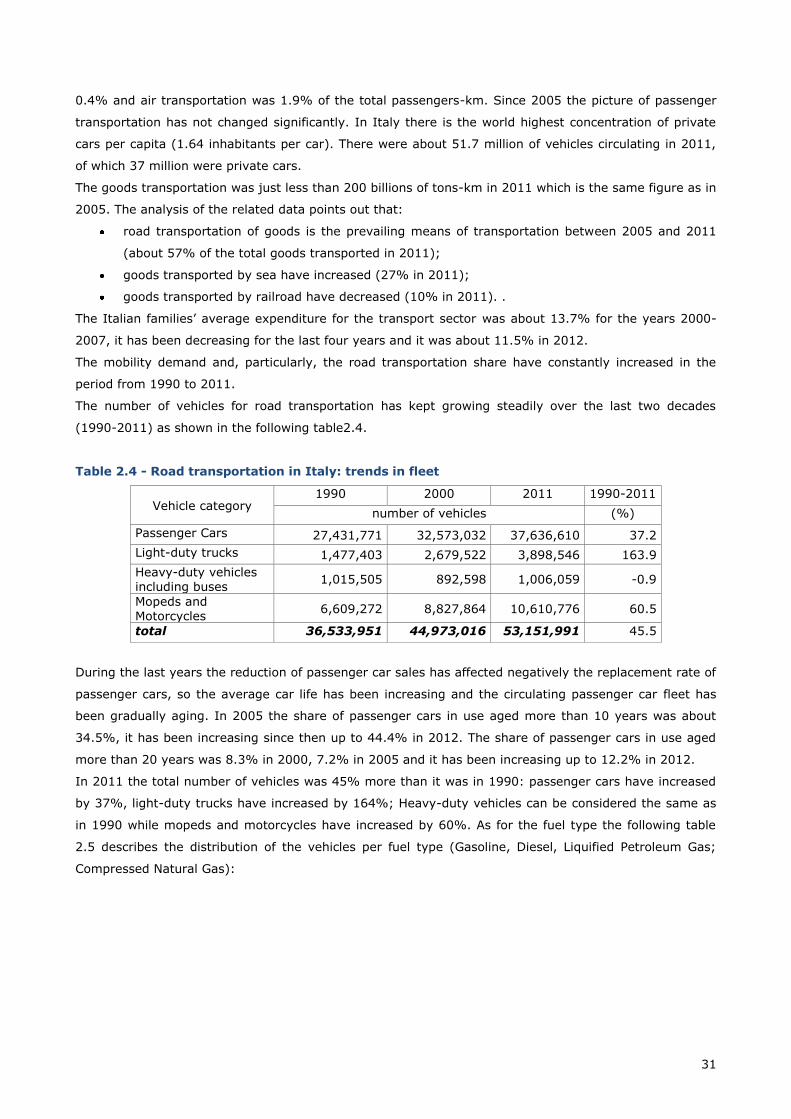
31
0.4% and air transportation was 1.9% of the total passengers-km. Since 2005 the picture of passenger
transportation has not changed significantly. In Italy there is the world highest concentration of private
cars per capita (1.64 inhabitants per car). There were about 51.7 million of vehicles circulating in 2011,
of which 37 million were private cars.
The goods transportation was just less than 200 billions of tons-km in 2011 which is the same figure as in
2005. The analysis of the related data points out that:
road transportation of goods is the prevailing means of transportation between 2005 and 2011
(about 57% of the total goods transported in 2011);
goods transported by sea have increased (27% in 2011);
goods transported by railroad have decreased (10% in 2011). .
The Italian families’ average expenditure for the transport sector was about 13.7% for the years 2000-
2007, it has been decreasing for the last four years and it was about 11.5% in 2012.
The mobility demand and, particularly, the road transportation share have constantly increased in the
period from 1990 to 2011.
The number of vehicles for road transportation has kept growing steadily over the last two decades
(1990-2011) as shown in the following table2.4.
Table 2.4 - Road transportation in Italy: trends in fleet
Vehicle category 1990 2000 2011 1990-2011
number of vehicles (%)
Passenger Cars 27,431,771 32,573,032 37,636,610 37.2
Light-duty trucks 1,477,403 2,679,522 3,898,546 163.9
Heavy-duty vehicles including buses
1,015,505 892,598 1,006,059 -0.9
Mopeds and Motorcycles
6,609,272 8,827,864 10,610,776 60.5
total 36,533,951 44,973,016 53,151,991 45.5
During the last years the reduction of passenger car sales has affected negatively the replacement rate of
passenger cars, so the average car life has been increasing and the circulating passenger car fleet has
been gradually aging. In 2005 the share of passenger cars in use aged more than 10 years was about
34.5%, it has been increasing since then up to 44.4% in 2012. The share of passenger cars in use aged
more than 20 years was 8.3% in 2000, 7.2% in 2005 and it has been increasing up to 12.2% in 2012.
In 2011 the total number of vehicles was 45% more than it was in 1990: passenger cars have increased
by 37%, light-duty trucks have increased by 164%; Heavy-duty vehicles can be considered the same as
in 1990 while mopeds and motorcycles have increased by 60%. As for the fuel type the following table
2.5 describes the distribution of the vehicles per fuel type (Gasoline, Diesel, Liquified Petroleum Gas;
Compressed Natural Gas):
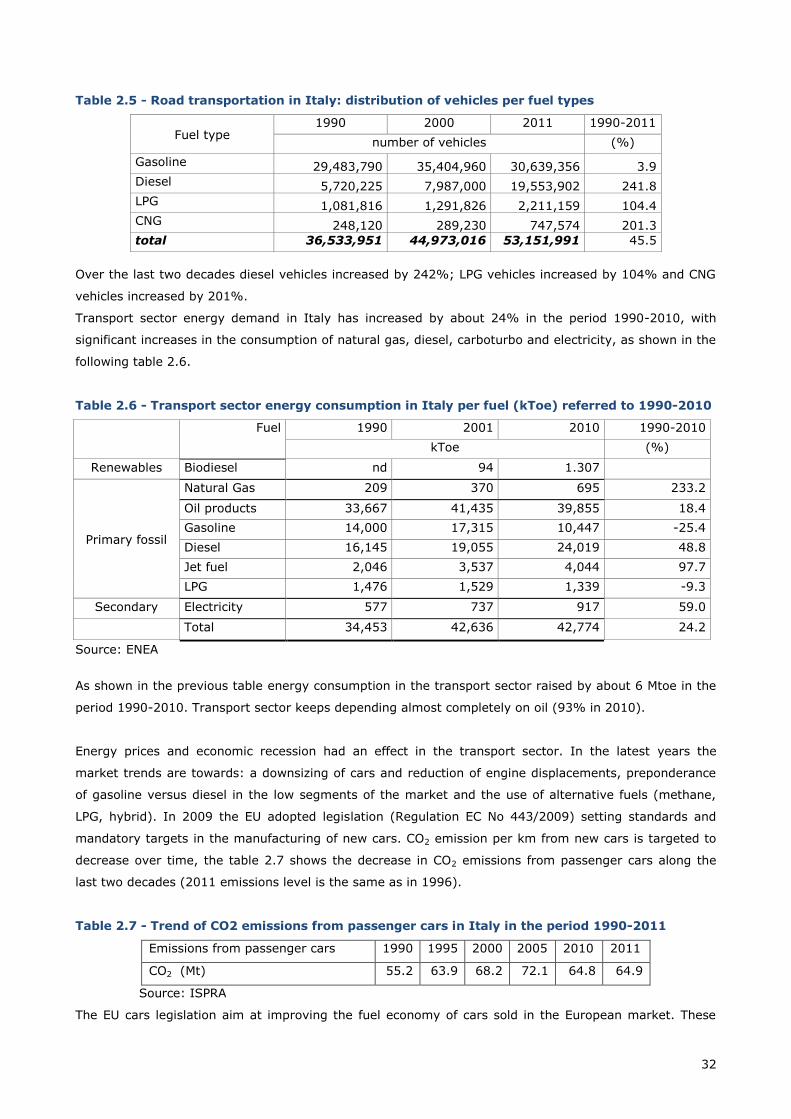
32
Table 2.5 - Road transportation in Italy: distribution of vehicles per fuel types
Fuel type 1990 2000 2011 1990-2011
number of vehicles (%)
Gasoline 29,483,790 35,404,960 30,639,356 3.9
Diesel 5,720,225 7,987,000 19,553,902 241.8
LPG 1,081,816 1,291,826 2,211,159 104.4
CNG 248,120 289,230 747,574 201.3
total 36,533,951 44,973,016 53,151,991 45.5
Over the last two decades diesel vehicles increased by 242%; LPG vehicles increased by 104% and CNG
vehicles increased by 201%.
Transport sector energy demand in Italy has increased by about 24% in the period 1990-2010, with
significant increases in the consumption of natural gas, diesel, carboturbo and electricity, as shown in the
following table 2.6.
Table 2.6 - Transport sector energy consumption in Italy per fuel (kToe) referred to 1990-2010
Fuel 1990 2001 2010 1990-2010
kToe (%)
Renewables Biodiesel nd 94 1.307
Primary fossil
Natural Gas 209 370 695 233.2
Oil products 33,667 41,435 39,855 18.4
Gasoline 14,000 17,315 10,447 -25.4
Diesel 16,145 19,055 24,019 48.8
Jet fuel 2,046 3,537 4,044 97.7
LPG 1,476 1,529 1,339 -9.3
Secondary Electricity 577 737 917 59.0
Total 34,453 42,636 42,774 24.2
Source: ENEA
As shown in the previous table energy consumption in the transport sector raised by about 6 Mtoe in the
period 1990-2010. Transport sector keeps depending almost completely on oil (93% in 2010).
Energy prices and economic recession had an effect in the transport sector. In the latest years the
market trends are towards: a downsizing of cars and reduction of engine displacements, preponderance
of gasoline versus diesel in the low segments of the market and the use of alternative fuels (methane,
LPG, hybrid). In 2009 the EU adopted legislation (Regulation EC No 443/2009) setting standards and
mandatory targets in the manufacturing of new cars. CO2 emission per km from new cars is targeted to
decrease over time, the table 2.7 shows the decrease in CO2 emissions from passenger cars along the
last two decades (2011 emissions level is the same as in 1996).
Table 2.7 - Trend of CO2 emissions from passenger cars in Italy in the period 1990-2011
Emissions from passenger cars 1990 1995 2000 2005 2010 2011
CO2 (Mt) 55.2 63.9 68.2 72.1 64.8 64.9
Source: ISPRA
The EU cars legislation aim at improving the fuel economy of cars sold in the European market. These
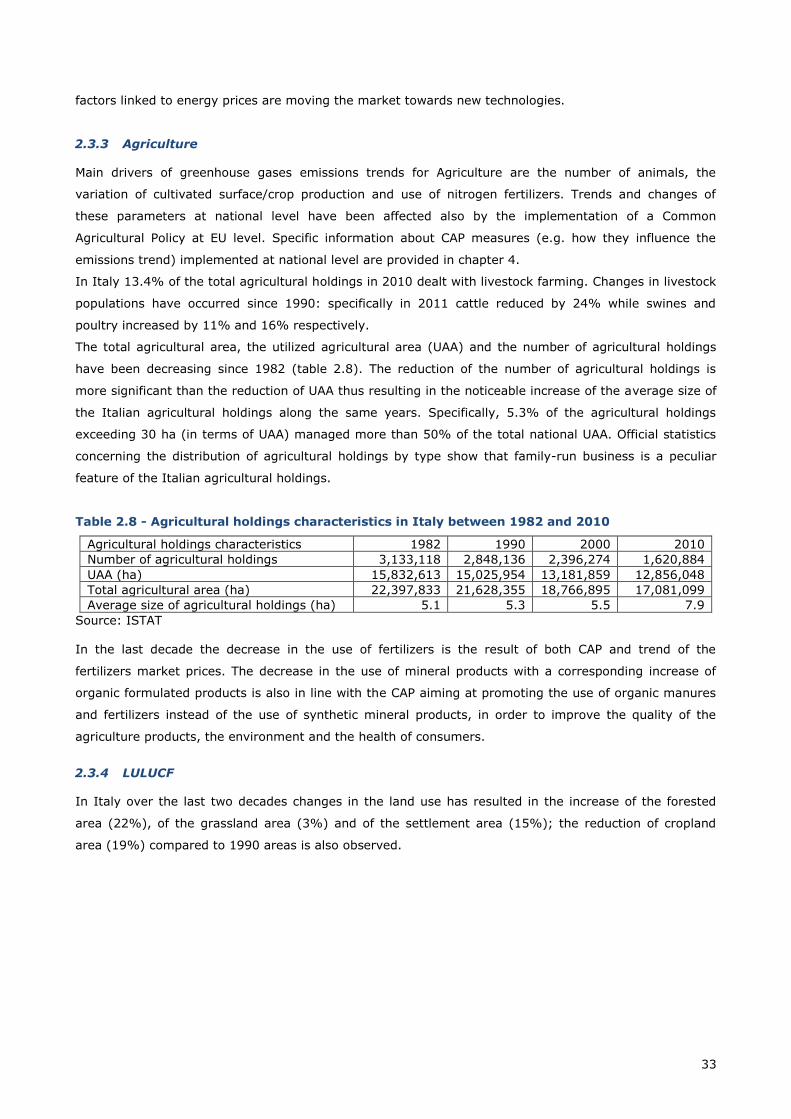
33
factors linked to energy prices are moving the market towards new technologies.
2.3.3 Agriculture
Main drivers of greenhouse gases emissions trends for Agriculture are the number of animals, the
variation of cultivated surface/crop production and use of nitrogen fertilizers. Trends and changes of
these parameters at national level have been affected also by the implementation of a Common
Agricultural Policy at EU level. Specific information about CAP measures (e.g. how they influence the
emissions trend) implemented at national level are provided in chapter 4.
In Italy 13.4% of the total agricultural holdings in 2010 dealt with livestock farming. Changes in livestock
populations have occurred since 1990: specifically in 2011 cattle reduced by 24% while swines and
poultry increased by 11% and 16% respectively.
The total agricultural area, the utilized agricultural area (UAA) and the number of agricultural holdings
have been decreasing since 1982 (table 2.8). The reduction of the number of agricultural holdings is
more significant than the reduction of UAA thus resulting in the noticeable increase of the average size of
the Italian agricultural holdings along the same years. Specifically, 5.3% of the agricultural holdings
exceeding 30 ha (in terms of UAA) managed more than 50% of the total national UAA. Official statistics
concerning the distribution of agricultural holdings by type show that family-run business is a peculiar
feature of the Italian agricultural holdings.
Table 2.8 - Agricultural holdings characteristics in Italy between 1982 and 2010
Agricultural holdings characteristics 1982 1990 2000 2010
Number of agricultural holdings 3,133,118 2,848,136 2,396,274 1,620,884
UAA (ha) 15,832,613 15,025,954 13,181,859 12,856,048
Total agricultural area (ha) 22,397,833 21,628,355 18,766,895 17,081,099
Average size of agricultural holdings (ha) 5.1 5.3 5.5 7.9
Source: ISTAT
In the last decade the decrease in the use of fertilizers is the result of both CAP and trend of the
fertilizers market prices. The decrease in the use of mineral products with a corresponding increase of
organic formulated products is also in line with the CAP aiming at promoting the use of organic manures
and fertilizers instead of the use of synthetic mineral products, in order to improve the quality of the
agriculture products, the environment and the health of consumers.
2.3.4 LULUCF
In Italy over the last two decades changes in the land use has resulted in the increase of the forested
area (22%), of the grassland area (3%) and of the settlement area (15%); the reduction of cropland
area (19%) compared to 1990 areas is also observed.
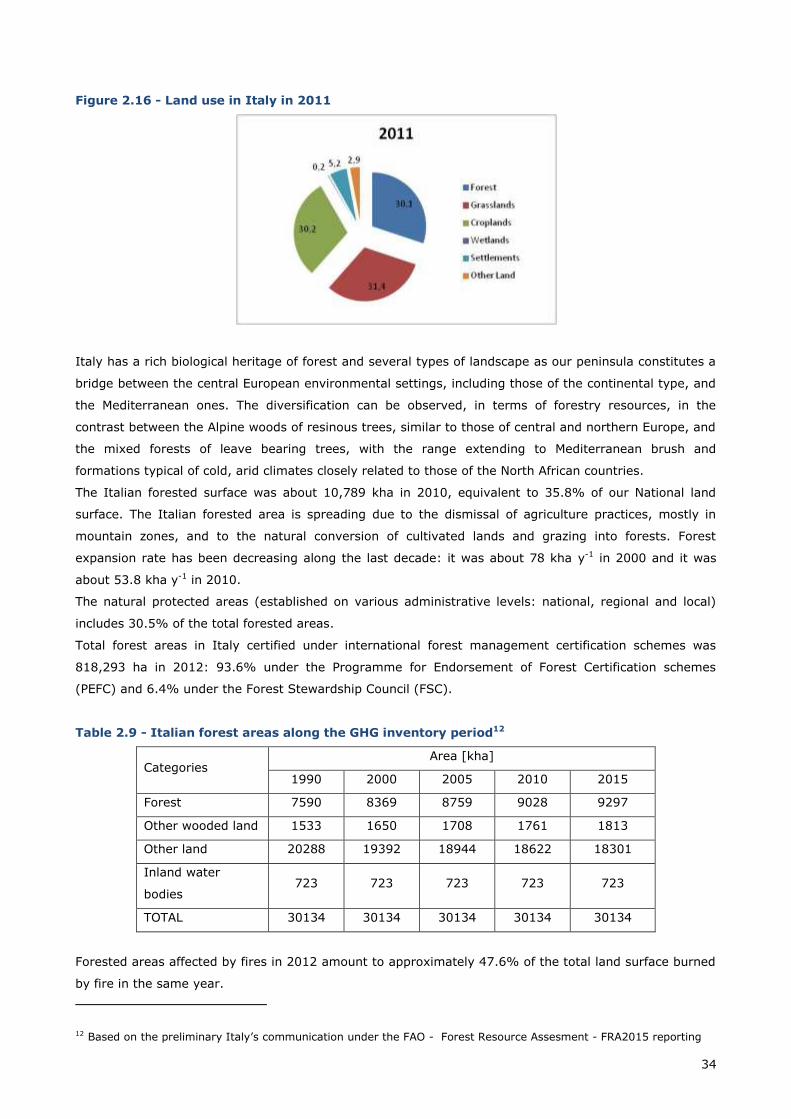
34
Figure 2.16 - Land use in Italy in 2011
Italy has a rich biological heritage of forest and several types of landscape as our peninsula constitutes a
bridge between the central European environmental settings, including those of the continental type, and
the Mediterranean ones. The diversification can be observed, in terms of forestry resources, in the
contrast between the Alpine woods of resinous trees, similar to those of central and northern Europe, and
the mixed forests of leave bearing trees, with the range extending to Mediterranean brush and
formations typical of cold, arid climates closely related to those of the North African countries.
The Italian forested surface was about 10,789 kha in 2010, equivalent to 35.8% of our National land
surface. The Italian forested area is spreading due to the dismissal of agriculture practices, mostly in
mountain zones, and to the natural conversion of cultivated lands and grazing into forests. Forest
expansion rate has been decreasing along the last decade: it was about 78 kha y-1 in 2000 and it was
about 53.8 kha y-1 in 2010.
The natural protected areas (established on various administrative levels: national, regional and local)
includes 30.5% of the total forested areas.
Total forest areas in Italy certified under international forest management certification schemes was
818,293 ha in 2012: 93.6% under the Programme for Endorsement of Forest Certification schemes
(PEFC) and 6.4% under the Forest Stewardship Council (FSC).
Table 2.9 - Italian forest areas along the GHG inventory period12
Categories Area [kha]
1990 2000 2005 2010 2015
Forest 7590 8369 8759 9028 9297
Other wooded land 1533 1650 1708 1761 1813
Other land 20288 19392 18944 18622 18301
Inland water
bodies 723 723 723 723 723
TOTAL 30134 30134 30134 30134 30134
Forested areas affected by fires in 2012 amount to approximately 47.6% of the total land surface burned
by fire in the same year.
12 Based on the preliminary Italy’s communication under the FAO - Forest Resource Assesment - FRA2015 reporting
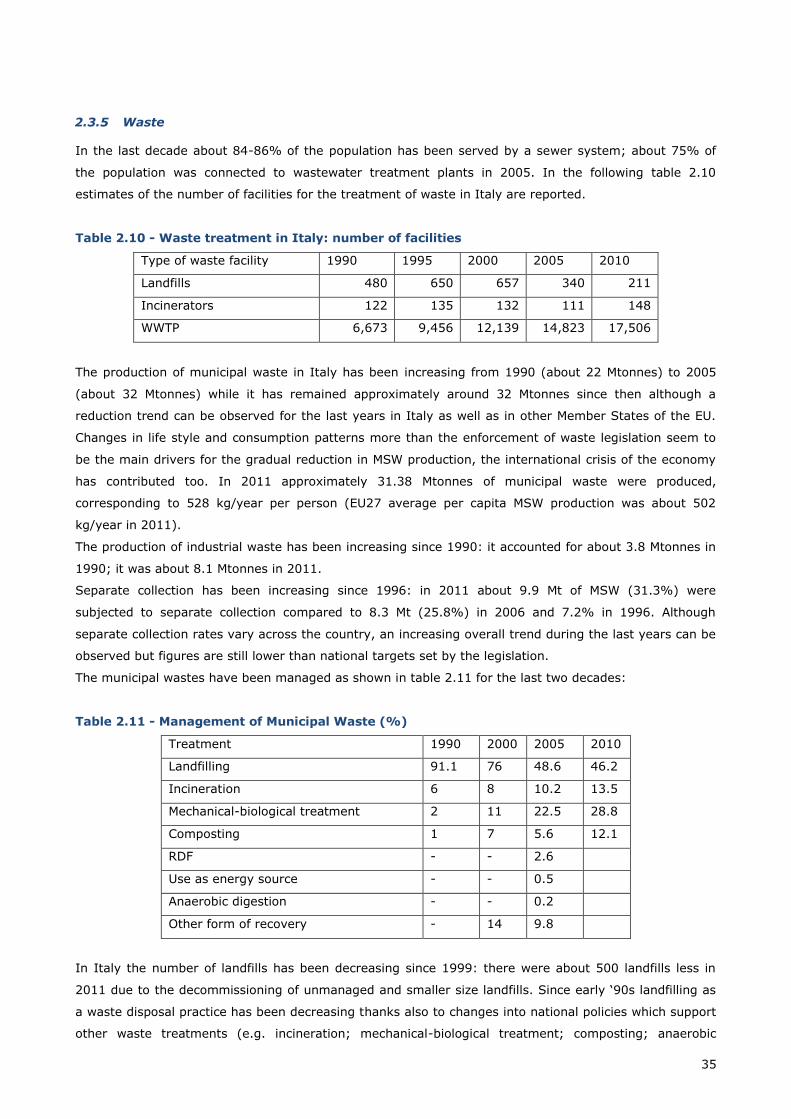
35
2.3.5 Waste
In the last decade about 84-86% of the population has been served by a sewer system; about 75% of
the population was connected to wastewater treatment plants in 2005. In the following table 2.10
estimates of the number of facilities for the treatment of waste in Italy are reported.
Table 2.10 - Waste treatment in Italy: number of facilities
Type of waste facility 1990 1995 2000 2005 2010
Landfills 480 650 657 340 211
Incinerators 122 135 132 111 148
WWTP 6,673 9,456 12,139 14,823 17,506
The production of municipal waste in Italy has been increasing from 1990 (about 22 Mtonnes) to 2005
(about 32 Mtonnes) while it has remained approximately around 32 Mtonnes since then although a
reduction trend can be observed for the last years in Italy as well as in other Member States of the EU.
Changes in life style and consumption patterns more than the enforcement of waste legislation seem to
be the main drivers for the gradual reduction in MSW production, the international crisis of the economy
has contributed too. In 2011 approximately 31.38 Mtonnes of municipal waste were produced,
corresponding to 528 kg/year per person (EU27 average per capita MSW production was about 502
kg/year in 2011).
The production of industrial waste has been increasing since 1990: it accounted for about 3.8 Mtonnes in
1990; it was about 8.1 Mtonnes in 2011.
Separate collection has been increasing since 1996: in 2011 about 9.9 Mt of MSW (31.3%) were
subjected to separate collection compared to 8.3 Mt (25.8%) in 2006 and 7.2% in 1996. Although
separate collection rates vary across the country, an increasing overall trend during the last years can be
observed but figures are still lower than national targets set by the legislation.
The municipal wastes have been managed as shown in table 2.11 for the last two decades:
Table 2.11 - Management of Municipal Waste (%)
Treatment 1990 2000 2005 2010
Landfilling 91.1 76 48.6 46.2
Incineration 6 8 10.2 13.5
Mechanical-biological treatment 2 11 22.5 28.8
Composting 1 7 5.6 12.1
RDF - - 2.6
Use as energy source - - 0.5
Anaerobic digestion - - 0.2
Other form of recovery - 14 9.8
In Italy the number of landfills has been decreasing since 1999: there were about 500 landfills less in
2011 due to the decommissioning of unmanaged and smaller size landfills. Since early ‘90s landfilling as
a waste disposal practice has been decreasing thanks also to changes into national policies which support
other waste treatments (e.g. incineration; mechanical-biological treatment; composting; anaerobic
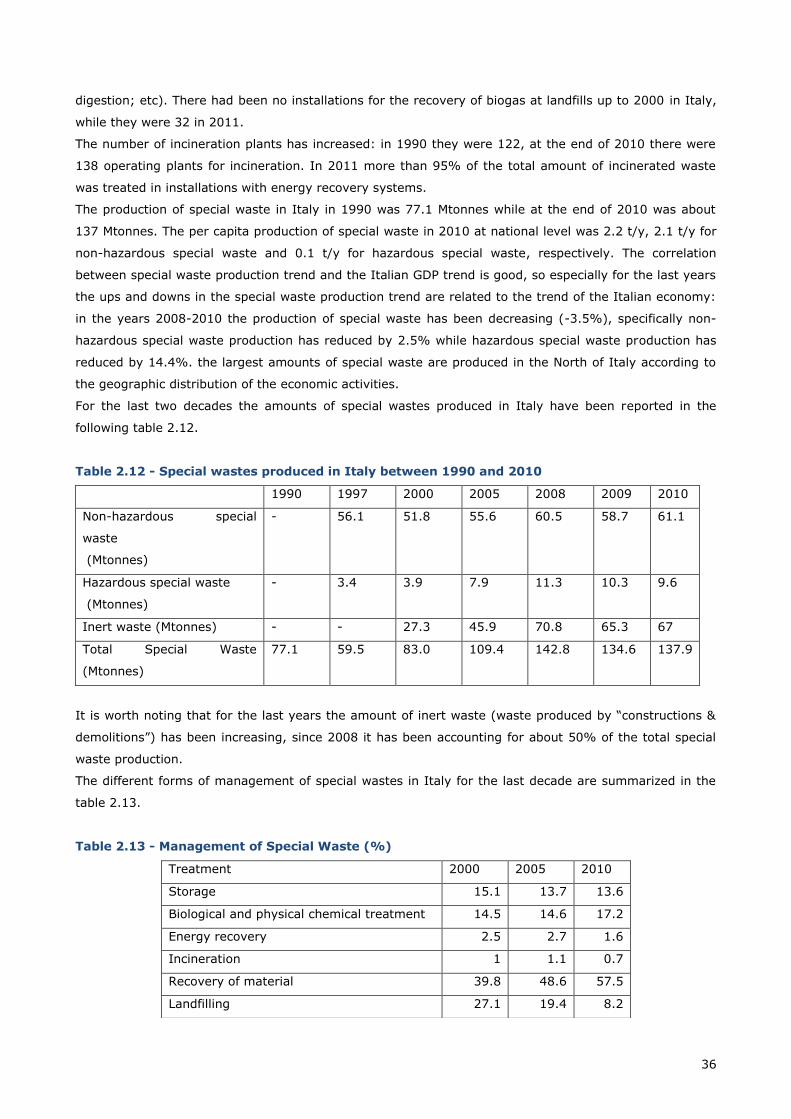
36
digestion; etc). There had been no installations for the recovery of biogas at landfills up to 2000 in Italy,
while they were 32 in 2011.
The number of incineration plants has increased: in 1990 they were 122, at the end of 2010 there were
138 operating plants for incineration. In 2011 more than 95% of the total amount of incinerated waste
was treated in installations with energy recovery systems.
The production of special waste in Italy in 1990 was 77.1 Mtonnes while at the end of 2010 was about
137 Mtonnes. The per capita production of special waste in 2010 at national level was 2.2 t/y, 2.1 t/y for
non-hazardous special waste and 0.1 t/y for hazardous special waste, respectively. The correlation
between special waste production trend and the Italian GDP trend is good, so especially for the last years
the ups and downs in the special waste production trend are related to the trend of the Italian economy:
in the years 2008-2010 the production of special waste has been decreasing (-3.5%), specifically non-
hazardous special waste production has reduced by 2.5% while hazardous special waste production has
reduced by 14.4%. the largest amounts of special waste are produced in the North of Italy according to
the geographic distribution of the economic activities.
For the last two decades the amounts of special wastes produced in Italy have been reported in the
following table 2.12.
Table 2.12 - Special wastes produced in Italy between 1990 and 2010
1990 1997 2000 2005 2008 2009 2010
Non-hazardous special
waste
(Mtonnes)
- 56.1 51.8 55.6 60.5 58.7 61.1
Hazardous special waste
(Mtonnes)
- 3.4 3.9 7.9 11.3 10.3 9.6
Inert waste (Mtonnes) - - 27.3 45.9 70.8 65.3 67
Total Special Waste
(Mtonnes)
77.1 59.5 83.0 109.4 142.8 134.6 137.9
It is worth noting that for the last years the amount of inert waste (waste produced by “constructions &
demolitions”) has been increasing, since 2008 it has been accounting for about 50% of the total special
waste production.
The different forms of management of special wastes in Italy for the last decade are summarized in the
table 2.13.
Table 2.13 - Management of Special Waste (%)
Treatment 2000 2005 2010
Storage 15.1 13.7 13.6
Biological and physical chemical treatment 14.5 14.6 17.2
Energy recovery 2.5 2.7 1.6
Incineration 1 1.1 0.7
Recovery of material 39.8 48.6 57.5
Landfilling 27.1 19.4 8.2
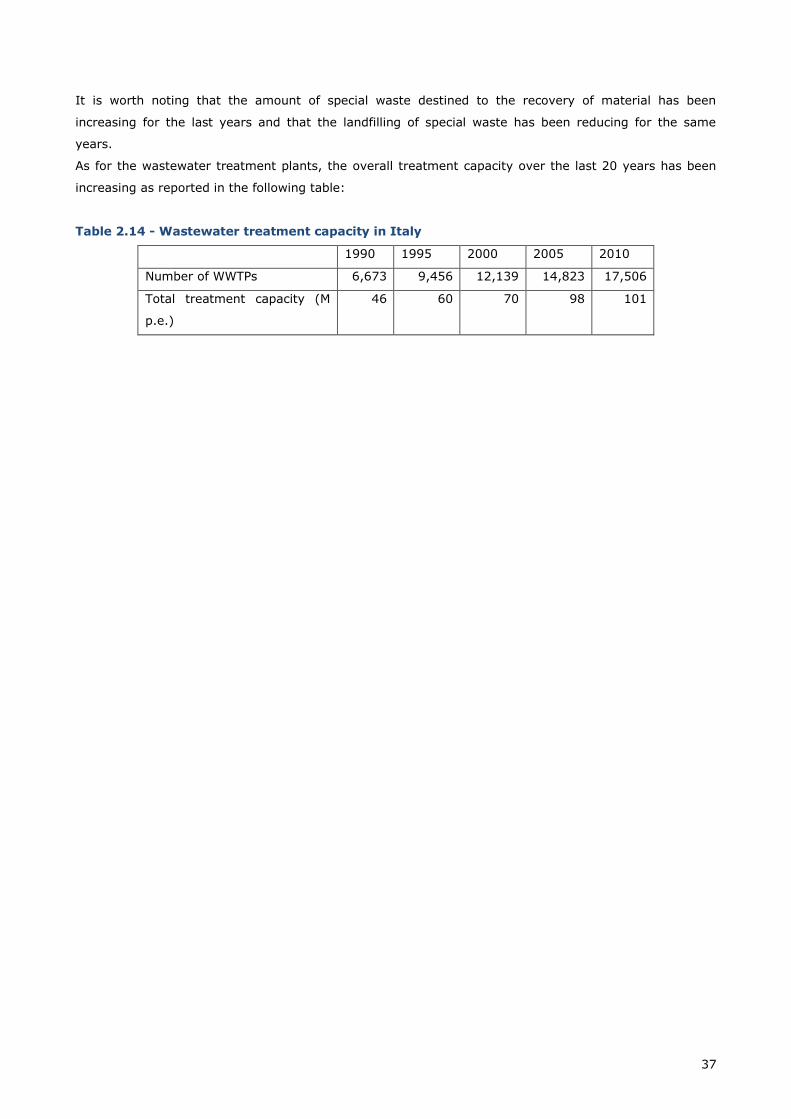
37
It is worth noting that the amount of special waste destined to the recovery of material has been
increasing for the last years and that the landfilling of special waste has been reducing for the same
years.
As for the wastewater treatment plants, the overall treatment capacity over the last 20 years has been
increasing as reported in the following table:
Table 2.14 - Wastewater treatment capacity in Italy
1990 1995 2000 2005 2010
Number of WWTPs 6,673 9,456 12,139 14,823 17,506
Total treatment capacity (M
p.e.)
46 60 70 98 101
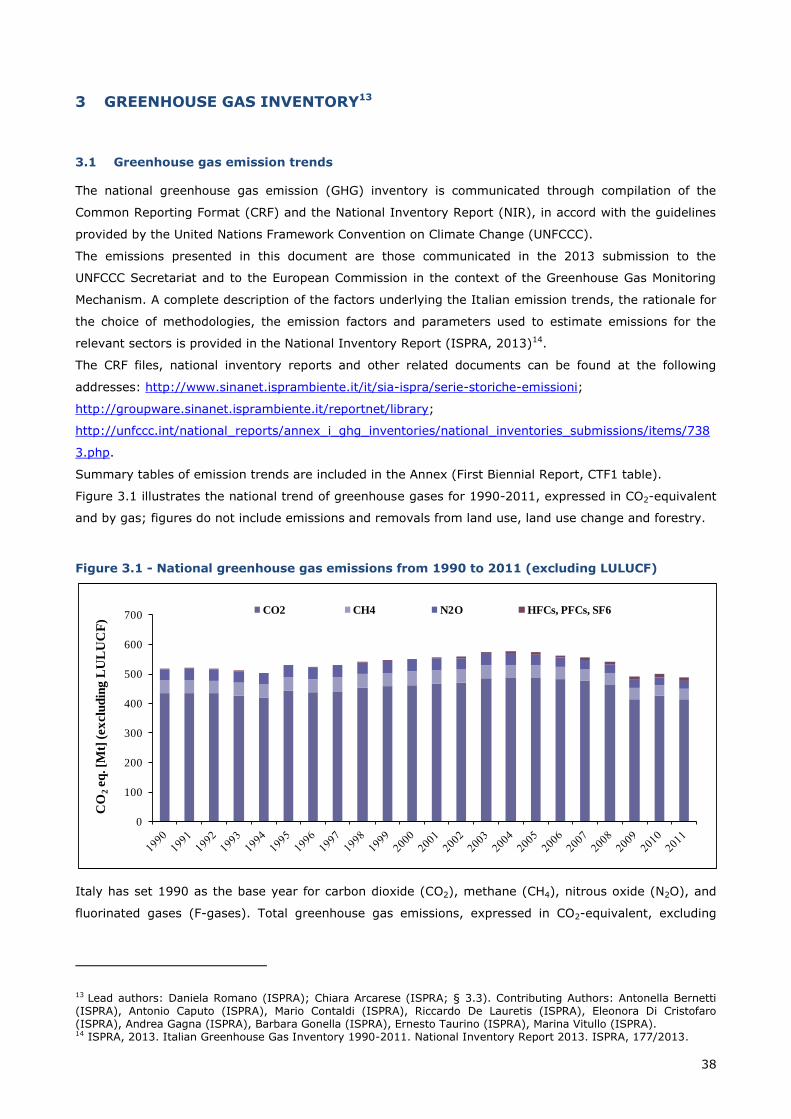
38
3 GREENHOUSE GAS INVENTORY13
3.1 Greenhouse gas emission trends
The national greenhouse gas emission (GHG) inventory is communicated through compilation of the
Common Reporting Format (CRF) and the National Inventory Report (NIR), in accord with the guidelines
provided by the United Nations Framework Convention on Climate Change (UNFCCC).
The emissions presented in this document are those communicated in the 2013 submission to the
UNFCCC Secretariat and to the European Commission in the context of the Greenhouse Gas Monitoring
Mechanism. A complete description of the factors underlying the Italian emission trends, the rationale for
the choice of methodologies, the emission factors and parameters used to estimate emissions for the
relevant sectors is provided in the National Inventory Report (ISPRA, 2013)14.
The CRF files, national inventory reports and other related documents can be found at the following
addresses: http://www.sinanet.isprambiente.it/it/sia-ispra/serie-storiche-emissioni;
http://groupware.sinanet.isprambiente.it/reportnet/library;
http://unfccc.int/national_reports/annex_i_ghg_inventories/national_inventories_submissions/items/738
3.php.
Summary tables of emission trends are included in the Annex (First Biennial Report, CTF1 table).
Figure 3.1 illustrates the national trend of greenhouse gases for 1990-2011, expressed in CO2-equivalent
and by gas; figures do not include emissions and removals from land use, land use change and forestry.
Figure 3.1 - National greenhouse gas emissions from 1990 to 2011 (excluding LULUCF)
Italy has set 1990 as the base year for carbon dioxide (CO2), methane (CH4), nitrous oxide (N2O), and
fluorinated gases (F-gases). Total greenhouse gas emissions, expressed in CO2-equivalent, excluding
13 Lead authors: Daniela Romano (ISPRA); Chiara Arcarese (ISPRA; § 3.3). Contributing Authors: Antonella Bernetti (ISPRA), Antonio Caputo (ISPRA), Mario Contaldi (ISPRA), Riccardo De Lauretis (ISPRA), Eleonora Di Cristofaro (ISPRA), Andrea Gagna (ISPRA), Barbara Gonella (ISPRA), Ernesto Taurino (ISPRA), Marina Vitullo (ISPRA). 14 ISPRA, 2013. Italian Greenhouse Gas Inventory 1990-2011. National Inventory Report 2013. ISPRA, 177/2013.
0
100
200
300
400
500
600
700
CO
2eq
. [M
t] (
ex
clu
din
g L
UL
UC
F)
CO2 CH4 N2O HFCs, PFCs, SF6
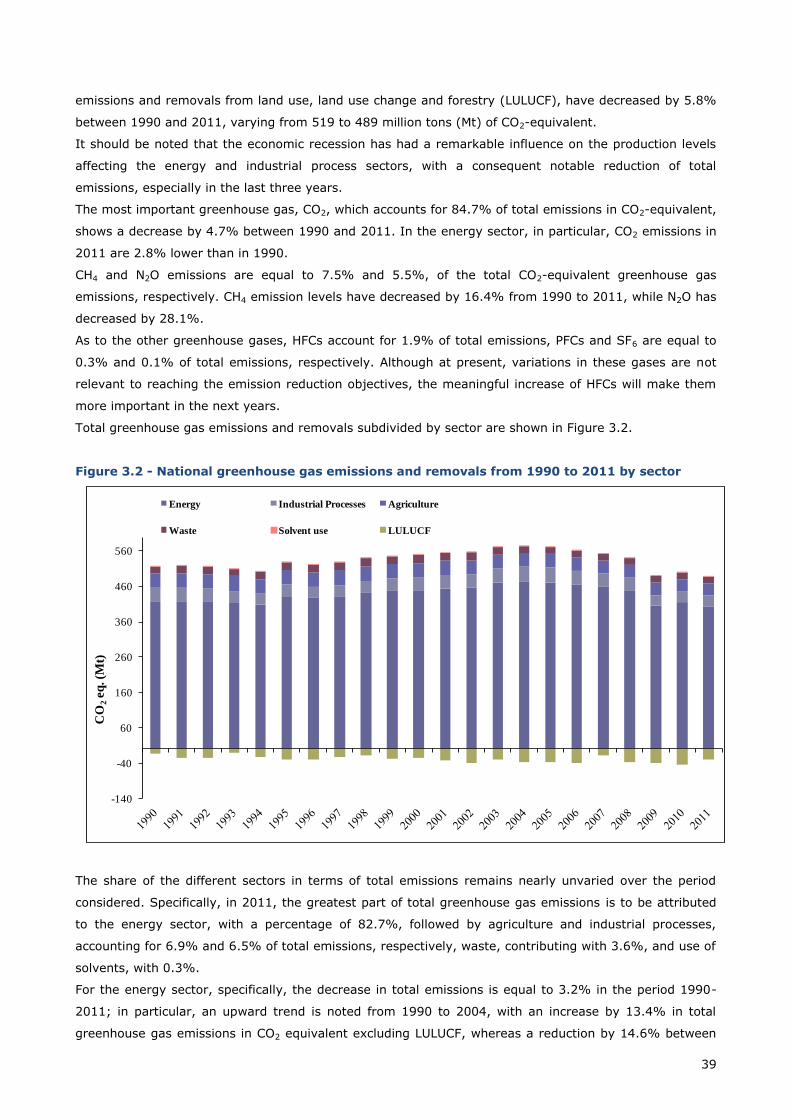
39
emissions and removals from land use, land use change and forestry (LULUCF), have decreased by 5.8%
between 1990 and 2011, varying from 519 to 489 million tons (Mt) of CO2-equivalent.
It should be noted that the economic recession has had a remarkable influence on the production levels
affecting the energy and industrial process sectors, with a consequent notable reduction of total
emissions, especially in the last three years.
The most important greenhouse gas, CO2, which accounts for 84.7% of total emissions in CO2-equivalent,
shows a decrease by 4.7% between 1990 and 2011. In the energy sector, in particular, CO2 emissions in
2011 are 2.8% lower than in 1990.
CH4 and N2O emissions are equal to 7.5% and 5.5%, of the total CO2-equivalent greenhouse gas
emissions, respectively. CH4 emission levels have decreased by 16.4% from 1990 to 2011, while N2O has
decreased by 28.1%.
As to the other greenhouse gases, HFCs account for 1.9% of total emissions, PFCs and SF6 are equal to
0.3% and 0.1% of total emissions, respectively. Although at present, variations in these gases are not
relevant to reaching the emission reduction objectives, the meaningful increase of HFCs will make them
more important in the next years.
Total greenhouse gas emissions and removals subdivided by sector are shown in Figure 3.2.
Figure 3.2 - National greenhouse gas emissions and removals from 1990 to 2011 by sector
The share of the different sectors in terms of total emissions remains nearly unvaried over the period
considered. Specifically, in 2011, the greatest part of total greenhouse gas emissions is to be attributed
to the energy sector, with a percentage of 82.7%, followed by agriculture and industrial processes,
accounting for 6.9% and 6.5% of total emissions, respectively, waste, contributing with 3.6%, and use of
solvents, with 0.3%.
For the energy sector, specifically, the decrease in total emissions is equal to 3.2% in the period 1990-
2011; in particular, an upward trend is noted from 1990 to 2004, with an increase by 13.4% in total
greenhouse gas emissions in CO2 equivalent excluding LULUCF, whereas a reduction by 14.6% between
-140
-40
60
160
260
360
460
560
CO
2eq
. (M
t)
Energy Industrial Processes Agriculture
Waste Solvent use LULUCF
40
2004 and 2011 is observed. From 2004, GHG emissions from the sector are decreasing as a result of the
policies adopted at European and national level to implement the production of energy from renewable
source; a further shift from petrol products to natural gas in producing energy has been observed as a
consequence of the starting of the EU greenhouse gas Emission Trading Scheme (EU ETS) in January, 1st
2005. From 2009, a further drop of the sectoral emissions is due to the economic recession.
In general, from 1990 to 2011 the decrease in emissions is driven by the reduction in the energy
industries and manufacturing industries and construction, which account for 32% and 15% and reduced
by 4% and 30%, respectively. Specifically for the manufacturing industries and construction, the reason
for the reduced emissions is the cut in production in some subsectors (e.g chemical, construction and
building materials, steel) due to the effects of the economic recession but also an increase in efficiency
especially identified in the chemical sector.
On the other hand, a significant increase in emissions still occur in two relevant sectors, transport and
other sectors, which increased by about 14% and 10% and account for 29% and 21%, respectively.
Road transport is the most relevant source in the transport sector, accounting in 2011 for 22.5% of total
national CO2 equivalent emissions. In 2011, GHG emissions from road transport were about 93.1% of the
national emissions from transport. From 1990 to 2011, GHG emissions from the sector increased by
15.4% due to the increase of vehicle fleet, total mileage and consequently fuel consumptions. Since
2004, fuel consumption and emissions stabilised; from 2007, a change in the trend is observed for GHG
emissions with an average annual decrease of 2.2% up to 2011.
The increase in other sectors, which refer to emissions originated from energy use in the civil sector and
from military mobile activities, is due, from 1990 to 2000, to the increase in numbers and size of building
with heating, the trend in weather conditions and from 2002, and especially in the last years, to the
increase in other greenhouse gas emissions than CO2 for the growing use of woody biomass and biogas
for heating.
The substance with the highest impact, in this sector, is CO2, accounting for 97.1% of the total, whose
levels have decreased by 2.8% from 1990 to 2011. The trend is mostly driven by the transport and the
energy industry sectors, especially for the increased fuel consumption in road transportation, and by the
energy industry for the increase in electricity production and the related emissions notwithstanding the
specific carbon content of the kWh generated in Italy has constantly decreased over the years. A sharp
decrease has been observed in CO2 emissions from manufacturing industries and construction as
previously described.
Describing patterns of other GHGs except for CO2, the trend of N2O emissions is related to the technology
development in road transport and to the switch from gasoline to diesel fuel consumption; CH4 emission
trend is driven by the combined effect of technological improvements that limit volatile organic
compounds (VOCs) from tail pipe and evaporative emissions (for cars) and the expansion of two-
wheelers fleet.
The agriculture sector is the second source of emissions, contributing 6.9% to total greenhouse gases,
excluding the LULUCF sector. Emissions from the sector refer to methane and nitrous oxide levels, which
account for 43.1% and 56.9% of total emissions, respectively. The decrease observed in total emissions
from 1990 to 2011 (-17.7%) is due to the decrease of CH4 emissions from enteric fermentation (-12.4%)
and N2O from agricultural soils (-21.1%), which account for 32.1% and 45.8% of total agricultural
emissions, respectively. Main drivers behind these downward trends are the reduction in the number of
animals, especially cattle which have decreased by 23.9 between 1990 and 2011 and contribute with
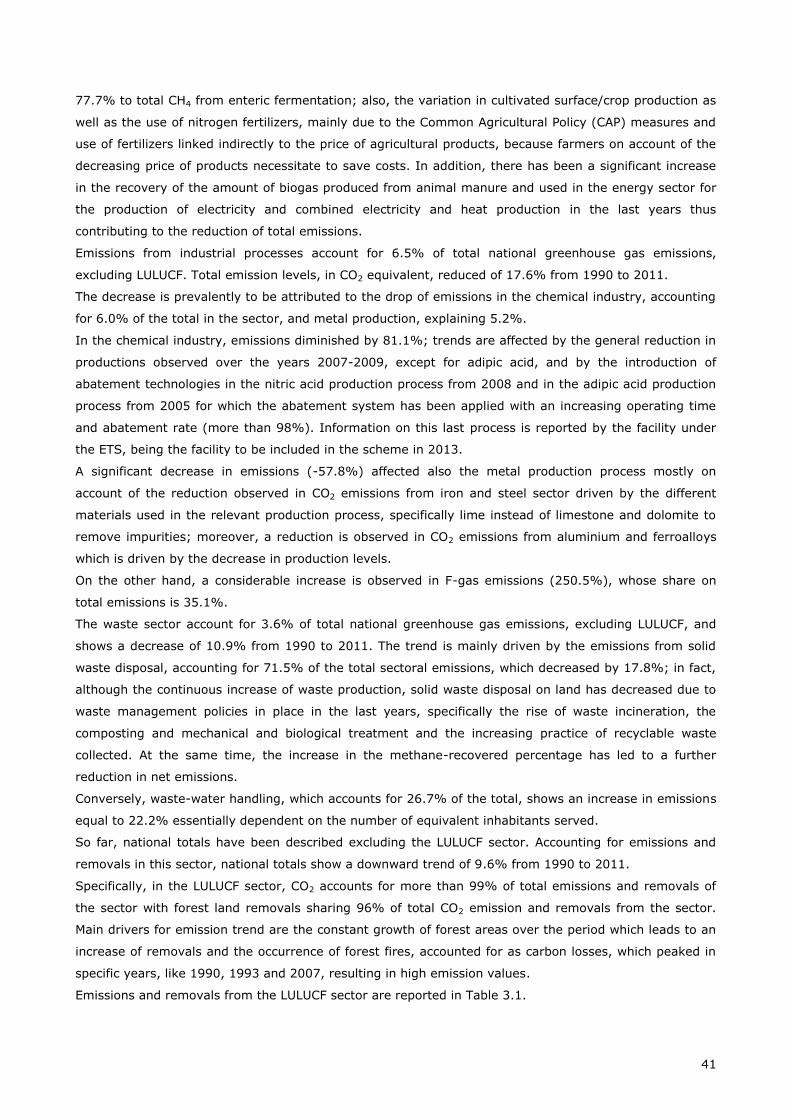
41
77.7% to total CH4 from enteric fermentation; also, the variation in cultivated surface/crop production as
well as the use of nitrogen fertilizers, mainly due to the Common Agricultural Policy (CAP) measures and
use of fertilizers linked indirectly to the price of agricultural products, because farmers on account of the
decreasing price of products necessitate to save costs. In addition, there has been a significant increase
in the recovery of the amount of biogas produced from animal manure and used in the energy sector for
the production of electricity and combined electricity and heat production in the last years thus
contributing to the reduction of total emissions.
Emissions from industrial processes account for 6.5% of total national greenhouse gas emissions,
excluding LULUCF. Total emission levels, in CO2 equivalent, reduced of 17.6% from 1990 to 2011.
The decrease is prevalently to be attributed to the drop of emissions in the chemical industry, accounting
for 6.0% of the total in the sector, and metal production, explaining 5.2%.
In the chemical industry, emissions diminished by 81.1%; trends are affected by the general reduction in
productions observed over the years 2007-2009, except for adipic acid, and by the introduction of
abatement technologies in the nitric acid production process from 2008 and in the adipic acid production
process from 2005 for which the abatement system has been applied with an increasing operating time
and abatement rate (more than 98%). Information on this last process is reported by the facility under
the ETS, being the facility to be included in the scheme in 2013.
A significant decrease in emissions (-57.8%) affected also the metal production process mostly on
account of the reduction observed in CO2 emissions from iron and steel sector driven by the different
materials used in the relevant production process, specifically lime instead of limestone and dolomite to
remove impurities; moreover, a reduction is observed in CO2 emissions from aluminium and ferroalloys
which is driven by the decrease in production levels.
On the other hand, a considerable increase is observed in F-gas emissions (250.5%), whose share on
total emissions is 35.1%.
The waste sector account for 3.6% of total national greenhouse gas emissions, excluding LULUCF, and
shows a decrease of 10.9% from 1990 to 2011. The trend is mainly driven by the emissions from solid
waste disposal, accounting for 71.5% of the total sectoral emissions, which decreased by 17.8%; in fact,
although the continuous increase of waste production, solid waste disposal on land has decreased due to
waste management policies in place in the last years, specifically the rise of waste incineration, the
composting and mechanical and biological treatment and the increasing practice of recyclable waste
collected. At the same time, the increase in the methane-recovered percentage has led to a further
reduction in net emissions.
Conversely, waste-water handling, which accounts for 26.7% of the total, shows an increase in emissions
equal to 22.2% essentially dependent on the number of equivalent inhabitants served.
So far, national totals have been described excluding the LULUCF sector. Accounting for emissions and
removals in this sector, national totals show a downward trend of 9.6% from 1990 to 2011.
Specifically, in the LULUCF sector, CO2 accounts for more than 99% of total emissions and removals of
the sector with forest land removals sharing 96% of total CO2 emission and removals from the sector.
Main drivers for emission trend are the constant growth of forest areas over the period which leads to an
increase of removals and the occurrence of forest fires, accounted for as carbon losses, which peaked in
specific years, like 1990, 1993 and 2007, resulting in high emission values.
Emissions and removals from the LULUCF sector are reported in Table 3.1.
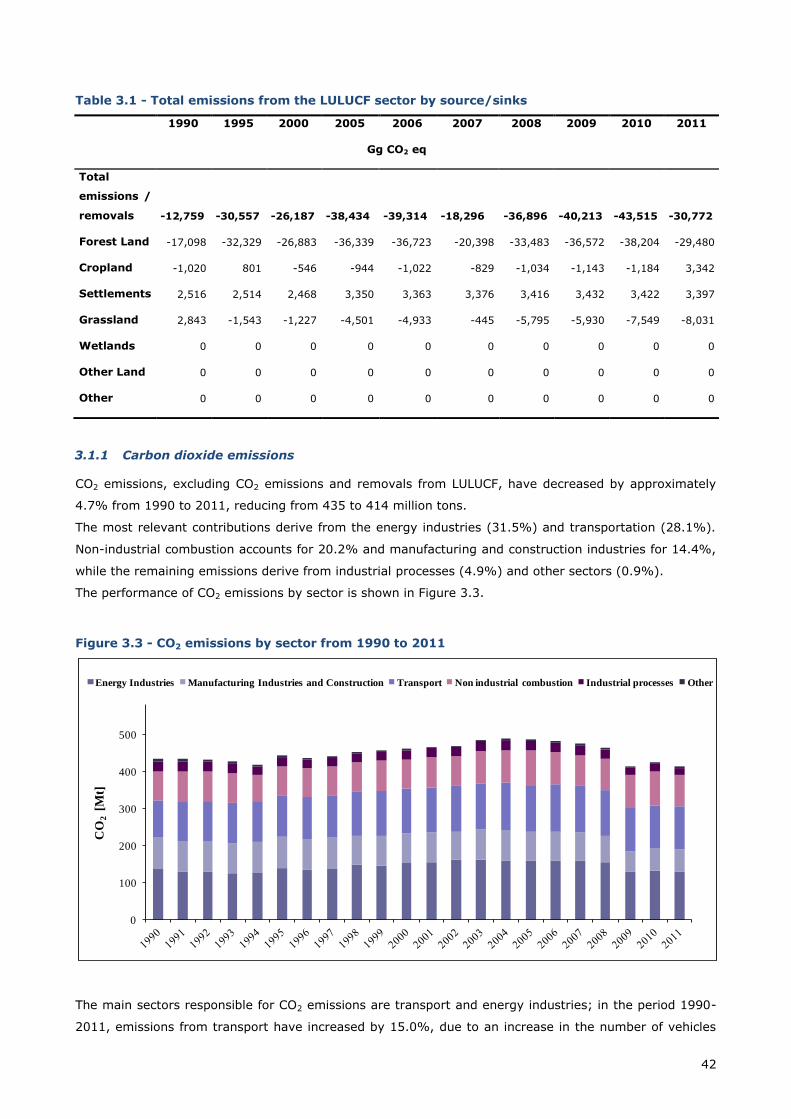
42
Table 3.1 - Total emissions from the LULUCF sector by source/sinks
1990 1995 2000 2005 2006 2007 2008 2009 2010 2011
Gg CO2 eq
Total
emissions /
removals
-12,759 -30,557 -26,187 -38,434 -39,314 -18,296 -36,896 -40,213 -43,515 -30,772
Forest Land -17,098 -32,329 -26,883 -36,339 -36,723 -20,398 -33,483 -36,572 -38,204 -29,480
Cropland -1,020 801 -546 -944 -1,022 -829 -1,034 -1,143 -1,184 3,342
Settlements 2,516 2,514 2,468 3,350 3,363 3,376 3,416 3,432 3,422 3,397
Grassland 2,843 -1,543 -1,227 -4,501 -4,933 -445 -5,795 -5,930 -7,549 -8,031
Wetlands 0 0 0 0 0 0 0 0 0 0
Other Land 0 0 0 0 0 0 0 0 0 0
Other 0 0 0 0 0 0 0 0 0 0
3.1.1 Carbon dioxide emissions
CO2 emissions, excluding CO2 emissions and removals from LULUCF, have decreased by approximately
4.7% from 1990 to 2011, reducing from 435 to 414 million tons.
The most relevant contributions derive from the energy industries (31.5%) and transportation (28.1%).
Non-industrial combustion accounts for 20.2% and manufacturing and construction industries for 14.4%,
while the remaining emissions derive from industrial processes (4.9%) and other sectors (0.9%).
The performance of CO2 emissions by sector is shown in Figure 3.3.
Figure 3.3 - CO2 emissions by sector from 1990 to 2011
The main sectors responsible for CO2 emissions are transport and energy industries; in the period 1990-
2011, emissions from transport have increased by 15.0%, due to an increase in the number of vehicles
0
100
200
300
400
500
CO
2 [M
t]
Energy Industries Manufacturing Industries and Construction Transport Non industrial combustion Industrial processes Other
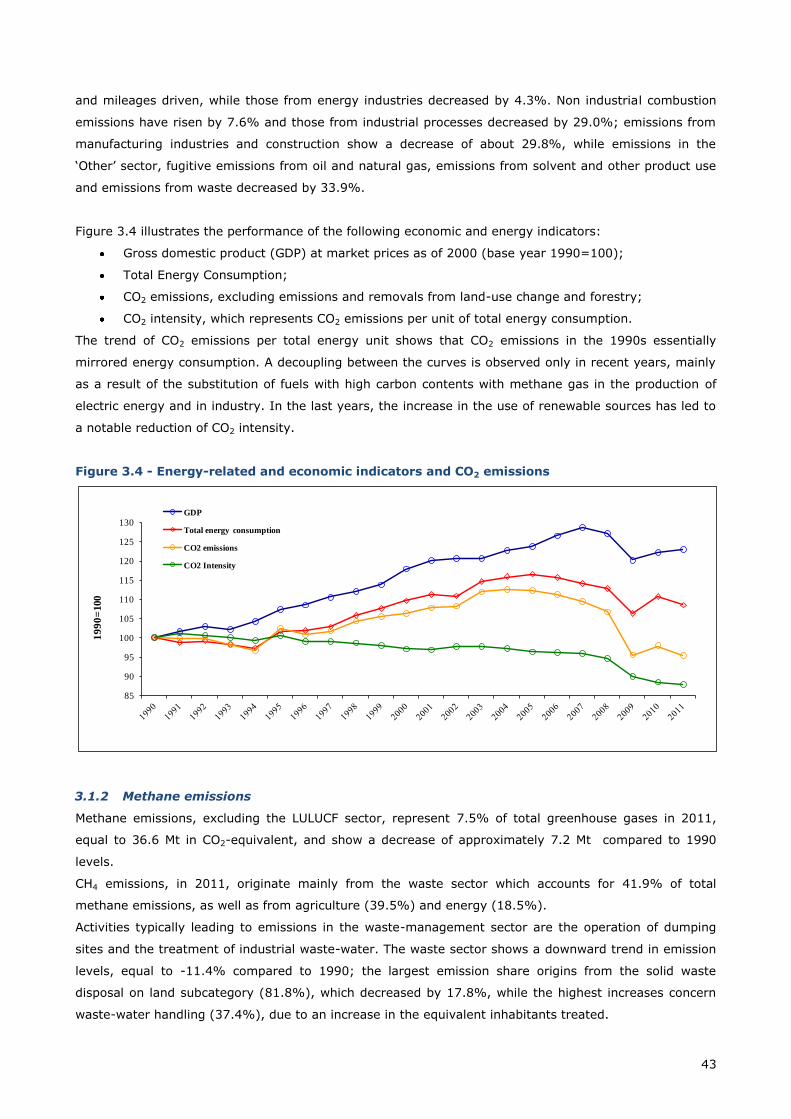
43
and mileages driven, while those from energy industries decreased by 4.3%. Non industrial combustion
emissions have risen by 7.6% and those from industrial processes decreased by 29.0%; emissions from
manufacturing industries and construction show a decrease of about 29.8%, while emissions in the
‘Other’ sector, fugitive emissions from oil and natural gas, emissions from solvent and other product use
and emissions from waste decreased by 33.9%.
Figure 3.4 illustrates the performance of the following economic and energy indicators:
Gross domestic product (GDP) at market prices as of 2000 (base year 1990=100);
Total Energy Consumption;
CO2 emissions, excluding emissions and removals from land-use change and forestry;
CO2 intensity, which represents CO2 emissions per unit of total energy consumption.
The trend of CO2 emissions per total energy unit shows that CO2 emissions in the 1990s essentially
mirrored energy consumption. A decoupling between the curves is observed only in recent years, mainly
as a result of the substitution of fuels with high carbon contents with methane gas in the production of
electric energy and in industry. In the last years, the increase in the use of renewable sources has led to
a notable reduction of CO2 intensity.
Figure 3.4 - Energy-related and economic indicators and CO2 emissions
3.1.2 Methane emissions
Methane emissions, excluding the LULUCF sector, represent 7.5% of total greenhouse gases in 2011,
equal to 36.6 Mt in CO2-equivalent, and show a decrease of approximately 7.2 Mt compared to 1990
levels.
CH4 emissions, in 2011, originate mainly from the waste sector which accounts for 41.9% of total
methane emissions, as well as from agriculture (39.5%) and energy (18.5%).
Activities typically leading to emissions in the waste-management sector are the operation of dumping
sites and the treatment of industrial waste-water. The waste sector shows a downward trend in emission
levels, equal to -11.4% compared to 1990; the largest emission share origins from the solid waste
disposal on land subcategory (81.8%), which decreased by 17.8%, while the highest increases concern
waste-water handling (37.4%), due to an increase in the equivalent inhabitants treated.
85
90
95
100
105
110
115
120
125
130
19
90
=100
GDP
Total energy consumption
CO2 emissions
CO2 Intensity
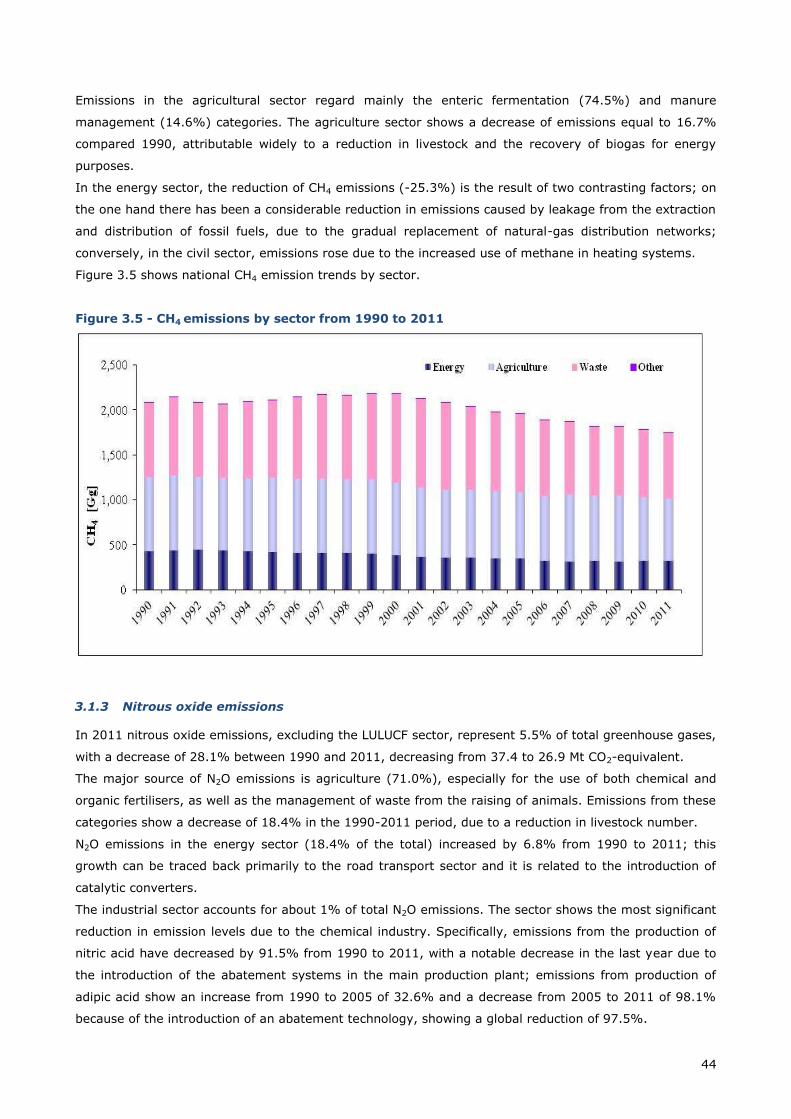
44
Emissions in the agricultural sector regard mainly the enteric fermentation (74.5%) and manure
management (14.6%) categories. The agriculture sector shows a decrease of emissions equal to 16.7%
compared 1990, attributable widely to a reduction in livestock and the recovery of biogas for energy
purposes.
In the energy sector, the reduction of CH4 emissions (-25.3%) is the result of two contrasting factors; on
the one hand there has been a considerable reduction in emissions caused by leakage from the extraction
and distribution of fossil fuels, due to the gradual replacement of natural-gas distribution networks;
conversely, in the civil sector, emissions rose due to the increased use of methane in heating systems.
Figure 3.5 shows national CH4 emission trends by sector.
Figure 3.5 - CH4 emissions by sector from 1990 to 2011
3.1.3 Nitrous oxide emissions
In 2011 nitrous oxide emissions, excluding the LULUCF sector, represent 5.5% of total greenhouse gases,
with a decrease of 28.1% between 1990 and 2011, decreasing from 37.4 to 26.9 Mt CO2-equivalent.
The major source of N2O emissions is agriculture (71.0%), especially for the use of both chemical and
organic fertilisers, as well as the management of waste from the raising of animals. Emissions from these
categories show a decrease of 18.4% in the 1990-2011 period, due to a reduction in livestock number.
N2O emissions in the energy sector (18.4% of the total) increased by 6.8% from 1990 to 2011; this
growth can be traced back primarily to the road transport sector and it is related to the introduction of
catalytic converters.
The industrial sector accounts for about 1% of total N2O emissions. The sector shows the most significant
reduction in emission levels due to the chemical industry. Specifically, emissions from the production of
nitric acid have decreased by 91.5% from 1990 to 2011, with a notable decrease in the last year due to
the introduction of the abatement systems in the main production plant; emissions from production of
adipic acid show an increase from 1990 to 2005 of 32.6% and a decrease from 2005 to 2011 of 98.1%
because of the introduction of an abatement technology, showing a global reduction of 97.5%.
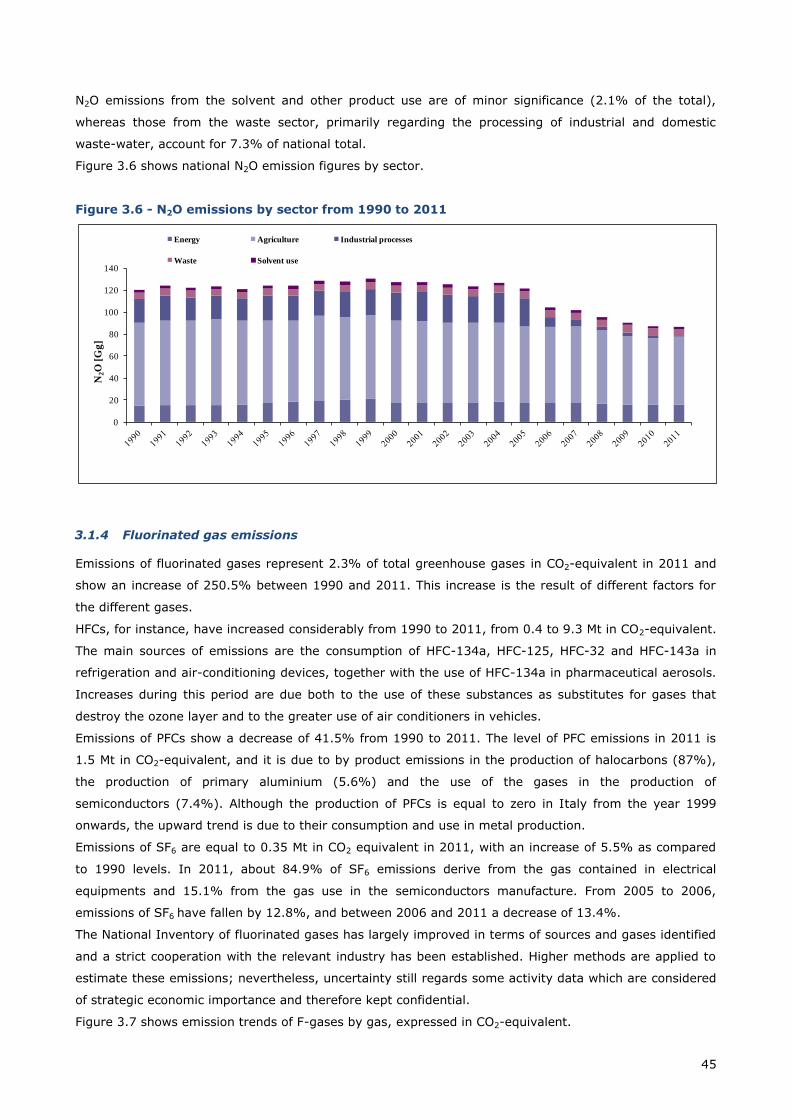
45
N2O emissions from the solvent and other product use are of minor significance (2.1% of the total),
whereas those from the waste sector, primarily regarding the processing of industrial and domestic
waste-water, account for 7.3% of national total.
Figure 3.6 shows national N2O emission figures by sector.
Figure 3.6 - N2O emissions by sector from 1990 to 2011
3.1.4 Fluorinated gas emissions
Emissions of fluorinated gases represent 2.3% of total greenhouse gases in CO2-equivalent in 2011 and
show an increase of 250.5% between 1990 and 2011. This increase is the result of different factors for
the different gases.
HFCs, for instance, have increased considerably from 1990 to 2011, from 0.4 to 9.3 Mt in CO2-equivalent.
The main sources of emissions are the consumption of HFC-134a, HFC-125, HFC-32 and HFC-143a in
refrigeration and air-conditioning devices, together with the use of HFC-134a in pharmaceutical aerosols.
Increases during this period are due both to the use of these substances as substitutes for gases that
destroy the ozone layer and to the greater use of air conditioners in vehicles.
Emissions of PFCs show a decrease of 41.5% from 1990 to 2011. The level of PFC emissions in 2011 is
1.5 Mt in CO2-equivalent, and it is due to by product emissions in the production of halocarbons (87%),
the production of primary aluminium (5.6%) and the use of the gases in the production of
semiconductors (7.4%). Although the production of PFCs is equal to zero in Italy from the year 1999
onwards, the upward trend is due to their consumption and use in metal production.
Emissions of SF6 are equal to 0.35 Mt in CO2 equivalent in 2011, with an increase of 5.5% as compared
to 1990 levels. In 2011, about 84.9% of SF6 emissions derive from the gas contained in electrical
equipments and 15.1% from the gas use in the semiconductors manufacture. From 2005 to 2006,
emissions of SF6 have fallen by 12.8%, and between 2006 and 2011 a decrease of 13.4%.
The National Inventory of fluorinated gases has largely improved in terms of sources and gases identified
and a strict cooperation with the relevant industry has been established. Higher methods are applied to
estimate these emissions; nevertheless, uncertainty still regards some activity data which are considered
of strategic economic importance and therefore kept confidential.
Figure 3.7 shows emission trends of F-gases by gas, expressed in CO2-equivalent.
0
20
40
60
80
100
120
140
N2O
[G
g]
Energy Agriculture Industrial processes
Waste Solvent use
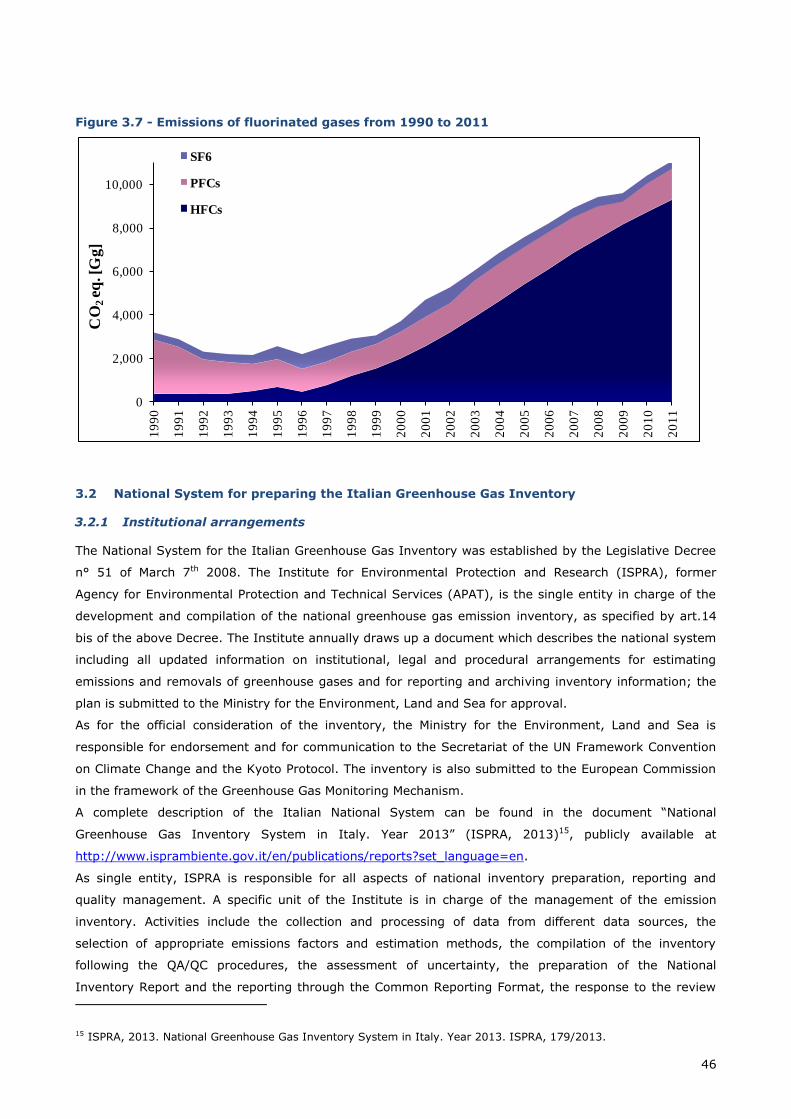
46
Figure 3.7 - Emissions of fluorinated gases from 1990 to 2011
3.2 National System for preparing the Italian Greenhouse Gas Inventory
3.2.1 Institutional arrangements
The National System for the Italian Greenhouse Gas Inventory was established by the Legislative Decree
n° 51 of March 7th 2008. The Institute for Environmental Protection and Research (ISPRA), former
Agency for Environmental Protection and Technical Services (APAT), is the single entity in charge of the
development and compilation of the national greenhouse gas emission inventory, as specified by art.14
bis of the above Decree. The Institute annually draws up a document which describes the national system
including all updated information on institutional, legal and procedural arrangements for estimating
emissions and removals of greenhouse gases and for reporting and archiving inventory information; the
plan is submitted to the Ministry for the Environment, Land and Sea for approval.
As for the official consideration of the inventory, the Ministry for the Environment, Land and Sea is
responsible for endorsement and for communication to the Secretariat of the UN Framework Convention
on Climate Change and the Kyoto Protocol. The inventory is also submitted to the European Commission
in the framework of the Greenhouse Gas Monitoring Mechanism.
A complete description of the Italian National System can be found in the document “National
Greenhouse Gas Inventory System in Italy. Year 2013” (ISPRA, 2013)15, publicly available at
http://www.isprambiente.gov.it/en/publications/reports?set_language=en.
As single entity, ISPRA is responsible for all aspects of national inventory preparation, reporting and
quality management. A specific unit of the Institute is in charge of the management of the emission
inventory. Activities include the collection and processing of data from different data sources, the
selection of appropriate emissions factors and estimation methods, the compilation of the inventory
following the QA/QC procedures, the assessment of uncertainty, the preparation of the National
Inventory Report and the reporting through the Common Reporting Format, the response to the review
15 ISPRA, 2013. National Greenhouse Gas Inventory System in Italy. Year 2013. ISPRA, 179/2013.
0
2,000
4,000
6,000
8,000
10,000
19
90
19
91
19
92
19
93
19
94
19
95
19
96
19
97
19
98
19
99
20
00
20
01
20
02
20
03
20
04
20
05
20
06
20
07
20
08
20
09
20
10
20
11
CO
2 e
q. [
Gg]
SF6
PFCs
HFCs
47
processes, the updating and data storage. The web address where all the information related to the
inventory can be found is: http://www.sinanet.isprambiente.it/it/sia-ispra/serie-storiche-emissioni.
Different institutions are responsible for communication and publication of statistical basic data, which are
essential for ISPRA to carry out emission estimates. These institutions are part of a National Statistical
System (Sistan), which periodically provides national official statistics; moreover, the National Statistical
System ensures the homogeneity of the methods used for official statistics data through a coordination
plan, involving the entire public administration at central, regional and local levels. The National
Statistical System is coordinated by the Italian National Institute of Statistics (ISTAT) whereas other
participant bodies are the statistical offices of ministries, national agencies, regions and autonomous
provinces, provinces, municipalities, research institutes, chambers of commerce, local governmental
offices, some private agencies and private subjects.
These bodies are required to provide the data and information specified in an annual statistical plan which
defines surveys, data elaborations and project studies for a three-year period; the plan is approved by a
Prime Ministerial Decree after consideration of the Interministerial Committee for economic planning
(Cipe). The latest Prime Ministerial Decree, which approved the three-year plan for 2011-2013, updated
for 2012-2013, was issued on 20th April 2012.
Further information on the National Statistical System is found in the National Inventory Report and
National Inventory System.
The main Sistan products, which are primarily necessary for the inventory compilation, are:
National Statistical Yearbooks, Monthly Statistical Bulletins, by ISTAT (National Institute of
Statistics);
Annual Report on the Energy and Environment, by ENEA (Agency for New Technologies, Energy
and the Environment);
National Energy Balance (annual), Petrochemical Bulletin (quarterly publication), by MSE
(Ministry of Economic Development);
Transport Statistics Yearbooks, by MINT (Ministry of Transportation);
Annual Statistics on Electrical Energy in Italy, by TERNA (National Independent System
Operator);
Annual Report on Waste, by ISPRA.
National Forestry Inventory, by MIPAAF (Ministry of Agriculture, Food and Forest Policies).
The national emission inventory is a Sistan product.
3.2.2 Inventory preparation
The Italian emission inventory is based on methodologies consistent with the IPCC guidelines, IPCC Good
Practice Guidance and EMEP/EEA Guidebook (IPCC, 199716; IPCC, 200617; IPCC, 200018; IPCC, 200319;
EMEP/CORINAIR, 200720; EMEP/EEA, 200921).
16 IPCC, 1997. Revised 1996 IPCC Guidelines for National Greenhouse Gas Emission Inventories. Three volumes: Reference Manual, Reporting Manual, Reporting Guidelines and Workbook. IPCC/OECD/IEA. IPCC WG1 Technical Support Unit, Hadley Centre, Meteorological Centre, Meteorological Office, Bracknell, UK. 17 IPCC, 2006. 2006 IPCC Guidelines for National Greenhouse Gas Inventories, Prepared by the National Greenhouse Gas Inventories Programme, Eggleston H.S., Buendia L., Miwa K., Ngara T. and Tanabe K. (eds).Published: IGES, Japan. 18 IPCC, 2000. Good Practice Guidance and Uncertainty Management in National Greenhouse Gas Inventories. IPCC National Greenhouse Gas Inventories Programme, Technical Support Unit, Hayama, Kanagawa, Japan.
48
In addition, national methodologies are developed and supported by background reference materials.
Emission estimates are characterized by quantitative uncertainty figures calculated at a detailed category
level and for the inventory as a total, following the IPCC Good Practice Guidance; uncertainty is also used
in the assessment of key categories.
The inventory preparation process takes place annually; in case of methodological changes or additional
information, emissions are recalculated from 1990 onwards.
Detailed information on emission figures and estimation methodologies, including all the basic data and
emission factors needed to carry out the final estimates, are provided in the National Inventory Report
(NIR) which completes the stage of inventory preparation. The last report is available at the following
web address http://www.isprambiente.gov.it/en/publications/reports?set_language=en.
In addition to the institutions which are part of the National Statistical System, ISPRA has established
fruitful cooperation with a number of other governmental and research institutes as well as industrial
associations, which helps improving some key categories of the inventory. Specifically, these activities
aim at the improvement of provision and collection of basic data and emission factors, through plant-
specific data, and exchange of information on scientific researches and new studies. Moreover, when in
depth investigation is needed and a high uncertainty in the estimates is present, specific sector analyses
are commissioned to ad hoc research teams or consultants.
ISPRA also coordinates with different national and regional authorities and private institutions for the
cross-checking of parameters and estimates as well as with ad hoc expert panels in order to improve the
accuracy, completeness and transparency of the inventory.
All the reference material, estimates and calculation sheets, as well as the documentation on scientific
papers and the basic data needed for the inventory compilation, are stored and archived at ISPRA.
In Table 3.2 a summary of the activity data and sources used in the inventory compilation is reported.
19 IPCC, 2003. Good Practice Guidance for Land Use, Land-Use Change and Forestry. IPCC Technical Support Unit, Kanagawa, Japan. 20 EMEP/CORINAIR, 2007. Atmospheric Emission Inventory Guidebook. Technical report No 16/2007. 21 EMEP/EEA, 2009. Air Pollutant Emission Inventory Guidebook. Technical report No 9/2009.
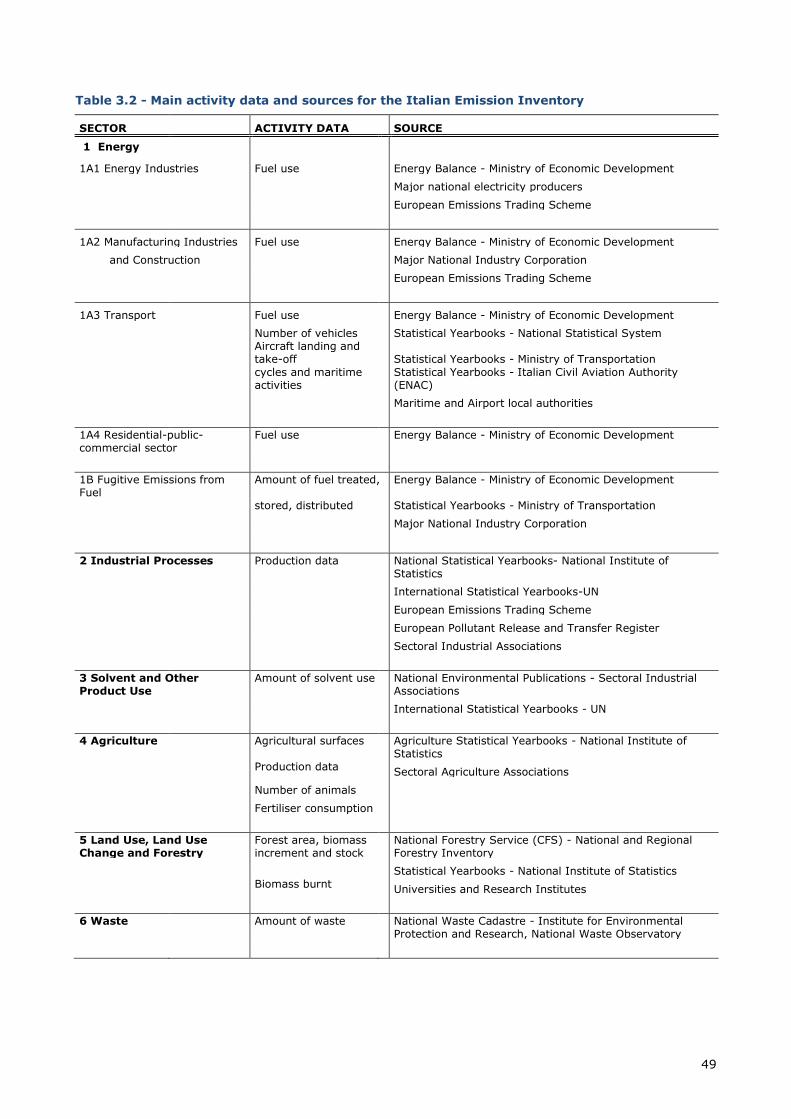
49
Table 3.2 - Main activity data and sources for the Italian Emission Inventory
SECTOR ACTIVITY DATA SOURCE
1 Energy
1A1 Energy Industries Fuel use Energy Balance - Ministry of Economic Development
Major national electricity producers
European Emissions Trading Scheme
1A2 Manufacturing Industries Fuel use Energy Balance - Ministry of Economic Development
and Construction
Major National Industry Corporation
European Emissions Trading Scheme
1A3 Transport Fuel use Energy Balance - Ministry of Economic Development
Number of vehicles Statistical Yearbooks - National Statistical System
Aircraft landing and take-off Statistical Yearbooks - Ministry of Transportation
cycles and maritime activities
Statistical Yearbooks - Italian Civil Aviation Authority (ENAC)
Maritime and Airport local authorities
1A4 Residential-public-commercial sector
Fuel use Energy Balance - Ministry of Economic Development
1B Fugitive Emissions from Fuel
Amount of fuel treated, Energy Balance - Ministry of Economic Development
stored, distributed Statistical Yearbooks - Ministry of Transportation
Major National Industry Corporation
2 Industrial Processes Production data National Statistical Yearbooks- National Institute of Statistics
International Statistical Yearbooks-UN
European Emissions Trading Scheme
European Pollutant Release and Transfer Register
Sectoral Industrial Associations
3 Solvent and Other Product Use
Amount of solvent use National Environmental Publications - Sectoral Industrial Associations
International Statistical Yearbooks - UN
4 Agriculture Agricultural surfaces Agriculture Statistical Yearbooks - National Institute of Statistics
Production data Sectoral Agriculture Associations
Number of animals
Fertiliser consumption
5 Land Use, Land Use Change and Forestry
Forest area, biomass increment and stock
National Forestry Service (CFS) - National and Regional Forestry Inventory
Statistical Yearbooks - National Institute of Statistics
Biomass burnt Universities and Research Institutes
6 Waste Amount of waste National Waste Cadastre - Institute for Environmental Protection and Research, National Waste Observatory
50
3.2.3 Key categories identification
A key category analysis of the Italian inventory is carried out according to the Approach 1 and Approach
2 described in the 2006 IPCC Guidelines (IPCC, 2006). These guidelines provide a harmonized method to
deal with both sources and removals and correct some inconsistencies between the previous IPCC Good
Practice Guidance and Guidelines, which dealt with and without the LULUCF separately (IPCC, 2000;
IPCC, 2003). According to the IPCC guidelines, a key category is defined as an emission category that
has a significant influence on a country’s GHG inventory in terms of the absolute level and trend in
emissions and removals, or both. Key categories are those which, when summed together in descending
order of magnitude, add up to over 95% of the total emissions or 90% of total uncertainty.
A quantitative analysis is carried out on the Italian greenhouse gas inventory to establish the
uncertainties of different emission categories, the uncertainty of total emissions for the base year and the
latest inventory year, and the so- called trend uncertainty. The uncertainty assessment helps the
identification of the key categories whose effect on the total uncertainty of the inventory is the highest;
furthermore, by means of such an assessment, the improvement measures can be directed so that the
total uncertainty of the inventory can be lowered as effectively as possible.
Quantitative estimates of uncertainty for the Italian GHG inventory are calculated using Approach 1 as
defined in the 2006 IPCC Guidelines, which provides a calculation based on the error propagation
equations. National emissions are disaggregated, as far as possible, into the categories proposed in the
guidelines; other categories are added to reflect specific national circumstances. Both level and trend
analysis are applied to the base year and to the last submitted inventory including and excluding the
LULUCF sector.
In summary, the overall uncertainty in the national total emissions is equal to 3.4% for the year 2011;
the uncertainty in the trend between 1990 and 2011 is equal to 2.6%. When considering the LULUCF
sector in the analysis, the uncertainty in total GWP emissions and removals increases to 5.1% for the
year 2011 and to 4.2% in the trend between 1990 and 2011.
Further information on these figures is reported in the National Inventory Report.
The uncertainty figures are used to carry out a key category analysis on the inventory applying the IPCC
Approach 2 which helps prioritising activities to improve inventory quality and to reduce overall
uncertainty. Key categories are categories which should receive special consideration in terms of
methodological aspects and quality assurance and quality control verification.
For the categories with a high uncertainty, generally, further improvements are planned whenever
sectoral studies can be carried out. For example, last year, the prioritisation of improvements related to
the results of uncertainty analysis led to a revision of the net carbon stock changes and further activities
are planned for the LULUCF sector to improve the accuracy and reduce the overall uncertainty.
Applying category analysis to the 2011 inventory, without considering the LULUCF sector, 27 key
categories were identified in total, both at level and trend. When considering emissions and removals
from the LULUCF sector, 32 key categories were identified.
Results of the key category assessment for the 2011 inventory are reported in Table 3.3. More details
can be found in the National Inventory Report.
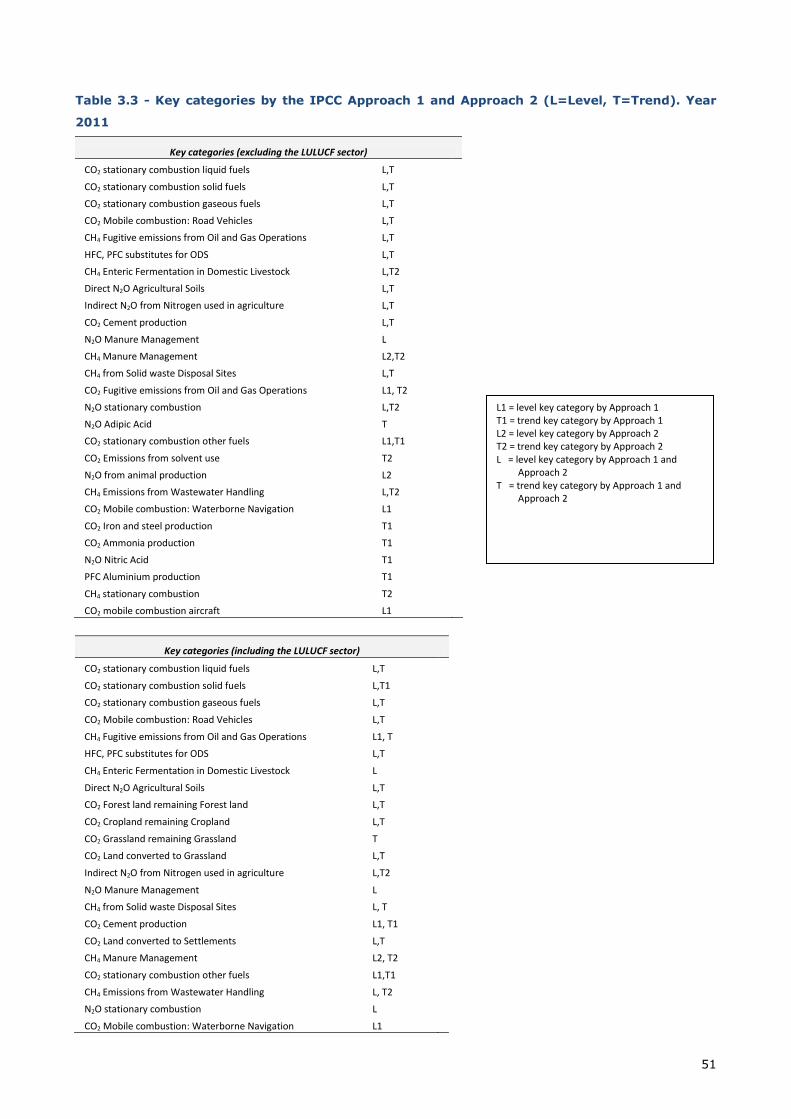
51
Table 3.3 - Key categories by the IPCC Approach 1 and Approach 2 (L=Level, T=Trend). Year
2011
Key categories (excluding the LULUCF sector)
CO2 stationary combustion liquid fuels L,T
CO2 stationary combustion solid fuels L,T
CO2 stationary combustion gaseous fuels L,T
CO2 Mobile combustion: Road Vehicles L,T
CH4 Fugitive emissions from Oil and Gas Operations L,T
HFC, PFC substitutes for ODS L,T
CH4 Enteric Fermentation in Domestic Livestock L,T2
Direct N2O Agricultural Soils L,T
Indirect N2O from Nitrogen used in agriculture L,T
CO2 Cement production L,T
N2O Manure Management L
CH4 Manure Management L2,T2
CH4 from Solid waste Disposal Sites L,T
CO2 Fugitive emissions from Oil and Gas Operations L1, T2
N2O stationary combustion L,T2
N2O Adipic Acid T
CO2 stationary combustion other fuels L1,T1
CO2 Emissions from solvent use T2
N2O from animal production L2
CH4 Emissions from Wastewater Handling L,T2
CO2 Mobile combustion: Waterborne Navigation L1
CO2 Iron and steel production T1
CO2 Ammonia production T1
N2O Nitric Acid T1
PFC Aluminium production T1
CH4 stationary combustion T2
CO2 mobile combustion aircraft L1
Key categories (including the LULUCF sector)
CO2 stationary combustion liquid fuels L,T
CO2 stationary combustion solid fuels L,T1
CO2 stationary combustion gaseous fuels L,T
CO2 Mobile combustion: Road Vehicles L,T
CH4 Fugitive emissions from Oil and Gas Operations L1, T
HFC, PFC substitutes for ODS L,T
CH4 Enteric Fermentation in Domestic Livestock L
Direct N2O Agricultural Soils L,T
CO2 Forest land remaining Forest land L,T
CO2 Cropland remaining Cropland L,T
CO2 Grassland remaining Grassland T
CO2 Land converted to Grassland L,T
Indirect N2O from Nitrogen used in agriculture L,T2
N2O Manure Management L
CH4 from Solid waste Disposal Sites L, T
CO2 Cement production L1, T1
CO2 Land converted to Settlements L,T
CH4 Manure Management L2, T2
CO2 stationary combustion other fuels L1,T1
CH4 Emissions from Wastewater Handling L, T2
N2O stationary combustion L
CO2 Mobile combustion: Waterborne Navigation L1
L1 = level key category by Approach 1 T1 = trend key category by Approach 1 L2 = level key category by Approach 2 T2 = trend key category by Approach 2 L = level key category by Approach 1 and Approach 2 T = trend key category by Approach 1 and Approach 2
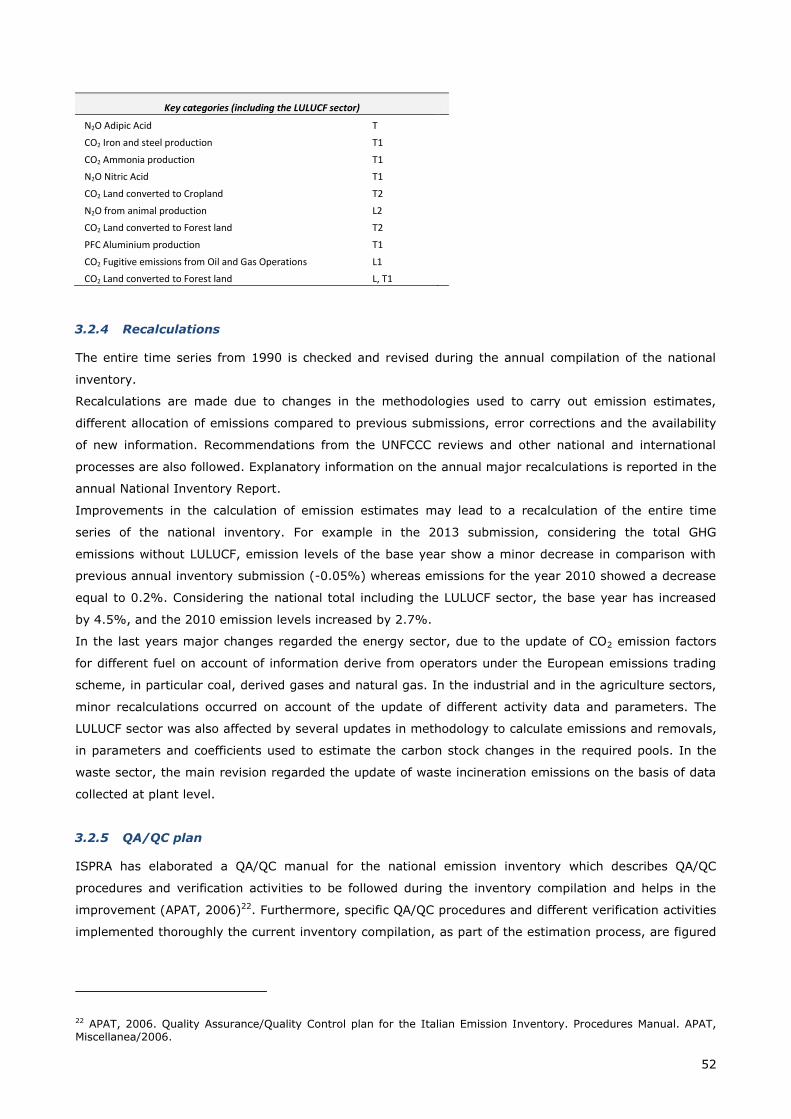
52
Key categories (including the LULUCF sector)
N2O Adipic Acid T
CO2 Iron and steel production T1
CO2 Ammonia production T1
N2O Nitric Acid T1
CO2 Land converted to Cropland T2
N2O from animal production L2
CO2 Land converted to Forest land T2
PFC Aluminium production T1
CO2 Fugitive emissions from Oil and Gas Operations L1
CO2 Land converted to Forest land L, T1
3.2.4 Recalculations
The entire time series from 1990 is checked and revised during the annual compilation of the national
inventory.
Recalculations are made due to changes in the methodologies used to carry out emission estimates,
different allocation of emissions compared to previous submissions, error corrections and the availability
of new information. Recommendations from the UNFCCC reviews and other national and international
processes are also followed. Explanatory information on the annual major recalculations is reported in the
annual National Inventory Report.
Improvements in the calculation of emission estimates may lead to a recalculation of the entire time
series of the national inventory. For example in the 2013 submission, considering the total GHG
emissions without LULUCF, emission levels of the base year show a minor decrease in comparison with
previous annual inventory submission (-0.05%) whereas emissions for the year 2010 showed a decrease
equal to 0.2%. Considering the national total including the LULUCF sector, the base year has increased
by 4.5%, and the 2010 emission levels increased by 2.7%.
In the last years major changes regarded the energy sector, due to the update of CO2 emission factors
for different fuel on account of information derive from operators under the European emissions trading
scheme, in particular coal, derived gases and natural gas. In the industrial and in the agriculture sectors,
minor recalculations occurred on account of the update of different activity data and parameters. The
LULUCF sector was also affected by several updates in methodology to calculate emissions and removals,
in parameters and coefficients used to estimate the carbon stock changes in the required pools. In the
waste sector, the main revision regarded the update of waste incineration emissions on the basis of data
collected at plant level.
3.2.5 QA/QC plan
ISPRA has elaborated a QA/QC manual for the national emission inventory which describes QA/QC
procedures and verification activities to be followed during the inventory compilation and helps in the
improvement (APAT, 2006)22. Furthermore, specific QA/QC procedures and different verification activities
implemented thoroughly the current inventory compilation, as part of the estimation process, are figured
22 APAT, 2006. Quality Assurance/Quality Control plan for the Italian Emission Inventory. Procedures Manual. APAT, Miscellanea/2006.
53
out in the annual QA/QC plan (ISPRA, 2013)23. These documents are available at
http://www.sinanet.isprambiente.it/it/sia-ispra/serie-storiche-emissioni.
Quality control checks and quality assurance procedures together with some verification activities are
applied both to the national inventory as a whole and at sectoral level. Future planned improvements are
prepared for each sector, by the relevant inventory compiler; each expert identifies areas for sectoral
improvement based on his own knowledge and in response to inventory UNFCCC reviews and other kind
of processes.
Feedbacks for the Italian inventory are obtained by communicating data to various institutions and/or at
local level. For instance, the communication of the inventory to the European Community results in a pre-
check of the GHG values before its submission to the UNFCCC, allowing possible relevant inconsistencies
to be highlighted. Emission figures are also subjected to a process of re-examination once the inventory,
the inventory related publications and the national inventory reports are posted on a website, specifically
at www.isprambiente.gov.it.
As for official independent reviews, an agreement to conduct a bilateral review between Italy and Spain
was established in 2012, with a focus on the revision of the GHG inventories of both the Parties. Two in-
country visits were already held; the Italian team revised part of the energy sector of Spain, specifically
the categories public power plants, petroleum refining plants, road transport and off-road, whereas the
Spanish team revised the Industrial processes and solvent and other product use, and the LULUCF
sectors of Italy. Results of these analyses are being finalized in a technical report. Aim of the review was
to carry out a general quality assurance analysis of the inventories in terms of the methodologies, the
EFs and the references used, as well as analysing critical cross cutting issues such as the details of the
national energy balances and comparison with international data (Eurostat and IEA), use of plant specific
information. Revisions of the other inventory sectors are planned during the year 2013.
Additionally, an official independent review of the entire Italian greenhouse gas inventory has been
undertaken by the Aether consultants. Main findings and recommendations are reported in a final
document, and regard the transparency in the NIR, the improvement of QA/QC documentation and some
pending issues in the LULUCF sector. These suggestions will be considered to improve the 2014
submission.
In 2013, ISPRA finalised the provincial inventory at local scale for the year 2010 and updated figures for
1990, 1995, 2000 and 2005 in the framework of the Protocol on Long-term Financing of the Cooperative
Programme for Monitoring and Evaluation of the Long-range Transmission of Air Pollutants in Europe
(EMEP) under the Convention on Long-range Transboundary Air Pollution (CLTRAP). Specifically, ISPRA
has applied a top-down approach to estimate emissions at provincial areas based on proxy variables. The
results were checked out by regional and local environmental agencies and authorities; data are available
at ISPRA web address http://www.sinanet.isprambiente.it/it/sia-ispra/inventaria.
The inventory is also presented to a Technical Committee on Emissions (CTE), coordinated by the
Ministry for the Environment, Land and Sea, where all the relevant Ministries and local authorities are
represented; within this context emission figures and results are shared and discussed. Especially in the
last years, there has been an intensification of the activities in order to establish national policies and
measures to meet the 2020 EU target and implement national programmes for the post Kyoto period. In
this regard, and as a basis for emission scenarios, the importance of the emission inventory is primary.
23 ISPRA, 2013. Quality Assurance/Quality Control plan for the Italian Emission Inventory. Year 2013. ISPRA, 180/2013.
54
Moreover, from 2011, a report concerning the state of implementation of commitments to reduce
greenhouse gases emissions, and describing emission trend and projections, is prepared by ISMELS in
consultation with other relevant Ministers. The report is annexed to the economy and financial document
(DEF) to be annually approved by the Government.
Expert peer reviews of the national inventory also occur annually within the UNFCCC process, and their
results and suggestions can provide valuable feedback on areas where the inventory should be improved.
Moreover, at European level, voluntary reviews of the European inventory are undertaken by experts
from various Member States for critical sectoral categories.
Comparisons between national activity data and data from international databases are usually carried out
in order to identify the main differences and explain them.
The quality of the inventory has also been improved through the organization and participation in sector
specific workshops.
A specific procedure undertaken for improving the inventory has been the establishing of national expert
panels (in particular, on road transport, land use change and forestry and energy sectors) which involve,
on a voluntary basis, different institutions, local agencies and industrial associations cooperating to
improve activity data and emission factors accuracy.
In addition to these expert panels, ISPRA participates in technical working groups within the National
Statistical System. These groups, named Circoli di qualità, coordinated by the National Institute of
Statistics, are constituted by both producers and users of statistical information with the aim of improving
and monitoring statistical information in specific sectors such as transport, industry, agriculture, forest
and fishing. As reported in previous sections, these activities improve the quality and details of basic
data, as well as enable a more organized and timely communication.
A proper archiving and reporting of the documentation related to the inventory compilation process is
also part of the national QA/QC programme. All the material and documents used for the inventory
preparation are stored at the Institute for Environmental Protection and Research.
Information relating to the planning, preparation, and management of inventory activities are
documented and archived. A master documentation catalogue is generated for each inventory year and it
is possible to track changes in data and methodologies over time. Specifically, the documentation
includes:
electronic copies of each of the final inventory report and drafts, electronic copies of the final CRF
tables and drafts;
electronic copies of all the final, linked source category spreadsheets for the inventory estimates
(including all spreadsheets that feed the emission spreadsheets);
results of the reviews and, in general, all documentation related to the corresponding inventory
year submission.
After each reporting cycle, all database files, spreadsheets and electronic documents are archived as
‘read-only’ mode.
A ‘reference’ database is also compiled every year to increase the transparency of the inventory. This
database consists of a number of records that references all documentation used during the inventory
compilation, for each sector and submission year, the link to the electronically available documents and
the place where they are stored as well as internal documentation on QA/QC procedures.
55
3.3 National registry
3.3.1 Description of national registry
Directive 2009/29/EC, adopted in 2009, provided for the centralization of the EU ETS operations into a
single European Union registry operated by the European Commission as well as for the inclusion of the
aviation sector. At the same time, and with a view to increasing efficiency in the operations of their
respective national registries, the EU Member States who are also Parties to the Kyoto Protocol (25) plus
Iceland, Liechtenstein and Norway decided to operate their registries in a consolidated manner in
accordance with all relevant decisions applicable to the establishment of Party registries - in particular
Decision 13/CMP.1 and decision 24/CP.8.
With a view to complying with the new requirements of Commission Regulation 920/2010 and
Commission Regulation 1193/2011, in addition to implementing the platform shared by the consolidating
Parties, the registry of EU has undergone a major re-development. The consolidated platform which
implements the national registries in a consolidated manner (including the registry of EU) is called
Consolidated System of EU registries (CSEUR) and was developed together with the new EU registry on
the basis the following modalities:
1. Each Party retains its organization designated as its registry administrator to maintain the national
registry of that Party and remains responsible for all the obligations of Parties that are to be fulfilled
through registries;
2. Each Kyoto unit issued by the Parties in such a consolidated system is issued by one of the
constituent Parties and continues to carry the Party of origin identifier in its unique serial number;
3. Each Party retains its own set of national accounts as required by paragraph 21 of the Annex to
Decision 15/CMP.1. Each account within a national registry keeps a unique account number
comprising the identifier of the Party and a unique number within the Party where the account is
maintained;
4. Kyoto transactions continue to be forwarded to and checked by the UNFCCC Independent Transaction
Log (ITL), which remains responsible for verifying the accuracy and validity of those transactions;
5. The transaction log and registries continue to reconcile their data with each other in order to ensure
data consistency and facilitate the automated checks of the ITL;
6. The requirements of paragraphs 44 to 48 of the Annex to Decision 13/CMP.1 concerning making non-
confidential information accessible to the public would be fulfilled by each Party individually;
7. All registries reside on a consolidated IT platform sharing the same infrastructure technologies. The
chosen architecture implements modalities to ensure that the consolidated national registries are
uniquely identifiable, protected and distinguishable from each other, notably:
With regards to the data exchange, each national registry connects to the ITL directly and
establishes a distinct and secure communication link through a consolidated communication
channel (VPN tunnel);
The ITL remains responsible for authenticating the national registries and takes the full and final
record of all transactions involving Kyoto units and other administrative processes such that
those actions cannot be disputed or repudiated;
With regards to the data storage, the consolidated platform continues to guarantee that data is
kept confidential and protected against unauthorized manipulation;
56
The data storage architecture also ensures that the data pertaining to a national registry are
distinguishable and uniquely identifiable from the data pertaining to other consolidated national
registries;
In addition, each consolidated national registry keeps a distinct user access entry point (URL) and
a distinct set of authorisation and configuration rules.
Following the successful implementation of the CSEUR platform, the 28 national registries concerned
were re-certified in June 2012 and switched over to their new national registry on 20 June 2012. During
the go-live process, all relevant transaction and holdings data were migrated to the CSEUR platform and
the individual connections to and from the ITL were re-established for each Party.
The transition to the CSEUR platform apparently brought changes to the national registry with regards to
the information required under decision 15/CMP.1 (Annex II.E Paragraphs 32a-j). Changes referring to
Paragraphs 32b-j have been described in the National Inventory Report 2013, chapter 13; contact
information about the registry administrator (Paragraph 32a) has also changed compared to previous
national communication: the contact person is now Riccardo Liburdi.
3.3.2 Registry Administrator
The Italian Government modified the previous Legislative Decrees N. 216/2006 and N. 51/2008 which
enforced European Directive 87/2003/CE, by the new Legislative Decree N. 30 of 13 March 2013.
According to this new Decree, ISPRA is responsible for the administration of the national section of the
Union Registry under the European Directive 2009/29/EC (amending Directive 2003/87/EC). The Institute
performs these tasks under the supervision of the national Competent Authority.
The Decree 30/2013 also confirms that economic resources for the technical and administrative support
of the Registry will be supplied to ISPRA by account holders paying a fee. The amount of such a fee still
has to be regulated by a future Decree.
3.3.3 Cooperation with other Parties
The EU Member States who are also Parties to the Kyoto Protocol (25) plus Iceland, Liechtenstein and
Norway decided to operate their registries in a consolidated manner in accordance with all relevant
decisions applicable to the establishment of Party registries - in particular Decision 13/CMP.1 and decision
24/CP.8. The consolidated platform which implements the national registries in a consolidated manner
(including the registry of EU) is called Consolidated System of EU registries (CSEUR).
3.3.4 Database structure and capacity of the national registry
In 2012, the EU registry has undergone a major redevelopment with a view to comply with the new
requirements of Commission Regulation 920/2010 and Commission Regulation 1193/2011 in addition to
implementing the Consolidated System of EU registries (CSEUR).
The complete description of the consolidated registry was provided in the common readiness
documentation and specific readiness documentation for the national registry of EU and all consolidating
national registries. The documentation is annexed to the 2013 submission to UNFCCC.
During certification, the consolidated registry was notably subject to connectivity testing, connectivity
reliability testing, distinctness testing and interoperability testing to demonstrate capacity and
conformance to the Data Exchange Standard (DES). All tests were executed successfully and lead to
57
successful certification on 1 June 2012.
3.3.5 Conformity with data exchange standards (DES)
The overall change to a Consolidated System of EU Registries triggered changes to the registry software
and required new conformance testing. The complete description of the consolidated registry was
provided in the common readiness documentation and specific readiness documentation for the national
registry of EU and all consolidating national registries. The documentation is annexed to the 2013
submission to UNFCCC.
During certification, the consolidated registry was notably subject to connectivity testing, connectivity
reliability testing, distinctness testing and interoperability testing to demonstrate capacity and
conformance to the Data Exchange Standard (DES). All tests were executed successfully and lead to
successful certification on 1 June 2012.
3.3.6 Procedures for minimizing and handling of discrepancies
The overall change to a Consolidated System of EU Registries also triggered changes to discrepancies
procedures, as reflected in the updated manual intervention document and the operational plan. The
complete description of the consolidated registry was provided in the common readiness documentation
and specific readiness documentation for the national registry of EU and all consolidating national
registries. The documentation is annexed to the 2013 submission to UNFCCC.
3.3.7 Prevention of unauthorized manipulations and operator error
The overall change to a Consolidated System of EU Registries also triggered changes to security, as
reflected in the updated security plan. The complete description of the consolidated registry was provided
in the common readiness documentation and specific readiness documentation for the national registry of
EU and all consolidating national registries. The documentation is annexed to the 2013 submission to
UNFCCC.
3.3.8 User interface of the national registry
Non-confidential information required by Decision 13/CMP.1 annex II.E paragraphs 44-48, is publicly
accessible through the public website http://www.info-ets.isprambiente.it.
All required information is provided with the following exceptions:
- paragraph 45(d)(e): account representatives' identifiers, name and contact information are
deemed as confidential according to article 110 and Annex VIII of Registry Regulation N.
389/2013/CE;
- paragraph 46: no details on Article 6 projects and ERU units are reported, since there are no Joint
Implementation projects in Italy;
- paragraph 47(a)(d)(f): holding and transaction information is provided aggregated, on an
account type level, due to more detailed information being deemed as confidential according to
article 110 of Registry Regulation N. 389/2013/CE.
The Italian registry can be accessed at the following URL:
https://ets-registry.webgate.ec.europa.eu/euregistry/IT/index.xhtml.
A support portal, with news, procedures, documentation, is also available for the public at:
58
http://www.info-ets.isprambiente.it.
3.3.9 Integrity of data storage and recovery
The overall change to a Consolidated System of EU Registries also triggered changes to data integrity
measures, as reflected in the updated disaster recovery plan. The complete description of the
consolidated registry was provided in the common readiness documentation and specific readiness
documentation for the national registry of EU and all consolidating national registries. The documentation
is annexed to the 2013 submission to UNFCCC.
3.3.10 Test results
The consolidated EU system of registries successfully completed a full certification procedure in June
2012. Notably, this procedure includes connectivity testing, connectivity reliability testing, distinctness
testing and interoperability testing to demonstrate capacity and conformance to the Data Exchange
Standard (DES). This included a full Annex H test. All tests were executed successfully and led to
successful certification on 1 June2012.
On 2 October 2012 a new software release (called V4) including functionalities enabling the auctioning of
phase 3 and aviation allowances, a new EU ETS account type (trading account) and a trusted account list
went into Production. This measure prevents any transfer from a holding account to an account that is
not trusted.
The October 2012 release (version 4.0) was only a minor iteration and changes were limited to EU ETS
functionality and had no impact on Kyoto Protocol functions in the registry. However, each major release
of the registry is subject to both regression testing and tests related to new functionalities. These tests
include thorough testing against the DES and are carried out prior to the relevant major release of the
version to Production.
Prior to each release, security tests are carried out by the registry developer, by the hosting organization
(DIGIT) and by an independent security expert. Test reports for these tests are confidential, in line with
standard security protocol, and cannot be disclosed. The scope of the security tests includes source code
analysis, vulnerability tests (OWASP) and penetration tests. Prior to specific release, load and stress tests
are carried out by the hosting organization (DIGIT).
59
4 POLICIES AND MEASURES24
4.1 Policy making process
In the most recent years actions taken by Italy to mitigate climate change are driven by the commitment
undertaken under:
- the Kyoto Protocol target for the period 2008-2012
- the so called “EU Climate Energy Package” for the period 2013-2020.
4.1.1 The Kyoto Protocol
Under the Kyoto Protocol, the EU-1525 has agreed to reduce its greenhouse gas (GHG) emissions by 8%
in the period 2008–2012 compared to base year levels and has decided to fulfil its commitment jointly in
accordance with the provisions of Kyoto Protocol Article 4( so called “EU burden sharing agreement”).
In the framework of the EU Burden Sharing Agreement, Italy has committed to reduce its greenhouse
gas emissions by 6.5% below base-year levels (1990) over the first commitment period, 2008-2012.
After the review of the initial report of Italy under the Kyoto Protocol (FCCC/IRR/2007/ITA) the Kyoto
objective has been established as 483.26 MtCO2/year for each year of the “commitment period”.
4.1.2 The “Climate and Energy Package” and the Effort Sharing Decision n. 406/2009/EC
The 8th and 9th March 2007 conclusion of the European Council named “Integrated Energy and Climate
Change Package” (IECCP) commits the European Member States to achieve by 2020 the following
targets:
• 20% reduction of EU greenhouse gas emissions compared to 1990. This reduction could be raised
to 30% with a global agreement for the period post 2012.
• 20% reduction in energy use to be achieved by improving energy efficiency.
• 20% use of renewable energy
• 10% use of biofuels in the transport sector.
This comprehensive set of legislation act also known as the ‘Climate and Energy package’ or “20/20/20
package” was agreed at EU level to reach those objectives and is being implemented. The most relevant
European legislation acts are:
• Directive 2009/28/EC of the European Parliament and of the Council of 23 April 2009 on the
promotion of the use of energy from renewable sources and amending and subsequently
repealing directive 2001/77/EC and 2003/30/EC: this Directive also subdivides the 20%
renewable target between the EU Member States. According to that, by 2020 the 17% of the
national final energy consumption of Italy should come from renewable sources.
• Directive 2009/29/EC of the European Parliament and of the Council of 23 April 2009 amending
Directive 2003/87/EC so as to improve and extend the greenhouse gas emission allowance
trading scheme of the community: this Directive revises and strengthens the EU Emissions
Trading Scheme (EU ETS) already in place since 2005.
24 Lead author: Monica Pantaleoni (ISPRA). Contributing authors: Riccardo De Lauretis (ISPRA), Eleonora Di Cristofaro (ISPRA), Domenico Gaudioso (ISPRA), Barbara Gonella (ISPRA), Ernesto Taurino (ISPRA), Marina Vitullo (ISPRA). 25 Until 1 May 2004 the Member States of the EU were 15 (Belgium, Denmark, Germany, Greece, Spain, France, Ireland, Italy, Luxembourg, Netherlands, Austria, Portugal, Finland, Sweden, United Kingdom). After 1 May 2004 thirteen new Member States joined the Union (Bulgaria, Croatia, Czech Republic, Cyprus, Estonia, Hungary, Latvia, Lithuania, Malta, Poland, Romania, Slovakia and Slovenia).
60
• Decision n. 406/2009/EC of the European Parliament and of the Council of 23 April 2009 on the
effort of Member States to reduce their greenhouse gas emissions to meet the Community’s
greenhouse gas emission reduction commitments up to 2020 (ESD): by 2020 Italy shall reduce
the GHG emissions by 13% compared to 2005 levels, in all the sectors not covered by the EU
ETS, such as transport, civil, agriculture and waste sectors.
• Directive 2012/27/EC of the European Parliament and of the Council of 25 October 2012 on
energy efficiency, amending Directives 2009/125/EC and 2010/30/EU and repealing Directives
2004/8/EC and 2006/32/EC: this Directive establishes a common framework of measures for the
promotion of energy efficiency within the Union in order to ensure the achievement of the Union’s
2020 20 % headline target on energy efficiency and to pave the way for further energy efficiency
improvements beyond that date.
In order to monitoring progress and assess compliance towards the targets set by Directive 2009/29/CE
and by Decision 406/2009/CE, starting from year 2013 the national emissions and projections should be
divided in two main sectors: those covered by EU ETS and all other sectors.
4.1.3 The European Union Emission Trading Scheme- ETS sector
The Directive 2003/87/EC has been amended by the Directive 2008/101/CE to include the aviation sector
and by Directive 2009/29/CE of 23 April 2009, which introduces substantive changes in the scheme for
the period 2013-2020. One of the most important changes relates to the EU wide cap setting procedure,
as the new system will be no longer based on national-cap setting.
The EU wide cap is determined according to a linear reduction path arriving at a reduction of 21% below
reported 2005 emissions in 2020. The starting point of such path is the mid-point of the 2008-12 period,
while the starting level is the average annual total quantity of allowances issued by Member States
pursuant to Commission Decisions on Member States’ national allocation plans for the period 2008-12.
This path implies a decrease of the EU wide cap of 1.74% annually. Among the other significant changes
it has to be underlined:
auctioning is the main allocation method and it’s applied as the only allocation method for the
power sector,
Manufacturing sectors are allocated via benchmarks set as the 10% best CO2 performance per
unit of production taking the years 2007-2008 as a basis for data.
the trading period is extended from 5 to 8 years in order to provide for more certainty to
industry,
other activities (such as the production of nitric, adipic, glyoxal and glyoxylic acid, the production
of ammonia, aluminium) and greenhouse gases (nitrous oxide and perfluorocarbons) are included
in the scheme.
National and international aviation has been included in ETS starting from 2012, however the full
implementation of aviation inclusion is still under international negotiation.
For what concerns the Kyoto period 2008-2012, Table 4.1 shows verified emissions submitted by ETS
operators by sector in the second trading period (2008-2012) and the difference between the verified
emissions and ex ante allocation.
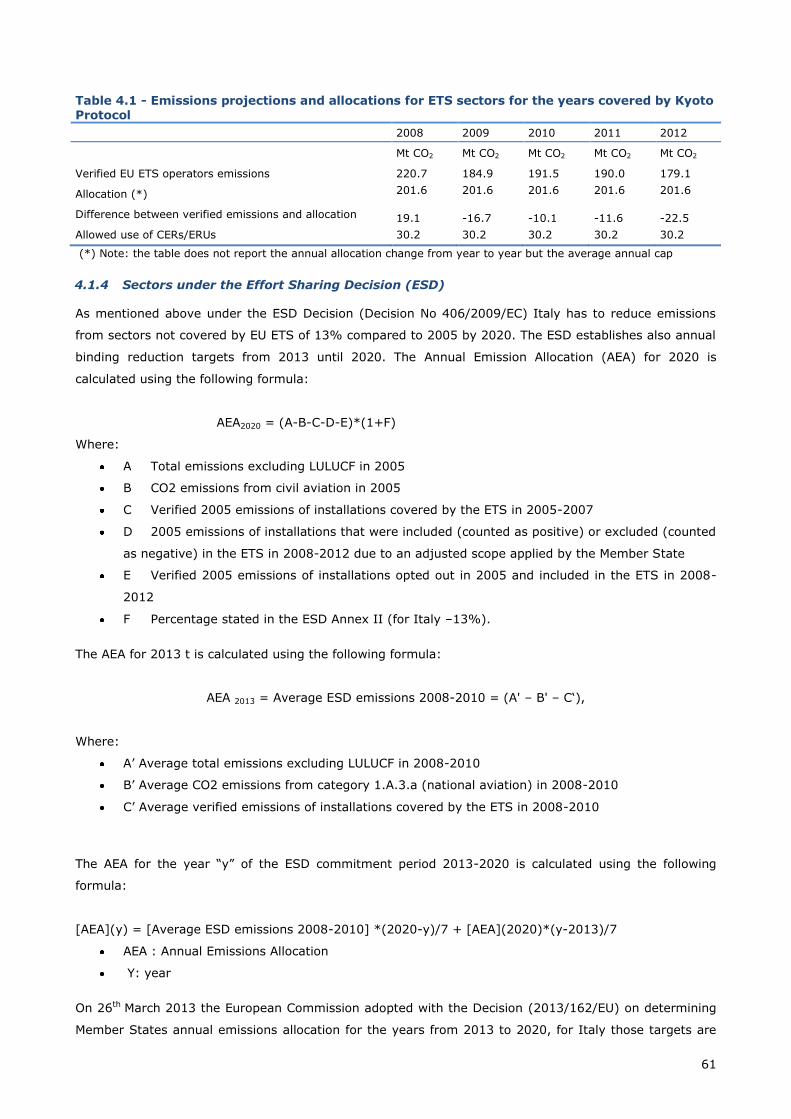
61
Table 4.1 - Emissions projections and allocations for ETS sectors for the years covered by Kyoto Protocol
2008 2009 2010 2011 2012
Mt CO2 Mt CO2 Mt CO2 Mt CO2 Mt CO2
Verified EU ETS operators emissions 220.7 184.9 191.5 190.0 179.1
Allocation (*) 201.6 201.6 201.6 201.6 201.6
Difference between verified emissions and allocation 19.1 -16.7 -10.1 -11.6 -22.5
Allowed use of CERs/ERUs 30.2 30.2 30.2 30.2 30.2
(*) Note: the table does not report the annual allocation change from year to year but the average annual cap
4.1.4 Sectors under the Effort Sharing Decision (ESD)
As mentioned above under the ESD Decision (Decision No 406/2009/EC) Italy has to reduce emissions
from sectors not covered by EU ETS of 13% compared to 2005 by 2020. The ESD establishes also annual
binding reduction targets from 2013 until 2020. The Annual Emission Allocation (AEA) for 2020 is
calculated using the following formula:
AEA2020 = (A-B-C-D-E)*(1+F)
Where:
A Total emissions excluding LULUCF in 2005
B CO2 emissions from civil aviation in 2005
C Verified 2005 emissions of installations covered by the ETS in 2005-2007
D 2005 emissions of installations that were included (counted as positive) or excluded (counted
as negative) in the ETS in 2008-2012 due to an adjusted scope applied by the Member State
E Verified 2005 emissions of installations opted out in 2005 and included in the ETS in 2008-
2012
F Percentage stated in the ESD Annex II (for Italy –13%).
The AEA for 2013 t is calculated using the following formula:
AEA 2013 = Average ESD emissions 2008-2010 = (A' – B' – C‘),
Where:
A’ Average total emissions excluding LULUCF in 2008-2010
B’ Average CO2 emissions from category 1.A.3.a (national aviation) in 2008-2010
C’ Average verified emissions of installations covered by the ETS in 2008-2010
The AEA for the year “y” of the ESD commitment period 2013-2020 is calculated using the following
formula:
[AEA](y) = [Average ESD emissions 2008-2010] *(2020-y)/7 + [AEA](2020)*(y-2013)/7
AEA : Annual Emissions Allocation
Y: year
On 26th March 2013 the European Commission adopted with the Decision (2013/162/EU) on determining
Member States annual emissions allocation for the years from 2013 to 2020, for Italy those targets are
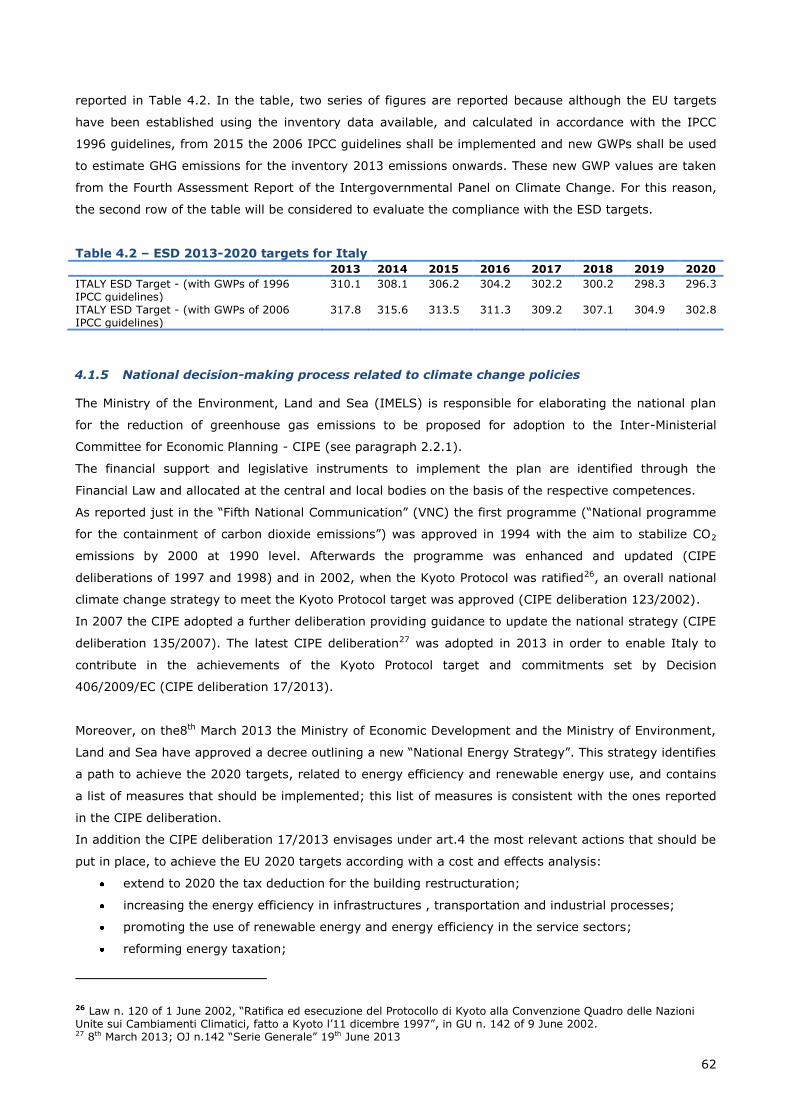
62
reported in Table 4.2. In the table, two series of figures are reported because although the EU targets
have been established using the inventory data available, and calculated in accordance with the IPCC
1996 guidelines, from 2015 the 2006 IPCC guidelines shall be implemented and new GWPs shall be used
to estimate GHG emissions for the inventory 2013 emissions onwards. These new GWP values are taken
from the Fourth Assessment Report of the Intergovernmental Panel on Climate Change. For this reason,
the second row of the table will be considered to evaluate the compliance with the ESD targets.
Table 4.2 – ESD 2013-2020 targets for Italy
2013 2014 2015 2016 2017 2018 2019 2020
ITALY ESD Target - (with GWPs of 1996 IPCC guidelines)
310.1 308.1 306.2 304.2 302.2 300.2 298.3 296.3
ITALY ESD Target - (with GWPs of 2006 IPCC guidelines)
317.8 315.6 313.5 311.3 309.2 307.1 304.9 302.8
4.1.5 National decision-making process related to climate change policies
The Ministry of the Environment, Land and Sea (IMELS) is responsible for elaborating the national plan
for the reduction of greenhouse gas emissions to be proposed for adoption to the Inter-Ministerial
Committee for Economic Planning - CIPE (see paragraph 2.2.1).
The financial support and legislative instruments to implement the plan are identified through the
Financial Law and allocated at the central and local bodies on the basis of the respective competences.
As reported just in the “Fifth National Communication” (VNC) the first programme (“National programme
for the containment of carbon dioxide emissions”) was approved in 1994 with the aim to stabilize CO2
emissions by 2000 at 1990 level. Afterwards the programme was enhanced and updated (CIPE
deliberations of 1997 and 1998) and in 2002, when the Kyoto Protocol was ratified26, an overall national
climate change strategy to meet the Kyoto Protocol target was approved (CIPE deliberation 123/2002).
In 2007 the CIPE adopted a further deliberation providing guidance to update the national strategy (CIPE
deliberation 135/2007). The latest CIPE deliberation27 was adopted in 2013 in order to enable Italy to
contribute in the achievements of the Kyoto Protocol target and commitments set by Decision
406/2009/EC (CIPE deliberation 17/2013).
Moreover, on the8th March 2013 the Ministry of Economic Development and the Ministry of Environment,
Land and Sea have approved a decree outlining a new “National Energy Strategy”. This strategy identifies
a path to achieve the 2020 targets, related to energy efficiency and renewable energy use, and contains
a list of measures that should be implemented; this list of measures is consistent with the ones reported
in the CIPE deliberation.
In addition the CIPE deliberation 17/2013 envisages under art.4 the most relevant actions that should be
put in place, to achieve the EU 2020 targets according with a cost and effects analysis:
extend to 2020 the tax deduction for the building restructuration;
increasing the energy efficiency in infrastructures , transportation and industrial processes;
promoting the use of renewable energy and energy efficiency in the service sectors;
reforming energy taxation;
26 Law n. 120 of 1 June 2002, “Ratifica ed esecuzione del Protocollo di Kyoto alla Convenzione Quadro delle Nazioni Unite sui Cambiamenti Climatici, fatto a Kyoto l’11 dicembre 1997”, in GU n. 142 of 9 June 2002. 27 8th March 2013; OJ n.142 “Serie Generale” 19th June 2013
63
promoting low carbon technologies.
4.1.6 Monitoring and evaluation of progress with climate policies and measures
The CIPE resolution 123/2002 has established an inter-Ministerial Technical Committee for GHG
emissions (CTE). The CTE is chaired by the IMELS and at the time of the approval of the CIPE
deliberation 123/2002 included representatives of the Ministries of Economy and Finance, Economic
Development, Agricultural, Food and Forestry Policies, Infrastructures, Transport, University and
Research, Foreign Affairs and of Regions. In 2009, the CIPE through its deliberation n. 16/2009, decided
to enhance the institutional framework through the reconstitution of CTE at level of general directors and
its integration with representatives of the Prime Minister office.
The main task of the CTE is to monitor the emissions trend, the status of the implementation of the
policies and measures identified in the overall national strategy of GHG emissions and in general to assist
IMELS in elaborating the national plan for the reduction of greenhouse gas emissions to be proposed to
CIPE for adoption.
The deliberation 17/2013 has also established that by 31st January of each year, the Ministry of
Environment, Land and Sea will present to CTE for further considerations:
an update of the “With Measures” and “With Additional Measures” Scenario (see chapter 5 for
definitions);
an assessment of the implementation of measures;
an update on the status of compliance with ESD Decision.
Considering the forthcoming deadline for the assessment of the compliance with the Kyoto protocol
target, the deliberation n. 17/2013 entrusts IMELS directly with the task to propose to the CIPE the
AAUs, CERs and ERUs portfolio to be bought to fill the gap.
4.2 Main policies and measures
This section gives a description of the main policies and measures that have had or are expected to have
a direct or indirect effect on the reduction of greenhouse gas emissions in Italy.
The potential emissions reduction has been assessed in detail up to 2020 for those policies and measures
reported in the latest CIPE deliberation n 17/2013.
The policies and measures hereinafter described are divided in two types:
Measures implemented by 31st December 2010;
Measures planned on 31st December 2012.
4.3 Cross Sectoral policies
4.3.1 National Action Plan for Renewable Energy 2010 and Legislative decree 28/2011
In January 2007, the Commission published a Renewable Energy Roadmap outlining a long-term strategy
and in 2009 the EU adopted Directive 2009/28/EC aiming at increasing the average renewable share
across the EU to 20% by 2020. Such Directive sets individual targets for each Member State (the national
target for Italy is 17%). EU countries are free to decide their own preferred 'mix' of renewable sources,
allowing them to take account of their different potentials. They must present national action plans
(NAPs) based on the indicative trajectories to the European Commission by 30 June 2010, followed by
progress reports submitted every two years. The objective expressed in the form of a share of energy
64
from renewable sources relative to total consumption in transport, electricity and heating and cooling in
2020 takes also into account the effects of other policy measures addressing energy efficiency.
The Directive 2009/28/EU has been transposed by the Legislative Decree N. 28 of 3rd March 2011. The
decree defines the mechanisms, the incentives and the institutional, financial and legal tools necessary to
achieve the 2020 targets regarding the renewable energy use. The decree also provides for a substantial
reorganization of existing incentive schemes in particular in the field of green certificates and white
certificates system, both described below.
4.3.2 Decree 28th December 2012 - Conto Termico (“Heating Account”)
The 28th December 2012 decree, the so called “Conto Termico” decree, implements the incentive scheme
introduced by Legislative Decree 28/2011; in particular encourages small-scale energy efficiency
measures in public sector buildings and the production of thermal energy from renewable sources (in
both public and private sector).
The measures covered by the decree are: building shells, replacement of heating plants with ones more
efficient and replacement or installation of equipment using renewable energy.
The incentives are identified based on the energy saving achievable for the building and on energy
production from renewable sources
4.3.3 Directive 2012/27/EC – Energy Efficiency
The Directive 2012/27/UE establishes a common framework for the promotion of energy efficiency,
doesn’t set mandatory targets but in the same time points out measures in the areas of energy-supply
and energy end-use.
Each member state by the end of April 2013 should set targets in terms of energy consumption and
primary /final energy savings, energy intensity and should notify it to the European Commission. By the
end of June 2014 the European Commission will assesses progresses.
The most relevant directive articles are ones related to the renovation of the buildings in the public
sector, the metering and accounting of energy efficiency, promoting of heating and cooling (the impact
on thermal generation), processing, transmission and distribution of energy.
4.3.4 The White Certificates system
The White Certificates or Title of Energy Efficiency (TEE) system represents a cross cutting policy aimed
at promoting energy efficiency and delivering emissions reductions in all the energy end use sectors:
industrial, residential, service. The system was firstly introduced in July 2001 by means of two ministerial
decrees. The history of this measure has just been explained in detail in paragraph 4.3 of the VNC. Very
briefly the system introduces and enforces energy saving targets for electricity and natural gas
distributors.
In the December 2012 was issued the so called “White Certificate Decree” concerning the determination
of national quantitative targets of energy savings that must be pursued to the distribution companies for
electricity and gas from 2013 to 2016 and for the expansion of white certificates mechanism. The decree
also defines the criteria, the conditions and the procedures to implement energy efficiency measures in
end-use energy and transfers to the GSE from 2013 the management, assessment and certification of
energy saving projects carried out under white certificates.
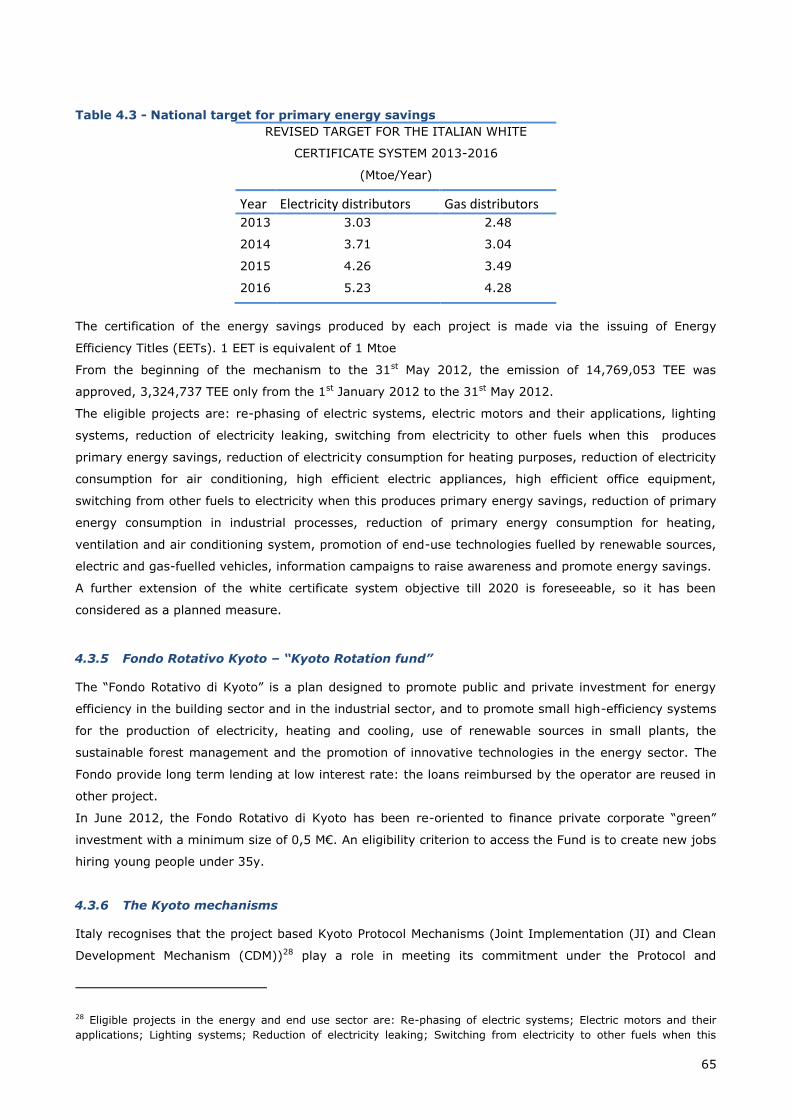
65
Table 4.3 - National target for primary energy savings
REVISED TARGET FOR THE ITALIAN WHITE
CERTIFICATE SYSTEM 2013-2016
(Mtoe/Year)
Year Electricity distributors Gas distributors 2013 3.03 2.48
2014 3.71 3.04
2015 4.26 3.49
2016 5.23 4.28
The certification of the energy savings produced by each project is made via the issuing of Energy
Efficiency Titles (EETs). 1 EET is equivalent of 1 Mtoe
From the beginning of the mechanism to the 31st May 2012, the emission of 14,769,053 TEE was
approved, 3,324,737 TEE only from the 1st January 2012 to the 31st May 2012.
The eligible projects are: re-phasing of electric systems, electric motors and their applications, lighting
systems, reduction of electricity leaking, switching from electricity to other fuels when this produces
primary energy savings, reduction of electricity consumption for heating purposes, reduction of electricity
consumption for air conditioning, high efficient electric appliances, high efficient office equipment,
switching from other fuels to electricity when this produces primary energy savings, reduction of primary
energy consumption in industrial processes, reduction of primary energy consumption for heating,
ventilation and air conditioning system, promotion of end-use technologies fuelled by renewable sources,
electric and gas-fuelled vehicles, information campaigns to raise awareness and promote energy savings.
A further extension of the white certificate system objective till 2020 is foreseeable, so it has been
considered as a planned measure.
4.3.5 Fondo Rotativo Kyoto – “Kyoto Rotation fund”
The “Fondo Rotativo di Kyoto” is a plan designed to promote public and private investment for energy
efficiency in the building sector and in the industrial sector, and to promote small high-efficiency systems
for the production of electricity, heating and cooling, use of renewable sources in small plants, the
sustainable forest management and the promotion of innovative technologies in the energy sector. The
Fondo provide long term lending at low interest rate: the loans reimbursed by the operator are reused in
other project.
In June 2012, the Fondo Rotativo di Kyoto has been re-oriented to finance private corporate “green”
investment with a minimum size of 0,5 M€. An eligibility criterion to access the Fund is to create new jobs
hiring young people under 35y.
4.3.6 The Kyoto mechanisms
Italy recognises that the project based Kyoto Protocol Mechanisms (Joint Implementation (JI) and Clean
Development Mechanism (CDM))28 play a role in meeting its commitment under the Protocol and
28 Eligible projects in the energy and end use sector are: Re-phasing of electric systems; Electric motors and their
applications; Lighting systems; Reduction of electricity leaking; Switching from electricity to other fuels when this
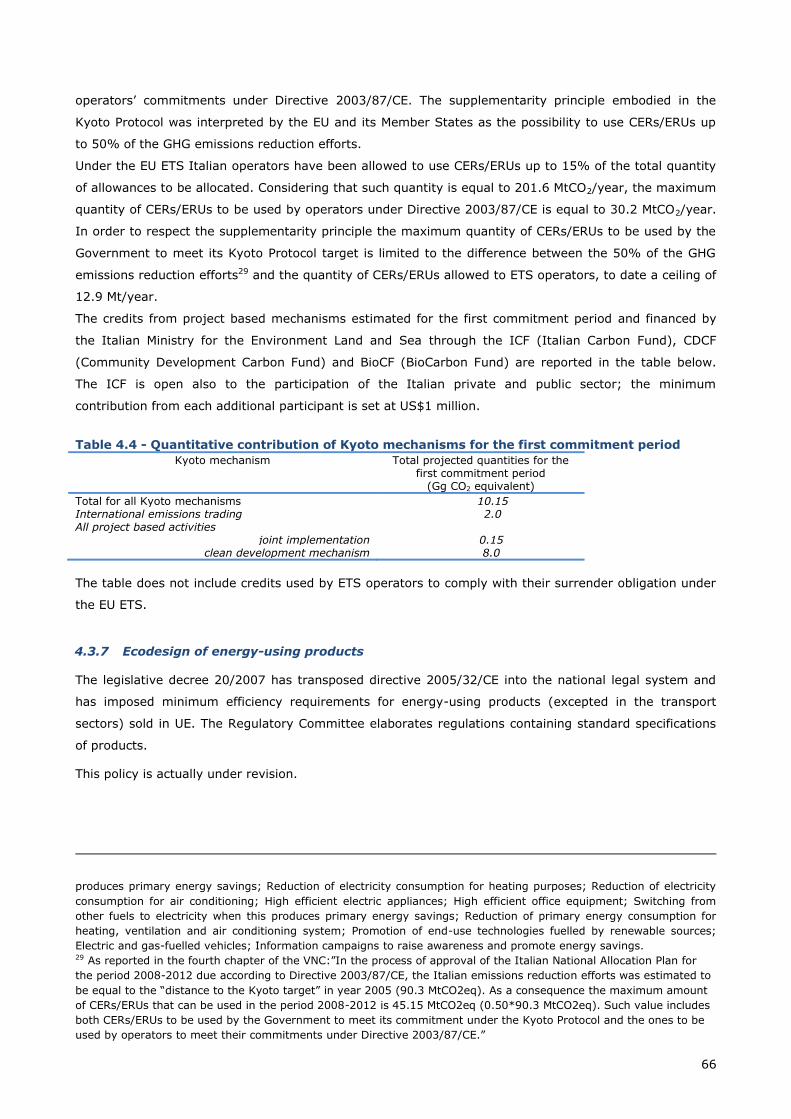
66
operators’ commitments under Directive 2003/87/CE. The supplementarity principle embodied in the
Kyoto Protocol was interpreted by the EU and its Member States as the possibility to use CERs/ERUs up
to 50% of the GHG emissions reduction efforts.
Under the EU ETS Italian operators have been allowed to use CERs/ERUs up to 15% of the total quantity
of allowances to be allocated. Considering that such quantity is equal to 201.6 MtCO2/year, the maximum
quantity of CERs/ERUs to be used by operators under Directive 2003/87/CE is equal to 30.2 MtCO2/year.
In order to respect the supplementarity principle the maximum quantity of CERs/ERUs to be used by the
Government to meet its Kyoto Protocol target is limited to the difference between the 50% of the GHG
emissions reduction efforts29 and the quantity of CERs/ERUs allowed to ETS operators, to date a ceiling of
12.9 Mt/year.
The credits from project based mechanisms estimated for the first commitment period and financed by
the Italian Ministry for the Environment Land and Sea through the ICF (Italian Carbon Fund), CDCF
(Community Development Carbon Fund) and BioCF (BioCarbon Fund) are reported in the table below.
The ICF is open also to the participation of the Italian private and public sector; the minimum
contribution from each additional participant is set at US$1 million.
Table 4.4 - Quantitative contribution of Kyoto mechanisms for the first commitment period
Kyoto mechanism Total projected quantities for the first commitment period
(Gg CO2 equivalent)
Total for all Kyoto mechanisms 10.15 International emissions trading 2.0 All project based activities
joint implementation 0.15 clean development mechanism 8.0
The table does not include credits used by ETS operators to comply with their surrender obligation under
the EU ETS.
4.3.7 Ecodesign of energy-using products
The legislative decree 20/2007 has transposed directive 2005/32/CE into the national legal system and
has imposed minimum efficiency requirements for energy-using products (excepted in the transport
sectors) sold in UE. The Regulatory Committee elaborates regulations containing standard specifications
of products.
This policy is actually under revision.
produces primary energy savings; Reduction of electricity consumption for heating purposes; Reduction of electricity
consumption for air conditioning; High efficient electric appliances; High efficient office equipment; Switching from
other fuels to electricity when this produces primary energy savings; Reduction of primary energy consumption for
heating, ventilation and air conditioning system; Promotion of end-use technologies fuelled by renewable sources;
Electric and gas-fuelled vehicles; Information campaigns to raise awareness and promote energy savings. 29 As reported in the fourth chapter of the VNC:”In the process of approval of the Italian National Allocation Plan for
the period 2008-2012 due according to Directive 2003/87/CE, the Italian emissions reduction efforts was estimated to
be equal to the “distance to the Kyoto target” in year 2005 (90.3 MtCO2eq). As a consequence the maximum amount
of CERs/ERUs that can be used in the period 2008-2012 is 45.15 MtCO2eq (0.50*90.3 MtCO2eq). Such value includes
both CERs/ERUs to be used by the Government to meet its commitment under the Kyoto Protocol and the ones to be
used by operators to meet their commitments under Directive 2003/87/CE.”
67
4.3.8 Structural funds 2007-2013
This policy has been described in detail in the ”VNC” (see paragraph 4.3 and in particular table 4.3). The
measure foresee a contribution by EU in investments focused on the improvement of energy efficiency,
development of renewable energies and improvement of transport networks and waste management.
4.3.9 Covenant of Mayors
The Covenant of Mayors is an initiative launched by the European Commission to endorse and support
the voluntary efforts deployed by local authorities in the implementation of sustainable energy policies. It
plays an important role in mobilising local and regional actors around the fulfilment of the EU’s climate
and energy targets for 2020.
In order to translate their voluntary political commitment into specific measures and projects, Covenant
signatories undertake to prepare and submit, within the year following their signature, a Sustainable
Energy Action Plan (SEAP). The SEAP is the key document in which the Covenant signatory outlines how
it intends to reach its CO2 reduction target by 2020. It defines the activities and measures set up to
achieve the targets, together with time frames and assigned responsibilities. By the end of 2013, 2627
Italian mayors, representing 31,356,850 inhabitants, have signed the Covenant. The population covered
is therefore 53% of the total Italian population, which means that Italy ranks second in Europe, after
Spain. 66% of the Covenant Communities have already submitted their SEAP.
Through their participation to the initiative, the Italian municipalities have achieved a number of positive
results, in particular by increasing local political attention on the issues of energy efficiency, renewable
energy, sustainable mobility, waste, and establishing channels to provide information to citizens.
At the same time, the following problems have emerged:
• difficulties in ensuring compliance with the commitments arising from the accession to the Covenant
of Mayors (e.g. the submission of SEAPs within one year from the signature of the covenant);
• lack of human and financial resources to achieve objectives;
• identification, planning and implementation of actions in all key areas, which will lead to the
objective of reducing CO2 emissions (especially for smaller municipalities).
For these reasons, the Ministry for the Environment will provide in the future increasing support to the
Communities participating to the initiative, by:
• supporting technical work concerning the preparation of baseline inventories (e.g. identification of a
common set of data-bases for energy consumption, homogenization of software for inventory
calculations)
• providing guidelines and handbooks for public administrations concerning issues such as energy
audits of buildings, EU funding, energy performance contracting, preparation of joint SEAPs;
• establishing a web site providing examples of good practices and experiences of various Italian
subjects.
4.4 Energy Sectors
The Energy production and transformation sector are under Emission Trading Scheme. The emissions
from this sector are also influenced by other measures that traditionally can be grouped into four main
measures:
68
Use of renewable energy
Cogeneration
Improving the efficiency for electricity and thermal use of thermoelectric power plants
Improving of energy efficiency in industry
4.4.1 Renewable energy sources
In Italy the electricity production by renewable use has had a very important development in the period
2010-2012, driven by the financial incentives, in particular for the photovoltaic sources; in fact the
electricity gross production from renewable sources was ~ 93 TWh in the 2012 compared with a 2020
national target of 120-130 TWh / year according to 2013 “National Energy Strategy”. As explained before
this rapid growth is due in particular to the high increase of photovoltaic production.
Also the thermal renewable sources have a relevant role to achieve the IECCP targets. Until recently
these technologies have been rather neglected by the country's energy policies and regulation, but
despite this, they have had an important development.
The heat consumption represents the largest share of our energy consumption, both in the civil and
industrial sectors (approximately 45% of total final consumption). The thermal renewable are generally
more efficient and less expensive than the electric ones, in terms of cost per tonne of CO2 avoided or
cost per kWh of final energy produced and involve significant benefits of saving fossil fuel for the final
consumer (e.g. through biomass heating), and for the country as a whole (reducing imports).
The development of renewable thermal energy use over the past five years has occurred in line with the
objectives (5.4 Mtoe in 2010) and was driven by measures regarding energy efficiency, tax deductions or
white certificates.
The rest of this paragraph presents a review of main incentives to renewable in last years.
The Green Certificates system
Since the early 90s several different schemes have been introduced to subsidise the diffusion of
renewable energy sources in electricity production, see paragraph 4.2 of the VNC.
Green Certificates are tradable rights issued for the first eight years of incremental generation of
renewable electricity: in order to qualify for the issuance of Green Certificates the plant generating
renewable electricity must have started operation after April 1st, 1999. Each certificate represents 50
MWh and its price is determined by market forces. In case of insufficient supply of Green Certificates on
the market, the GSE can sell these certificates at a prescribed price that is the difference between the
take-up price paid to the generator and the average price paid in the same period to conventional
producers. This price has become an upper boundary for the price of the certificates freely sold on the
market.
Paragraph 5 of Article 22 of Legislative Decree 28/2011 declares the end of the incentive mechanism of
green certificates after 2015, that will be substitutes by other supporting mechanisms outlined below.
The “Omnicomprensiva” Tariff - All-encompassing tariff
The “Omnicomprensiva” is a support system based on providing fixed charge granted to renewable
energy installations in the energy function electric grid (feed in tariff). This rate is applicable only to
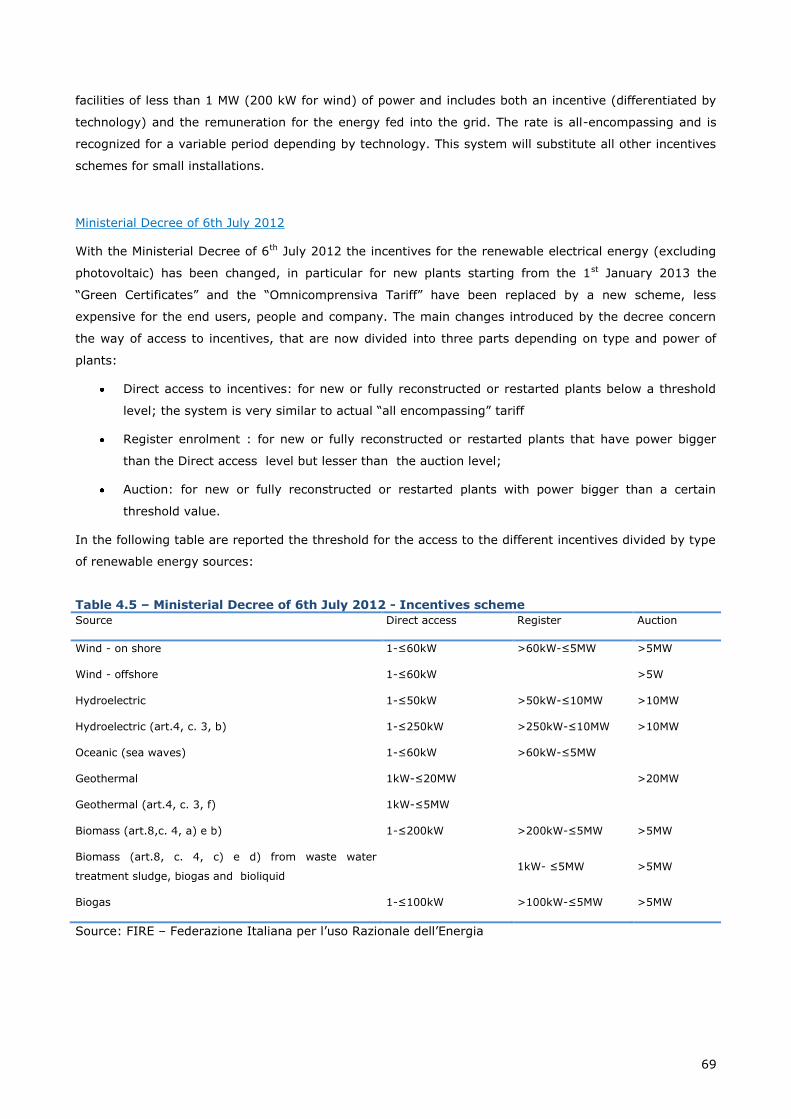
69
facilities of less than 1 MW (200 kW for wind) of power and includes both an incentive (differentiated by
technology) and the remuneration for the energy fed into the grid. The rate is all-encompassing and is
recognized for a variable period depending by technology. This system will substitute all other incentives
schemes for small installations.
Ministerial Decree of 6th July 2012
With the Ministerial Decree of 6th July 2012 the incentives for the renewable electrical energy (excluding
photovoltaic) has been changed, in particular for new plants starting from the 1st January 2013 the
“Green Certificates” and the “Omnicomprensiva Tariff” have been replaced by a new scheme, less
expensive for the end users, people and company. The main changes introduced by the decree concern
the way of access to incentives, that are now divided into three parts depending on type and power of
plants:
Direct access to incentives: for new or fully reconstructed or restarted plants below a threshold
level; the system is very similar to actual “all encompassing” tariff
Register enrolment : for new or fully reconstructed or restarted plants that have power bigger
than the Direct access level but lesser than the auction level;
Auction: for new or fully reconstructed or restarted plants with power bigger than a certain
threshold value.
In the following table are reported the threshold for the access to the different incentives divided by type
of renewable energy sources:
Table 4.5 – Ministerial Decree of 6th July 2012 - Incentives scheme
Source Direct access Register Auction
Wind - on shore 1-≤60kW >60kW-≤5MW >5MW
Wind - offshore 1-≤60kW
>5W
Hydroelectric 1-≤50kW >50kW-≤10MW >10MW
Hydroelectric (art.4, c. 3, b) 1-≤250kW >250kW-≤10MW >10MW
Oceanic (sea waves) 1-≤60kW >60kW-≤5MW
Geothermal 1kW-≤20MW
>20MW
Geothermal (art.4, c. 3, f) 1kW-≤5MW
Biomass (art.8,c. 4, a) e b) 1-≤200kW >200kW-≤5MW >5MW
Biomass (art.8, c. 4, c) e d) from waste water
treatment sludge, biogas and bioliquid 1kW- ≤5MW >5MW
Biogas 1-≤100kW >100kW-≤5MW >5MW
Source: FIRE – Federazione Italiana per l’uso Razionale dell’Energia
70
The “Conto Energia”
The “Conto Energia” is a support system that provides constant compensation electricity produced by
solar photovoltaic and thermodynamic, for a fixed period (20 years for photovoltaic systems, solar
systems and 25 years for thermodynamic) through a tariff for all energy produced by the plants (feed in
premium). The system has exhausted the available financial allowances in mid 2013. Photovoltaic
generation has reduced capital costs by about 70% from 2008 to 2012 and incentives for small
photovoltaic installations are limited to tax incentives (50% of capital investment recovered as tax
deduction).
Thermal renewable energy
The strategy of additional development of thermal renewable energy use is based on a number of specific
mechanisms:
small size technologies (relating primarily to the civilian sector), the Government has recently
launched a ministerial decree the so-called "Conto Termico". This mechanism, as explained
before, provide the access to the incentive scheme to the most virtuous technologies, with
minimum standards established for each type of technologies and greater incentives where also
energy efficiency is foreseen.
For larger size technologies the supporting mechanisms are the White Certificates.
Table 4.6 reports impacts on emissions for every single measure.
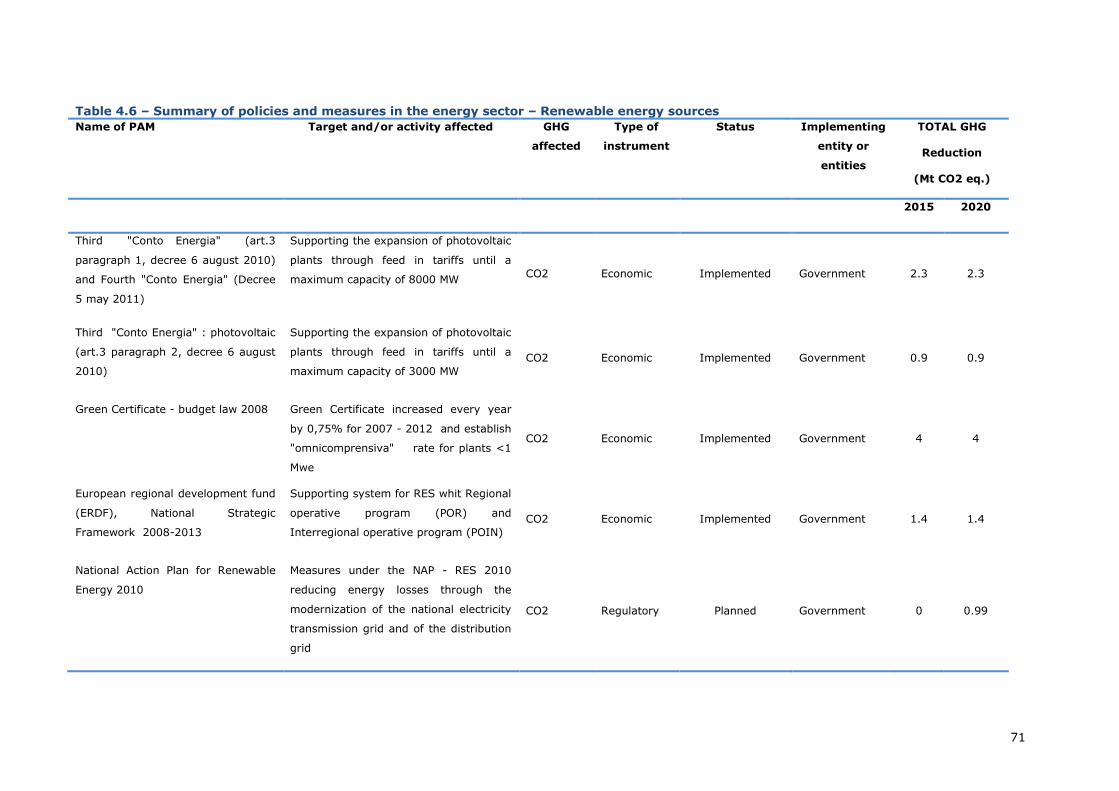
71
Table 4.6 – Summary of policies and measures in the energy sector – Renewable energy sources
Name of PAM Target and/or activity affected GHG
affected
Type of
instrument
Status Implementing
entity or
entities
TOTAL GHG
Reduction
(Mt CO2 eq.)
2015 2020
Third "Conto Energia" (art.3
paragraph 1, decree 6 august 2010)
and Fourth "Conto Energia" (Decree
5 may 2011)
Supporting the expansion of photovoltaic
plants through feed in tariffs until a
maximum capacity of 8000 MW CO2 Economic Implemented Government 2.3 2.3
Third "Conto Energia" : photovoltaic
(art.3 paragraph 2, decree 6 august
2010)
Supporting the expansion of photovoltaic
plants through feed in tariffs until a
maximum capacity of 3000 MW
CO2 Economic Implemented Government 0.9 0.9
Green Certificate - budget law 2008 Green Certificate increased every year
by 0,75% for 2007 - 2012 and establish
"omnicomprensiva" rate for plants <1
Mwe
CO2 Economic Implemented Government 4 4
European regional development fund
(ERDF), National Strategic
Framework 2008-2013
Supporting system for RES whit Regional
operative program (POR) and
Interregional operative program (POIN)
CO2 Economic Implemented Government 1.4 1.4
National Action Plan for Renewable
Energy 2010
Measures under the NAP - RES 2010
reducing energy losses through the
modernization of the national electricity
transmission grid and of the distribution
grid
CO2 Regulatory Planned Government 0 0.99
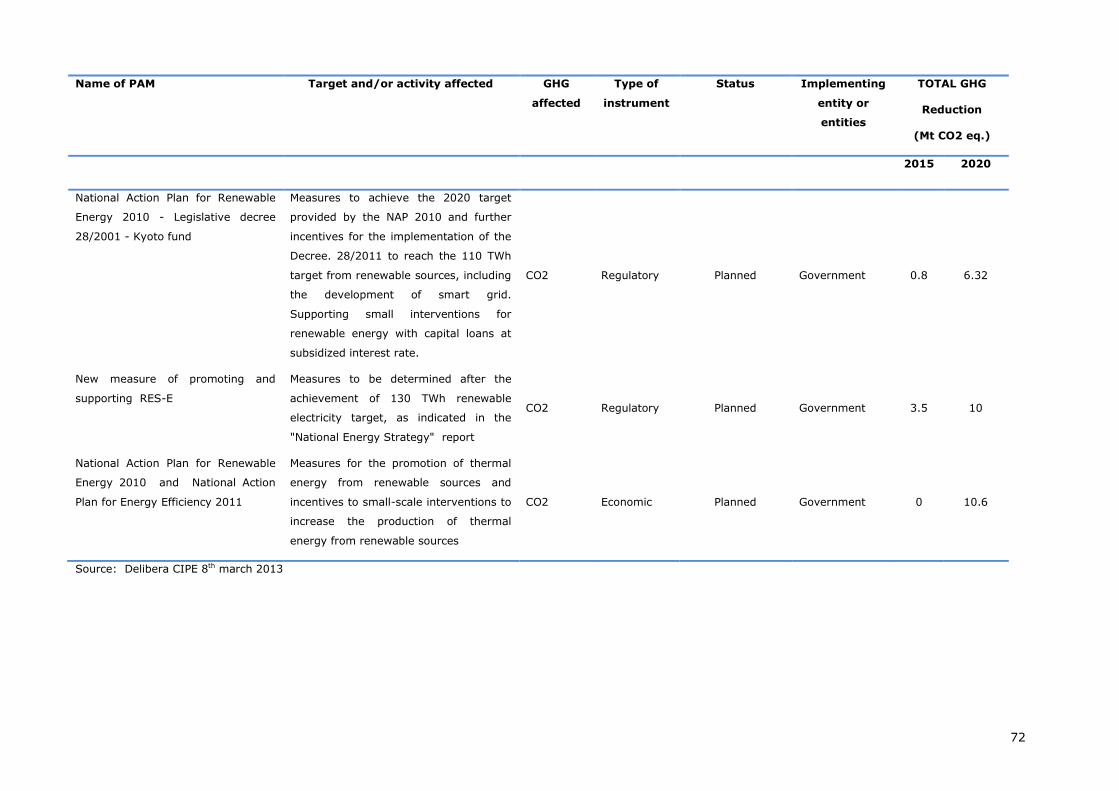
72
Name of PAM Target and/or activity affected GHG
affected
Type of
instrument
Status Implementing
entity or
entities
TOTAL GHG
Reduction
(Mt CO2 eq.)
2015 2020
National Action Plan for Renewable
Energy 2010 - Legislative decree
28/2001 - Kyoto fund
Measures to achieve the 2020 target
provided by the NAP 2010 and further
incentives for the implementation of the
Decree. 28/2011 to reach the 110 TWh
target from renewable sources, including
the development of smart grid.
Supporting small interventions for
renewable energy with capital loans at
subsidized interest rate.
CO2 Regulatory Planned Government 0.8 6.32
New measure of promoting and
supporting RES-E
Measures to be determined after the
achievement of 130 TWh renewable
electricity target, as indicated in the
"National Energy Strategy" report
CO2 Regulatory Planned Government 3.5 10
National Action Plan for Renewable
Energy 2010 and National Action
Plan for Energy Efficiency 2011
Measures for the promotion of thermal
energy from renewable sources and
incentives to small-scale interventions to
increase the production of thermal
energy from renewable sources
CO2 Economic Planned Government 0 10.6
Source: Delibera CIPE 8th march 2013
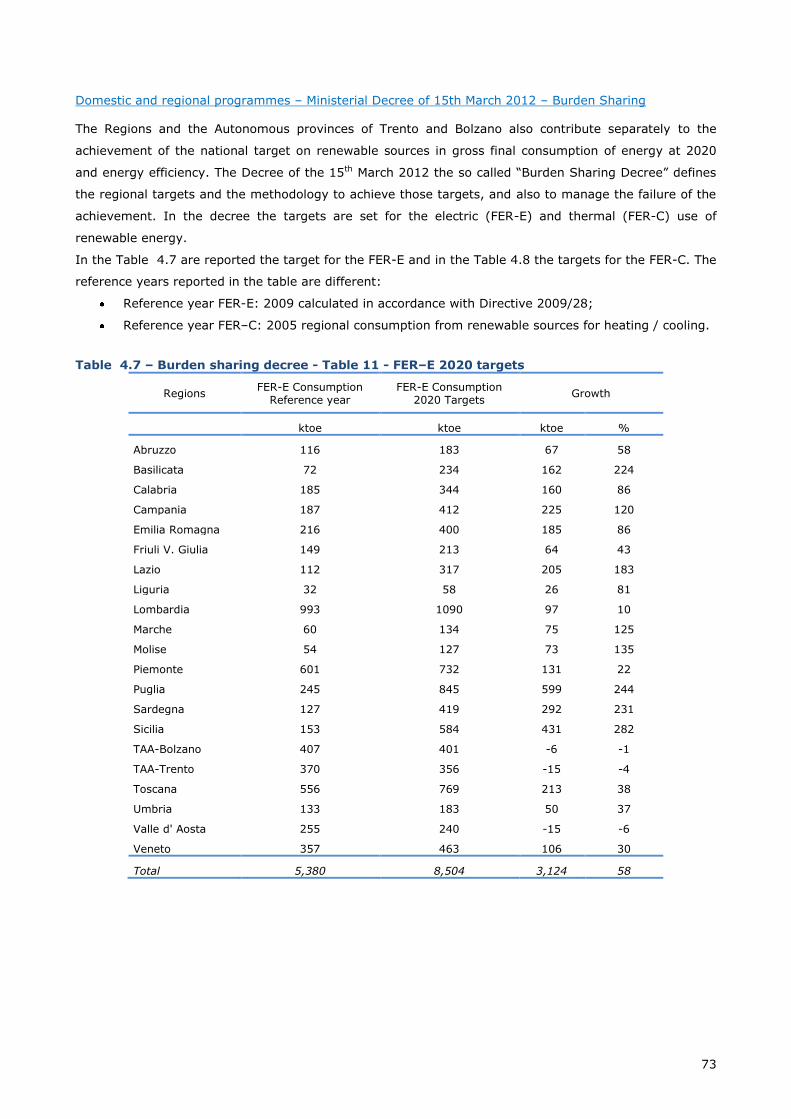
73
Domestic and regional programmes – Ministerial Decree of 15th March 2012 – Burden Sharing
The Regions and the Autonomous provinces of Trento and Bolzano also contribute separately to the
achievement of the national target on renewable sources in gross final consumption of energy at 2020
and energy efficiency. The Decree of the 15th March 2012 the so called “Burden Sharing Decree” defines
the regional targets and the methodology to achieve those targets, and also to manage the failure of the
achievement. In the decree the targets are set for the electric (FER-E) and thermal (FER-C) use of
renewable energy.
In the Table 4.7 are reported the target for the FER-E and in the Table 4.8 the targets for the FER-C. The
reference years reported in the table are different:
Reference year FER-E: 2009 calculated in accordance with Directive 2009/28;
Reference year FER–C: 2005 regional consumption from renewable sources for heating / cooling.
Table 4.7 – Burden sharing decree - Table 11 - FER–E 2020 targets
Regions FER-E Consumption
Reference year FER-E Consumption
2020 Targets Growth
ktoe ktoe ktoe %
Abruzzo 116 183 67 58
Basilicata 72 234 162 224
Calabria 185 344 160 86
Campania 187 412 225 120
Emilia Romagna 216 400 185 86
Friuli V. Giulia 149 213 64 43
Lazio 112 317 205 183
Liguria 32 58 26 81
Lombardia 993 1090 97 10
Marche 60 134 75 125
Molise 54 127 73 135
Piemonte 601 732 131 22
Puglia 245 845 599 244
Sardegna 127 419 292 231
Sicilia 153 584 431 282
TAA-Bolzano 407 401 -6 -1
TAA-Trento 370 356 -15 -4
Toscana 556 769 213 38
Umbria 133 183 50 37
Valle d' Aosta 255 240 -15 -6
Veneto 357 463 106 30
Total 5,380 8,504 3,124 58
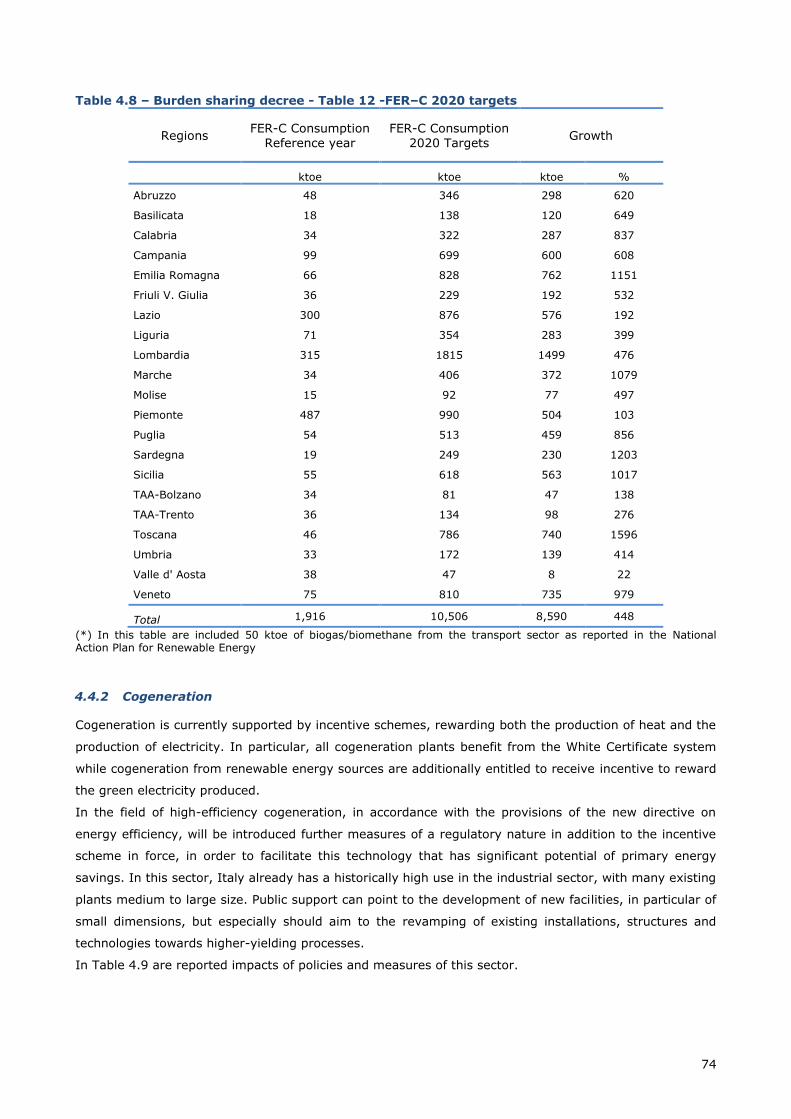
74
Table 4.8 – Burden sharing decree - Table 12 -FER–C 2020 targets
Regions FER-C Consumption
Reference year
FER-C Consumption
2020 Targets Growth
ktoe ktoe ktoe %
Abruzzo 48 346 298 620
Basilicata 18 138 120 649
Calabria 34 322 287 837
Campania 99 699 600 608
Emilia Romagna 66 828 762 1151
Friuli V. Giulia 36 229 192 532
Lazio 300 876 576 192
Liguria 71 354 283 399
Lombardia 315 1815 1499 476
Marche 34 406 372 1079
Molise 15 92 77 497
Piemonte 487 990 504 103
Puglia 54 513 459 856
Sardegna 19 249 230 1203
Sicilia 55 618 563 1017
TAA-Bolzano 34 81 47 138
TAA-Trento 36 134 98 276
Toscana 46 786 740 1596
Umbria 33 172 139 414
Valle d' Aosta 38 47 8 22
Veneto 75 810 735 979
Total 1,916 10,506 8,590 448
(*) In this table are included 50 ktoe of biogas/biomethane from the transport sector as reported in the National Action Plan for Renewable Energy
4.4.2 Cogeneration
Cogeneration is currently supported by incentive schemes, rewarding both the production of heat and the
production of electricity. In particular, all cogeneration plants benefit from the White Certificate system
while cogeneration from renewable energy sources are additionally entitled to receive incentive to reward
the green electricity produced.
In the field of high-efficiency cogeneration, in accordance with the provisions of the new directive on
energy efficiency, will be introduced further measures of a regulatory nature in addition to the incentive
scheme in force, in order to facilitate this technology that has significant potential of primary energy
savings. In this sector, Italy already has a historically high use in the industrial sector, with many existing
plants medium to large size. Public support can point to the development of new facilities, in particular of
small dimensions, but especially should aim to the revamping of existing installations, structures and
technologies towards higher-yielding processes.
In Table 4.9 are reported impacts of policies and measures of this sector.
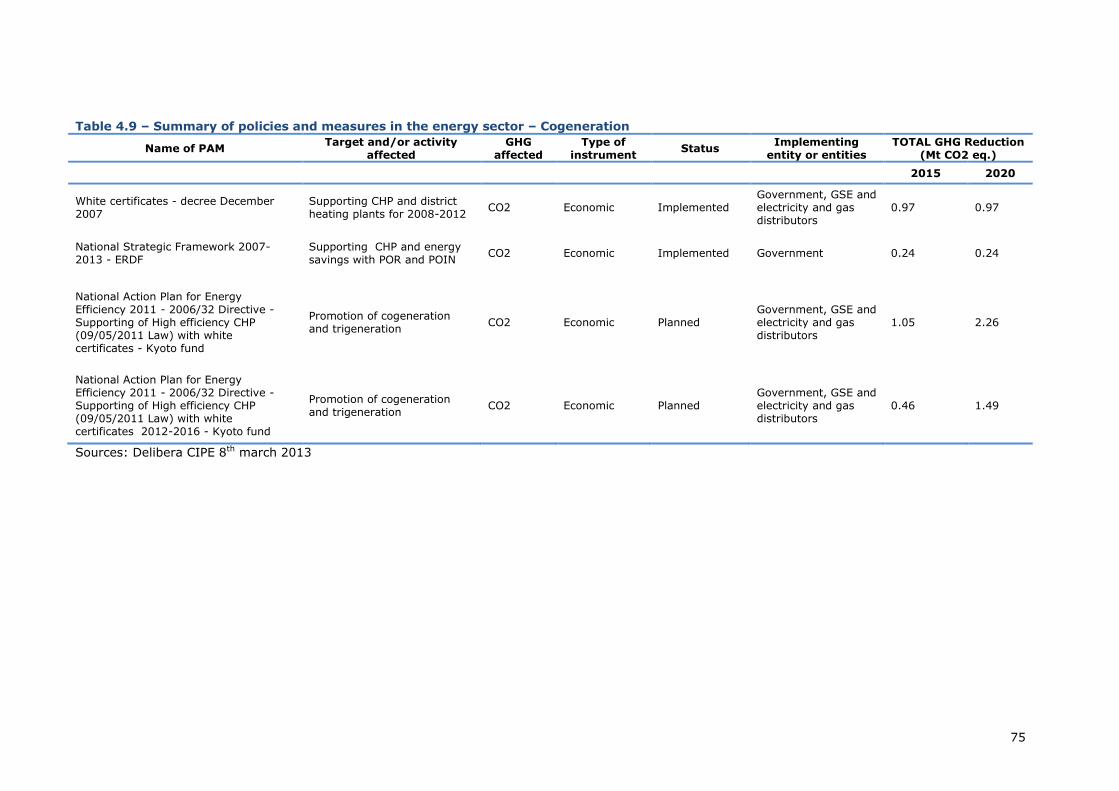
75
Table 4.9 – Summary of policies and measures in the energy sector – Cogeneration
Name of PAM Target and/or activity
affected GHG
affected Type of
instrument Status
Implementing entity or entities
TOTAL GHG Reduction (Mt CO2 eq.)
2015 2020
White certificates - decree December 2007
Supporting CHP and district heating plants for 2008-2012
CO2 Economic Implemented Government, GSE and electricity and gas distributors
0.97 0.97
National Strategic Framework 2007-2013 - ERDF
Supporting CHP and energy savings with POR and POIN
CO2 Economic Implemented Government 0.24 0.24
National Action Plan for Energy Efficiency 2011 - 2006/32 Directive - Supporting of High efficiency CHP (09/05/2011 Law) with white certificates - Kyoto fund
Promotion of cogeneration and trigeneration
CO2 Economic Planned Government, GSE and electricity and gas distributors
1.05 2.26
National Action Plan for Energy Efficiency 2011 - 2006/32 Directive - Supporting of High efficiency CHP (09/05/2011 Law) with white certificates 2012-2016 - Kyoto fund
Promotion of cogeneration and trigeneration
CO2 Economic Planned Government, GSE and electricity and gas distributors
0.46 1.49
Sources: Delibera CIPE 8th march 2013
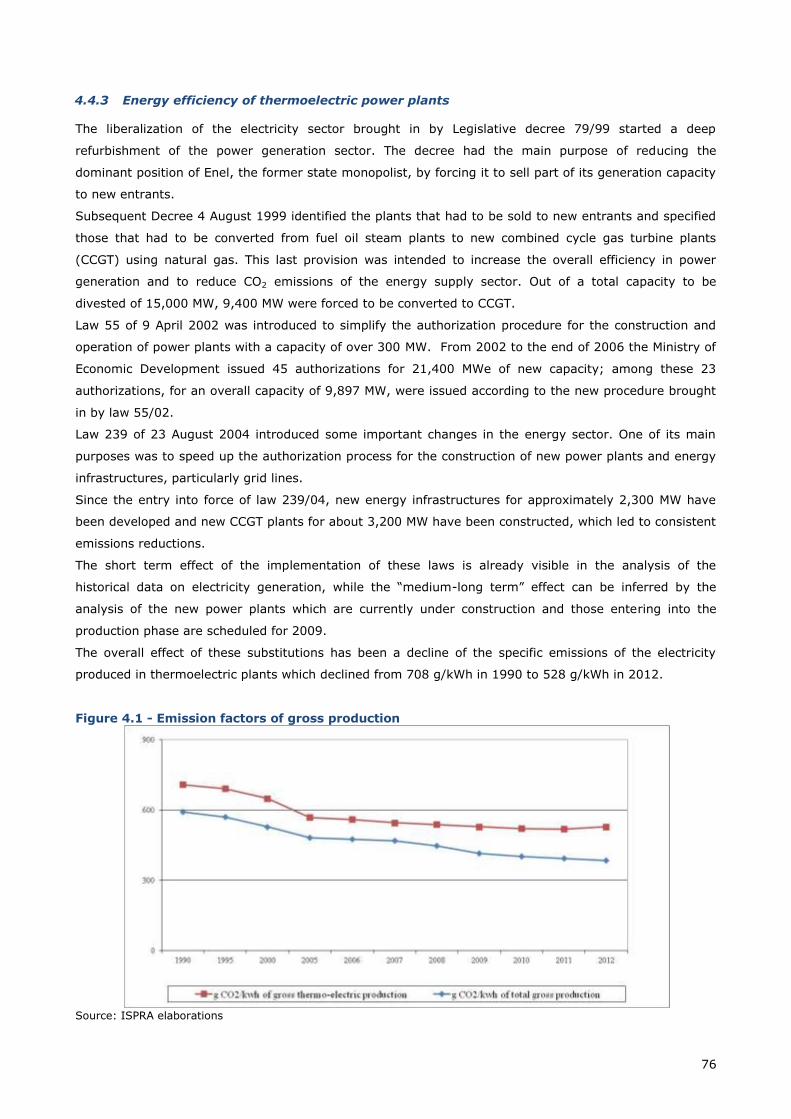
76
4.4.3 Energy efficiency of thermoelectric power plants
The liberalization of the electricity sector brought in by Legislative decree 79/99 started a deep
refurbishment of the power generation sector. The decree had the main purpose of reducing the
dominant position of Enel, the former state monopolist, by forcing it to sell part of its generation capacity
to new entrants.
Subsequent Decree 4 August 1999 identified the plants that had to be sold to new entrants and specified
those that had to be converted from fuel oil steam plants to new combined cycle gas turbine plants
(CCGT) using natural gas. This last provision was intended to increase the overall efficiency in power
generation and to reduce CO2 emissions of the energy supply sector. Out of a total capacity to be
divested of 15,000 MW, 9,400 MW were forced to be converted to CCGT.
Law 55 of 9 April 2002 was introduced to simplify the authorization procedure for the construction and
operation of power plants with a capacity of over 300 MW. From 2002 to the end of 2006 the Ministry of
Economic Development issued 45 authorizations for 21,400 MWe of new capacity; among these 23
authorizations, for an overall capacity of 9,897 MW, were issued according to the new procedure brought
in by law 55/02.
Law 239 of 23 August 2004 introduced some important changes in the energy sector. One of its main
purposes was to speed up the authorization process for the construction of new power plants and energy
infrastructures, particularly grid lines.
Since the entry into force of law 239/04, new energy infrastructures for approximately 2,300 MW have
been developed and new CCGT plants for about 3,200 MW have been constructed, which led to consistent
emissions reductions.
The short term effect of the implementation of these laws is already visible in the analysis of the
historical data on electricity generation, while the “medium-long term” effect can be inferred by the
analysis of the new power plants which are currently under construction and those entering into the
production phase are scheduled for 2009.
The overall effect of these substitutions has been a decline of the specific emissions of the electricity
produced in thermoelectric plants which declined from 708 g/kWh in 1990 to 528 g/kWh in 2012.
Figure 4.1 - Emission factors of gross production
Source: ISPRA elaborations
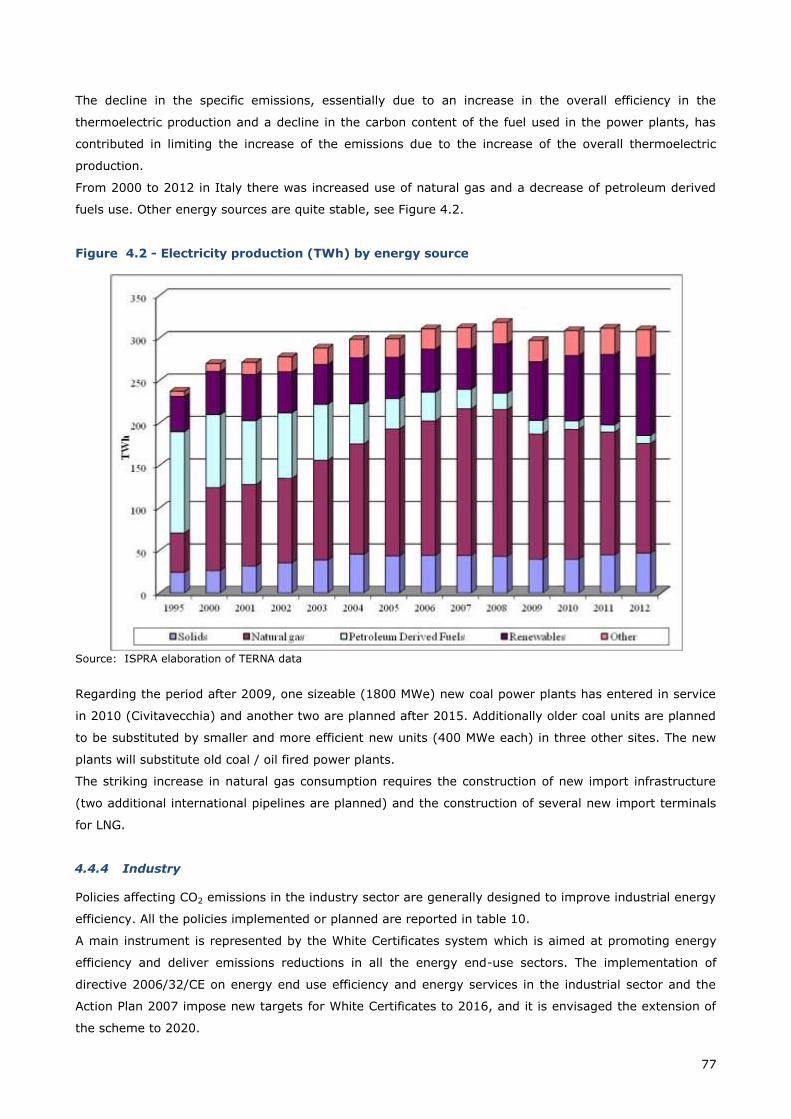
77
The decline in the specific emissions, essentially due to an increase in the overall efficiency in the
thermoelectric production and a decline in the carbon content of the fuel used in the power plants, has
contributed in limiting the increase of the emissions due to the increase of the overall thermoelectric
production.
From 2000 to 2012 in Italy there was increased use of natural gas and a decrease of petroleum derived
fuels use. Other energy sources are quite stable, see Figure 4.2.
Figure 4.2 - Electricity production (TWh) by energy source
Source: ISPRA elaboration of TERNA data
Regarding the period after 2009, one sizeable (1800 MWe) new coal power plants has entered in service
in 2010 (Civitavecchia) and another two are planned after 2015. Additionally older coal units are planned
to be substituted by smaller and more efficient new units (400 MWe each) in three other sites. The new
plants will substitute old coal / oil fired power plants.
The striking increase in natural gas consumption requires the construction of new import infrastructure
(two additional international pipelines are planned) and the construction of several new import terminals
for LNG.
4.4.4 Industry
Policies affecting CO2 emissions in the industry sector are generally designed to improve industrial energy
efficiency. All the policies implemented or planned are reported in table 10.
A main instrument is represented by the White Certificates system which is aimed at promoting energy
efficiency and deliver emissions reductions in all the energy end-use sectors. The implementation of
directive 2006/32/CE on energy end use efficiency and energy services in the industrial sector and the
Action Plan 2007 impose new targets for White Certificates to 2016, and it is envisaged the extension of
the scheme to 2020.
78
As reported in the VNC another important initiative recently introduced by the Government concerns the
replacement of existing inefficient electric motors with high efficient ones. This is a measure that can help
to achieve substantial CO2 emissions reductions, but the engines with high purchase price and the lack of
information about their energy saving potential represents a main obstacle to their diffusion.
Since the potential for energy saving in the industry sector is still consistent, several new additional
measures are currently under discussion to try to exploit it.
Further extension of Action plan target to 2020 with White Certificate system have been considered as
planned measures.
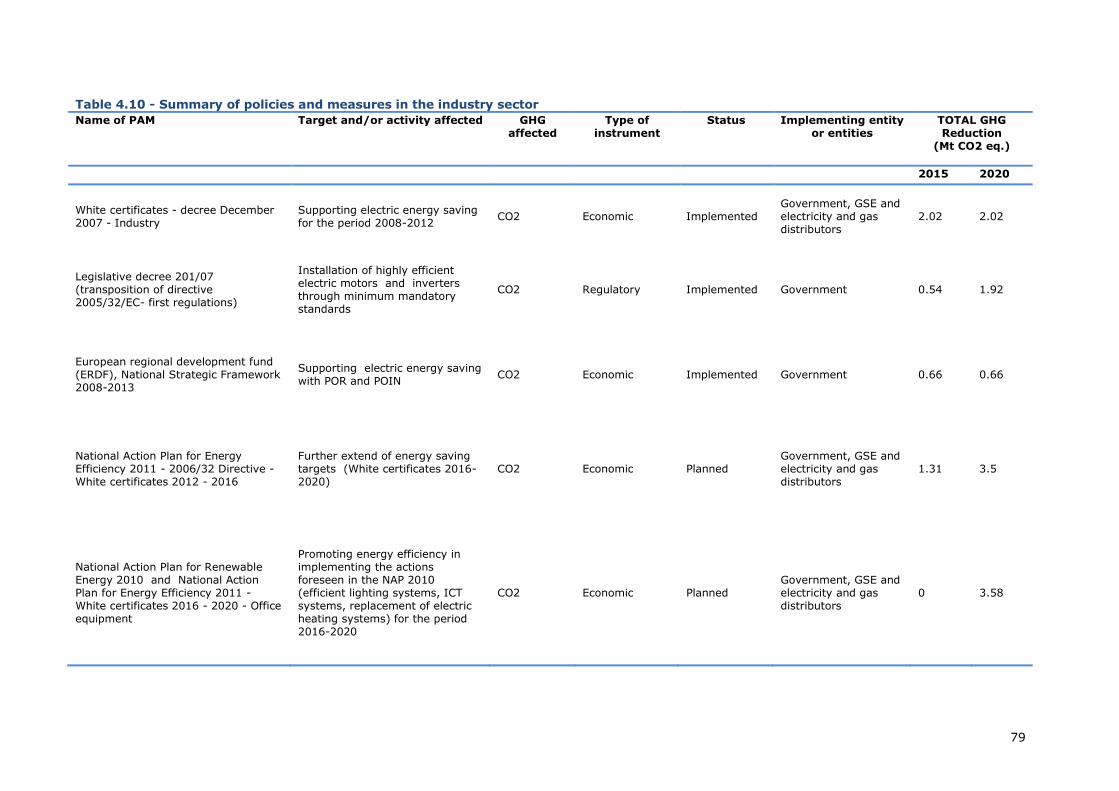
79
Table 4.10 - Summary of policies and measures in the industry sector
Name of PAM Target and/or activity affected GHG affected
Type of instrument
Status Implementing entity or entities
TOTAL GHG Reduction
(Mt CO2 eq.)
2015 2020
White certificates - decree December 2007 - Industry
Supporting electric energy saving for the period 2008-2012
CO2 Economic Implemented Government, GSE and electricity and gas distributors
2.02 2.02
Legislative decree 201/07 (transposition of directive 2005/32/EC- first regulations)
Installation of highly efficient electric motors and inverters through minimum mandatory standards
CO2 Regulatory Implemented Government 0.54 1.92
European regional development fund (ERDF), National Strategic Framework 2008-2013
Supporting electric energy saving with POR and POIN
CO2 Economic Implemented Government 0.66 0.66
National Action Plan for Energy Efficiency 2011 - 2006/32 Directive - White certificates 2012 - 2016
Further extend of energy saving targets (White certificates 2016-2020)
CO2 Economic Planned Government, GSE and electricity and gas distributors
1.31 3.5
National Action Plan for Renewable Energy 2010 and National Action Plan for Energy Efficiency 2011 - White certificates 2016 - 2020 - Office equipment
Promoting energy efficiency in implementing the actions foreseen in the NAP 2010 (efficient lighting systems, ICT systems, replacement of electric heating systems) for the period 2016-2020
CO2 Economic Planned Government, GSE and electricity and gas distributors
0 3.58
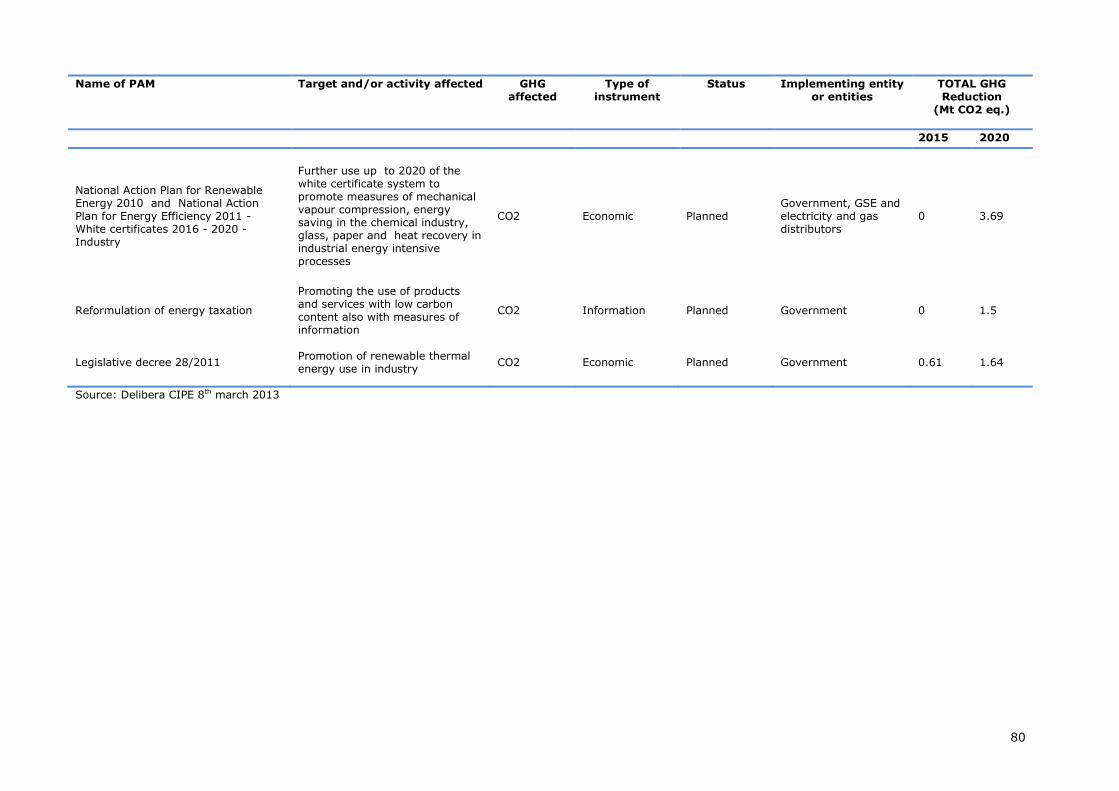
80
Name of PAM Target and/or activity affected GHG affected
Type of instrument
Status Implementing entity or entities
TOTAL GHG Reduction
(Mt CO2 eq.)
2015 2020
National Action Plan for Renewable Energy 2010 and National Action Plan for Energy Efficiency 2011 - White certificates 2016 - 2020 - Industry
Further use up to 2020 of the white certificate system to promote measures of mechanical vapour compression, energy saving in the chemical industry, glass, paper and heat recovery in industrial energy intensive processes
CO2 Economic Planned Government, GSE and electricity and gas distributors
0 3.69
Reformulation of energy taxation
Promoting the use of products and services with low carbon content also with measures of information
CO2 Information Planned Government 0 1.5
Legislative decree 28/2011 Promotion of renewable thermal energy use in industry
CO2 Economic Planned Government 0.61 1.64
Source: Delibera CIPE 8th march 2013
81
4.4.5 Civil (residential and tertiary)
The package of policies deployed in this sector aims at improving energy efficiency (for example by White
Certificates) through specific actions targeted both at existing and new buildings and appliances.
Improving the energy efficiency of buildings and reducing the related emissions has become a priority in
the last few years.
The implementation of directive 2002/91/CE was an opportunity to introduce stricter energy
requirements and to promote the diffusion of renewable energy sources in the building sector. The
Directive lays down requirements on the application of minimum standards for the energy performance of
new buildings and on the performance of large existing buildings undergoing major renovation. The
directive also requires the provision of energy performance certificates when buildings are constructed,
sold or rented out. The legislative decree 192/2005 transposed the directive into national law and has
required the adoption of further ministerial decrees to become fully implemented.
At the end of 2006, legislative decree 192/2005 was amended by legislative decree 311/2006 to
strengthen the buildings thermal demand requirements. The new law applies to new buildings and to
existing buildings subject to major renovation30 and provides for some important measures. Amongst the
main provisions, the following obligations are worth citing:
Installation of technical blinds for solar protection and insulation of new buildings and
buildings subject to overall renovation (limited to buildings over 1000 m2);
laying down of all the necessary works to allow the connection of new buildings (and
buildings subject to major renovation) to district heating systems, when existing (and not
further than 1 km) or planned;
installation of solar thermal systems that cover at least 50% of hot water demand for all new
buildings and in case of replacement or renovation of the existing heating system;
Installation of PV systems (with a power capacity to be defined in a subsequent ministerial
decree) in all new buildings and in existing buildings with a total floor area over 1000m2;
Dir. 2010/31/EC recasts the European Energy Performance of Buildings Directive (EPBD) (transposed into
national law with the decree 63/2013). This measure defines mandatory standards for new buildings with
net zero energy. The transposition of this directive will raise the requirement on new buildings and in the
same time will be important to strengthen the control system, making it consistent in all regions.
There are also minimal efficiency requirements on new domestic appliances (TV, refrigerator, lamps,
etc.), with a gradual introduction between 2009 and 2015. Those standards take into account the
European regulations 644/2009, 278/2009 242/2009 243/2009 and 1275/2008 and are put into practice
by the Legislative decree 201/2007 (directive 2006/32/CE). The Decree 21 December 2007 included
energy efficiency in the civil sector to comply the White Certificate system target to 2012.
Consistent reductions are also expected from the introduction of other regulations for energy efficiency
standards for new energy-consuming products introduced by law 201/2007 (transposition of directive
2005/32/CE).
As regards tax rebates system, it actually allows the recovery in 10 year time of up to 55%/65% of
capital expenses for high efficiency appliances or building shell improvements. It is extended and
30 As regards the minimum energy performance requirements of existing buildings subject to major renovation, the decree applies only in case of large buildings of over 1000 m2 and in case of expansion of existing buildings (over 20%). The decree applies only partially to existing buildings under the 1000m2 threshold.
82
modified on an annual basis with the annual state budget law. It will be important to extend, adjust and
improve this provision to increase its cost-benefit effectiveness and efficiency. Of the possible
improvements, the most significant concern: a differentiation between the percentage of deductible
expenditure and/or the duration of the refund, in proportion to the actual saving produced by the
intervention; the introduction of maximum specific cost parameters for each type of intervention, to
prevent part of the incentive being transferred to product prices; a tighter focus of the instrument on
improving the energy efficiency of existing buildings, by reviewing the current scope of eligible initiatives
in order to avoid overlaps with other, newly introduced, incentives having the same aim (Conto Termico).
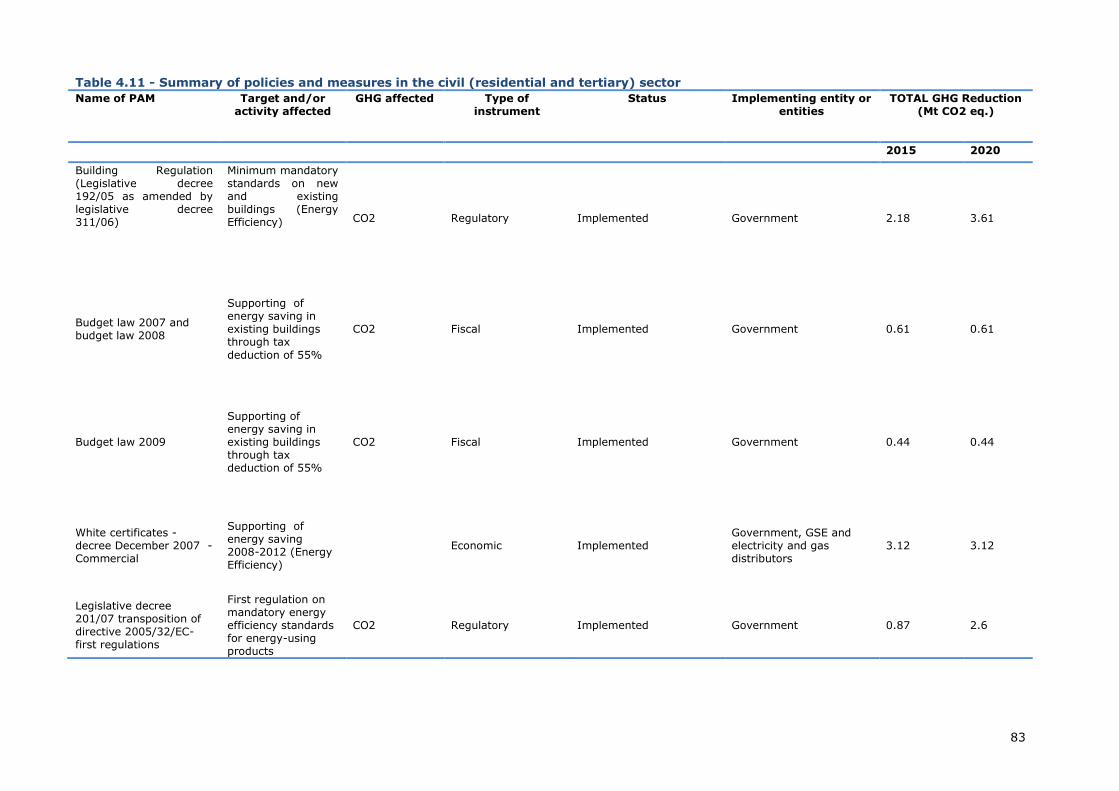
83
Table 4.11 - Summary of policies and measures in the civil (residential and tertiary) sector
Name of PAM Target and/or activity affected
GHG affected Type of instrument
Status Implementing entity or entities
TOTAL GHG Reduction (Mt CO2 eq.)
2015 2020
Building Regulation (Legislative decree 192/05 as amended by legislative decree 311/06)
Minimum mandatory standards on new and existing buildings (Energy Efficiency) CO2 Regulatory Implemented Government 2.18 3.61
Budget law 2007 and budget law 2008
Supporting of energy saving in existing buildings through tax
deduction of 55%
CO2 Fiscal Implemented Government 0.61 0.61
Budget law 2009
Supporting of energy saving in existing buildings through tax deduction of 55%
CO2 Fiscal Implemented Government 0.44 0.44
White certificates - decree December 2007 - Commercial
Supporting of energy saving 2008-2012 (Energy Efficiency)
Economic Implemented Government, GSE and electricity and gas distributors
3.12 3.12
Legislative decree 201/07 transposition of directive 2005/32/EC- first regulations
First regulation on mandatory energy efficiency standards for energy-using products
CO2 Regulatory Implemented Government 0.87 2.6
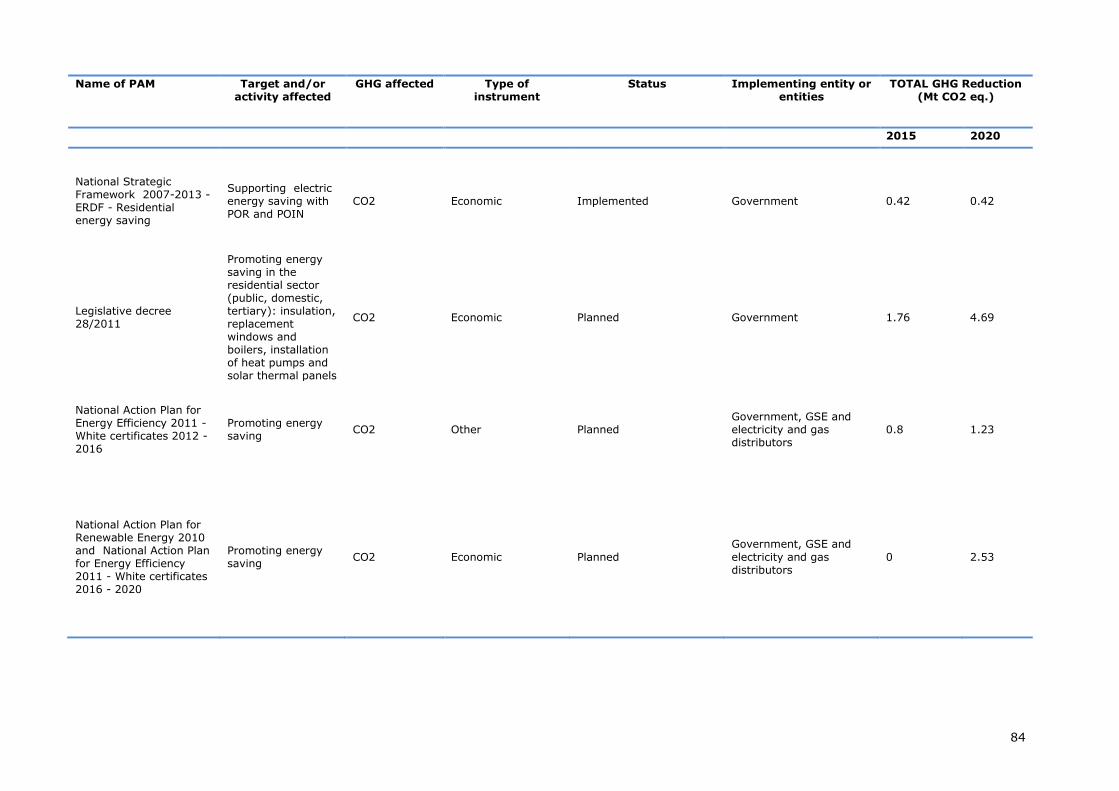
84
Name of PAM Target and/or activity affected
GHG affected Type of instrument
Status Implementing entity or entities
TOTAL GHG Reduction (Mt CO2 eq.)
2015 2020
National Strategic Framework 2007-2013 - ERDF - Residential energy saving
Supporting electric energy saving with POR and POIN
CO2 Economic Implemented Government 0.42 0.42
Legislative decree 28/2011
Promoting energy saving in the residential sector (public, domestic, tertiary): insulation, replacement windows and boilers, installation of heat pumps and solar thermal panels
CO2 Economic Planned Government 1.76 4.69
National Action Plan for Energy Efficiency 2011 - White certificates 2012 - 2016
Promoting energy saving
CO2 Other Planned Government, GSE and electricity and gas distributors
0.8 1.23
National Action Plan for Renewable Energy 2010 and National Action Plan for Energy Efficiency 2011 - White certificates 2016 - 2020
Promoting energy saving
CO2 Economic Planned
Government, GSE and
electricity and gas distributors
0 2.53
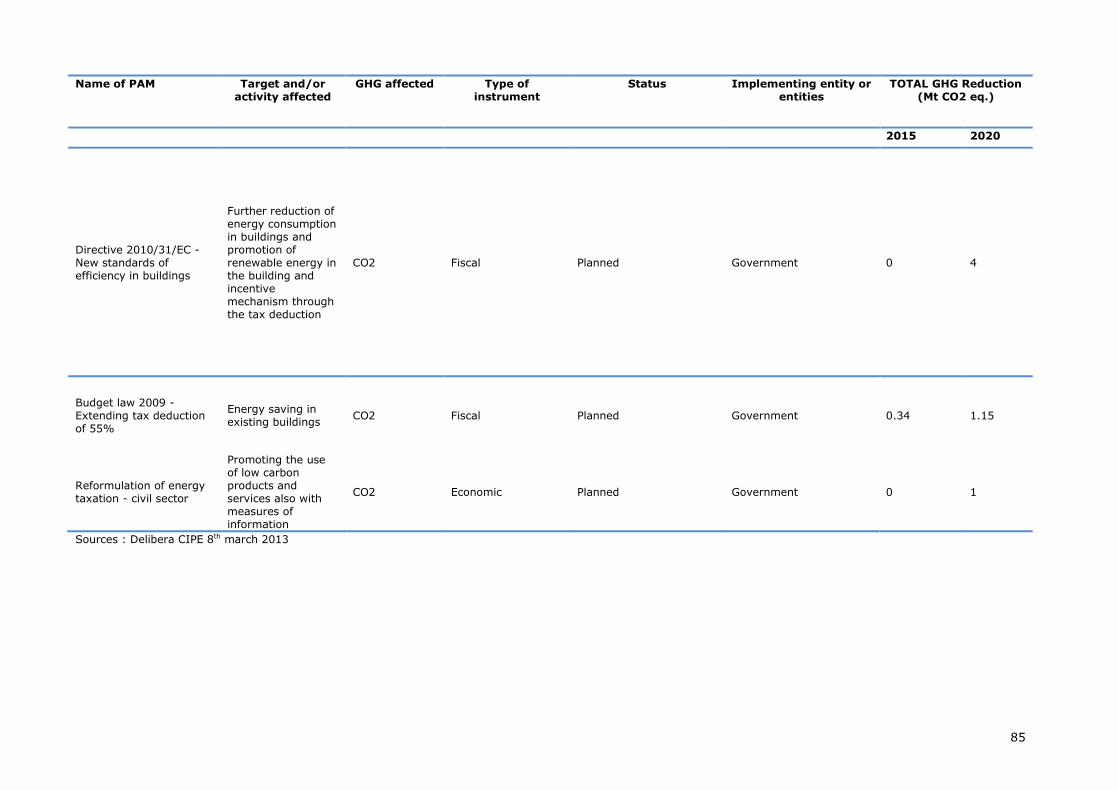
85
Name of PAM Target and/or activity affected
GHG affected Type of instrument
Status Implementing entity or entities
TOTAL GHG Reduction (Mt CO2 eq.)
2015 2020
Directive 2010/31/EC - New standards of efficiency in buildings
Further reduction of energy consumption in buildings and promotion of renewable energy in the building and incentive mechanism through the tax deduction
CO2 Fiscal Planned Government 0 4
Budget law 2009 - Extending tax deduction of 55%
Energy saving in existing buildings
CO2 Fiscal Planned Government 0.34 1.15
Reformulation of energy taxation - civil sector
Promoting the use of low carbon products and services also with measures of information
CO2 Economic Planned Government 0 1
Sources : Delibera CIPE 8th march 2013
86
4.4.6 Transport
The policies and measure considered in the transport sector are:
Infrastructural measures: high capacity and high speed networks and tuning of regional
networks for commuting and goods. Management measures regarding enhancement of road
urban public transport network.
Intermodal measures regarding shifting from private road traffic to public road traffic and shifting
goods transport from the road to the sea and management measures regarding supporting
efficiency in private road transport and improving road circulation in the urban areas.
Fleet update measures regarding further subsidy to change older cars with new ones with
average emissions of 120 CO2/km (130 gCO2/km engines efficiency plus -10 gCO2/km from
additional reduction tools);
Mandatory requirement of the Directive 2009/28/EC: 10% of use of biofuel for transport at 2020.
The Budget laws 2007, following the European directive CE30/2003 prescribes that the minimum quota of
bio fuel in 2009 is a 3% of total sold and 5.75% by 2010. Recently the second objective date has been
moved to 2013.
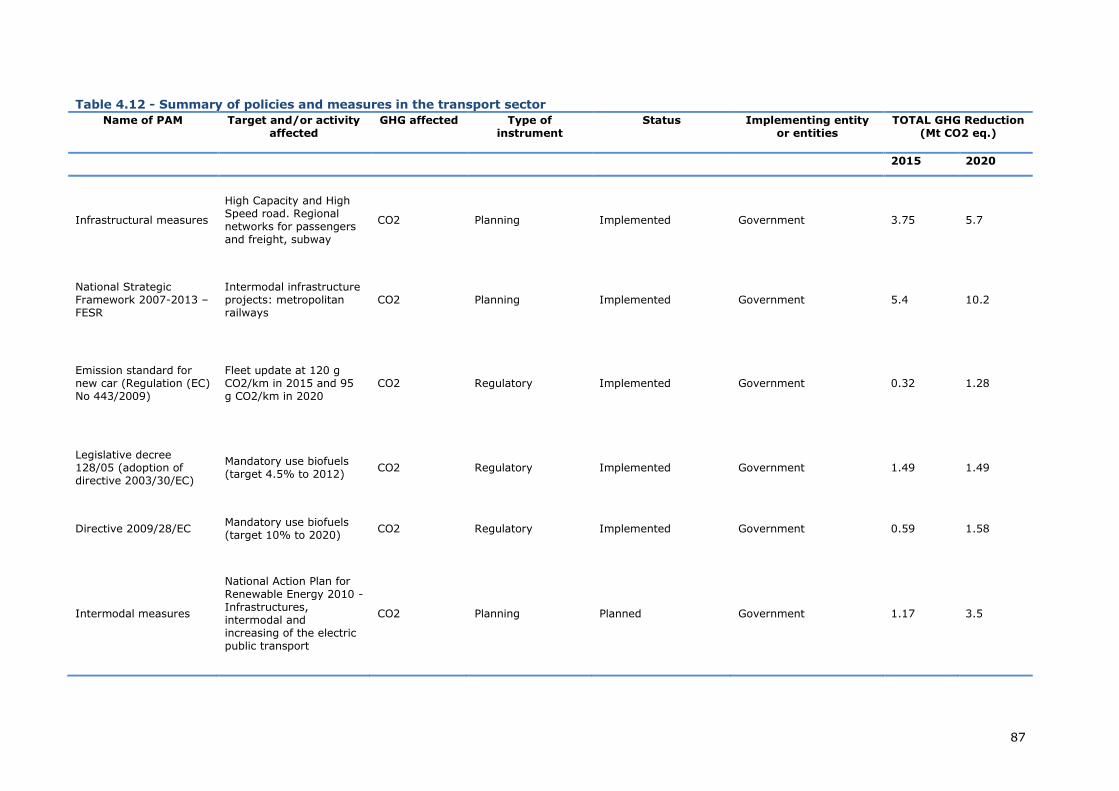
87
Table 4.12 - Summary of policies and measures in the transport sector
Name of PAM Target and/or activity affected
GHG affected Type of instrument
Status Implementing entity or entities
TOTAL GHG Reduction (Mt CO2 eq.)
2015 2020
Infrastructural measures
High Capacity and High Speed road. Regional networks for passengers and freight, subway
CO2 Planning Implemented Government 3.75 5.7
National Strategic Framework 2007-2013 – FESR
Intermodal infrastructure projects: metropolitan railways
CO2 Planning Implemented Government 5.4 10.2
Emission standard for new car (Regulation (EC) No 443/2009)
Fleet update at 120 g CO2/km in 2015 and 95 g CO2/km in 2020
CO2 Regulatory Implemented Government 0.32 1.28
Legislative decree 128/05 (adoption of directive 2003/30/EC)
Mandatory use biofuels (target 4.5% to 2012)
CO2 Regulatory Implemented Government 1.49 1.49
Directive 2009/28/EC Mandatory use biofuels (target 10% to 2020)
CO2 Regulatory Implemented Government 0.59 1.58
Intermodal measures
National Action Plan for Renewable Energy 2010 - Infrastructures, intermodal and increasing of the electric public transport
CO2 Planning Planned Government 1.17 3.5
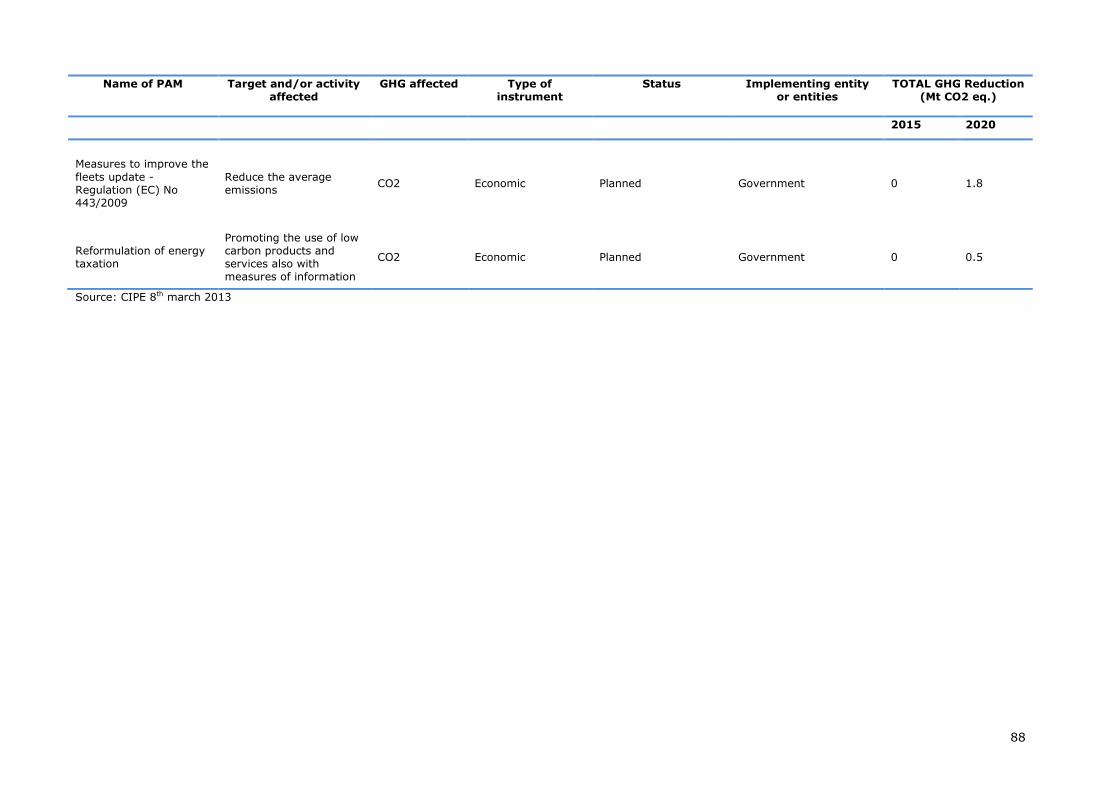
88
Name of PAM Target and/or activity affected
GHG affected Type of instrument
Status Implementing entity or entities
TOTAL GHG Reduction (Mt CO2 eq.)
2015 2020
Measures to improve the
fleets update - Regulation (EC) No 443/2009
Reduce the average emissions
CO2 Economic Planned Government 0 1.8
Reformulation of energy taxation
Promoting the use of low carbon products and services also with measures of information
CO2 Economic Planned Government 0 0.5
Source: CIPE 8th march 2013

89
4.5 No energy sectors
4.5.1 Industrial Processes
For the industrial processes sector has been taken into account the reduction of N2O emissions in plants
for the production of nitric acid. This measure can result in significant reductions in process emissions
from the industrial sector, with a relatively small cost.
In the production of nitric acid, the most advanced technology is provided by SCR (Selective Catalytic
Reduction) systems for the treatment of process gases, which has been installed by the main production
plants in Italy. This activity has been included in the emission trading scheme starting from 2012.
Therefore, this measure has been included in the WEM scenario.
Table 4.13 – Summary of policies and measures in the industrial processes sector
Name of
PAM
Target and/or activity
affected
GHG
affected
Type of
instrument
Status
Implementing
entity or entities
TOTAL GHG
Reduction (Mt CO2 eq.)
2015 2020
Nitric acid Reduction of N2O emissions in nitric acid production plants
N2O Voluntary/Economic
Implemented Industrial plant
0.74 0.74
Source: ISPRA
4.5.2 Agriculture
In the last years, the role of agriculture in climate change mitigation has been emphasised. In this
context, the reform of the Common Agricultural Policy (CAP) has a relevant contribution. In 2008 the CAP
has been reinforced by the Health Check, which strengthens the gradual shift from a financial support
linked to production towards decoupled direct aids, by the strengthening of rural development policy, and
by the increasing integration of environmental considerations, including climate change.
Therefore, the payments for farmers consider their respect of environmental laws and other types of
legislation. Thus, the incentives for intensive production have reduced. On the other hand main emission
reduction activities are predominantly or exclusively supported by two rural development measures: farm
modernisation (code 121) and agri-environment (code 214). Some activities support the modernisation of
farms through energy efficient equipment and buildings, and promoting biogas production31. This picture
has been also assessed by ISPRA in the 21 regional Rural Development Plans (RDPs), where measure
code 214 is most likely to contribute with N2O emission reductions. In 2008, a report32 prepared by the
Ministry of Agriculture (MIPAAF) in the framework of the Rural Development Network has assessed
qualitatively the contribution of Rural Development Plans (RDPs) in terms of the mitigation potential.
Moreover, in 2009, the CAP Health Check targets have been included in the RDPs33. In 2010, some
general information on the number of RDPs that have considered climate change targets (15 RDPs) or all
6 Health Check targets (3 RDPs), is available34.
31 European Commission (2009), Commission staff working document. The role of European agriculture in climate
change mitigation. SEC(2009) 1093 final (http://ec.europa.eu/agriculture/climate_change/sec2009_1093_en.pdf) 32 MIPAAF (2008), “Il contributo dei piani di sviluppo rurale e della condizionalità alla mitigazione dei cambiamenti
climatici e al loro adattamento. Rete Rurale Nazionale 2007-2013 Italia”, November 2008 33 See the publication “The Contribution of Rural Development Programmes in Mitigating Greenhouse Gas Emissions in
Italy” Climate Change and the Sustainable Use of Water Resources - Climate Change Management 2012, pp 367-387 34 MIPAAF (2010), “Le nuove sfide della PAC e le misure di rilancio dell’economia nei programmi di sviluppo rurale
2007-2013 – Aprile 2010. Rete Rurale Nazionale 2007-2013” (www.reterurale.it)
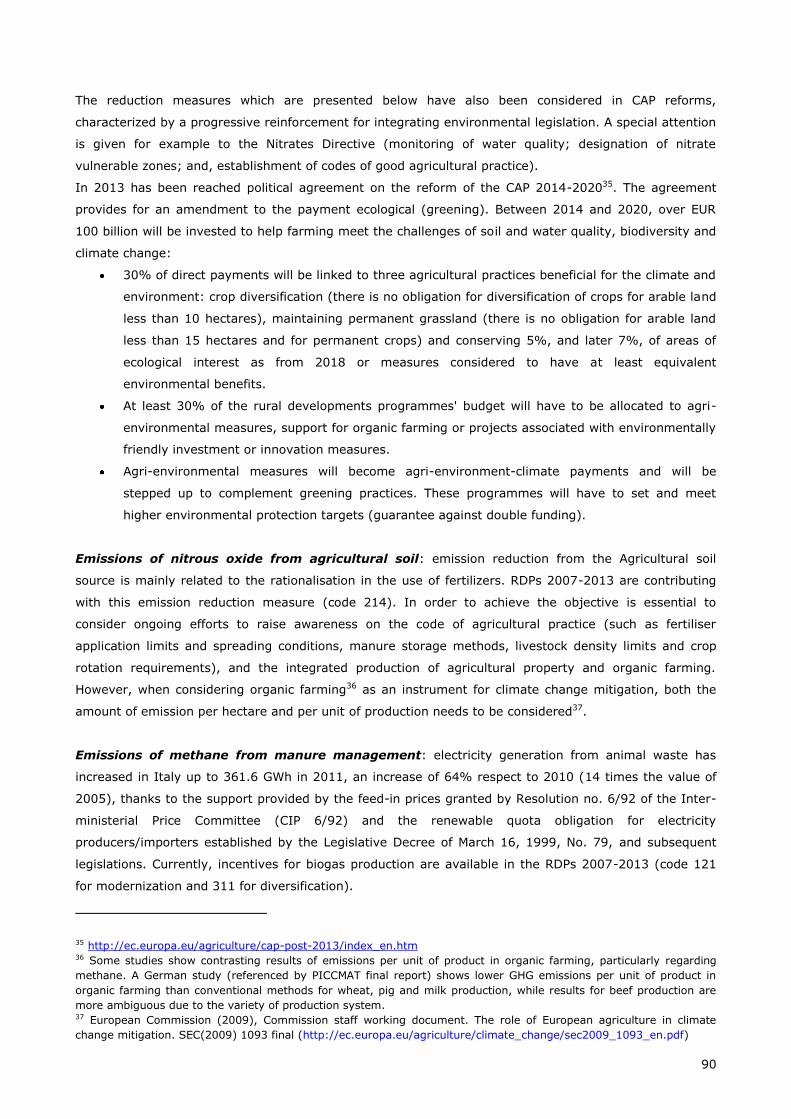
90
The reduction measures which are presented below have also been considered in CAP reforms,
characterized by a progressive reinforcement for integrating environmental legislation. A special attention
is given for example to the Nitrates Directive (monitoring of water quality; designation of nitrate
vulnerable zones; and, establishment of codes of good agricultural practice).
In 2013 has been reached political agreement on the reform of the CAP 2014-202035. The agreement
provides for an amendment to the payment ecological (greening). Between 2014 and 2020, over EUR
100 billion will be invested to help farming meet the challenges of soil and water quality, biodiversity and
climate change:
30% of direct payments will be linked to three agricultural practices beneficial for the climate and
environment: crop diversification (there is no obligation for diversification of crops for arable land
less than 10 hectares), maintaining permanent grassland (there is no obligation for arable land
less than 15 hectares and for permanent crops) and conserving 5%, and later 7%, of areas of
ecological interest as from 2018 or measures considered to have at least equivalent
environmental benefits.
At least 30% of the rural developments programmes' budget will have to be allocated to agri-
environmental measures, support for organic farming or projects associated with environmentally
friendly investment or innovation measures.
Agri-environmental measures will become agri-environment-climate payments and will be
stepped up to complement greening practices. These programmes will have to set and meet
higher environmental protection targets (guarantee against double funding).
Emissions of nitrous oxide from agricultural soil: emission reduction from the Agricultural soil
source is mainly related to the rationalisation in the use of fertilizers. RDPs 2007-2013 are contributing
with this emission reduction measure (code 214). In order to achieve the objective is essential to
consider ongoing efforts to raise awareness on the code of agricultural practice (such as fertiliser
application limits and spreading conditions, manure storage methods, livestock density limits and crop
rotation requirements), and the integrated production of agricultural property and organic farming.
However, when considering organic farming36 as an instrument for climate change mitigation, both the
amount of emission per hectare and per unit of production needs to be considered37.
Emissions of methane from manure management: electricity generation from animal waste has
increased in Italy up to 361.6 GWh in 2011, an increase of 64% respect to 2010 (14 times the value of
2005), thanks to the support provided by the feed-in prices granted by Resolution no. 6/92 of the Inter-
ministerial Price Committee (CIP 6/92) and the renewable quota obligation for electricity
producers/importers established by the Legislative Decree of March 16, 1999, No. 79, and subsequent
legislations. Currently, incentives for biogas production are available in the RDPs 2007-2013 (code 121
for modernization and 311 for diversification).
35 http://ec.europa.eu/agriculture/cap-post-2013/index_en.htm 36 Some studies show contrasting results of emissions per unit of product in organic farming, particularly regarding
methane. A German study (referenced by PICCMAT final report) shows lower GHG emissions per unit of product in
organic farming than conventional methods for wheat, pig and milk production, while results for beef production are
more ambiguous due to the variety of production system. 37 European Commission (2009), Commission staff working document. The role of European agriculture in climate
change mitigation. SEC(2009) 1093 final (http://ec.europa.eu/agriculture/climate_change/sec2009_1093_en.pdf)
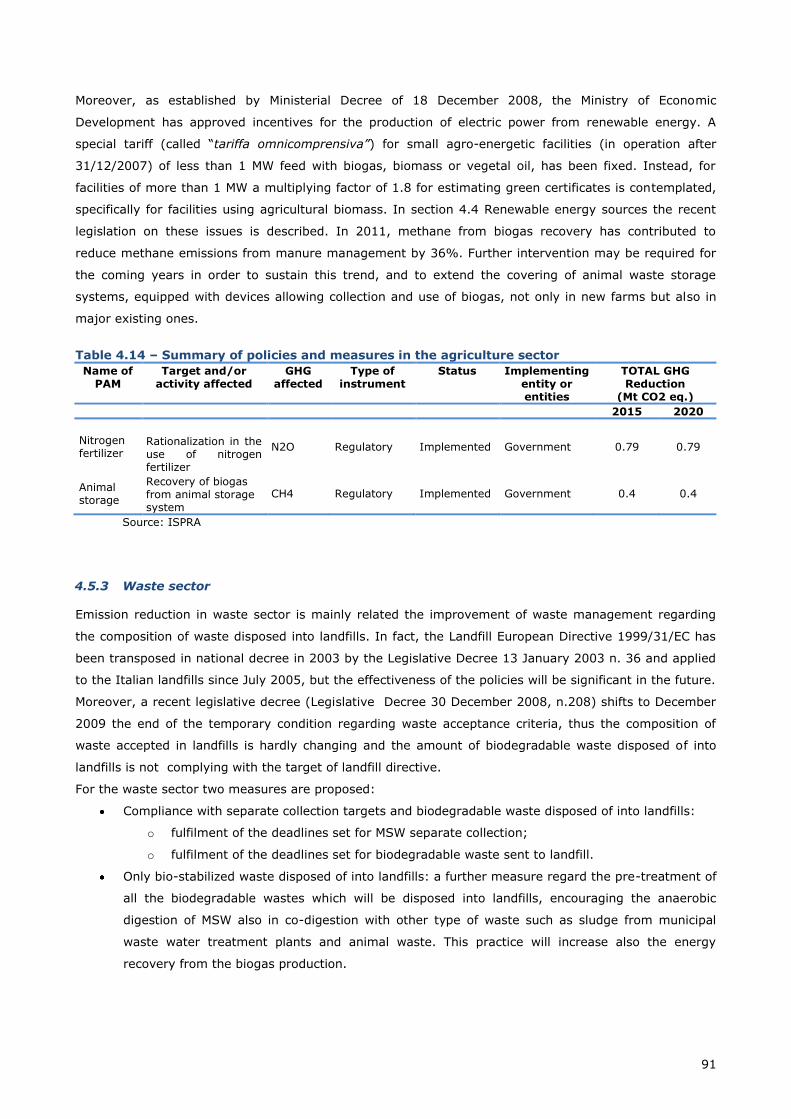
91
Moreover, as established by Ministerial Decree of 18 December 2008, the Ministry of Economic
Development has approved incentives for the production of electric power from renewable energy. A
special tariff (called “tariffa omnicomprensiva”) for small agro-energetic facilities (in operation after
31/12/2007) of less than 1 MW feed with biogas, biomass or vegetal oil, has been fixed. Instead, for
facilities of more than 1 MW a multiplying factor of 1.8 for estimating green certificates is contemplated,
specifically for facilities using agricultural biomass. In section 4.4 Renewable energy sources the recent
legislation on these issues is described. In 2011, methane from biogas recovery has contributed to
reduce methane emissions from manure management by 36%. Further intervention may be required for
the coming years in order to sustain this trend, and to extend the covering of animal waste storage
systems, equipped with devices allowing collection and use of biogas, not only in new farms but also in
major existing ones.
Table 4.14 – Summary of policies and measures in the agriculture sector
Name of PAM
Target and/or activity affected
GHG affected
Type of instrument
Status Implementing entity or entities
TOTAL GHG Reduction
(Mt CO2 eq.)
2015 2020
Nitrogen fertilizer
Rationalization in the use of nitrogen fertilizer
N2O Regulatory Implemented Government 0.79 0.79
Animal storage
Recovery of biogas from animal storage system
CH4 Regulatory Implemented Government 0.4 0.4
Source: ISPRA
4.5.3 Waste sector
Emission reduction in waste sector is mainly related the improvement of waste management regarding
the composition of waste disposed into landfills. In fact, the Landfill European Directive 1999/31/EC has
been transposed in national decree in 2003 by the Legislative Decree 13 January 2003 n. 36 and applied
to the Italian landfills since July 2005, but the effectiveness of the policies will be significant in the future.
Moreover, a recent legislative decree (Legislative Decree 30 December 2008, n.208) shifts to December
2009 the end of the temporary condition regarding waste acceptance criteria, thus the composition of
waste accepted in landfills is hardly changing and the amount of biodegradable waste disposed of into
landfills is not complying with the target of landfill directive.
For the waste sector two measures are proposed:
Compliance with separate collection targets and biodegradable waste disposed of into landfills:
o fulfilment of the deadlines set for MSW separate collection;
o fulfilment of the deadlines set for biodegradable waste sent to landfill.
Only bio-stabilized waste disposed of into landfills: a further measure regard the pre-treatment of
all the biodegradable wastes which will be disposed into landfills, encouraging the anaerobic
digestion of MSW also in co-digestion with other type of waste such as sludge from municipal
waste water treatment plants and animal waste. This practice will increase also the energy
recovery from the biogas production.
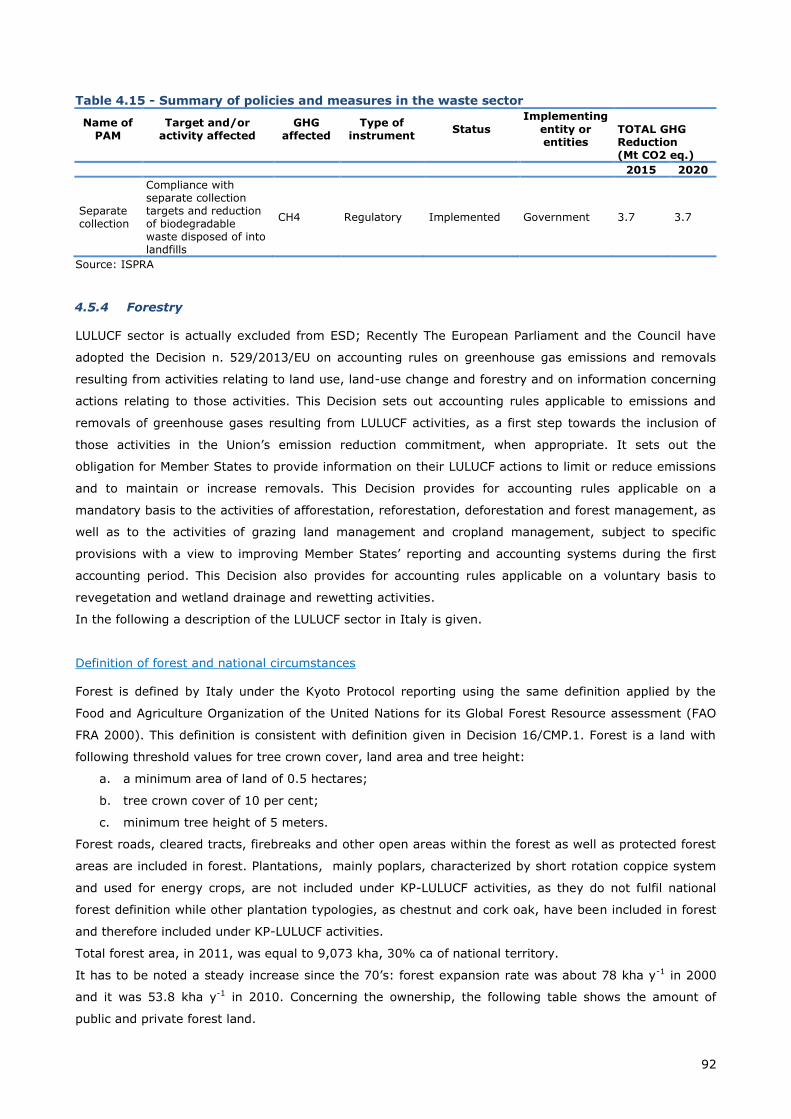
92
Table 4.15 - Summary of policies and measures in the waste sector
Name of PAM
Target and/or activity affected
GHG affected
Type of instrument
Status
Implementing
entity or entities
TOTAL GHG Reduction (Mt CO2 eq.)
2015 2020
Separate collection
Compliance with separate collection targets and reduction of biodegradable waste disposed of into landfills
CH4 Regulatory Implemented Government 3.7 3.7
Source: ISPRA
4.5.4 Forestry
LULUCF sector is actually excluded from ESD; Recently The European Parliament and the Council have
adopted the Decision n. 529/2013/EU on accounting rules on greenhouse gas emissions and removals
resulting from activities relating to land use, land-use change and forestry and on information concerning
actions relating to those activities. This Decision sets out accounting rules applicable to emissions and
removals of greenhouse gases resulting from LULUCF activities, as a first step towards the inclusion of
those activities in the Union’s emission reduction commitment, when appropriate. It sets out the
obligation for Member States to provide information on their LULUCF actions to limit or reduce emissions
and to maintain or increase removals. This Decision provides for accounting rules applicable on a
mandatory basis to the activities of afforestation, reforestation, deforestation and forest management, as
well as to the activities of grazing land management and cropland management, subject to specific
provisions with a view to improving Member States’ reporting and accounting systems during the first
accounting period. This Decision also provides for accounting rules applicable on a voluntary basis to
revegetation and wetland drainage and rewetting activities.
In the following a description of the LULUCF sector in Italy is given.
Definition of forest and national circumstances
Forest is defined by Italy under the Kyoto Protocol reporting using the same definition applied by the
Food and Agriculture Organization of the United Nations for its Global Forest Resource assessment (FAO
FRA 2000). This definition is consistent with definition given in Decision 16/CMP.1. Forest is a land with
following threshold values for tree crown cover, land area and tree height:
a. a minimum area of land of 0.5 hectares;
b. tree crown cover of 10 per cent;
c. minimum tree height of 5 meters.
Forest roads, cleared tracts, firebreaks and other open areas within the forest as well as protected forest
areas are included in forest. Plantations, mainly poplars, characterized by short rotation coppice system
and used for energy crops, are not included under KP-LULUCF activities, as they do not fulfil national
forest definition while other plantation typologies, as chestnut and cork oak, have been included in forest
and therefore included under KP-LULUCF activities.
Total forest area, in 2011, was equal to 9,073 kha, 30% ca of national territory.
It has to be noted a steady increase since the 70’s: forest expansion rate was about 78 kha y-1 in 2000
and it was 53.8 kha y-1 in 2010. Concerning the ownership, the following table shows the amount of
public and private forest land.
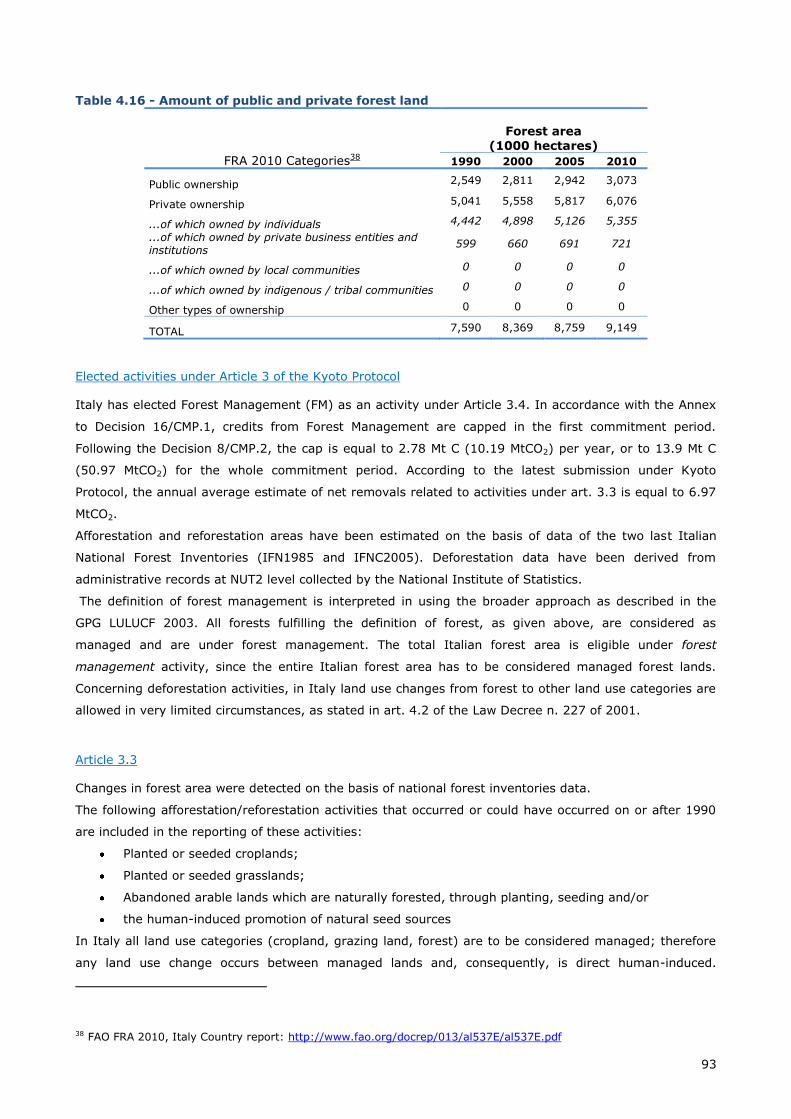
93
Table 4.16 - Amount of public and private forest land
FRA 2010 Categories38
Forest area (1000 hectares)
1990 2000 2005 2010
Public ownership 2,549 2,811 2,942 3,073
Private ownership 5,041 5,558 5,817 6,076
...of which owned by individuals 4,442 4,898 5,126 5,355
...of which owned by private business entities and institutions
599 660 691 721
...of which owned by local communities 0 0 0 0
...of which owned by indigenous / tribal communities 0 0 0 0
Other types of ownership 0 0 0 0
TOTAL 7,590 8,369 8,759 9,149
Elected activities under Article 3 of the Kyoto Protocol
Italy has elected Forest Management (FM) as an activity under Article 3.4. In accordance with the Annex
to Decision 16/CMP.1, credits from Forest Management are capped in the first commitment period.
Following the Decision 8/CMP.2, the cap is equal to 2.78 Mt C (10.19 MtCO2) per year, or to 13.9 Mt C
(50.97 MtCO2) for the whole commitment period. According to the latest submission under Kyoto
Protocol, the annual average estimate of net removals related to activities under art. 3.3 is equal to 6.97
MtCO2.
Afforestation and reforestation areas have been estimated on the basis of data of the two last Italian
National Forest Inventories (IFN1985 and IFNC2005). Deforestation data have been derived from
administrative records at NUT2 level collected by the National Institute of Statistics.
The definition of forest management is interpreted in using the broader approach as described in the
GPG LULUCF 2003. All forests fulfilling the definition of forest, as given above, are considered as
managed and are under forest management. The total Italian forest area is eligible under forest
management activity, since the entire Italian forest area has to be considered managed forest lands.
Concerning deforestation activities, in Italy land use changes from forest to other land use categories are
allowed in very limited circumstances, as stated in art. 4.2 of the Law Decree n. 227 of 2001.
Article 3.3
Changes in forest area were detected on the basis of national forest inventories data.
The following afforestation/reforestation activities that occurred or could have occurred on or after 1990
are included in the reporting of these activities:
Planted or seeded croplands;
Planted or seeded grasslands;
Abandoned arable lands which are naturally forested, through planting, seeding and/or
the human-induced promotion of natural seed sources
In Italy all land use categories (cropland, grazing land, forest) are to be considered managed; therefore
any land use change occurs between managed lands and, consequently, is direct human-induced.
38 FAO FRA 2010, Italy Country report: http://www.fao.org/docrep/013/al537E/al537E.pdf
94
Afforested/reforested areas are to be considered legally bound by national legislation. Extensive forest
disturbances have been rare in Italy, except for wildfires. Land-use changes after damage do not occur;
concerning wildfires, national legislation (Law n. 353 of 2000, art.10.1) doesn’t allow any land use
change after a fire event for 15 years. Harvesting is regulated through regional rules, which establish
procedures to follow in case of harvesting. Although different rules exist at regional level, a common
denominator is the requirement of an explicit written communication with the localization and the extent
of area to be harvested, existing forest typologies and forestry treatment. Concerning deforestation
activities, in Italy land use changes from forest to other land use categories (i.e. in construction of
railways the last years) are allowed in very limited circumstances, as stated in art. 4.2 of the Law Decree
n. 227 of 2001, and has to follow several administrative steps before being legally permitted. In addition,
clear-cutting is a not allowed practice (Law Decree n. 227 of 2001, art. 6.2).
Article 3.4
Forests in 1 January 1990 were under forest management, since Italy considers all forest land managed,
and, therefore, human-induced.
Italian forest resources are totally legally bound; the two main constraints, provided by the laws n. 3267
of 1923 and n. 431 of 1985, compel private and public owners to strictly respect limitations concerning
use of their forest resources. As a matter of fact, each exploitation of forest resources must not
compromise their perpetuation and therefore, any change of land use, for hydro-geological, landscape
and environmental protection in general (the same limitations apply also to burnt areas, following the law
n. 353 on forest fires approved in 2000). Consequently unplanned cuttings are always forbidden and local
prescriptions fix strict rules to be observed for forestry.
Methods for carbon stock change and GHG emission and removal estimates
The 2003 IPCC Good Practice Guidance for LULUCF has been entirely applied for all the LULUCF
categories as detailed data were available from national statistics and from researches at national and
regional level.
Methods for estimating carbon stock changes in forests (for Article 3.3 afforestation/reforestation and
Article 3.4 forest management) are the same as those used for the UNFCCC greenhouse gas inventory: a
growth model, For-est39
, is used to assess data concerning the growing stock and the related carbon,
estimating the evolution in time of the Italian forest carbon pools, according to the GPG classification and
definition: living biomass, both aboveground and belowground, dead organic matter, including dead wood
and litter, and soils as soil organic matter; it was conceived on an eco-physiological basis since it uses
growing stock as drive variable, growth relationships and measured forest parameters.
The model has been applied at regional scale (NUTS2); input data for the forest area, per region and
inventory typologies, were the First Italian National Forest Inventory (IFN1985) data and the Inventory of
Forests and Carbon pools (INFC2005). Following the main finding of 2011 UNFCCC review process, Italy
has decided not to account for the soil carbon stock changes from activities under Article 3.4, providing40
transparent and verifiable information to demonstrate that soils pool is not a source in Italy, as required
39 Federici S, Vitullo M, Tulipano S, De Lauretis R, Seufert G, 2008. An approach to estimate carbon stocks change in forest carbon pools under the UNFCCC: the Italian case. iForest 1: 86-95 URL: http://www.sisef.it/iforest/ 40 ISPRA, 2013. National Inventory Report 2013 – Italian greenhouse gas inventory 1990-2011. ISPRA
95
by par. 21 of the annex to decision 16/CMP.1. Concerning carbon stock changes resulting from
deforestation activities, due to a lack of detailed information on the land use of the deforested area, a
conservative approach was applied, assuming that the total deforested area is converted into
settlements. Carbon stock changes related to the forest land areas, before deforestation activities, have
been estimated, for each year and for each pool (living biomass, dead organic matter and soils), on the
basis of forest land carbon stocks deduced from the model For-est. In addition, it should be noted that
land use changes due to wildfires are not allowed by national legislation (Law Decree 21 November 2000,
n. 353, art.10, comma 1). The loss, in terms of carbon, due to deforested area is computed assuming
that the total amount of carbon, existing in the different pools before deforestation, is lost.
Carbon amount released by forest fires has been included in the overall assessment of carbon stocks
change. Not having data on the fraction of growing stock oxidised as consequence of fires, the most
conservative hypothesis has been adopted: all growing stock of burned forest areas has been assumed to
be completely oxidised and so released. The amount of burned growing stock has been calculated
multiplying average growing stock per hectare of forest typology for the assigned burned area. Assessed
value has been subtracted to total growing stock of respective typology.
National Registry for forest carbon sinks
Italy has decided to account for the emissions and removals under Article 3 paragraphs 3 and 4 at the
end of the commitment period. The National Registry for forest carbon sinks, instituted by a Ministerial
Decree on 1st April 2008, is part of National Greenhouse Gas Inventory System in Italy and includes
information on units of lands subject of activities under Article 3.3 and activities elected under Article 3.4
and related carbon stock changes. The National Registry for forest carbon sinks is aimed to estimate, in
accordance with the COP/MOP decisions, the IPCC Good Practice Guidance on LULUCF and every further
IPCC advise, the GHG emissions by sources and removal by sinks in forest land and related land-use
changes and to account the net emission in order to allow the Italian Registry to issue the relevant
amount of RMUs.
Activities planned in the framework of the registry for carbon sinks are still in progress, therefore
methodologies for area changes detection and the related uncertainties will be further developed. The
inventory of land use (IUTI) has been completed, resulting in land use classification, for all national
territory, for the years 1990, 2000 and 2008. A process of validation and verification of IUTI data, related
to 1990, 2000 and 2008, has been carried out, comparing IUTI with the official statistics. IUTI has been
planned to supply data with reference to 2012. For 2012, IUTI data will be carried out through a sample
of 301,300 points covering the entire country in the framework of the NFI. On the basis of the IUTI data
(for the period 1990-2008) and the results of the NFI (related to 2012), taking into account the
verification and validation activities, a time series, for the IPCC categories, will be elaborated, and used
for the next annual submission under UNFCCC.
4.6 Summary of policies and measures
A summary of implemented and planned measures are reported in table 4.17 and table 4.18 respectively.
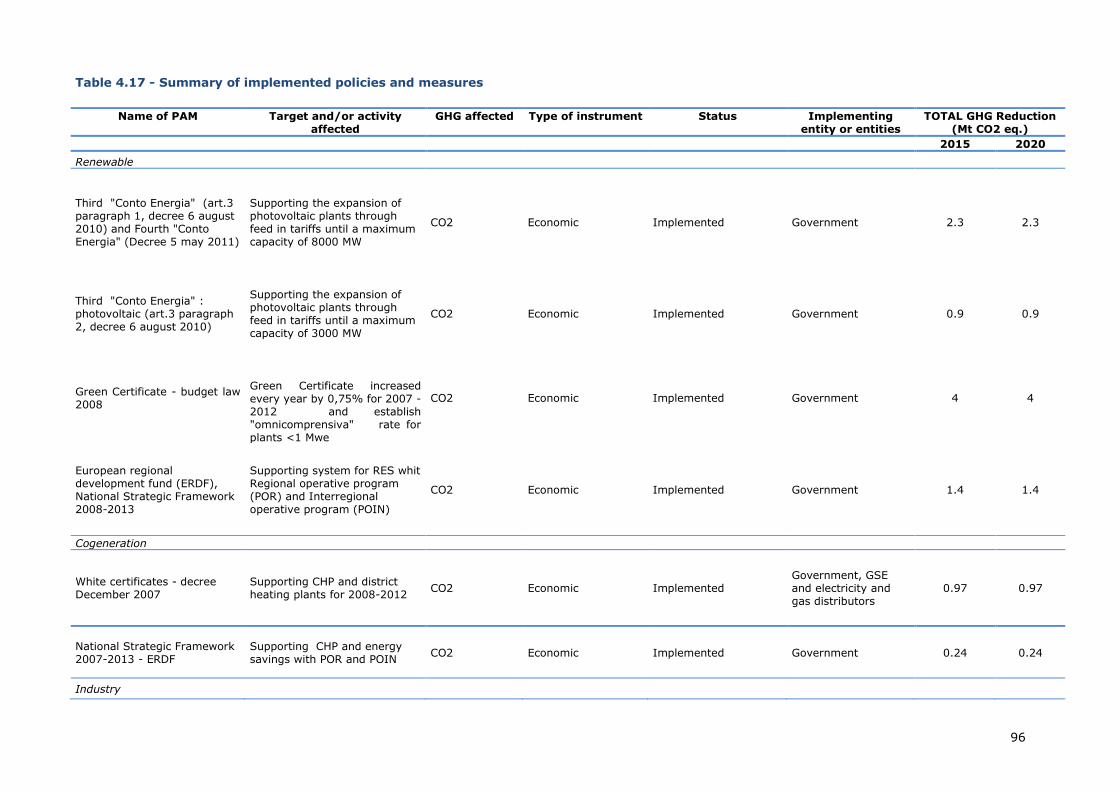
96
Table 4.17 - Summary of implemented policies and measures
Name of PAM Target and/or activity
affected GHG affected Type of instrument Status Implementing
entity or entities TOTAL GHG Reduction
(Mt CO2 eq.)
2015 2020
Renewable
Third "Conto Energia" (art.3 paragraph 1, decree 6 august 2010) and Fourth "Conto Energia" (Decree 5 may 2011)
Supporting the expansion of photovoltaic plants through feed in tariffs until a maximum capacity of 8000 MW
CO2 Economic Implemented Government 2.3 2.3
Third "Conto Energia" : photovoltaic (art.3 paragraph 2, decree 6 august 2010)
Supporting the expansion of photovoltaic plants through feed in tariffs until a maximum capacity of 3000 MW
CO2 Economic Implemented Government 0.9 0.9
Green Certificate - budget law 2008
Green Certificate increased every year by 0,75% for 2007 - 2012 and establish "omnicomprensiva" rate for plants <1 Mwe
CO2 Economic Implemented Government 4 4
European regional development fund (ERDF), National Strategic Framework 2008-2013
Supporting system for RES whit Regional operative program (POR) and Interregional operative program (POIN)
CO2 Economic Implemented Government 1.4 1.4
Cogeneration
White certificates - decree December 2007
Supporting CHP and district heating plants for 2008-2012
CO2 Economic Implemented Government, GSE and electricity and gas distributors
0.97 0.97
National Strategic Framework 2007-2013 - ERDF
Supporting CHP and energy savings with POR and POIN
CO2 Economic Implemented Government 0.24 0.24
Industry
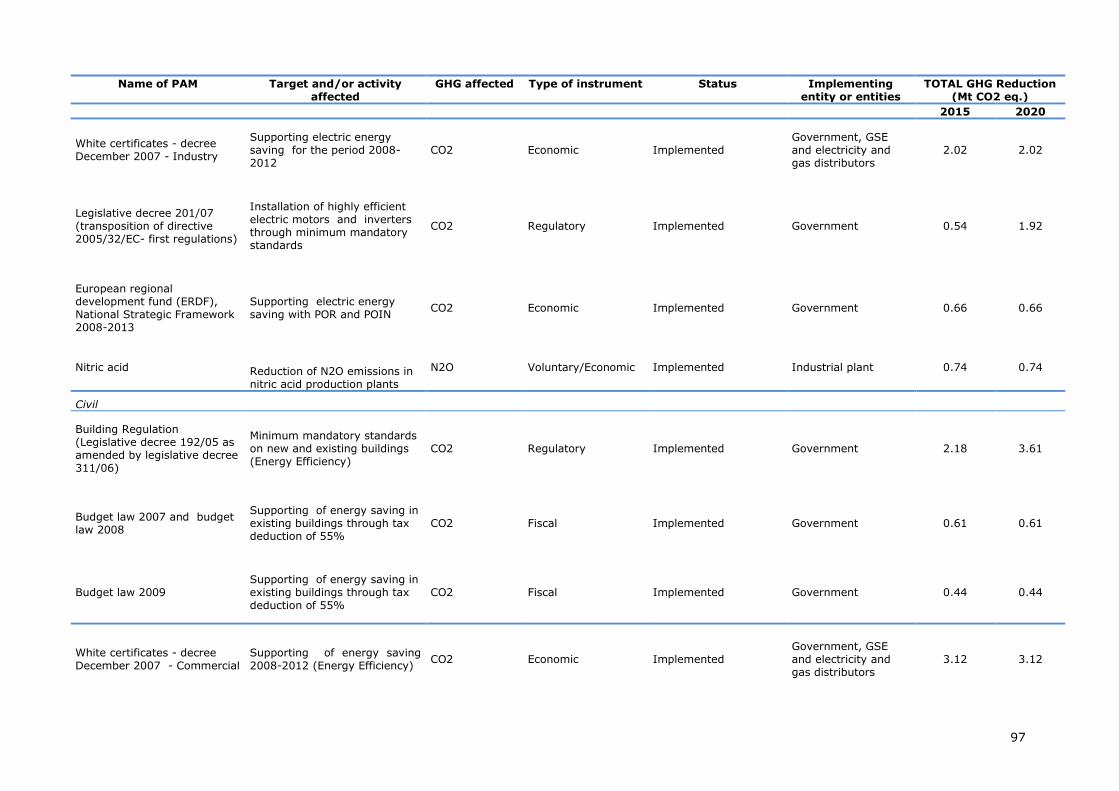
97
Name of PAM Target and/or activity affected
GHG affected Type of instrument Status Implementing entity or entities
TOTAL GHG Reduction (Mt CO2 eq.)
2015 2020
White certificates - decree December 2007 - Industry
Supporting electric energy saving for the period 2008-2012
CO2 Economic Implemented Government, GSE and electricity and gas distributors
2.02 2.02
Legislative decree 201/07 (transposition of directive 2005/32/EC- first regulations)
Installation of highly efficient electric motors and inverters through minimum mandatory standards
CO2 Regulatory Implemented Government 0.54 1.92
European regional development fund (ERDF), National Strategic Framework 2008-2013
Supporting electric energy saving with POR and POIN
CO2 Economic Implemented Government 0.66 0.66
Nitric acid Reduction of N2O emissions in nitric acid production plants
N2O Voluntary/Economic Implemented Industrial plant 0.74 0.74
Civil
Building Regulation (Legislative decree 192/05 as amended by legislative decree 311/06)
Minimum mandatory standards on new and existing buildings (Energy Efficiency)
CO2 Regulatory Implemented Government 2.18 3.61
Budget law 2007 and budget law 2008
Supporting of energy saving in existing buildings through tax deduction of 55%
CO2 Fiscal Implemented Government 0.61 0.61
Budget law 2009 Supporting of energy saving in existing buildings through tax deduction of 55%
CO2 Fiscal Implemented Government 0.44 0.44
White certificates - decree December 2007 - Commercial
Supporting of energy saving 2008-2012 (Energy Efficiency)
CO2 Economic Implemented Government, GSE and electricity and gas distributors
3.12 3.12
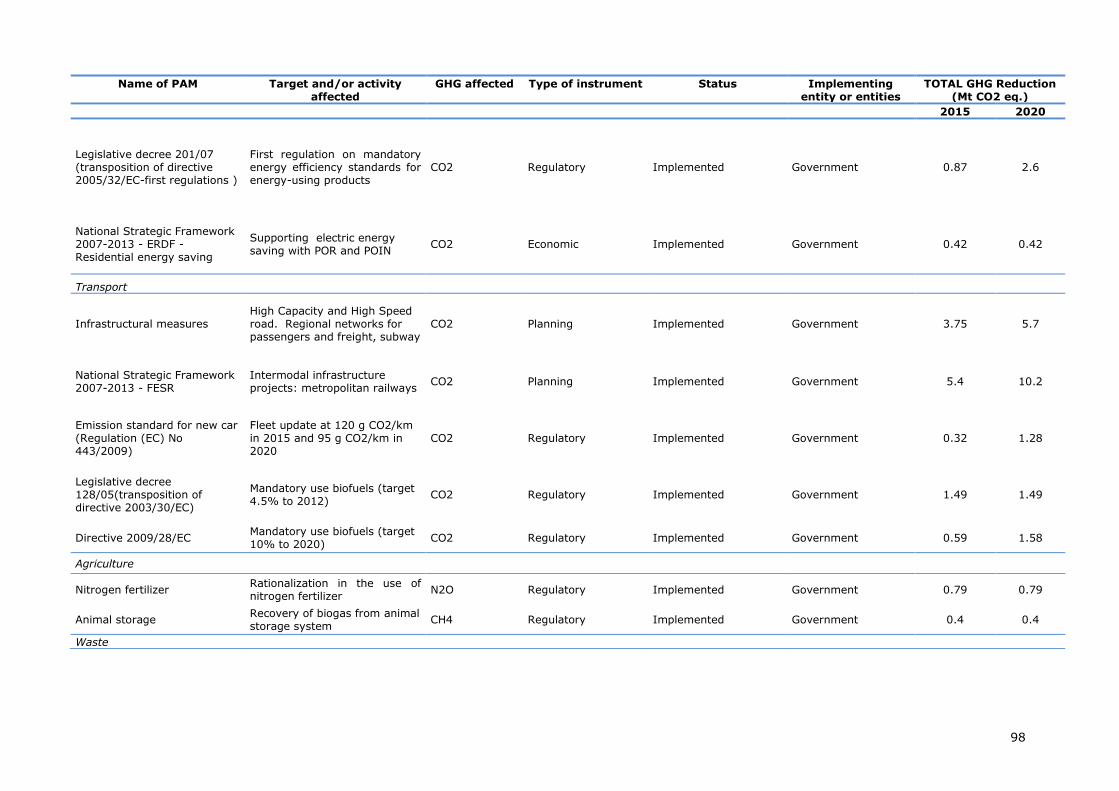
98
Name of PAM Target and/or activity affected
GHG affected Type of instrument Status Implementing entity or entities
TOTAL GHG Reduction (Mt CO2 eq.)
2015 2020
Legislative decree 201/07 (transposition of directive 2005/32/EC-first regulations )
First regulation on mandatory energy efficiency standards for energy-using products
CO2 Regulatory Implemented Government 0.87 2.6
National Strategic Framework 2007-2013 - ERDF - Residential energy saving
Supporting electric energy saving with POR and POIN
CO2 Economic Implemented Government 0.42 0.42
Transport
Infrastructural measures High Capacity and High Speed road. Regional networks for passengers and freight, subway
CO2 Planning Implemented Government 3.75 5.7
National Strategic Framework 2007-2013 - FESR
Intermodal infrastructure projects: metropolitan railways
CO2 Planning Implemented Government 5.4 10.2
Emission standard for new car (Regulation (EC) No 443/2009)
Fleet update at 120 g CO2/km in 2015 and 95 g CO2/km in 2020
CO2 Regulatory Implemented Government 0.32 1.28
Legislative decree 128/05(transposition of directive 2003/30/EC)
Mandatory use biofuels (target 4.5% to 2012)
CO2 Regulatory Implemented Government 1.49 1.49
Directive 2009/28/EC Mandatory use biofuels (target 10% to 2020)
CO2 Regulatory Implemented Government 0.59 1.58
Agriculture
Nitrogen fertilizer Rationalization in the use of nitrogen fertilizer
N2O Regulatory Implemented Government 0.79 0.79
Animal storage Recovery of biogas from animal storage system
CH4 Regulatory Implemented Government 0.4 0.4
Waste
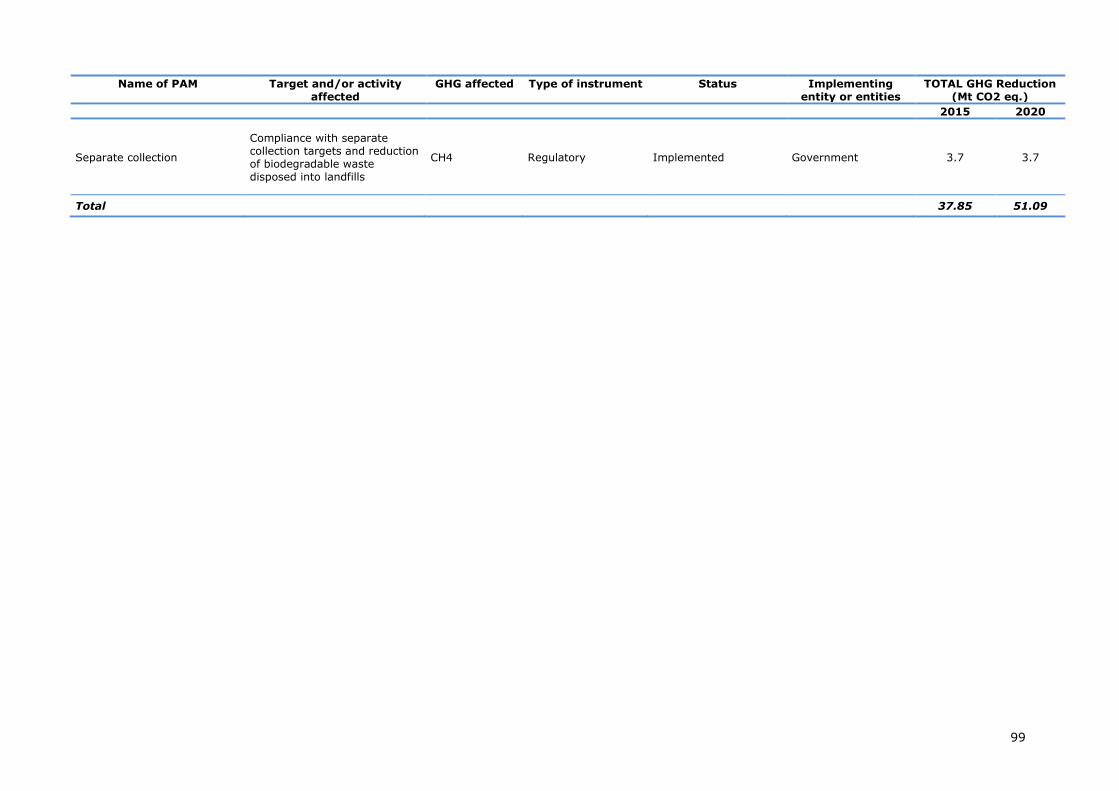
99
Name of PAM Target and/or activity affected
GHG affected Type of instrument Status Implementing entity or entities
TOTAL GHG Reduction (Mt CO2 eq.)
2015 2020
Separate collection
Compliance with separate collection targets and reduction of biodegradable waste disposed into landfills
CH4 Regulatory Implemented Government 3.7 3.7
Total
37.85 51.09
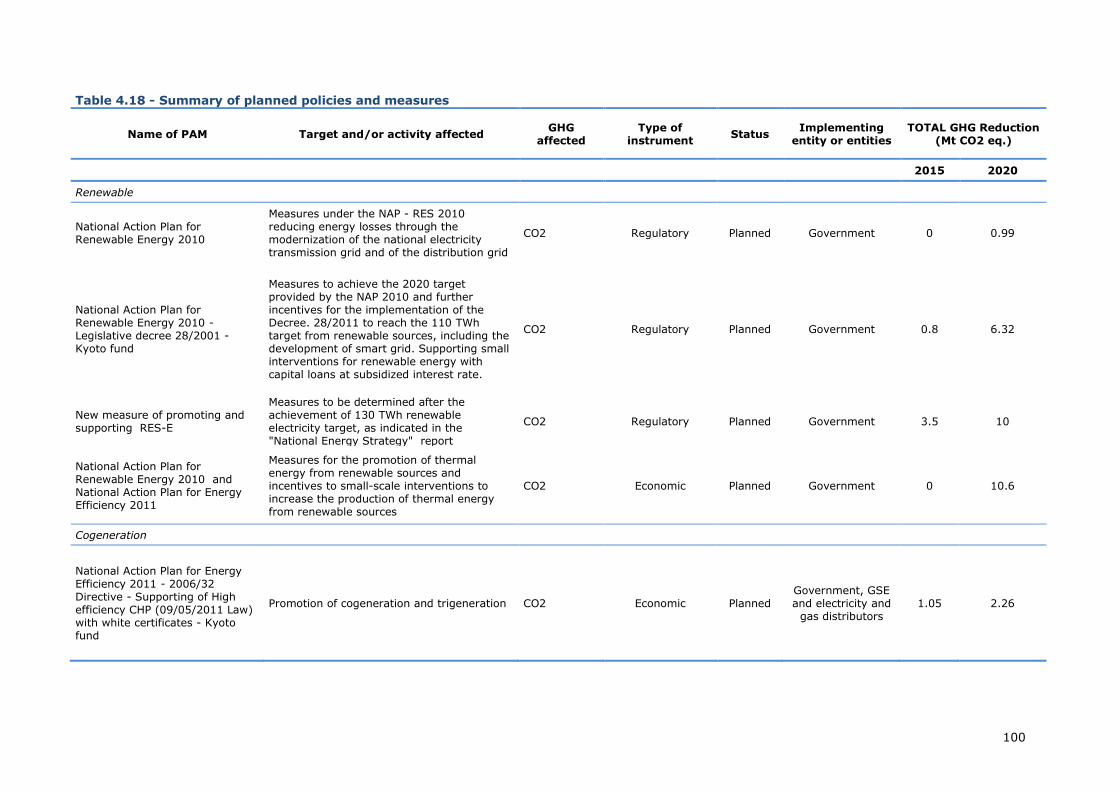
100
Table 4.18 - Summary of planned policies and measures
Name of PAM Target and/or activity affected GHG
affected Type of
instrument Status
Implementing entity or entities
TOTAL GHG Reduction (Mt CO2 eq.)
2015 2020
Renewable
National Action Plan for Renewable Energy 2010
Measures under the NAP - RES 2010 reducing energy losses through the modernization of the national electricity transmission grid and of the distribution grid
CO2 Regulatory Planned Government 0 0.99
National Action Plan for Renewable Energy 2010 - Legislative decree 28/2001 - Kyoto fund
Measures to achieve the 2020 target provided by the NAP 2010 and further incentives for the implementation of the Decree. 28/2011 to reach the 110 TWh target from renewable sources, including the development of smart grid. Supporting small interventions for renewable energy with capital loans at subsidized interest rate.
CO2 Regulatory Planned Government 0.8 6.32
New measure of promoting and supporting RES-E
Measures to be determined after the achievement of 130 TWh renewable electricity target, as indicated in the "National Energy Strategy" report
CO2 Regulatory Planned Government 3.5 10
National Action Plan for Renewable Energy 2010 and National Action Plan for Energy Efficiency 2011
Measures for the promotion of thermal energy from renewable sources and incentives to small-scale interventions to increase the production of thermal energy from renewable sources
CO2 Economic Planned Government 0 10.6
Cogeneration
National Action Plan for Energy Efficiency 2011 - 2006/32 Directive - Supporting of High efficiency CHP (09/05/2011 Law) with white certificates - Kyoto fund
Promotion of cogeneration and trigeneration CO2 Economic Planned Government, GSE and electricity and
gas distributors 1.05 2.26
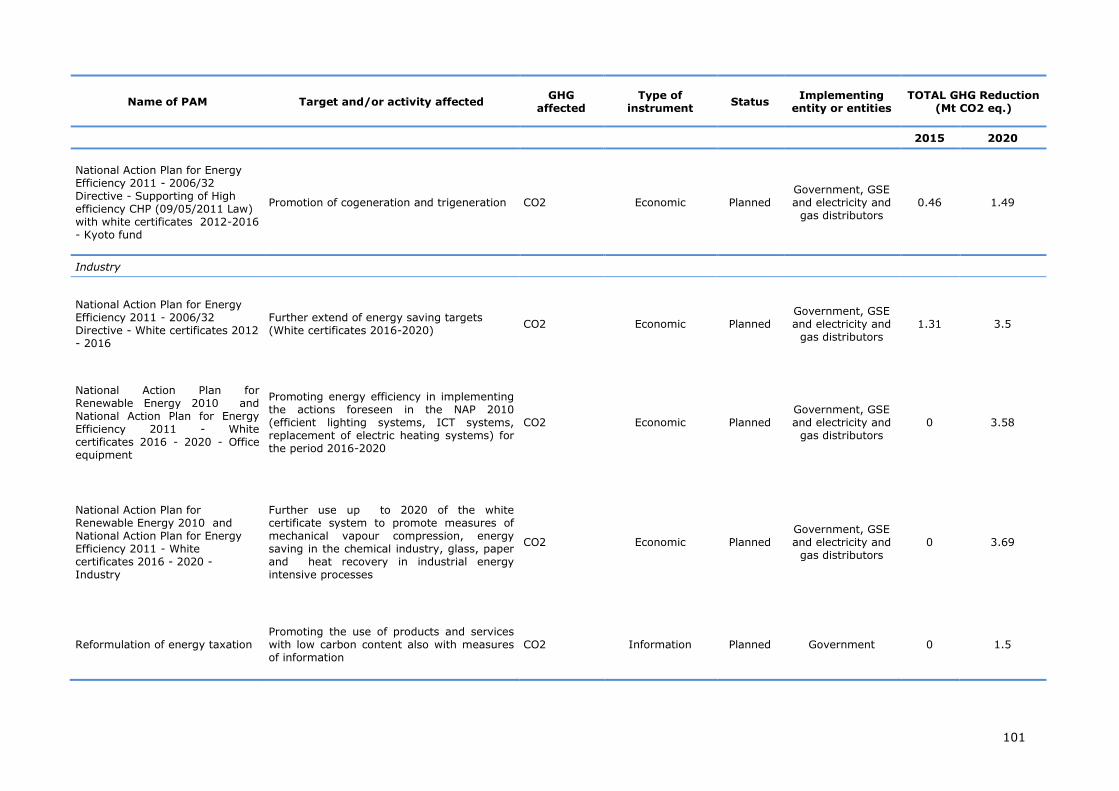
101
Name of PAM Target and/or activity affected GHG
affected Type of
instrument Status
Implementing entity or entities
TOTAL GHG Reduction (Mt CO2 eq.)
2015 2020
National Action Plan for Energy Efficiency 2011 - 2006/32 Directive - Supporting of High efficiency CHP (09/05/2011 Law) with white certificates 2012-2016 - Kyoto fund
Promotion of cogeneration and trigeneration CO2 Economic Planned Government, GSE and electricity and
gas distributors 0.46 1.49
Industry
National Action Plan for Energy Efficiency 2011 - 2006/32 Directive - White certificates 2012 - 2016
Further extend of energy saving targets (White certificates 2016-2020)
CO2 Economic Planned Government, GSE and electricity and
gas distributors 1.31 3.5
National Action Plan for Renewable Energy 2010 and National Action Plan for Energy Efficiency 2011 - White certificates 2016 - 2020 - Office equipment
Promoting energy efficiency in implementing the actions foreseen in the NAP 2010 (efficient lighting systems, ICT systems, replacement of electric heating systems) for the period 2016-2020
CO2 Economic Planned Government, GSE and electricity and
gas distributors 0 3.58
National Action Plan for Renewable Energy 2010 and National Action Plan for Energy Efficiency 2011 - White certificates 2016 - 2020 - Industry
Further use up to 2020 of the white certificate system to promote measures of mechanical vapour compression, energy saving in the chemical industry, glass, paper and heat recovery in industrial energy intensive processes
CO2 Economic Planned Government, GSE and electricity and
gas distributors 0 3.69
Reformulation of energy taxation Promoting the use of products and services with low carbon content also with measures of information
CO2 Information Planned Government 0 1.5
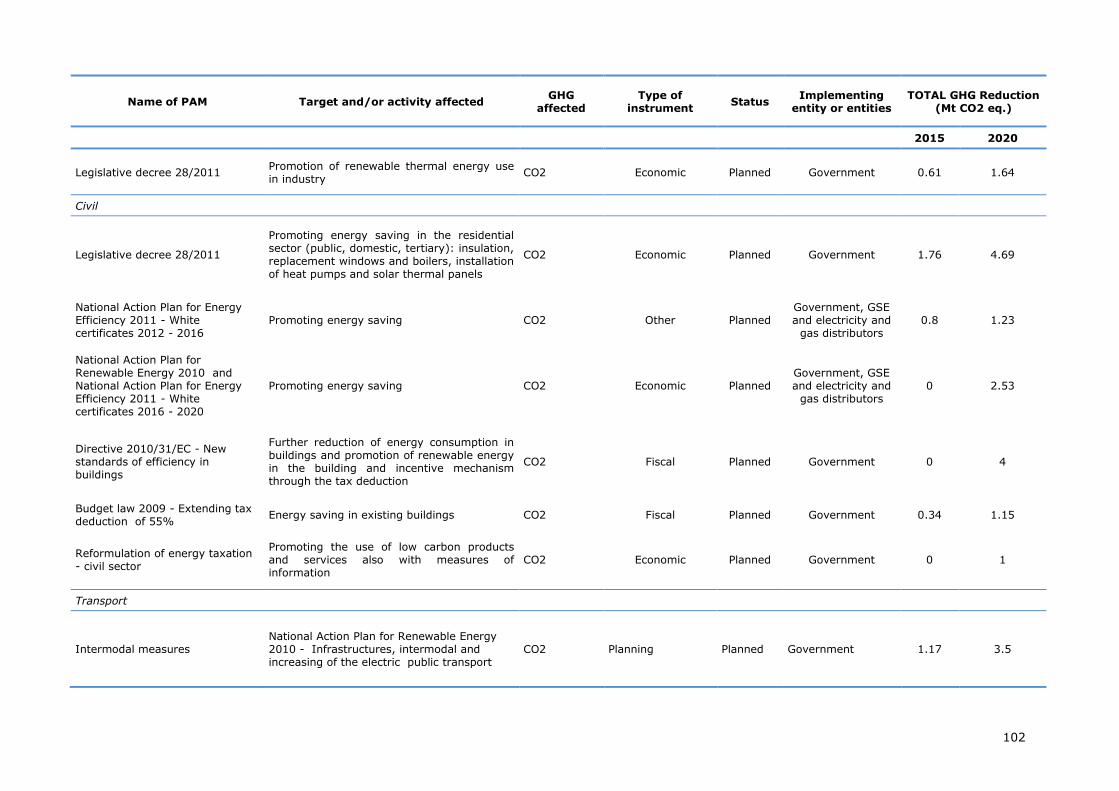
102
Name of PAM Target and/or activity affected GHG
affected Type of
instrument Status
Implementing entity or entities
TOTAL GHG Reduction (Mt CO2 eq.)
2015 2020
Legislative decree 28/2011 Promotion of renewable thermal energy use in industry
CO2 Economic Planned Government 0.61 1.64
Civil
Legislative decree 28/2011
Promoting energy saving in the residential sector (public, domestic, tertiary): insulation, replacement windows and boilers, installation of heat pumps and solar thermal panels
CO2 Economic Planned Government 1.76 4.69
National Action Plan for Energy Efficiency 2011 - White certificates 2012 - 2016
Promoting energy saving CO2 Other Planned Government, GSE and electricity and
gas distributors 0.8 1.23
National Action Plan for Renewable Energy 2010 and National Action Plan for Energy Efficiency 2011 - White certificates 2016 - 2020
Promoting energy saving CO2 Economic Planned Government, GSE and electricity and
gas distributors 0 2.53
Directive 2010/31/EC - New standards of efficiency in buildings
Further reduction of energy consumption in buildings and promotion of renewable energy in the building and incentive mechanism through the tax deduction
CO2 Fiscal Planned Government 0 4
Budget law 2009 - Extending tax deduction of 55%
Energy saving in existing buildings CO2 Fiscal Planned Government 0.34 1.15
Reformulation of energy taxation - civil sector
Promoting the use of low carbon products and services also with measures of information
CO2 Economic Planned Government 0 1
Transport
Intermodal measures National Action Plan for Renewable Energy 2010 - Infrastructures, intermodal and increasing of the electric public transport
CO2 Planning Planned Government 1.17 3.5
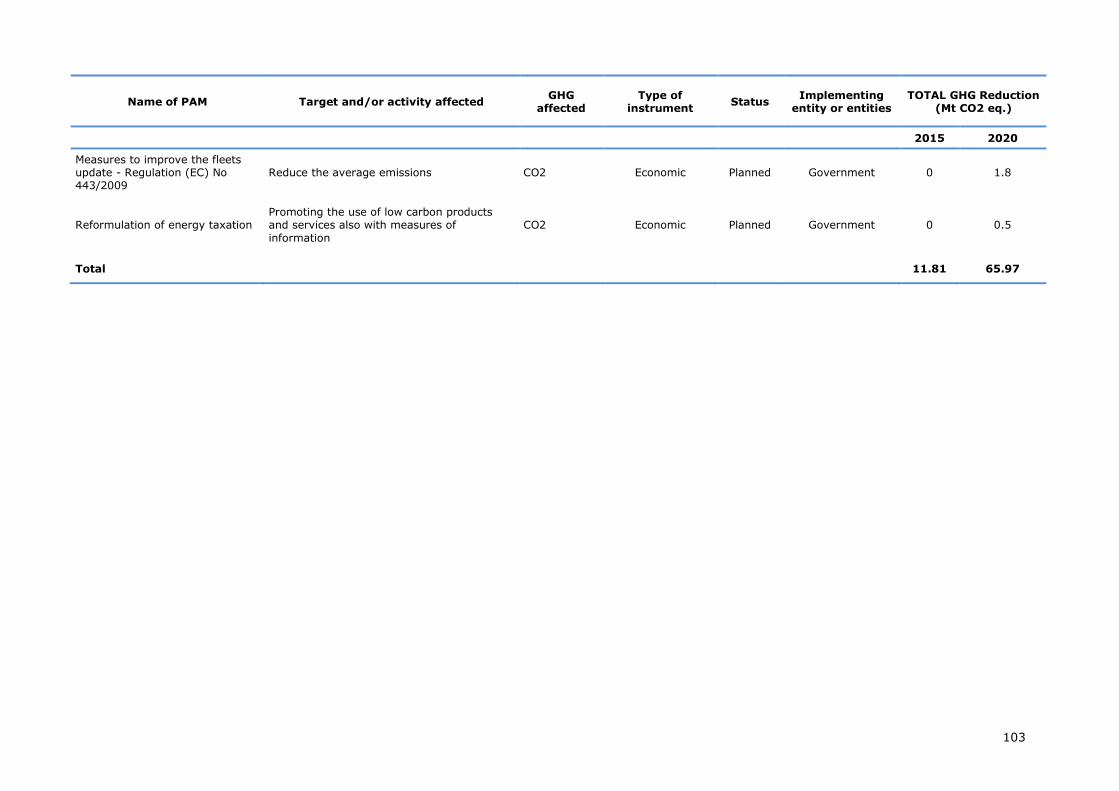
103
Name of PAM Target and/or activity affected GHG
affected Type of
instrument Status
Implementing entity or entities
TOTAL GHG Reduction (Mt CO2 eq.)
2015 2020
Measures to improve the fleets update - Regulation (EC) No 443/2009
Reduce the average emissions CO2 Economic Planned Government 0 1.8
Reformulation of energy taxation Promoting the use of low carbon products and services also with measures of
information
CO2 Economic Planned Government 0 0.5
Total
11.81 65.97
104
4.7 Costs analysis
An assessment of the costs of the implementation of the planned measures is available in the National
Energy Strategy and can be summarized as follows:
1. Energy efficiency
a. Tax deduction – 55% scheme : the cost for this deduction from 1.1 billion of euro
in the 2012 to 1.5 billion of euro in the 2020, stimulating private investment for about
20 billion;
b. Conto termico: The cost of Conto termico should be on about of 200 millions of
euro per year for the public administration sector. This amount should make able
investment on about 5 billions of euro starting from now up to 2020. In the Conto
termico also 700 millions of euro by year is dedicated for renewable thermal energy in
the private sector.
c. White certificates: The cost of this measure to € 1 billion per years for the whole
system at 2020 respect the € 400 million estimate in the 2012.
These measures could stimulate €50-€60 billion of aggregate investment in energy efficiency by
2020, with major spin-offs in an industrial sector where the aim is to achieve international
leadership, and savings of about €8 billion/year in fuel imports.
2. Renewable energy:
a. Electricity sector: to achieve the 2020 targets, around € 12.5 billion are being
made available each year (from the approximately € 9 billion already earmarked at the
end of 2011), over a 20-year period. The remaining resources will be allocated on the
basis of priority criteria that favour efficiency, technological innovation, lower
environmental impact and the national supply chain.
b. heating and cooling sector : the Conto Termico is being introduced to incentivise
small-scale projects, with up to approximately €1 billion/year being made available
c. transport sector : in view of the price differential for biofuels the impact by 2020
could amount to around €1billion/year.
These measures could stimulate €60-€70 billion of aggregate investment in renewable by 2020
4.8 Minimization of adverse effects in accordance with art.2 paragraph 3 of the Kyoto
Protocol
Each Annex I Party shall also provide information on how it strives to implement policies and
measures under Article 2 of the Kyoto Protocol in such a way to minimize adverse effects, including
adverse effects of climate change, effects on international trade, and social environmental and
economic impacts on other Parties under Article 4, paragraphs 8 and 9, of the Convention, taking into
account Article 3 of the Convention.
The Kyoto Protocol was adopted in pursuit of the ultimate objective of the Convention, and hence its
full implementation is intended to contribute to preventing dangerous anthropogenic interference with
the climate system. Ambitious mitigation goals are necessary to ascertain a future for all countries.
105
Adverse impacts on developing countries are reduced if global temperature increase is limited to 2
degrees Celsius, if dependence on fossil fuels decreases, and if Annex I Parties are able to develop
low-carbon energy systems and reduce fossil fuel consumption.
The European Community actively undertakes a large number of activities to have positive impacts on
third countries and their ability to tackle climate change, specifically capacity building and technology
transfer activities.
Climate policies in Italy are formulated and implemented in a way that minimise the potential adverse
impacts on specific sectors of economic activity, industrial sectors or other Parties to the Convention,
including the adverse effects on the international trade, social, environmental and economic impacts in
developing countries. As concerns domestic action, mitigation measures included in the national
climate change strategy do not focus exclusively on CO2 from fossil fuels, but cover all sectors of
economic activity which are related with GHG emissions or with carbon sinks.
Furthermore, Italy has ensured that the measures implemented in order to increase the differentiation
of energy sources do not contradict full liberalization of its energy markets. In particular, the
promotion of natural gas consumption improves the safety of energy supply of the country, while new
commercial relationships are developed with those countries from which natural gas is imported (e.g.
Russia, Algeria, etc.).
Other policies and measures might have potential positive impacts on third countries. However the
flexible mechanisms under the Kyoto Protocol are tools incorporated into the Protocol in order to share
efforts in reducing greenhouse gases, to ensure that investment is made where the money has
optimal greenhouse gas-reducing effects, thus ensuring minimal impact on the world economy, and to
enhance the development of new commercial relationships between developed and developing
countries. In such respect the use of CERs/ERUs by Italian operators and airlines operators under the
EU ETS in order to comply with their surrender obligations (see paragraph “The European Union
Emission Trading Scheme”) as well as by the Italian Government (see paragraph “The Kyoto
mechanisms: Joint Implementation and Clean Development Mechanism”) is a way to reduce potential
adverse effects.
At European level, changes to subsidies under the EC Common Agricultural Policy (CAP) now link
payments to environmental, food safety and animal welfare standards, not to agricultural production
volume. This encourages responsible agricultural practices. In addition, expectations are that the
worldwide use of biomass in the energy supply will increase considerably in the coming decades.
Countries and producers will see opportunities for new activities. But at the same time there is a
growing concern that this must not be at the expense of other important values for nature,
environment and society. To accommodate these feelings, criteria will be needed that indicate whether
biomass has been produced in a responsible manner.
Updated information on the minimization of adverse impacts in accordance with art.3 paragraph 14 of
the Kyoto Protocol is reported in the National Inventory Report transmitted to the UNFCCC in the
framework of the 2013 annual inventory submission.
4.9 Aviation and marine bunker fuels
According to Article 2 of the Kyoto Protocol, paragraph 2, on aviation and marine bunker fuels, each
Annex I Party shall identify the steps it has taken to promote and/or implement any decisions by the
106
International Civil Aviation Organisation (ICAO) and International Maritime Organisation (IMO) to limit
and reduce associated emissions.
As part of the European Union, Italy supported the European Commission's proposal to incorporate
aviation into the EU Emissions Trading System (ETS), which was approved in 2008 (Directive
2008/101/CE). In order to prevent negative effects on the EU's relationship with other countries, it
urged that implications in the area of international law, by ICAO, should be taken into account.
Directive 2008/101/CE sets a ceiling for CO2 allowances and establishes that a certain quantity of
allowances is allocated through auctioning. Furthermore airlines operators are allowed to buy
allowances from other sectors covered by EU ETS and to use JI or CDM credits to comply with their
surrender obligations.
As regards the maritime sector on 28 June 2013, the European Commission adopted a
Communication41 setting out a strategy for progressively including greenhouse gas emissions from
maritime transport in the EU's policy for reducing its overall emissions. The strategy consists of the
following consecutive steps:
Establishing a system for monitoring, reporting and verifying (MRV) of CO2 emissions;
Setting reduction targets for the maritime transport sector;
Applying further measures, including market-based instruments, in the medium to long term.
Relating to the first of these three steps, the Commission proposed a Regulation42 of the European
Parliament and of the Council establishing an EU-wide MRV system for large ships.
This proposal addresses ships above 5000 gross tons in respect of emissions released during their
voyages from the last port of call to a port under the jurisdiction of a Member State and from a port
under the jurisdiction of a Member State regardless of their flag. According to the proposed
Regulation, ship owners will have to monitor and report the verified amount of CO2 emitted by their
ships on voyages to, from and between EU ports, Owners will also have to provide certain other
information, such as data to determine the ships’ energy efficiency. It is proposed that the rules apply
from 1 January 2018. They are designed to support a staged approach towards setting global energy
efficiency standards for existing ships, as supported by several members of the International Maritime
Organisation.
With regard to economic effects on third countries, the impact assessment of this proposal concludes
that “based on the pass-through of costs and savings in maritime transport and on the price building
mechanisms in different sectors, measurable increases of commodity prices (with transport costs
being only an insignificant element of the commodities' prices) are expected to have minor effects43.
In the impact assessment, several policy options – from an MRV system to levies and to emission
trading schemes – were assessed.
Given the large cost-effective abatement potential of the sector, the above mentioned emission
reductions would lead to net cost savings for the maritime transport sector. Other expected impacts
41
Communication from the Commission to the European Parliament, the Council, the European Economic and
Social Committee and the Committee of the Regions: Integrating maritime transport emissions in the EU’s
greenhouse gas reduction policies. COM(2013) 479 final. 42 Proposal for a Regulation of the European Parliament and of the Council on the monitoring, reporting and
verification of carbon dioxide emissions from maritime transport and amending Regulation (EU) No 525/2013.
COM(2013) 480 final. 43 Impact Assessment – Part 1 Accompanying the document Proposal for a Regulation of the European Parliament
and of the Council on the monitoring, reporting and verification of carbon dioxide emissions from maritime
transport and amending Regulation (EU) No 525/2013. Commission staff working document SWD(2013) 237
final/2.

107
are the creation of additional jobs in ship yards and the maritime supply industry as well as health
benefits due to reduced emissions of SOX, NOX and particulate matter.
108
5 PROJECTIONS AND EFFECTS OF POLICIES AND MEASURES44
5.1 Introduction
The present chapter shows the scenarios of greenhouse gas (GHGs) emissions up to 2030. Projections
of future emissions are divided into two scenarios:
WM (with measures) national base scenario that includes all measures implemented or adopted
up to 2010;
WAM (with additional measures), that includes all planned measures.
2010 is the base year for the projections elaborated by the National Energy Strategy (Strategia
Energetica Nazionale, SEN). The projections of SEN scenario have been elaborated starting from 2011
followed by stakeholder participation and public consultation. The National Energy Strategy has been
approved in March 2013 by the Ministry of Economic Development and the Ministry of Environment.
The SEN scenario is a WAM scenario, as it includes the effects on emissions of a series of actions not
yet enforced to reach EU objectives and some other national objectives.
In this report it is not possible to examine a without measures scenario for many reasons. Most of
data are not available starting from 1990, moreover and more important many measures adopted in
the last years are structural and linked with many sectors so that is impossible to separate the effects
of past measures and upcoming measures. Fuel shift toward low carbon fuels for the electricity
generation is one of the most important dynamics that makes impossible to examine the effects
without measures on national emissions. Since 1990 there has been a steady increase of natural gas
share and a corresponding decrease of oil products share (see chapter 4, figure 4.2). Moreover a
relevant technological change in the electricity generation sector happened after 2000, when many
combined cycle plants, mainly fed with natural gas and synthesis gas by oil products gasification,
became operational.
However the emission projections of WM scenarios reported in the previous National Communications,
mainly the second and the third one, could supply esteems of emissions without the measures
implemented after 2000 (see par 5.12).
Concerning the measures considered in the WM scenario, the cross-cutting nature of EU Emissions
Trading System does not allow to easily consider such measure in the analysis by gas and by sector
provided from paragraph 5.2 to paragraph 5.7. However the effect of EU Emissions Trading Scheme
and its impact on the “with measures” scenario is treated in paragraph 5.8. Emissions from
international transport are reported separately in the paragraph 5.5, “Transport sector”. Information
on the expected use of the Kyoto Protocol mechanisms is also reported in the paragraph 5.9.
The emission scenario has been elaborated by a joint working group composed by members of
Ministry of Environment, Land and Sea, Ministry of Economic Development, ISPRA - Institute for
Environmental Protection and Research, ENEA - Italian National Agency for New Technologies, Energy
and the Sustainable Economic Development.
In particular ENEA has developed a set of different energy scenarios, to evaluate the effects of many
energy policies and GHG mitigation measures. Starting from analysis of ENEA the Ministry of Economic
Development together with the Ministry of environment adopted a single scenario which is the result
44 Lead author: Antonio Caputo (ISPRA). Contributing authors (ISPRA): Mario Contaldi (ISPRA), Riccardo De Lauretis (ISPRA), Eleonora Di Cristofaro (ISPRA), Barbara Gonella (ISPRA), Monica Pantaleoni (ISPRA), Emanuele Peschi (ISPRA), Daniela Romano (ISPRA), Ernesto Taurino (ISPRA), Marina Vitullo (ISPRA).
109
of the effects of a subset of policies and measures that were envisaged feasible in the timeframe up to
2020 and represented separately in various energy scenarios. The resulting scenario (SEN scenario) is
the one that better represents the implementation of all the feasible measure envisaged.
The emissions resulting from “SEN Scenario”, reported in this submission as “WAM scenario”, have
been calculated by ISPRA, in collaboration with the other institutions involved in the National Energy
Strategy, with a model based on the well known Markal software45. This working group also extended
the scenario up to 2030. The emission projections at sectoral level are elaborated by ISPRA and
IMELS.
The model is a partial equilibrium model and represents the domestic energy system and its main
emissions. It contains over 70 independent demands for energy services in four main sectors –
agriculture, industry, transport, commercial and household – split by sub-sectors, type of service and
material. Emissions of CO2 are directly accounted for in the model using IPCC “reference approach”
methodology and national Emission Factors.
The model follows a bottom-up technological approach: start from a single sector, or sub-sector, and
identify the derivative aggregate data. This approach yields greater accuracy and details compared to
the top-down approach, where sector variables are derived from a macro-variable (ex. income). The
model is also “integrated” in the sense all economic sectors are represented and it “produces” and
“distributes” the electricity and the fuels that are needed for final consumption, starting from primary
sources. This approach avoid in principle the so called “double counting” of effects of the
implementation of policies, so the model evaluates the impact and interactions of measures as a
package. Therefore the emissions difference between WM and WAM scenario is not the sum of the
effects of each measure as reported in table 4.17.
Structure and data of the full model, including the very detailed parts on end use devices that satisfy
the 70 demands for energy services are summarized in Contaldi and Gracceva, 200446.
5.1.1 The European context
In considering national intervention strategies to mitigate climate changes, it is important to consider
also other countries’ perspective, in particular EU Countries. Italy is a member of EU and its 2010
GHGs emissions account for about 10.6% of European Union (EU 27) actual emissions47. Moreover
many mitigation policies are coordinated at the EU level.
The European Commission started since year 2000 a monitoring mechanism of the greenhouse gas
emissions, which summaries the emissions and the mitigation measures implemented by Member
States on an annual basis. In the more recent reports (with 2010 data) a summary of the ongoing
situation at EU48 and National49 level is provided.
45 Markal (MARKet ALlocation) has been developed by the Implementing agreement of the International Energy
Agency for a programme of Energy Technology System Analysis (IEA/ETSAP). The “Second Assessment Report” of
IPCC (IPCC, 1995) suggests using Markal models to evaluate impact of mitigation policies. Source code is open,
regularly maintained and documented. 46 ENEA "Scenari energetici per l’Italia da un modello di equilibrio generale (Markal- macro)", M. Contaldi, F.
Gracceva, Enea Technical Report, ENEA, 2004, ISBN 88-8286-108-2. 47 Data from CRF, year 2010, of National Inventory Submission 2013 of European Union and Italy to the UNFCCC
Secretariat. 48 EU references, papers: Greenhouse gas emission trends and projections in Europe 2012. Tracking progress
towards Kyoto and 2020 targets - EEA Report No 6/2012 49 2013 Italy Climate policy progress report. Submitted to the European Commission pursuant to Decision No
280/2004/EC, Article 3(2), May 2013.
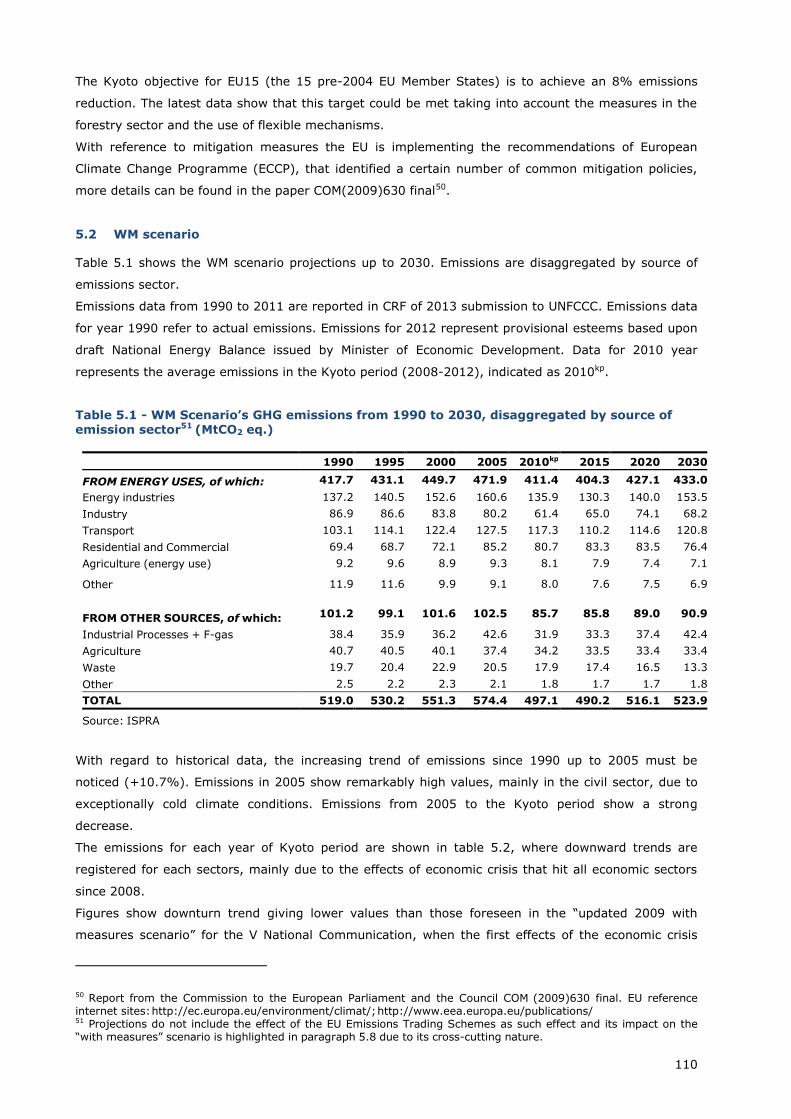
110
The Kyoto objective for EU15 (the 15 pre-2004 EU Member States) is to achieve an 8% emissions
reduction. The latest data show that this target could be met taking into account the measures in the
forestry sector and the use of flexible mechanisms.
With reference to mitigation measures the EU is implementing the recommendations of European
Climate Change Programme (ECCP), that identified a certain number of common mitigation policies,
more details can be found in the paper COM(2009)630 final50.
5.2 WM scenario
Table 5.1 shows the WM scenario projections up to 2030. Emissions are disaggregated by source of
emissions sector.
Emissions data from 1990 to 2011 are reported in CRF of 2013 submission to UNFCCC. Emissions data
for year 1990 refer to actual emissions. Emissions for 2012 represent provisional esteems based upon
draft National Energy Balance issued by Minister of Economic Development. Data for 2010 year
represents the average emissions in the Kyoto period (2008-2012), indicated as 2010kp.
Table 5.1 - WM Scenario’s GHG emissions from 1990 to 2030, disaggregated by source of emission sector51 (MtCO2 eq.)
1990 1995 2000 2005 2010kp 2015 2020 2030
FROM ENERGY USES, of which: 417.7 431.1 449.7 471.9 411.4 404.3 427.1 433.0
Energy industries 137.2 140.5 152.6 160.6 135.9 130.3 140.0 153.5
Industry 86.9 86.6 83.8 80.2 61.4 65.0 74.1 68.2
Transport 103.1 114.1 122.4 127.5 117.3 110.2 114.6 120.8
Residential and Commercial 69.4 68.7 72.1 85.2 80.7 83.3 83.5 76.4
Agriculture (energy use) 9.2 9.6 8.9 9.3 8.1 7.9 7.4 7.1
Other 11.9 11.6 9.9 9.1 8.0 7.6 7.5 6.9
FROM OTHER SOURCES, of which: 101.2 99.1 101.6 102.5 85.7 85.8 89.0 90.9
Industrial Processes + F-gas 38.4 35.9 36.2 42.6 31.9 33.3 37.4 42.4
Agriculture 40.7 40.5 40.1 37.4 34.2 33.5 33.4 33.4
Waste 19.7 20.4 22.9 20.5 17.9 17.4 16.5 13.3
Other 2.5 2.2 2.3 2.1 1.8 1.7 1.7 1.8
TOTAL 519.0 530.2 551.3 574.4 497.1 490.2 516.1 523.9
Source: ISPRA
With regard to historical data, the increasing trend of emissions since 1990 up to 2005 must be
noticed (+10.7%). Emissions in 2005 show remarkably high values, mainly in the civil sector, due to
exceptionally cold climate conditions. Emissions from 2005 to the Kyoto period show a strong
decrease.
The emissions for each year of Kyoto period are shown in table 5.2, where downward trends are
registered for each sectors, mainly due to the effects of economic crisis that hit all economic sectors
since 2008.
Figures show downturn trend giving lower values than those foreseen in the “updated 2009 with
measures scenario” for the V National Communication, when the first effects of the economic crisis
50 Report from the Commission to the European Parliament and the Council COM (2009)630 final. EU reference internet sites: http://ec.europa.eu/environment/climat/; http://www.eea.europa.eu/publications/ 51 Projections do not include the effect of the EU Emissions Trading Schemes as such effect and its impact on the “with measures” scenario is highlighted in paragraph 5.8 due to its cross-cutting nature.
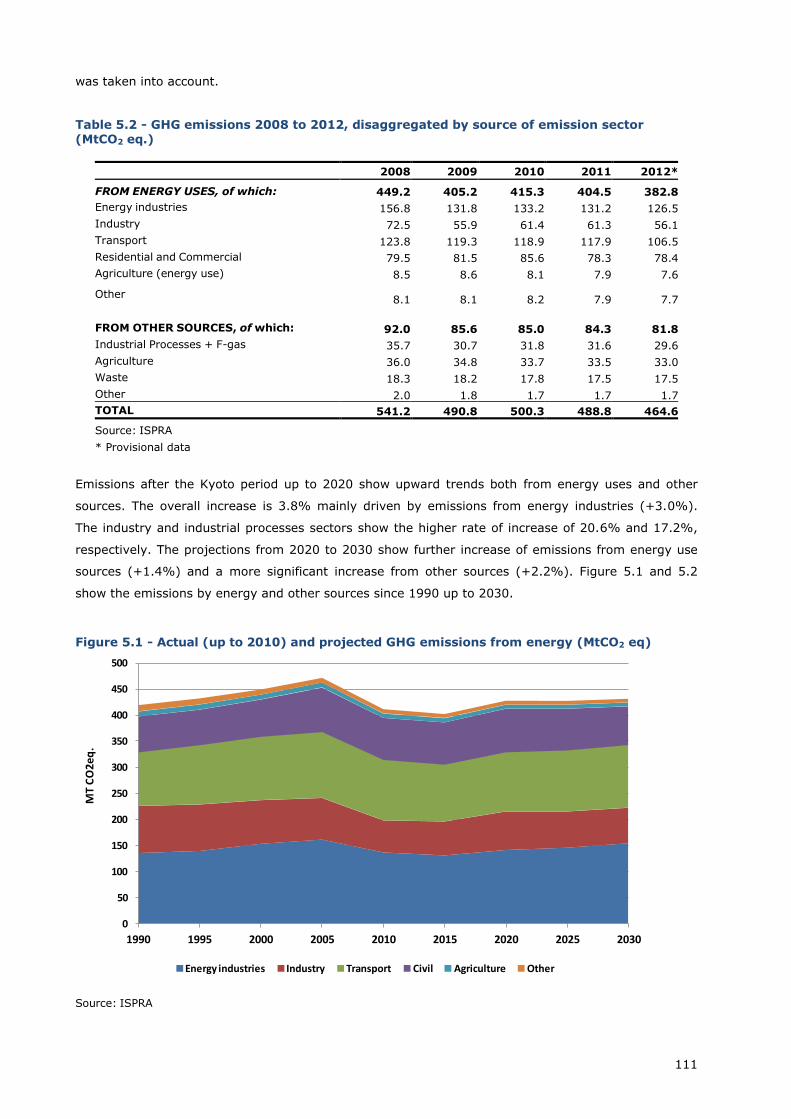
111
was taken into account.
Table 5.2 - GHG emissions 2008 to 2012, disaggregated by source of emission sector
(MtCO2 eq.)
2008 2009 2010 2011 2012*
FROM ENERGY USES, of which: 449.2 405.2 415.3 404.5 382.8
Energy industries 156.8 131.8 133.2 131.2 126.5
Industry 72.5 55.9 61.4 61.3 56.1
Transport 123.8 119.3 118.9 117.9 106.5
Residential and Commercial 79.5 81.5 85.6 78.3 78.4
Agriculture (energy use) 8.5 8.6 8.1 7.9 7.6
Other 8.1 8.1 8.2 7.9 7.7
FROM OTHER SOURCES, of which: 92.0 85.6 85.0 84.3 81.8
Industrial Processes + F-gas 35.7 30.7 31.8 31.6 29.6
Agriculture 36.0 34.8 33.7 33.5 33.0
Waste 18.3 18.2 17.8 17.5 17.5
Other 2.0 1.8 1.7 1.7 1.7
TOTAL 541.2 490.8 500.3 488.8 464.6
Source: ISPRA
* Provisional data
Emissions after the Kyoto period up to 2020 show upward trends both from energy uses and other
sources. The overall increase is 3.8% mainly driven by emissions from energy industries (+3.0%).
The industry and industrial processes sectors show the higher rate of increase of 20.6% and 17.2%,
respectively. The projections from 2020 to 2030 show further increase of emissions from energy use
sources (+1.4%) and a more significant increase from other sources (+2.2%). Figure 5.1 and 5.2
show the emissions by energy and other sources since 1990 up to 2030.
Figure 5.1 - Actual (up to 2010) and projected GHG emissions from energy (MtCO2 eq)
Source: ISPRA
0
50
100
150
200
250
300
350
400
450
500
1990 1995 2000 2005 2010 2015 2020 2025 2030
Energy industries Industry Transport Civil Agriculture Other
MT
CO
2e
q.
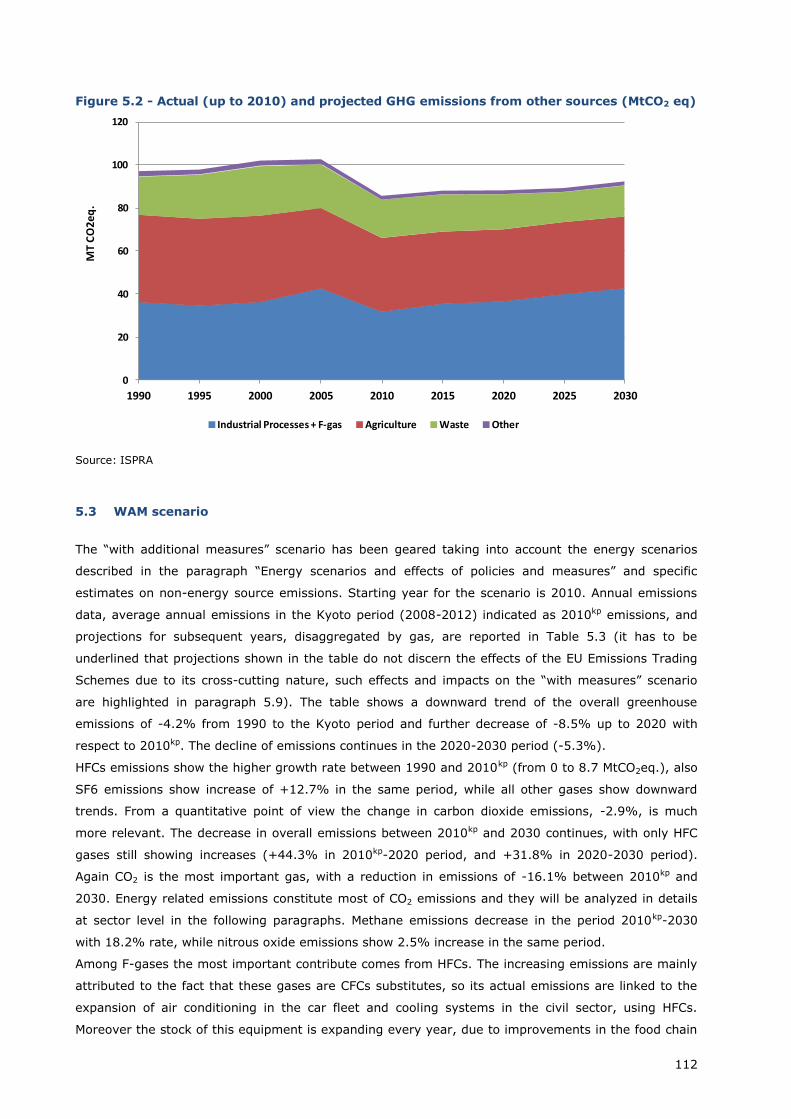
112
Figure 5.2 - Actual (up to 2010) and projected GHG emissions from other sources (MtCO2 eq)
Source: ISPRA
5.3 WAM scenario
The “with additional measures” scenario has been geared taking into account the energy scenarios
described in the paragraph “Energy scenarios and effects of policies and measures” and specific
estimates on non-energy source emissions. Starting year for the scenario is 2010. Annual emissions
data, average annual emissions in the Kyoto period (2008-2012) indicated as 2010kp emissions, and
projections for subsequent years, disaggregated by gas, are reported in Table 5.3 (it has to be
underlined that projections shown in the table do not discern the effects of the EU Emissions Trading
Schemes due to its cross-cutting nature, such effects and impacts on the “with measures” scenario
are highlighted in paragraph 5.9). The table shows a downward trend of the overall greenhouse
emissions of -4.2% from 1990 to the Kyoto period and further decrease of -8.5% up to 2020 with
respect to 2010kp. The decline of emissions continues in the 2020-2030 period (-5.3%).
HFCs emissions show the higher growth rate between 1990 and 2010kp (from 0 to 8.7 MtCO2eq.), also
SF6 emissions show increase of +12.7% in the same period, while all other gases show downward
trends. From a quantitative point of view the change in carbon dioxide emissions, -2.9%, is much
more relevant. The decrease in overall emissions between 2010kp and 2030 continues, with only HFC
gases still showing increases (+44.3% in 2010kp-2020 period, and +31.8% in 2020-2030 period).
Again CO2 is the most important gas, with a reduction in emissions of -16.1% between 2010kp and
2030. Energy related emissions constitute most of CO2 emissions and they will be analyzed in details
at sector level in the following paragraphs. Methane emissions decrease in the period 2010kp-2030
with 18.2% rate, while nitrous oxide emissions show 2.5% increase in the same period.
Among F-gases the most important contribute comes from HFCs. The increasing emissions are mainly
attributed to the fact that these gases are CFCs substitutes, so its actual emissions are linked to the
expansion of air conditioning in the car fleet and cooling systems in the civil sector, using HFCs.
Moreover the stock of this equipment is expanding every year, due to improvements in the food chain
0
20
40
60
80
100
120
1990 1995 2000 2005 2010 2015 2020 2025 2030
Industrial Processes + F-gas Agriculture Waste Other
MT
CO
2e
q.
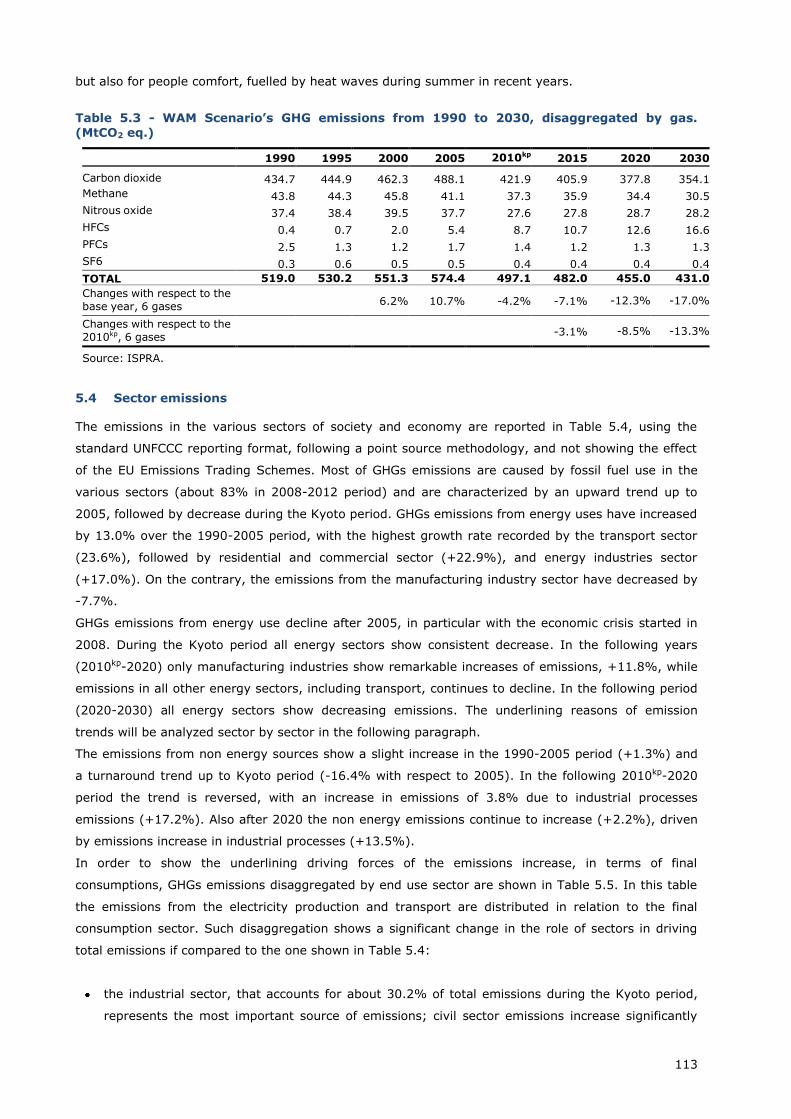
113
but also for people comfort, fuelled by heat waves during summer in recent years.
Table 5.3 - WAM Scenario’s GHG emissions from 1990 to 2030, disaggregated by gas.
(MtCO2 eq.)
1990 1995 2000 2005 2010kp 2015 2020 2030
Carbon dioxide 434.7 444.9 462.3 488.1 421.9 405.9 377.8 354.1
Methane 43.8 44.3 45.8 41.1 37.3 35.9 34.4 30.5
Nitrous oxide 37.4 38.4 39.5 37.7 27.6 27.8 28.7 28.2
HFCs 0.4 0.7 2.0 5.4 8.7 10.7 12.6 16.6
PFCs 2.5 1.3 1.2 1.7 1.4 1.2 1.3 1.3
SF6 0.3 0.6 0.5 0.5 0.4 0.4 0.4 0.4
TOTAL
519.0 530.2 551.3 574.4 497.1 482.0 455.0 431.0
Changes with respect to the
base year, 6 gases 6.2% 10.7% -4.2% -7.1% -12.3% -17.0%
Changes with respect to the
2010kp, 6 gases -3.1% -8.5% -13.3%
Source: ISPRA.
5.4 Sector emissions
The emissions in the various sectors of society and economy are reported in Table 5.4, using the
standard UNFCCC reporting format, following a point source methodology, and not showing the effect
of the EU Emissions Trading Schemes. Most of GHGs emissions are caused by fossil fuel use in the
various sectors (about 83% in 2008-2012 period) and are characterized by an upward trend up to
2005, followed by decrease during the Kyoto period. GHGs emissions from energy uses have increased
by 13.0% over the 1990-2005 period, with the highest growth rate recorded by the transport sector
(23.6%), followed by residential and commercial sector (+22.9%), and energy industries sector
(+17.0%). On the contrary, the emissions from the manufacturing industry sector have decreased by
-7.7%.
GHGs emissions from energy use decline after 2005, in particular with the economic crisis started in
2008. During the Kyoto period all energy sectors show consistent decrease. In the following years
(2010kp-2020) only manufacturing industries show remarkable increases of emissions, +11.8%, while
emissions in all other energy sectors, including transport, continues to decline. In the following period
(2020-2030) all energy sectors show decreasing emissions. The underlining reasons of emission
trends will be analyzed sector by sector in the following paragraph.
The emissions from non energy sources show a slight increase in the 1990-2005 period (+1.3%) and
a turnaround trend up to Kyoto period (-16.4% with respect to 2005). In the following 2010kp-2020
period the trend is reversed, with an increase in emissions of 3.8% due to industrial processes
emissions (+17.2%). Also after 2020 the non energy emissions continue to increase (+2.2%), driven
by emissions increase in industrial processes (+13.5%).
In order to show the underlining driving forces of the emissions increase, in terms of final
consumptions, GHGs emissions disaggregated by end use sector are shown in Table 5.5. In this table
the emissions from the electricity production and transport are distributed in relation to the final
consumption sector. Such disaggregation shows a significant change in the role of sectors in driving
total emissions if compared to the one shown in Table 5.4:
the industrial sector, that accounts for about 30.2% of total emissions during the Kyoto period,
represents the most important source of emissions; civil sector emissions increase significantly
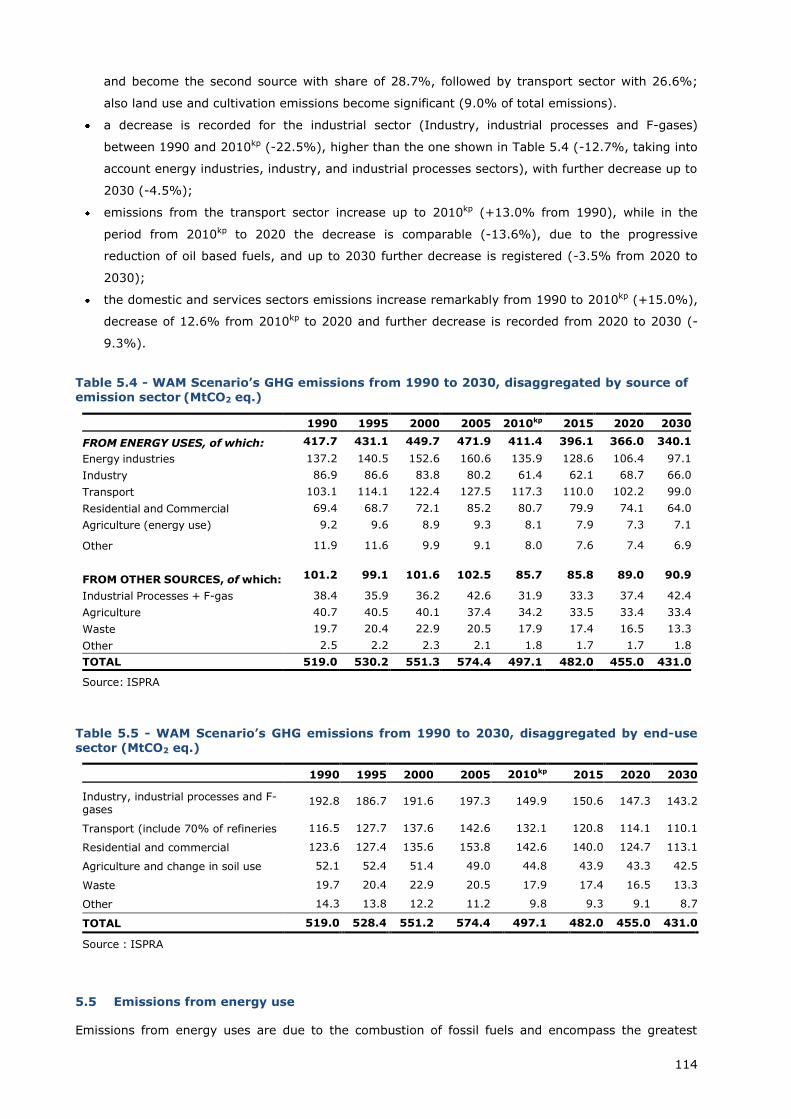
114
and become the second source with share of 28.7%, followed by transport sector with 26.6%;
also land use and cultivation emissions become significant (9.0% of total emissions).
a decrease is recorded for the industrial sector (Industry, industrial processes and F-gases)
between 1990 and 2010kp (-22.5%), higher than the one shown in Table 5.4 (-12.7%, taking into
account energy industries, industry, and industrial processes sectors), with further decrease up to
2030 (-4.5%);
emissions from the transport sector increase up to 2010kp (+13.0% from 1990), while in the
period from 2010kp to 2020 the decrease is comparable (-13.6%), due to the progressive
reduction of oil based fuels, and up to 2030 further decrease is registered (-3.5% from 2020 to
2030);
the domestic and services sectors emissions increase remarkably from 1990 to 2010kp (+15.0%),
decrease of 12.6% from 2010kp to 2020 and further decrease is recorded from 2020 to 2030 (-
9.3%).
Table 5.4 - WAM Scenario’s GHG emissions from 1990 to 2030, disaggregated by source of emission sector (MtCO2 eq.)
1990 1995 2000 2005 2010kp 2015 2020 2030
FROM ENERGY USES, of which: 417.7 431.1 449.7 471.9 411.4 396.1 366.0 340.1
Energy industries 137.2 140.5 152.6 160.6 135.9 128.6 106.4 97.1
Industry 86.9 86.6 83.8 80.2 61.4 62.1 68.7 66.0
Transport 103.1 114.1 122.4 127.5 117.3 110.0 102.2 99.0
Residential and Commercial 69.4 68.7 72.1 85.2 80.7 79.9 74.1 64.0
Agriculture (energy use) 9.2 9.6 8.9 9.3 8.1 7.9 7.3 7.1
Other 11.9 11.6 9.9 9.1 8.0 7.6 7.4 6.9
FROM OTHER SOURCES, of which: 101.2 99.1 101.6 102.5 85.7 85.8 89.0 90.9
Industrial Processes + F-gas 38.4 35.9 36.2 42.6 31.9 33.3 37.4 42.4
Agriculture 40.7 40.5 40.1 37.4 34.2 33.5 33.4 33.4
Waste 19.7 20.4 22.9 20.5 17.9 17.4 16.5 13.3
Other 2.5 2.2 2.3 2.1 1.8 1.7 1.7 1.8
TOTAL 519.0 530.2 551.3 574.4 497.1 482.0 455.0 431.0
Source: ISPRA
Table 5.5 - WAM Scenario’s GHG emissions from 1990 to 2030, disaggregated by end-use sector (MtCO2 eq.)
1990 1995 2000 2005 2010kp 2015 2020 2030
Industry, industrial processes and F-gases
192.8 186.7 191.6 197.3 149.9 150.6 147.3 143.2
Transport (include 70% of refineries 116.5 127.7 137.6 142.6 132.1 120.8 114.1 110.1
Residential and commercial 123.6 127.4 135.6 153.8 142.6 140.0 124.7 113.1
Agriculture and change in soil use 52.1 52.4 51.4 49.0 44.8 43.9 43.3 42.5
Waste 19.7 20.4 22.9 20.5 17.9 17.4 16.5 13.3
Other 14.3 13.8 12.2 11.2 9.8 9.3 9.1 8.7
TOTAL 519.0 528.4 551.2 574.4 497.1 482.0 455.0 431.0
Source : ISPRA
5.5 Emissions from energy use
Emissions from energy uses are due to the combustion of fossil fuels and encompass the greatest
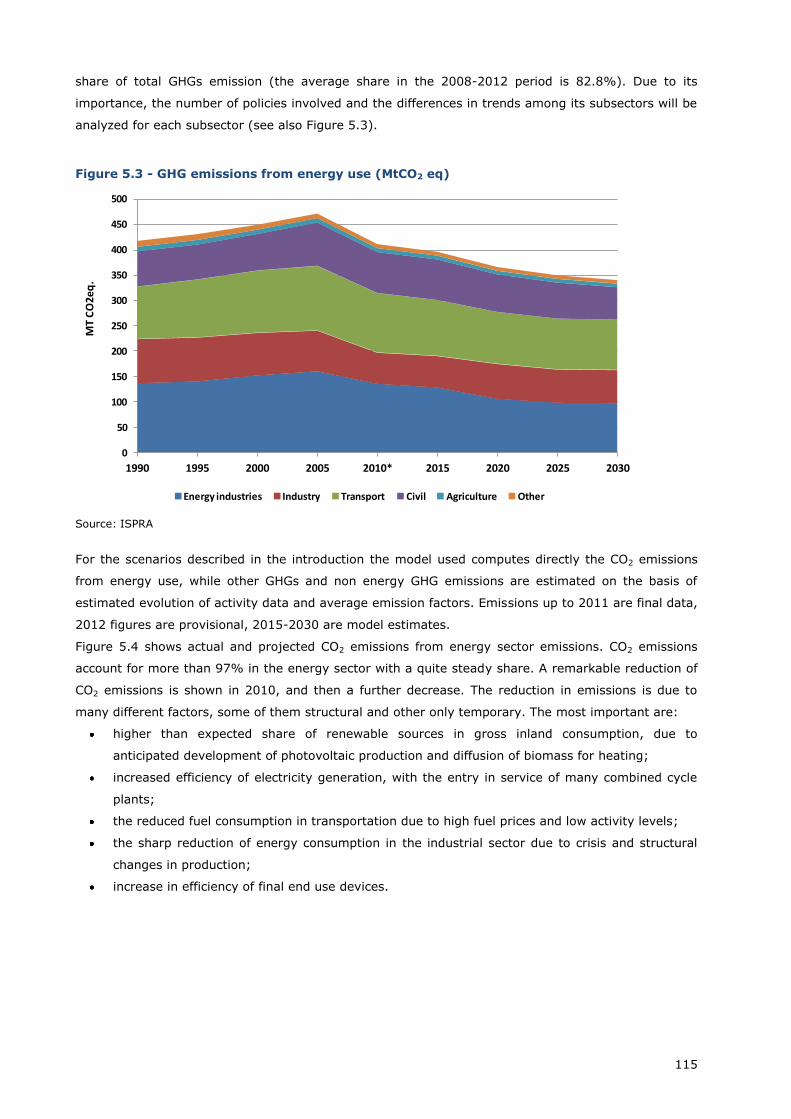
115
share of total GHGs emission (the average share in the 2008-2012 period is 82.8%). Due to its
importance, the number of policies involved and the differences in trends among its subsectors will be
analyzed for each subsector (see also Figure 5.3).
Figure 5.3 - GHG emissions from energy use (MtCO2 eq)
Source: ISPRA
For the scenarios described in the introduction the model used computes directly the CO2 emissions
from energy use, while other GHGs and non energy GHG emissions are estimated on the basis of
estimated evolution of activity data and average emission factors. Emissions up to 2011 are final data,
2012 figures are provisional, 2015-2030 are model estimates.
Figure 5.4 shows actual and projected CO2 emissions from energy sector emissions. CO2 emissions
account for more than 97% in the energy sector with a quite steady share. A remarkable reduction of
CO2 emissions is shown in 2010, and then a further decrease. The reduction in emissions is due to
many different factors, some of them structural and other only temporary. The most important are:
higher than expected share of renewable sources in gross inland consumption, due to
anticipated development of photovoltaic production and diffusion of biomass for heating;
increased efficiency of electricity generation, with the entry in service of many combined cycle
plants;
the reduced fuel consumption in transportation due to high fuel prices and low activity levels;
the sharp reduction of energy consumption in the industrial sector due to crisis and structural
changes in production;
increase in efficiency of final end use devices.
0
50
100
150
200
250
300
350
400
450
500
1990 1995 2000 2005 2010* 2015 2020 2025 2030
Energy industries Industry Transport Civil Agriculture Other
MT
CO
2e
q.
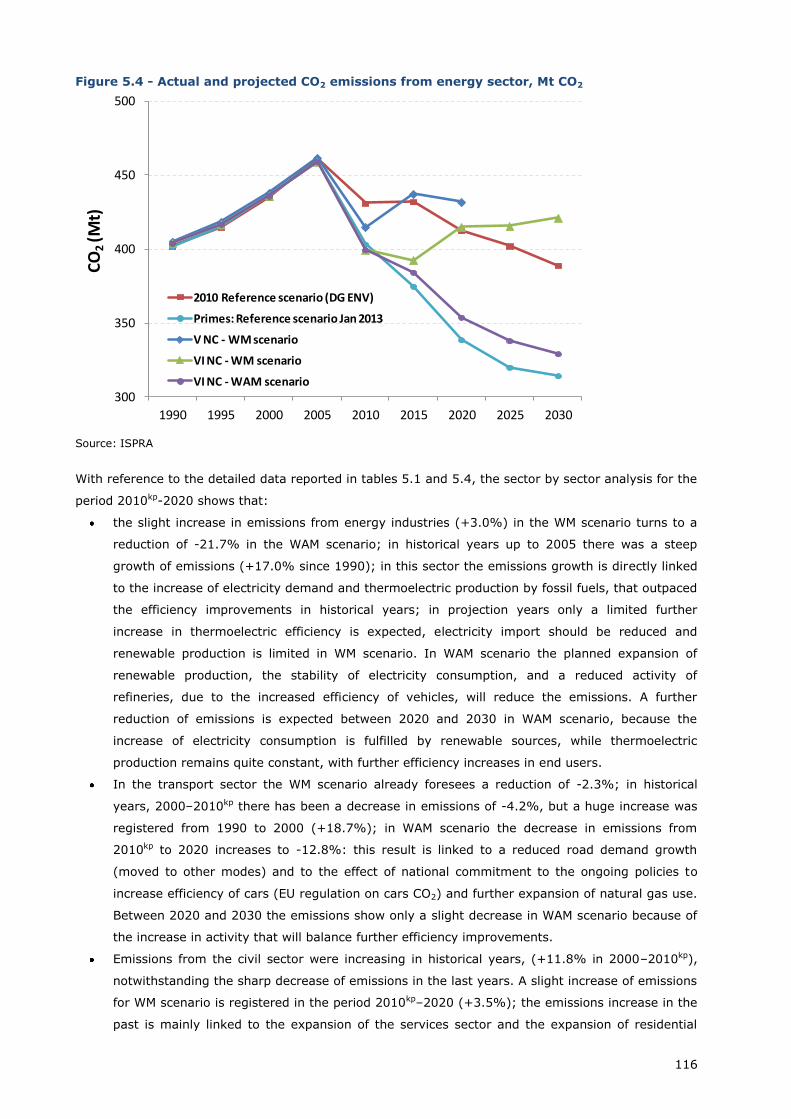
116
Figure 5.4 - Actual and projected CO2 emissions from energy sector, Mt CO2
Source: ISPRA
With reference to the detailed data reported in tables 5.1 and 5.4, the sector by sector analysis for the
period 2010kp-2020 shows that:
the slight increase in emissions from energy industries (+3.0%) in the WM scenario turns to a
reduction of -21.7% in the WAM scenario; in historical years up to 2005 there was a steep
growth of emissions (+17.0% since 1990); in this sector the emissions growth is directly linked
to the increase of electricity demand and thermoelectric production by fossil fuels, that outpaced
the efficiency improvements in historical years; in projection years only a limited further
increase in thermoelectric efficiency is expected, electricity import should be reduced and
renewable production is limited in WM scenario. In WAM scenario the planned expansion of
renewable production, the stability of electricity consumption, and a reduced activity of
refineries, due to the increased efficiency of vehicles, will reduce the emissions. A further
reduction of emissions is expected between 2020 and 2030 in WAM scenario, because the
increase of electricity consumption is fulfilled by renewable sources, while thermoelectric
production remains quite constant, with further efficiency increases in end users.
In the transport sector the WM scenario already foresees a reduction of -2.3%; in historical
years, 2000–2010kp there has been a decrease in emissions of -4.2%, but a huge increase was
registered from 1990 to 2000 (+18.7%); in WAM scenario the decrease in emissions from
2010kp to 2020 increases to -12.8%: this result is linked to a reduced road demand growth
(moved to other modes) and to the effect of national commitment to the ongoing policies to
increase efficiency of cars (EU regulation on cars CO2) and further expansion of natural gas use.
Between 2020 and 2030 the emissions show only a slight decrease in WAM scenario because of
the increase in activity that will balance further efficiency improvements.
Emissions from the civil sector were increasing in historical years, (+11.8% in 2000–2010kp),
notwithstanding the sharp decrease of emissions in the last years. A slight increase of emissions
for WM scenario is registered in the period 2010kp–2020 (+3.5%); the emissions increase in the
past is mainly linked to the expansion of the services sector and the expansion of residential
300
350
400
450
500
1990 1995 2000 2005 2010 2015 2020 2025 2030
2010 Reference scenario (DG ENV)
Primes: Reference scenario Jan 2013
V NC - WM scenario
VI NC - WM scenario
VI NC - WAM scenario
CO
2 (M
t)
117
building stock (second and third houses), also increased house size and higher internal
temperature play an important role; in projection years planned policies have a relevant effect
in curbing emissions; in WAM scenario reduction of emissions between 2010kp and 2020
increase up to -8.2% due to higher efficiencies planned for building stocks and expansion of
renewable use (biomass / geothermal / solar thermal / heat pumps). A further reduction of
13.6% is foreseen between 2020 and 2030 (WAM scenario) due to further improvements in
building thermal isolation and expansion of heat pumps. Climate data are kept constant in the
model.
Industry emissions register a deep decrease in historical years, 2000–2010kp (-26.7%), because
of the effect of economic crisis; the emissions are planned to increase, +20.6%, between 2010kp
and 2020 in WM scenario. Increase of activity data, or better a partial recovery of the activity
level registered between 2005 and 2008, is the main driving force (see paragraph 5.8.5). In the
WAM scenario the increase is almost halved, +11.8% between 2010kp and 2020. The reduced
increase is due mainly to increase in efficiency and cogeneration use. Emissions should stay
almost constant up to 2030 due to a slight expansion in activity balanced by further increase in
efficiency.
It is noteworthy to underline that the emissions computed by the model do not match 100% with the
inventory estimate for the base modelling year, currently 2010, because of the unavoidable
simplifications in the modelling of the energy system. The discrepancies are reduced to 1-2% in total
and up to 4% in the single sectors. Those estimates are in any case the best available to project
emissions.
5.5.1 Energy industries sector
According to IPCC guidelines the energy industries sector includes the electricity production from fossil
fuels, refineries and the production of coke and of electricity from coal gases in integrated steel plants.
Self-generated and self-consumed electricity are not included in the energy industries sector (see also
chapter 3 and in particular CRF data in section 1.A.1 a-c) as they are included among industrial
emissions (see also chapter 3 and in particular CRF data in section 1.A.2). The emissions from self-
generated and self-consumed electricity were relevant in the past, but in recent years they only
amount to about 10% of emissions from total electricity production, as reported in the NIR52. The
emissions from refineries are relevant but the increase in the efficiency of vehicles foreseen in the
next years will reduce the refineries activity. The emissions from energy industry sector are linked to
electricity production, especially for trends.
Between 1990 and 2005 a noticeable increase of 17.0% has been registered by the energy industries
sector, more than 1% yearly. From 2005 to 2010kp the trend shows an inversion and the emissions
sharply decrease (-15.4%). The declining trend in the last years is mainly driven by reduced activity in
the years of economic crisis and increasing share of renewable sources to produce electricity. A
significant role is also played by increasing fossil fuels efficiency for the electricity generation. After
the Kyoto period up to 2020 further decrease of emissions is expected (-21.7%), the declining trend
continues up to 2030 with -8.7% of reduction due to increasing share of renewable sources for
52 See Annex 2 and table A2.3 of National Inventory Report 2013, ISBN 978-88-448-0609-5 - ISPRA 2013, http://www.isprambiente.gov.it/it
118
electricity generation, lesser contribute is expected by efficiency factor due to limited scope remaining
for technologies to increase the energy generation efficiency and for fossil fuel switch to gas.
5.5.1.1 Electricity production
The increase of emissions from electricity production is lower than the growth of electricity production
itself (Figure 5.5), due mainly to fuel shift on lower carbon content fuels, increasing share of
renewable sources in the last years and relevant increase in efficiency of electricity production since
1990. The growth rate of gross electric energy production was quite high from 1990 to 2012 (about
1.7% per year), a sharp decline is observed during the Kyoto period (-5.2% in the 2012 as compared
to 2008 level, without considering electricity by pumped storage units), corresponding with the
economic crisis. The average gross electric energy production for years 2008-2012 is 39.3% higher
than 1990 level. As regards the carbon dioxide emissions, the amount for years 2008-2012 is 3.1%
lower than 1990 level.
According to the WAM scenario the expected increase in demand will be covered by strong increase in
installed power of renewable sources. A limited expansion of coal generation capacity is also planned.
Total power capacity, including renewable capacities, goes from 102,339 MW (gross efficient power) in
2008 to 128,134 MW in 2012. Renewable sources represent the main component of the power
increase (23,486 MW out of 25.795 MW). The growth has been essentially affected by photovoltaic
and wind capacity (15,988 MW and 4,582 MW, respectively). As concern the electricity from
renewable sources the European target for Italy to be achieved in 2020 is 26,4%, expressed as a
percentage of gross final consumption of electricity, including import share of electricity. Such target
is overachieved in 2012 with about 92 TWh, 27.1% of gross final consumption of electricity53. In
calculating the contribution of hydropower and wind, the effects of climatic variation are smoothed
through the use of a normalization rule according to Directive 2009/28/EC. The steep increase of
renewable electricity production is foreseen to continue in the next years. The National Energy
Strategy planned about 130 TWh from renewable sources in 2020, including the import from abroad of
about 24 TWh. The projection for 2030 is about 140 TWh with a decreasing share of imported
electricity from renewable sources to 10 TWh. Total electricity production without electricity by
pumped storage units grows from 299 TWh in 2010 to 311 TWh in 2020 and 341 Twh in 2030. As the
thermoelectric production is quite constant in the period 2010-2030 the growth of electricity
production will be produced by renewable sources.
53 GSE, 2013 - Impianti a fonti rinnovabili in Italia.
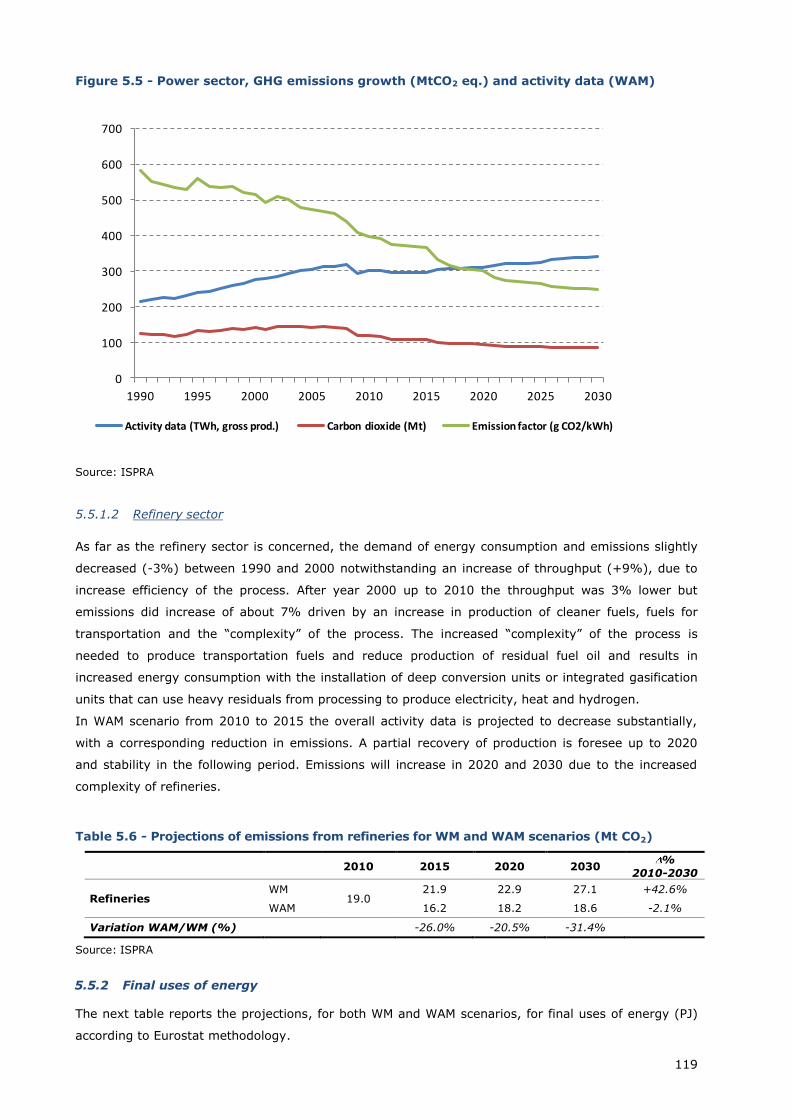
119
Figure 5.5 - Power sector, GHG emissions growth (MtCO2 eq.) and activity data (WAM)
Source: ISPRA
5.5.1.2 Refinery sector
As far as the refinery sector is concerned, the demand of energy consumption and emissions slightly
decreased (-3%) between 1990 and 2000 notwithstanding an increase of throughput (+9%), due to
increase efficiency of the process. After year 2000 up to 2010 the throughput was 3% lower but
emissions did increase of about 7% driven by an increase in production of cleaner fuels, fuels for
transportation and the “complexity” of the process. The increased “complexity” of the process is
needed to produce transportation fuels and reduce production of residual fuel oil and results in
increased energy consumption with the installation of deep conversion units or integrated gasification
units that can use heavy residuals from processing to produce electricity, heat and hydrogen.
In WAM scenario from 2010 to 2015 the overall activity data is projected to decrease substantially,
with a corresponding reduction in emissions. A partial recovery of production is foresee up to 2020
and stability in the following period. Emissions will increase in 2020 and 2030 due to the increased
complexity of refineries.
Table 5.6 - Projections of emissions from refineries for WM and WAM scenarios (Mt CO2)
2010 2015 2020 2030
%
2010-2030
Refineries WM
19.0 21.9 22.9 27.1 +42.6%
WAM 16.2 18.2 18.6 -2.1%
Variation WAM/WM (%)
-26.0% -20.5% -31.4%
Source: ISPRA
5.5.2 Final uses of energy
The next table reports the projections, for both WM and WAM scenarios, for final uses of energy (PJ)
according to Eurostat methodology.
0
100
200
300
400
500
600
700
1990 1995 2000 2005 2010 2015 2020 2025 2030
Activity data (TWh, gross prod.) Carbon dioxide (Mt) Emission factor (g CO2/kWh)
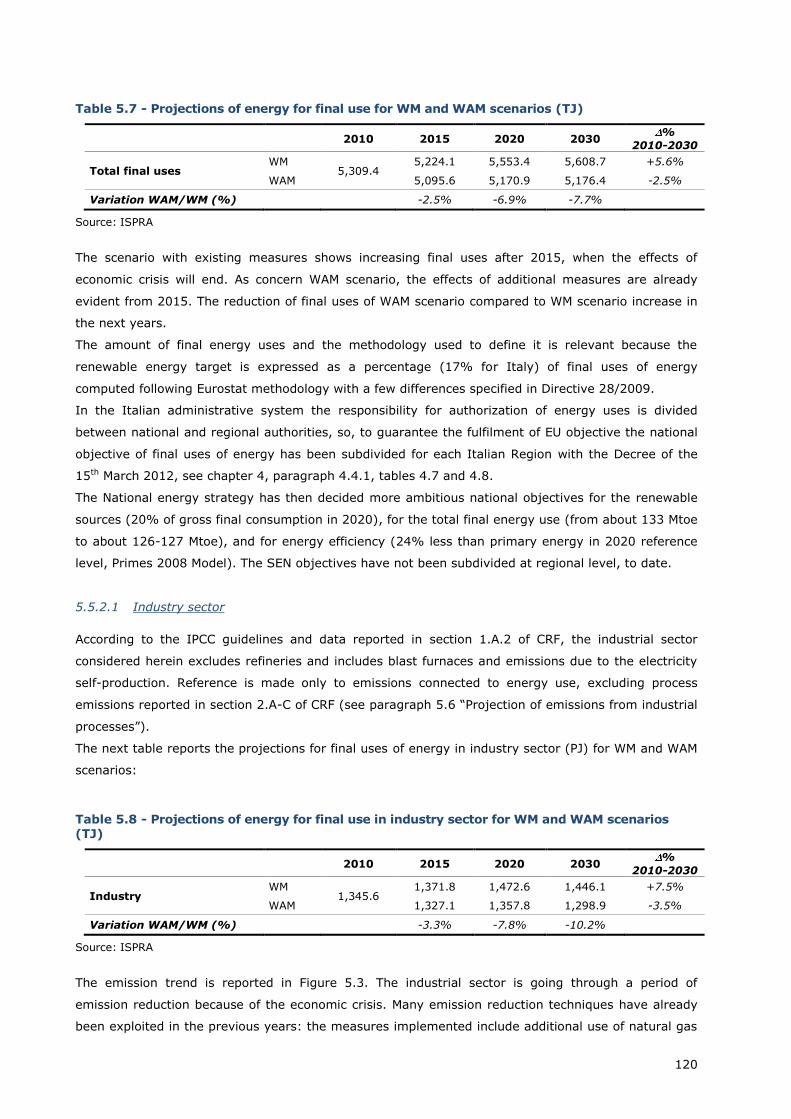
120
Table 5.7 - Projections of energy for final use for WM and WAM scenarios (TJ)
2010 2015 2020 2030
%
2010-2030
Total final uses WM
5,309.4 5,224.1 5,553.4 5,608.7 +5.6%
WAM 5,095.6 5,170.9 5,176.4 -2.5%
Variation WAM/WM (%)
-2.5% -6.9% -7.7%
Source: ISPRA
The scenario with existing measures shows increasing final uses after 2015, when the effects of
economic crisis will end. As concern WAM scenario, the effects of additional measures are already
evident from 2015. The reduction of final uses of WAM scenario compared to WM scenario increase in
the next years.
The amount of final energy uses and the methodology used to define it is relevant because the
renewable energy target is expressed as a percentage (17% for Italy) of final uses of energy
computed following Eurostat methodology with a few differences specified in Directive 28/2009.
In the Italian administrative system the responsibility for authorization of energy uses is divided
between national and regional authorities, so, to guarantee the fulfilment of EU objective the national
objective of final uses of energy has been subdivided for each Italian Region with the Decree of the
15th March 2012, see chapter 4, paragraph 4.4.1, tables 4.7 and 4.8.
The National energy strategy has then decided more ambitious national objectives for the renewable
sources (20% of gross final consumption in 2020), for the total final energy use (from about 133 Mtoe
to about 126-127 Mtoe), and for energy efficiency (24% less than primary energy in 2020 reference
level, Primes 2008 Model). The SEN objectives have not been subdivided at regional level, to date.
5.5.2.1 Industry sector
According to the IPCC guidelines and data reported in section 1.A.2 of CRF, the industrial sector
considered herein excludes refineries and includes blast furnaces and emissions due to the electricity
self-production. Reference is made only to emissions connected to energy use, excluding process
emissions reported in section 2.A-C of CRF (see paragraph 5.6 “Projection of emissions from industrial
processes”).
The next table reports the projections for final uses of energy in industry sector (PJ) for WM and WAM
scenarios:
Table 5.8 - Projections of energy for final use in industry sector for WM and WAM scenarios (TJ)
2010 2015 2020 2030
%
2010-2030
Industry WM
1,345.6 1,371.8 1,472.6 1,446.1 +7.5%
WAM 1,327.1 1,357.8 1,298.9 -3.5%
Variation WAM/WM (%)
-3.3% -7.8% -10.2%
Source: ISPRA
The emission trend is reported in Figure 5.3. The industrial sector is going through a period of
emission reduction because of the economic crisis. Many emission reduction techniques have already
been exploited in the previous years: the measures implemented include additional use of natural gas
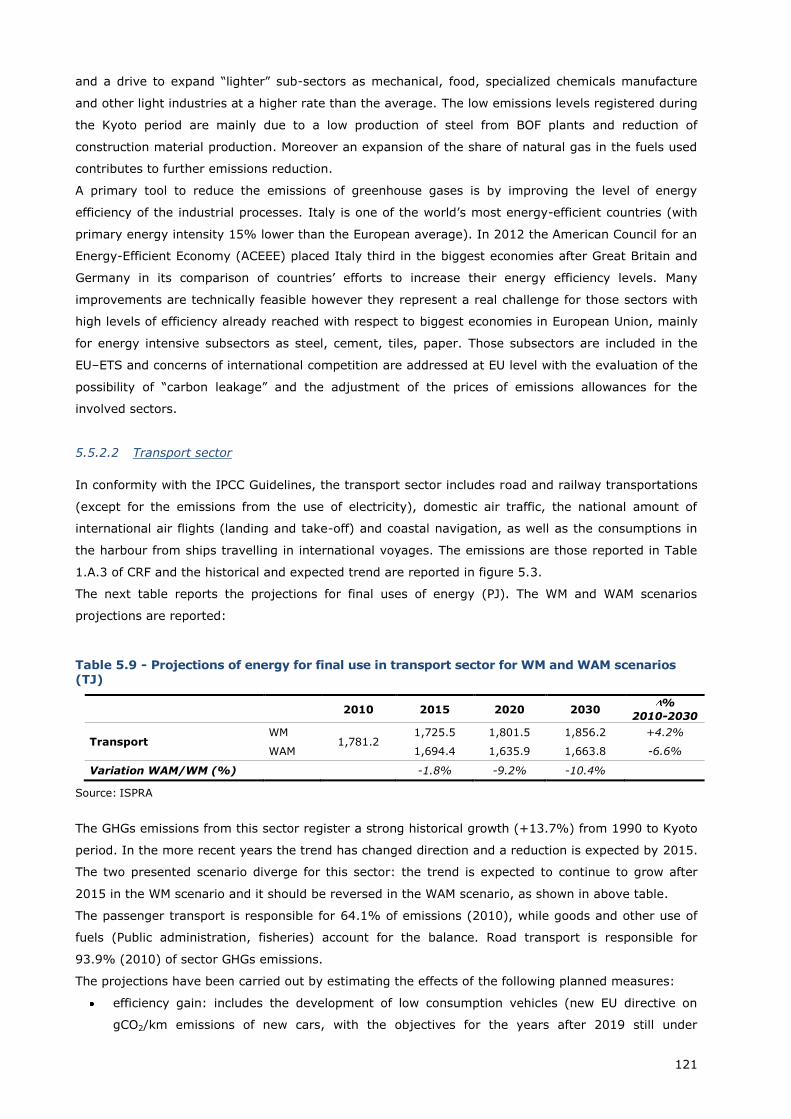
121
and a drive to expand “lighter” sub-sectors as mechanical, food, specialized chemicals manufacture
and other light industries at a higher rate than the average. The low emissions levels registered during
the Kyoto period are mainly due to a low production of steel from BOF plants and reduction of
construction material production. Moreover an expansion of the share of natural gas in the fuels used
contributes to further emissions reduction.
A primary tool to reduce the emissions of greenhouse gases is by improving the level of energy
efficiency of the industrial processes. Italy is one of the world’s most energy-efficient countries (with
primary energy intensity 15% lower than the European average). In 2012 the American Council for an
Energy-Efficient Economy (ACEEE) placed Italy third in the biggest economies after Great Britain and
Germany in its comparison of countries’ efforts to increase their energy efficiency levels. Many
improvements are technically feasible however they represent a real challenge for those sectors with
high levels of efficiency already reached with respect to biggest economies in European Union, mainly
for energy intensive subsectors as steel, cement, tiles, paper. Those subsectors are included in the
EU–ETS and concerns of international competition are addressed at EU level with the evaluation of the
possibility of “carbon leakage” and the adjustment of the prices of emissions allowances for the
involved sectors.
5.5.2.2 Transport sector
In conformity with the IPCC Guidelines, the transport sector includes road and railway transportations
(except for the emissions from the use of electricity), domestic air traffic, the national amount of
international air flights (landing and take-off) and coastal navigation, as well as the consumptions in
the harbour from ships travelling in international voyages. The emissions are those reported in Table
1.A.3 of CRF and the historical and expected trend are reported in figure 5.3.
The next table reports the projections for final uses of energy (PJ). The WM and WAM scenarios
projections are reported:
Table 5.9 - Projections of energy for final use in transport sector for WM and WAM scenarios (TJ)
2010 2015 2020 2030
%
2010-2030
Transport WM
1,781.2 1,725.5 1,801.5 1,856.2 +4.2%
WAM 1,694.4 1,635.9 1,663.8 -6.6%
Variation WAM/WM (%)
-1.8% -9.2% -10.4%
Source: ISPRA
The GHGs emissions from this sector register a strong historical growth (+13.7%) from 1990 to Kyoto
period. In the more recent years the trend has changed direction and a reduction is expected by 2015.
The two presented scenario diverge for this sector: the trend is expected to continue to grow after
2015 in the WM scenario and it should be reversed in the WAM scenario, as shown in above table.
The passenger transport is responsible for 64.1% of emissions (2010), while goods and other use of
fuels (Public administration, fisheries) account for the balance. Road transport is responsible for
93.9% (2010) of sector GHGs emissions.
The projections have been carried out by estimating the effects of the following planned measures:
efficiency gain: includes the development of low consumption vehicles (new EU directive on
gCO2/km emissions of new cars, with the objectives for the years after 2019 still under
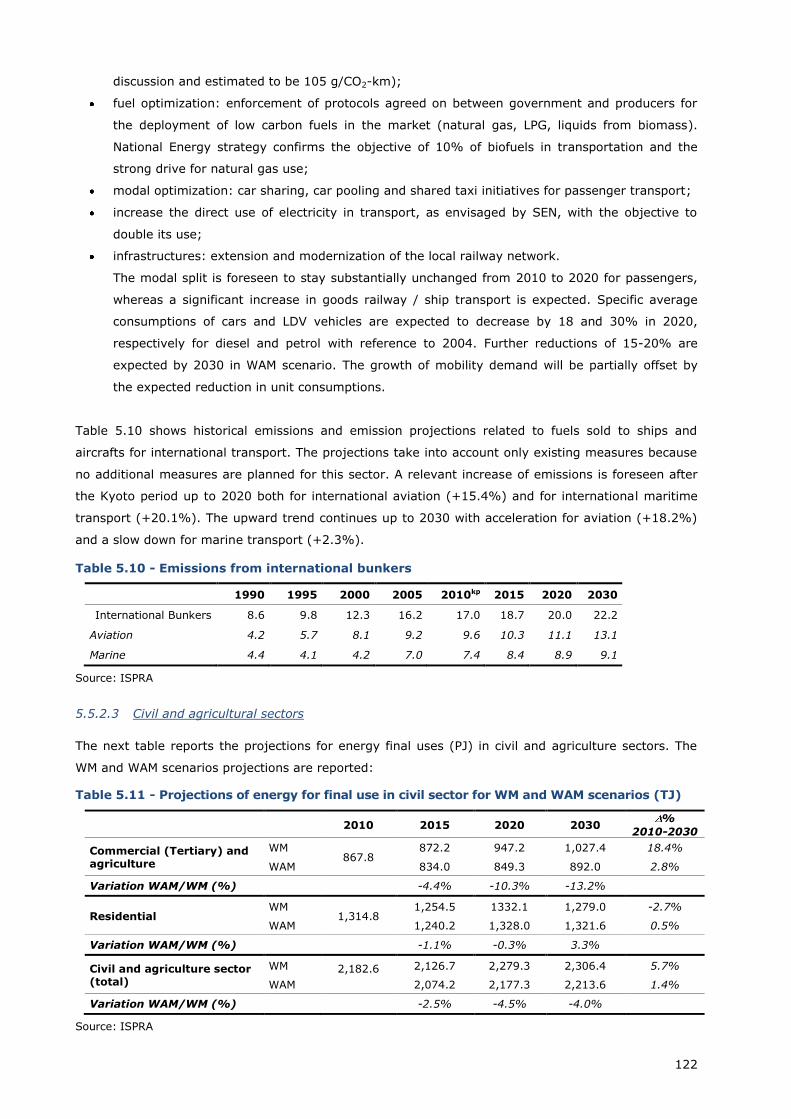
122
discussion and estimated to be 105 g/CO2-km);
fuel optimization: enforcement of protocols agreed on between government and producers for
the deployment of low carbon fuels in the market (natural gas, LPG, liquids from biomass).
National Energy strategy confirms the objective of 10% of biofuels in transportation and the
strong drive for natural gas use;
modal optimization: car sharing, car pooling and shared taxi initiatives for passenger transport;
increase the direct use of electricity in transport, as envisaged by SEN, with the objective to
double its use;
infrastructures: extension and modernization of the local railway network.
The modal split is foreseen to stay substantially unchanged from 2010 to 2020 for passengers,
whereas a significant increase in goods railway / ship transport is expected. Specific average
consumptions of cars and LDV vehicles are expected to decrease by 18 and 30% in 2020,
respectively for diesel and petrol with reference to 2004. Further reductions of 15-20% are
expected by 2030 in WAM scenario. The growth of mobility demand will be partially offset by
the expected reduction in unit consumptions.
Table 5.10 shows historical emissions and emission projections related to fuels sold to ships and
aircrafts for international transport. The projections take into account only existing measures because
no additional measures are planned for this sector. A relevant increase of emissions is foreseen after
the Kyoto period up to 2020 both for international aviation (+15.4%) and for international maritime
transport (+20.1%). The upward trend continues up to 2030 with acceleration for aviation (+18.2%)
and a slow down for marine transport (+2.3%).
Table 5.10 - Emissions from international bunkers
1990 1995 2000 2005 2010kp 2015 2020 2030
International Bunkers 8.6 9.8 12.3 16.2 17.0 18.7 20.0 22.2
Aviation 4.2 5.7 8.1 9.2 9.6 10.3 11.1 13.1
Marine 4.4 4.1 4.2 7.0 7.4 8.4 8.9 9.1
Source: ISPRA
5.5.2.3 Civil and agricultural sectors
The next table reports the projections for energy final uses (PJ) in civil and agriculture sectors. The
WM and WAM scenarios projections are reported:
Table 5.11 - Projections of energy for final use in civil sector for WM and WAM scenarios (TJ)
2010 2015 2020 2030
%
2010-2030
Commercial (Tertiary) and agriculture
WM 867.8
872.2 947.2 1,027.4 18.4%
WAM 834.0 849.3 892.0 2.8%
Variation WAM/WM (%)
-4.4% -10.3% -13.2%
Residential WM
1,314.8 1,254.5 1332.1 1,279.0 -2.7%
WAM 1,240.2 1,328.0 1,321.6 0.5%
Variation WAM/WM (%)
-1.1% -0.3% 3.3%
Civil and agriculture sector (total)
WM 2,182.6
2,126.7 2,279.3 2,306.4 5.7%
WAM 2,074.2 2,177.3 2,213.6 1.4%
Variation WAM/WM (%)
-2.5% -4.5% -4.0%
Source: ISPRA
123
The sectors are characterized by the following features:
agriculture: moderate penetration of gas in agricultural sector results in slight decrease of CO2
emissions from energy uses (from 8.1 Mt in 2010kp to 7.3 Mt in 2020 and to 7.1 Mt in 2030);
buildings (residential and tertiary): it is expected a slight yearly increase in the total square
meters of all residential and services buildings. The increase in heating demand will be offset by
the estimated natural gas expansion, by higher electricity penetration, and by the expected
efficiency gains, with a consequent decrease of CO2 emissions (from 80.7 Mt in 2010 to 74.1 Mt
in 2020 and to 64.0 Mt in 2030); the scenario is based on average weather conditions, in case
of cold winter emissions could be much higher, as was the case in 2005.
energy consumptions: the civil and agriculture sector show energy final uses in WAM scenario
4.0% lower than final uses in WM scenario in 2030, essentially due to the reduction of energy
consumption in commercial and agriculture sectors. As concerns residential sector, the
consumption of energy is 2030 in higher for WAM scenario than WM scenario because of
increase of biomass consumption in the former scenario that substitute more efficient natural
gas of WM scenario.
5.6 Emissions from other sectors
In figure 5.6 the emissions of GHGs from non energy sector are reported. As can be seen there is a
sharp emissions reduction between 2005 and 2010. The reduction is due to the effect of (in order of
importance):
implementation on N2O emission control in the adipic acid and nitric acid production;
reduction of emissions from landfills due to increased recovery of methane;
reduction of other process emissions due to a reduction of related industrial production;
increase of recovery of animal wastes for biogas production.
According to the scenario the emissions are projected to further reduction from 2010 up to 2015,
reaching a stable level afterward. The overall trend represents the combination of different evolution
of underlining sectors and gasses, in particular:
a stable trend in emissions for solvent, agriculture and waste sectors;
an increase in industrial process emissions;
a sizeable reduction of emissions of greenhouse gasses other than CO2 from energy use of fossil
fuels between 2010 and 2015, due to technology improvements.
Additionally we underline that there are no differences between WM and WAM scenario emissions in
Industrial processes, Solvent, Agriculture and Waste sector because no additional measures are
actually planned in those sectors. The increase in emissions in industrial processes is connected to a
sizeable increase in use of substitute of ozone depleting substances and, for a minor part, to an
increase of industrial production. For all other sectors the emissions are stable or continue to decline
slightly. Between 2020 and 2030 we observe a similar evolution.
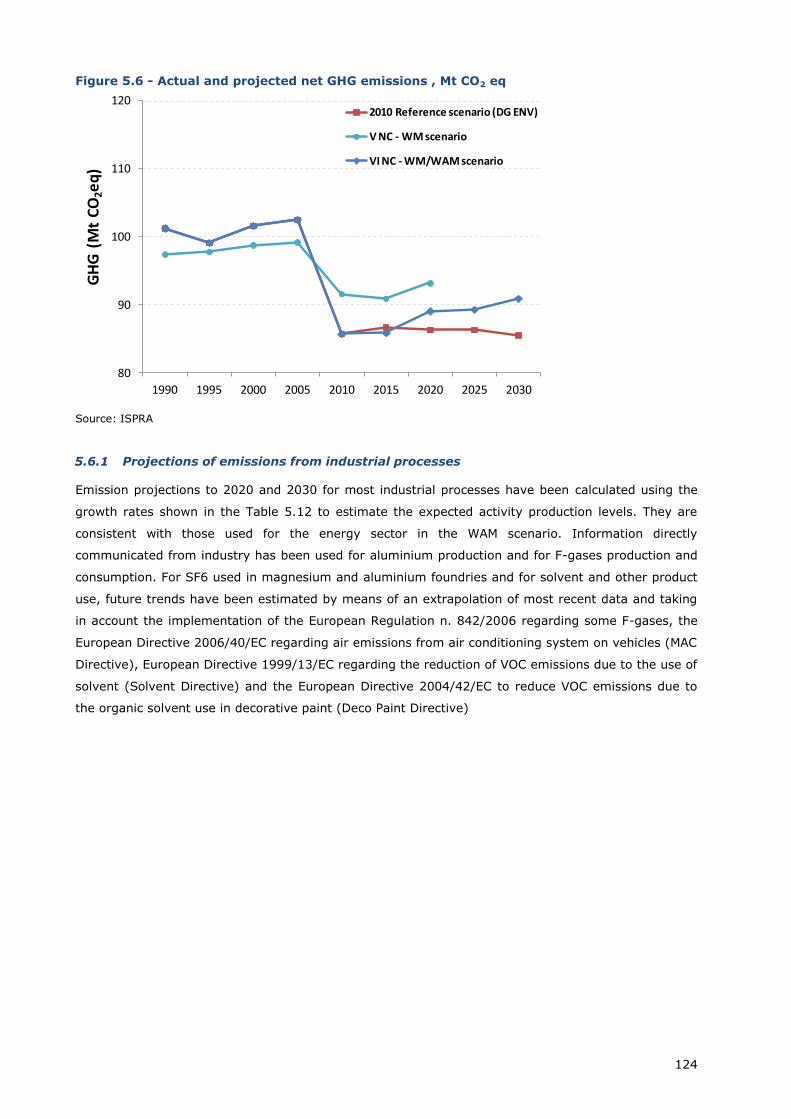
124
Figure 5.6 - Actual and projected net GHG emissions , Mt CO2 eq
Source: ISPRA
5.6.1 Projections of emissions from industrial processes
Emission projections to 2020 and 2030 for most industrial processes have been calculated using the
growth rates shown in the Table 5.12 to estimate the expected activity production levels. They are
consistent with those used for the energy sector in the WAM scenario. Information directly
communicated from industry has been used for aluminium production and for F-gases production and
consumption. For SF6 used in magnesium and aluminium foundries and for solvent and other product
use, future trends have been estimated by means of an extrapolation of most recent data and taking
in account the implementation of the European Regulation n. 842/2006 regarding some F-gases, the
European Directive 2006/40/EC regarding air emissions from air conditioning system on vehicles (MAC
Directive), European Directive 1999/13/EC regarding the reduction of VOC emissions due to the use of
solvent (Solvent Directive) and the European Directive 2004/42/EC to reduce VOC emissions due to
the organic solvent use in decorative paint (Deco Paint Directive)
80
90
100
110
120
1990 1995 2000 2005 2010 2015 2020 2025 2030
2010 Reference scenario (DG ENV)
V NC - WM scenario
VI NC - WM/WAM scenario
GH
G(M
t C
O2e
q)
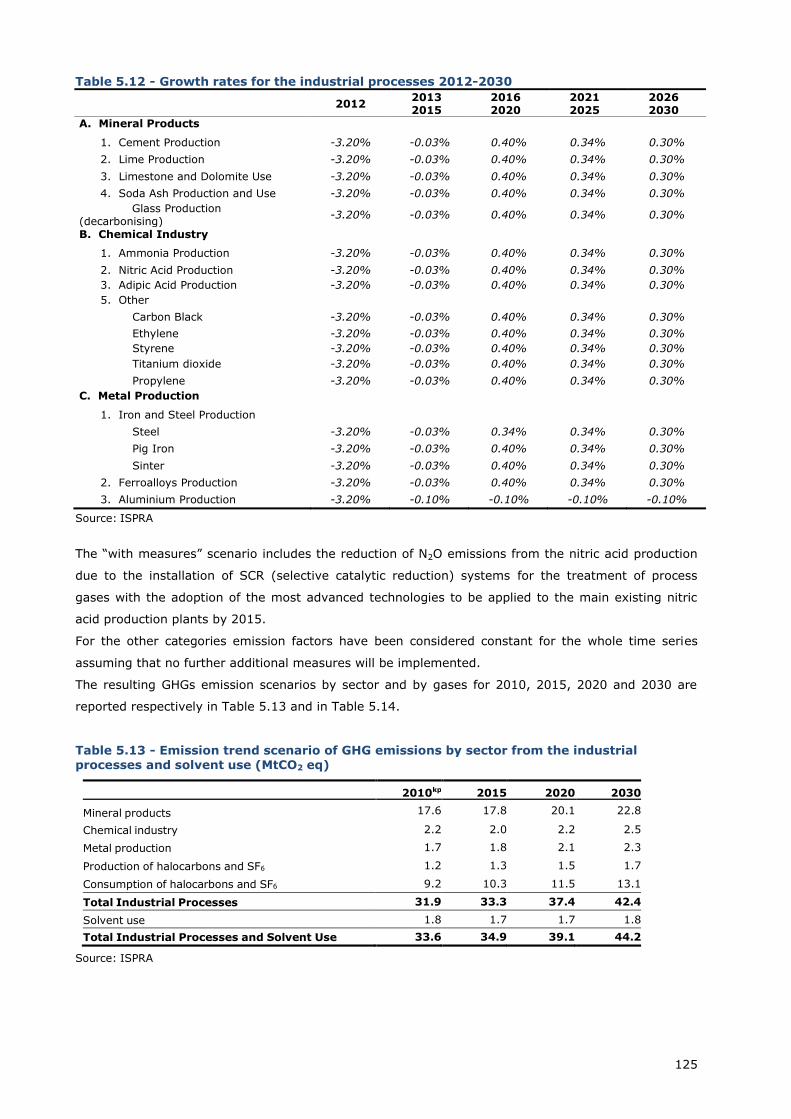
125
Table 5.12 - Growth rates for the industrial processes 2012-2030
2012
2013 2015
2016 2020
2021 2025
2026 2030
A. Mineral Products
1. Cement Production -3.20% -0.03% 0.40% 0.34% 0.30%
2. Lime Production -3.20% -0.03% 0.40% 0.34% 0.30%
3. Limestone and Dolomite Use -3.20% -0.03% 0.40% 0.34% 0.30%
4. Soda Ash Production and Use -3.20% -0.03% 0.40% 0.34% 0.30%
Glass Production (decarbonising)
-3.20% -0.03% 0.40% 0.34% 0.30%
B. Chemical Industry
1. Ammonia Production -3.20% -0.03% 0.40% 0.34% 0.30%
2. Nitric Acid Production -3.20% -0.03% 0.40% 0.34% 0.30%
3. Adipic Acid Production -3.20% -0.03% 0.40% 0.34% 0.30%
5. Other
Carbon Black -3.20% -0.03% 0.40% 0.34% 0.30%
Ethylene -3.20% -0.03% 0.40% 0.34% 0.30%
Styrene -3.20% -0.03% 0.40% 0.34% 0.30%
Titanium dioxide -3.20% -0.03% 0.40% 0.34% 0.30%
Propylene -3.20% -0.03% 0.40% 0.34% 0.30%
C. Metal Production
1. Iron and Steel Production
Steel -3.20% -0.03% 0.34% 0.34% 0.30%
Pig Iron -3.20% -0.03% 0.40% 0.34% 0.30%
Sinter -3.20% -0.03% 0.40% 0.34% 0.30%
2. Ferroalloys Production -3.20% -0.03% 0.40% 0.34% 0.30%
3. Aluminium Production -3.20% -0.10% -0.10% -0.10% -0.10%
Source: ISPRA
The “with measures” scenario includes the reduction of N2O emissions from the nitric acid production
due to the installation of SCR (selective catalytic reduction) systems for the treatment of process
gases with the adoption of the most advanced technologies to be applied to the main existing nitric
acid production plants by 2015.
For the other categories emission factors have been considered constant for the whole time series
assuming that no further additional measures will be implemented.
The resulting GHGs emission scenarios by sector and by gases for 2010, 2015, 2020 and 2030 are
reported respectively in Table 5.13 and in Table 5.14.
Table 5.13 - Emission trend scenario of GHG emissions by sector from the industrial processes and solvent use (MtCO2 eq)
2010kp 2015 2020 2030
Mineral products 17.6 17.8 20.1 22.8
Chemical industry 2.2 2.0 2.2 2.5
Metal production 1.7 1.8 2.1 2.3
Production of halocarbons and SF6 1.2 1.3 1.5 1.7
Consumption of halocarbons and SF6 9.2 10.3 11.5 13.1
Total Industrial Processes 31.9 33.3 37.4 42.4
Solvent use 1.8 1.7 1.7 1.8
Total Industrial Processes and Solvent Use 33.6 34.9 39.1 44.2
Source: ISPRA
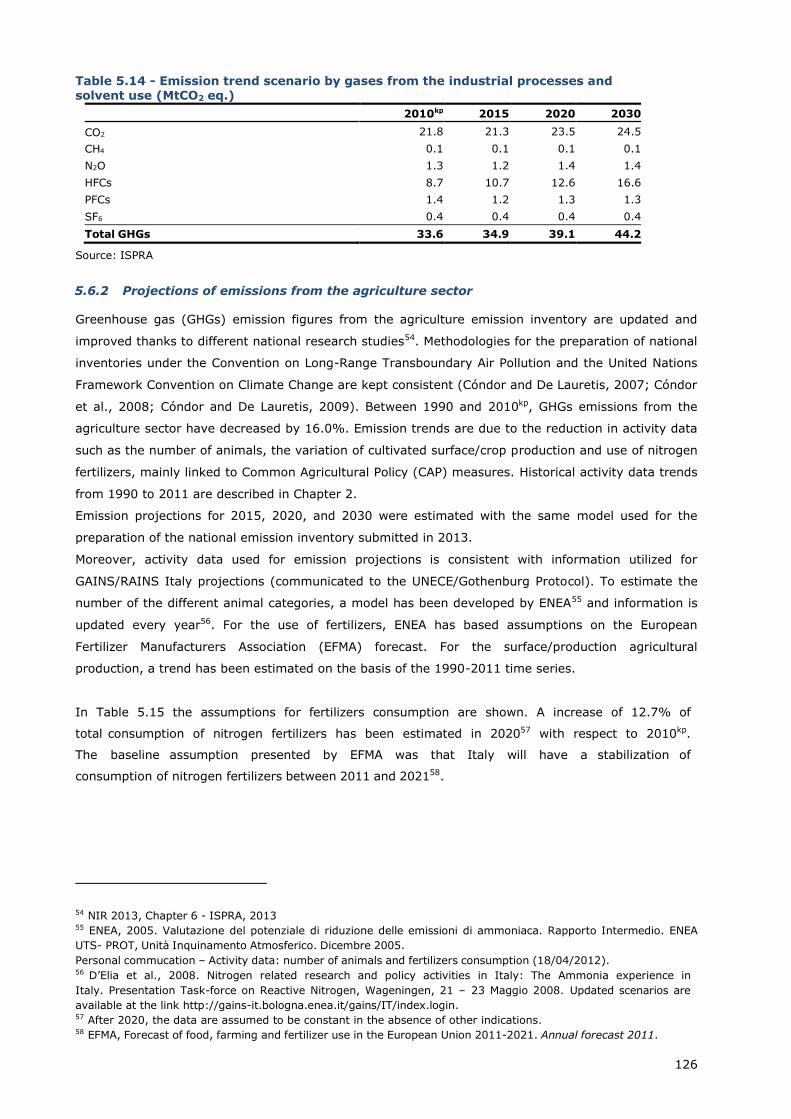
126
Table 5.14 - Emission trend scenario by gases from the industrial processes and solvent use (MtCO2 eq.)
2010kp 2015 2020 2030
CO2 21.8 21.3 23.5 24.5
CH4 0.1 0.1 0.1 0.1
N2O 1.3 1.2 1.4 1.4
HFCs 8.7 10.7 12.6 16.6
PFCs 1.4 1.2 1.3 1.3
SF6 0.4 0.4 0.4 0.4
Total GHGs 33.6 34.9 39.1 44.2
Source: ISPRA
5.6.2 Projections of emissions from the agriculture sector
Greenhouse gas (GHGs) emission figures from the agriculture emission inventory are updated and
improved thanks to different national research studies54. Methodologies for the preparation of national
inventories under the Convention on Long-Range Transboundary Air Pollution and the United Nations
Framework Convention on Climate Change are kept consistent (Cóndor and De Lauretis, 2007; Cóndor
et al., 2008; Cóndor and De Lauretis, 2009). Between 1990 and 2010kp, GHGs emissions from the
agriculture sector have decreased by 16.0%. Emission trends are due to the reduction in activity data
such as the number of animals, the variation of cultivated surface/crop production and use of nitrogen
fertilizers, mainly linked to Common Agricultural Policy (CAP) measures. Historical activity data trends
from 1990 to 2011 are described in Chapter 2.
Emission projections for 2015, 2020, and 2030 were estimated with the same model used for the
preparation of the national emission inventory submitted in 2013.
Moreover, activity data used for emission projections is consistent with information utilized for
GAINS/RAINS Italy projections (communicated to the UNECE/Gothenburg Protocol). To estimate the
number of the different animal categories, a model has been developed by ENEA55 and information is
updated every year56. For the use of fertilizers, ENEA has based assumptions on the European
Fertilizer Manufacturers Association (EFMA) forecast. For the surface/production agricultural
production, a trend has been estimated on the basis of the 1990-2011 time series.
In Table 5.15 the assumptions for fertilizers consumption are shown. A increase of 12.7% of
total consumption of nitrogen fertilizers has been estimated in 202057 with respect to 2010kp.
The baseline assumption presented by EFMA was that Italy will have a stabilization of
consumption of nitrogen fertilizers between 2011 and 202158.
54 NIR 2013, Chapter 6 - ISPRA, 2013 55 ENEA, 2005. Valutazione del potenziale di riduzione delle emissioni di ammoniaca. Rapporto Intermedio. ENEA
UTS- PROT, Unità Inquinamento Atmosferico. Dicembre 2005.
Personal commucation – Activity data: number of animals and fertilizers consumption (18/04/2012). 56 D’Elia et al., 2008. Nitrogen related research and policy activities in Italy: The Ammonia experience in
Italy. Presentation Task-force on Reactive Nitrogen, Wageningen, 21 – 23 Maggio 2008. Updated scenarios are
available at the link http://gains-it.bologna.enea.it/gains/IT/index.login. 57 After 2020, the data are assumed to be constant in the absence of other indications. 58 EFMA, Forecast of food, farming and fertilizer use in the European Union 2011-2021. Annual forecast 2011.
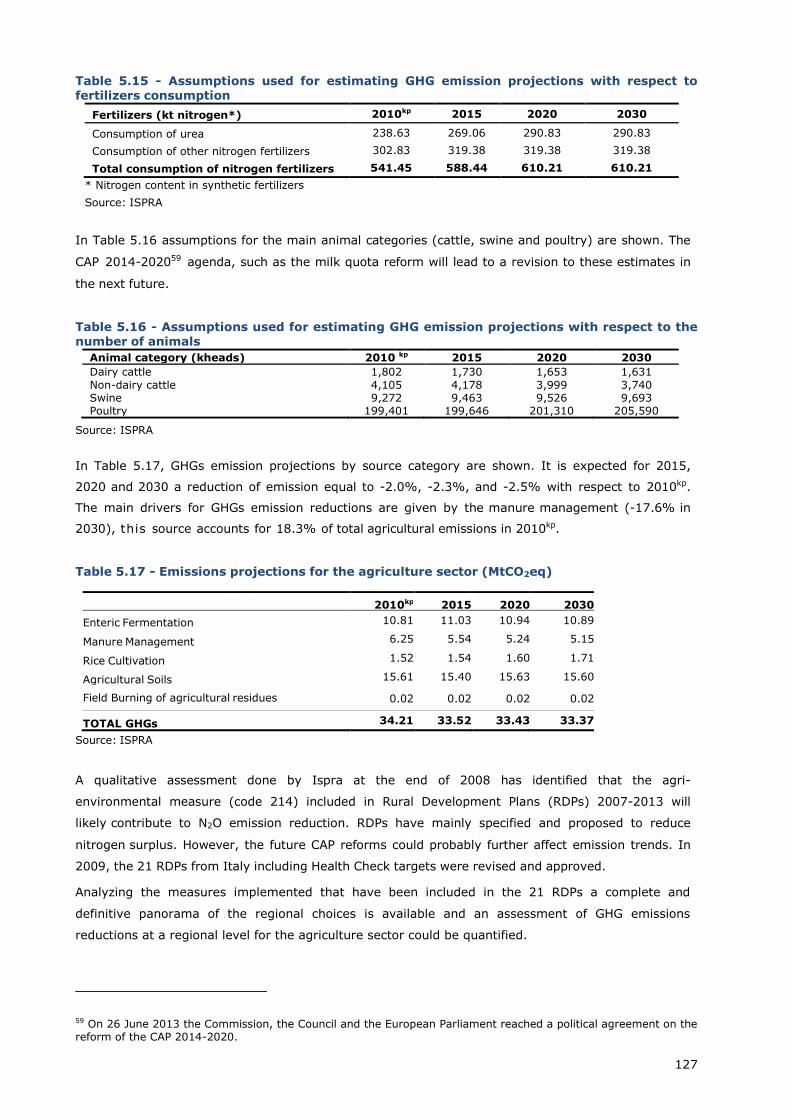
127
Table 5.15 - Assumptions used for estimating GHG emission projections with respect to fertilizers consumption
Fertilizers (kt nitrogen*) 2010kp 2015 2020 2030
Consumption of urea 238.63 269.06 290.83 290.83
Consumption of other nitrogen fertilizers 302.83 319.38 319.38 319.38
Total consumption of nitrogen fertilizers 541.45 588.44 610.21 610.21
* Nitrogen content in synthetic fertilizers
Source: ISPRA
In Table 5.16 assumptions for the main animal categories (cattle, swine and poultry) are shown. The
CAP 2014-202059 agenda, such as the milk quota reform will lead to a revision to these estimates in
the next future.
Table 5.16 - Assumptions used for estimating GHG emission projections with respect to the number of animals
Animal category (kheads) 2010 kp 2015 2020 2030
Dairy cattle 1,802 1,730 1,653 1,631
Non-dairy cattle 4,105 4,178 3,999 3,740 Swine 9,272 9,463 9,526 9,693 Poultry 199,401 199,646 201,310 205,590
Source: ISPRA
In Table 5.17, GHGs emission projections by source category are shown. It is expected for 2015,
2020 and 2030 a reduction of emission equal to -2.0%, -2.3%, and -2.5% with respect to 2010kp.
The main drivers for GHGs emission reductions are given by the manure management (-17.6% in
2030), this source accounts for 18.3% of total agricultural emissions in 2010kp.
Table 5.17 - Emissions projections for the agriculture sector (MtCO2eq)
2010kp 2015 2020 2030
Enteric Fermentation 10.81 11.03 10.94 10.89
Manure Management 6.25 5.54 5.24 5.15
Rice Cultivation 1.52 1.54 1.60 1.71
Agricultural Soils 15.61 15.40 15.63 15.60
Field Burning of agricultural residues 0.02 0.02 0.02 0.02
TOTAL GHGs 34.21 33.52 33.43 33.37
Source: ISPRA
A qualitative assessment done by Ispra at the end of 2008 has identified that the agri-
environmental measure (code 214) included in Rural Development Plans (RDPs) 2007-2013 will
likely contribute to N2O emission reduction. RDPs have mainly specified and proposed to reduce
nitrogen surplus. However, the future CAP reforms could probably further affect emission trends. In
2009, the 21 RDPs from Italy including Health Check targets were revised and approved.
Analyzing the measures implemented that have been included in the 21 RDPs a complete and
definitive panorama of the regional choices is available and an assessment of GHG emissions
reductions at a regional level for the agriculture sector could be quantified.
59 On 26 June 2013 the Commission, the Council and the European Parliament reached a political agreement on the reform of the CAP 2014-2020.
128
5.6.3 Projections of emissions from the LULUCF sector
The driving forces for projections estimations are activity data linked to the LULUCF sector; in
particular, given the decision about the elected activities under Article 3.4 of Kyoto Protocol, “Forest
Land” activity data constitute the key variables to project removals by sinks.
Key drivers have been identified in:
• forest management: assessment of forest area for the period 2011-2020 was made through
data extrapolation, starting from the consolidated time series 1990-2011.
• afforestation/reforestation: area has been defined following the positive trend individuated in
the period 1990-2011.
• harvested area, burned area by forest fires: data extrapolation was made, from the available
time series.
For a conservative assessment of annual accountable credits from LULUCF sector, in the first
commitment period, we refer to the assigned cap of 10.2 MtCO2 under art. 3.4.
5.6.4 Projections of emissions from the waste sector
The following projections have been prepared in conformity with most recent inventories and
evaluations on the implementation of the mitigation measures. The driving forces for projections
estimations are especially activity data linked to the whole waste sector and the reduction of
biodegradable waste in landfills. In particular, the municipal waste cycle has been studied, analyzing
its evolution trough the years on the basis of actions that have already been put into effect.
In the reference scenario the total amount of waste has been estimated on the basis of official
population forecasts provided by the National Institute of Statistics (ISTAT) and on the assumption of
a 1.4% annual increase of the waste production until 2020 and a 1.2% annual increase from 2020 to
2030 (European Topic Centre on Resource and waste Management – Environmental Outlooks:
Municipal Waste). Starting from the production, waste fluxes have been analyzed on the basis of the
following waste management options: recycling, landfilling, incineration, mechanical biological
treatments and composting.
Focusing on recycling and not only, national circumstances are very different from northern to
southern regions. The southern regions are late with the complying of national targets for separate
collection, whereas some northern cities have already reached and exceeded the fixed target. Despite
in 2011 the percentage of waste separation is 37.7%, efforts of the government in the improvement
of waste management lead to an optimistic outlook of the fulfilment of the deadlines set up by the
current legislation.
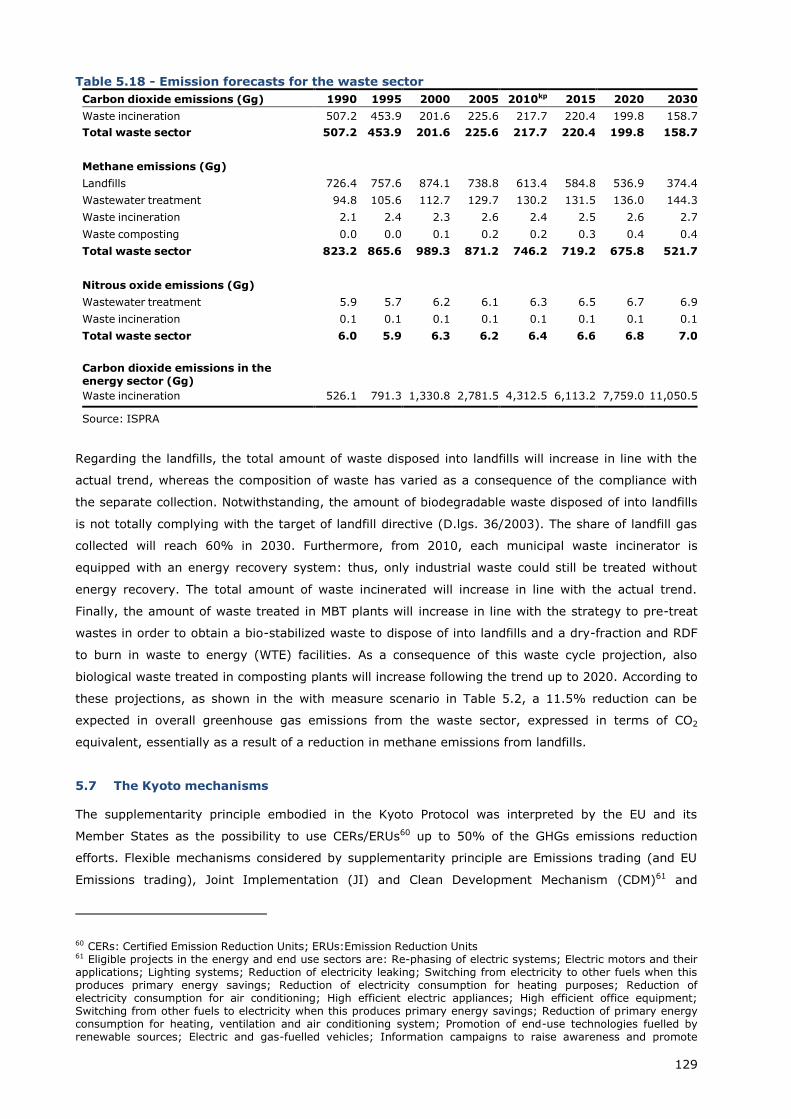
129
Table 5.18 - Emission forecasts for the waste sector
Carbon dioxide emissions (Gg) 1990 1995 2000 2005 2010kp 2015 2020 2030
Waste incineration 507.2 453.9 201.6 225.6 217.7 220.4 199.8 158.7
Total waste sector 507.2 453.9 201.6 225.6 217.7 220.4 199.8 158.7
Methane emissions (Gg)
Landfills 726.4 757.6 874.1 738.8 613.4 584.8 536.9 374.4
Wastewater treatment 94.8 105.6 112.7 129.7 130.2 131.5 136.0 144.3
Waste incineration 2.1 2.4 2.3 2.6 2.4 2.5 2.6 2.7
Waste composting 0.0 0.0 0.1 0.2 0.2 0.3 0.4 0.4
Total waste sector 823.2 865.6 989.3 871.2 746.2 719.2 675.8 521.7
Nitrous oxide emissions (Gg)
Wastewater treatment 5.9 5.7 6.2 6.1 6.3 6.5 6.7 6.9
Waste incineration 0.1 0.1 0.1 0.1 0.1 0.1 0.1 0.1
Total waste sector 6.0 5.9 6.3 6.2 6.4 6.6 6.8 7.0
Carbon dioxide emissions in the energy sector (Gg)
Waste incineration 526.1 791.3 1,330.8 2,781.5 4,312.5
6,113.2 7,759.0 11,050.5
Source: ISPRA
Regarding the landfills, the total amount of waste disposed into landfills will increase in line with the
actual trend, whereas the composition of waste has varied as a consequence of the compliance with
the separate collection. Notwithstanding, the amount of biodegradable waste disposed of into landfills
is not totally complying with the target of landfill directive (D.lgs. 36/2003). The share of landfill gas
collected will reach 60% in 2030. Furthermore, from 2010, each municipal waste incinerator is
equipped with an energy recovery system: thus, only industrial waste could still be treated without
energy recovery. The total amount of waste incinerated will increase in line with the actual trend.
Finally, the amount of waste treated in MBT plants will increase in line with the strategy to pre-treat
wastes in order to obtain a bio-stabilized waste to dispose of into landfills and a dry-fraction and RDF
to burn in waste to energy (WTE) facilities. As a consequence of this waste cycle projection, also
biological waste treated in composting plants will increase following the trend up to 2020. According to
these projections, as shown in the with measure scenario in Table 5.2, a 11.5% reduction can be
expected in overall greenhouse gas emissions from the waste sector, expressed in terms of CO2
equivalent, essentially as a result of a reduction in methane emissions from landfills.
5.7 The Kyoto mechanisms
The supplementarity principle embodied in the Kyoto Protocol was interpreted by the EU and its
Member States as the possibility to use CERs/ERUs60 up to 50% of the GHGs emissions reduction
efforts. Flexible mechanisms considered by supplementarity principle are Emissions trading (and EU
Emissions trading), Joint Implementation (JI) and Clean Development Mechanism (CDM)61 and
60 CERs: Certified Emission Reduction Units; ERUs:Emission Reduction Units 61 Eligible projects in the energy and end use sectors are: Re-phasing of electric systems; Electric motors and their applications; Lighting systems; Reduction of electricity leaking; Switching from electricity to other fuels when this produces primary energy savings; Reduction of electricity consumption for heating purposes; Reduction of electricity consumption for air conditioning; High efficient electric appliances; High efficient office equipment; Switching from other fuels to electricity when this produces primary energy savings; Reduction of primary energy consumption for heating, ventilation and air conditioning system; Promotion of end-use technologies fuelled by renewable sources; Electric and gas-fuelled vehicles; Information campaigns to raise awareness and promote
130
LULUCF. For more details see chapter 4 on policies and measures and paragraph 5.9 for Kyoto period,
see paragraph 5.10 for post Kyoto period.
5.8 Energy scenarios and effects of policies and measures
5.8.1 Formulation of new scenarios – methodology
The scenarios of greenhouse gas emissions from the combustion of energy sources are drawn from
the Markal – Italy model, based on the well known Markal software. The scenario used for this
submission is an update of the latest reviewed output of the model available, published by ENEA in
200962. The update consist in the use of 2011 final data and 2012 provisional energy consumption
data as an additional input to the model, with the objective to improve reliability of its results. This
published research scenario has been adapted for the NC considering the government policies aiming
to keep stable industrial production levels.
The model is a partial equilibrium model and represents the domestic energy system and its main
emissions. It contains over 70 independent demands for energy services in four main sectors –
agriculture, industry, transport, commercial and household – split by sub sectors, type of service and
material. For instance the industrial sector is split in the following sub sectors: iron and steel, non
ferrous, bricks and tiles, chemical, paper, mechanical, textile, building, and others. The demand for
space heating is expressed in square meters of new or existing households, single or multi-family,
central or small boilers, at different level of insulation. Demand and supply curves of each commodity
are specified stepwise by set of technologies, for a total of over one thousand. Import and export
options are include in most demand / supply curves. Emissions of CO2 are directly accounted for using
IPCC “reference approach” methodology and national Emission Factors.
The basic year of the energy model is 2010, the latest update has modified the 2011 results on the
basis of the 2011 actual data and 2012 provisional data, and modelled years go up to 2050. The
model follows a bottom-up technological approach: starts from a single sector, or sub-sector, and
identifies the derivative aggregate data. This approach yields greater accuracy and details compared
to the top-down approach, where sector variables are derived from a macro-variable (i.e. Gross
Domestic Product).
Structure and data of the full model, including the very detailed parts on end use devices that satisfy
the 70 demands for energy services are summarized in [Contaldi, Gracceva, 2004]. Below some
additional details are reported for the two most important sectors from the GHGs emissions trend
point of view:
Transport: modelling is based on detailed demand growth, which accounts for both goods and
passenger transport. All modes are included, road, railway, air and water. With regard to road,
the modelling of the Italian car fleet (petrol, diesel, gas-powered cars), 2–wheelers, heavy
vehicles and busses is provided. The analysis also considers such variables as passengers-km,
tons-km, mileage, occupancy rates and unit consumptions (litres-km).
Energy supply: the technologies represent all fossil fuels power plants in operation in 2010. In
the following periods, when existing power plants gradually go out of service, the growing
demand is met by copies of the main existing technologies or more efficient combined cycles,
energy savings. 62 ENEA – 2009, Rapporto energia e ambiente 2008, analisi e scenari
131
integrated coal gasification, fluid bed cycles, fuel cells, CHP plants or renewable power plants
(geothermal, wind, PV, hydro run of the river, mini hydro, solid waste, biogas and biomass).
CO2 sequestration and nuclear power plants are modeled, but not active up to 2020.
5.8.2 With additional measure scenario, main variables and energy consumptions
The WAM scenario underlying the emission projections described in this chapter is the SEN scenario as
reported in the paragraph 5.1.
The scenario takes into account the effects of the ongoing economic crisis that hit all national activities
and the evolution trend is based on planned recovery from the economic crisis and development of
low carbon technologies, mainly for the electricity generation sector. It comes in particular from
certain assumptions relating to social, demographic and economic circumstances of the country,
assumptions used to determine the evolution of the demand for energy services, which is the basis of
the scenarios. The main driving variables used for projections of demand for energy services, in the
end-use sectors, are:
for industry: economic growth and industrial production (at sub sector);
for tertiary: added value (of three major sub-sectors);
for residential: demographic trends of the system (primarily the population and the number of
households), some assumptions on the expected evolution of demand characteristics, the
expansion of number appliances per household and the growing demand for summer cooling;
for the electricity generation: continuation of the ongoing growth of renewable sources;
for the transport: dynamics of active population (along with assumptions about mobility per
capita) and the growth of national products (especially for transporting goods).
The actual demand development of energy services changes according also to energy prices
established on different energy markets.
5.8.3 Energy prices and national production
Up to 2030 an increase of energy costs is expected. Average global electricity prices increase by 15%
to 2035 in real terms, driven by higher fossil fuel costs, a shift to more capital-intensive generating
capacity, subsidies to renewable sources and CO2 pricing in some countries.63
The recent National Energy Strategy planned to boost the national oil and natural gas production of
gas, pushing the share of domestic production from 7% to 14% up to 2020. A strategy to diversify the
access points of fossil resources is planned (mainly with new regasification plants of LNG and gas
pipeline). Moreover a plan for reduction of energy consumption and evolution of the mix towards
renewable sources is scheduled. The goals of planned measures are the costs reduction and
compliance of energy prices to the European levels.
5.8.4 Technologies for electricity generation
The choice of electric generation technologies is driven by the minimization of costs, but also taking
into account the constraints local environmental and/or national (partially internalized in the model as
additional costs). The new generating capacity built in the coming years will be made primarily by
63 IEA, World Energy Outlook, 2012.
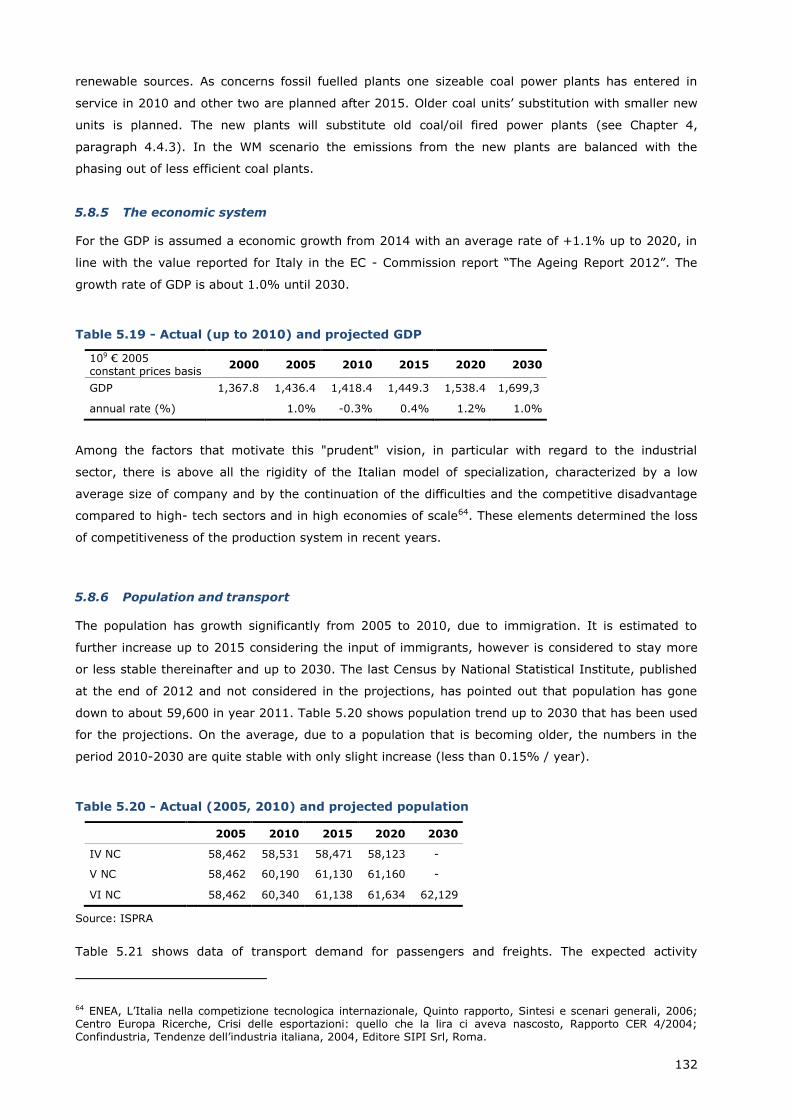
132
renewable sources. As concerns fossil fuelled plants one sizeable coal power plants has entered in
service in 2010 and other two are planned after 2015. Older coal units’ substitution with smaller new
units is planned. The new plants will substitute old coal/oil fired power plants (see Chapter 4,
paragraph 4.4.3). In the WM scenario the emissions from the new plants are balanced with the
phasing out of less efficient coal plants.
5.8.5 The economic system
For the GDP is assumed a economic growth from 2014 with an average rate of +1.1% up to 2020, in
line with the value reported for Italy in the EC - Commission report “The Ageing Report 2012”. The
growth rate of GDP is about 1.0% until 2030.
Table 5.19 - Actual (up to 2010) and projected GDP
109 € 2005 constant prices basis
2000 2005 2010 2015 2020 2030
GDP 1,367.8 1,436.4 1,418.4 1,449.3 1,538.4 1,699,3
annual rate (%) 1.0% -0.3% 0.4% 1.2% 1.0%
Among the factors that motivate this "prudent" vision, in particular with regard to the industrial
sector, there is above all the rigidity of the Italian model of specialization, characterized by a low
average size of company and by the continuation of the difficulties and the competitive disadvantage
compared to high- tech sectors and in high economies of scale64. These elements determined the loss
of competitiveness of the production system in recent years.
5.8.6 Population and transport
The population has growth significantly from 2005 to 2010, due to immigration. It is estimated to
further increase up to 2015 considering the input of immigrants, however is considered to stay more
or less stable thereinafter and up to 2030. The last Census by National Statistical Institute, published
at the end of 2012 and not considered in the projections, has pointed out that population has gone
down to about 59,600 in year 2011. Table 5.20 shows population trend up to 2030 that has been used
for the projections. On the average, due to a population that is becoming older, the numbers in the
period 2010-2030 are quite stable with only slight increase (less than 0.15% / year).
Table 5.20 - Actual (2005, 2010) and projected population
2005 2010 2015 2020 2030
IV NC
58,462 58,531 58,471 58,123 -
V NC
58,462 60,190 61,130 61,160 -
VI NC
58,462 60,340 61,138 61,634 62,129
Source: ISPRA
Table 5.21 shows data of transport demand for passengers and freights. The expected activity
64 ENEA, L’Italia nella competizione tecnologica internazionale, Quinto rapporto, Sintesi e scenari generali, 2006; Centro Europa Ricerche, Crisi delle esportazioni: quello che la lira ci aveva nascosto, Rapporto CER 4/2004; Confindustria, Tendenze dell’industria italiana, 2004, Editore SIPI Srl, Roma.
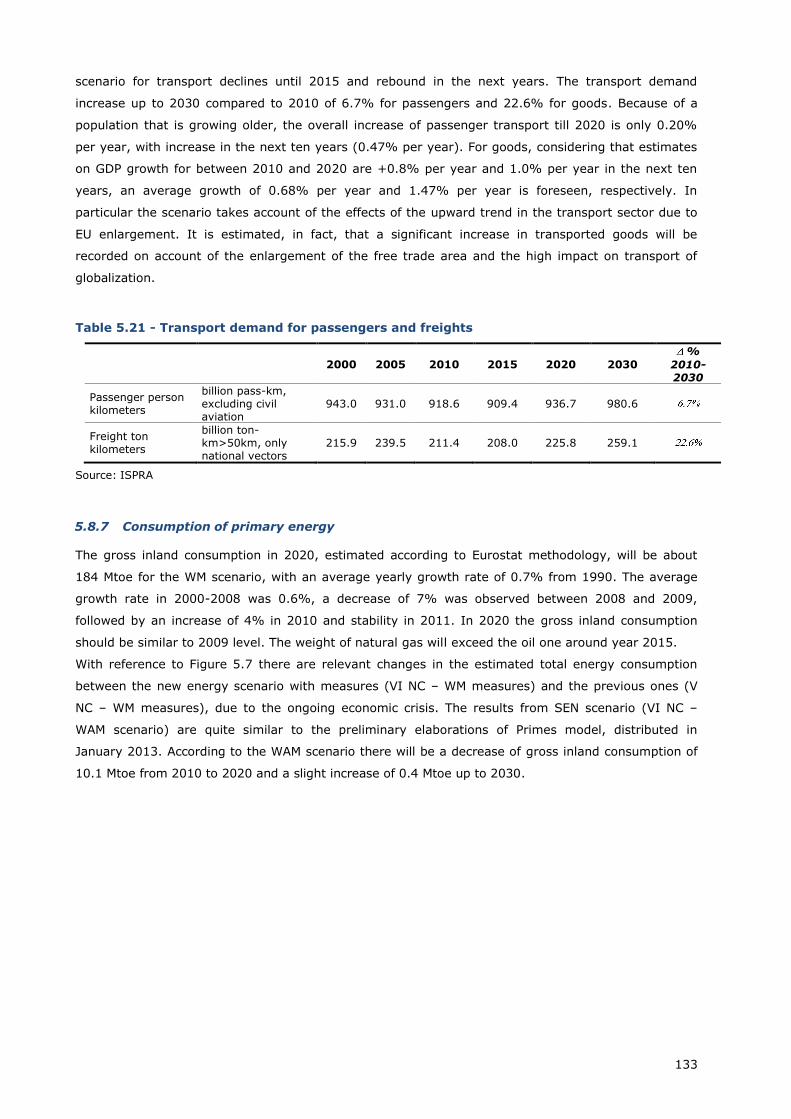
133
scenario for transport declines until 2015 and rebound in the next years. The transport demand
increase up to 2030 compared to 2010 of 6.7% for passengers and 22.6% for goods. Because of a
population that is growing older, the overall increase of passenger transport till 2020 is only 0.20%
per year, with increase in the next ten years (0.47% per year). For goods, considering that estimates
on GDP growth for between 2010 and 2020 are +0.8% per year and 1.0% per year in the next ten
years, an average growth of 0.68% per year and 1.47% per year is foreseen, respectively. In
particular the scenario takes account of the effects of the upward trend in the transport sector due to
EU enlargement. It is estimated, in fact, that a significant increase in transported goods will be
recorded on account of the enlargement of the free trade area and the high impact on transport of
globalization.
Table 5.21 - Transport demand for passengers and freights
2000 2005 2010 2015 2020 2030
%
2010-2030
Passenger person kilometers
billion pass-km, excluding civil aviation
943.0 931.0 918.6 909.4 936.7 980.6
Freight ton kilometers
billion ton-km>50km, only national vectors
215.9 239.5 211.4 208.0 225.8 259.1
Source: ISPRA
5.8.7 Consumption of primary energy
The gross inland consumption in 2020, estimated according to Eurostat methodology, will be about
184 Mtoe for the WM scenario, with an average yearly growth rate of 0.7% from 1990. The average
growth rate in 2000-2008 was 0.6%, a decrease of 7% was observed between 2008 and 2009,
followed by an increase of 4% in 2010 and stability in 2011. In 2020 the gross inland consumption
should be similar to 2009 level. The weight of natural gas will exceed the oil one around year 2015.
With reference to Figure 5.7 there are relevant changes in the estimated total energy consumption
between the new energy scenario with measures (VI NC – WM measures) and the previous ones (V
NC – WM measures), due to the ongoing economic crisis. The results from SEN scenario (VI NC –
WAM scenario) are quite similar to the preliminary elaborations of Primes model, distributed in
January 2013. According to the WAM scenario there will be a decrease of gross inland consumption of
10.1 Mtoe from 2010 to 2020 and a slight increase of 0.4 Mtoe up to 2030.
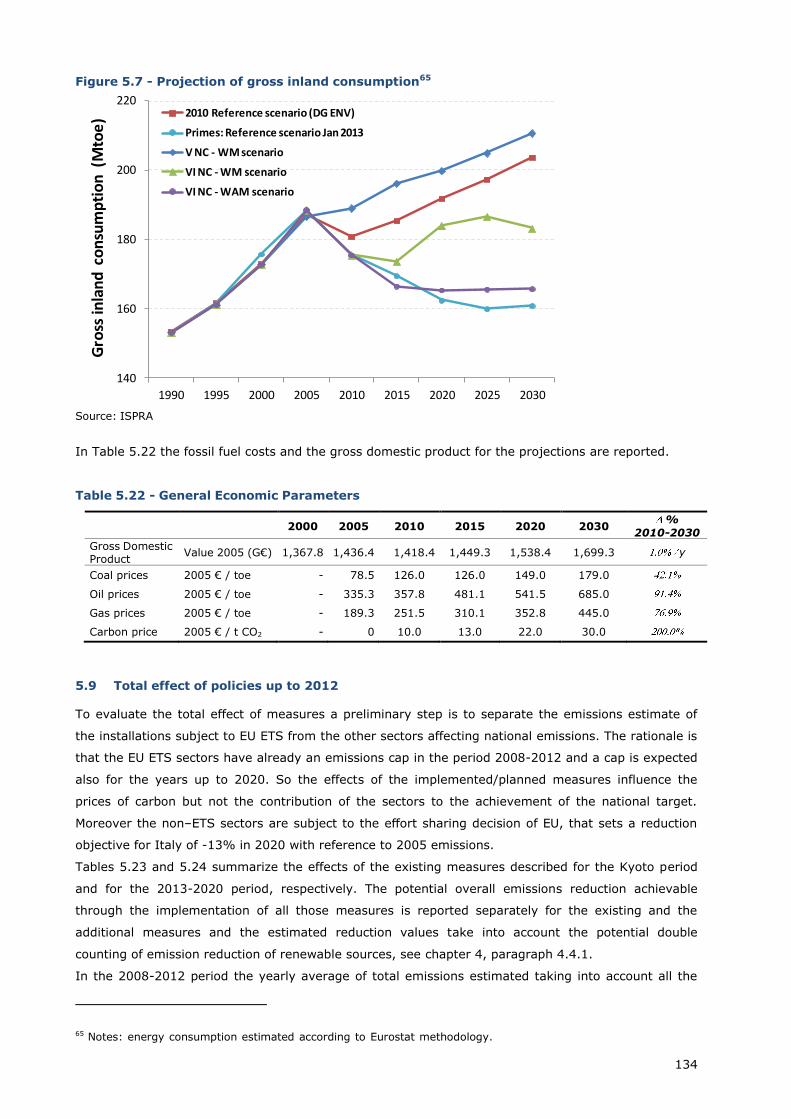
134
Figure 5.7 - Projection of gross inland consumption65
Source: ISPRA
In Table 5.22 the fossil fuel costs and the gross domestic product for the projections are reported.
Table 5.22 - General Economic Parameters
2000 2005 2010 2015 2020 2030 %
2010-2030
Gross Domestic Product
Value 2005 (G€) 1,367.8 1,436.4 1,418.4 1,449.3 1,538.4 1,699.3 y
Coal prices 2005 € / toe - 78.5 126.0 126.0 149.0 179.0
Oil prices 2005 € / toe - 335.3 357.8 481.1 541.5 685.0
Gas prices 2005 € / toe - 189.3 251.5 310.1 352.8 445.0
Carbon price 2005 € / t CO2 - 0 10.0 13.0 22.0 30.0
5.9 Total effect of policies up to 2012
To evaluate the total effect of measures a preliminary step is to separate the emissions estimate of
the installations subject to EU ETS from the other sectors affecting national emissions. The rationale is
that the EU ETS sectors have already an emissions cap in the period 2008-2012 and a cap is expected
also for the years up to 2020. So the effects of the implemented/planned measures influence the
prices of carbon but not the contribution of the sectors to the achievement of the national target.
Moreover the non–ETS sectors are subject to the effort sharing decision of EU, that sets a reduction
objective for Italy of -13% in 2020 with reference to 2005 emissions.
Tables 5.23 and 5.24 summarize the effects of the existing measures described for the Kyoto period
and for the 2013-2020 period, respectively. The potential overall emissions reduction achievable
through the implementation of all those measures is reported separately for the existing and the
additional measures and the estimated reduction values take into account the potential double
counting of emission reduction of renewable sources, see chapter 4, paragraph 4.4.1.
In the 2008-2012 period the yearly average of total emissions estimated taking into account all the
65 Notes: energy consumption estimated according to Eurostat methodology.
140
160
180
200
220
1990 1995 2000 2005 2010 2015 2020 2025 2030
2010 Reference scenario (DG ENV)
Primes: Reference scenario Jan 2013
V NC - WM scenario
VI NC - WM scenario
VI NC - WAM scenario
Gro
ss in
lan
d c
on
sum
pti
on
(M
toe
)
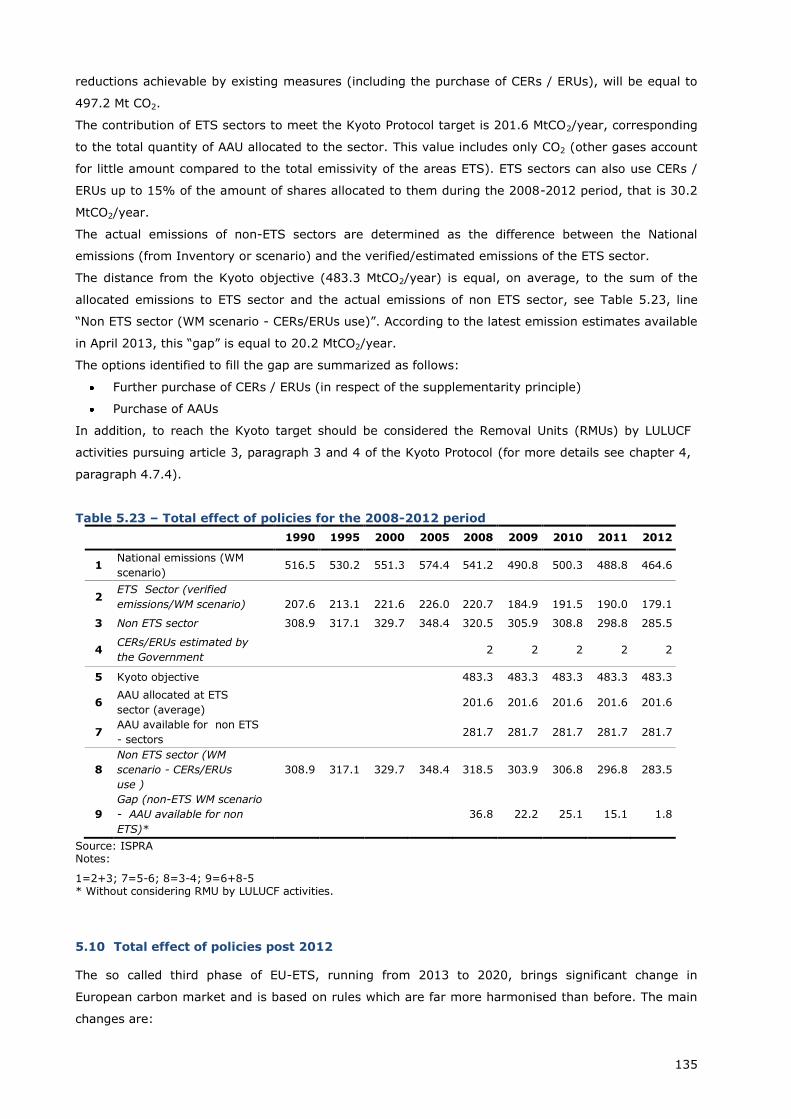
135
reductions achievable by existing measures (including the purchase of CERs / ERUs), will be equal to
497.2 Mt CO2.
The contribution of ETS sectors to meet the Kyoto Protocol target is 201.6 MtCO2/year, corresponding
to the total quantity of AAU allocated to the sector. This value includes only CO2 (other gases account
for little amount compared to the total emissivity of the areas ETS). ETS sectors can also use CERs /
ERUs up to 15% of the amount of shares allocated to them during the 2008-2012 period, that is 30.2
MtCO2/year.
The actual emissions of non-ETS sectors are determined as the difference between the National
emissions (from Inventory or scenario) and the verified/estimated emissions of the ETS sector.
The distance from the Kyoto objective (483.3 MtCO2/year) is equal, on average, to the sum of the
allocated emissions to ETS sector and the actual emissions of non ETS sector, see Table 5.23, line
“Non ETS sector (WM scenario - CERs/ERUs use)”. According to the latest emission estimates available
in April 2013, this “gap” is equal to 20.2 MtCO2/year.
The options identified to fill the gap are summarized as follows:
Further purchase of CERs / ERUs (in respect of the supplementarity principle)
Purchase of AAUs
In addition, to reach the Kyoto target should be considered the Removal Units (RMUs) by LULUCF
activities pursuing article 3, paragraph 3 and 4 of the Kyoto Protocol (for more details see chapter 4,
paragraph 4.7.4).
Table 5.23 – Total effect of policies for the 2008-2012 period
1990 1995 2000 2005 2008 2009 2010 2011 2012
1 National emissions (WM
scenario) 516.5 530.2 551.3 574.4 541.2 490.8 500.3 488.8 464.6
2 ETS Sector (verified
emissions/WM scenario)
207.6
213.1
221.6
226.0
220.7
184.9
191.5
190.0
179.1
3 Non ETS sector 308.9 317.1 329.7 348.4 320.5 305.9 308.8 298.8 285.5
4 CERs/ERUs estimated by
the Government 2 2 2 2 2
5 Kyoto objective
483.3 483.3 483.3 483.3 483.3
6 AAU allocated at ETS
sector (average) 201.6 201.6 201.6 201.6 201.6
7 AAU available for non ETS
- sectors 281.7 281.7 281.7 281.7 281.7
8
Non ETS sector (WM
scenario - CERs/ERUs
use )
308.9 317.1 329.7 348.4 318.5 303.9 306.8 296.8 283.5
9
Gap (non-ETS WM scenario
- AAU available for non
ETS)*
36.8 22.2 25.1 15.1 1.8
Source: ISPRA Notes:
1=2+3; 7=5-6; 8=3-4; 9=6+8-5 * Without considering RMU by LULUCF activities.
5.10 Total effect of policies post 2012
The so called third phase of EU-ETS, running from 2013 to 2020, brings significant change in
European carbon market and is based on rules which are far more harmonised than before. The main
changes are:
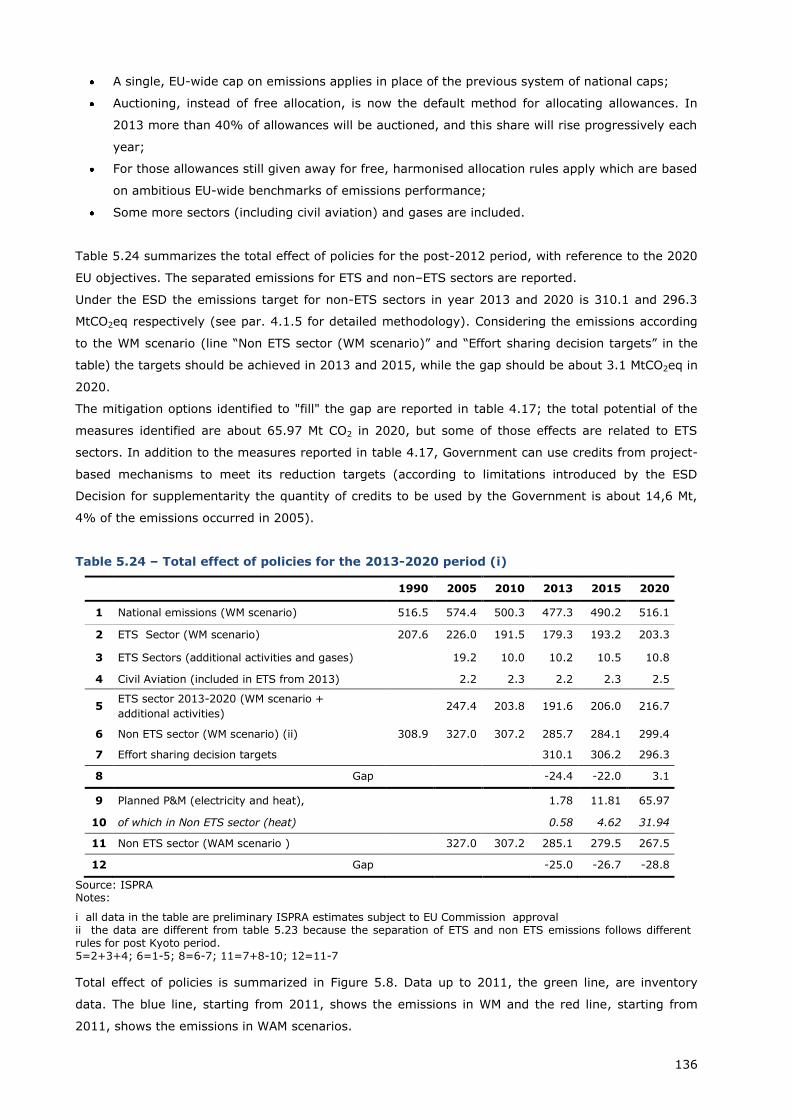
136
A single, EU-wide cap on emissions applies in place of the previous system of national caps;
Auctioning, instead of free allocation, is now the default method for allocating allowances. In
2013 more than 40% of allowances will be auctioned, and this share will rise progressively each
year;
For those allowances still given away for free, harmonised allocation rules apply which are based
on ambitious EU-wide benchmarks of emissions performance;
Some more sectors (including civil aviation) and gases are included.
Table 5.24 summarizes the total effect of policies for the post-2012 period, with reference to the 2020
EU objectives. The separated emissions for ETS and non–ETS sectors are reported.
Under the ESD the emissions target for non-ETS sectors in year 2013 and 2020 is 310.1 and 296.3
MtCO2eq respectively (see par. 4.1.5 for detailed methodology). Considering the emissions according
to the WM scenario (line “Non ETS sector (WM scenario)” and “Effort sharing decision targets” in the
table) the targets should be achieved in 2013 and 2015, while the gap should be about 3.1 MtCO2eq in
2020.
The mitigation options identified to "fill" the gap are reported in table 4.17; the total potential of the
measures identified are about 65.97 Mt CO2 in 2020, but some of those effects are related to ETS
sectors. In addition to the measures reported in table 4.17, Government can use credits from project-
based mechanisms to meet its reduction targets (according to limitations introduced by the ESD
Decision for supplementarity the quantity of credits to be used by the Government is about 14,6 Mt,
4% of the emissions occurred in 2005).
Table 5.24 – Total effect of policies for the 2013-2020 period (i)
1990 2005 2010 2013 2015 2020
1 National emissions (WM scenario) 516.5 574.4 500.3 477.3 490.2 516.1
2 ETS Sector (WM scenario) 207.6 226.0 191.5 179.3 193.2 203.3
3 ETS Sectors (additional activities and gases)
19.2 10.0 10.2 10.5 10.8
4 Civil Aviation (included in ETS from 2013)
2.2 2.3 2.2 2.3 2.5
5 ETS sector 2013-2020 (WM scenario +
additional activities) 247.4 203.8 191.6 206.0 216.7
6 Non ETS sector (WM scenario) (ii) 308.9 327.0 307.2 285.7 284.1 299.4
7 Effort sharing decision targets
310.1 306.2 296.3
8 Gap
-24.4 -22.0 3.1
9 Planned P&M (electricity and heat),
1.78 11.81 65.97
10 of which in Non ETS sector (heat)
0.58 4.62 31.94
11 Non ETS sector (WAM scenario )
327.0 307.2 285.1 279.5 267.5
12 Gap
-25.0 -26.7 -28.8
Source: ISPRA Notes:
i all data in the table are preliminary ISPRA estimates subject to EU Commission approval ii the data are different from table 5.23 because the separation of ETS and non ETS emissions follows different rules for post Kyoto period. 5=2+3+4; 6=1-5; 8=6-7; 11=7+8-10; 12=11-7
Total effect of policies is summarized in Figure 5.8. Data up to 2011, the green line, are inventory
data. The blue line, starting from 2011, shows the emissions in WM and the red line, starting from
2011, shows the emissions in WAM scenarios.
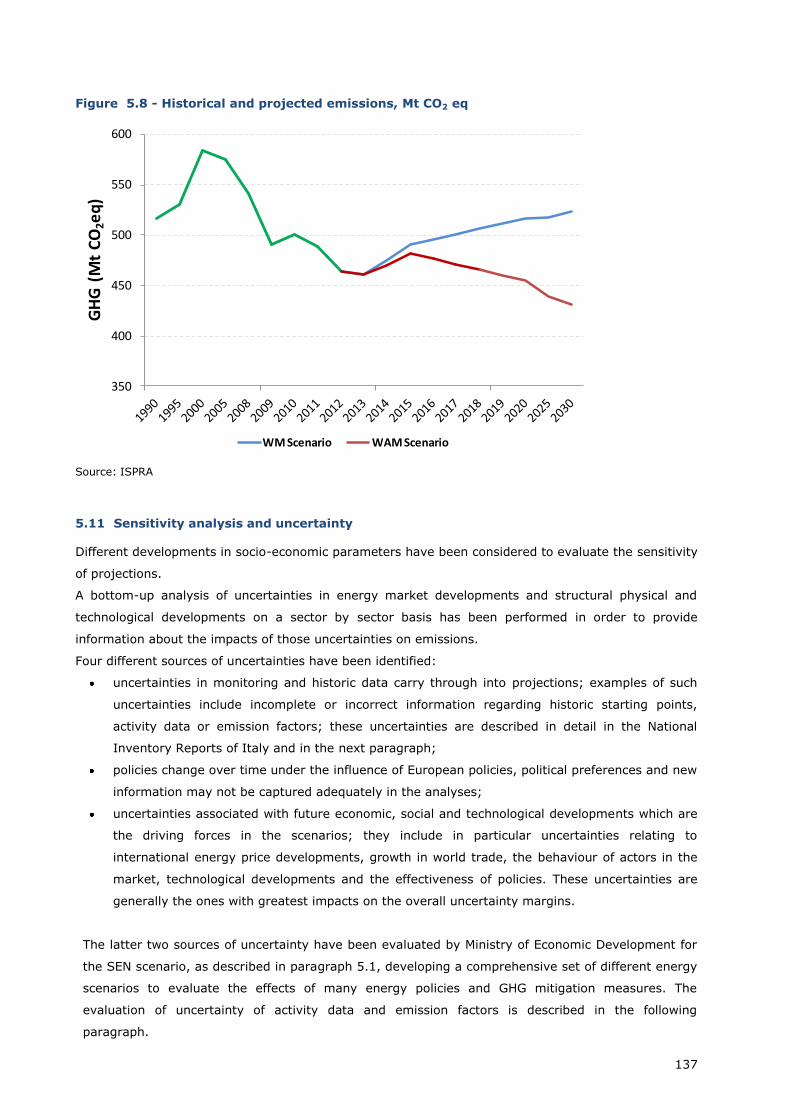
137
Figure 5.8 - Historical and projected emissions, Mt CO2 eq
Source: ISPRA
5.11 Sensitivity analysis and uncertainty
Different developments in socio-economic parameters have been considered to evaluate the sensitivity
of projections.
A bottom-up analysis of uncertainties in energy market developments and structural physical and
technological developments on a sector by sector basis has been performed in order to provide
information about the impacts of those uncertainties on emissions.
Four different sources of uncertainties have been identified:
uncertainties in monitoring and historic data carry through into projections; examples of such
uncertainties include incomplete or incorrect information regarding historic starting points,
activity data or emission factors; these uncertainties are described in detail in the National
Inventory Reports of Italy and in the next paragraph;
policies change over time under the influence of European policies, political preferences and new
information may not be captured adequately in the analyses;
uncertainties associated with future economic, social and technological developments which are
the driving forces in the scenarios; they include in particular uncertainties relating to
international energy price developments, growth in world trade, the behaviour of actors in the
market, technological developments and the effectiveness of policies. These uncertainties are
generally the ones with greatest impacts on the overall uncertainty margins.
The latter two sources of uncertainty have been evaluated by Ministry of Economic Development for
the SEN scenario, as described in paragraph 5.1, developing a comprehensive set of different energy
scenarios to evaluate the effects of many energy policies and GHG mitigation measures. The
evaluation of uncertainty of activity data and emission factors is described in the following
paragraph.
350
400
450
500
550
600
WM Scenario WAM Scenario
GH
G(M
t C
O2e
q)
138
5.11.1 Uncertainty ranges of inventory
The IPCC Good Practice Guidance (IPCC, 2000) defines the Tier 1 and Tier 2 approaches to estimate
uncertainties in national greenhouse gas inventories. Quantitative estimates of the uncertainties for
the Italian GHGs inventory are calculated using a Tier 1 approach, which provides a calculation based
on the error propagation equations. In addition, a Tier 2 approach, corresponding to the application of
Monte Carlo analysis, has been applied to specific categories of the inventory but the results show
that, with the information available at present, applying methods higher than the Tier 1 does not
make a significant difference in figures.
The Tier 1 approach estimates, for the 2011 total emission figures without LULUCF, an uncertainty of
3.4% in the combined GHG emissions, whereas for the trend between 1990 and 2011 the analysis
assesses an uncertainty of 2.6%. Including the LULUCF sector into the national figures, the
uncertainty according to the Tier 1 approach is equal to 5.1%, whereas the uncertainty for the trend is
estimated to be 4.2%.
The assessment of uncertainty has also been applied to the base year emission levels. The results
show an uncertainty of 3.5% in the combined GHGs total emissions, excluding emissions and
removals from LULUCF, whereas it increases to 4.1% including the LULUCF sector.
QC procedures are also undertaken on the calculations of uncertainties in order to confirm the
correctness of the estimates and that there is sufficient documentation to duplicate the analysis. The
assumptions on which uncertainty estimations are based are documented for each category. Figures
used to draw up uncertainty analysis are checked both with the relevant analyst experts and with
literature references and are consistent with the IPCC Good Practice Guidance (IPCC, 2000; IPCC,
2003).
The emissions projection estimates are based on a very detailed model output, the bottom up
technological model produces a set of energy consumption data similar to the sector approach of
emission inventory. So the scenario has the same range of uncertainties of the inventory.
5.12 Comparisons with previous National Communications
As required by the methodology an outline of the emission scenarios contained in the previous
National Communications is reported.
Table 5.25 below reports CO2 emissions from energy sector and total GHGs emissions in II, III, IV and
V National Communications. It was not possible to use the WOM scenario (without measures scenario)
for all projections because a WOM scenario is not reported in this National Communication and in the
previous one. However the emission projections of scenarios with measures reported in the second
and third National Communications could supply esteems of emissions without the measures
implemented after 2000.
The projections from scenarios with measures have been considered. For VI National Communication
also projections from scenario with additional measures are reported.
As can be seen the effects of economic crisis started in 2008 has shocked the previous projections for
2010 and for the Kyoto period. There was a certain stability of projections of the emissions from the
energy sector for the year 2010, with a range of ±2%, between the II, III and IV National
Communications. In the fifth National Communication the emission projections changed appreciably,
with a sizeable reduction with respect to the historical path, due to the first effects of the economic
crisis and of the measures implemented between in the 2006–2008 timeframe. Data of VI NC show
emissions drastically reduced in the Kyoto period with respect to the previous projection due to the
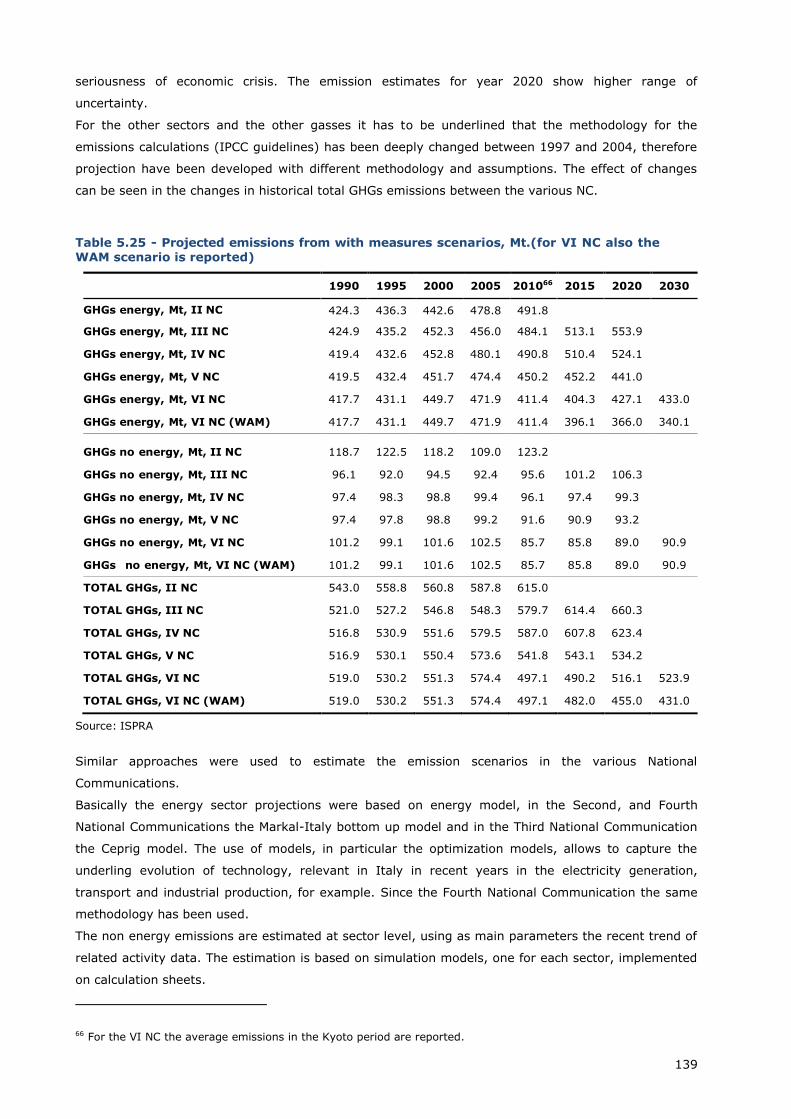
139
seriousness of economic crisis. The emission estimates for year 2020 show higher range of
uncertainty.
For the other sectors and the other gasses it has to be underlined that the methodology for the
emissions calculations (IPCC guidelines) has been deeply changed between 1997 and 2004, therefore
projection have been developed with different methodology and assumptions. The effect of changes
can be seen in the changes in historical total GHGs emissions between the various NC.
Table 5.25 - Projected emissions from with measures scenarios, Mt.(for VI NC also the WAM scenario is reported)
1990 1995 2000 2005 201066 2015 2020 2030
GHGs energy, Mt, II NC 424.3 436.3 442.6 478.8 491.8
GHGs energy, Mt, III NC 424.9 435.2 452.3 456.0 484.1 513.1 553.9
GHGs energy, Mt, IV NC 419.4 432.6 452.8 480.1 490.8 510.4 524.1
GHGs energy, Mt, V NC 419.5 432.4 451.7 474.4 450.2 452.2 441.0
GHGs energy, Mt, VI NC 417.7 431.1 449.7 471.9 411.4 404.3 427.1 433.0
GHGs energy, Mt, VI NC (WAM) 417.7 431.1 449.7 471.9 411.4 396.1 366.0 340.1
GHGs no energy, Mt, II NC 118.7 122.5 118.2 109.0 123.2
GHGs no energy, Mt, III NC 96.1 92.0 94.5 92.4 95.6 101.2 106.3
GHGs no energy, Mt, IV NC 97.4 98.3 98.8 99.4 96.1 97.4 99.3
GHGs no energy, Mt, V NC 97.4 97.8 98.8 99.2 91.6 90.9 93.2
GHGs no energy, Mt, VI NC 101.2 99.1 101.6 102.5 85.7 85.8 89.0 90.9
GHGs no energy, Mt, VI NC (WAM) 101.2 99.1 101.6 102.5 85.7 85.8 89.0 90.9
TOTAL GHGs, II NC 543.0 558.8 560.8 587.8 615.0
TOTAL GHGs, III NC 521.0 527.2 546.8 548.3 579.7 614.4 660.3
TOTAL GHGs, IV NC 516.8 530.9 551.6 579.5 587.0 607.8 623.4
TOTAL GHGs, V NC 516.9 530.1 550.4 573.6 541.8 543.1 534.2
TOTAL GHGs, VI NC 519.0 530.2 551.3 574.4 497.1 490.2 516.1 523.9
TOTAL GHGs, VI NC (WAM) 519.0 530.2 551.3 574.4 497.1 482.0 455.0 431.0
Source: ISPRA
Similar approaches were used to estimate the emission scenarios in the various National
Communications.
Basically the energy sector projections were based on energy model, in the Second, and Fourth
National Communications the Markal-Italy bottom up model and in the Third National Communication
the Ceprig model. The use of models, in particular the optimization models, allows to capture the
underling evolution of technology, relevant in Italy in recent years in the electricity generation,
transport and industrial production, for example. Since the Fourth National Communication the same
methodology has been used.
The non energy emissions are estimated at sector level, using as main parameters the recent trend of
related activity data. The estimation is based on simulation models, one for each sector, implemented
on calculation sheets.
66 For the VI NC the average emissions in the Kyoto period are reported.
140
The driving forces for emission projections, basically the evolution of main parameters concerning
economic development, population and travel demand are described in the respective National
Communication and vary according to the model used.
141
6 VULNERABILITY ASSESSMENT, CLIMATE CHANGE IMPACTS AND
ADAPTATION MEASURES67
6.1 Expected impacts of climate change and vulnerability assessment
According to international and national studies and publications68
the Mediterranean region is expected
to undergo particularly negative climate change impacts over the next decades, which, combined with
the effects of anthropogenic stress on natural resources, make this region one of the most vulnerable
areas in Europe. The anticipated negative impacts are mainly related to possible extraordinary heat
spells (especially in summer), increased frequency of extreme weather events (heat waves, droughts
and severe rainfalls) and reduced annual precipitation and river flow.69 70 In this context, Italy may
undergo some expected climate change impacts that would critically affect the following national
circumstances, including:
water resources and areas at risk of desertification;
coastal areas prone to erosion and flooding and susceptible to alterations of marine
ecosystems;
Alpine regions and mountain ecosystems experiencing glacial loss and snow cover loss; areas
prone to flood and landslide risk (i.e. hydro-geological risks including the risk of flash floods,
flash mud/debris flows, rock falls and other mass movements related to soil and land
management) and, in particular, the hydrographical basin of the Po River.
Climate change is likely to magnify the regional differences in terms of quality and availability of
natural resources and ecosystems in Europe and also in Italy.
6.1.1 Agriculture and food security
In Italy water shortages during specific crop development stages may reduce the productivity of most
crops (e.g. corn, soybeans and wheat). The decline in agricultural productivity could especially
concern wheat yield and fruit and vegetables production, as a consequence of water scarcity,
pathogens species increasing and soil degradation. Conversely olive, citrus, vine and durum wheat
cultivation could become possible in the North of Italy. Wine production, an activity of particular
economic relevance in Italy, could undergo major changes too. The suitability of cultivation areas for
specific crops might modify, which could lead to displacements of agricultural productions.71 72
6.1.2 Biodiversity and natural ecosystems
Italy is characterized by one of the most significant natural heritages of animal and plant species in
Europe in terms of both the total number of specimens and the high rate of endemism. Furthermore,
50 Italian sites are recognized as internationally important wetlands in the Ramsar Convention’s list.
67 Lead authors: Sergio Castellari (CMCC/INGV), Silvia Medri (CMCC) and Sara Venturini (CMCC). Contributing
authors: Daniela Pasella (IMELS), Luisa Pierantonelli (IMELS). 68 IPCC (2007); EEA (2012a); EEA (2012b); EEA (2010); EEA (2010b); Menne B. and Wolf T. (2007); Antonioli F.,
et al. (2007); Carraro C. (2008); Castellari S. and Artale V. (2009); Medri S. et al. (2013). 69 IPCC (2007). 70 EEA (2012b). 71 Cecchi L. et al. (2007). 72 Miglietta F. et al. (2009).
142
Climate change can threat Italian biodiversity at the level of species and habitats especially in the
mountain environments. Therefore, Italy is expected to face an extremely high risk of biodiversity and
natural ecosystems loss under future climate change.
Terrestrial ecosystems
Mediterranean-type terrestrial ecosystems are likely to be especially affected by climate change,73
with the following changes:
advancing trends in plant phenology;
changes in spatial distribution of flora and fauna;
increased risk of extinction for several terrestrial species, changes in the structure of the
biological community and biodiversity loss;
loss of wetlands ecosystems;
reduction in forests extension and biodiversity loss, especially in the South and in the
mountains.
Italian mountain (Alps and Apennines) environments are considered vulnerable to climate change.74
European mountains ecosystems could face:75 76
shift of plant and animal species towards higher elevations (with changes in the composition
and structure of alpine and nival communities)77, with consequent changes in the structure of
mountain communities and high risk of extinction for mountain flora and fauna;
alteration of the hydro-geological cycle, with impacts on the water balance of rain-collecting
basins and the stability of mountain slopes, resulting in higher risk of rock falls and soil
erosion;
glaciers retreat and permafrost reduction;
decrease of duration of snow cover (by several weeks for each degree of temperature
increase) at middle elevations;
significant reduction in snow mass in the Italian Alps;78
potential formation of Alpine large lakes as glaciers retreat, which might cause glacier lake
outburst floods.
Aquatic (marine and freshwater) ecosystems
Marine ecosystems - Mediterranean marine organisms, communities and ecosystems might be
further altered by climate change, including with spreading of invasive species driven by water
warming, which would cause a general threat and possible decline of marine biodiversity. Many
biological processes are expected to be negatively affected by climate change especially in summer
(possible mass mortality of invertebrates); simulations of these conditions indicate a biomass loss
higher than 35%.79 In the last decades the increasing development of marine mucilage in Italian
waters indicates altered environmental conditions for such aquatic system. This phenomenon might
favour the spreading of pathogenic bacteria.80
Freshwater ecosystems - Freshwater ecosystems are also expected to undergo negative changes
73 IPCC (2007). 74 IMELS (2010). 75 IPCC (2007). 76 Castellari S. (2008). 77 Cecchi L. et al. (2007). 78 Soncini A. and Bocchiola D. (2011). 79 Coma R. et al. (2009). 80 Danovaro R. et al. (2009).
143
such as loss of habitats, biotic components and processes. Higher temperatures might increase the
risk of excessive growth of algae and cyanobacteria in the lakes and eventually of eutrophication
processes in lake ecosystems, especially in late summer.81 The loss of wetlands would cause severe
imbalances in the related biotic communities.
6.1.3 Coastal zones
Climate change impacts on Italian coastal areas include:82
coastal erosion and instability, with risk of coastline regression;
loss of coastal land and of related economic activities, infrastructures, urban settlements,
recreational areas and natural heritage sites, mainly where climate change combines with
natural and/or anthropogenic subsidence;
reduction or loss of biodiversity and ecosystems (especially wetlands), and decrease of marine
life caused by the combined effect of climate change and anthropogenic stress;
damages to coastal rural economy, due to salt water intrusion into coastal fresh-water beds;
negative impacts on tourism and possible displacement of tourism flows from the coasts in
summer;
possible threat to human health posed by flood events.
Specifically, about 4500 km2 of Italian coastal areas are at risk of sea flooding from sea level rise
(SLR) by the next 100 years; most of them are located in the North Adriatic Sea, but some Tyrrhenian
and Ionian coasts may be at risk too.83 The Northern Adriatic coast, characterized by the Po river delta
and the Venice lagoon, is at high risk, as this area lies below sea level and hosts many residential
settlements, cultural heritage sites as well as industrial establishments.84
6.1.4 Drought and desertification
About one third of the country is vulnerable to varying degrees to the processes of land degradation. A
classification of the vulnerability of the Italian territory to land degradation and desertification, based
on the Environmentally Sensitive Area Index (ESAI) showed that (in 2000) Sicilia was affected by a
regional medium-high degree of environmental vulnerability (sensitive areas represented about 70%
of the regional territory), followed by Molise (58%), Puglia (57%) and Basilicata (55%). Six regions
(Sardegna, Marche, Emilia-Romagna, Umbria, Abruzzo and Campania) had similar conditions
(between 30% and 50%); for seven other regions (Calabria, Toscana, Friuli-Venezia-Giulia, Lazio,
Lombardia, Veneto and Piemonte) sensitive areas represented between 10% and 25%, while in three
regions (Liguria, Valle d’Aosta and Trentino Alto Adige) the percentages were fairly small (2% - 6%).
More recent studies show the sensitivity to desertification and drought of the Italian territory based on
the Sensitivity to Desertification Index (SDI), which considers soil quality, climate and vegetation
parameters. The gradual worsening of desertification trends, already observed in the whole country,
can be accelerated from climate change by increasing the actions of erosion, salinization, loss of
organic matter and drying up of soil.85 About 30% of the Italian territory can be considered at risk of
desertification, with the key vulnerabilities located in the South. Furthermore, especially vulnerable
81 Menne B. and Wolf T. (2007). 82 IPCC (2007). 83 Antonioli F. and Silenzi S. (2007). 84 Policy Research Corporation (in association with MRAG), 2009. 85 Carraro C. and Sgobbi A. (2008).
144
areas are farmlands with intensive and marginal production, areas at risk of accelerated erosion (e.g.
coastal areas), areas damaged by contamination, pollution and fires, and fallow and abandoned lands.
Severe indirect socio-economic impacts of this desertification process may follow, including: decline in
agriculture and tourism productivity, growing unemployment in rural areas with consequent migration,
conflicts over water uses, harm to properties and people, due to increased frequency of fires, overall
biodiversity loss.86 87
6.1.5 Fisheries
Marine fishery
The following negative impacts can be expected:
fish stock movements, inducing changes in the composition of biological communities in a
given area, also affecting the economic activities related to fishery, e.g. potentially less
productivity;
trans-boundary aquatic infections, with potential increase and expansion of aquatic diseases in
aquaculture and expansion of exotic pest species;
the resilience of many water ecosystems might be exceeded due to anthropogenic stress, e.g.
from overfishing, pollution, tourism, fragmentation and loss of habitat, combined with climate
change effects on temperature, salinity and density of water, with potential impact on
ecosystems’ physiology, biology and ecology;
possible general reduction in the productivity of the fished species;88
bivalve and gastropod molluscs or shellfish and like species with calcified shares could suffer
significant impacts from expected reduction of sea water pH; they could also suffer from
anoxia or hypoxia events during summer heat waves, whose frequency and duration is
supposed to increase;89 therefore all the economic activities based on the collection of these
organism may be at particular risk.
Freshwater fishery
It is very likely that over the short term there could be negative effects on the physiology of
freshwater fish due to local temperatures increase; this could result in changes in distribution and
probably abundance of freshwater species, with significant impacts on aquaculture. Italian aquaculture
could be particularly affected in North-Adriatic coastal wetlands and lagoon areas due to possible
water heating and acidification, extreme weather conditions, increasing incidence of diseases and sea
level rise.
6.1.6 Forests
Forests cover about one third of the Italian territory90. Existing studies91 92 show that climate change
could induce overall changes in the composition of species and habitats of Italian forests, resulting in
local losses of biodiversity. Potential impacts of climate change include:
86 Perini L. et al. (2008). 87 Sciortino M. et al. (2009). 88 Cheung W. W. L. et al. (2010); Cheung W.W.L. et al. (2012). 89 Cebrian et al. (2011); Vaquer-Sunyer and Duarte (2011). 90 MiPAAF, CRA (2005). 91 Valentini R. et al. (2009). 92 Petriccione B. et al. (2009). (BioRefugia website: http://sweb01.dbv.uniroma1.it/bruno/biorefugia/index.html).
145
northwards and altitudinal shift of the range of climatic and environmental conditions typical of
the Mediterranean area;
reduction of growth and productivity rates in central-Southern Italy, where about 1/3 of the
woodland could be threatened by reduced water supply and extended drought periods;
changes in the distribution of main tree forest species in central Italy mostly located in the
central Apennines, over 1500 m, in 2080, such as: general upward (towards higher altitude)
shift of the distributional area, strong reduction of the distributional area of the most
mesophile and microtherm species; significant expansion of the range of the Mediterranean
species into the inner pre-Apennine zones; phenologic changes in the timing of growth, with
earlier onset of spring events;
higher risk of forest fires and droughts, with possible extension of burned areas, more
ignitions and longer fire seasons (in particular in the Alpine area and in Calabria, Campania,
Sicilia and Sardegna regions);
some possible positive impacts, such as an increase in forest productivity in the Alps in
relation to the expansion of the growing season.
The actual possibilities for the forest ecosystems to shift are scarce, because climate change rate far
exceeds the rate of colonization of new areas and the potential corridors are often obstructed by
territorial fragmentation. Hence, a progressive disruption of forest ecosystems could be expected.93
A study94 on scenarios for the spreading of forest species in response to climate change with a focus
on the Alps show a possible reduction of about 50% of the habitats at the national level, with a
progressive decline of mountain habitats for high altitude conifers (red fir, larch, Swiss pine) in favour
of beech, oak chestnut and deciduous oaks.95
6.1.7 Human health
Expected impacts of climate change include96 97 98 99 100:
increased heat-related mortality and morbidity, related to summer heat waves;
slight reduction of cold-related mortality, linked to expected milder winter temperatures (but
the extent is not known);
increased risk of injuries, morbidity (e.g. enteric infections, post traumatic stress disorder and
vector-borne diseases) and deaths, from floods, heavy precipitation and fires events;
increased respiratory diseases and allergic disorders, as a result of the effects of changes in
air pollution concentrations that may be aggravated by climate change;
adverse consequences of potentially more frequent and prolonged extreme ozone events and
increasing toxicity of pollutants particularly in summertime;
possible increase of the cases of West Nile fever and leishmania, of risks for malaria and
dengue fever and of the spreading of vector borne diseases.
The groups of population that are more vulnerable to such impacts include the elderly, the children,
93 Valentini R. et al. (2009). 94 Valentini R. and Santini M. (2008). 95 Valentini R. et al. (2009). 96 Michelozzi P. et al. (2007). 97 Funari E. et al. (2007). 98 Forestiere F. (2007). 99 Menne B. et al. (2009). 100 Majori G. (2007).
146
people suffering from different diseases and marginalized people.
6.1.8 Water
Water resources (in terms of annual precipitation and river discharge) are projected to decrease over
Southern Europe, and this regional pattern could intensify in the last decades of this century. The
existing conditions of high stress on water resources and of hydro-geologic disturbance in some Italian
regions could be exacerbated by projected climate change including: reduced water availability and
quality, increases in frequency and intensity of droughts especially in summer, increases in frequency
and severity of river summer flows reductions and annual river flow decline and limited groundwater
recharge101.
Water quantity and quality
Water quantity/availability and quality in Italy could be affected by102 103:
reduced water availability, especially in summer;
increased water stress;
severe negative impacts in the South, where vegetation and territory are already experiencing
a marginal water supply regime;
increased seasonal water deficit due to significant pressures of summer tourism peaks in small
Italian islands;
potential increased conflicts among multiple uses of water resources.
Hydro-geologic system
A mapping of the hydrological risk in Italy showed that in 2006: 5.2% of the Italian territory is
exposed to the risk of landslides; 4.1% is under risk of flooding and 0.5% is prone to avalanches.104
According to a more recent (2008) assessment105 9.8% of the Italian territory is characterized by the
highest level of hydro-geological criticality (that represents the states of “high” and “very high” risk
and danger), of which 6.8% include areas with exposed properties (urban centres, infrastructures,
industrial areas, etc.).
Climate change impacts on the Italian hydro-geological system include:
variations in the hydrologic regime related to e.g.:
progressive melting of the glaciers and reduction of seasonal snow cover in Alpine
catchments, due to rising temperatures and changing precipitation patterns;
increase in the aridity of soils and in the frequency of drought events in the plain
areas;
changes in groundwater resources, related to SLR resulting in increased saltwater
intrusion in coastal aquifers, accompanied by limited capacity of beach nourishment
due to the lower river sediment transport (induced by reduced rivers medium ratings
because of decreased precipitation but also by man-made dam works and
withdrawals);
101 Portoghese I. et al. (2009). 102 Portoghese I. et al. (2009). 103 Funari E. et al. (2007). 104 Bigano A. and Pauli F. (2007). 105 IMELS (2008).
147
higher risk of inland flooding, due to increased events of river flood heights in relation to
heavy precipitation events;106
increased winter run-off by 90% and decreased summer run-off by 45% in central Europe
Alpine rivers,107 with consequent greater risk of flooding and drought respectively;
significant changes in the hydrologic balance (and water quality) of some studied river basins
(Rio Mulargia in Sardegna and Alento river in Campania),108 with an estimated reduction in
annual discharge as well as nutrients and sediments transport in the next decades;
increased risk of flash mud/debris flows, due to a potential increase of extreme weather
events;
increased risk of landslides in the Alps, due to temperature warming and ice melting; risk of
rock falls in the Apennines, because of possible more frequent and sudden temperature
changes, especially in winter; risk of flash floods in both areas, due to severe precipitation
events.
The areas most exposed to the hydro-geological risk include: the hydrographical basin of the Po River,
subject to increased flood risk, and the Alpine and Apennine areas, subject to increased flash flood
risk.
6.1.9 Infrastructure and economy
An assessment of the infrastructural capacity to adapt to climate change for Italy based on a
combination of “indicators on the road network density, hospital beds and sustainable water use”109,
carried out by the ESPON CLIMATE project110, shows how infrastructural capacity can change in Italy
depending on the different regions, spanning the whole range of quintiles, from the “lowest capacity”
(mainly insular and some south-eastern regions) to the “highest capacity” (mainly north-western
regions).
The Italian infrastructure and economy could face the following impacts.
Energy – Potential reduction of hydropower production due to expected reduced water availability;111
summer cooling needs might increase up to 50% Italy by 2080;112 increasing energy demand for
cooling needs in summertime could exceed the decreasing energy demand for heating needs in
winter.113
Tourism – Possible reduced summer tourism, due to high temperatures and water scarcity, more
expensive and/or reduced winter tourism, due to decreasing natural snow cover; on the other hand,
improved conditions for spring and autumn tourism might occur. The impacts extent and entity is
varying across Italian regions; Sicilia, Lazio, Toscana and Umbria may be the most affected ones;
winter tourism losses may be high for the Alto Adige region while relatively smaller for Friuli Venezia
Giulia and Valle d’Aosta.114
106 EEA (2012b). 107 Beniston M. (2006). 108 Lo Porto A. et al. (2007) “Influenza dei cambiamenti climatici sul regime idrologico di due bacini idrografici in
ambiente mediterraneo”. In Carli B., Cavarretta G., Colacino M., Fuzzi S. (eds) “Clima e Cambiamenti Climatici: Le
attività di ricerca del CNR”, 577-580. CNR. 109 EEA (2012). 110 Greiving S. et al. (2011). 111 Gaudioso D. and Masullo A. (2009). 112 Cecchi L. et al. (2007). 113 Mima S. et al. (2011). 114 Bigano A. and Bosello F. (2007).
148
Agriculture – Reduction in productivity for most crops due to water shortages; decline in agricultural
productivity for wheat crop, fruit and vegetables yields, due to water scarcity and soil degradation.115
Fishery – Possible decrease in fishery productivity, due to fish stock movements and trans-boundary
aquatic infections.116
Transport – Possible deterioration, disruption or inaccessibility of the transport network, due to a
combination of factors including temperature rise, changing precipitation patterns, extreme weather
events, increased risk of floods, flash floods, landslides and rock falls and flash mud/debris flows.117
Urban settlements – Possible damages to settlements and disruption of socio-economic activities,
mainly due to extreme events like floods, storms, heat waves, droughts, melting of permafrost in
some Alpine areas; possible decrease in water availability and quality as well as air quality affecting
urban population and settlements.
Infrastructure – Pressures on urban and rural infrastructures and damages or loss of properties,
mainly due to extreme events, such as flooding.
6.1.10 Economic impacts of climate change
Only few studies assessed sector- or site-specific economic impacts of climate change in Italy by using
different scenarios, approaches and methodologies.
Agriculture –The average yield reduction due to the impacts of climate change is evaluated at 9.3%
and 23% respectively for a +2° C and a +4 °C temperature rise scenario in 2050. The value of lost
production is estimated in the range 13 - 30 billion Euros per year in 2050, with a negative impact on
the GDP around 0.1%.118 Based on another analysis119 the decrease in the value of agricultural land
could be estimated between 87 and 162 billion Euros in 2100 under the IPCC A2 scenario.
Coastal areas120 – Existing studies121 on the expected costs of inaction for the coastal areas are
limited to few vulnerable areas (the Fondi Plains, the Sangro River basin and the Grado and Marano
Plains) for which the direct costs were calculated in terms of land loss. For the Sangro River basin122
the estimated costs are around 14 million Euros for the reference scenario at 2100; considering higher
hydro-geological vulnerability besides SLR, the estimated costs would increase to about 73 million
Euros.123 Furthermore, the CIRCE124 project estimated the loss of coastal areas in Italy in 2050 under
the IPCC SRES A1B scenario at about 0.7% of the national territory, with an indirect economic impact
on the Italian GDP at - 0.18%, in terms of loss of coastal infrastructures and agricultural land.125
Some studies126 addressing climate change impacts on coastal tourism, highlighted how “extremely
hot summers could reduce tourism inflow to Italian regions on average by 1.22%” while possibly
115 Miglietta F. et al. (2009). 116 FAO (2008). 117 Caserini S. and Pignatelli R. (2009). 118 Courtesy of Francesco Bosello (2013). 119 Van Passel S. et al. (2012). 120 Carraro C. (2008). 121 By Foundation Eni Enrico Mattei (Fondazione Eni Enrico Mattei - FEEM) and Italian National Agency for New
Technologies, Energy and Environment (Ente per le Nuove Tecnologie, l’Energia e l’Ambiente - ENEA); quoted in
Carraro C. (2008). 122 Breil M. et al. (2007). 123 Carraro C. (2008). 124 EU FP6 project CIRCE (Climate Change Impact Research: The Mediterranean Environment)
(http://www.circeproject.eu/). 125 Courtesy of Francesco Bosello (2013). 126 Galeotti M. et al. (2004).
149
slightly increase tourism inflow to Italian coastal zones.127
Drought and desertification128 – The costs of desertification for Italy were estimated at about 60-
412 million US$/year, considering a 16500 km2 of land at risk.129
Fisheries – Some site-specific studies on Sacca di Goro Lagoon (one of the major European sites of
aquaculture for Philippine clams) estimated that reduced rainfall and the incidence of certain seaweed
could reduce clam production with an annual monetary loss of 10.4 – 16.5 million Euros on
average.130
The SESAME131 project estimated the loss of aggregated productivity of fish stocks for Italy at about
8.07% in 2030 under the IPCC A1B scenario. This would impact Italy’s GDP by -0.04% in 2030
(equivalent to a loss of 25 million Euro per year in the period 2001-2030), considering only the
potential impact of the reduced fish availability on the ability to produce goods and services in the
future. The fishing industry would suffer a loss of production around 4% in 2030.132
Human health – the costs of impacts of heat waves for Italy in the absence of any adaptation
strategy are estimated around 281 million Euros for 2020 in Rome alone;133 the damages caused by
floods in the European countries in the Mediterranean area in the last decade are estimated at 12,3
billion Euros, of which 96% can be attributed to events taking place in Italy.134
Water - hydro-geological system – River flooding costs related to impacts of climate change may
increase in Italy.135 The direct costs of hydro-geologic risks (floods and landslides) for 3 Italian regions
(Calabria, Lazio and Lombardia) were estimated at 103 million Euros in terms of value of the land
under flood risk and at 187 million Euros in terms of value of the land at risk of landslides.136 The
expected direct costs of floods for Italy in 2050 under the IPCC SRES A1B scenario could be 1.6 billion
Euros137. The related impact on the national GDP would amount to 457 million Euros in 2050.138
Tourism – The SESAME139 project estimated a reduction of tourism demand for Italy of 1.65% in
2030 under the IPCC A1B scenario due to a potential loss of attractiveness from the deterioration of
marine ecosystems. The CIRCE140 project estimated a reduction of tourism inflows for Italy potentially
induced by rising temperatures at about 15% in 2050 under the IPCC A1B scenario; this could be
partially offset by an increased domestic tourism demand, with a net negative impact on the sector of
8.9%. The consequent GDP reduction would be of 0.25% in 2050.
Macro-economic impacts of climate change in Italy – The only available study141 assessing the
costs of climate change impacts in Italy in an aggregated way was carried out by FEEM in
collaboration with ISPRA and CMCC. The study focused on four vulnerable areas: Alps and glacier
ecosystems; coastal zones; arid areas and areas threatened by desertification; areas prone to floods
127 Gambarelli G. and Goria A. (2004). 128 Carraro C. (2008). 129 Carraro C. and Sgobbi A. (2008). 130 Viaroli P. et al. (2007); quoted in Carraro C. (2008). 131 EU FP6 project SESAME (Southern European Seas: Assessing and Modelling Ecosystem Changes). 132 Courtesy of Francesco Bosello (2013). 133 Alberini A., and Chiabai A. (2007); quoted in Carraro, C. (2008). 134 Sinisi L. (2009). 135 EEA (2012b). 136 Carraro C. and Sgobbi A. (2008). 137 Flörke M. et al. (2011); ClimWatAdapt (Climate Adaptation modelling water scenarios and sectoral impacts)
(http://climwatadapt.eu/). 138 Courtesy of Francesco Bosello (2013). 139 FP6 project SESAME (Southern European Seas: Assessing and Modelling Ecosystem Changes). 140 Bosello F. et al. (2010). 141 Carraro C. (2008).
150
and landslides. According to this study, Italy may experience aggregated GDP losses induced by
climate change around 0.12%-0.16% in the period 2001-2050, equivalent to approximately 20-30
billion Euros, considering a temperature increase of 0.93°C; for a +1.2°C temperature rise scenario
larger losses could be expected of 0.16% - 0.20% of GDP. The tourism and the economy of Alpine
area could suffer significant damages. Large North-South differences could emerge in Italy in terms of
economic impacts of climate change.
6.2 Adaptation
National Adaptation Strategy –
Italy is currently preparing a National Strategy for the adaptation to climate change (NAS), which will
define priorities at sectoral level through the combination of top-down and bottom-up approaches.
The top down process started in 2012 with the aim to prepare a draft NAS scientifically based and
shared at institutional level. In particular, to update existing information on impacts and
vulnerabilities, in 2012 a Technical Panel of Experts (about 110 scientists coordinated by CMCC142)
was established. This information was shared amongst an Institutional Committee (including
Ministries, Civil Protection and representatives of regional and local authorities) in preparing the draft
NAS. In December 2012 a draft resolution to the “Interministerial Committee for Economic Planning”
was issued to individuate the economic allocation for priority actions with particular reference to the
hydrogeological risk.
The bottom-up approach has been implemented starting with an on-line survey on the perception of
risks of climate change and on the “adaptation concept” in the country, launched in October 2012. In
2013, both an on-line public review and “ad hoc” public consultations were organized, in order to
promote the involvement of citizens and stakeholders such as: NGOs, municipalities, private sector
and trade unions. The results of the activities are substantial in dealing with, inter alia, the future
implementation of the NAS.
The final approval of the NAS is foreseen in the first semester of 2014.
Sectoral adaptation – Despite the current lack of a NAS and of comprehensive economic
assessments, a number of adaptation initiatives has been already implemented at the national level in
the context of the policies for environment protection, natural hazards prevention, sustainable
management of natural resources and health protection. These efforts include: legal frameworks,
monitoring and surveillance systems and practical measures i.e. in the fields: human health, coastal
areas, agriculture, desertification and water resources. Considerable actions were undertaken also at
the regional and city levels. Italy also participates in research efforts on climate change adaptation at
both international and national level, with a special focus on agriculture, biodiversity, coastal zones,
desertification, health, water and cities. Furthermore, Italy is also active in international cooperation
initiatives on climate change related topics, including transnational cooperation efforts (e.g. in the
context of the Alpine Convention) and capacity building activities in developing countries, funded by
the Italian Ministry of Foreign Affairs and the IMELS. All these initiatives are summarized in the
following section.
142
http://www.cmcc.it/projects/snac-elements-to-develop-a-national-adaptation-strategy-to-climate-change .
151
6.2.1 Agriculture and food security
The Italian Ministry of Agriculture, Food and Forestry Policies (MIPAAF) published in 2011 the White
Paper: “Challenges and opportunities of rural development for mitigation and adaptation to climate
change”.143 This document aims at increasing the resilience of the agricultural sector to the impacts of
climate change as well as the investments in a low-carbon economy through the development and
diffusion of renewable energy and green products. Furthermore this document identifies specific
adaptation actions to be implemented at different levels in agriculture in four main areas: technology
development; adoption of technologies; government programmes and insurance services; financial
management of farms.
Legal frameworks
Italy implemented a (2007-2010) National Plan for irrigation in support to the agricultural sector144
and allocated specific funds to alleviate the effects of extreme events, including droughts.
Furthermore, specific adaptation actions are financially supported by the (2007-2013) 21 regional
Rural Development Programmes (RDPs) focused mainly to water management and forestry measures.
Insurance system
Since 2010 Italy implemented specific support to the costs of insurance premiums covering the risks
of climate change on crop production, animal diseases in livestock, diseases and pest infestations of
plants145. A single system was created collecting all the relevant funds, including the CMO Wine funds
providing contributions to insurance for wine grapes crops and the National Solidarity Fund for natural
disasters in agriculture.146
Research
Relevant recent research efforts on climate change adaptation in agriculture in Italy include the
following three national projects and one international project:
AgroScenari (Adaptation scenarios of Italian agriculture to climate change) - national
Programme (2008-2012) aimed to address the subject of adaptation to current and projected
climate change;
Climesco (Evolution of cropping systems as affected by climate change) - national project
(2006-2010) aimed also at “defining agronomic corrective actions to maintain or possibly
increase the sustainability of the cropping systems used in Southern Italian regions”;
Soilsink (Climate change and agricultural and forestry systems: impact on the carbon
reservoirs and on the soil microbic diversity) - national project (2006-2010) aimed also at
providing advice to agricultural technicians and planners on the most appropriate decisions for
agricultural land management;
Icarus (IWRM for Climate Change Adaptation in Rural Social Ecosystems in Southern Europe) –
international project (2010-2012) aimed to address efficient water use in agriculture and
identifying innovative adaptation strategies, practices and tools for saving water in irrigated
productions systems.
143 MiPAAF, Rete Rurale Nazionale (2011). 144 Further information: Rete Rurale Nazionale - RRN (http://www.reterurale.it/pianoirriguo). 145 Thanks to Reg. (EC) 73/2009 issued after the CAP Health Check, allowing the use of Community funds for
insurance benefits. 146 MiPAAF, Rete Rurale Nazionale (2011).
152
6.2.2 Biodiversity and natural ecosystems
Conservation and management of fauna and flora
At the national level, the DPNM147 of IMELS aims to the establishment of nature reserves and national
parks, the definition of relative management criteria, the development of national action plans,
guidelines and guidance documents for the conservation of species and habitats and the production of
publications and databases on the natural heritage. The variety of implemented initiatives on
terrestrial and marine148 protected areas149, national parks, landscape, terrestrial fauna and flora, and
actions for limiting the impacts of alien invasive species can be considered beneficial also for adapting
to climate change.
National Biodiversity Strategy
In 2010150 the IMELS launched the National Biodiversity Strategy to be implemented in the period
2011-2020. The Strategy is built on three pillars: “biodiversity and ecosystem services”, “biodiversity
and climate change”, “biodiversity and economic policies”. The Strategy provides indications on
priorities for action based on intervention tools for the different working areas, either directly or
implicitly linked to climate change adaptation. This Strategy explicitly aims at “reducing substantially
the impact of climate change on biodiversity by 2020, by defining appropriate measures of adaptation
and mitigation, also targeted at increasing the resilience of natural and semi-natural ecosystems to
climate change”. Such identified adaptation actions are aimed e.g. at: “maintaining the range and
variability of ecological habitats and species; facilitating the spread of species into new favourable
habitats; maintaining the existing ecological networks; controlling the spread of invasive species”.
Research
Italy participated to a number of recent international projects related to biodiversity and climate
change, including the following ones (reported as examples):
several nature and biodiversity protection projects within the LIFE+ programme;
HABIT-CHANGE (Adaptive Management of Climate-induced Changes of Habitat Diversity in
Protected Areas) project (2010-2013), aimed at assessing, improving and adapting existing
management and conservation strategies in protected areas to pro-actively respond to likely
effects of climate change as a threat to habitat integrity and diversity;
MANFRED (Management strategies to adapt Alpine Space forests to climate change risks)
project (2009-2012), aimed at defining management strategies for the protection of the Alpine
forests ecosystems from climate change risks and for adaptation to climate change impacts;
C3-Alps – Capitalizing Climate Change Knowledge for Adaptation in the Alpine Space project
(2012-2014), aimed to synthesize, transfer, and implement in policy and practice the best
available adaptation knowledge by building on the results of previous projects and initiatives
on adaptation to climate change in the Alps.
6.2.3 Coastal zones
The main competences and responsibilities for organising and administering coastal defence passed in
147 Direzione per la Protezione della Natura e del Mare del Ministero dell'Ambiente e della Tutela del Territorio e del
Mare. 148 http://www.orbicolare.it/works/eb_amp2010/mappa.html. 149 http://www.minambiente.it/pagina/elenco-ufficiale-delle-aree-naturali-protette-0. 150 By approval in October 2010 by the Standing Conference for relations between the State, Regions and
autonomous Provinces.
153
2001 from the national government to the 15 coastal regions.
Integrated coastal Zone Management (ICZM)151
At the national level, Italy is required to prepare a strategy on Integrated coastal Zone Management
(ICZM), which includes prevention and reduction of the effects of natural hazards and of climate
change. The IMELS has already started an overall institutional coordination, through the involvement
of regional and local authorities dealing with planning and management of coastal areas, with a view
to define the required ICZM Strategy and to prepare the relevant Plans/Programs and/or Guidelines.
Appropriate consultation of stakeholders is envisaged to ensure proper input and consideration of all
relevant interests. The most recent status of activities in this respect is reported in the IMELS 2011
report: “National Progress Report on integrated coastal zone management (2006-2010)”.152
At the regional level, some Italian regional governments started to focus on the ICZM e.g.: Emilia-
Romagna and Marche (2005) and Liguria (2002), with the adoption of instruments having reference to
the ICZM, and Toscana, Lazio, Abruzzo, Sardegna and Puglia, with preliminary testing of the ICZM
approach or plans for land protection and spatial planning. Basilicata and Sicilia just started
preparatory activities for their regional coastal plans.
Implemented adaptation actions and measures
Over the years, regional action focused on interventions aimed at stabilizing and fixing the coastline to
protect coastal zones from increased erosion and flooding. The implementation of several of these
initiatives is also beneficial for adapting to climate change. They include:153 154
traditional coastal defence measures, such as artificial reefs (rock mound structures, flood
walls), near-shore breakwaters, bulkheads, artificial channelling and drainage and, more
recently, beach nourishment generally in high-profit touristic areas and dune restoration (e.g.
Campania, Lazio, Emilia-Romagna, Toscana);
a cutting-edge system of mobile barriers against exceptionally high tides (Veneto);
a real-time wave monitoring network in support to civil protection decisions during extreme
weather events (Campania) and/or other monitoring systems (Emilia-Romagna);
land use planning;
managerial interventions, such as changing agricultural practices in areas prone to floods and
changing location of recreational facilities.
Examples of advanced coastal protection
Veneto155 - Following a 1984 national law, the Venice Water Authority (under the Ministry of
Infrastructure and Transport) is implementing through the Consorzio Venezia Nuova a General Plan of
Interventions, whose costs are supported by the government, to achieve protection measures
safeguarding the city and its lagoon from the sea tides. In addition, a specific project called MOSE
(MOdulo Sperimentale Elettromeccanico)156, was designed to temporarily divide the sea from the
lagoon during high tides. For this purpose, a system of mobile barriers was built at three lagoon inlets
to be activated during exceptionally high tides. The defence structure, whose works started in 2003,
was designed to cope with an increase of up to 60 cm in sea level.
151 http://www.minambiente.it/pagina/gestione-integrata-delle-zone-costiere-gizc. 152 IMELS (2011). 153 Carraro C. and Sgobbi A. (2008). 154 Policy Research Corporation (in association with MRAG) (2009). 155 Policy Research Corporation (in association with MRAG) (2009). 156 MOSE project (http://www.salvemose.it/index.php).
154
Emilia-Romagna157 - Emilia-Romagna is the first Italian region to have implemented beach
nourishment (a “soft” kind of intervention) in 1983 as an alternative to the environmentally
unsustainable “hard” protection works. Later, in 2002 and 2007, two major beach nourishment
interventions were carried out using off-shore submerged sand deposits. In 1983 the region also
approved its first Coastal Plan and established a subsidence monitoring network of the coastal territory
and shoreline movements. The second Coastal Plan was issued in 1995 which was followed by two
Coastal Status Reports in 2000 and 2007. The latest Coastal Plan, including a ten-year Management
Plan (2010-2019), includes some considerations on climate change. Starting from 2000 a GIS-based
Coastal Information System was developed in support to coastal studies, monitoring and planning. In
2002 the region started experimenting a pilot video monitoring system of the littoral processes in
support of coastal zone management through the development of video-derived Coastal State
Indicators (CSI).158 Furthermore, the region is the only one to have developed and adopted Guidelines
for an ICZM in 2005.
Research
Italy has been and is involved in these recent international research projects, relevant to some extent
to adaptation to climate change over its regional coasts:
INTERREG IIIC Beachmed-e MedPlan subproject (2005-2008), focused on risk assessment and
the establishment of integrated plans for Mediterranean coastlines;
COASTANCE (regional COmmon Action STrategy Against Coastal Erosion and climate change
effects for a sustainable coastal planning in the Mediterranean basin) project (2009-2012),
focused on regional action strategies for adaptation to climate change in the coastal zones;
MedLab (Mediterranean Living Lab for Territorial Innovation) project (2009-2011), focused on
innovative Information and communication Technology services in support to regional policy;
SHAPE (Shaping an Holistic Approach to Protect the Adriatic Environment between coast and
sea) project (2011-2014), aimed at creating the basis for the protection and the sustainable
development of the Adriatic coastal-marine environment, by promoting the implementation of
the ICZM Protocol and the Roadmap for Maritime Spatial Planning (MSP).
Also Italy has been involved in relevant national projects, such as:
• CAMP (Coastal Area Management Programme Italia) project (2009), supporting also the ICZM,
carried out in the framework of the Barcelona Convention;
• VECTOR (VulnErability of the Italian coastal area and marine Ecosystems to Climatic changes
and Their rOle in the Mediterranean caRbon cycles) project (2006-2009), aimed to study the
most significant impacts of climate change on the Mediterranean marine environment and the
role of this basin on the planetary CO2 cycle.
6.2.4 Drought and desertification
National Action Programme (NAP) to Combat Drought and Desertification
As requested by the United Nation Convention on Combating Desertification (UNCCD), in 1999 Italy
developed and approved the National Action Programme to Combat Drought and Desertification159
aimed at reducing losses of soil productivity caused by climate change and other human activities in
157 Policy Research Corporation (in association with MRAG) (2009). 158 Within the EU 5th FWP RTD (2002-2005) CoastView Project (http://141.163.79.209/web/index.html). 159 IMELS (1999) “Programma di Azione Nazionale per la Lotta alla Siccità e alla Desertificazione (PAN)”.
155
the context of sustainable development, following the ad hoc Guidelines160 elaborated by the National
Committee to Combat Desertification (CNLSD). The NAP, that calls for the creation of links and
synergies with other global conventions on climate, biodiversity and the protection of international
waters, provides a coherent set of indications that are beneficial also to adapting to climate change.
Local Action Programmes (LAPs) to Combat Drought and Desertification
The National Action Programme to Combat Drought and Desertification entrusted the Regional
Governments and Watershed Authorities161 with the responsibility to develop Local Action Programmes
to Combat Drought and Desertification. Currently, ten Italian Regional Governments adopted these
programmes: Campania (2010), Liguria (2010), Toscana (2010), Emilia-Romagna (2009), Puglia
(2008), Sardegna (2008), Calabria (2008), Abruzzo (2007), Basilicata (2007) and Sicilia (2007)162.
Pilot projects to combat desertification
The IMELS promoted Pilot projects to combat desertification163, which make use of experimental
techniques and methods for actions aimed at improving knowledge (e.g. environmental monitoring,
maps and boundaries of sensitive areas/at risk of desertification of different phenomena and
indicators) and at directly intervening in the territory. Currently, 6 Italian Regional Governments
conducted such Pilot projects: Abruzzo (2010), Piemonte (2010), Sardegna (2009), Sicilia (2009),
Calabria (2009) and Puglia (2008).
Other initiatives
The “Good practices for combating desertification”164 report by IMELS and Research Nucleus on
desertification of Sassari University (2009) provides a methodological and operational tool for the
identification of good practices for combating desertification.
6.2.5 Fisheries
Existing adaptation strategies for the fisheries sector are mainly on sustainable management of
fisheries at national and international level and on enhancement of complementary activities such as
aquaculture. It is worth mentioning the 2007-2013 Operational Programme for the Italian fisheries
sector, run under the responsibility of MiPAAF and focused on 5 priority lines that involve some degree
of adaptation and sustainability (e.g. interventions directed to the protection of the marine ecosystem
and the competitiveness of national fisheries)165.
6.2.6 Forests166
Adaptation in the forest sector in Italy is mainly related to the protection of forests from wild fires. The
IMELS, through the DPNM, developed the following initiatives for the protection of forests from fires:
“Framework law on forest fires” (2000);
Guidelines for sustainable forest management in State natural parks and reserves (2005);
Schemes for plans against forest fires for State natural protected areas (2002/2009);
specific plans for State natural reserves;
160http://www.arpa.emr.it/cms3/documenti/_cerca_doc/siccita_desertificazione/linee_guida_piano_azione_nazional
e_99.pdf. 161 Autorità di Bacino. 162 Programmi di azione locale di lotta alla siccità e alla desertificazione (PAL). 163 Progetti Pilota di Lotta alla Siccità e alla Desertificazione. 164 Seddaiu G. et al. (2009). 165 http://www.politicheagricole.it/flex/cm/pages/ServeBLOB.php/L/IT/IDPagina/311. 166 http://www.minambiente.it/pagina/attivita-antincendi-boschivi.
156
provision of scientific and technical support to planning the detection of wild fire in State
protected natural areas and national parks of priority intervention areas (including an on-line
GIS-bases cartography).
6.2.7 Human health
Efforts undertaken in the national health sector that are beneficial also for adapting to climate change
are most developed in the field of prevention of and response to heat health effects from heat waves
and are implemented mainly under the direction of the Department for Civil Protection and the Italian
Ministry of Health. The Ministry of Health launched the National Programme for the prevention of
effects of heat waves on health, providing a framework for the implementation of prevention plans at
the local level, with the technical support by the Department for Civil Protection. The main objective of
this initiative was the implementation of Heat Health Watch Warning System (HHWWS) and the
national system of rapid detection of daily mortality.
Implemented adaptation actions and measures
National network of city-based HHWWSs,167 covering 34 cities (in February 2012), including: a
daily mortality surveillance system; a vulnerability registry, local action plans, national
working group of experts for the preparation of local surveillance, response plans and the
vulnerability registry;
National Operational Plan for the prevention of the effects of heat on health,168 extending the
city-specific forecasting systems, defining the mortality surveillance system and the local
response plan and identifying the categories at risk (for the Vulnerability registry) and the
reference centres;
(2006) “Guidelines for preparing monitoring and response plans for the health effects of heat
waves”;169
Regional initiatives against heat waves, including measures concerning heat waves, depletion
of the stratospheric ozone layer, vector-borne diseases, water and food quality and pollen
species by Emilia-Romagna.
In addition, the Ministry of Health conducted dissemination campaigns and awareness raising
initiatives, such as:
Social Guardians Service (2004-2010) experimental project in 4 large cities (Roma, Torino,
Milano and Genova) to verify the effectiveness of the assistance model of the “social guardian”
for fragile elderly people;
“For a safe summer” initiative, disseminating to the citizens information and
recommendations170 (including a “Heat Lab” website171 (2004) promoting the exchange of
knowledge and local practical experiences, a National Call Centre Service, booklets and
dedicated TV programmes).
167http://www.salute.gov.it/emergenzaCaldo/paginaInternaEmergenzaCaldo.jsp?menu=sistema&id=410&lingua=italiano. 168 Ministry of Health (2005) “Piano Operativo Nazionale per la Prevenzione degli Effetti del Caldo sulla Salute” 169 Ministry of Health (2006) “Linee guida per preparare piani di sorveglianza e risposta verso gli effetti sulla salute
di ondate di calore anomalo” 170http://www.salute.gov.it/imgs/C_17_pubblicazioni_1959_allegato.pdf. 171http://www.google.it/url?sa=t&rct=j&q=&esrc=s&source=web&cd=2&ved=0CDoQFjAB&url=http%3A%2F%2Fwww.trapianti.salute.gov.it%2Fresources%2Fstatic%2Ffocus%2F6%2Fheat_lab_documentazione.pdf&ei=vhjVUrGYI7Tb7AapuoCwDA&usg=AFQjCNECNHa0Axf7TD_t8Wzig3uwPwCXdw&sig2=zqhdaIDjEr5lGQddIds5dg&cad=rja.
157
Research
Research on adaptation to heat waves carried out in Italy includes epidemiologic studies carried out by
Office of Statistics of Istituto Superiore di Sanità’ to calculate the excess mortality due to the summer
2003 heat wave, and activities undertaken in the context of the international cCASHh Climate
Change and Adaptation Strategies for Human Health in Europe172 project (2001-2004).
6.2.8 Water
Water scarcity and drought
The projected increase of droughts frequency and water scarcity, especially in Southern Italy, are very
high on the policy agenda. These drive the development of suitable responses in combination with the
other components of EU water regulation.173 Implemented initiatives include the following ones.
Following the (2000) EU Water Framework Directive (WFD),174 Italy issued water emergencies
regulations to address water crises, providing both technical and financial support for
emergency measures. 175
On 5 March 2007, the Council of Ministers approved “Practical guidelines to deal with possible
water crises”, that provide indications to all water management structures for undertaking
monitoring and appropriate enforcement activities.176
Ad hoc organizations for crisis management were established, such as a “Drought control
room” for drought events in the Po River basin, and a “Coordination Unit for the management
of water resources” shared between Puglia and Basilicata Regions, to regulate water usage
and to take the necessary measures to prevent water crisis.
A number of Italian structural funds include irrigation networks as well as drinking-water
distribution networks, not only for water emergencies.
In terms of cohesion funds, Italy has a water programme, also useful in providing necessary
information for water crisis prevention.
At the catchment level, the River Basin Management Plan of the Po River catchment (adopted in 2010
and approved in 2013177) aims, among its objectives, at the identification of shared strategies for
water management and adaptation to climate change; in addition, the Watershed Authority of the
Arno River Basin took into account climate change impacts in mapping flood hazard and risk in support
to river Basin planning (pursuant to Directive 2007/60/EC on flood risks assessment and
management).178
Hydro-geological risk
Legal frameworks
Law 267/1998, also known as Legge Sarno, is the main legal mechanism involving the
implementation of hydro-geological protection in line with the WFD and requires the
authorities responsible for hydrological basins management to detect risk areas, set up
172 Results of the cCASHh project are reported in Menne, B.; Ebi, K. L. (Eds.) (2006) “Climate Change and
Adaptation Strategies for Human Health”. 173 EEA (2007). 174 http://eur-lex.europa.eu/LexUriServ/LexUriServ.do?uri=CELEX:32000L0060:EN:NOT. 175 http://www.direttivaacque.minambiente.it/. 176 Gaudioso D. and Masullo A. (2009). 177 http://www.adbpo.it/on-multi/ADBPO/Home/articolo1425.html. 178 http://www.appenninosettentrionale.it/dist/?p=1240.
158
prevention plans and establish regulations to avoid additional risk due to anthropogenic
factors; it is also the legal basis for identification and funding of urgent preventive measures;
(2004) Prime Minister Directive179 provides operational guidelines for the organizational and
functional management of the national and regional warning system for the hydro-geological
and hydraulic risk for the purpose of civil protection; it requires the establishment of an
integrated warning system at the national and regional level, based on the activities of
Functional Centres devoted to the collection, processing and assimilation of climate-related,
hydrological, geological and geo-morphological data.
Implemented adaptation actions and measures
The main activities coping with the hydro-geological risk are implemented at the national level by the
Department of Civil Protection, including:
monitoring of hydro-pluviometric data and water availability, in order to anticipate possible
future critical situations, in collaboration with Regional and Watershed Authorities;
establishment (in 2007) of a technical-scientific group of the main national experts in seasonal
weather forecasting and climatology with the aim to update the scenarios for the next three-
month period;
managing, in accordance with the Regional governments, the network of functional centres,
regional structures and competence centres for the collection, monitoring, and sharing of
weather, hydro-geological and hydraulic data (the National System for early warning and
monitoring), a key support tool for decision-making for civil protection and warning for hydro-
geologic and hydrologic risk;
promotion, financing and coordination of technical and scientific initiatives aimed at widening
knowledge base on extreme weather events and their application to the development of early
warning, evaluation and real-time monitoring tools;
implementation of a national Radar Plan for nowcasting.
Research
The main recent experiences of research on adaptation to climate change in the water sector in Italy
are the following:
ClimWatAdapt (Climate Adaptation - Modelling water scenarios and sectoral impacts)180
project (2010-2011) addressing also vulnerability assessment and potential key adaptation
measures assessment;
STRADA (Climate change adaptation strategies for the management of natural hazards in the
in trans-boundary areas)181 project (2010-2013), developing adaptation strategies in the Italy-
Switzerland trans-boundary territory, with a focus on managing water resources and on
adaptation to hydro-geological hazards in the context of climate change in Alpine
environment.
TRUST (Tool for regional scale assessment of groundwater storage improvement in adaptation
to climate change)182 project (2009-2011) addressing also the development of adaptation
strategies for the ground water as well as of innovative actions to stop the slow but also
progressive decline of the level of ground water of the Veneto and Friuli regions.
179 http://www.protezionecivile.gov.it/jcms/it/view_prov.wp?contentId=LEG21144. 180 ClimWatAdapt (http://climwatadapt.eu/). 181 STRADA (http://www.progettostrada.net/). 182 TRUST (http://www.lifetrust.it/cms/).
159
6.2.9 Infrastructure and economy183
Tourism – Artificial snowmaking systems are still the most applied response of the Italian winter
tourism industry to the decrease in the snow-reliable ski zones. About 77% of Italian ski areas are
already covered with artificial snow, reaching 100% in Friuli Venezia Giulia and Alto Adige regions.
These interventions have high costs and are not considered sustainable options (due to energy
consumption, water resources use, installation and maintenance). New and promising business
models, including both snow-related and non snow-related offers (health tourism, congress tourism,
other sports and popular activities, etc.) have been developed to some extent, leading to the
diversification of winter tourism revenue.
Urban settlements – As to the urban sector, a range of initiatives were either implemented or
started by Provinces, Cities and Municipalities, such as.
Ancona Municipality184 developed a Local Adaptation Plan (in the framework of the ACT
project185) in close collaboration with local stakeholders and based on a methodology designed
by ISPRA with the aim to be applied also in other European cities.186
Genova Province developed an Adaptation Action Plan187 (under the GRaBS project188) to cope
with the territory vulnerabilities that might be worsened by climate change and through
planning strategies aimed at increasing the environment natural defences. The involvement of
local stakeholders and citizens was a core pillar of the project.189
Faenza Municipality implemented a Bio-neighbourhood incentive programme for developers190
within the urban planning regulations to cope with rising temperatures related to climate
change, with a focus on enhancing synergies between climate change adaptation and
mitigation, quality of life and development. For this purpose, the incentive programme
authorises additional building capacity with respect to the approved standards for buildings
having distinctive features of environmental sustainability.
Sustainable Cities network and Coordination of Italian Local Agenda 21 developed in “2011
Draft Guidelines for “local adaptation action plans of urban systems to climate change”.191 This
document aims at facilitating the integration of mitigation and adaptation actions in local
planning for resilient cities and territories in Italy. Furthermore, a national survey of best
practices in Italian urban and regional planning was launched, with the aim to support the
process of adapting the territories and cities to climate change.192
At the regional level, the Abruzzo Region and the National agency for new technologies, Energy and
sustainable economic development (ENEA) conducted a “Feasibility study for the assessment of
climate change impacts and vulnerabilities for the Abruzzo region and possible adaptation actions”193
focused to coastal marine environment, coastal zones, mountain areas and production activities. This
183 Carraro C. et al. (2008). 184 http://www.actlife.eu/EN/project-partners/municipality-of-ancona.xhtml. 185 EC LIFE Environment ACT (Adapting to climate Change in Time). 186 http://www.a21italy.it/medias/2091-bpadattamento-al-cambiamento-climaticocomune-ancona.pdf. 187 EEA (2012a). 188 GRaBS (GReen and Blue Space adaptation for urban areas and eco towns) (http://www.grabs-eu.org/). 189 http://www.laprovinciaperilclima.info/index.php?Pg=238. 190 http://www.grabs-eu.org/membersArea/files/faenza.pdf. 191 http://www.comune.modena.it/ilclimadellecitta/documenti/citta-resilienti-2011/modena/documento_indirizzi. 192 http://www.comune.modena.it/ilclimadellecitta/pagine/citta-resilienti. 193 ENEA (2011).
160
study aimed at identifying technical, scientific, methodological, procedural and public elements needed
to tailor the methodologies and procedures put forward by IPCC and UNEP to the Italian case for the
identification of possible adaptation options. The ultimate goal includes building a field-tested
prototype that could be taken up as a reference method for analysis of climate change adaptation at
the national level.
Energy – The promotion of the use of solar energy use started in Italy in February 2007.194
Research
Research on adaptation to climate change in the urban sector in Italy includes international projects
such as:
ACT (Adapting to Climate change in Time)195 project (2010-2012) supporting local authorities,
in particular the ones of the European cities in the Mediterranean basin in developing a
concerted Local Adaptation Strategy to increase cities resilience to climate change, taking into
account environmental, social and economic impacts of climate change; in Italy it was carried
out by the Municipality of Ancona196;
UHI (Urban Heat Island)197 project (2011-2014) aiming at developing strategies to mitigate,
adapt to, prevent and manage the risks related to the urban heat island phenomenon,
involving agencies, departments and directorates of Emilia-Romagna and Veneto Regions;
their areas of intervention are the metropolitan cluster of Bologna–Modena and the urban
corridor of Venezia–Padova. In this context the Veneto Region organized an international
conference on climate adaptation in urban areas (Venice, 23-24 May 2013)198;
CHAMP (Local Climate Change Response) project199 (2009-2012) “aimed at training and
supporting local and sub-regional authorities in implementing an integrated management
system for climate change mitigation and adaptation, and to promoting the model European-
wide”;
EU Cities Adapt (Adaptation Strategies for European Cities)200 project (2012-2013). Three
Italian cities (Alba, Padova and Ancona) were selected to participate to the training and
capacity building phase for developing and implementing an adaptation strategy. In particular,
within the project Ancona is considered a “peer city” that is advanced in its adaptation process
and will support the other “starting cities”.
6.2.10 Cost of adapting to climate change
In this topic only the already mentioned effort by FEEM-CMCC-ISPRA can be reported.201 This study
covers just few specific adaptation measures that have been explored or undertaken in “four
vulnerable areas: the Alps and glacier ecosystems, coastal zones, arid areas and areas threatened by
desertification, and zones prone to floods and landslides”.
Alps and glacier ecosystems - While a comprehensive economic evaluation over the Italian Alpine
zones is missing, some estimates for adjusting the tourism industry to climate change were
194 Gaudioso D. and Masullo A. (2009). 195 ACT (http://www.actlife.eu/EN/index.xhtml). 196 http://www.actlife.eu/EN/project-partners/municipality-of-ancona.xhtml. 197 UHI (http://www.eu-uhi.eu/index.php). 198 http://www.iuav.it/Ateneo-cal/2013/05/Il-clima-c/index.htm. 199 CHAMP (http://www.localmanagement.eu/index.php/champ:home?language=en). 200 EU Cities Adapt (http://eucities-adapt.eu/cms/). 201 Carraro C. (2008).
161
performed. The most common adaptation strategy for winter tourism involves artificial snowmaking;
however, this kind of intervention implies high costs linked to energy consumption, water resources
use, installation and maintenance and it is therefore not considered a sustainable adaptation option.
Coastal zones - Economic assessments of adaptation measures for coastal zones are almost
inexistent in Italy, with the exception of very specific issues (e.g. MO.S.E. project in the Venice
lagoon). The European PESETA project provided some estimates, which could be assumed for the
Italian case. According to these estimates, damages due to sea level rise could amount to 9-42 billion
Euros per year, depending on the sea level scenario. In addition, adaptation could reduce the costs of
adverse climate change impacts in the possible range of 7% - 50% in the medium run and up to 70%
in the long period.
Arid areas and areas threatened by desertification - At present, there are no available estimates
concerning the adaptation costs in the sector of drought and desertification for Italy. The main
reasons for that involve the lack of scientific literature as well as some specific features of the
phenomenon, that hamper the identification of measures to combat desertification and their economic
assessment.
Zones prone to floods and landslides - Urgent measures financed by Italy until 2006 for the
hydro-geological risk amounted to 447.36 million Euros for flood risk and 667.88 million Euros for
landslide risk. These figures could give an idea of the costs for the defence of the Italian territory from
hydro-geological disasters. Nevertheless, they do not represent at all the cost of protection in the light
of the increased risk associated with climate change.
6.2.11 Cooperation in preparing for adaptation202
Several trans-boundary initiatives have been undertaken in the context of the Alpine Convention.
In addition, several bilateral and multilateral initiatives (projects and programmes) on climate change
research on impacts, adaptation and mitigation were carried out, including capacity building activities
in developing countries, with the financial support by the Italian Ministry of Foreign Affairs and the
IMELS. IMELS cooperation initiatives on climate change adaptation with industrialized countries as well
as with developing countries in support of technology transfer (in the period 2006-2008) include
multilateral cooperation on climate change, bilateral cooperation with developing countries and
scientific and technological cooperation.
6.3 References
Alberini A. and Chiabai A. (2007) “Valutazione degli impatti dei cambiamenti climatici sulla salute”.
APAT & CMCC.
Albouy C., Guilhaumon F., Araujio M.B., Mouillot D. and Leprieur F. (2012) “Combining projected
changes in species richness and composition reveals climate change impacts on coastal fish
assemblages”. Global Change Biology. John Wiley & Sons Ltd.
Antonioli F., Artale V., Campiotti C.A., Cocito S., Delfanti R., Colonna N., Della Rocca B., Delmonaco
G., Di Sarra G., Frezzotti M., Giraudi C., Iannetta M., Margottini C., Marullo S., Menegoni P.,
Narcisi B., Peirano A., Picco P., Ruti P.M., Sciortino M., Struglia M.V., Valpreda E. and Verrubbi V.
(2007) “Dossier ENEA per lo studio dei cambiamenti climatici e dei loro effetti”. Roma: ENEA.
202 IMELS (2009).
162
Antonioli F. and Silenzi S. (2007). “Variazioni relative del livello del mare e vulnerabilità delle pianure
costiere italiane”. In “Quaderni della Società Geologica Italiana (SGI) 2”. SGI.
Araújo M. B., Thuiller W. and Pearson R.G. (2006) “Climate warming and the decline of amphibians
and reptiles in Europe”. Journal of Biogeography, 33:1712–1728. Blackwell Publishing Ltd.
Aucelli, P.P.C., Aminti P.L., Amore C., Artom C., Bellotti P., Bozzano A., Caputo C., Castellini G.,
Cipriani L.E., Cocco E., Corradi N., D’Alessandro L., Damiani L., Davoli L., De Pippo T., Devoti S.,
Di Gregorio F., Evangelista S., Ferrari M., Ferri S., Fierro G., Fontolan G., Ginesu S., Giuffrida E.,
Iannantuono E., Iuliano S., La Monica G.B., Landini B., Mascioli F., Nesci O., Palmentola G.,
Pranzini E., Pugliese F., Randazzo G., Raffi R., Rosskopf C.M., Salvatore M.C., Silenzi S., Simeoni
U. and Veltri P. (2006) “Lo stato dei litorali italiani”. In Studi Costieri, n.10/2006, 5-112. Gruppo
Nazionale per la Ricerca sull’Ambiente Costiero - GNRAC.
Autorità di bacino del fiume Po (2010) “Piano di Gestione del distretto idrografico del fiume Po”.
Autorità di bacino del fiume Po.
Beniston M. (2006) “Climatic change in the Alps: Perspectives and impacts”. Proceedings of the
“Wengen 2006 Workshop − Adaptation to the Impacts of Climate Change in the European Alps”.
Organisation for Economic Co-operation and Development (OECD).
Beniston M., Stephenson D.B., Christensen O.B., Ferro C.A.T., Frei C., Goyette S., Halsnaes K., Holt
T., Jylhä K., Koffi B., Palutikof J., Schöll R., Semmler T. and Woth K. (2007) “Future extreme
events in European climate: an exploration of regional climate model projections”. Climatic
Change (Vol. 81 , pp. 71-95). Springer Science + Business Media B.V.
Bigano A. and Bosello F. (2007) “Impacts of climate change on tourism in the Italian alps: an
economic assessment”. Report for the “ClimChalp” Project. ClimChalp Project.
Bigano A. and Pauli F. (2007) “Dimensioni socio-economiche, costi dell’inazione e strategie di
adattamento per l’impatto del cambiamento climatico sul sistema idrogeologico italiano” in Carraro
C., 2008. Società editrice il Mulino.
Bonati G., Coderoni S., Pontrandolfi A. and Vagnozzi, A. (2011) “Capitolo 8 - Strumenti per la
mitigazione e l’adattamento per il settore agricolo e forestale”. In MiPAAF, Rete Rurale Nazionale,
2011. Roma: MiPAAF.
Bosello F., Nicholls R.J., Richards J., Roson R. and Tol R.S.J. (2012) “Economic impacts of climate
change in Europe: sea-level rise”. Climatic Change 112:63–81. Springer.
Bosello F., Eboli F. and Parrado R. (2010) “Climate change impacts in the Mediterranean: final results
by means of a CGE analysis”. CIRCE Project.
Breil M., Catenacci M. and Travisi M. (2007) “Impatti del cambiamento climatico sulle zone costiere:
Quantificazione economica di impatti e di misure di adattamento – sintesi di risultati e indicazioni
metodologiche per la ricerca futura”. APAT & CMCC.
Carraro C. (2008) “Cambiamenti climatici e strategie di adattamento in Italia. Una valutazione
economica”. Società editrice il Mulino.
Carraro C. and Sgobbi A. (2008) “Climate change impacts and adaptation strategies in Italy: an
economic assessment”. FEEM Research Paper; CMCC Research Paper No. 14. Milan: FEEM; CMCC.
Carraro C., Crimi J. and Sgobbi A. (2008) “La valutazione economica degli impatti dei cambiamenti
climatici in Italia e delle relative misure di adattamento”. In Carraro, C., 2008. Società editrice il
Mulino.
Caserini S. and Pignatelli R. (2009) “Cambiamenti climatici e trasporti: il contesto e gli impatti”. In
Castellari, S. and Artale, V. (2009). Bononia University Press.
163
Castellari S. (2008) “Climate change, impacts and adaptation strategies in the alpine space: some
results from the INTERREG III B project CLIMCHALP”. Proceedings of the International Conference
“Mountains as Early Indicators of Climate Change”, 17-18 aprile 2008, Padova, Italy, pp. 81-91.
United Nations Environment (UNEP) Programme Regional Office for Europe – Vienna Office.
Castellari S. and Artale, V. (2009) “I cambiamenti climatici in Italia: evidenze, vulnerabilità e impatti”.
Bononia University Press.
Cebrian E., Uriz M.J., Garrabou J. and Ballesteros E. (2011) “Sponge Mass Mortalities in a Warming
Mediterranean Sea: Are Cyanobacteria-Harboring Species Worse Off?”. PLoS ONE 6(6). PLOS.
Cecchi L., Orlandini S., Forestiere F. and Morabito M. (2007) “3.3 Urban environments and
socioeconomic sectors”. In Menne B. and Wolf T., 2007. Rome, WHO-APAT.
Cecchi L., Orlandini S., Morabito M., Bindi M. and Morindo M. (2007) “3.2 Ecosystems, forests and
agriculture”. In Menne B. and Wolf T., 2007. Rome, WHO-APAT.
Cheung W. W.L., Lam V. W. Y., Sarmiento J.L., Kearney K., Watson R., Zeller D. and Pauly D. (2010)
“Large-scale redistribution of maximum fisheries catch potential in the global ocean under climate
change”. Global Change Biology, 16:24–35. Blackwell Publishing Ltd.
Cheung W.W.L., Sarmiento J.L., Dunne J., Frölicher T.L., Lam V.W.Y., Deng Palomares M.L., Watson
R. and Pauly D. (2012) “Shrinking of fishes exacerbates impacts of global ocean changes on
marine ecosystems”. Nature Climate Change. Nature Publishing Group (NPG).
Coma R., Ribes M., Serrano E., Jiménez E., Salat J. and Pascual J. (2009) “Global warming-enhanced
stratification and mass mortality events in the Mediterranean”. PNAS 2009 106 (15) 6176-6181.
National Academy of Sciences.
Danovaro R., Fonda Umani S. and Pusceddu A. (2009) “Climate Change and the Potential Spreading of
Marine Mucilage and Microbial Pathogens in the Mediterranean Sea”. PLoS ONE 4(9): e7006.
PLOS.
EEA (European Environment Agency) (2007) “Climate change and water adaptation issues”. EEA
Technical report No 2/2007. Copenhagen: EEA.
EEA (European Environment Agency) (2010a) “Adapting to climate change”. In EEA, 2010b.
Copenhagen: EEA.
EEA (European Environment Agency) (2010b) “The European environment - state and outlook 2010
(SOER 2010)”. Copenhagen: EEA.
EEA (European Environment Agency) (2012a) “Urban adaptation to climate change in Europe -
Challenges and opportunities for cities”. EEA Report No 2/2012. Copenhagen: EEA.
EEA (European Environment Agency) (2012b) “Climate change, impacts and vulnerability in Europe,
An indicator-based report”. EEA Report No 12/2012. Copenhagen: EEA.
ENEA (Agenzia nazionale per le nuove tecnologie, l’energia e lo sviluppo economico sostenibile) (2011)
“Politiche e misure nazionali sui cambiamenti climatici. Elementi per una valutazione”. Roma:
ENEA.
EU Commission (2009) “Green Paper on the reform of the Common Fisheries Policy”. (COM (2009)
163 final)). EU Commission.
FAO (2008) “Climate Change for fisheries and aquaculture. Technical background document from the
expert consultation held on 7 to 9 April 2008, FAO, Rome, Italy”. Rome: FAO.
Flörke M., Wimmer F., Dworak T., Laaser C., Vidaurre R., Tröltzsch J., Marinova N., Fons J., Fulco L.,
Giupponi C., Bosello F. and Mysiak J. (2011) “Final Report for the project Climate Adaptation
modelling water scenarios and sectoral impacts”. CESR - European Commission Directorate
164
General Environment.
Forestiere F. (2007) “4.4 Air quality and health”. In Menne B. and Wolf T., 2007. Rome, WHO-APAT.
Funari E., Martinelli A., Blasi M. F., Carere M., Della Bella V., Mancini L., Marcheggiani S., Mattera F.
and Stefanelli M. (2007) “3.1 Water”. In Menne B. and Wolf T., 2007. Rome, WHO-APAT.
Funari E., Blasi M. F., Carere M., Della Bella V., Mancini L., Marcheggiani S., Mattera F. and Stefanelli
M. (2007) “4.3 Flooding and health. In Menne B. and Wolf T., 2007. Rome, WHO-APAT.
Galeotti M., Goria A., Mombrini P. and Spantidaki E. (2004) “Weather Impacts on Natural, Social and
Economic Systems (WISE) Part II: Individual Perception of Climate Extremes in Italy”. FEEM,
NOTA DI LAVORO 32.2004. Milan: FEEM.
Gambarelli G. and Goria A. (2004) “Economic evaluation of climate change impacts and adaptation in
italy”. FEEM, Note di Lavoro 103.04. Milan: FEEM.
Gaudioso D. and Masullo A. (2009) “Impatti dei cambiamenti climatici sul settore energetico”. In
Castellari S. and Artale V. (2009). Bononia University Press.
Greiving S. et al. (2011) “ESPON Climate Project. Climate change and territorial effects on regions and
local economies”. ESPON & IRPUD, TU Dortmund.
IMELS (Italian Ministry of Environment Land and Sea) (1999) “National Action Programme to Combat
Drought and Desertification”. Rome: IMELS.
IMELS (Italian Ministry of Environment Land and Sea) - Direzione Generale per difesa del suolo (2008)
“Il rischio idrogeologico in Italia”. Rome: IMELS.
IMELS (Italian Ministry of Environment Land and Sea) (2009) “Chapter VI. Vulnerability assessment,
climate change impacts and adaptation measures”. In “Fifth National Communication under the
UNFCCC”. Rome: IMELS.
IMELS (Italian Ministry of Environment Land and Sea) (2010) “Strategia Nazionale per la Biodiversità”.
Rome: IMELS.
IMELS (Italian Ministry of Environment Land and Sea) (2011) “Report Nazionale sui progressi realizzati
in materia di gestione integrata delle zone costiere (2006-2010)”. Rome: IMELS.
IPCC (2007) – Parry M.L., O.F. Canziani, J.P. Palutikof, P.J. van der Linden and C.E. Hanson, Eds.,
2007, Climate Change 2007: Impacts, Adaptation and Vulnerability. Contribution of Working
Group II to the Fourth Assessment Report of the Intergovernmental Panel on Climate Change,
Cambridge University Press, Cambridge, UK, 982pp.
Kazmierczak A. and Carter J. (2010) “Adaptation to climate change using green and blue
infrastructure. A database of case studies”. University of Manchester, GRaBS project.
Majori G. (2007) “4.5 Vector-borne diseases”. In Menne B. and Wolf T., 2007. Rome, WHO-APAT.
Medri S., Venturini S. and Castellari S. (2013) “Overview of key climate change impacts,
vulnerabilities and adaptation action in Italy”. CMCC Research Paper. Issue RP0178, July 2013.
(available at: http://www.cmcc.it/it/publications/rp0178-overview-of-key-climate-change-impacts-
vulnerabilities-and-adaptation-action-in-italy).
Menne B. and Wolf T. (2007) “Environment and health risks from climate change and variability in
Italy”. Rome, WHO-APAT.
Menne B., Sinisi L. and Bertollini R. (2009) “6. Conclusions”. In Menne B. and Wolf T., 2007. Rome,
WHO-APAT.
Michelozzi P., de Donato F. and Kirchmayer U. (2007) “4.1 Heat and health”. In Menne B. and Wolf
T., 2007. Rome, WHO-APAT.
Miglietta F., Bindi M. and Vaccari F.P. (2009) “Impatti dei cambiamenti climatici sull’agricoltura”. In
165
Castellari S. and Artale V. (2009). Bononia University Press.
Mima S., Criqui P. and Watkiss P. (2011) “Technical Policy Briefing Note 4: Energy - The Impacts and
Economic Costs of Climate Change and Energy in the European Union. Summary of Sector Results
from the ClimateCost project”. ClimateCost project. Funded by the European Community’s
Seventh Framework Programme.
MiPAAF (Ministero delle Politiche Agricole Alimentari e Forestali, Ispettorato Generale - Corpo Forestale
dello Stato). CRA (Istituto Sperimentale per l’Assestamento Forestale e per l’Alpicoltura) (2005)
“INFC 2005 – Inventario Nazionale delle Foreste e dei Serbatoi Forestali di Carbonio”. Sistema
Informativo Agricolo Nazionale (SIAN).
MiPAAF (Ministero delle Politiche Agricole Alimentari e Forestali), Rete Rurale Nazionale (2011) “Libro
bianco - Sfide ed opportunità dello sviluppo rurale per la mitigazione e l'adattamento ai
cambiamenti climatici”. Roma: MiPAAF.
Perini L., Salvati L., Ceccarelli T., Sorrenti S. and Zitti M. (2008) “La desertificazione in Italia. Processi,
indicatori, vulnerabilità del territorio”. Acireale – Roma: Bonanno Editore.
Petriccione B., Cindolo C., Cocciufa C., Ferlazzo S. and Parisi G. (2009) “Gli effetti dei cambiamenti
climatici sugli ecosistemi forestali”. Atti del Terzo Congresso Nazionale di Selvicoltura. Taormina
(ME), 16-19 ottobre 2008. Accademia Italiana di Scienze Forestali, Firenze, p. 570-574.
Policy Research Corporation (in association with MRAG) (2009) “The economics of climate change
adaptation in EU coastal areas”. (“Country overview and assessment”. Chapter 11. “Italy”).
European Commission, Directorate-General for Maritime Affairs and Fisheries.
Portoghese I., Vurro M. and Mariotti A. (2009) “Impatti sul ciclo idrologico e risorse idriche”. In
Castellari S. and Artale V. (2009). Bononia University Press.
Rete Rurale Nazionale - RRN (2010) “Climate Change and Renewable Energy measures in EU RDPs
2007 – 2013 Member state profile - Italy”. European Network for Rural Development (EN RD).
Roson R. (2007) “Gli impatti macroeconomici del cambiamento climatico sui vari settori economici e
sul commercio internazionale con un modello di equilibrio generale”. APAT & CMCC.
Sciortino M., Luise A. and Genesio L. (2009) “La desertificazione e il degrado del territorio”. In
Castellari S. and Artale V. (2009). Bononia University Press.
Seddaiu G., Solinas S., Pisanu P.A. and Roggero P.P. (2009) “Buone pratiche di lotta alla
desertificazione” NRD – Nucleo di Ricerche sulla Desertificazione - Università di Sassari.
Sinisi L. (2009) “Cambiamenti climatici e determinanti ambientali di salute”. In Castellari, S. and
Artale, V. (2009). Bononia University Press.
Soncini A. and Bocchiola D. (2011) “Assessment of future snowfall regimes within the Italian Alps
using general circulation models”. Cold Regions Science and Technology 68(3), 113–123. Elsevier.
Vafeidis A.T., Nicholls R.J., McFadden L., Tol R.S.J., Spencer T., Grashoff P.S., Boot G. and Klein R.J.T.
(2008) “A new global coastal database for impact and vulnerability analysis to sea-level rise”.
Journal of Coastal Research 24(4):917–924. Coastal Education and Research Foundation (CERF).
Valentini R., Petriccione B., Sezzi E., Santini M., Vannini, Vettraino A.M. and Spano D. (2009) “Foreste
e cambiamenti climatici”. In Castellari S. and Artale V. (2009). Bononia University Press.
Valentini R. and Santini M. (2008) “Chapter 3. Climate impact scenarios on forest biodiversity and land
use changes in Alpine zone”. In ClimChAlp INTERREG IIIB Alpine Space (2008) “ClimChAlp -
Extended Scientific Final Report”. ClimChAlp INTERREG IIIB Alpine Space.
Van Passel S., Massetti E. and Mendelsohn R. (2012) “A Ricardian Analysis of the Impact of Climate
Change on European Agriculture”, FEEM note di lavoro 83.2012. Milan: FEEM.
166
Vaquer-Sunyer R. and Duarte C.M. (2011) “Temperature effects on oxygen thresholds for hypoxia in
marine benthic organisms”. Global Change Biology, 17, 1788-1797. Blackwell Publishing Ltd.
Viaroli P., Marinov D., Bodini A., Giordani G., Galbiati L., Somma F., Bencivelli S., Norro A. and
Zaldívar Comenges J.-M. (2007) “Analysis of clam farming scenarios in Sacca di Goro lagoon”.
Transitional Waters Monographs, 1 (p. 71-92). University of Salento - SIBA.
167
7 FINANCIAL RESOURCES AND TRANSFER OF TECHNOLOGY, INCLUDING
INFORMATION UNDER ARTICLES 10 AND 11 OF THE KYOTO
PROTOCOL203
7.1 Provision of New and additional resources
Since the Fifth National Communication, Italy has contributed to approximately 13.270 million of USD
in ODA, according to OECD DAC estimates.
The Italian Ministry of Foreign Affairs has disbursed around 32 million EUR in bilateral cooperation with
developing countries for climate change related activities.
The commitment of Italian Ministry for the Environment, Land and Sea (IMELS) to tackle climate
change and encourage technology transfer in the less developing countries is strongly expressed in
the Decree (DLGS 13/03/2013). In fact, this latter will define the criteria for the allocation of the
revenues from auctioning of CO2 rights. In particular, it is established that the 50% of those revenues
will be dedicated to projects addressed to reduce emissions from deforestation and forest degradation,
to improve the technology transfer, as well as all the adaptation measures to climate change in the
least developed countries. This Decree accomplishes to several targets. For instance, it reflects the EU
Directive 2003/87/EC related to establish a scheme for greenhouse gas emissions allowance trading
with the Community, contributes to the Global Fund on Climate Change created in Poznan (COP 14 /
MOP 4), meets the commitment undertaken in the Durban Conference (COP 17/MOP 7), in favour of
the less developing countries.
7.2 Multilateral cooperation on climate change
Between 2009 and 2012, the Italian multilateral environmental activities were characterized as the
following: supply of financial resources, design and implementation of programmes and projects,
promotion of transfer of environmentally-sound technologies aiming at reducing the impacts of human
activities on climate change and support to adaptation measures.
In particular, IMELS multilateral performances were carried out with several relevant organizations or
programmes, such as: UNESCO, UNIDO, the Food and Agriculture Organisation (FAO), the Regional
Environmental Centre for Central and Eastern Europe (REC), the Global Environment Facility (GEF),
the World Bank (WB), the United Nations Development Programme (UNEP) and the Mediterranean
Action Plan (MAP).
In this paragraph, it will be described the activities that are particularly significant to the aim of the
Communication.
As mentioned in the previous National Communications, the IMELS continued its activity with
UNESCO, under the Memorandum of Understanding, mainly the related partnership: “Water
Programme for Africa, Arid and Water Scarce Zones”. In particular, it produced the second phase of
the Programme entitled: “Water Programme for Environmental Sustainability – Towards adaptation
measures to human and climate impacts”, addressing environmental sustainability through adaptation
203 Lead authors: Emanuela Vignola (IMELS) and Alessandro Negrin (IMELS). Contributing authors: Giorgia
Caropreso (IMELS), Alessandro Celestino (IMELS), Carmen Glorioso (IMELS), Roberta Ianna (IMELS), Vanessa Leonardi (IMELS), Alessandro Peru (IMELS), Federica Sprovieri, (IMELS), Fiamma Valentino (IMELS), Margherita Vitale (IMELS). Special Thanks to: Ministry of Foreign Affairs: Directorate General for Development Cooperation.
168
measures to remediate human and climate impacts on groundwater resources. This programme was
implemented in several areas (Algeria, Brazil, Caribbean, Iraq, Montenegro, Morocco, Southern Africa,
Tunisia, Vietnam). In cooperation with the recipient countries, the project developed methodologies
for the sustainable management of costal aquifer systems and for the protection of groundwater
dependent ecosystems as well as prevention of contamination of marine ecosystem. The project
ended in 2010.
IMELS signed an agreement with UNIDO ITPO for the technical assistance to Sub-Saharan African
countries for the promotion of environmentally-sound technologies and share energy efficiency best
practices. The purpose of the project is to contribute to the sustainable industrial development of
selected countries such as Cameroon, Ghana, and Tanzania, especially in respect to the
energy/environment nexus. The project seeks to identify and mobilize technical assistance measures
and support the implementation of environmentally-sound investment and energy-efficient technology
transfer. The project will promote energy efficiency as a method of strengthening the sustainability
and reducing the carbon footprints of selected industrial processes through training, capacity-building,
transfer of knowledge and know-how and technical assistance. Project objectives will be achieved by
supporting the evolution of partnership opportunities into business proposals and providing relevant
information about the investment potential of environmentally-sound and energy efficient
technologies.
In Central Eastern Europe, multilateral activities continued to be mostly implemented through the
Italian Trust Fund (ITF), established, in 2001, within the Regional Environmental Center for
Central and Eastern Europe (REC), located in Budapest, Hungary.
Since the establishment of the ITF, Italy become a major partner in environmental and sustainability
solutions in the region served by the REC. Italy’s financial contribution has exceeded EUR 12 million,
backing the successful implementation of more than 200 projects, across Europe and beyond.
The funded projects have raised awareness of far-reaching challenges related to the environment,
climate change and health, and have provided fundamental help in identifying solutions. Cooperation
between the ITF and the REC has also established and promoted strong networks among the
beneficiary countries for regional and global solutions and has opened up new opportunities and
channels for the involvement of Italian and other key stakeholders — government, business, academia
and civil society.
With particular reference to climate change and energy issues, several programs were carried out on
training and capacity building, energy efficiency innovation, trans-boundary cooperation , promotion
and awareness-raising regarding climate change mitigation and adaptation policies, development and
promotion of low-carbon solutions
From 2009 to 2012 the following specific projects have been developed within this framework:
Eco-building programme (2010) - Supporting efforts to promote a carbon free society a
campaign of activities with the aim of disseminating information for various target groups in
the Central and Eastern European region was developed, channelling messages related to
novel ECO-building solutions and possibilities to the relevant stakeholders and decision
makers. The overarching goal was to promote an ECO-building campaign, using existing
technologies in innovative and integrated design solutions, to demonstrate that significant
reductions in the environmental impact of energy use in buildings and in greenhouse gas
emission are possible. These activities increased awareness about the best way to balance two
important requirements: to reduce the demand for heating, cooling and lighting, at the same
169
time as supplying the necessary heating, cooling and lighting in the most efficient way, based
as much as possible on renewable energy sources. With the aim of presenting and
disseminating all the relevant information to as wide an audience as possible, the initiative
focused on a presentation and an exhibition on ECO-building solutions to be delivered at
various events in different regions. These events allowed sharing the best available
technologies and expertise with the industry, stakeholders and decision makers, across
national borders. Activities included: workshops, presentations, discussions and business
networking with the organisations of various regions, principally concerning the drivers,
barriers, funding solutions, design principles and best practices of ECO-building. They brought
local, regional and international entrepreneurs, decision makers and stakeholders together,
allowing them to exchange views and develop business opportunities for a low carbon future.
Certificate Programme on Corporate Sustainability (2009-2011) - The Certificate Programme
on Corporate Sustainability objective’s was to promote the approach of sustainability and to
encourage the integration of economic, social and environmental concerns in core business
processes by delivering series of courses on sustainable development. The project also aimed
at developing a better understanding of the role of businesses in attaining the goals of
sustainable development and encouraging the change in business culture to implement
patterns of sustainable production that reduces environmental stress. In order to reach to the
defined objectives, the project developed a multi-faceted capacity building programme on
sustainability with different training modules, research topics, case studies and site visits for
the participation of mid-level managers working in different sectors of Turkish businesses. The
programme was held at Bogazici University, which is one of the most prominent universities of
Turkey. The programme was shaped up with different “must and elective courses” to increase
the interest from different industrial and/or service sectors. There was three different training
modules namely; introducing, financing and implementing corporate sustainability.
Specifically, some of the modules touched upon how innovation in low-carbon technologies is
critical to achieving the greenhouse gas emissions reductions necessary to addressing climate
change while maintaining robust economic growth. In fact, businesses are an important
engine of the low-carbon innovations that are vital to solving the global climate change
problem. The aforementioned modules include: Financing Low Carbon Economy; Financial
Options in the International Carbon Markets for the Energy Industry; Calculation of
Greenhouse Gas Accounting – Climate Platform; Introduction to the Carbon Management.
Sustainable Development Academy (SDA) (2010 – ongoing) - The “Courses for Sustainability”
run by the Sustainable Development Academy of the REC (SDA) are the fruit of a hugely
successful Italian initiative spearheaded by the Italian Ministry for the Environment, Land and
Sea. They have now a prestigious, nearly ten years long track record. The main project aims
and the institutional backbone of the programme remained the same throughout, while
changes in detail reflected the adaptation to the needs of different constituents and to the
shifts in priorities of environmental policy. The main project aim still is to bring together major
stakeholders who share the responsibility for forming and implementing environmental policy,
to do this on a regional basis so that useful and meaningful international and inter-sectoral
links can be forged, and to offer up-to-date, high-quality and practice-oriented capacity
170
building. All programs have been developed through several modules, articulated in different
topics and subjects, among which climate change has a prominent role. The training courses
are carried out in cooperation with different partners, among which academies, such as Venice
International University, Bosphorus University, and AgroInnova.
First International High-Level Conference on Water, Climate and Health (2012) -The High-
Level Conference on Water, Climate and Health, organised by the IMELS and the Regional
Environmental Center for Central and Eastern Europe, was held in Arezzo (Italy), on
November 23, 2012, under the framework of the Seventh Forum on Health Risk Management
and the First International Forum on Development, Environment and Health. It provided a
valuable opportunity to explore critical environmental factors, that endanger human health, to
identify risk assessment challenges, and to discuss the main policy tools and possible joint
actions. The conference built on high-level science-policy dialogue, and provided an
opportunity for national and international discussion and trans-boundary cooperation on
environment and health as new drivers for green economy and sustainable development. The
aim of the conference was to identify future steps towards the development of joint
programmes and activities to tackle key environment and health challenges such as climate
change, extreme weather events, and water and land management, particularly in South
Eastern Europe, the Mediterranean and Central Asia.
Europe-China Clean Energy Center (EC2) (2010 – ongoing) - The Europe-China Clean Energy
Centre is a five-year cooperation project, funded by the European Union. In April 2010, it was
initiated by the European Commission, the National Energy Administration of China and the
Ministry of Commerce of China, with the support of IMELS, which is supporting the Chinese
Government’s efforts to shape a more sustainable, environment-friendly and efficient energy
sector while tackling climate change challenges. The Centre uses a combination of research
and technological analysis on clean energy, identification and addressing of technological
needs, potential projects, best practices and partnership opportunities. EC2 will act as a
clearing house for new clean technologies, by facilitating the interaction among research
institutions and by promoting technological analysis, best practices sharing and partnership
opportunities building. The available knowledge on state-of-the art and emerging technologies
will be mapped and collected. EC2 will also establish an innovative platform for capacity
building for Chinese institutions in the field of energy policy and regulation and advise EU and
Chinese decision-makers on how to develop and enforce policy-making, energy planning and
reform. A special focus will be put on promoting and organising high level dissemination
activities on clean energies projects and financing schemes.
USE Efficiency (2009 – 2012) -Energy use directly impacts the environment through the
extraction and consumption of natural resources for fuel and air emissions and climate
changes resulting from the combustion of fossil fuels. The environmental degradation resulting
from climate change is multi-faceted. One simple way of addressing the complex issues
related to climate change is to increase energy efficiency and the use of renewable energy,
thereby reducing greenhouse gas emissions. Within the framework of the Intelligent Energy
Europe Programme (IEE), developed to help deliver on the ambitious climate change and
171
energy targets that the EU has set for itself, USE Efficiency created a common stream for
energy efficiency systems in university buildings, where universities and students were
proposed as shining examples both for energy efficiency solutions and for energy efficiency
behaviour. The Project involved 10 EU countries (9 Universities and 4 market players), and
had the aim to improve energy efficiency in university buildings and to establish training
programs for students. Students were the main actors of the project, learning about energy
efficiency, working and interacting together with professors and technicians. To act on
students meant to act on direct future market players in diffusion of public opinions. The wide
geographical and climatic coverage allowed an important crossover of methodologies even to a
professional and technological level.
The partnership agreement between IMELS and World Bank is still in place. It consists of a number
of funds dedicated at purchasing emission reductions from projects related global environmental
protection and transfer clean technologies for sustainable development in least developed countries.
The Global Bioenergy Partnership
GBEP was established to implement the commitments taken by the G8 in the 2005 in Gleneagles Plan of Action to support "biomass and biofuels deployment, particularly in developing countries where biomass use is prevalent". Following a consultation process among developing and developed countries, international agencies
and the private sector, the Global Bioenergy Partnership (GBEP) was launched at the 14th session of the Commission on Sustainable Development (CSD-14) in New York on 11 May 2006, and in response to the 2005 G8 mandate (renewed in 2007, 2008 and 2009), GBEP initiated an international discussion on the issues related to bioenergy. From 2006 to 2012, GBEP received a renewed mandate by the G8, then, in 2013, a recognition and support by the G20.
The Partnership is a forum where voluntary cooperation works towards consensus in the areas of the sustainability of bioenergy and its contribution to climate change mitigation. It brings together public, private and civil society stakeholders and focuses its activities in three strategic areas: Sustainable
Development, Climate Change, Food and Energy Security. GBEP partners now comprise 23 countries and 14 international organizations and institutions: Argentina, Brazil, Canada, China, Colombia, Fiji, France, Germany, Ghana, Italy, Japan, Mauritania, Mexico, Netherlands, Paraguay, Russian Federation, Spain, Sudan, Sweden, Switzerland, Tanzania,
United Kingdom, United States of America, Economic Community of West African States (ECOWAS), European Commission, FAO, IDB, IEA, International Renewable Energy Agency (IRENA), UNCTAD, UN/DESA, UNDP, UNEP, UNIDO, UN Foundation, World Council for Renewable Energy (WCRE) and European Biomass Industry Association (EUBIA). A further 26 countries and 11 international organizations and institutions are participating as Observers: Angola, Australia, Austria, Cambodia, Chile, Denmark, Egypt, El Salvador, Ethiopia, Gambia, India, Indonesia, Kenya, Lao PDR, Madagascar, Malaysia, Morocco, Mozambique, Norway,
Peru, Rwanda, South Africa, Thailand, Tunisia, Viet Nam, Zimbabwe, African Development Bank (AfDB), Asian Development Bank (ADB), Economic Commission for Latin America and the Caribbean (ECLAC), European Environment Agency (EEA), Global Environment Facility (GEF), International Fund for Agricultural Development (IFAD), Organization of American States (OAS), Union Economique et Monétaire Ouest Africaine (UEMOA), World Agroforestry Centre (ICRAF), World Bank and the World Business Council on Sustainable Development (WBCSD).
Chair of the Partnership is Corrado Clini, Director General, Ministry for the Environment Land and Sea, Italy; Co-Chair is André Aranha Corrêa do Lago, Director, Ministry of Foreign Affairs, and Brazil. The GBEP Secretariat, hosted at FAO Headquarters in Rome with the support of Italy, is the principal coordinator of the Partnership communications and activities. Since its launch, GBEP has made significant advances in its programme of work toward sustainable bioenergy. In January 2011, GBEP released the "GBEP Common Methodological Framework for GHG Lifecycle Analysis of Bioenergy - Version One" for the use of policy makers and stakeholders when
assessing GHG emissions associated with bioenergy and to make GHG lifecycle analyses (LCAs) more transparent.
172
In December 2011, GBEP published its report on sustainability indicators for bioenergy, providing an
invaluable resource in helping countries assess and develop sustainable production and use of bioenergy.
The GBEP Working Group on Capacity Building for Sustainable Bioenergy (Working Group) was
established in May 2011 to promote the dissemination, use, and implementation of the outcomes of the GBEP Task Forces on GHG Methodologies and on Sustainability through activities and projects. Since its establishment the Working Group has been focusing on the followings: - Sustainable Modern Bioenergy in the ECOWAS region. Three forums were organized: in Bamako (Mali) to initiate a regional dialogue to support the development of regional and national bioenergy strategies; in Rome to discuss biomass resource assessment and mapping, and in Brasilia to discuss agricultural productivity and feedstock conversion, in order to further facilitate effective policy
planning for a sustainable bioenergy sector in the region. - Raise awareness and share data and experience on the implementation of GBEP indicators. Three workshops were organized to share very interesting experiences and lessons learned from the pilot testing of the GBEP sustainability indicators in various countries. These events highlighted that the indicators are useful tools to catalyze flow of data from the bioenergy sector to research and government, that will then use it to develop policies to guide the industry practices.
- Study Tour for Capacity Building. A Bioenergy Week was held in Brasilia in 2013 consisting in short training courses analyzing technical and public policy aspects of bioenergy development, in line with GBEP 24 indicators of sustainability. Experts from developing countries in the Americas, Africa and
Asia had the opportunity to learn from positive experiences in the sustainable production and use of bioenergy that could guide the design and implementation of bioenergy policies in their countries. - Initial discussions on capacity building activities on woody biomass, bioenergy atlas and food security.
7.3 Bilateral cooperation with developing countries
Inspired by the Millennium Development Goals and by the targets set by the Multilateral
Environmental Agreements, Italy is still keen to continue the activities mentioned in the Fifth National
Communication. In order to be coherent with the huge efforts already made in the previous years, the
geographical focus has not been changed. Therefore, the areas and countries benefiting from the
Italian bilateral cooperation are: North Africa, China, India, the Mediterranean region, Central and
Eastern European, Iraq, Latin America, Pacific islands.
The following sub-paragraphs will provide the description of the most relevant projects.
7.3.1 Cooperation on climate change with Asian and Middle East countries
IMELS started the Sino-Italian Cooperation Program for Environmental Protection (SICP) with the
People's Republic of China, more than ten years ago. In this way, it was possible to develop over
200 project lines, for the environmental monitoring and management, mostly contributed at
strengthening Chinese national and local institutions, protecting and conserving natural resources,
water management, waste-to-energy, developing renewable energy sources, energy efficiency,
sustainable urban planning and eco-building, environmental protection in the poorest regions,
developing low-emission transport systems and technologies, sustainable agriculture, biodiversity
protection and forest management. About 60 projects were strictly related to climate change activities
and have been identified in terms of the objectives and programs established in the United Nations
Convention on Climate Change, while the others can also be considered useful to create and enabling
environment for mitigation and adaptation measures.
Project formulation has been entrusted to a permanent Sino-Italian task force made up of experts
from IMELS, Chinese Ministries and Agencies, scientific Institutions, Italian and Chinese Universities.
This task force constitutes the Program Management Offices (PMO) based in Beijing and Shanghai.
IMELS entrusted the Italian Trade Commission, Beijing and Shanghai Offices, as project manager of
this task force. The Italian Trade Commission ensures the cooperation of Italian enterprises interested
173
in joining the program design and co-funding.
Since 2000, in the framework of SICP, IMELS has co-financed projects with 185 million €, either
through direct contribution to the Chinese partnering entities or through the Trust Funds established in
the World Bank and other Multilateral Funds. Other co-financing has been granted by the Chinese
institutions and Italian companies involved in the program, the United Nations, the Global
Environmental Facility, the Word Bank and the Multilateral Fund for the Montreal Protocol on the
Protection of the Ozone Layer, with at least 165 million €. The total value of the projects developed so
far or currently on-going is of 350 million €.
In many cases, the projects have created the opportunity for additional programs in key sectors for
the sustainable development of Chinese economy, developed by the Chinese authorities jointly with
the Italian companies already involved in the bilateral cooperation, without further support from the
Italian Ministry for the Environment.
In 2010, in cooperation with the National Development and Reform Commission, IMELS launched the
Sino-Italian Climate Change Cooperation Program (SICP), a specific cooperation program aiming at
implementing joint initiatives in the field of mitigation and adaptation to climate change, transfer and
promotion of low-carbon technologies, studies and researches as scientific support to decision-making.
This programme is still ongoing.
Under SICP, IMELS and the Chinese Ministry of Science and Technology (MOST) established the Sino-
Italian Facility aimed at supporting joint projects for the development, transfer and promotion of
technologies able to reduce GHGs emissions as well as capacity building actions for CDM projects
development.
A specific activity line has been developed for supporting the Beijing Municipality’s Program for 2008
Green Olympics. 17 projects have been implemented, focusing on low-emissions transport systems in
Beijing, including a zero-emissions fleet in the Olympic Village; solar energy applications for the
Olympic Village; air quality monitoring and atmospheric pollution control, including the establishment
of 2 advanced laboratories; sustainable urban planning and energy efficiency, water resources
recovery and management.
In cooperation with the Venice International University, an impressing capacity building action has
been implanted. This action aimed at providing a comprehensive training on Sustainable Development
for key public officers and business experts. The Advanced Training Program on Sustainable
Development and Environmental Management has trained around 10.000 Chinese beneficiaries.
In 2003, IMELS started the cooperation with Iraq, mainly with the Free Iraq foundation (IF) for the
environmental restoration and conservation of the water resources in the marshes of Southern
Mesopotamia. The “New Eden” project was initiated with the collaboration of IF and the involvement of
the Iraqi Ministries of Environment (MoE), Municipalities and Public Works (MMPW) and Water
Resources (MWR). It was realised the “New Eden Master Plan for Integrated Water Resources
management in the Marshland Areas”. Indeed, IMELS proceeded with transferring technology and
know-how, so that the Iraqis themselves could then take over the long term implementation of the
project, revising it as conditions change and following up by encouraging the adequate development of
training curricula to prepare future environmental managers. The plan for the 2008-2009 included
several projects and activities that were developed under the framework of the New Eden Master Plan.
Finally, the activities for the period 2010-2014 are dedicated to make the MoE able to joint and
174
implement the International Conventions on environmental protection, mainly UNFCCC and Kyoto
Protocol, and to create a National Centre for the studying of Climate Change inside the Ministry.
In India, the cooperation activity is still active and ruled under the Memorandum of Understanding on
“Co-operation in the Area of Climate Change and Development and Implementation of Projects under
the Clean Development Mechanism of the Kyoto Protocol”, signed in 2005, with the Indian Ministry of
Environment and Forests (MoEF) and on a Memorandum of Understanding on “Indo-Italian Renewable
Energy Cooperation” signed in 2007 with the Indian Ministry of New and Renewable Energy (MNRE). A
successful bilateral project is the “feasibility study on small-scale biomass power generation”, the
project aims at developing new opportunities of cooperation between Italy and India in the renewable
energy sector, by studying the adaptation to EU standards and to different biomass feedstock of a
small scale Indian pilot plant for power generation based on biomass gasification, developed with the
Indian Institute of Science (Bangalore).
7.3.2 Cooperation in the Mediterranean region and the African region on climate change
In the framework of the “Mediterranean Renewable Energy Programme (MEDREP)”, largely
described in the previous communications, IMELS has developed a cooperation program for the
promotion of the renewable energy sources, energy efficiency, low-emission technologies and
sustainable development strategies in collaboration with Universities, Research Centres, Enterprises,
International Institutions, local Agencies and Public Administrations.
The Mediterranean Renewable Energy Centre (MEDREC), established in 2004, in Tunis, in collaboration
with the Ministry for Industry of Tunisia and the Tunisian National Agency for Energy Conservation is
still working. It is “the Northern African regional focal point” of the Renewable Energy and Energy
Efficiency Partnership (REEEP), constituted as a voluntary multi-stakeholder partnership, contributing
to the implementation of Agenda 21 and Johannesburg Plan of Implementation (JPOI), with the
objective to expand the global market for renewable energy and energy efficiency.
MEDREC provided financial and technical assistance to the establishment and management of the
Solar Water Heater Subsidy Facilities in Tunisia and Egypt, with the aim to promote individual and
collective solar water heating installations in the residential, tertiary and industrial sectors.
Furthermore, the Center has continued its activity in creating professional capacities in the region, in
the field of the Kyoto Protocol and in other fields, such as Bio-Energies, organizing several training
cycles aiming at addressing the topic of CDM projects development and the theme of Bio-Energies,
under a practical and operational point of view. Participants, from major private and public institutions
of the region, were provided with presentations of concrete experiences while addressing theoretical
and technical issues.
In the framework of the MEDREP programme, IMELS, with the technical support of MEDREC, has been
co financing projects in Algeria, Egypt, Israel, Tunisia and Morocco, designed to:
delivering electricity to isolated rural populations;
addressing the global approach of renewable energy introduction in the building sector in
coherence with the energy efficiency policy;
disseminating cooling systems for the food conservation, powered by renewable;
implementing innovative financial mechanisms to support the deployment of renewable
energies (Mediterranean Investment Facility-PROSOL);
175
identifying and promoting project opportunities in the framework of the Clean Development
Mechanism under the Kyoto Protocol, creating the suitable conditions of investment for Italian
private sector.
176
The PROSOL project and the Mediterranean Investment Facility (MIF)
Within the framework of the Mediterranean Renewable Energy Programme (MEDREP), as already
described in the past Communication, a financing mechanism to support the Tunisian market of Solar Water Heating (SWH) systems has been jointly implemented by the Tunisian Government and the
United Nations Environment Programme - Division of Technology, Industry, and Economics (UNEP/DTIE), with the financial support of the Ministry for the Environment Land and Sea of Italy and the technical support of the Mediterranean Renewable Energy Centre (MEDREC).
Based on the Tunisian Government’s strategy, PROSOL supports the solar water heating market and provides training for local SWH suppliers. The PROSOL has proved to be a great success: since February 2005 it has led to the installation of a value of 122.500 systems, for a total of 360.000 m2 of collectors; the whole turnover has reached 95 million EUR.
The PROSOL project has been presented to the CDM Executive Board for registration as the first “Programmatic CDM” in the Mediterranean Region.
On the basis of the successful conclusion of Prosol, the IMELS, in collaboration with UNEP-DTIE, has decided to launch the Mediterranean Investment Facility (MIF) initiative aiming at the development, over the period 2009-2012, of several projects having an important impact on CO2 emissions by
diversifying the use of small scale renewable energy and energy efficiency technologies by targeting different niche markets. New projects have been implemented in Tunisia (Prosol Collective and Industrial), Egypt and Montenegro.
The MIF will have the participation of public and private sector investors to:
- Provide support to market development: technical assistance to develop financing mechanism (ex: PROSOL), targeted capacity building, development of CDM (PROSOL)
- Provide incentives for commercial and development banks to lend to renewable energy and energy efficiency projects (soft interest rates, maturation, grace period, partial guarantees)
- Provide attractive financing conditions to residential sector (green appliances program, interest rate incentives, green mortgages).
In Egypt, because of the political instability during last three years, IMELS’s action encountered some
difficulties. However, IMELS was able to maintain the following activities:
- Project for the Sustainable Development of Environmental Sound Management in South Sinai
Coast Line (Ras Mohamed National Park). The project, which started in 2005 and finished in
2012, was addressed to improve the sustainable development of the area. In this way, it was
lunched a pilot project on eco-tourism, as well as an integrated strategy for nature
conservation and environmental education.
- Project: “Innovative Means to Protect Water Resources in the Mediterranean Coastal Areas
through re-injection of Treated Water” (2011-2014). This project is financed under the
program Sustainable Water Integrated Management - Demonstration Projects, pilot
demonstration projects related to the sustainable integrated management of water in the
southern Countries of the Mediterranean, in the framework of Environmental Neighborhood
Partnership Instruments (ENPI) of EuropeAid, and IMELS is the coordinator. The IMPROWARE
main objective is to demonstrate and promote environmentally sustainable water
management policies and practices in Egypt and Tunisia, with focus on wastewater treatment
activities directed to produce water of appropriate quality levels for its successive re-injection
into coastal aquifers. Specifically, the project contributes to contrast aquifer deterioration by
saltwater intrusion due to over-extraction and climate change and to increase water
availability for the local communities in the rural demonstration sites, but also to implement
"capacity building" activity at inter-institutional level and dissemination of knowledge and
177
practices developed in the project. The activities mainly consist of modelling and simulation
component related to the recharge of an aquifer in the area of Wadi Al Nutrun in Egypt and
the upgrade of an existing wastewater treatment plant at Korba in Tunisia, including
downstream infiltration basins. The application of innovative technologies and best practices
for protecting water resources in the selected areas has the potential to be replicated in other
ENPI Mediterranean countries by widely disseminating results and “lessons learned”,
demonstrating best practices and state-of-the-art technologies to public institutions. The
project envisages setting in place a broad cooperation to improve planning and management
skills at sub-regional and regional (Mediterranean) levels and empowering decision-makers
and societies at large to tackle the increasing demand for water resources, adapt to climate
change and act effectively against desertification.
7.3.3 Cooperation with Central and Eastern European countries on climate change
In Central and Eastern Europe, IMELS’s activity has been active, since 2002. The activities are
developed under Memorandum of Understanding: “Environmental Protection Co-Operation”, signed
with the former Ministry for Protection of Natural Resources and Environment of the Republic of Serbia
and Montenegro. This agreement was designed to develop a programme of bilateral cooperation in the
fields of sustainable development, institutional strengthening and harmonization to both International
and European legislative standards according to funds available from the Italian Law 84/2001 on
Balkans’ reconstruction, and it is still operational.
Since then, the cooperation program has expanded with more than 60 projects implemented in
Albania, Bosnia, Croatia, Bulgaria, Serbia, Montenegro, Macedonia, Poland, Romania, Turkey,
Hungary, Kyrgyzstan and Tajikistan, mainly dedicated to:
strengthen local and national capacities on environmental governance;
transfer know-how and technologies to prevent and control environmental pollution and water
management;
promote renewable energy and energy efficiency.
In the former Republic of Serbia, IMELS is continuing the activities launched in 2003, related to the
sustainable requalification of the Municipality of Pancevo, considered as the heaviest polluted
industrial areas, as well as the legal and technical assistance programme to facilitate the Kyoto
Protocol ratification and for the preparation of the “First National Communication”. The Italian Ministry
has been providing institutional capacity building activities, to promote the Green Certificates incentive
mechanism, involving representatives of the Serbian Ministry of Energy and Mining and the Serbian
Ministry of International Economic relations.
It is ongoing a scientific collaboration between the Italian Institute of Geophysics and Volcanology, the
hydro meteorological institute of the University of Belgrade and Serbia, for the second phase of the
project SINTA (simulations of Climate Change in the Mediterranean area). SINTA aims to improve the
scientific expertise of the institution responsible for the preparation of distribution models of air
pollution, which in addition to the emission inventory, facilitates the preparation of air quality plans
and promotion of mitigation and adaptation activities.
IMELS is also participating in the "SEE Programme, 3rd Call for Proposals – OrientGate: a structured
network for integration of climate knowledge into policy and territorial planning", in collaboration with
178
Puglia Region, INGV, Euro-Mediterranean Centre on Climate Change and the Serbian
Hydrometeorological Service.
It is under construction a waste management system, to reduce the amount of waste disposed in the
landfill of the Municipality of Pancevo (Pancevo Action Programme). An important synergy has been
established between the activities of the IMELS and the activities carried out by the Italian
Cooperation Program of the Ministry for Foreign Affairs in Serbia with the use of funds at its disposal.
These resources will help to meet part of the project, through the design of a system of separate
waste collection, construction of ecological islands and the construction of an air separation plant dry/
wet - The building, that will contain the plant, was already built and is currently in the training phase
for the equipment.
The MoE has provided a human resources in the field of technical support activities for the functioning
of DNA and the development of related procedures for data collection and the development of
regulations for the implementation of the National GHG Inventory, in collaboration with EPS (Electric
Power of Serbia Incumbent ), with the aim of defining the Carbon Emission Factor.
A "Report on CERs: legal nature and related taxation scenario" has been produced and it is ongoing a
study in the field of primary legislation for the management of CERs (Certified Emission Reductions)
cd "CERSS Management".
Representatives of the Ministry of Environment and the Ministry of Energy of the Republic of Serbia
attended the first session of a training course organized by the Italian Ministry for the Environment in
Brussels on "European Institutions and EU funding programs for environmental projects." The second
session on CDM PDDs took place in the municipality of Leskovac, Kragujevac and Subotica. It was also
realized the third round of the DNA Training of the Ministry of Serbia in the framework of technical
assistance in order to strengthen the administrative capacity of the same in the monitoring of the EU-
ETS and CDM Awareness System.
Regarding the Acquis Communitaire, it was implemented a legal assistance focused on:
- primary and secondary legislation relating to air quality;
- primary legislation on environmental liability;
- Community and Italian legislation in the field of energy efficiency;
- primary legislation relating to the management of the CERs;
- Report containing the guidelines for the development of secondary legislation in the field of
protection of the air;
-Report on the Italian legislation on energy efficiency.
The signature of the Annex XI confirms the continuation of bilateral cooperation with the Ministry of
Economic Development, Energy and Environment, with particular regard to the support to Italian
companies, particularly technical assistance for EU-ETS and Italian industry in Kragujevac and a CDM
validation (landfill capturing biogas).
In Montenegro, a cooperation program with the Ministry for Tourism and Environmental Protection
started in 2004, with the signature of a Memorandum of Understanding followed by three technical
annexes.
The aforementioned MoU has been replaced by the Cooperation Agreement for Environmental
Protection in Podgorica, signed in November 2012 by the two governments represented by the
Ministers of the Environment.
This update was necessary to adapt the contents of the Agreement of 2004, to the recent
amendments to the legislation of Montenegro, with particular reference to the rules relating to the VAT
179
rules and public procurement. The purpose of the agreement is the continuation and deepening of the
eight years successful cooperation, recognizing the need for additional activities, projects and
initiatives addressed to promote sustainable development, in line with the requirements of the
accession process to the European Union, in Montenegro. Among the activities:
- legal assistance in alignment with the objectives of environmental and climate Acquis Communitaire;
- support to institutional development and capacity building;
- monitoring of environmental quality in accordance with EU standards;
- support for environmental management, particularly in the areas of air quality, climate change,
prevention and control of pollution and protection of nature;
- promotion of development of energy sources that are environmentally friendly, in particular
renewable energy;
- promotion of sustainable tourism, transport, sustainable use of natural resources and management
of national parks and other protected areas;
- implementation of initiatives related to energy efficiency programs, particularly in the field of
building constructions;
- protection of the marine environment and the coastal area, starting from the creation of the
partnership "Adriatic Sea Coastal Areas and River basin Management system" ( ADRICOSM ) within
the framework of the " Mediterranean Action Plan " (MAP) ;
- establishing cooperation in "International and European Programs".
In the Republic of Albania, IMELS signed the Memorandum of Understanding, on 31 May 2005, on
“Cooperation in the field of the Clean Development Mechanism under article 12 of the Kyoto Protocol”.
The agreement aimed at facilitating the implementation of the Kyoto Protocol, through legal support to
the national competent authority (DNA), and technical support for potential CDM project assessment,
in the field of renewable energy sources, energy efficiency, waste and forest management. Due to the
high interest of the Albanian Government toward the management of coastal areas and river basin
water quality, several projects have been implemented in these sectors. ADRICOSM-STAR (Integrated
river basin and Coastal zone management system), started in 2007, aiming at the development and
partial implementation of an integrated coastal area and river and urban water management system,
that considers both observational and modelling components. Area of investigation was the Bojana
river Delta between Montenegro and Albania, and the Montenegro coastal area which is naturally
affected by Albanian marine waters.
Moreover, another project in this sector financed by IMELS was the “Monitoring of water resources in
the Erzeni river basin”. Its main objective was to collect environmental data regarding the water
resources in the Erzeni river basin and, subsequently, assessed and elaborated the availability and
quality of water resources at basin level, together with preliminary evaluations and recommendations
on the water management systems.
Considering the Albanian air quality issue, IMELS has decided to supply technical assistance for the
implementation of Air Pollutants Emission Inventories and for Air Quality Planning. The target of this
assistance was first of all the support to the republic of Albania in the compilation of a national
emission inventory for the integration of Albania in Long Range Tran boundary Air Pollution (LRTAP)
Convention and then the support to the Albanian team to develop capacity to assess and plan air
quality on local/urban scale, in particular in urban and industrial areas regulated in the frame of the
EU Air Quality Framework Directive 96/92/CE and relative “daughters” Directives. These activities
180
represented the core of the project “Technical support services for pollutant emissions inventories
implementation and air quality planning in Albania”. All the collaboration activities have been
completed.
In Republic of Macedonia, IMELS has been cooperating since august 2005, when a Memorandum of
Understanding on “Cooperation in the field of Environment and Sustainable Development” was signed.
The cooperation program recently has been reduced due to lower availability of financial resources,
without hindering the completion of projects started in the areas of environmental protection, the use
of renewable energy sources, the use of energy efficiency measures, the prevention and reduction of
environmental pollution, legal aid for the transposition of the Acquis Communitaire, and promoting
sustainable development.
ORIENTGATE – A structured network for the integration of climate knowledge into policy and territorial planning
The OrientGate project aims to implement concerted and coordinated climate adaptation actions across South Eastern Europe (SEE). The partnership comprises 19 financing partners, 11 associates and three observers, covering 13 countries, and the role of the partners can be grouped into three main categories: • National hydrometeorological services, responsible for monitoring climate variability and risk.
• Territorial development policy organisations, responsible for translating climate variability and climate risk assessment information into territorial development planning instruments. • Scientific institutions. Together they will explore climate risks faced by coastal, rural and urban communities, contributing to a better understanding of the impacts of climate variability and climate change on water regimes, forests and agroecosystems.
The way in which OrientGate aims to coordinate climate change adaptation efforts in SEE countries is by building a lasting partnership between communities that produce knowledge and experimental studies, and communities that apply that knowledge. The project aims to: • develop a comprehensive and consistent methodology for assessing the risks arising as a result of
climate variability and change;
• harmonise risk assessment and communication on the part of hydro meteorological services; • encourage the use of acquired climate adaptation knowledge and experience in territorial planning and development; • enhance capacity to reconcile the risks and opportunities inherent in environmental changes, including rising temperatures.
The core output to be developed by OrientGate is a set of web tools, designed to provide access to data and metadata from climate observations and simulations that will be available through a data platform connected to the European Climate Adaptation Platform. Other project outputs will include six pilot studies of specific climate adaptation exercises developed by the project’s three thematic centres (Forest and Agriculture, Drought, Water and Coasts, and Urban Adaptation and Health); capacity-building seminars and workshops; and a working partnership among the hydrometeorological services of SEE countries.
In particular, one of the pilot studies is located in the Italian region of Apulia and it will concentrate on the production of tools and guidelines for regional and local institutions in order to promote effective
planning for the management and protection of Apulian water resources and coastal environments. The planning will take into account impacts, vulnerabilities and risks related to climatic changes with a special focus on extreme events such as heat waves, draughts and intense rainfalls, which are all causes of water resource imbalances.
A final book collecting the lessons learned and a set of policy guidelines will be published as final output of the project. The SEE Transnational Cooperation Programme which finances Orientgate, has developed a capitalization strategy to strengthen links between projects on similar topics enabling project teams to
consolidate achievements and create greater leverage. OrientGate has been selected as lead project
181
for the Thematic Pole (TP) on Climate Change Adaptation. (www.southeast-europe.net/en/achievements/ capitalisation_strategy).
Financed by: South East Europe Transnational Cooperation Programme Duration: 30 months (07/2012 - 12/2014)
7.3.4 Cooperation on climate change in Latin America
In Brazil, the Italian bilateral cooperation started in 2004, under the Memorandum of Understanding
signed with the Brazilian Ministries of Science and Technology and the Environment. This activity has
produced relevant results, such as:
IMELS continued its support to the programme: “Amazon Key Stone Initiatives”, for the
environmental defence of the protected areas of Acre, Purus, Itenez and Mamorè, in the
Amazon. In 2010, it presented the results of this project, which consisted in several initiatives
addressed to the information and environmental education.
In 2010, IMELS started a joint programme with the World Centre for bio fuel production,
based in the State of Sao Paolo. The Programme involves: the Brazilian Ministries of Science
and Technology and the Environment, state agencies (Secretaria de Agricultura e
Abastecimento; Istituto Agronomico), the University of Sao Paolo and Campinasa, public and
private fundations (Fundacao de Estudos e Pesquisas Agricolas e Florestais; Fundacao de
Apoio Agricola, Forum Das Americas), and producers association (Sociedade dos Tecnicos,
Acucareros e Alcooleiros do Brasil -STAB). The Programme is dedicated to the recognition of
environmental problems, case studies’ analysis, exchange of experiences between Brazilian
and Italian experts, identification of possible joint programmes for institutions and companies
to be addressed to World Bank or European Commission.
In 2011, IMELS took an important role in the International Conference: “Bright Cities”, held in
Rio de Janeiro. The Conference was organized by Brazilian government, in collaboration with
the United Nations. Its main objective was to promote the sustainable development of the
urban areas, in view of the World Football Champion 2014 and Olympic Games 2016. In this
occasion, IMELS presented the best practices and the technologies related to the China
Programme, mainly Beijing Olympic Games 2008 and Shanghai Expo 2010.
In 2011, an Agreement with the Environmental Protection Agency of Rio de Janeiro State was
signed for the elaboration of the programme of sustainable development of the State in the
following areas: quality of the urban environments, water use management, hydrogeological
instability prevention, natural heritage increasing (especially the forests), restoration of
polluted sites. Indeed, under the same framework, IMELS was requested to take a role in the
favelas requalification.
In 2012, IMELS promoted a joint programme with the State of Pernambuco for the realization
of a Centre on mitigation and adaptation of climate change, in collaboration with the Euro
Mediterranean Centre for Climate Change, an Italian excellence centre on this issue. Indeed,
the programme foreseen the participation of IMELS in the protection of biodiversity and
sustainability of the archipelago of Fernando de Noronha.
182
In 2012, IMELS signed a programme with a local Non Governmental Organization, active in
the promotion of sustainable development projects in Brazil. The scope of the programme is
the calculation the carbon foot printing of the textile products. OSKLEN Group was chosen as a
case study for the corporate social responsibility.
In occasion of Rio+20 Conference, IMELS signed a bilateral agreement with the Brazilian
Ministry of Energy for the promotion of sustainable energy. This latter points to develop joint
initiatives between Italian and Brazilian companies in the sector of renewable energies.
Italy and Brazil hold the Presidency of the "Global Bio Energy Partnership" (GBEP) – see the relative
box on GEF.
In Mexico, the activity proceeds under the Memorandum of Understanding on “Cooperation on
afforestation, reforestation and bioenergy for forest resources”, signed with the National Forestry
Commission, in 2008. Under this framework, it was established a Working Group with the objective of
monitoring project activities on bioenergies. The projects developed are the following:
MEXISCO Feasibility studies of solar industrial refrigeration in the food and agro industry. The
project aimed to develop and analyse the application of solar refrigeration systems for the
food and agro industry in Mexico using as bases the experience gained through the EU project
MEDISCO (www.medisco.org). The solar thermally driven cooling concepts resulted, under
local conditions, economically and socially sustainable. The objective has been to develop a
high performing solar driven cooling and refrigeration concept, aiming at the best compromise
towards innovative technologies use, primary energy savings and economic issues. The
concept has been developed through theoretical and simulation activities.
MEXISCO 2: Programmatic CDM on Solar Cooling in the Food and Agro Industry in Mexico -
Mexisco 2 has been elaborated in parallel with Mexisco 1 and finalised to identify a
methodology for a programmatic CDM in solar cooling in the food and agro industry.
SECOND GENERATION BIOFUEL: CELLULOSIC ETHANOL - This project, in cooperation with the
relevant Mexican partners (SEMARNAT and CONAFOR), evaluated the roadmap for a
innovative solution in the production of second generation ethanol from Mexican feedstocks,
which do not compete with food, at price competitive with fossil fuels. In particular this project
focused on the feasibility study of the process to produce 2nd generation bioethanol from the
best sustainable mexican biomasses; the identified biomasses on one hand had to guarantee a
high cellulose/hemicellulose yield per hectare and on the other hand had to allow a high global
energy efficiency and a low environmental and social impact.
7.3.5 South Pacific Small Islands Developing States
Since 2007, the Government of Italy has strongly supported the Governments of the Pacific Small
Island States, namely: Republic of the Fiji Islands, Republic of Kiribati, Republic of the Marshall
Islands, Federated States of Micronesia, Republic of Nauru, Republic of Palau, Independent State of
Papua New Guinea, Independent State of Samoa, Solomon Islands, Kingdom of Tonga, Tuvalu,
Republic of Vanuatu, Cook Islands and Niue. Indeed, in 2008, the Government of Austria and the
Municipality of Milan joined the Government of Italy as a donor to the program.
The program was dedicated to adaptation to climate change, protection from vulnerability to extreme
climate variability and mitigation of harmful emissions, generated by energy utilization. It was
183
designed to serve as a catalyst for attracting investments in the energy sector from the International
Financial Institutions and the private sector. The projects are implemented under two different
modalities: direct financing and financing through an international organization (the International
Union for Conservation of Nature, IUCN), and implementation is carried out by a national Agent
designated for this purpose by each Government. The Italian Government has designated the Euro-
Mediterranean Centre for Climate Change, to coordinate all operations under the direct financing
modality.
According to the Agreement established among the Parties of the Programme, two bodies were
created for the cooperative activities: a Joint Working Group and a Joint Committee. The first one for
overseeing and managing project preparation activities aimed at identifying the objectives, specific
cooperation sub-sectors, activities in each sub-sector, and cost of each project; while, the second one
for approving project budgets and work plans, and decides upon the most suitable management
mechanisms, including monitoring and dissemination of results and lessons learned.
The objectives of the program reflected the priorities established by the Governments of the Pacific
SIDS. They consisted of the development of measures to adapt to the adverse effects of climate
change, the development of local renewable energy sources and biofuels as well as the wide
dissemination of their use to address energy security, while increasing access to energy services,
reduce emission of green-house gases, and strive for sustainable transport. Moreover, the program
was designed to strengthen national capacities for the establishment of national energy policies and
strategies, as well as markets, and to ensure sustainability through the development and deployment
of specialized human resources at both the national and community levels. The implementation of the
program was carried out with the involvement and support of the beneficiary communities.
The components of the Programme are the following:
Development of climate change adaptation measures - Assessment of current and future
climate changes in the tropical cyclones distribution, intensity and frequency; seasonal
forecasts; expansion of the periodic bulletin "Island Climate Update" and development of the
"Yearly Climate Assessment"; strengthening of early warning systems.
Assessment of energy requirements and strengthening of energy policies and action plans -
identification of the most appropriate renewable energy mix capable of meeting the islands
energy needs. Therefore: technology assessment of energy requirements and infrastructure
for the mid-and long-term; development of sustainable transport technologies, including non-
motorized solutions; development of human resources specialized in the planning,
implementation and management of energy policies, strategies and plans; development of
national and regional energy markets, as well as of the appropriate financial instruments.
Rural Electrification - Development and utilization of the photovoltaic technology, for new
installations and rehabilitation of existing facilities, in those areas where solar energy is the
most abundant renewable source; development and utilization of other renewable energy
technologies – such as mini hydro and wind.
Development of biofuels - Assessment of the viability of biofuel production from diversified
local sources; feasibility studies and pilot projects/testing for the utilization of biofuels for local
transportation and power generation; technical studies and process analysis for biofuels
production.
184
Development of renewable energy sources - According to each country priorities, the program will
include the following feasibility studies and pilot projects: photovoltaic stand-alone electrification in
urban areas; photovoltaic integration into the national grid; wind energy data collection and resource
assessment; biogas from household waste and waste management; assessment of the geothermal,
tidal and wave power generation potential; small hydropower resource assessment.
7.4 Scientific co-operation
IMELS is also strongly committed to support programme on scientific research and technology transfer
in strategic areas, like China, in collaboration with noteworthy research centre. These projects are
dedicated to improve these regions capacity to tackle climate change by fostering research.
In the framework of the Sino-Italian Cooperation Program for Environmental Protection (SICP) several
scientific and technological research projects have been implemented, in collaboration with the
National Development and Reform Commission, the Chinese Ministry of Science and Technology, the
main Chinese scientific institutions, Chinese Municipalities, companies and prestigious universities,
such as Tsinghua University in Beijing, Tongji University in Shanghai and Jiaotong University in
Shanghai.
In 2011, the first phase of the Sino-Italian Climate Change Cooperation Program started. It consisted
of the following projects:
- Xinjiang Climate Change Implementation Plan. The project’s objective was to support Xinjiang
province to develop and improve the Regional Climate Change Implementation Plan. The study tour,
training and workshops were organized to promote the understanding on national policy of
environmental protection and climate change. The final workshop was held in the middle of 2012, with
the publication of Xinjiang Climate Change Implementation Plan.
- Media Communications and Public Relations. The project had the objective to build the multi-sector
mechanism and multi level network for climate change communication, in China. The project produced
“China's Policies and Actions for Addressing Climate Change report (2011)”, Media Training for
addressing climate change before Durban Conference, a series of workshops and dissemination
materials for promoting social awareness.
- CCS & CO2 Comprehensive Utilization in Northern Shaanxi Area. The project pointed to identify a
feasible approach and the best technologies for large scale Carbon Capture, Use and Storage
implementation in Northern Shaanxi province. The project completed the geological investigation, data
collection and interpretation, and CCS technology study. The activity of Northern Shaanxi CO2
emission sources investigation and analysis, with the focus on non-power industry is still ongoing.
- Capacity Building of Costal Ecosystems to Climate Change Adaptation. The Project was implemented
in Wenzhou city, involving on the Chinese side the State Oceanic Administration, Zhejiang Provincial
Ocean and Fisheries Bureau, Zhejiang Mariculture Research Institute. The objective was to build a
methodology in Wenzhou to evaluate the climate change effect on the coastal and marine
environment, and identify section of the coastal and marine environment. High ecological value area
and environmental indicators were identified in the application of Remote Sensing analysis and
elaboration of thematic maps. The key indicators of human activities and climate change pressure
were defined.
- Training Program on Climate Change and Sustainable Development. The training program consists of
specific courses on “capacity building on climate change” and “climate change: policy, conventions and
statistical systems”. The training aimed at providing Chinese participants with theoretical instruments
185
and practical cases on Italian and European experiences, in the field of environmental protection and
climate change. A total amount of 80 participants, per year, from central and provincial Development
Reform Committee and other related institutions attend the training.
New processes and technologies are being developed in the following sectors:
- Air pollution prevention and control (Suzhou, Beijing, Lanzhou, Shanghai, Urumqi): development of
an innovative pollution source monitoring system aiming at reducing emissions, through a program to
take action on traffic and industrial sources (2003-2011), including the establishment of an advanced
chemical laboratory, in Beijing, under the Green Olympics Program.
- Sustainable transport: development of an advanced laboratory for vehicles emissions control and an
“Intelligent Transport System” for the regulation of urban traffic and to reduce consumption and
emissions (2005-2008), integrated by an Intelligent Bus Operation Control System (IBOCS), to
optimize public transport fleet management. Additional R&D activities focus on biofuels and hybrid
vehicles (2007-09). Technology transfer activities address low emission solutions for public
transportation such as anti-particulates filters (2008-09) and low emission CNG engines (2004), which
activity has been continuing among the technical partners. Viajeo (2009-2012) The project, co-
financed through European Commission funds from DG Research, builds on the experience of ITS and
IBOCS project and aims at designing, demonstrating and validating an open platform to facilitate data
sharing and exchange from different sources and provide data processing and management to support
and improve urban sustainable transportation.
- Renewable Energies and Energy efficiency. Testing of a diagnosis model for the evaluation of the
energy and environmental performances in the Shanghai industrial sector (2005-06); design and
testing urban and industrial energy saving plans in Jinan, Suzhou and Taiyuan (2006-2008);
exploitation of geothermal energy with application of the re-injection technology in Tibet and the
Tianjin area (2005-06); scientific cooperation in the field of clean coal, including carbon capture and
storage and ultrasupercritical technologies (2008), in view of development of pilot actions (2009-10).
- Hydrogen innovative technologies: promotion of technologies to produce energy and hydrogen from
waste in co-combustion with coal.
- Sustainable Urban Planning and Eco-building: since 2004 various pilot experiences have been
developed, among which: the design and building of the Sino-Italian Environment and Energy-efficient
Building (SIEEB) at the Tsinghua University Campus (2006), the Environmental Conventions Building -
4C Building- (2009) the Program for GHGs reduction in the Residential Building Sector in China,
including the development of related CDM methodology (2007-2010), the eco-building interventions in
the Urban Best Practices Area at Shanghai World Expo Park (2008-10).
- Adaptation to climate change: sandstorm prevention and control in Beijing, development of
sustainable agricultural techniques and optimisation water use and arid zones through the utilization
of an Italian-designed system (Vallerani method) for the reforestation in Inner Mongolia (2005-2009).
An interesting point of the Sino – Italian R&D cooperation has been the establishment of the following
research centers and activities:
- The “Green Energy Laboratory” at Jiaotong University, dedicated to the development of energy
efficiency technologies and CDM methodologies for GHGs emissions reduction in the building sector.
The Lab was inaugurated in spring 2012 at the presence of the Italian Minister for the Environment
and the relevant Chinese authorities. It shall become a platform for tweaking and testing technologies
designed to promote energy efficiency, emission reduction, and CDM methodologies in the
186
construction industry.
- The Euro-Asian research and training on CLImate change MAnagement (CLIMA), launched in March
2006 and still working, has developed an integrated scientific/educational approach to the problems of
climate change.
- The Sino-Italian Sustainable Urban Mobility Research Centre, launched in 2005 and still operating,
with Tongji University of Shanghai, is intended to study and implement environmentally friendly
technologies. In this framework, the first high-output micro-turbine for tri-generation has been
installed on the campus of Tongji University, as an innovative and clean response to the increasing
demand for energy in China. The Centre has also developed prototypes of hybrid vehicles and electric
motorcycles.
The cooperation with the Euro-Mediterranean Centre for Climate Change (CMCC) allows IMELS
to develop other projects as part of an integrated, multi-disciplinary and frontier research for
understanding, controlling and adapting to Climate Change.
CMCC is a national research centre, funded in 2005 by IMELS, Italian Ministry of Education, University
and Research, and of Economy and Finance, represents the most ambitious initiative undertaken in
Italy, within the framework of the National Research Plan, and specifically the National Research Plan
on Climate. CMCC is a consortium of eight Italian research institutions: Istituto Nazionale di Geofisica
e Vulcanologia, University of Salento, Italian Space Agency, University of Venice Cà Foscari, Eni Enrico
Mattei Fondation, Univerisity of Sassari, University Tuscia and University of Sannio.
Since 2006, the Euro-Mediterranean Center on Climate Change hosts the IPCC Focal Point for Italy.
The National IPCC Focal Point participates in the plenary sessions and meetings of IPCC, represents
the IPCC in Italy, and carries out communication and education activities concerning IPCC activities.
CMCC manages a Supercomputing Centre (located in the ‘Ecotekne’ Campus in Lecce), which is
ranked 168th in the list of the 500 most powerful computer systems in the world as for November
2012, and is the second Italian supercomputing infrastructure. The HPC infrastructure is composed of
a 960 cores IBM Power6 cluster (peak performance 18TFlops) and 8000 cores Intel Xeon Sandy Bridge
(peak performance 160TFlops).
CMCC’s expertise and approach to climate science is strengthened by its capacity to develop research
projects, which contribute to a national network of excellence. CMCC also collaborates with the best
international centers specialized in advanced and applied research on climate change. Over the past
years, CMCC participated in cutting-edge research, collaborating with more than 500 institutions from
71 countries. The acquired portfolio of research projects includes 110 primary internationally
composed and funded projects: 2 funded projects in FP6 (6th Framework Program of the EU), 34
funded projects in FP7 (7th Framework Program of the EU) and 74 funded projects under other EU
and international research grants (tot. of ca. 41 M €). In about a half of the implemented projects,
CMCC acted as the coordinator.
Among the activities carried out by CMCC, the main projects, programmes, and international
multilateral agreements directly financed by IMELS and coordinated by CMCC are:
GEMINA: the project aims to strengthen and further develop the research activities of CMCC. The
project will be cofounded by IMELS and MIUR; more specifically IMELS will provide funding for the
187
consolidation and further development of the international scientific network of CMCC, being crucial to
ensure Italian research at the forefront within the international research community.
Italy-Small Island Developing States (SIDS) Cooperative Programme on climate change
impacts and on emission reduction policies: the project has been presented during the
Conference of the Parties (COP) at the United Nations Framework Convention on Climate Change
(UNFCCC) in Cancun (29 November – 2 December 2010). The side event titled International
cooperation and local commitment: a success story in the Small Pacific Islands States was organized
by the Italian Ministry for the Environment, Land and Sea with the participation of CMCC. On May 10th
2007, the Italian Government and the Pacific Small Island States launched a cooperation program in
New York to address the key global challenges of climate change; in less than 3 years about $11 Mln
have been committed to projects and activities (18 projects in all). The event at COP 16 introduced
and promoted the programs as cooperation models. As part of this cooperation programme IMELS
financed the project Climate Change Assessment in Small Pacific Islands State coordinated by
CMCC which investigated the estimates of sea level changes in the next twenty five years and
assessed the changes in the tropical cyclone characteristics during the next thirty years in the region.
As part of the strong cooperation with CMCC, the IMELS financed the project Elements for the
elaboration of the National Strategy of Adaptation to Climate Change (SNAC). As part of
SNAC project CMCC coordinated the development of the first Italian Adaptation Strategy which has
been realised for public consultation, in November 2013.
In the context of the development of National Adaptation Strategies (NAS) across all European
countries and a comprehensive European Adaptation Strategy by the European Commission, the
Italian approach to develop a NAS involves 3 main elements:
• the collection, analysis and interpretation of sound scientific data on impacts, vulnerability and
adaptation relevant per sector at the national level, collected through a working group of national
scientists;
• the study of the political process of adaptation at the European level and an investigation about
adaptation governance;
• adequate consideration of the results of the involvement of national stakeholders and institutions
when allocating priorities for action for adaptation.
The specific SNAC objectives were:
• Identification of specific sectors for sectoral and inter-sectoral analysis
• Evaluation of the status of scientific knowledge on climate change impacts, availability of data and
information at different scales and sectors in the country
• Identification of sectoral vulnerabilities to those impacts and evaluation of related risks
• Support in identifying and analysing current adaptation measures carried out at different scales
(national, regional and local) and in various sectors
• Estimation of costs and benefits of possible adaptation measures/actions for various sectors for
short (2020-2030) and medium term (2040-2050).
• Support in identifying main national stakeholders and managing dialogue between institutions.
• Support in elaborating guidelines for sectoral adaptation action at different scales.
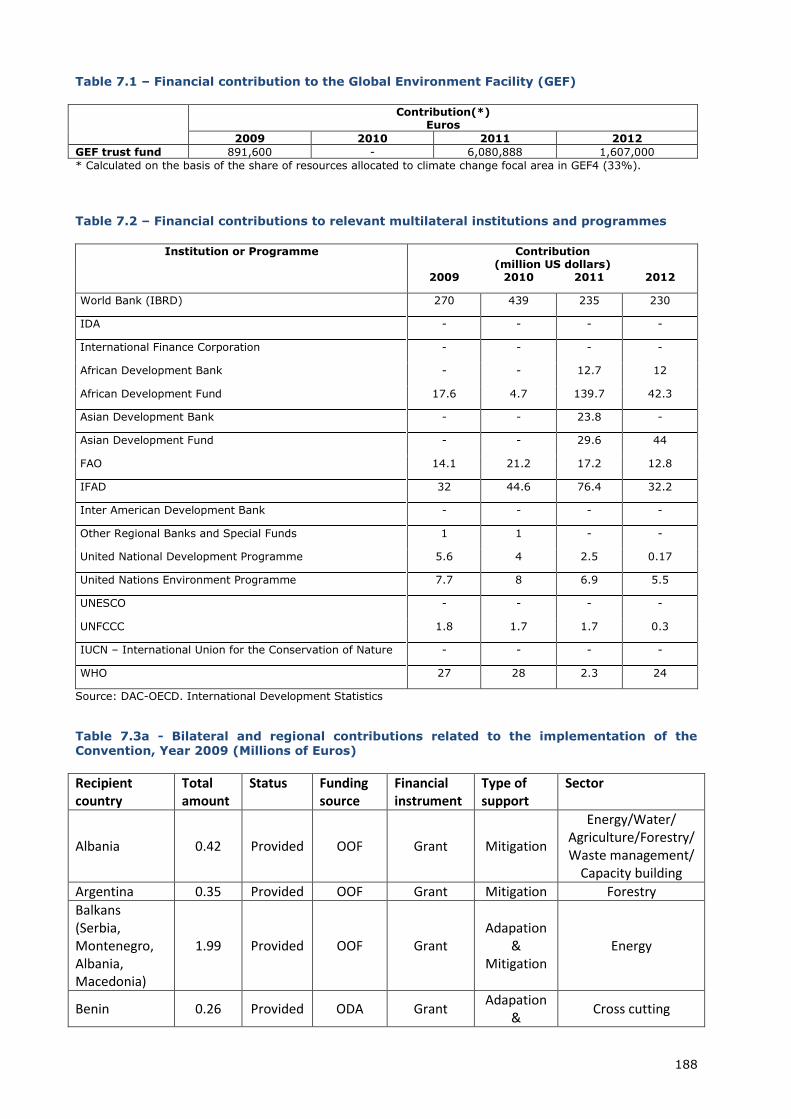
188
Table 7.1 – Financial contribution to the Global Environment Facility (GEF)
Contribution(*) Euros
2009 2010 2011 2012
GEF trust fund 891,600 - 6,080,888 1,607,000
* Calculated on the basis of the share of resources allocated to climate change focal area in GEF4 (33%).
Table 7.2 – Financial contributions to relevant multilateral institutions and programmes
Institution or Programme Contribution (million US dollars)
2009 2010 2011 2012
World Bank (IBRD) 270 439 235 230
IDA - - - -
International Finance Corporation - - - -
African Development Bank - - 12.7 12
African Development Fund 17.6 4.7 139.7 42.3
Asian Development Bank - - 23.8 -
Asian Development Fund - - 29.6 44
FAO 14.1 21.2 17.2 12.8
IFAD 32 44.6 76.4 32.2
Inter American Development Bank - - - -
Other Regional Banks and Special Funds 1 1 - -
United National Development Programme 5.6 4 2.5 0.17
United Nations Environment Programme 7.7 8 6.9 5.5
UNESCO - - - -
UNFCCC 1.8 1.7 1.7 0.3
IUCN – International Union for the Conservation of Nature - - - -
WHO 27 28 2.3 24
Source: DAC-OECD. International Development Statistics
Table 7.3a - Bilateral and regional contributions related to the implementation of the Convention, Year 2009 (Millions of Euros)
Recipient country
Total amount
Status Funding source
Financial instrument
Type of support
Sector
Albania 0.42 Provided OOF Grant Mitigation
Energy/Water/ Agriculture/Forestry/ Waste management/
Capacity building
Argentina 0.35 Provided OOF Grant Mitigation Forestry
Balkans (Serbia, Montenegro, Albania, Macedonia)
1.99 Provided OOF Grant Adapation
& Mitigation
Energy
Benin 0.26 Provided ODA Grant Adapation
& Cross cutting
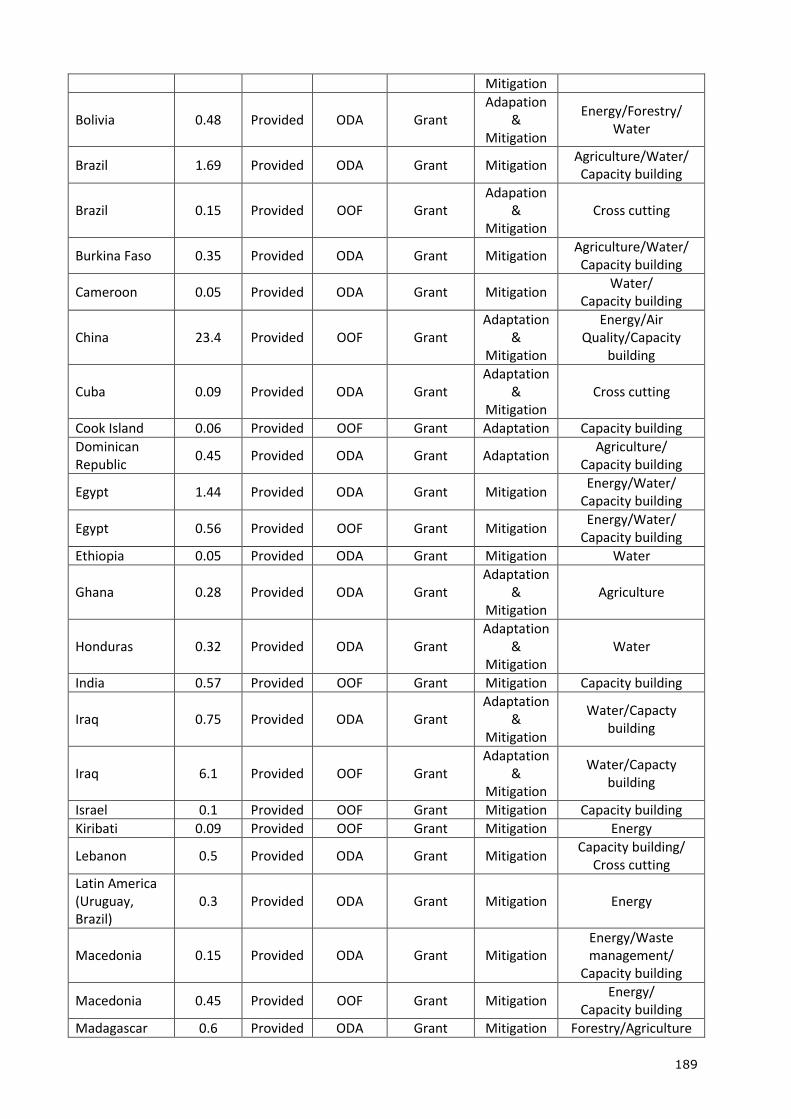
189
Mitigation
Bolivia 0.48 Provided ODA Grant Adapation
& Mitigation
Energy/Forestry/ Water
Brazil 1.69 Provided ODA Grant Mitigation Agriculture/Water/ Capacity building
Brazil 0.15 Provided OOF Grant Adapation
& Mitigation
Cross cutting
Burkina Faso 0.35 Provided ODA Grant Mitigation Agriculture/Water/ Capacity building
Cameroon 0.05 Provided ODA Grant Mitigation Water/
Capacity building
China 23.4 Provided OOF Grant Adaptation
& Mitigation
Energy/Air Quality/Capacity
building
Cuba 0.09 Provided ODA Grant Adaptation
& Mitigation
Cross cutting
Cook Island 0.06 Provided OOF Grant Adaptation Capacity building
Dominican Republic
0.45 Provided ODA Grant Adaptation Agriculture/
Capacity building
Egypt 1.44 Provided ODA Grant Mitigation Energy/Water/
Capacity building
Egypt 0.56 Provided OOF Grant Mitigation Energy/Water/
Capacity building
Ethiopia 0.05 Provided ODA Grant Mitigation Water
Ghana 0.28 Provided ODA Grant Adaptation
& Mitigation
Agriculture
Honduras 0.32 Provided ODA Grant Adaptation
& Mitigation
Water
India 0.57 Provided OOF Grant Mitigation Capacity building
Iraq 0.75 Provided ODA Grant Adaptation
& Mitigation
Water/Capacty building
Iraq 6.1 Provided OOF Grant Adaptation
& Mitigation
Water/Capacty building
Israel 0.1 Provided OOF Grant Mitigation Capacity building
Kiribati 0.09 Provided OOF Grant Mitigation Energy
Lebanon 0.5 Provided ODA Grant Mitigation Capacity building/
Cross cutting
Latin America (Uruguay, Brazil)
0.3 Provided ODA Grant Mitigation Energy
Macedonia 0.15 Provided ODA Grant Mitigation Energy/Waste management/
Capacity building
Macedonia 0.45 Provided OOF Grant Mitigation Energy/
Capacity building
Madagascar 0.6 Provided ODA Grant Mitigation Forestry/Agriculture
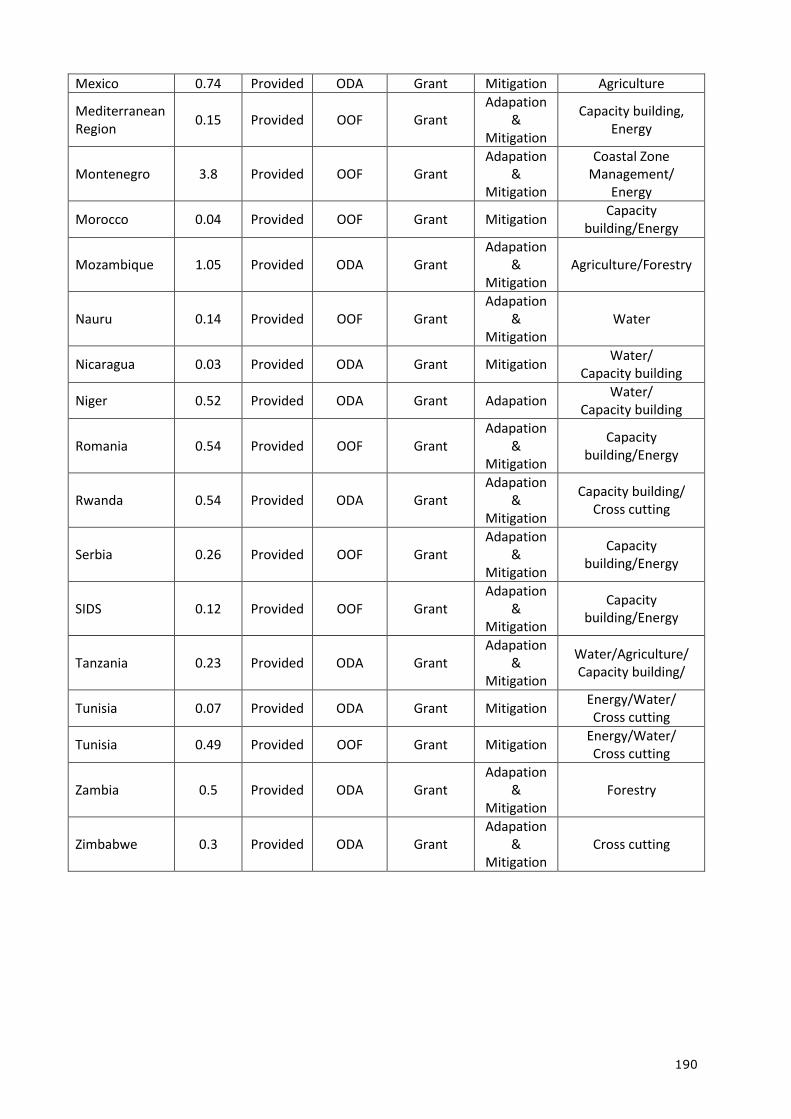
190
Mexico 0.74 Provided ODA Grant Mitigation Agriculture
Mediterranean Region
0.15 Provided OOF Grant Adapation
& Mitigation
Capacity building, Energy
Montenegro 3.8 Provided OOF Grant Adapation
& Mitigation
Coastal Zone Management/
Energy
Morocco 0.04 Provided OOF Grant Mitigation Capacity
building/Energy
Mozambique 1.05 Provided ODA Grant Adapation
& Mitigation
Agriculture/Forestry
Nauru 0.14 Provided OOF Grant Adapation
& Mitigation
Water
Nicaragua 0.03 Provided ODA Grant Mitigation Water/
Capacity building
Niger 0.52 Provided ODA Grant Adapation Water/
Capacity building
Romania 0.54 Provided OOF Grant Adapation
& Mitigation
Capacity building/Energy
Rwanda 0.54 Provided ODA Grant Adapation
& Mitigation
Capacity building/ Cross cutting
Serbia 0.26 Provided OOF Grant Adapation
& Mitigation
Capacity building/Energy
SIDS 0.12 Provided OOF Grant Adapation
& Mitigation
Capacity building/Energy
Tanzania 0.23 Provided ODA Grant Adapation
& Mitigation
Water/Agriculture/ Capacity building/
Tunisia 0.07 Provided ODA Grant Mitigation Energy/Water/ Cross cutting
Tunisia 0.49 Provided OOF Grant Mitigation Energy/Water/ Cross cutting
Zambia 0.5 Provided ODA Grant Adapation
& Mitigation
Forestry
Zimbabwe 0.3 Provided ODA Grant Adapation
& Mitigation
Cross cutting
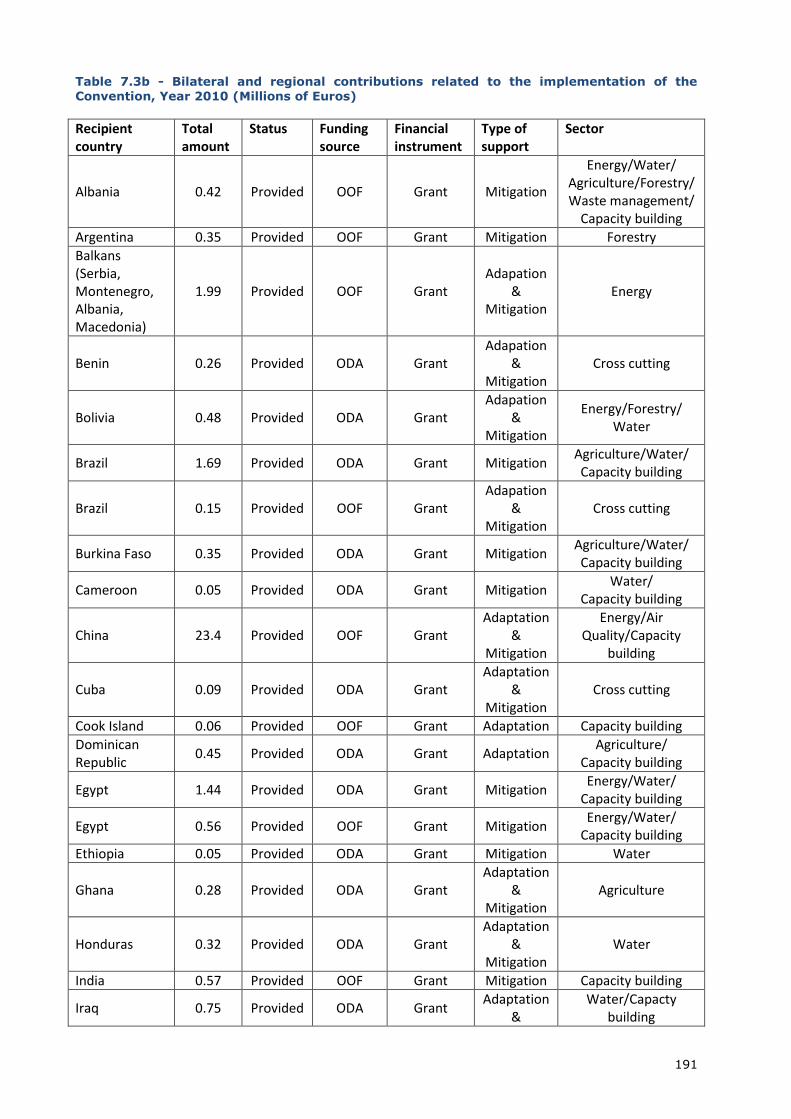
191
Table 7.3b - Bilateral and regional contributions related to the implementation of the
Convention, Year 2010 (Millions of Euros)
Recipient country
Total amount
Status Funding source
Financial instrument
Type of support
Sector
Albania 0.42 Provided OOF Grant Mitigation
Energy/Water/ Agriculture/Forestry/ Waste management/
Capacity building
Argentina 0.35 Provided OOF Grant Mitigation Forestry
Balkans (Serbia, Montenegro, Albania, Macedonia)
1.99 Provided OOF Grant Adapation
& Mitigation
Energy
Benin 0.26 Provided ODA Grant Adapation
& Mitigation
Cross cutting
Bolivia 0.48 Provided ODA Grant Adapation
& Mitigation
Energy/Forestry/ Water
Brazil 1.69 Provided ODA Grant Mitigation Agriculture/Water/ Capacity building
Brazil 0.15 Provided OOF Grant Adapation
& Mitigation
Cross cutting
Burkina Faso 0.35 Provided ODA Grant Mitigation Agriculture/Water/ Capacity building
Cameroon 0.05 Provided ODA Grant Mitigation Water/
Capacity building
China 23.4 Provided OOF Grant Adaptation
& Mitigation
Energy/Air Quality/Capacity
building
Cuba 0.09 Provided ODA Grant Adaptation
& Mitigation
Cross cutting
Cook Island 0.06 Provided OOF Grant Adaptation Capacity building
Dominican Republic
0.45 Provided ODA Grant Adaptation Agriculture/
Capacity building
Egypt 1.44 Provided ODA Grant Mitigation Energy/Water/
Capacity building
Egypt 0.56 Provided OOF Grant Mitigation Energy/Water/
Capacity building
Ethiopia 0.05 Provided ODA Grant Mitigation Water
Ghana 0.28 Provided ODA Grant Adaptation
& Mitigation
Agriculture
Honduras 0.32 Provided ODA Grant Adaptation
& Mitigation
Water
India 0.57 Provided OOF Grant Mitigation Capacity building
Iraq 0.75 Provided ODA Grant Adaptation
& Water/Capacty
building
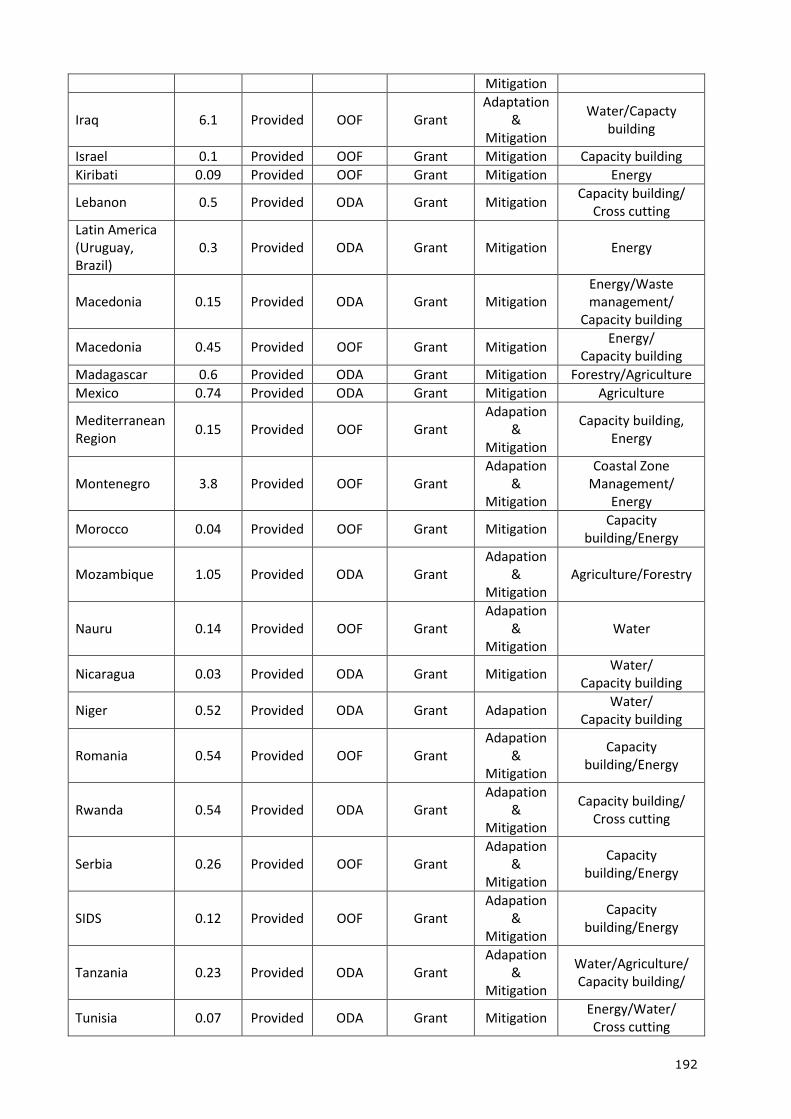
192
Mitigation
Iraq 6.1 Provided OOF Grant Adaptation
& Mitigation
Water/Capacty building
Israel 0.1 Provided OOF Grant Mitigation Capacity building
Kiribati 0.09 Provided OOF Grant Mitigation Energy
Lebanon 0.5 Provided ODA Grant Mitigation Capacity building/
Cross cutting
Latin America (Uruguay, Brazil)
0.3 Provided ODA Grant Mitigation Energy
Macedonia 0.15 Provided ODA Grant Mitigation Energy/Waste management/
Capacity building
Macedonia 0.45 Provided OOF Grant Mitigation Energy/
Capacity building
Madagascar 0.6 Provided ODA Grant Mitigation Forestry/Agriculture
Mexico 0.74 Provided ODA Grant Mitigation Agriculture
Mediterranean Region
0.15 Provided OOF Grant Adapation
& Mitigation
Capacity building, Energy
Montenegro 3.8 Provided OOF Grant Adapation
& Mitigation
Coastal Zone Management/
Energy
Morocco 0.04 Provided OOF Grant Mitigation Capacity
building/Energy
Mozambique 1.05 Provided ODA Grant Adapation
& Mitigation
Agriculture/Forestry
Nauru 0.14 Provided OOF Grant Adapation
& Mitigation
Water
Nicaragua 0.03 Provided ODA Grant Mitigation Water/
Capacity building
Niger 0.52 Provided ODA Grant Adapation Water/
Capacity building
Romania 0.54 Provided OOF Grant Adapation
& Mitigation
Capacity building/Energy
Rwanda 0.54 Provided ODA Grant Adapation
& Mitigation
Capacity building/ Cross cutting
Serbia 0.26 Provided OOF Grant Adapation
& Mitigation
Capacity building/Energy
SIDS 0.12 Provided OOF Grant Adapation
& Mitigation
Capacity building/Energy
Tanzania 0.23 Provided ODA Grant Adapation
& Mitigation
Water/Agriculture/ Capacity building/
Tunisia 0.07 Provided ODA Grant Mitigation Energy/Water/ Cross cutting
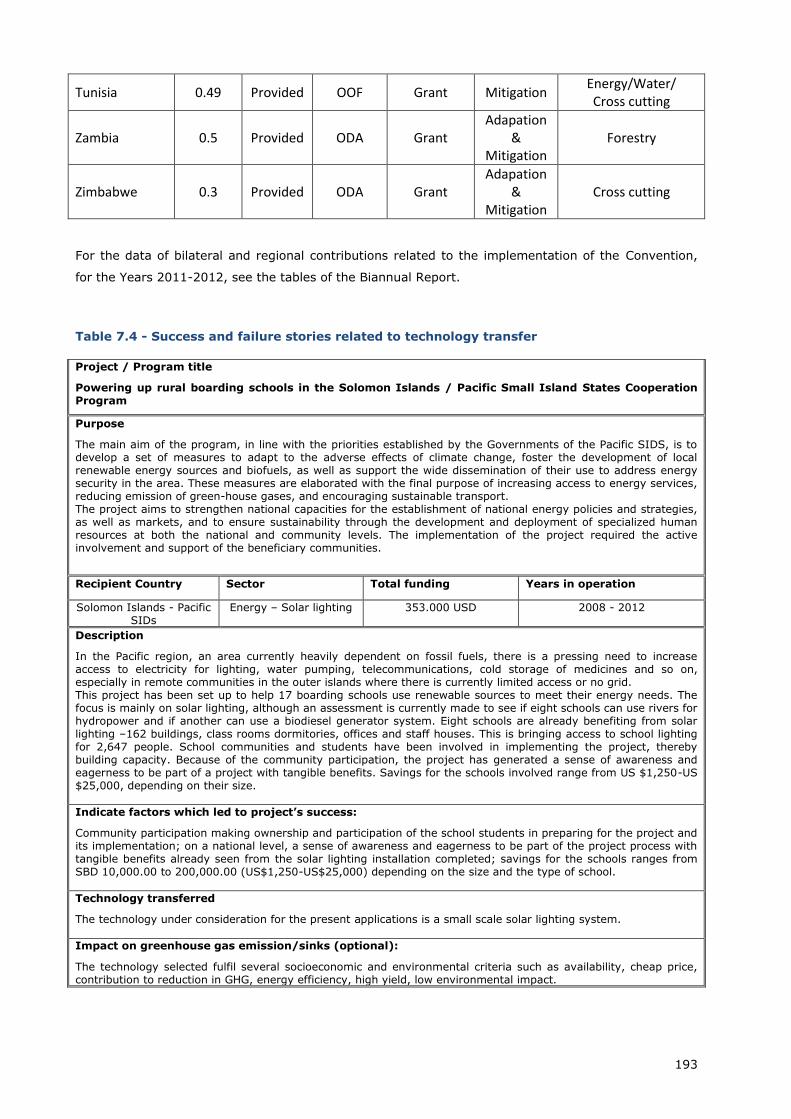
193
Tunisia 0.49 Provided OOF Grant Mitigation Energy/Water/ Cross cutting
Zambia 0.5 Provided ODA Grant Adapation
& Mitigation
Forestry
Zimbabwe 0.3 Provided ODA Grant Adapation
& Mitigation
Cross cutting
For the data of bilateral and regional contributions related to the implementation of the Convention,
for the Years 2011-2012, see the tables of the Biannual Report.
Table 7.4 - Success and failure stories related to technology transfer
Project / Program title
Powering up rural boarding schools in the Solomon Islands / Pacific Small Island States Cooperation Program
Purpose
The main aim of the program, in line with the priorities established by the Governments of the Pacific SIDS, is to develop a set of measures to adapt to the adverse effects of climate change, foster the development of local renewable energy sources and biofuels, as well as support the wide dissemination of their use to address energy security in the area. These measures are elaborated with the final purpose of increasing access to energy services, reducing emission of green-house gases, and encouraging sustainable transport. The project aims to strengthen national capacities for the establishment of national energy policies and strategies, as well as markets, and to ensure sustainability through the development and deployment of specialized human resources at both the national and community levels. The implementation of the project required the active involvement and support of the beneficiary communities.
Recipient Country Sector Total funding Years in operation
Solomon Islands - Pacific SIDs
Energy – Solar lighting 353.000 USD 2008 - 2012
Description
In the Pacific region, an area currently heavily dependent on fossil fuels, there is a pressing need to increase access to electricity for lighting, water pumping, telecommunications, cold storage of medicines and so on, especially in remote communities in the outer islands where there is currently limited access or no grid. This project has been set up to help 17 boarding schools use renewable sources to meet their energy needs. The focus is mainly on solar lighting, although an assessment is currently made to see if eight schools can use rivers for hydropower and if another can use a biodiesel generator system. Eight schools are already benefiting from solar lighting –162 buildings, class rooms dormitories, offices and staff houses. This is bringing access to school lighting for 2,647 people. School communities and students have been involved in implementing the project, thereby building capacity. Because of the community participation, the project has generated a sense of awareness and eagerness to be part of a project with tangible benefits. Savings for the schools involved range from US $1,250-US $25,000, depending on their size.
Indicate factors which led to project’s success:
Community participation making ownership and participation of the school students in preparing for the project and its implementation; on a national level, a sense of awareness and eagerness to be part of the project process with tangible benefits already seen from the solar lighting installation completed; savings for the schools ranges from SBD 10,000.00 to 200,000.00 (US$1,250-US$25,000) depending on the size and the type of school.
Technology transferred
The technology under consideration for the present applications is a small scale solar lighting system.
Impact on greenhouse gas emission/sinks (optional):
The technology selected fulfil several socioeconomic and environmental criteria such as availability, cheap price, contribution to reduction in GHG, energy efficiency, high yield, low environmental impact.
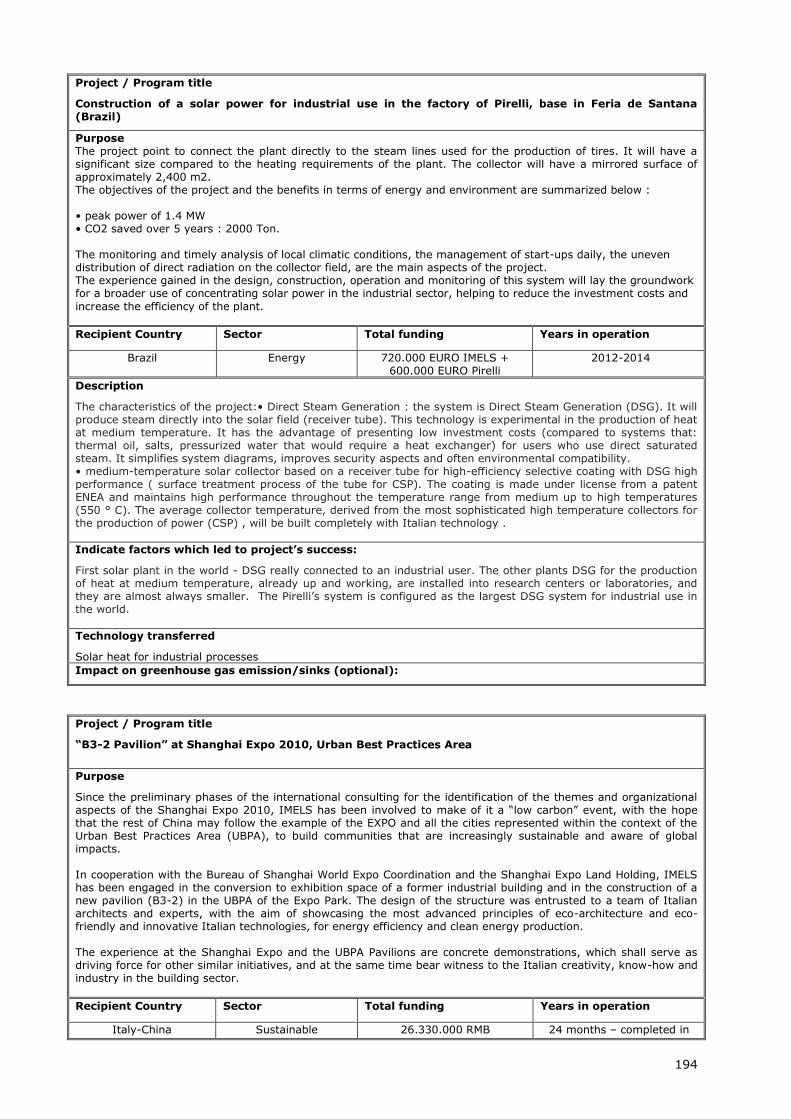
194
Project / Program title
Construction of a solar power for industrial use in the factory of Pirelli, base in Feria de Santana (Brazil)
Purpose The project point to connect the plant directly to the steam lines used for the production of tires. It will have a significant size compared to the heating requirements of the plant. The collector will have a mirrored surface of approximately 2,400 m2. The objectives of the project and the benefits in terms of energy and environment are summarized below : • peak power of 1.4 MW • CO2 saved over 5 years : 2000 Ton. The monitoring and timely analysis of local climatic conditions, the management of start-ups daily, the uneven distribution of direct radiation on the collector field, are the main aspects of the project. The experience gained in the design, construction, operation and monitoring of this system will lay the groundwork for a broader use of concentrating solar power in the industrial sector, helping to reduce the investment costs and
increase the efficiency of the plant.
Recipient Country Sector Total funding Years in operation
Brazil Energy 720.000 EURO IMELS + 600.000 EURO Pirelli
2012-2014
Description
The characteristics of the project:• Direct Steam Generation : the system is Direct Steam Generation (DSG). It will produce steam directly into the solar field (receiver tube). This technology is experimental in the production of heat at medium temperature. It has the advantage of presenting low investment costs (compared to systems that: thermal oil, salts, pressurized water that would require a heat exchanger) for users who use direct saturated steam. It simplifies system diagrams, improves security aspects and often environmental compatibility. • medium-temperature solar collector based on a receiver tube for high-efficiency selective coating with DSG high performance ( surface treatment process of the tube for CSP). The coating is made under license from a patent ENEA and maintains high performance throughout the temperature range from medium up to high temperatures (550 ° C). The average collector temperature, derived from the most sophisticated high temperature collectors for the production of power (CSP) , will be built completely with Italian technology .
Indicate factors which led to project’s success:
First solar plant in the world - DSG really connected to an industrial user. The other plants DSG for the production of heat at medium temperature, already up and working, are installed into research centers or laboratories, and they are almost always smaller. The Pirelli’s system is configured as the largest DSG system for industrial use in the world.
Technology transferred
Solar heat for industrial processes
Impact on greenhouse gas emission/sinks (optional):
Project / Program title
“B3-2 Pavilion” at Shanghai Expo 2010, Urban Best Practices Area
Purpose
Since the preliminary phases of the international consulting for the identification of the themes and organizational aspects of the Shanghai Expo 2010, IMELS has been involved to make of it a “low carbon” event, with the hope that the rest of China may follow the example of the EXPO and all the cities represented within the context of the Urban Best Practices Area (UBPA), to build communities that are increasingly sustainable and aware of global impacts. In cooperation with the Bureau of Shanghai World Expo Coordination and the Shanghai Expo Land Holding, IMELS has been engaged in the conversion to exhibition space of a former industrial building and in the construction of a new pavilion (B3-2) in the UBPA of the Expo Park. The design of the structure was entrusted to a team of Italian architects and experts, with the aim of showcasing the most advanced principles of eco-architecture and eco-friendly and innovative Italian technologies, for energy efficiency and clean energy production. The experience at the Shanghai Expo and the UBPA Pavilions are concrete demonstrations, which shall serve as driving force for other similar initiatives, and at the same time bear witness to the Italian creativity, know-how and industry in the building sector.
Recipient Country Sector Total funding Years in operation
Italy-China Sustainable 26.330.000 RMB 24 months – completed in
195
Architecture 2010
Description
It has been estimated that the building sector is responsible for more than 30% of the energy consumption in China, and it is therefore an important sector for GHG emission reductions, in which IMELS has funded projects aimed at promoting good practices in ecological architecture and research and development of energy-efficient technologies. The B3-2 Pavilion is a simple rectangular “box” measuring 78 by 28 metres, with a completely free interior forming a neutral space, without any intermediate pillars, capable of hosting the installations of the cities participating in the event, which have later been chosen as Bologna, Shenzhen and Seoul. As the work is part of the cooperation program between the Expo and IMELS, the project, entrusted to Studio Archea as the winner of a bidding, has transformed the hypothesis of the industrial shed, the theme of the neutral box, into a mechanism for the diffusion of natural light. During the day, the space is thus illuminated without any energy consumption. The roof has been conceived as a shed structure, crossed by beams, whose steel structure has been covered, in order to form a sequence of reflecting surfaces that diffuse the light from above. The construction has been designed so as to make it possible to reuse and recover the building, and it may therefore be disassembled and reassembled in another location. The entire construction is made in steel structures and technologies without cemented joints, and it is therefore possible to reuse more than 90% of the components. The non-structural outer walls have been built and designed as thick and highly insulated layered structures which comprise, from the interior towards the exterior, the installation of simple drywall panels perforated by a sequence of square windows of various dimensions arranged obliquely with respect to the vertical, an interior air chamber, metal panels with an intermediate layer in polyurethane foam providing thermal and acoustic insulation, fixed to the loadbearing columns made in simple I-profiles, a second air chamber in the layer occupied by the secondary substructure, necessary to support the casings and the outer skin, consisting of aluminium frames covered with silicon fabric, which turn the building box into a soft surface with a vibratory motion. The shell, half-way between the convex spatialism of Castellani and the more recent optical experiences, “necessarily” avoid to compete, on a volumetric level, with the other exhibition pavilions, instead assuming a role of interval or passage, a covered square or loggia which may be crossed thanks to the four large doors placed opposite one another, which make it possible to walk through the pavilion and thus assuring a continuous path along the Urban Best Practices area.
Indicate factors which led to project’s success:
Thanks to the special solutions for the external surfaces, the B3-2 pavilion has a low power consumption and adopts a new generation of textile outer casing, designed to facilitate the natural air-conditioning. For the construction operations exploited, whenever possible, the utilization of building materials for reuse.
Technology transferred
Among the main technologies adopted for the B3-2 Pavilion: textile panels for outer casing, low consumption lightning system.
Impact on greenhouse gas emission/sinks (optional):
The construction materials chosen technologies without cemented joints and the reuse of the main components contribute to GHG reduction, high energy efficiency and very low environmental impact.
Project / Program title
Green Energy Laboratory – GEL at the Shanghai Jiao Tong University
Purpose
The Green Energy Laboratory (GEL) is a platform for the testing and dissemination of energy efficient and “low-carbon” technologies in the building and housing sectors. GEL has been jointly envisioned and supported by the Italian Ministry for the Environment Land and Sea (IMELS) and the Shanghai JiaoTong University (SJTU), since 2007. it is another “landmark” in the Sino-Italian Cooperation Programme in the field of sustainable urban development and architecture. Designed by Italian experts together with the Dept. of Mechanical and Electrotecnical Engineering of the Shanghai University, GEL is located in the Minhang campus of the JiaoTong University and was created as research centre and laboratory for the analysis and diffusion of low carbon emission technologies in the construction and housing sector.
Recipient Country Sector Total funding Years in operation
Italy-China Sustainable Architecture
2 M Euro 36 months – completed in 2012
Description
196
The building sector in China has been estimated to be responsible for more than 30% of the energy consumption, it is therefore an important sector for GHG emission reduction, in which IMELS has been promoting good practices in eco-architecture, energy-efficient technologies and research and development of construction materials. The 1500 m2 Green Energy Laboratory is conceived as a compact body surrounding a central court, covered by a large skylight, that can be opened or closed depending on the season, a solution chosen due to its functional characteristics in terms of distribution and energetic optimization. The space, surrounded by access balconies, is configured as a void that optimizes energy consumption. During the sunny winter days, it functions as an accumulator of heat, while during the summer days, it acts as a chimney, aspirating the hot air produced in the interior. The building has three floors with a total surface area of 1500 square metres above ground, and a maximum height of 20 m. The first two floors host laboratories, meeting rooms, a control room, classrooms for the students and an exhibition space; every interior has windows on two sides, to the exterior and the inner court. The third floor hosts two sample apartments, the simulation of a two-room flat and a three-room flat covered by a pitched roof with photovoltaic panels, realized as platform for tests on residential types of spaces, to experiment with energy-efficient systems and buildings. The orientation of the building and its rectangular shape, along with the façade and the glazed interior court, are conceived to maximize the natural ventilation and to control exposure to the sun, in order to obtain an ideal interior climate with a minimum expenditure of energy. The façade, the distinctive feature of the exterior volume, consists of a double skin: an internal layer in glazed cells that provide waterproofing and insulation and an external one consisting of earthenware shutters that serve as sunscreens, to shade and regulate the illumination in the working spaces inside. The HVAC system has been designed on the basis of a main system (CHPC/WHP) combined with other, dedicated ones of smaller dimensions that are interchangeable according to the tests and research work
done in the different laboratories.
Indicate factors which led to project’s success:
GEL obtained the Gold level LEED Green Building Certification and is regarded as one of the most advanced green building research platforms in the world.
Technology transferred
GEL integrates nearly 20 advanced technologies in terms of renewable energy, air conditioning, building automatic control and green buildings. Different types of solar collectors with corresponding solar air conditioning systems (solar adsorption chiller, solar absorption system, solar desiccant cooling system and solar ice-making system) operate inside GEL. The cooling and heating power is provided by different heat pump technologies. The building is also equipped with many other advanced facilities, including a highly efficient, independent temperature and humidity control system, a floor heating terminal, a cold radiant ceiling terminal, a fan coil terminal with minor temperature difference, a total heat exchanger, a combined cooling, heating and power system, a heat storage system (phase change material, thermo-chemical heat storage), biogas power, a hybrid PV/wind system, a smart grid, a building energy management system, a zero energy apartment and a smart apartment, etc.
Impact on greenhouse gas emission/sinks (optional):
The orientation of the building, its shape, along with the façade and the interior space have been designed to optimize energy consumption. The construction materials and the advanced technologies in terms of renewable energy, air conditioning, building automatic control contribute to GHG reduction, high energy efficiency and very low environmental impact.
197
8 RESEARCH AND SYSTEMATIC OBSERVATION204
8.1 Introduction
This chapter describes the relevant Italian activities in climate change research and climate systematic
observations. The main focus concerns the national research programmes and some relevant
International research projects funded by Italian Institutions. Finally, it provides an overview of the
funding involved in the research and systematic observation sectors. The Italian climate research
covers different aspects, such as climate observations, climate modelling and impacts assessments.
8.2 General policy on research and systematic observation
8.2.1 Research
The main specific financial support to climate scientific research and technological development in
Italy in the near past was provided by the 2001 Special Integrative Fund for Research (FISR -
Fondo Integrativo Speciale per la Ricerca)205, aimed at funding specific activities with particular
strategic relevance, pursuant to the 2001-2003 National Research Programme (PNR -Programma
Nazionale della Ricerca 2001-2003206) and its updated versions following the Guidelines for
Scientific and Technological Policy of the Government (Linee Guida per la Politica Scientifica e
Tecnologica del Governo)207.
Through the 2001 FISR the Strategic Programme for Sustainable Development and Climate
Change (Programma Strategico Sviluppo Sostenibile e Cambiamenti Climatici) was co-funded and its
related activities were carried out over the subsequent years (until 2010). With a total budget of about
26.8 Million Euro208 the FISR was financially supported by the Italian Ministries of: Economy and
Finance (MEF - Ministero dell’Economia e delle Finanze); Education, University and Research (MIUR -
Ministero dell’Istruzione, dell’Università e della Ricerca); Environment, Land and Sea (IMELS) (MATTM
- Ministero dell’Ambiente e della Tutela del Territorio e del Mare); Agriculture Food and Forestry
Policies (MIPAAF - Ministero delle Politiche Agricole Alimentari e Forestali), the MIUR being the
managing organization of the National Programme.
The Strategic Programme for Sustainable Development and Climate Change supported
research on climate, climate change, climate protection, vulnerability and impacts assessment with a
204 Lead authors: Sergio Castellari (CMCC/INGV), Silvia Medri (CMCC), Fabrizio Ciciulla (USAM-CNMCA).
Contributing authors: Vincenzo Artale (ENEA), Francesco Apadula (RSE Spa), Sandro Calmanti (ENEA), Paolo
Cristofanelli (ISAC-CNR), Franco Desiato (ISPRA), Alcide di Sarra (ENEA), Nadia Pinardi (INGV), Antonello
Provenzale (ISAC-CNR), Paolo Ruti (ENEA). 205 FISR 2001: Interministerial Decree 17th December 2002 (Published on Official Gazette 14th January 2003 n.10)
http://attiministeriali.miur.it/anno-2002/dicembre/di-17122002.aspx. 206 The PNR 2001-2003 (http://www.miur.it/Documenti/ricerca/pnr_2011_2013/PNR_2011-
2013_23_MAR_2011_web.pdf) was approved by the CIPE on the 21st December 2000;
The PNR 2005-2007 (http://hubmiur.pubblica.istruzione.it/alfresco/d/d/workspace/SpacesStore/f6e84deb-a716-
470a-a18c-3662a49758f5/1999.pdf ) was approved in January 2005 by Legislative Decree 204/1998, Art. 1,
comma 2. 207 Approved on the 19th April 2002 by the Council of Ministries and the Interministerial Committee for Economic
Planning (C.I.P.E. - Comitato Interministeriale per la Programmazione Economica)
http://www.google.it/url?sa=t&rct=j&q=&esrc=s&source=web&cd=1&ved=0CDQQFjAA&url=http%3A%2F%2Fww
w.miur.it%2FUserFiles%2F1027.pdf&ei=IrupUrGFGuL-ygPCxoCIDw&usg=AFQjCNFm-
BqjXMnHaR1b6mh_EVDJUt7QlA&sig2=wCZt2T5pK_2i8Tqxp0WC9Q&bvm=bv.57967247,d.bGQ&cad=rja. 208 FISR Special Integrative Fund Research - Contract 2001 “Identification of projects Sustainable development and
climate change” (Directorial Decree 31st December 2004 n. 1797/Ric - Published in the Official Gazette of 21
January 2005 no. 16) http://attiministeriali.miur.it/anno-2004/dicembre/dd-31122004-n-1797ric.aspx.
198
special focus on themes such as:
climate observations and modelling (from simple linear models to general coupled
atmosphere-ocean models);
study of innovative instruments for Kyoto Protocol implementation and of soil carbon sinks;
vulnerability assessment research including coastal areas and marine ecosystems;
socio-economic impacts of climate change on energy, industry, insurance, transport and
tourism, soil degradation, water ecosystem, biodiversity, human health, human settlements,
marine biology, forestry, agriculture;
special geographic focus on coastal zones, oceanic zones and the Mediterranean Area.
In this framework, nine national climate related research projects were financially supported and a
new climate research network was launched: the Euro-Mediterranean Centre on Climate Change
(CMCC - Centro Euro-Mediterraneo sui Cambiamenti Climatici)209. CMCC aims at studying climate
change and the impacts of climate change on several different sectors and systems with a particular
emphasis on the Mediterranean area. CMCC is a consortium of already existing scientific institutions
such as: Universities, Public Research Centres, Foundations and Consortiums.
Investments in climatic research continued to be a specific priority area also in the subsequent as well
as in the most recent PNR, which covers the period 2011-2013 (PNR 2011-2013)210. Following the
strategic vision of the European Union (“EU 2020”), this programme has an innovative approach211
compared to the previous ones and aims at addressing the identified “Major Societal Challenges” -
“food security, human health and the environment, climate change and energy security”- on which the
future European research program will be based, especially through an enhanced participation in
Community programs. The PNR 2011-2013 is implemented through several national funding
programmes promoted and managed by the MIUR212, namely:
Ordinary fund for research institutes and bodies (FOE - Fondo ordinario per il
finanziamento degli enti e istituzioni di ricerca)213 - the primary contribution of the MIUR to
fund research activities conducted by public research bodies and institutes acting under the
supervision of the Ministry214;
Fund for investment in basic research (FIRB - Fondo per gli Investimenti della Ricerca di
Base)215 - for activities with a high scientific and technological content and also at international
level;
209 FISR 2001: Interministerial Decree 17th December 2002 (Published on Official Gazette 15th January 2003 n.11)
http://attiministeriali.miur.it/anno-2002/dicembre/di-17122002-%281%29.aspx.
CMCC Website: http://www.cmcc.it/. 210 Approved by the CIPE on the 23rd March 2011 with Deliberation N.2/2011
(http://www.miur.it/Documenti/ricerca/pnr_2011_2013/PNR_2011-2013_23_MAR_2011_web.pdf). 211 as it not only acts as a tool to promote the coordinated development of Italian research activities but also as a
structural component of the economic policy, aiming at the progressive integration between research supply and
demand and on building a network of platforms and technology infrastructures open to the contribution and
participation of the productive system, as well as on the increase in profitability of the investments on research. It
was prepared with a a broad consultation of the scientific and academic communities, the economic sector, the
State-Regions Conference, the Observatory of the the Regions, and all the government departments in charge. 212 https://www.researchitaly.it/en/researching/funding/programmes/. 213 https://www.researchitaly.it/en/researching/funding/programmes/ordinary-fund-for-research-institutes-and-
bodies/. 214 List of public research bodies and institutes acting under the supervision of the Ministry:
http://hubmiur.pubblica.istruzione.it/web/ricerca/enti-di-ricerca/elenco-enti. 215 https://www.researchitaly.it/en/researching/funding/programmes/fund-for-investment-in-basic-research/.
199
Research facilitation fund (FAR - Fondo per le Agevolazioni alla Ricerca)216 – in support to
industrial research;
Special integrative fund for research (FISR - Fondo Integrativo Speciale per la Ricerca)217
– for initiatives of specific strategic relevance and for the operation of private organizations
carrying out research activities – the fund is managed by the MIUR;
Research projects of national interest (PRIN - Progetti di Ricerca di Interesse
Nazionale)218 – aimed at the reinforcement of the national scientific basis also with a view to
promoting an effective participation in the European initiatives related to the EC Framework
Programmes;
National Operative Programme (PON - Programma operativo Nazionale) for Research and
Competitiveness 2007-2013)219 - financed by the European Regional Development Fund
(ERDF) and national sources, it is designed to promote “convergence” i.e. the growth of
underdeveloped regions (Calabria, Campania, Puglia and Sicily in Italy) compared to the
European average.
The Programme identified interalia a limited number of so called “Flagship Projects” (Progetti
Bandiera) and “Project of Interest” (Progetti di interesse): projects of national strategic interest
aimed at improving the efficiency and effectiveness of the national research system that are
undertaken by and included in the work programmes of the competent public research bodies.
The PNR 2011-2013 aims at improving the system of Italian Research also through its
internationalization, following the Strategy for the Internationalisation of the Italian Research
(SIRIt - Strategia per l’Internazionalizzazione della Ricerca Italiana): a document prepared to ensure
the necessary coherence of the National research priorities with the European and international
priorities and strategies. In this respect the programme envisages the following actions:
maximizing the use of collaboration tools within the EU, mainly 7th Framework Programme
(and in the future Horizon 2020) for the full realization of the European Research Area (ERA),
with a special attention to the Joint Programming Initiative (JPI) on climate and also other
European and international funding bodies;
pursuing other types of commitment levels based on international bilateral and multilateral
agreements;
fostering collaboration activities with non-European countries;
honouring the country’s international commitments under global conventions and agreements
under the aegis of the United Nations or not, providing tools for ad hoc financing for the
implementation of technology transfer and/or capacity building are also honoured.
Climate related research projects carried out by Italy through the above mentioned funding schemes
encompass a wide range of specific themes, including:
climate process and climate system studies, including paleoclimate studies;
modelling and prediction, including general circulation models;
research on the impacts of climate change;
socio-economic analysis, including analysis of both the impacts of climate change and
response options;
216 https://www.researchitaly.it/en/researching/funding/programmes/research-subsidy-fund/. 217 http://hubmiur.pubblica.istruzione.it/web/ricerca/sistema-ricerca. 218 https://www.researchitaly.it/en/researching/funding/programmes/research-projects-of-national-interest/. 219 https://www.researchitaly.it/en/researching/funding/programmes/national-operative-programme-for-research-and-competitiveness-2007-2013/.
200
research and development on mitigation and adaptation technologies.
Some relevant examples of such projects either funded by national sources and by international funds
are listed in Chapter ‘C. Research” in Tables 8.1 and 8.2.
In addition the MIUR supports and manages the “Special Programme” titled: National antarctic
research programme (PNRA - Programma Nazionale di Ricerche in Antartide)220, which is
implemented by:
the National Scientific Commission for the Antarctic (CSNA221), comprised of experts from the
various scientific areas addressed by the PNRA, providing guidance and evaluating findings;
the National Research Council (CNR), in charge of programming and coordinating scientific
activities;
the National Agency for New Technology, Energy and Sustainable Economic Development
(ENEA), implementing the Antarctic campaigns and being responsible for the management of
scientific research infrastructures in the Antarctic.
The PNRA strategic planning document (documento di programmazione strategica)222 for the period
2012-2014 estimates a total financial need around 70 Million Euro and calls for projects covering
interalia a range of climate specific and/or related themes223.
Moreover, the MIPAAF launched and financed in 2008 a five year research initiative to cope with
adaptation of Italian agriculture to climate change in the subsequent 15-25 years, with a total budget
of 8.225.542 Euro224. The programme, called “AgroScenari - Adaptation scenarios of Italian
agriculture to climate change” (AgroScenari: Scenari di adattamento dell’agricoltura italiana ai
cambiamenti climatici)225, is managed by the Italian Agricultural Research Council (CRA - Consiglio per
la Ricerca e la sperimentazione in Agricoltura) and more specifically by the CRA Research Unit for
Climatology and Meteorology applied to agriculture (CRA-CMA - Unità di ricerca per la climatologia e la
220 The PNRA was created by Italian Law no. 284/1985 (http://www.pnra.it/txt/Info_PNRA_norm/Legge284.pdf),
with MIUR placed in charge of coordinating Italian research in the Antarctic. Since then, successive articles of
legislation for the authorization of funding have ensured Italian participation in the Antarctic Treaty
(http://www.pnra.it/leggi.htm), which was introduced in 1959 and entered into effect in 1961. This Treaty
regulates the operations of the countries present on the continent. 221 http://www.csna.it/index.html. 222 Approved with Ministerial Decree dated 30th Oct. 2012 (Prot. N. 729/Ric.)
http://www.csna.it/Documenti/PNRA_Programma_triennale_2012_2014_2012_06_27.pdf). 223
1. Atmospheric dynamics and climate processes;
2. polar cap dynamics;
3. solid Earth dynamics and cryosphere evolution;
4. polar oceans dynamics;
5. Sun-Earth relations and space weather;
6. the Universe over Antarctica;
7. evolution, adaptation and biodiversity;
8. man in extreme environments;
9. environmental contamination;
10. paleoclimate;
11. Issues and environmental risks;
12. Technology: Innovation and experimentation. 224 Ministerial Decree 8th July 2013
http://agroscenari.entecra.it/public/upload/documenti/documenti_ufficiali/decreto_variante_2013.pdf. 225 Ministerial Decree 7th August 2008 n. 8608/7303/08
http://agroscenari.entecra.it/public/upload/documenti/documenti_ufficiali/decreto_finanziamento.pdf.
AgroScenari Website: http://www.agroscenari.it/.
201
meteorologia applicata all’agricoltura). The AgroScenari Programme is subdivided into nine research
lines as follows:
1. Climate change and meteo-climatology;
a) acquisition, adaptation and downscaling of future climatic scenarios at the local scale,
b) modelling to forecast farm soil trafficability,
2. Analysis of climate change impacts on farming systems, with specific reference to herbaceous
crops;
3. Alternative production systems scenarios with emphasis on typical crops and varieties;
4. New scenarios in the agro-zootechnical D.O.P products;
5. Irrigation and climate change;
6. Land degradation processes and climate change;
7. Climatic scenarios, crop diseases and pests;
8. Phenology and climate change;
9. Economic adaptation strategies of farmers to climate change and agricultural policy support
tools.
In 2013 the programme was extended up to 31 Dec. 2014226 and it is being carried out by several
CRA research units as well as by the CNR, several universities and the Regional Agency for
Environmental Protection (ARPA - Agenzia Regionale per la Protezione dell’Ambiente) of Emilia-
Romagna. In addition, at the national level, the MIUR is in the process of defining preliminary
feasibility studies concerning a possible knowledge platform for climate227.
8.3 Observation
According to the PNR 2011-2013, the climate system observations and monitoring must overcome the
current dispersion and multi-annual planning. A more efficient network for Earth observations would
facilitate the Italian contributing to the Copernicus Climate Change Services (former GMES - Global
Monitoring for Environment and Security) and GEOSS (Global Earth Observation System of Systems)
and the increase of the competitiveness of research programs within the EU. The main topics include:
monitoring the Earth’s surface, changes in the composition of the atmosphere, water cycle,
emergency response, climate change, marine monitoring and security; support for national
infrastructure and ESFRI initiatives (ICOS, EUFARCOPAL , SIOS, JERICO, EMSO).
8.4 Major Italian research institutions and organisations working in the field of Climate
and Climate Change
A quite large number of national universities, public and private institutes and other organizations are
involved in climate research and climate-related research and systematic observation. The major
Italian universities consortium, research institutions and organisations conducting climate and climate
change research are the following ones:
Abdus Salam International Centre for Theoretical Physics (ICTP), http://www.ictp.it/;
Agricultural Research Council (CRA - Consiglio per la Ricerca e la sperimentazione in
Agricoltura), http://www.entecra.it/;
226 Ministerial Decree 10th April 2013 n. 6800/7303/13
http://agroscenari.entecra.it/public/upload/documenti/documenti_ufficiali/decreto_proroga_2014.pdf. 227 Source: PNR 2005-2007 (http://hubmiur.pubblica.istruzione.it/alfresco/d/d/workspace/SpacesStore/f6e84deb-
a716-470a-a18c-3662a49758f5/1999.pdf).
202
ENI Enrico Mattei Foundation (FEEM - Fondazione ENI Enrico Mattei), http://www.feem.it/;
Euro-Mediterranean Centre on Climate Change (CMCC - Centro Euro-Mediterraneo sui
Cambiamenti Climatici), http://www.cmcc.it/;
Institute for Environmental Protection and Research (ISPRA – Istituto Superiore per la
Protezione e la Ricerca Ambientale), http://www.isprambiente.it;
Institute of Agro-environmental and Forest Biology of the National Research Council
(IBAF CNR - Istituto di Biologia Agroambientale e Forestale del Consiglio Nazionale delle
Ricerche), http://www.ibaf.cnr.it/;
Institute of Atmospheric Sciences and Climate of the National Research Council (ISAC
CNR - Istituto di Scienze dell’Atmosfera e del Clima del Consiglio Nazionale delle Ricerche),
www.isac.cnr.it;
Institute of Biometeorology of the National Research Council (IBIMET CNR - Istituto di
Biometeorologia del Consiglio Nazionale delle Ricerche), http://www.clima.ibimet.cnr.it/;
Institute of Marine Sciences of the National Research Council (ISMAR CNR - Istituto di
Scienze Marine del Consiglio Nazionale delle Ricerche), http://www.ismar.cnr.it/;
National Agency for New Technologies, Energy and Sustainable Economic
Development (ENEA – Agenzia nazionale per le nuove tecnologie, l’energia e lo sviluppo
economico sostenibile), www.enea.it;
National Centre of Meteorology and Aeronautical Climatology of the Italian Air Force
(CNMCA - Centro Nazionale di Meteorologia e Climatologia Aeronautica dell’Aeronautica
Militare), http://www.meteoam.it/;
National Consortium of Universities for Atmospheric and Hydrospheric Physics
(CINFAI - Consorzio Interuniversitario Nazionale per la Fisica delle Atmosfere e delle
Idrosfere), http://www.cinfai.it/;
National Institute of Experimental Oceanography and Geophysics (OGS - Istituto
Nazionale di Oceanografia e di Geofisica Sperimentale), http://www.ogs.trieste.it/
National Institute of Geophysics and Volcanology (INGV - Istituto Nazionale di Geofisica
e Vulcanologia), www.bo.ingv.it;
National Interuniversity Consortium for Marine Sciences, Local Research Unit:
Department of Geological Sciences and Geotechnologies - Milano-Bicocca (CoNISMa -
Consorzio Nazionale Interuniversitario per le Scienze del Mare, Unità locale di ricerca:
Dipartimento di Scienze Geologiche e Geotecnologie, Università degli Studi di Milano-Bicocca),
http://www.conismamibi.it/;
Water Research Institute of the National Research Council (IRSA CNR - Istituto di
Ricerca sulle Acque), http://www.irsa.cnr.it/;
Zoological Station Anton Dohrn of Naples (Stazione Zoologica Anton Dohrn di Napoli),
http://www.szn.it/.
In addition, several regional Agencies For Environment Protection (ARPAs) are actively conducting
research on climate data monitoring, regional climate modelling and regional impacts assessments.
8.5 Major funding bodies in the field of Climate Change
The major Italian funding bodies for climate change research are reported below:
203
Institute for Environmental Protection and Research (ISPRA – Istituto Superiore per la
Protezione e la Ricerca Ambientale), http://www.isprambiente.it;
Ministry of Agriculture Food and Forestry Policies (MIPAAF - Ministero delle Politiche
Agricole Alimentari e Forestali), http://www.politicheagricole.it/;
Ministry of Economy and Finance, (MEF - Ministero dell’Economia e delle Finanze),
http://www.mef.gov.it/;
Ministry of Environment, Land and Sea (IMELS - Ministero dell’Ambiente e della Tutela del
Territorio e del Mare), http://www.minambiente.it;
Ministry of Foreign Affaires (MAE - Ministero degli Affari Esteri), http://www.esteri.it/;
Ministry of Education, University and Research, (MIUR - Ministero dell’Istruzione,
dell’Università e della Ricerca), http://www.miur.it/.
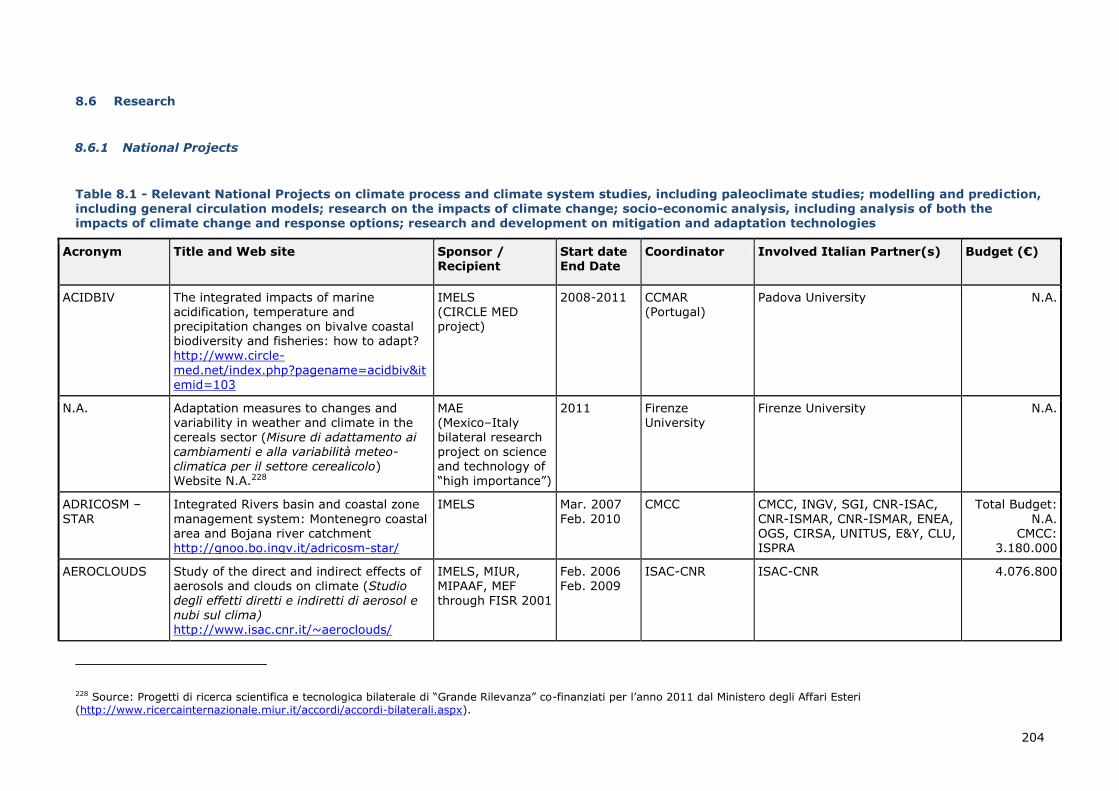
204
8.6 Research
8.6.1 National Projects
Table 8.1 - Relevant National Projects on climate process and climate system studies, including paleoclimate studies; modelling and prediction, including general circulation models; research on the impacts of climate change; socio-economic analysis, including analysis of both the impacts of climate change and response options; research and development on mitigation and adaptation technologies
Acronym Title and Web site Sponsor /
Recipient
Start date
End Date
Coordinator Involved Italian Partner(s) Budget (€)
ACIDBIV The integrated impacts of marine acidification, temperature and precipitation changes on bivalve coastal biodiversity and fisheries: how to adapt? http://www.circle-
med.net/index.php?pagename=acidbiv&itemid=103
IMELS (CIRCLE MED project)
2008-2011 CCMAR (Portugal)
Padova University N.A.
N.A. Adaptation measures to changes and variability in weather and climate in the
cereals sector (Misure di adattamento ai cambiamenti e alla variabilità meteo-climatica per il settore cerealicolo) Website N.A.228
MAE (Mexico–Italy
bilateral research project on science and technology of “high importance”)
2011 Firenze University
Firenze University N.A.
ADRICOSM –
STAR
Integrated Rivers basin and coastal zone
management system: Montenegro coastal area and Bojana river catchment http://gnoo.bo.ingv.it/adricosm-star/
IMELS Mar. 2007
Feb. 2010
CMCC CMCC, INGV, SGI, CNR-ISAC,
CNR-ISMAR, CNR-ISMAR, ENEA, OGS, CIRSA, UNITUS, E&Y, CLU, ISPRA
Total Budget:
N.A. CMCC:
3.180.000
AEROCLOUDS Study of the direct and indirect effects of aerosols and clouds on climate (Studio
degli effetti diretti e indiretti di aerosol e nubi sul clima) http://www.isac.cnr.it/~aeroclouds/
IMELS, MIUR, MIPAAF, MEF
through FISR 2001
Feb. 2006 Feb. 2009
ISAC-CNR ISAC-CNR 4.076.800
228 Source: Progetti di ricerca scientifica e tecnologica bilaterale di “Grande Rilevanza” co-finanziati per l’anno 2011 dal Ministero degli Affari Esteri (http://www.ricercainternazionale.miur.it/accordi/accordi-bilaterali.aspx).
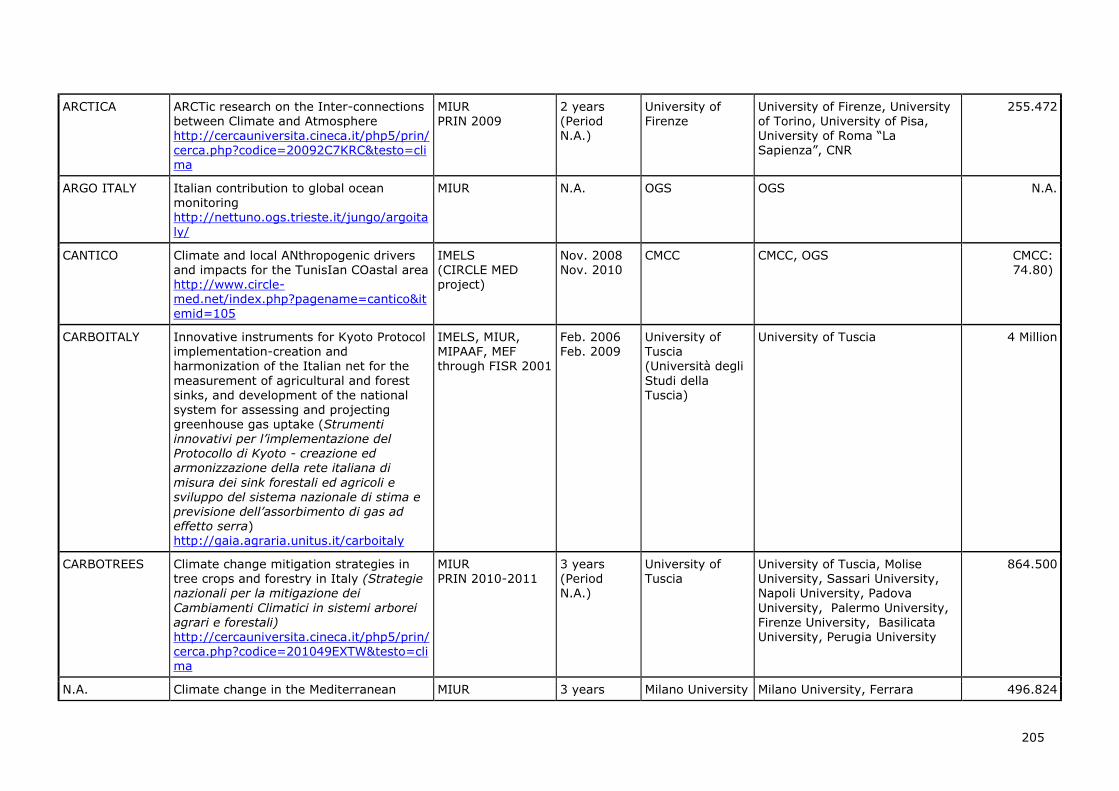
205
ARCTICA ARCTic research on the Inter-connections between Climate and Atmosphere http://cercauniversita.cineca.it/php5/prin/cerca.php?codice=20092C7KRC&testo=clima
MIUR PRIN 2009
2 years (Period N.A.)
University of Firenze
University of Firenze, University of Torino, University of Pisa, University of Roma “La Sapienza”, CNR
255.472
ARGO ITALY Italian contribution to global ocean monitoring http://nettuno.ogs.trieste.it/jungo/argoita
ly/
MIUR N.A. OGS OGS N.A.
CANTICO Climate and local ANthropogenic drivers and impacts for the TunisIan COastal area http://www.circle-med.net/index.php?pagename=cantico&itemid=105
IMELS (CIRCLE MED project)
Nov. 2008 Nov. 2010
CMCC CMCC, OGS CMCC: 74.80)
CARBOITALY Innovative instruments for Kyoto Protocol implementation-creation and harmonization of the Italian net for the
measurement of agricultural and forest sinks, and development of the national system for assessing and projecting greenhouse gas uptake (Strumenti
innovativi per l’implementazione del Protocollo di Kyoto - creazione ed armonizzazione della rete italiana di
misura dei sink forestali ed agricoli e sviluppo del sistema nazionale di stima e previsione dell’assorbimento di gas ad effetto serra) http://gaia.agraria.unitus.it/carboitaly
IMELS, MIUR, MIPAAF, MEF through FISR 2001
Feb. 2006 Feb. 2009
University of Tuscia (Università degli
Studi della Tuscia)
University of Tuscia 4 Million
CARBOTREES Climate change mitigation strategies in tree crops and forestry in Italy (Strategie nazionali per la mitigazione dei
Cambiamenti Climatici in sistemi arborei agrari e forestali) http://cercauniversita.cineca.it/php5/prin/cerca.php?codice=201049EXTW&testo=clima
MIUR PRIN 2010-2011
3 years (Period N.A.)
University of Tuscia
University of Tuscia, Molise University, Sassari University, Napoli University, Padova
University, Palermo University, Firenze University, Basilicata University, Perugia University
864.500
N.A. Climate change in the Mediterranean MIUR 3 years Milano University Milano University, Ferrara 496.824
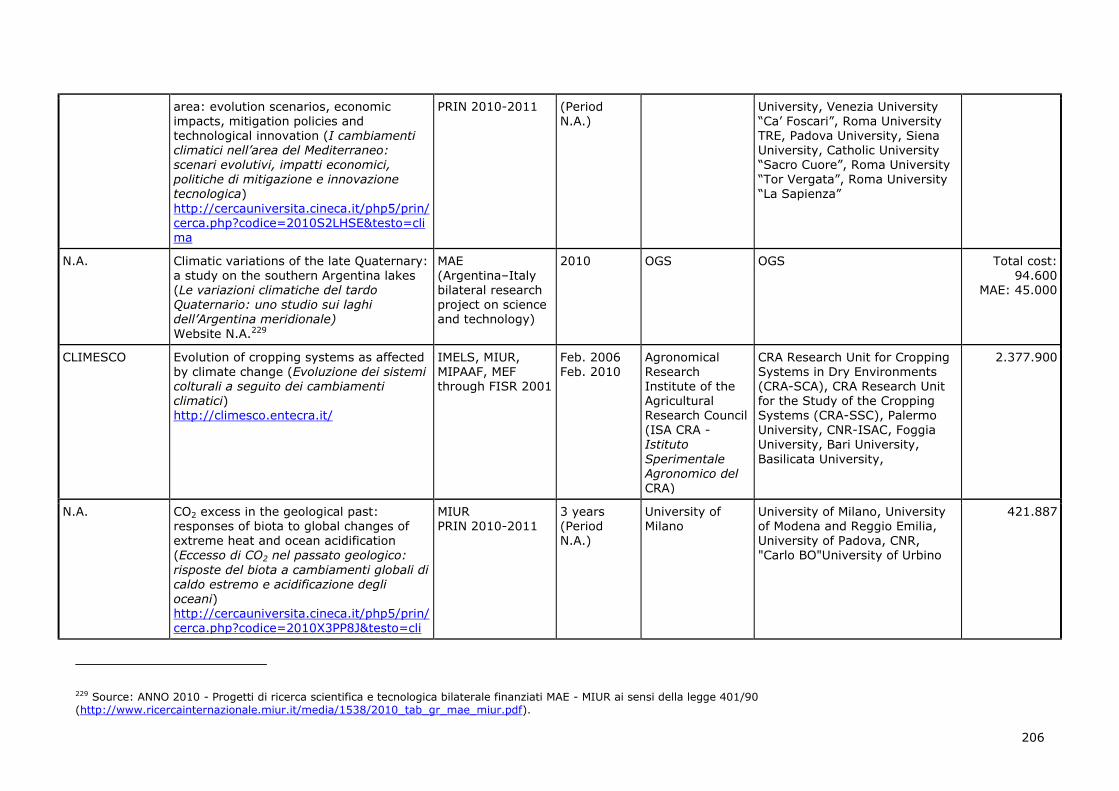
206
area: evolution scenarios, economic impacts, mitigation policies and technological innovation (I cambiamenti climatici nell’area del Mediterraneo: scenari evolutivi, impatti economici, politiche di mitigazione e innovazione tecnologica)
http://cercauniversita.cineca.it/php5/prin/cerca.php?codice=2010S2LHSE&testo=clima
PRIN 2010-2011 (Period N.A.)
University, Venezia University “Ca’ Foscari”, Roma University TRE, Padova University, Siena University, Catholic University “Sacro Cuore”, Roma University “Tor Vergata”, Roma University “La Sapienza”
N.A. Climatic variations of the late Quaternary: a study on the southern Argentina lakes (Le variazioni climatiche del tardo Quaternario: uno studio sui laghi dell’Argentina meridionale)
Website N.A.229
MAE (Argentina–Italy bilateral research project on science and technology)
2010 OGS OGS Total cost: 94.600
MAE: 45.000
CLIMESCO Evolution of cropping systems as affected by climate change (Evoluzione dei sistemi colturali a seguito dei cambiamenti climatici) http://climesco.entecra.it/
IMELS, MIUR, MIPAAF, MEF through FISR 2001
Feb. 2006 Feb. 2010
Agronomical Research Institute of the Agricultural Research Council
(ISA CRA - Istituto
Sperimentale Agronomico del CRA)
CRA Research Unit for Cropping Systems in Dry Environments (CRA-SCA), CRA Research Unit for the Study of the Cropping Systems (CRA-SSC), Palermo
University, CNR-ISAC, Foggia University, Bari University,
Basilicata University,
2.377.900
N.A. CO2 excess in the geological past: responses of biota to global changes of extreme heat and ocean acidification (Eccesso di CO2 nel passato geologico:
risposte del biota a cambiamenti globali di caldo estremo e acidificazione degli
oceani) http://cercauniversita.cineca.it/php5/prin/cerca.php?codice=2010X3PP8J&testo=cli
MIUR PRIN 2010-2011
3 years (Period N.A.)
University of Milano
University of Milano, University of Modena and Reggio Emilia, University of Padova, CNR, "Carlo BO"University of Urbino
421.887
229 Source: ANNO 2010 - Progetti di ricerca scientifica e tecnologica bilaterale finanziati MAE - MIUR ai sensi della legge 401/90 (http://www.ricercainternazionale.miur.it/media/1538/2010_tab_gr_mae_miur.pdf).
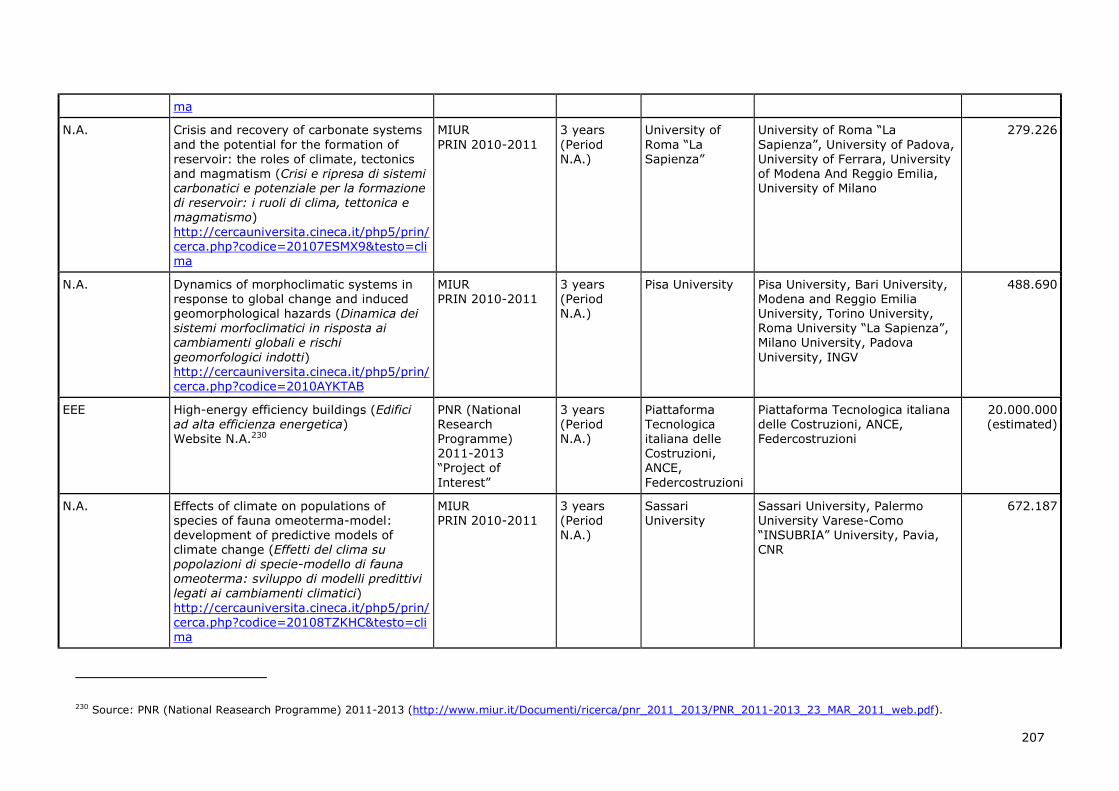
207
ma
N.A. Crisis and recovery of carbonate systems
and the potential for the formation of reservoir: the roles of climate, tectonics and magmatism (Crisi e ripresa di sistemi carbonatici e potenziale per la formazione di reservoir: i ruoli di clima, tettonica e magmatismo)
http://cercauniversita.cineca.it/php5/prin/cerca.php?codice=20107ESMX9&testo=cli
ma
MIUR
PRIN 2010-2011
3 years
(Period N.A.)
University of
Roma “La Sapienza”
University of Roma “La
Sapienza”, University of Padova, University of Ferrara, University of Modena And Reggio Emilia, University of Milano
279.226
N.A. Dynamics of morphoclimatic systems in response to global change and induced geomorphological hazards (Dinamica dei sistemi morfoclimatici in risposta ai cambiamenti globali e rischi
geomorfologici indotti) http://cercauniversita.cineca.it/php5/prin/cerca.php?codice=2010AYKTAB
MIUR PRIN 2010-2011
3 years (Period N.A.)
Pisa University Pisa University, Bari University, Modena and Reggio Emilia University, Torino University, Roma University “La Sapienza”, Milano University, Padova
University, INGV
488.690
EEE High-energy efficiency buildings (Edifici ad alta efficienza energetica)
Website N.A.230
PNR (National Research
Programme) 2011-2013 “Project of
Interest”
3 years (Period
N.A.)
Piattaforma Tecnologica
italiana delle Costruzioni, ANCE,
Federcostruzioni
Piattaforma Tecnologica italiana delle Costruzioni, ANCE,
Federcostruzioni
20.000.000 (estimated)
N.A. Effects of climate on populations of species of fauna omeoterma-model: development of predictive models of climate change (Effetti del clima su popolazioni di specie-modello di fauna omeoterma: sviluppo di modelli predittivi legati ai cambiamenti climatici)
http://cercauniversita.cineca.it/php5/prin/cerca.php?codice=20108TZKHC&testo=clima
MIUR PRIN 2010-2011
3 years (Period N.A.)
Sassari University
Sassari University, Palermo University Varese-Como “INSUBRIA” University, Pavia, CNR
672.187
230 Source: PNR (National Reasearch Programme) 2011-2013 (http://www.miur.it/Documenti/ricerca/pnr_2011_2013/PNR_2011-2013_23_MAR_2011_web.pdf).
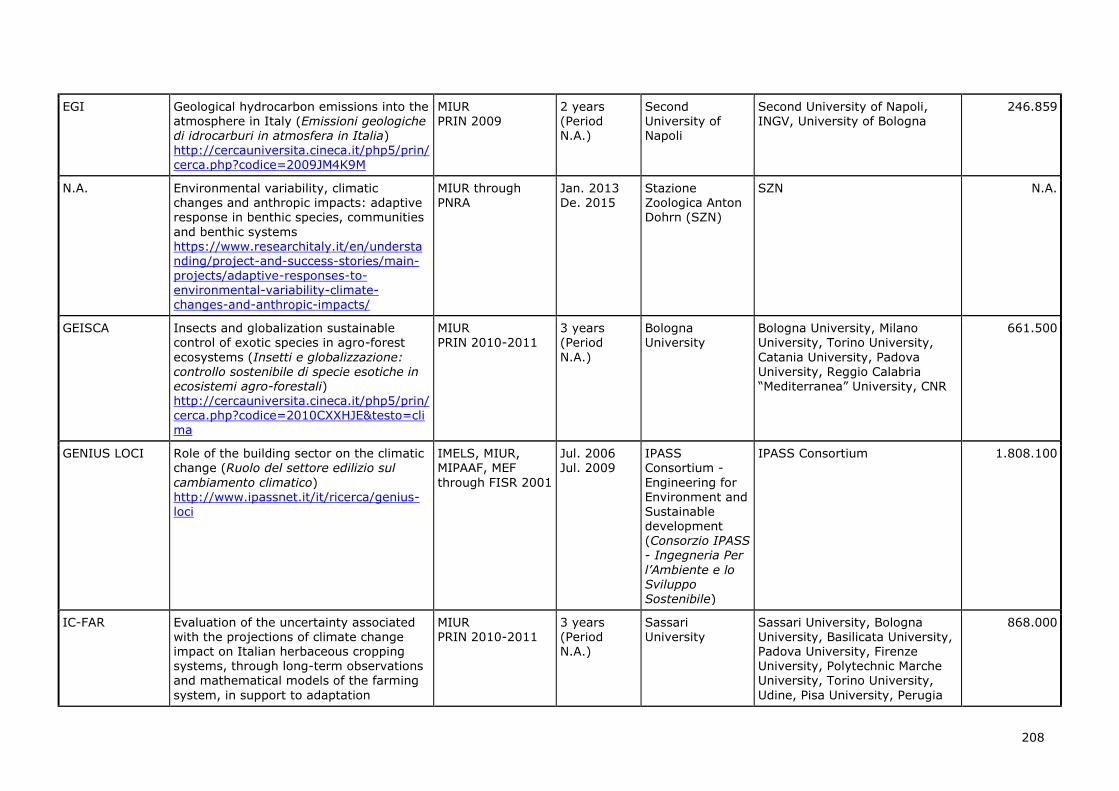
208
EGI Geological hydrocarbon emissions into the atmosphere in Italy (Emissioni geologiche di idrocarburi in atmosfera in Italia) http://cercauniversita.cineca.it/php5/prin/cerca.php?codice=2009JM4K9M
MIUR PRIN 2009
2 years (Period N.A.)
Second University of Napoli
Second University of Napoli, INGV, University of Bologna
246.859
N.A. Environmental variability, climatic changes and anthropic impacts: adaptive response in benthic species, communities
and benthic systems https://www.researchitaly.it/en/understa
nding/project-and-success-stories/main-projects/adaptive-responses-to-environmental-variability-climate-changes-and-anthropic-impacts/
MIUR through PNRA
Jan. 2013 De. 2015
Stazione Zoologica Anton Dohrn (SZN)
SZN N.A.
GEISCA Insects and globalization sustainable control of exotic species in agro-forest
ecosystems (Insetti e globalizzazione: controllo sostenibile di specie esotiche in ecosistemi agro-forestali) http://cercauniversita.cineca.it/php5/prin/cerca.php?codice=2010CXXHJE&testo=cli
ma
MIUR PRIN 2010-2011
3 years (Period
N.A.)
Bologna University
Bologna University, Milano University, Torino University,
Catania University, Padova University, Reggio Calabria “Mediterranea” University, CNR
661.500
GENIUS LOCI Role of the building sector on the climatic change (Ruolo del settore edilizio sul
cambiamento climatico) http://www.ipassnet.it/it/ricerca/genius-loci
IMELS, MIUR, MIPAAF, MEF
through FISR 2001
Jul. 2006 Jul. 2009
IPASS Consortium -
Engineering for Environment and Sustainable development (Consorzio IPASS - Ingegneria Per
l’Ambiente e lo Sviluppo
Sostenibile)
IPASS Consortium 1.808.100
IC-FAR Evaluation of the uncertainty associated with the projections of climate change impact on Italian herbaceous cropping systems, through long-term observations and mathematical models of the farming
system, in support to adaptation
MIUR PRIN 2010-2011
3 years (Period N.A.)
Sassari University
Sassari University, Bologna University, Basilicata University, Padova University, Firenze University, Polytechnic Marche University, Torino University,
Udine, Pisa University, Perugia
868.000
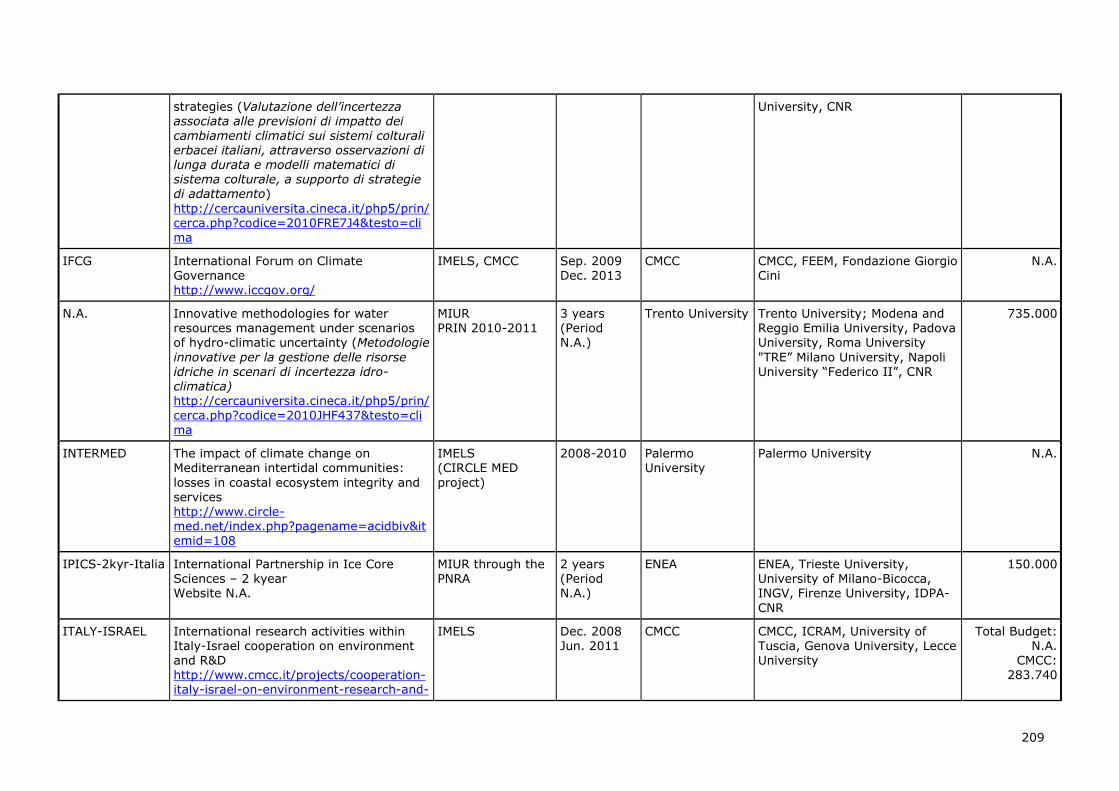
209
strategies (Valutazione dell’incertezza associata alle previsioni di impatto dei cambiamenti climatici sui sistemi colturali erbacei italiani, attraverso osservazioni di lunga durata e modelli matematici di sistema colturale, a supporto di strategie di adattamento)
http://cercauniversita.cineca.it/php5/prin/cerca.php?codice=2010FRE7J4&testo=clima
University, CNR
IFCG International Forum on Climate Governance http://www.iccgov.org/
IMELS, CMCC Sep. 2009 Dec. 2013
CMCC CMCC, FEEM, Fondazione Giorgio Cini
N.A.
N.A. Innovative methodologies for water resources management under scenarios of hydro-climatic uncertainty (Metodologie
innovative per la gestione delle risorse idriche in scenari di incertezza idro-climatica) http://cercauniversita.cineca.it/php5/prin/cerca.php?codice=2010JHF437&testo=cli
ma
MIUR PRIN 2010-2011
3 years (Period N.A.)
Trento University Trento University; Modena and Reggio Emilia University, Padova University, Roma University
"TRE” Milano University, Napoli University “Federico II”, CNR
735.000
INTERMED The impact of climate change on Mediterranean intertidal communities:
losses in coastal ecosystem integrity and services http://www.circle-med.net/index.php?pagename=acidbiv&itemid=108
IMELS (CIRCLE MED
project)
2008-2010 Palermo University
Palermo University N.A.
IPICS-2kyr-Italia International Partnership in Ice Core Sciences – 2 kyear Website N.A.
MIUR through the PNRA
2 years (Period N.A.)
ENEA ENEA, Trieste University, University of Milano-Bicocca, INGV, Firenze University, IDPA-
CNR
150.000
ITALY-ISRAEL International research activities within Italy-Israel cooperation on environment and R&D http://www.cmcc.it/projects/cooperation-italy-israel-on-environment-research-and-
IMELS Dec. 2008 Jun. 2011
CMCC CMCC, ICRAM, University of Tuscia, Genova University, Lecce University
Total Budget: N.A.
CMCC: 283.740
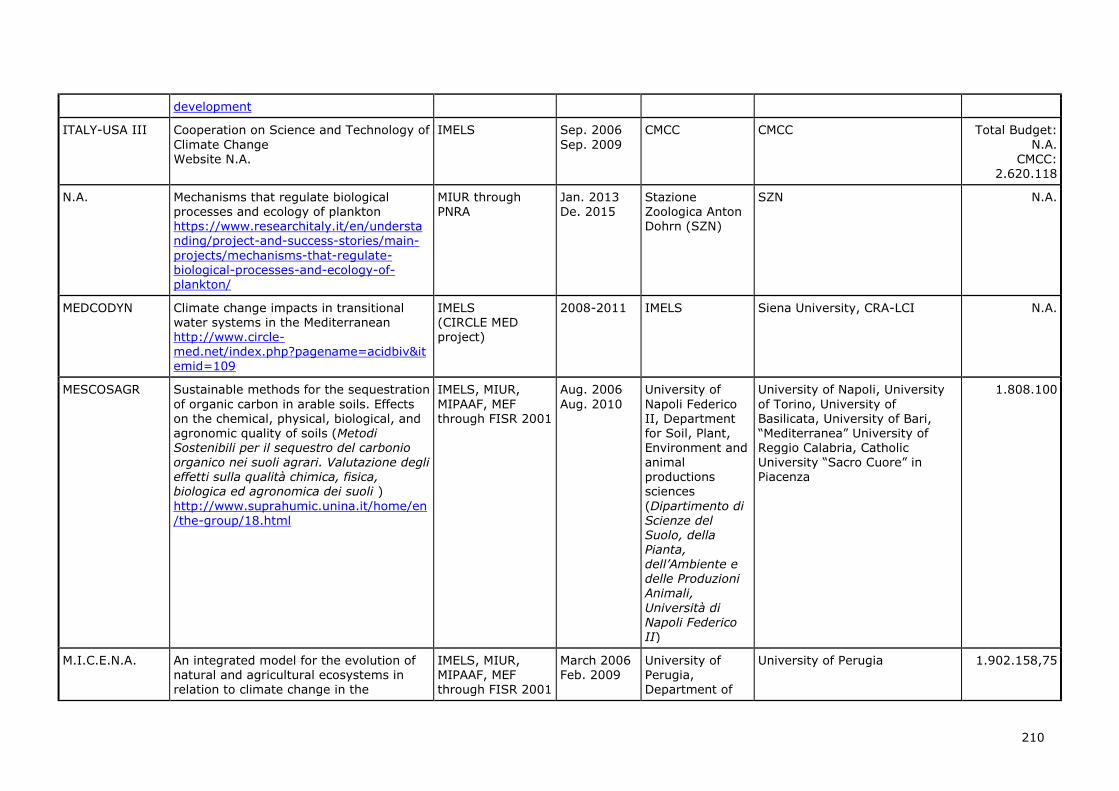
210
development
ITALY-USA III Cooperation on Science and Technology of
Climate Change Website N.A.
IMELS Sep. 2006
Sep. 2009
CMCC CMCC Total Budget:
N.A. CMCC:
2.620.118
N.A. Mechanisms that regulate biological processes and ecology of plankton https://www.researchitaly.it/en/understanding/project-and-success-stories/main-
projects/mechanisms-that-regulate-biological-processes-and-ecology-of-plankton/
MIUR through PNRA
Jan. 2013 De. 2015
Stazione Zoologica Anton Dohrn (SZN)
SZN N.A.
MEDCODYN Climate change impacts in transitional water systems in the Mediterranean http://www.circle-med.net/index.php?pagename=acidbiv&itemid=109
IMELS (CIRCLE MED project)
2008-2011 IMELS Siena University, CRA-LCI N.A.
MESCOSAGR Sustainable methods for the sequestration
of organic carbon in arable soils. Effects on the chemical, physical, biological, and
agronomic quality of soils (Metodi Sostenibili per il sequestro del carbonio organico nei suoli agrari. Valutazione degli effetti sulla qualità chimica, fisica, biologica ed agronomica dei suoli )
http://www.suprahumic.unina.it/home/en/the-group/18.html
IMELS, MIUR,
MIPAAF, MEF through FISR 2001
Aug. 2006
Aug. 2010
University of
Napoli Federico II, Department
for Soil, Plant, Environment and animal productions sciences
(Dipartimento di Scienze del Suolo, della Pianta, dell’Ambiente e delle Produzioni Animali,
Università di Napoli Federico II)
University of Napoli, University
of Torino, University of Basilicata, University of Bari,
“Mediterranea” University of Reggio Calabria, Catholic University “Sacro Cuore” in Piacenza
1.808.100
M.I.C.E.N.A. An integrated model for the evolution of natural and agricultural ecosystems in relation to climate change in the
IMELS, MIUR, MIPAAF, MEF through FISR 2001
March 2006 Feb. 2009
University of Perugia, Department of
University of Perugia 1.902.158,75
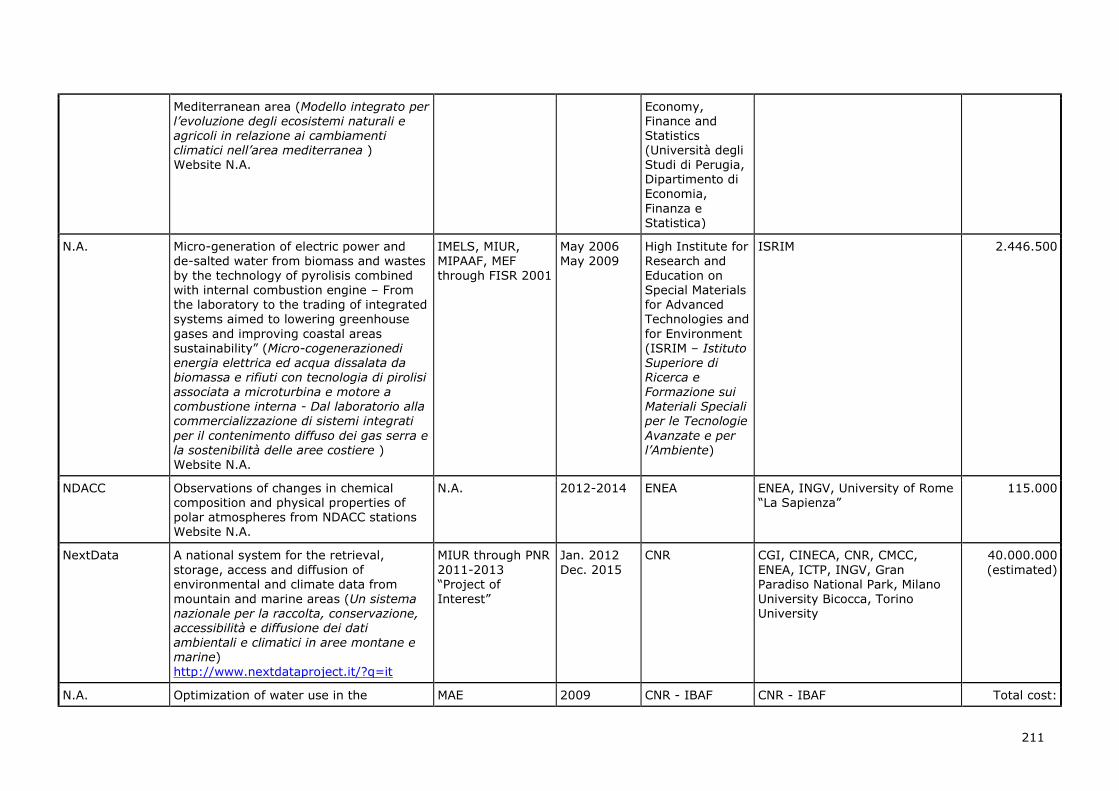
211
Mediterranean area (Modello integrato per l’evoluzione degli ecosistemi naturali e agricoli in relazione ai cambiamenti climatici nell’area mediterranea ) Website N.A.
Economy, Finance and Statistics (Università degli Studi di Perugia, Dipartimento di Economia,
Finanza e Statistica)
N.A. Micro-generation of electric power and
de-salted water from biomass and wastes by the technology of pyrolisis combined with internal combustion engine – From the laboratory to the trading of integrated systems aimed to lowering greenhouse
gases and improving coastal areas sustainability” (Micro-cogenerazionedi energia elettrica ed acqua dissalata da biomassa e rifiuti con tecnologia di pirolisi associata a microturbina e motore a combustione interna - Dal laboratorio alla commercializzazione di sistemi integrati
per il contenimento diffuso dei gas serra e la sostenibilità delle aree costiere ) Website N.A.
IMELS, MIUR,
MIPAAF, MEF through FISR 2001
May 2006
May 2009
High Institute for
Research and Education on Special Materials for Advanced Technologies and
for Environment (ISRIM – Istituto Superiore di Ricerca e Formazione sui Materiali Speciali per le Tecnologie
Avanzate e per l’Ambiente)
ISRIM 2.446.500
NDACC Observations of changes in chemical composition and physical properties of polar atmospheres from NDACC stations Website N.A.
N.A. 2012-2014 ENEA ENEA, INGV, University of Rome “La Sapienza”
115.000
NextData A national system for the retrieval,
storage, access and diffusion of environmental and climate data from
mountain and marine areas (Un sistema nazionale per la raccolta, conservazione, accessibilità e diffusione dei dati ambientali e climatici in aree montane e marine)
http://www.nextdataproject.it/?q=it
MIUR through PNR
2011-2013 “Project of
Interest”
Jan. 2012
Dec. 2015
CNR CGI, CINECA, CNR, CMCC,
ENEA, ICTP, INGV, Gran Paradiso National Park, Milano
University Bicocca, Torino University
40.000.000
(estimated)
N.A. Optimization of water use in the MAE 2009 CNR - IBAF CNR - IBAF Total cost:
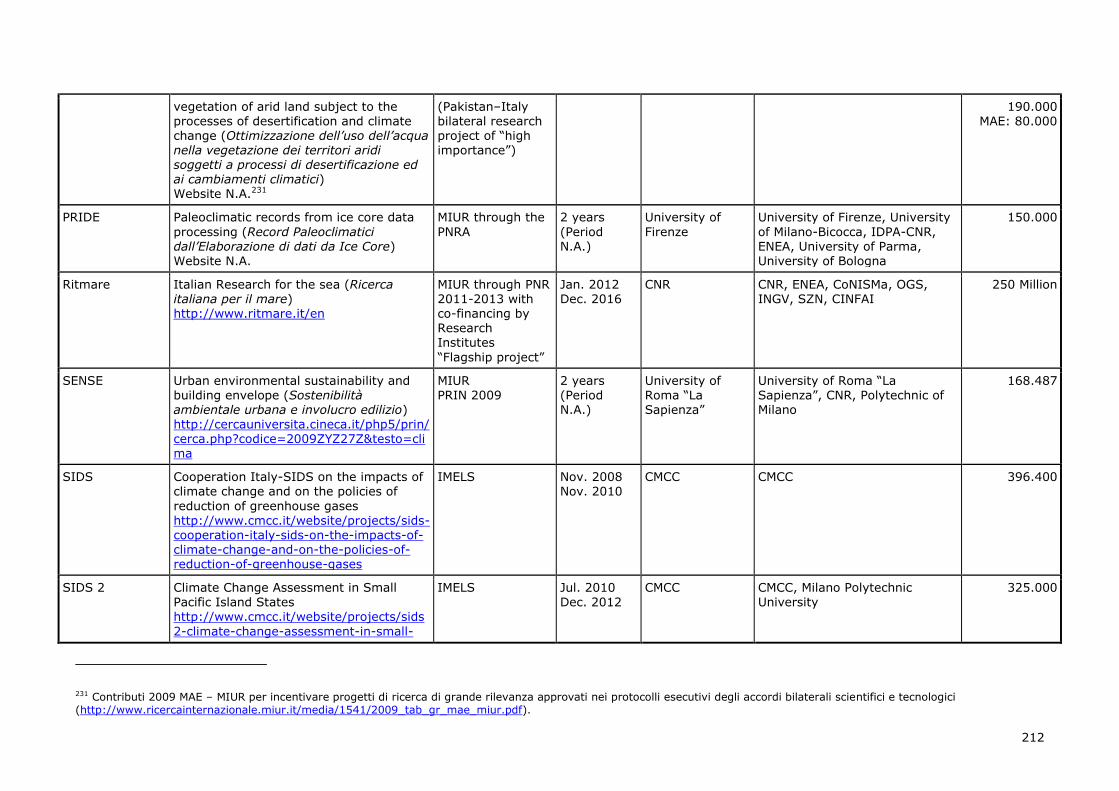
212
vegetation of arid land subject to the processes of desertification and climate change (Ottimizzazione dell’uso dell’acqua nella vegetazione dei territori aridi soggetti a processi di desertificazione ed ai cambiamenti climatici) Website N.A.231
(Pakistan–Italy bilateral research project of “high importance”)
190.000 MAE: 80.000
PRIDE Paleoclimatic records from ice core data
processing (Record Paleoclimatici dall’Elaborazione di dati da Ice Core)
Website N.A.
MIUR through the
PNRA
2 years
(Period N.A.)
University of
Firenze
University of Firenze, University
of Milano-Bicocca, IDPA-CNR, ENEA, University of Parma,
University of Bologna
150.000
Ritmare Italian Research for the sea (Ricerca italiana per il mare) http://www.ritmare.it/en
MIUR through PNR 2011-2013 with co-financing by Research Institutes
“Flagship project”
Jan. 2012 Dec. 2016
CNR CNR, ENEA, CoNISMa, OGS, INGV, SZN, CINFAI
250 Million
SENSE Urban environmental sustainability and building envelope (Sostenibilità ambientale urbana e involucro edilizio) http://cercauniversita.cineca.it/php5/prin/
cerca.php?codice=2009ZYZ27Z&testo=clima
MIUR PRIN 2009
2 years (Period N.A.)
University of Roma “La Sapienza”
University of Roma “La Sapienza”, CNR, Polytechnic of Milano
168.487
SIDS Cooperation Italy-SIDS on the impacts of climate change and on the policies of
reduction of greenhouse gases http://www.cmcc.it/website/projects/sids-cooperation-italy-sids-on-the-impacts-of-climate-change-and-on-the-policies-of-reduction-of-greenhouse-gases
IMELS Nov. 2008 Nov. 2010
CMCC CMCC 396.400
SIDS 2 Climate Change Assessment in Small
Pacific Island States http://www.cmcc.it/website/projects/sids
2-climate-change-assessment-in-small-
IMELS Jul. 2010
Dec. 2012
CMCC CMCC, Milano Polytechnic
University
325.000
231 Contributi 2009 MAE – MIUR per incentivare progetti di ricerca di grande rilevanza approvati nei protocolli esecutivi degli accordi bilaterali scientifici e tecnologici (http://www.ricercainternazionale.miur.it/media/1541/2009_tab_gr_mae_miur.pdf).
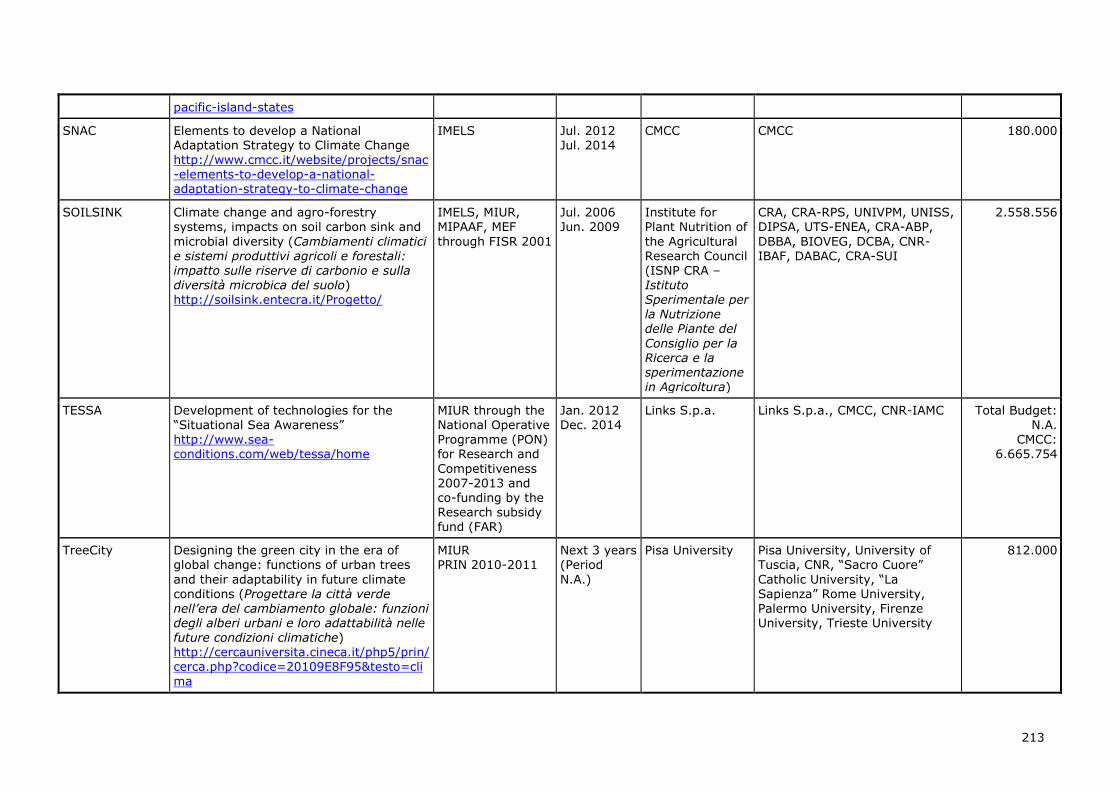
213
pacific-island-states
SNAC Elements to develop a National Adaptation Strategy to Climate Change http://www.cmcc.it/website/projects/snac-elements-to-develop-a-national-adaptation-strategy-to-climate-change
IMELS Jul. 2012 Jul. 2014
CMCC CMCC 180.000
SOILSINK Climate change and agro-forestry systems, impacts on soil carbon sink and
microbial diversity (Cambiamenti climatici
e sistemi produttivi agricoli e forestali: impatto sulle riserve di carbonio e sulla diversità microbica del suolo) http://soilsink.entecra.it/Progetto/
IMELS, MIUR, MIPAAF, MEF
through FISR 2001
Jul. 2006 Jun. 2009
Institute for Plant Nutrition of
the Agricultural
Research Council (ISNP CRA – Istituto Sperimentale per la Nutrizione delle Piante del
Consiglio per la Ricerca e la sperimentazione in Agricoltura)
CRA, CRA-RPS, UNIVPM, UNISS, DIPSA, UTS-ENEA, CRA-ABP,
DBBA, BIOVEG, DCBA, CNR-
IBAF, DABAC, CRA-SUI
2.558.556
TESSA Development of technologies for the
“Situational Sea Awareness” http://www.sea-conditions.com/web/tessa/home
MIUR through the
National Operative Programme (PON) for Research and
Competitiveness 2007-2013 and co-funding by the Research subsidy fund (FAR)
Jan. 2012
Dec. 2014
Links S.p.a. Links S.p.a., CMCC, CNR-IAMC Total Budget:
N.A. CMCC:
6.665.754
TreeCity Designing the green city in the era of global change: functions of urban trees
and their adaptability in future climate conditions (Progettare la città verde
nell’era del cambiamento globale: funzioni degli alberi urbani e loro adattabilità nelle future condizioni climatiche) http://cercauniversita.cineca.it/php5/prin/cerca.php?codice=20109E8F95&testo=cli
ma
MIUR PRIN 2010-2011
Next 3 years (Period
N.A.)
Pisa University Pisa University, University of Tuscia, CNR, “Sacro Cuore”
Catholic University, “La Sapienza” Rome University,
Palermo University, Firenze University, Trieste University
812.000
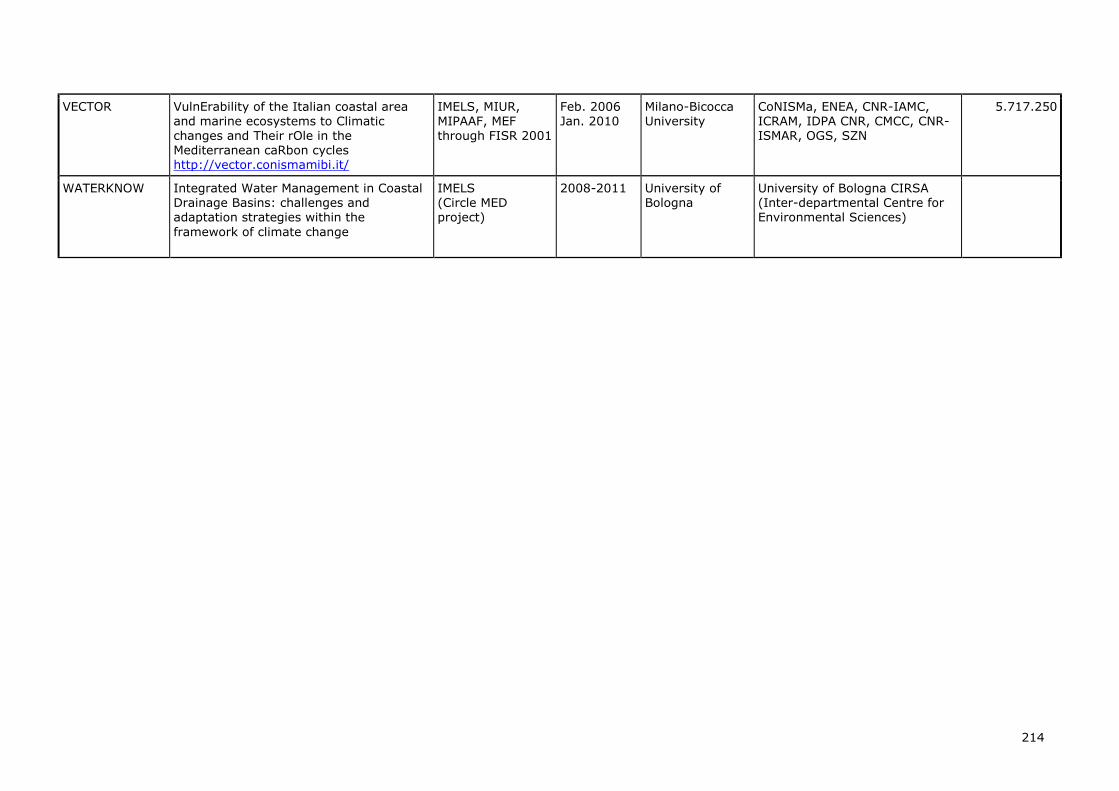
214
VECTOR VulnErability of the Italian coastal area and marine ecosystems to Climatic changes and Their rOle in the Mediterranean caRbon cycles http://vector.conismamibi.it/
IMELS, MIUR, MIPAAF, MEF through FISR 2001
Feb. 2006 Jan. 2010
Milano-Bicocca University
CoNISMa, ENEA, CNR-IAMC, ICRAM, IDPA CNR, CMCC, CNR-ISMAR, OGS, SZN
5.717.250
WATERKNOW Integrated Water Management in Coastal Drainage Basins: challenges and adaptation strategies within the
framework of climate change
IMELS (Circle MED project)
2008-2011 University of Bologna
University of Bologna CIRSA (Inter-departmental Centre for Environmental Sciences)
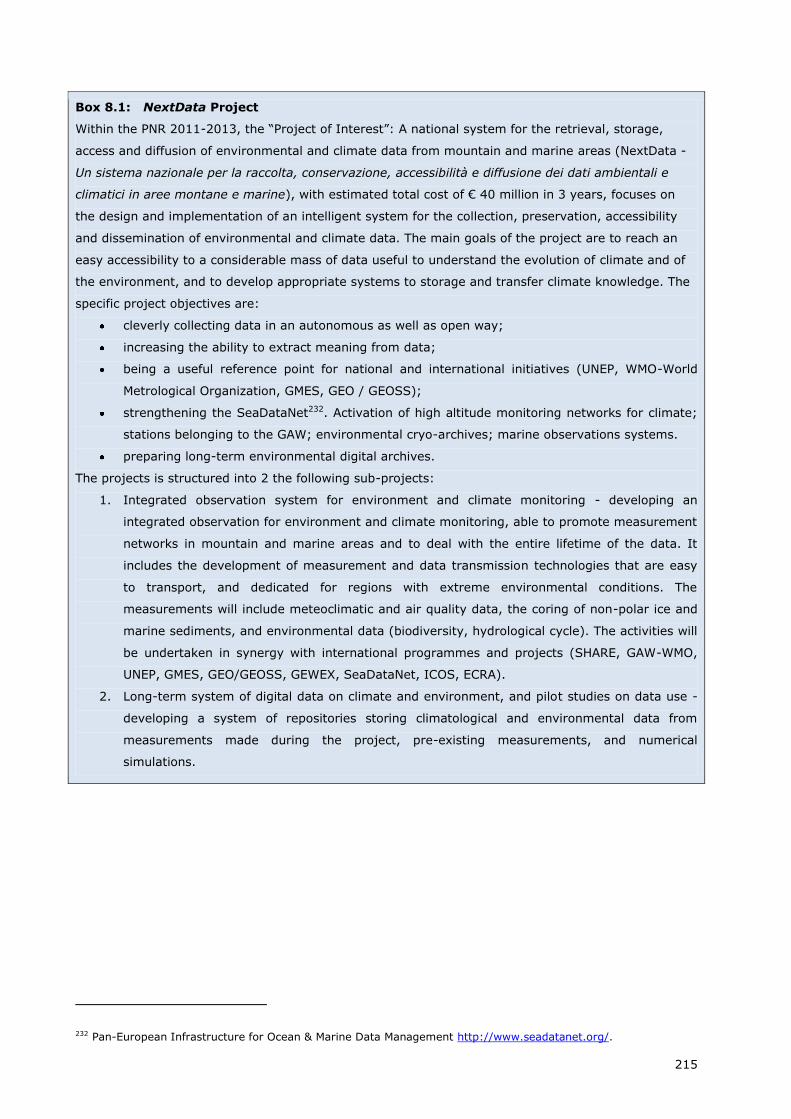
215
Box 8.1: NextData Project
Within the PNR 2011-2013, the “Project of Interest”: A national system for the retrieval, storage,
access and diffusion of environmental and climate data from mountain and marine areas (NextData -
Un sistema nazionale per la raccolta, conservazione, accessibilità e diffusione dei dati ambientali e
climatici in aree montane e marine), with estimated total cost of € 40 million in 3 years, focuses on
the design and implementation of an intelligent system for the collection, preservation, accessibility
and dissemination of environmental and climate data. The main goals of the project are to reach an
easy accessibility to a considerable mass of data useful to understand the evolution of climate and of
the environment, and to develop appropriate systems to storage and transfer climate knowledge. The
specific project objectives are:
cleverly collecting data in an autonomous as well as open way;
increasing the ability to extract meaning from data;
being a useful reference point for national and international initiatives (UNEP, WMO-World
Metrological Organization, GMES, GEO / GEOSS);
strengthening the SeaDataNet232. Activation of high altitude monitoring networks for climate;
stations belonging to the GAW; environmental cryo-archives; marine observations systems.
preparing long-term environmental digital archives.
The projects is structured into 2 the following sub-projects:
1. Integrated observation system for environment and climate monitoring - developing an
integrated observation for environment and climate monitoring, able to promote measurement
networks in mountain and marine areas and to deal with the entire lifetime of the data. It
includes the development of measurement and data transmission technologies that are easy
to transport, and dedicated for regions with extreme environmental conditions. The
measurements will include meteoclimatic and air quality data, the coring of non-polar ice and
marine sediments, and environmental data (biodiversity, hydrological cycle). The activities will
be undertaken in synergy with international programmes and projects (SHARE, GAW-WMO,
UNEP, GMES, GEO/GEOSS, GEWEX, SeaDataNet, ICOS, ECRA).
2. Long-term system of digital data on climate and environment, and pilot studies on data use -
developing a system of repositories storing climatological and environmental data from
measurements made during the project, pre-existing measurements, and numerical
simulations.
232 Pan-European Infrastructure for Ocean & Marine Data Management http://www.seadatanet.org/.
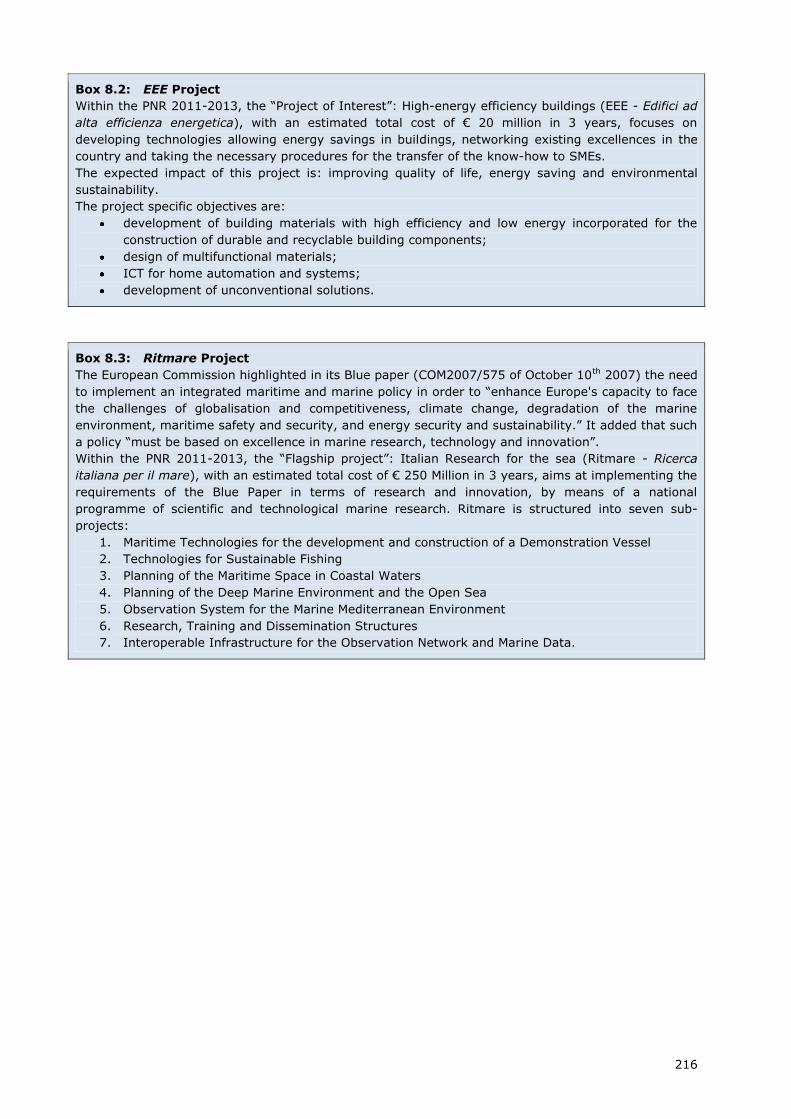
216
Box 8.2: EEE Project
Within the PNR 2011-2013, the “Project of Interest”: High-energy efficiency buildings (EEE - Edifici ad
alta efficienza energetica), with an estimated total cost of € 20 million in 3 years, focuses on
developing technologies allowing energy savings in buildings, networking existing excellences in the
country and taking the necessary procedures for the transfer of the know-how to SMEs.
The expected impact of this project is: improving quality of life, energy saving and environmental
sustainability.
The project specific objectives are:
development of building materials with high efficiency and low energy incorporated for the
construction of durable and recyclable building components;
design of multifunctional materials;
ICT for home automation and systems;
development of unconventional solutions.
Box 8.3: Ritmare Project
The European Commission highlighted in its Blue paper (COM2007/575 of October 10th 2007) the need
to implement an integrated maritime and marine policy in order to “enhance Europe's capacity to face
the challenges of globalisation and competitiveness, climate change, degradation of the marine
environment, maritime safety and security, and energy security and sustainability.” It added that such
a policy “must be based on excellence in marine research, technology and innovation”.
Within the PNR 2011-2013, the “Flagship project”: Italian Research for the sea (Ritmare - Ricerca
italiana per il mare), with an estimated total cost of € 250 Million in 3 years, aims at implementing the
requirements of the Blue Paper in terms of research and innovation, by means of a national
programme of scientific and technological marine research. Ritmare is structured into seven sub-
projects:
1. Maritime Technologies for the development and construction of a Demonstration Vessel
2. Technologies for Sustainable Fishing
3. Planning of the Maritime Space in Coastal Waters
4. Planning of the Deep Marine Environment and the Open Sea
5. Observation System for the Marine Mediterranean Environment
6. Research, Training and Dissemination Structures
7. Interoperable Infrastructure for the Observation Network and Marine Data.
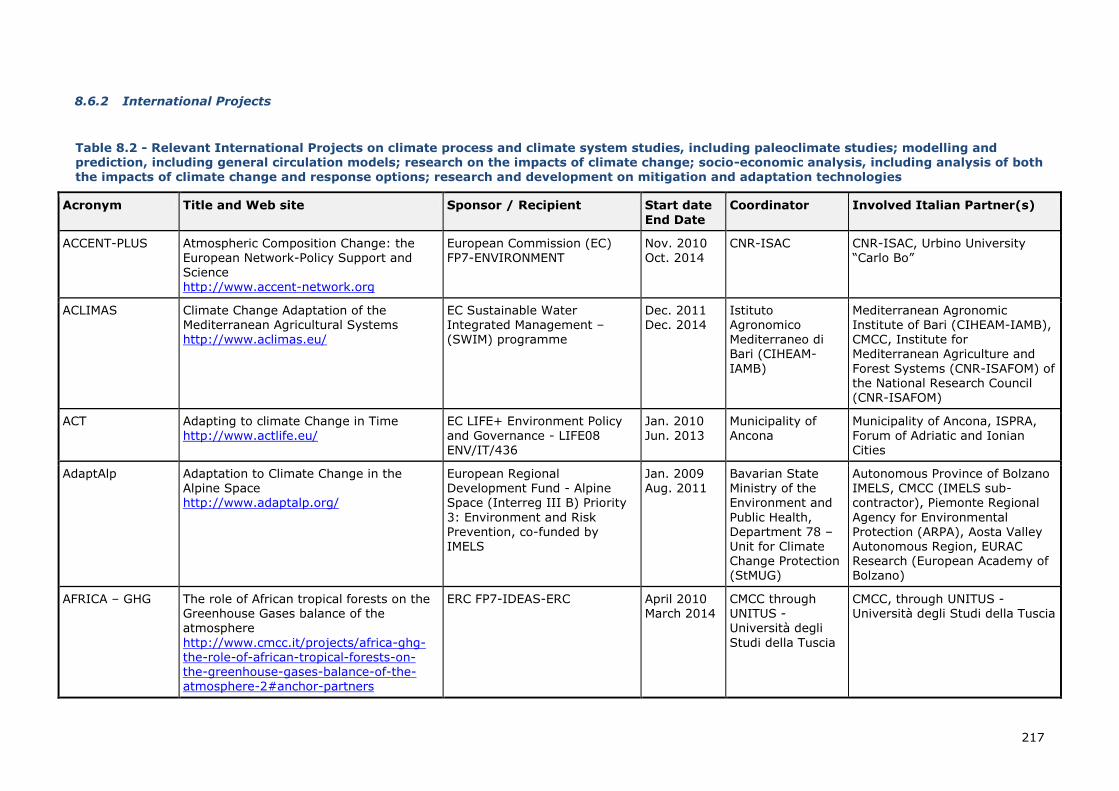
217
8.6.2 International Projects
Table 8.2 - Relevant International Projects on climate process and climate system studies, including paleoclimate studies; modelling and prediction, including general circulation models; research on the impacts of climate change; socio-economic analysis, including analysis of both the impacts of climate change and response options; research and development on mitigation and adaptation technologies
Acronym Title and Web site Sponsor / Recipient Start date
End Date
Coordinator Involved Italian Partner(s)
ACCENT-PLUS Atmospheric Composition Change: the
European Network-Policy Support and Science http://www.accent-network.org
European Commission (EC)
FP7-ENVIRONMENT
Nov. 2010
Oct. 2014
CNR-ISAC CNR-ISAC, Urbino University
“Carlo Bo”
ACLIMAS Climate Change Adaptation of the Mediterranean Agricultural Systems http://www.aclimas.eu/
EC Sustainable Water Integrated Management – (SWIM) programme
Dec. 2011 Dec. 2014
Istituto Agronomico Mediterraneo di Bari (CIHEAM-
IAMB)
Mediterranean Agronomic Institute of Bari (CIHEAM-IAMB), CMCC, Institute for Mediterranean Agriculture and
Forest Systems (CNR-ISAFOM) of the National Research Council (CNR-ISAFOM)
ACT Adapting to climate Change in Time
http://www.actlife.eu/
EC LIFE+ Environment Policy
and Governance - LIFE08 ENV/IT/436
Jan. 2010
Jun. 2013
Municipality of
Ancona
Municipality of Ancona, ISPRA,
Forum of Adriatic and Ionian Cities
AdaptAlp Adaptation to Climate Change in the Alpine Space http://www.adaptalp.org/
European Regional Development Fund - Alpine Space (Interreg III B) Priority
3: Environment and Risk Prevention, co-funded by IMELS
Jan. 2009 Aug. 2011
Bavarian State Ministry of the Environment and
Public Health, Department 78 – Unit for Climate Change Protection (StMUG)
Autonomous Province of Bolzano IMELS, CMCC (IMELS sub-contractor), Piemonte Regional
Agency for Environmental Protection (ARPA), Aosta Valley Autonomous Region, EURAC Research (European Academy of Bolzano)
AFRICA – GHG The role of African tropical forests on the Greenhouse Gases balance of the atmosphere
http://www.cmcc.it/projects/africa-ghg-the-role-of-african-tropical-forests-on-the-greenhouse-gases-balance-of-the-atmosphere-2#anchor-partners
ERC FP7-IDEAS-ERC April 2010 March 2014
CMCC through UNITUS - Università degli
Studi della Tuscia
CMCC, through UNITUS - Università degli Studi della Tuscia
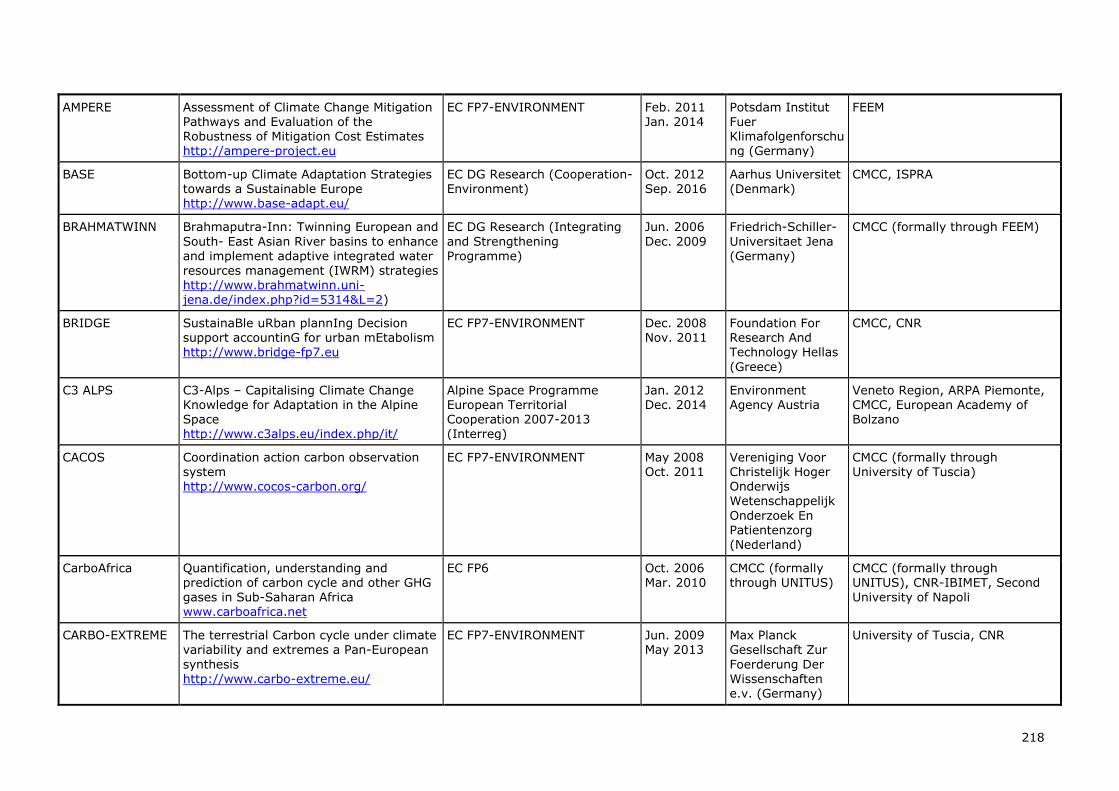
218
AMPERE Assessment of Climate Change Mitigation Pathways and Evaluation of the Robustness of Mitigation Cost Estimates http://ampere-project.eu
EC FP7-ENVIRONMENT Feb. 2011 Jan. 2014
Potsdam Institut Fuer Klimafolgenforschung (Germany)
FEEM
BASE Bottom-up Climate Adaptation Strategies towards a Sustainable Europe http://www.base-adapt.eu/
EC DG Research (Cooperation-Environment)
Oct. 2012 Sep. 2016
Aarhus Universitet (Denmark)
CMCC, ISPRA
BRAHMATWINN Brahmaputra-Inn: Twinning European and
South- East Asian River basins to enhance
and implement adaptive integrated water resources management (IWRM) strategies http://www.brahmatwinn.uni-jena.de/index.php?id=5314&L=2)
EC DG Research (Integrating
and Strengthening
Programme)
Jun. 2006
Dec. 2009
Friedrich-Schiller-
Universitaet Jena
(Germany)
CMCC (formally through FEEM)
BRIDGE SustainaBle uRban plannIng Decision support accountinG for urban mEtabolism http://www.bridge-fp7.eu
EC FP7-ENVIRONMENT Dec. 2008 Nov. 2011
Foundation For Research And Technology Hellas
(Greece)
CMCC, CNR
C3 ALPS C3-Alps – Capitalising Climate Change Knowledge for Adaptation in the Alpine Space
http://www.c3alps.eu/index.php/it/
Alpine Space Programme European Territorial Cooperation 2007-2013
(Interreg)
Jan. 2012 Dec. 2014
Environment Agency Austria
Veneto Region, ARPA Piemonte, CMCC, European Academy of Bolzano
CACOS Coordination action carbon observation system http://www.cocos-carbon.org/
EC FP7-ENVIRONMENT May 2008 Oct. 2011
Vereniging Voor Christelijk Hoger Onderwijs Wetenschappelijk
Onderzoek En Patientenzorg (Nederland)
CMCC (formally through University of Tuscia)
CarboAfrica Quantification, understanding and prediction of carbon cycle and other GHG
gases in Sub-Saharan Africa www.carboafrica.net
EC FP6 Oct. 2006 Mar. 2010
CMCC (formally through UNITUS)
CMCC (formally through UNITUS), CNR-IBIMET, Second
University of Napoli
CARBO-EXTREME The terrestrial Carbon cycle under climate variability and extremes a Pan-European
synthesis http://www.carbo-extreme.eu/
EC FP7-ENVIRONMENT Jun. 2009 May 2013
Max Planck Gesellschaft Zur
Foerderung Der Wissenschaften e.v. (Germany)
University of Tuscia, CNR
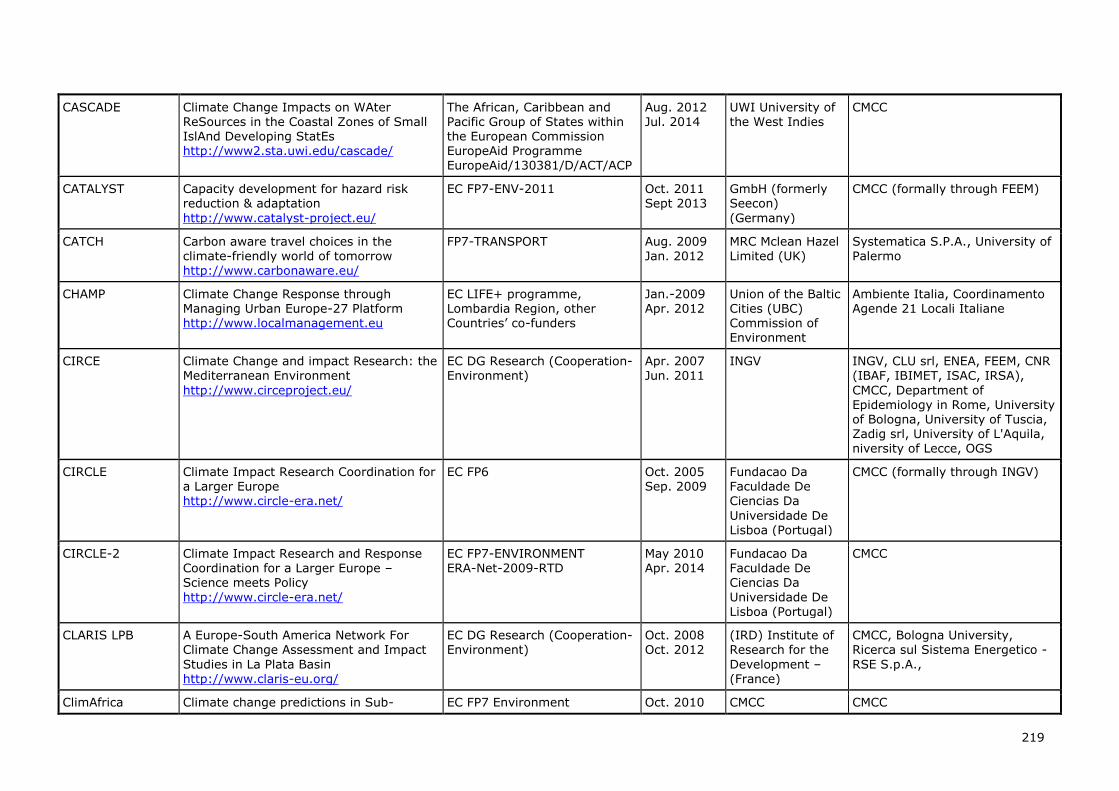
219
CASCADE Climate Change Impacts on WAter ReSources in the Coastal Zones of Small IslAnd Developing StatEs http://www2.sta.uwi.edu/cascade/
The African, Caribbean and Pacific Group of States within the European Commission EuropeAid Programme EuropeAid/130381/D/ACT/ACP
Aug. 2012 Jul. 2014
UWI University of the West Indies
CMCC
CATALYST Capacity development for hazard risk reduction & adaptation
http://www.catalyst-project.eu/
EC FP7-ENV-2011 Oct. 2011 Sept 2013
GmbH (formerly Seecon)
(Germany)
CMCC (formally through FEEM)
CATCH Carbon aware travel choices in the
climate-friendly world of tomorrow http://www.carbonaware.eu/
FP7-TRANSPORT Aug. 2009
Jan. 2012
MRC Mclean Hazel
Limited (UK)
Systematica S.P.A., University of
Palermo
CHAMP Climate Change Response through Managing Urban Europe-27 Platform http://www.localmanagement.eu
EC LIFE+ programme, Lombardia Region, other Countries’ co-funders
Jan.-2009 Apr. 2012
Union of the Baltic Cities (UBC) Commission of Environment
Ambiente Italia, Coordinamento Agende 21 Locali Italiane
CIRCE Climate Change and impact Research: the Mediterranean Environment
http://www.circeproject.eu/
EC DG Research (Cooperation-Environment)
Apr. 2007 Jun. 2011
INGV INGV, CLU srl, ENEA, FEEM, CNR (IBAF, IBIMET, ISAC, IRSA),
CMCC, Department of Epidemiology in Rome, University of Bologna, University of Tuscia,
Zadig srl, University of L'Aquila, niversity of Lecce, OGS
CIRCLE Climate Impact Research Coordination for a Larger Europe http://www.circle-era.net/
EC FP6 Oct. 2005 Sep. 2009
Fundacao Da Faculdade De Ciencias Da
Universidade De Lisboa (Portugal)
CMCC (formally through INGV)
CIRCLE-2 Climate Impact Research and Response Coordination for a Larger Europe – Science meets Policy
http://www.circle-era.net/
EC FP7-ENVIRONMENT ERA-Net-2009-RTD
May 2010 Apr. 2014
Fundacao Da Faculdade De Ciencias Da
Universidade De Lisboa (Portugal)
CMCC
CLARIS LPB A Europe-South America Network For Climate Change Assessment and Impact
Studies in La Plata Basin http://www.claris-eu.org/
EC DG Research (Cooperation-Environment)
Oct. 2008 Oct. 2012
(IRD) Institute of Research for the
Development – (France)
CMCC, Bologna University, Ricerca sul Sistema Energetico -
RSE S.p.A.,
ClimAfrica Climate change predictions in Sub- EC FP7 Environment Oct. 2010 CMCC CMCC
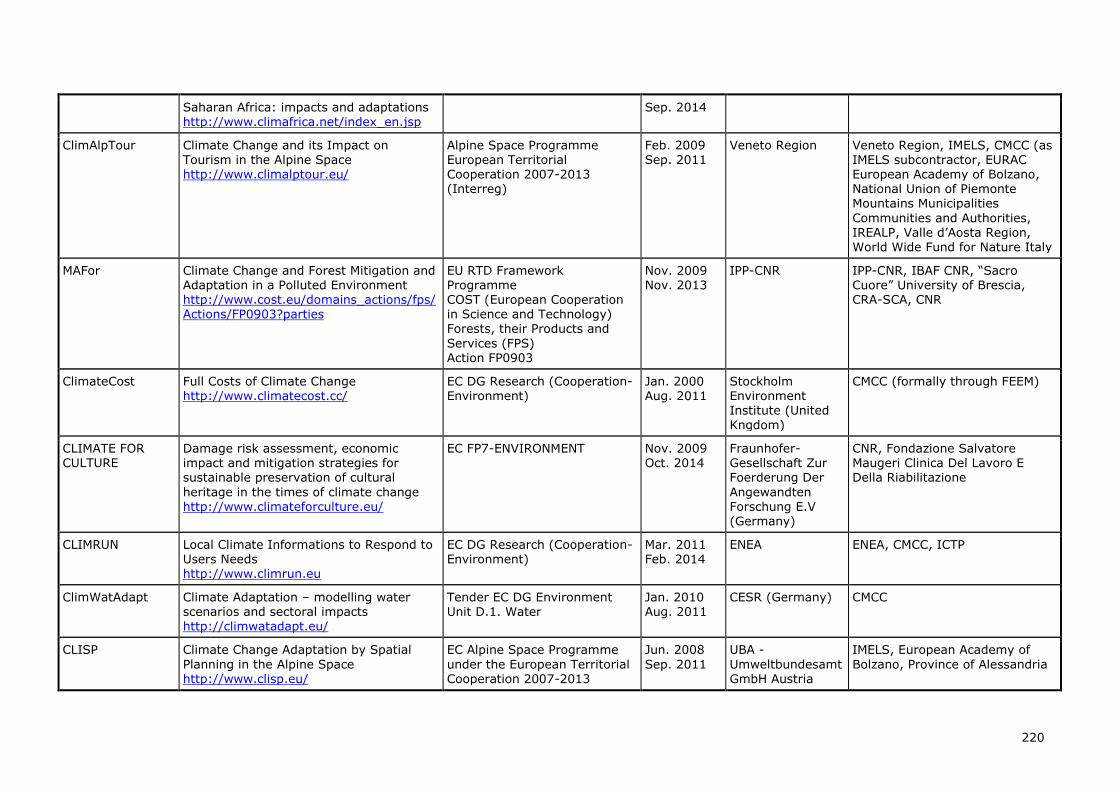
220
Saharan Africa: impacts and adaptations http://www.climafrica.net/index_en.jsp
Sep. 2014
ClimAlpTour Climate Change and its Impact on Tourism in the Alpine Space http://www.climalptour.eu/
Alpine Space Programme European Territorial Cooperation 2007-2013 (Interreg)
Feb. 2009 Sep. 2011
Veneto Region Veneto Region, IMELS, CMCC (as IMELS subcontractor, EURAC European Academy of Bolzano, National Union of Piemonte Mountains Municipalities
Communities and Authorities, IREALP, Valle d’Aosta Region, World Wide Fund for Nature Italy
MAFor Climate Change and Forest Mitigation and Adaptation in a Polluted Environment http://www.cost.eu/domains_actions/fps/Actions/FP0903?parties
EU RTD Framework Programme COST (European Cooperation in Science and Technology) Forests, their Products and
Services (FPS) Action FP0903
Nov. 2009 Nov. 2013
IPP-CNR IPP-CNR, IBAF CNR, “Sacro Cuore” University of Brescia, CRA-SCA, CNR
ClimateCost Full Costs of Climate Change http://www.climatecost.cc/
EC DG Research (Cooperation-Environment)
Jan. 2000 Aug. 2011
Stockholm Environment Institute (United
Kngdom)
CMCC (formally through FEEM)
CLIMATE FOR CULTURE
Damage risk assessment, economic impact and mitigation strategies for sustainable preservation of cultural
heritage in the times of climate change http://www.climateforculture.eu/
EC FP7-ENVIRONMENT Nov. 2009 Oct. 2014
Fraunhofer-Gesellschaft Zur Foerderung Der
Angewandten Forschung E.V (Germany)
CNR, Fondazione Salvatore Maugeri Clinica Del Lavoro E Della Riabilitazione
CLIMRUN Local Climate Informations to Respond to Users Needs http://www.climrun.eu
EC DG Research (Cooperation-Environment)
Mar. 2011 Feb. 2014
ENEA ENEA, CMCC, ICTP
ClimWatAdapt Climate Adaptation – modelling water scenarios and sectoral impacts http://climwatadapt.eu/
Tender EC DG Environment Unit D.1. Water
Jan. 2010 Aug. 2011
CESR (Germany) CMCC
CLISP Climate Change Adaptation by Spatial
Planning in the Alpine Space http://www.clisp.eu/
EC Alpine Space Programme
under the European Territorial Cooperation 2007-2013
Jun. 2008
Sep. 2011
UBA -
Umweltbundesamt GmbH Austria
IMELS, European Academy of
Bolzano, Province of Alessandria

221
CLUVA Climate change and Urban Vulnerability in Africa http://www.cluva.eu/
EC EC DG Research (Cooperation-Environment)
Dec. 2010 Nov. 2013
AMRA Analysis and Monitoring of Environmental Risk Scarl
AMRA Scarl, CMCC
CO2CARE CO2 Site Closure Assessment Research http://www.co2care.org/
EC FP7-ENERGY Jan. 2011 Dec. 2013
Helmholtz-Zentrum Potsdam Deutsches Geoforschungszent
rum (Germany)
OGS
COASTANCE regional COmmon Action STrategy Against Coastal Erosion and climate change effects for a sustainable coastal planning in the Mediterranean basin www.coastance.eu
EC ERDF European Territorial Cooperation 2007-2013
Apr. 2009 Mar. 2012
Region of East Macedonia & Thrace (Greece)
Lazio Region, Emilia-Romagna Region
COMBINE Comprehensive Modelling of the Earth system for better climate prediction and projection
http://www.combine-project.eu/
EC DG Research (Cooperation-Environment)
May 2009 Oct. 2013
Max Planck Gesellschaft Zur Foerderung Der
Wissenschaften E.V. (Germany)
CMCC
CPO Climate Policy Outreach
http://www.cmcc.it/projects/cpo-climate-policy-outreach-2
EuropeAid/127819/C/SER/Multi Jan. 2010
Dec. 2012
CMCC CMCC
DEMOCLOCK Demonstration of a cost effective medium size Chemical Looping Combustion through packed beds using solid hydrocarbons as fuel for power production
with CO2 capture http://www.sintef.no/Projectweb/DemoClock/
EC FP7-ENERGY Jun. 2011 May 2015
Stiftelsen Sintef (Norway)
Milano Polytechnic, Foster Wheeler Italiana SRL
DEMOCRITOS DEveloping the MObility CRedits
Integrated platform enabling travellers to improve urban TranspOrt Sustainability http://democritos.ipacv.ro/
EC FP7-TRANSPORT Oct. 2009
Sep. 2011
Genova
Municipality
Genova Municipality, TRT
Trasporti e Territorio Srl, QUAERYON SRL
DRR MAURITIUS Development of an Inundation, Flooding & Landslide National Risk Profile, Maps,
Strategy Framework and Action Plans for Disaster Risk Management in the Republic
UNDP Africa Adaptation Program (AAP) & Ministry of
Environment & Sustainable Development of Mauritius
Mar. 2012 Sep. 2012
UNDP - African Adaptation
Program (AAP) and Ministry of
CMCC, SGI - Studio Galli Ingegneria SpA
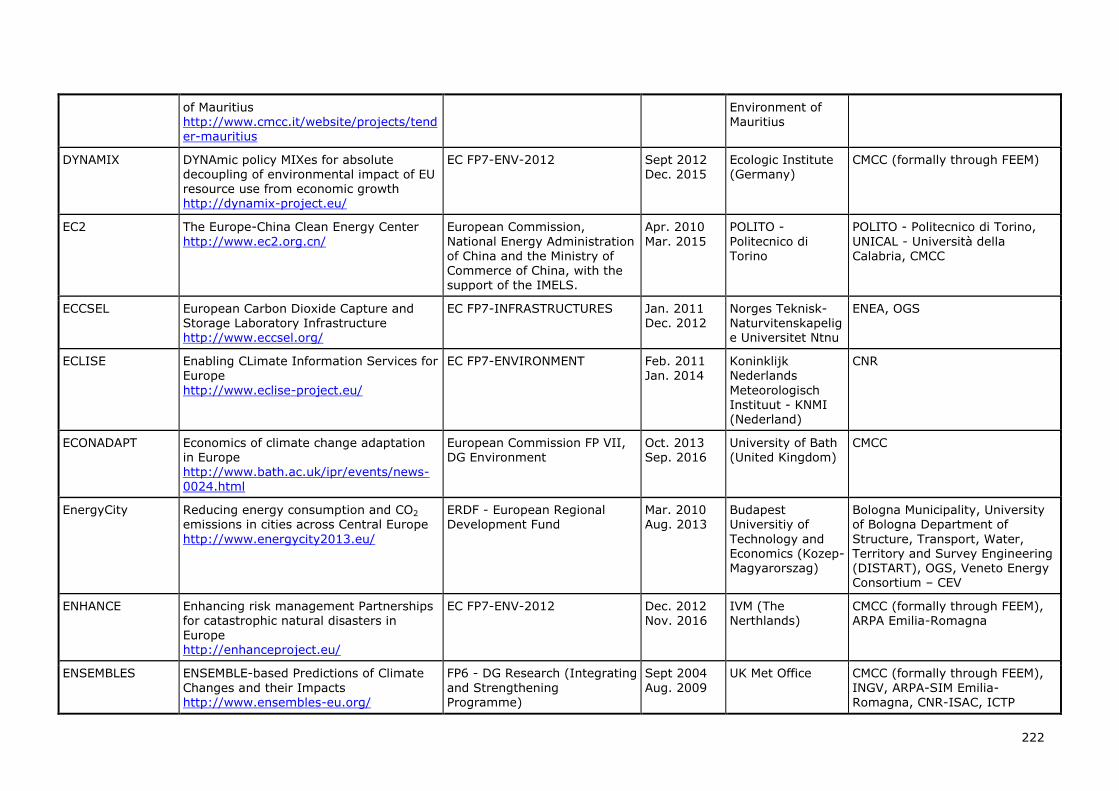
222
of Mauritius http://www.cmcc.it/website/projects/tender-mauritius
Environment of Mauritius
DYNAMIX DYNAmic policy MIXes for absolute decoupling of environmental impact of EU resource use from economic growth http://dynamix-project.eu/
EC FP7-ENV-2012 Sept 2012 Dec. 2015
Ecologic Institute (Germany)
CMCC (formally through FEEM)
EC2 The Europe-China Clean Energy Center
http://www.ec2.org.cn/
European Commission,
National Energy Administration
of China and the Ministry of Commerce of China, with the support of the IMELS.
Apr. 2010
Mar. 2015
POLITO -
Politecnico di
Torino
POLITO - Politecnico di Torino,
UNICAL - Università della
Calabria, CMCC
ECCSEL European Carbon Dioxide Capture and Storage Laboratory Infrastructure http://www.eccsel.org/
EC FP7-INFRASTRUCTURES Jan. 2011 Dec. 2012
Norges Teknisk-Naturvitenskapelige Universitet Ntnu
ENEA, OGS
ECLISE Enabling CLimate Information Services for Europe
http://www.eclise-project.eu/
EC FP7-ENVIRONMENT Feb. 2011 Jan. 2014
Koninklijk Nederlands
Meteorologisch Instituut - KNMI (Nederland)
CNR
ECONADAPT Economics of climate change adaptation in Europe http://www.bath.ac.uk/ipr/events/news-0024.html
European Commission FP VII, DG Environment
Oct. 2013 Sep. 2016
University of Bath (United Kingdom)
CMCC
EnergyCity Reducing energy consumption and CO2 emissions in cities across Central Europe
http://www.energycity2013.eu/
ERDF - European Regional Development Fund
Mar. 2010 Aug. 2013
Budapest Universitiy of
Technology and Economics (Kozep-Magyarorszag)
Bologna Municipality, University of Bologna Department of
Structure, Transport, Water, Territory and Survey Engineering (DISTART), OGS, Veneto Energy Consortium – CEV
ENHANCE Enhancing risk management Partnerships for catastrophic natural disasters in Europe http://enhanceproject.eu/
EC FP7-ENV-2012 Dec. 2012 Nov. 2016
IVM (The Nerthlands)
CMCC (formally through FEEM), ARPA Emilia-Romagna
ENSEMBLES ENSEMBLE-based Predictions of Climate
Changes and their Impacts http://www.ensembles-eu.org/
FP6 - DG Research (Integrating
and Strengthening Programme)
Sept 2004
Aug. 2009
UK Met Office CMCC (formally through FEEM),
INGV, ARPA-SIM Emilia-Romagna, CNR-ISAC, ICTP
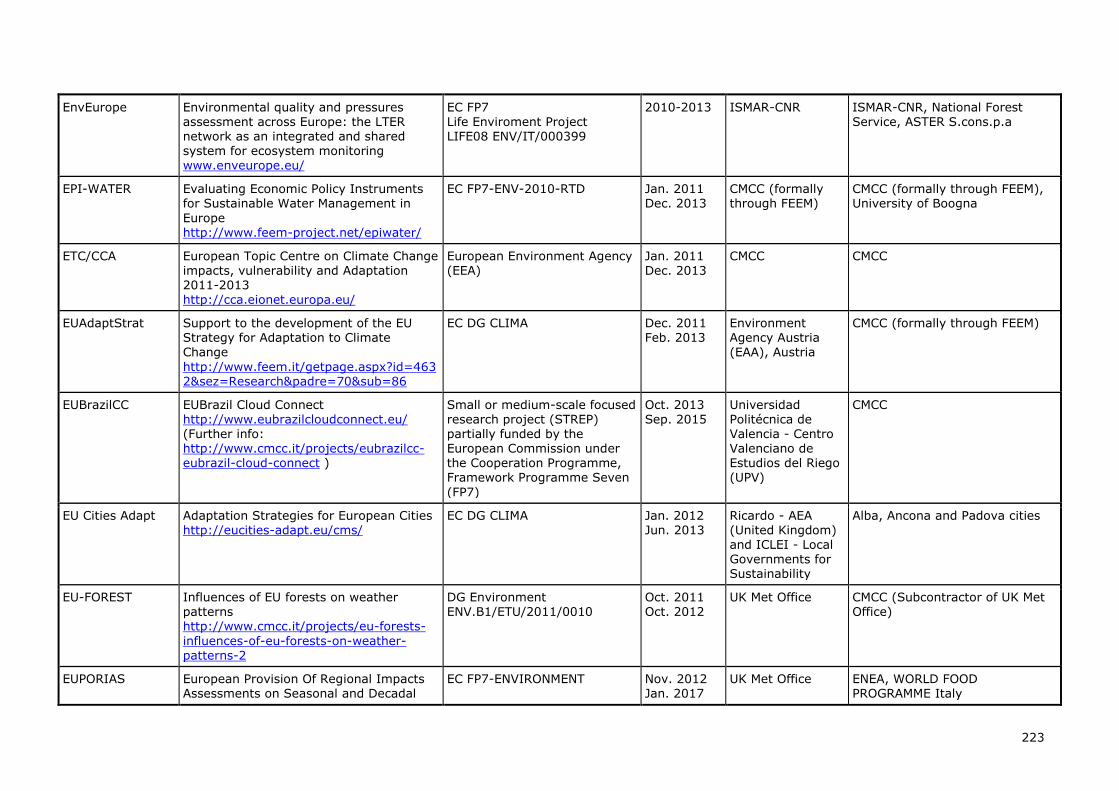
223
EnvEurope Environmental quality and pressures assessment across Europe: the LTER network as an integrated and shared system for ecosystem monitoring www.enveurope.eu/
EC FP7 Life Enviroment Project LIFE08 ENV/IT/000399
2010-2013 ISMAR-CNR ISMAR-CNR, National Forest Service, ASTER S.cons.p.a
EPI-WATER Evaluating Economic Policy Instruments for Sustainable Water Management in
Europe http://www.feem-project.net/epiwater/
EC FP7-ENV-2010-RTD Jan. 2011 Dec. 2013
CMCC (formally through FEEM)
CMCC (formally through FEEM), University of Boogna
ETC/CCA European Topic Centre on Climate Change impacts, vulnerability and Adaptation 2011-2013 http://cca.eionet.europa.eu/
European Environment Agency (EEA)
Jan. 2011 Dec. 2013
CMCC CMCC
EUAdaptStrat Support to the development of the EU Strategy for Adaptation to Climate Change
http://www.feem.it/getpage.aspx?id=4632&sez=Research&padre=70&sub=86
EC DG CLIMA Dec. 2011 Feb. 2013
Environment Agency Austria (EAA), Austria
CMCC (formally through FEEM)
EUBrazilCC EUBrazil Cloud Connect http://www.eubrazilcloudconnect.eu/
(Further info: http://www.cmcc.it/projects/eubrazilcc-eubrazil-cloud-connect )
Small or medium-scale focused research project (STREP)
partially funded by the European Commission under the Cooperation Programme, Framework Programme Seven
(FP7)
Oct. 2013 Sep. 2015
Universidad Politécnica de
Valencia - Centro Valenciano de Estudios del Riego (UPV)
CMCC
EU Cities Adapt Adaptation Strategies for European Cities http://eucities-adapt.eu/cms/
EC DG CLIMA Jan. 2012 Jun. 2013
Ricardo - AEA (United Kingdom) and ICLEI - Local Governments for Sustainability
Alba, Ancona and Padova cities
EU-FOREST Influences of EU forests on weather patterns http://www.cmcc.it/projects/eu-forests-
influences-of-eu-forests-on-weather-patterns-2
DG Environment ENV.B1/ETU/2011/0010
Oct. 2011 Oct. 2012
UK Met Office CMCC (Subcontractor of UK Met Office)
EUPORIAS European Provision Of Regional Impacts Assessments on Seasonal and Decadal
EC FP7-ENVIRONMENT Nov. 2012 Jan. 2017
UK Met Office ENEA, WORLD FOOD PROGRAMME Italy
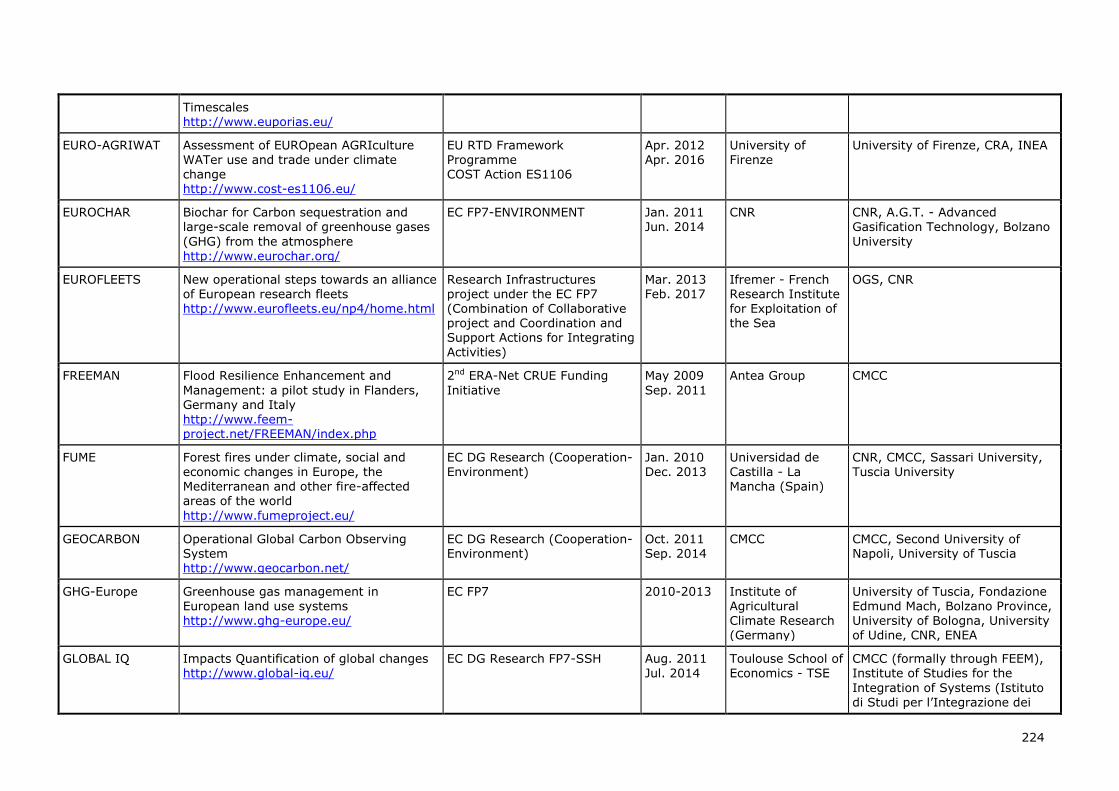
224
Timescales http://www.euporias.eu/
EURO-AGRIWAT Assessment of EUROpean AGRIculture WATer use and trade under climate change http://www.cost-es1106.eu/
EU RTD Framework Programme COST Action ES1106
Apr. 2012 Apr. 2016
University of Firenze
University of Firenze, CRA, INEA
EUROCHAR Biochar for Carbon sequestration and large-scale removal of greenhouse gases
(GHG) from the atmosphere
http://www.eurochar.org/
EC FP7-ENVIRONMENT Jan. 2011 Jun. 2014
CNR CNR, A.G.T. - Advanced Gasification Technology, Bolzano
University
EUROFLEETS New operational steps towards an alliance of European research fleets http://www.eurofleets.eu/np4/home.html
Research Infrastructures project under the EC FP7 (Combination of Collaborative project and Coordination and Support Actions for Integrating Activities)
Mar. 2013 Feb. 2017
Ifremer - French Research Institute for Exploitation of the Sea
OGS, CNR
FREEMAN Flood Resilience Enhancement and
Management: a pilot study in Flanders, Germany and Italy http://www.feem-
project.net/FREEMAN/index.php
2nd ERA-Net CRUE Funding
Initiative
May 2009
Sep. 2011
Antea Group CMCC
FUME Forest fires under climate, social and economic changes in Europe, the Mediterranean and other fire-affected areas of the world
http://www.fumeproject.eu/
EC DG Research (Cooperation-Environment)
Jan. 2010 Dec. 2013
Universidad de Castilla - La Mancha (Spain)
CNR, CMCC, Sassari University, Tuscia University
GEOCARBON Operational Global Carbon Observing System http://www.geocarbon.net/
EC DG Research (Cooperation-Environment)
Oct. 2011 Sep. 2014
CMCC CMCC, Second University of Napoli, University of Tuscia
GHG-Europe Greenhouse gas management in
European land use systems http://www.ghg-europe.eu/
EC FP7 2010-2013 Institute of
Agricultural Climate Research (Germany)
University of Tuscia, Fondazione
Edmund Mach, Bolzano Province, University of Bologna, University of Udine, CNR, ENEA
GLOBAL IQ Impacts Quantification of global changes http://www.global-iq.eu/
EC DG Research FP7-SSH Aug. 2011 Jul. 2014
Toulouse School of Economics - TSE
CMCC (formally through FEEM), Institute of Studies for the
Integration of Systems (Istituto di Studi per l’Integrazione dei
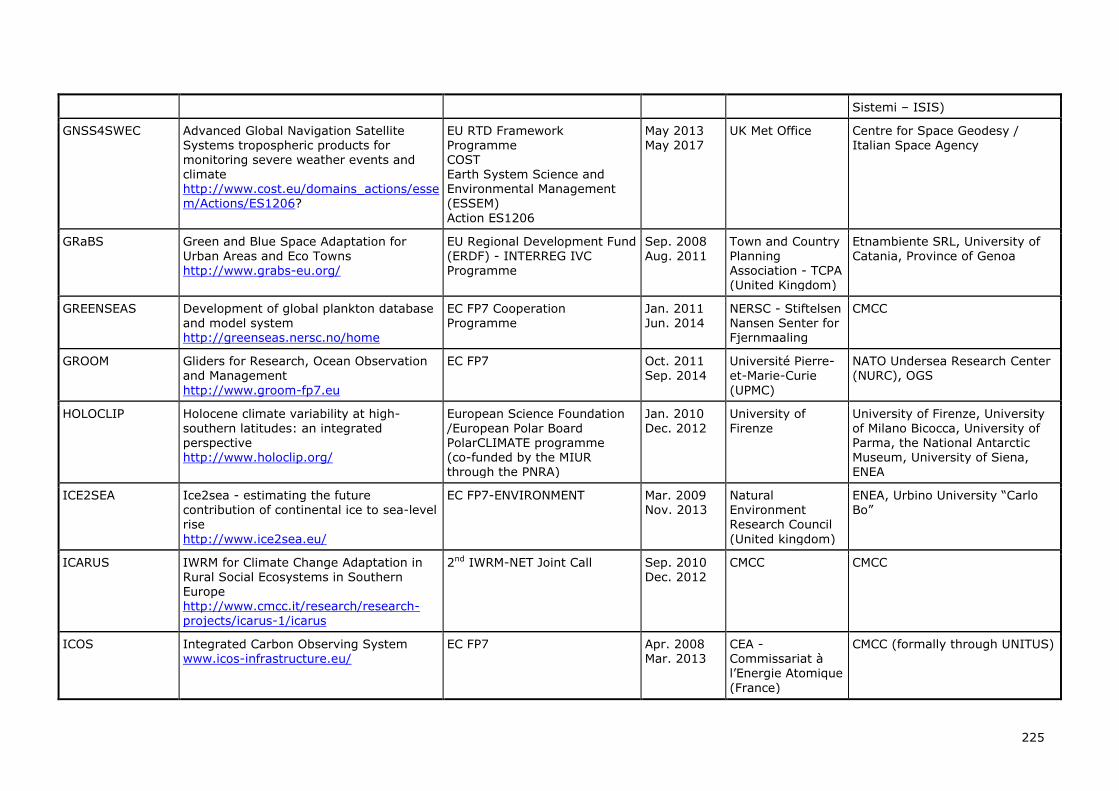
225
Sistemi – ISIS)
GNSS4SWEC Advanced Global Navigation Satellite Systems tropospheric products for monitoring severe weather events and climate http://www.cost.eu/domains_actions/essem/Actions/ES1206?
EU RTD Framework Programme COST Earth System Science and Environmental Management (ESSEM)
Action ES1206
May 2013 May 2017
UK Met Office Centre for Space Geodesy / Italian Space Agency
GRaBS Green and Blue Space Adaptation for
Urban Areas and Eco Towns http://www.grabs-eu.org/
EU Regional Development Fund
(ERDF) - INTERREG IVC Programme
Sep. 2008
Aug. 2011
Town and Country
Planning Association - TCPA (United Kingdom)
Etnambiente SRL, University of
Catania, Province of Genoa
GREENSEAS Development of global plankton database and model system http://greenseas.nersc.no/home
EC FP7 Cooperation Programme
Jan. 2011 Jun. 2014
NERSC - Stiftelsen Nansen Senter for Fjernmaaling
CMCC
GROOM Gliders for Research, Ocean Observation and Management
http://www.groom-fp7.eu
EC FP7 Oct. 2011 Sep. 2014
Université Pierre-et-Marie-Curie
(UPMC)
NATO Undersea Research Center (NURC), OGS
HOLOCLIP Holocene climate variability at high-
southern latitudes: an integrated perspective http://www.holoclip.org/
European Science Foundation
/European Polar Board PolarCLIMATE programme (co-funded by the MIUR through the PNRA)
Jan. 2010
Dec. 2012
University of
Firenze
University of Firenze, University
of Milano Bicocca, University of Parma, the National Antarctic Museum, University of Siena, ENEA
ICE2SEA Ice2sea - estimating the future contribution of continental ice to sea-level rise
http://www.ice2sea.eu/
EC FP7-ENVIRONMENT Mar. 2009 Nov. 2013
Natural Environment Research Council
(United kingdom)
ENEA, Urbino University “Carlo Bo”
ICARUS IWRM for Climate Change Adaptation in Rural Social Ecosystems in Southern Europe
http://www.cmcc.it/research/research-projects/icarus-1/icarus
2nd IWRM-NET Joint Call Sep. 2010 Dec. 2012
CMCC CMCC
ICOS Integrated Carbon Observing System www.icos-infrastructure.eu/
EC FP7 Apr. 2008 Mar. 2013
CEA - Commissariat à l’Energie Atomique
(France)
CMCC (formally through UNITUS)
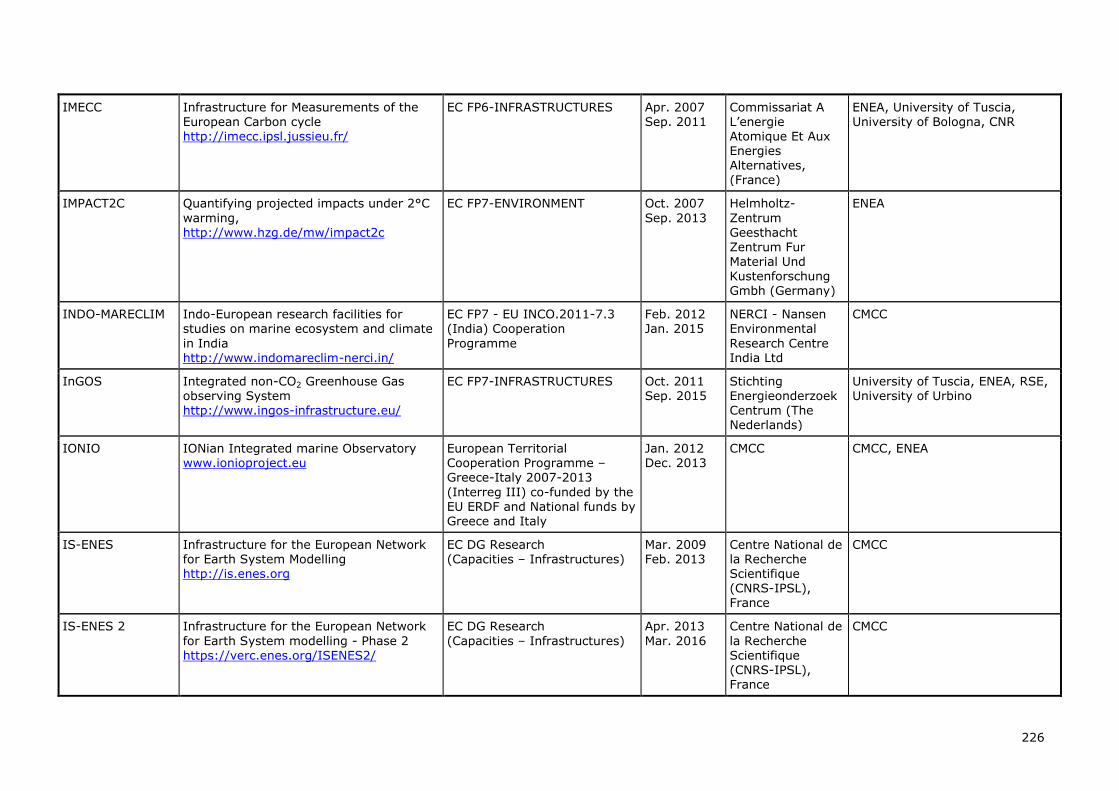
226
IMECC Infrastructure for Measurements of the European Carbon cycle http://imecc.ipsl.jussieu.fr/
EC FP6-INFRASTRUCTURES Apr. 2007 Sep. 2011
Commissariat A L’energie Atomique Et Aux Energies Alternatives, (France)
ENEA, University of Tuscia, University of Bologna, CNR
IMPACT2C Quantifying projected impacts under 2°C
warming, http://www.hzg.de/mw/impact2c
EC FP7-ENVIRONMENT Oct. 2007
Sep. 2013
Helmholtz-
Zentrum Geesthacht Zentrum Fur
Material Und Kustenforschung Gmbh (Germany)
ENEA
INDO-MARECLIM Indo-European research facilities for studies on marine ecosystem and climate
in India http://www.indomareclim-nerci.in/
EC FP7 - EU INCO.2011-7.3 (India) Cooperation
Programme
Feb. 2012 Jan. 2015
NERCI - Nansen Environmental
Research Centre India Ltd
CMCC
InGOS Integrated non-CO2 Greenhouse Gas observing System http://www.ingos-infrastructure.eu/
EC FP7-INFRASTRUCTURES Oct. 2011 Sep. 2015
Stichting Energieonderzoek Centrum (The
Nederlands)
University of Tuscia, ENEA, RSE, University of Urbino
IONIO IONian Integrated marine Observatory www.ionioproject.eu
European Territorial Cooperation Programme – Greece-Italy 2007-2013
(Interreg III) co-funded by the EU ERDF and National funds by Greece and Italy
Jan. 2012 Dec. 2013
CMCC CMCC, ENEA
IS-ENES Infrastructure for the European Network for Earth System Modelling http://is.enes.org
EC DG Research (Capacities – Infrastructures)
Mar. 2009 Feb. 2013
Centre National de la Recherche Scientifique (CNRS-IPSL),
France
CMCC
IS-ENES 2 Infrastructure for the European Network
for Earth System modelling - Phase 2 https://verc.enes.org/ISENES2/
EC DG Research
(Capacities – Infrastructures)
Apr. 2013
Mar. 2016
Centre National de
la Recherche Scientifique (CNRS-IPSL), France
CMCC
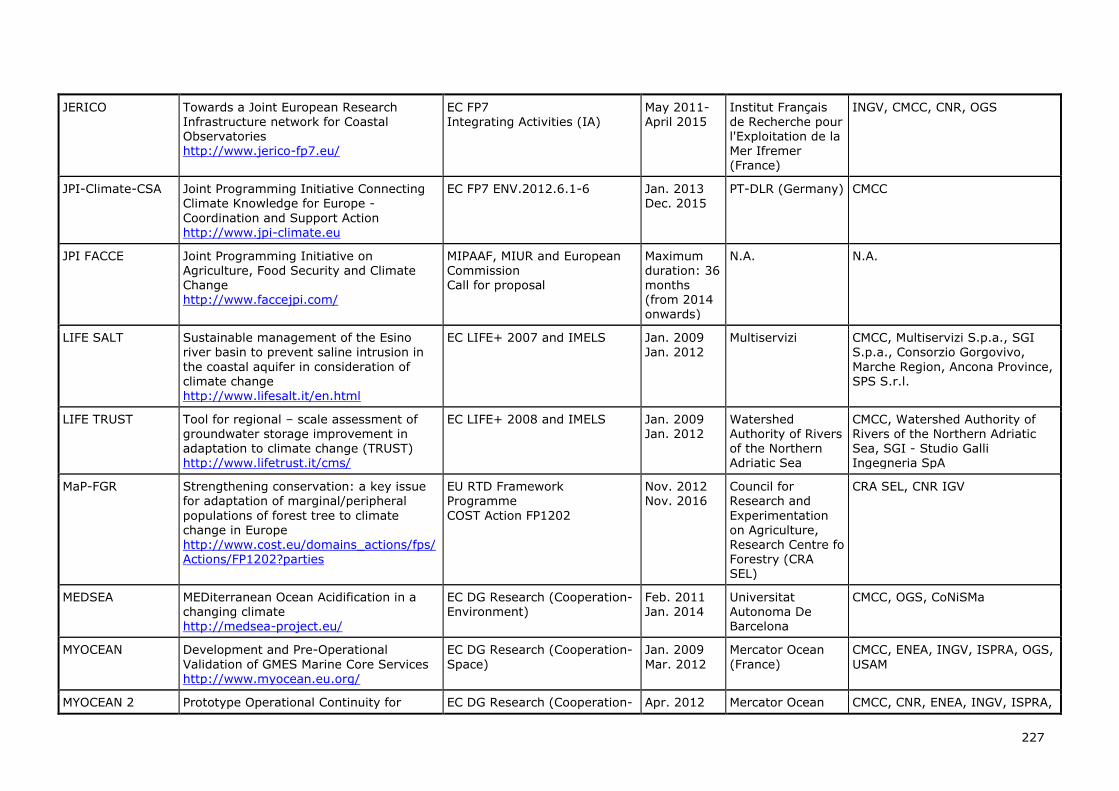
227
JERICO Towards a Joint European Research Infrastructure network for Coastal Observatories http://www.jerico-fp7.eu/
EC FP7 Integrating Activities (IA)
May 2011-April 2015
Institut Français de Recherche pour l'Exploitation de la Mer Ifremer (France)
INGV, CMCC, CNR, OGS
JPI-Climate-CSA Joint Programming Initiative Connecting Climate Knowledge for Europe -
Coordination and Support Action http://www.jpi-climate.eu
EC FP7 ENV.2012.6.1-6 Jan. 2013 Dec. 2015
PT-DLR (Germany) CMCC
JPI FACCE Joint Programming Initiative on Agriculture, Food Security and Climate Change http://www.faccejpi.com/
MIPAAF, MIUR and European Commission Call for proposal
Maximum duration: 36 months (from 2014 onwards)
N.A. N.A.
LIFE SALT Sustainable management of the Esino river basin to prevent saline intrusion in
the coastal aquifer in consideration of climate change http://www.lifesalt.it/en.html
EC LIFE+ 2007 and IMELS Jan. 2009 Jan. 2012
Multiservizi CMCC, Multiservizi S.p.a., SGI S.p.a., Consorzio Gorgovivo,
Marche Region, Ancona Province, SPS S.r.l.
LIFE TRUST Tool for regional – scale assessment of
groundwater storage improvement in adaptation to climate change (TRUST) http://www.lifetrust.it/cms/
EC LIFE+ 2008 and IMELS Jan. 2009
Jan. 2012
Watershed
Authority of Rivers of the Northern Adriatic Sea
CMCC, Watershed Authority of
Rivers of the Northern Adriatic Sea, SGI - Studio Galli Ingegneria SpA
MaP-FGR Strengthening conservation: a key issue for adaptation of marginal/peripheral
populations of forest tree to climate change in Europe http://www.cost.eu/domains_actions/fps/Actions/FP1202?parties
EU RTD Framework Programme
COST Action FP1202
Nov. 2012 Nov. 2016
Council for Research and
Experimentation on Agriculture, Research Centre fo Forestry (CRA SEL)
CRA SEL, CNR IGV
MEDSEA MEDiterranean Ocean Acidification in a changing climate http://medsea-project.eu/
EC DG Research (Cooperation-Environment)
Feb. 2011 Jan. 2014
Universitat Autonoma De Barcelona
CMCC, OGS, CoNiSMa
MYOCEAN Development and Pre-Operational
Validation of GMES Marine Core Services http://www.myocean.eu.org/
EC DG Research (Cooperation-
Space)
Jan. 2009
Mar. 2012
Mercator Ocean
(France)
CMCC, ENEA, INGV, ISPRA, OGS,
USAM
MYOCEAN 2 Prototype Operational Continuity for EC DG Research (Cooperation- Apr. 2012 Mercator Ocean CMCC, CNR, ENEA, INGV, ISPRA,
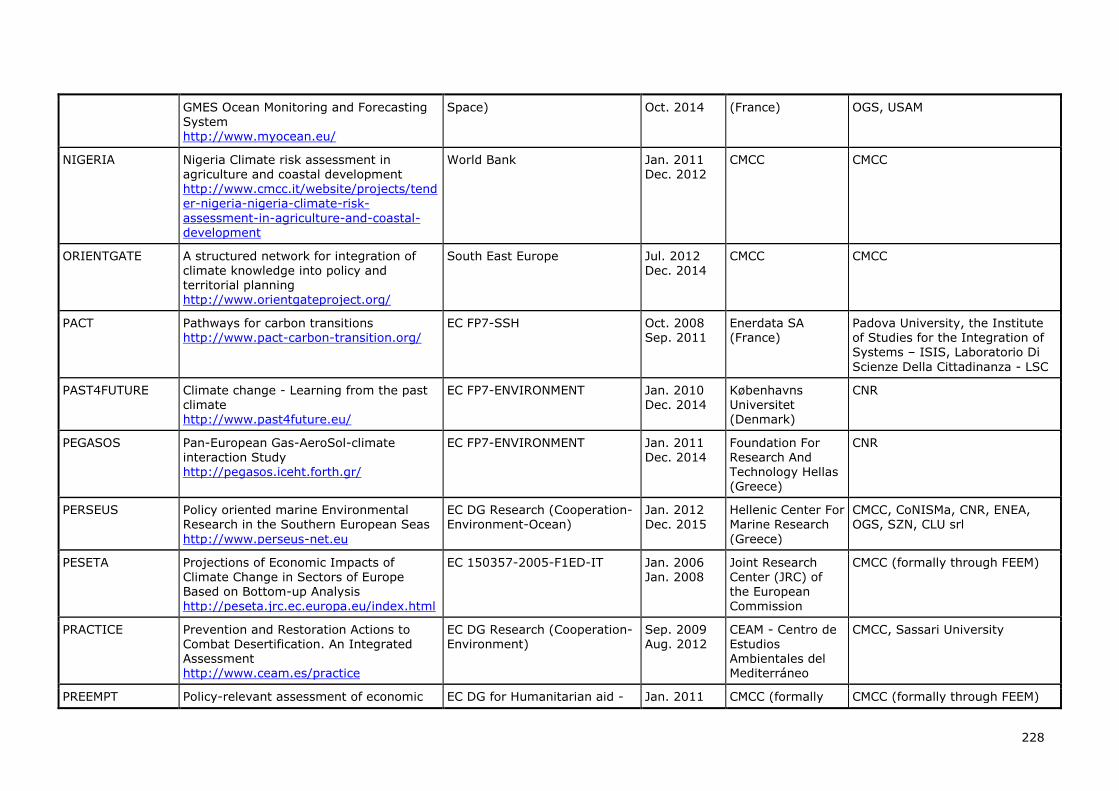
228
GMES Ocean Monitoring and Forecasting System http://www.myocean.eu/
Space) Oct. 2014 (France) OGS, USAM
NIGERIA Nigeria Climate risk assessment in agriculture and coastal development http://www.cmcc.it/website/projects/tender-nigeria-nigeria-climate-risk-
assessment-in-agriculture-and-coastal-development
World Bank Jan. 2011 Dec. 2012
CMCC CMCC
ORIENTGATE A structured network for integration of climate knowledge into policy and territorial planning http://www.orientgateproject.org/
South East Europe Jul. 2012 Dec. 2014
CMCC CMCC
PACT Pathways for carbon transitions http://www.pact-carbon-transition.org/
EC FP7-SSH Oct. 2008 Sep. 2011
Enerdata SA (France)
Padova University, the Institute of Studies for the Integration of Systems – ISIS, Laboratorio Di
Scienze Della Cittadinanza - LSC
PAST4FUTURE Climate change - Learning from the past climate http://www.past4future.eu/
EC FP7-ENVIRONMENT Jan. 2010 Dec. 2014
Københavns Universitet (Denmark)
CNR
PEGASOS Pan-European Gas-AeroSol-climate interaction Study http://pegasos.iceht.forth.gr/
EC FP7-ENVIRONMENT Jan. 2011 Dec. 2014
Foundation For Research And Technology Hellas (Greece)
CNR
PERSEUS Policy oriented marine Environmental Research in the Southern European Seas
http://www.perseus-net.eu
EC DG Research (Cooperation-Environment-Ocean)
Jan. 2012 Dec. 2015
Hellenic Center For Marine Research
(Greece)
CMCC, CoNISMa, CNR, ENEA, OGS, SZN, CLU srl
PESETA Projections of Economic Impacts of Climate Change in Sectors of Europe Based on Bottom-up Analysis
http://peseta.jrc.ec.europa.eu/index.html
EC 150357-2005-F1ED-IT Jan. 2006 Jan. 2008
Joint Research Center (JRC) of the European
Commission
CMCC (formally through FEEM)
PRACTICE Prevention and Restoration Actions to Combat Desertification. An Integrated Assessment http://www.ceam.es/practice
EC DG Research (Cooperation-Environment)
Sep. 2009 Aug. 2012
CEAM - Centro de Estudios Ambientales del Mediterráneo
CMCC, Sassari University
PREEMPT Policy-relevant assessment of economic EC DG for Humanitarian aid - Jan. 2011 CMCC (formally CMCC (formally through FEEM)
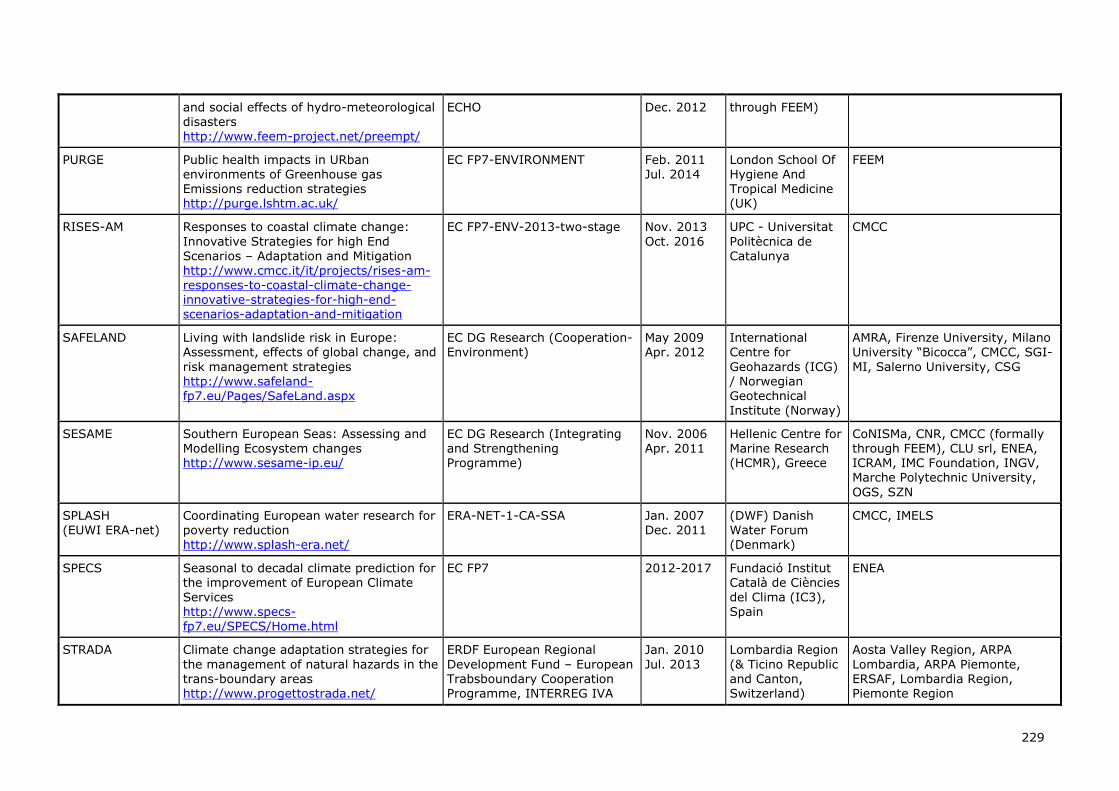
229
and social effects of hydro-meteorological disasters http://www.feem-project.net/preempt/
ECHO Dec. 2012 through FEEM)
PURGE Public health impacts in URban environments of Greenhouse gas Emissions reduction strategies http://purge.lshtm.ac.uk/
EC FP7-ENVIRONMENT Feb. 2011 Jul. 2014
London School Of Hygiene And Tropical Medicine (UK)
FEEM
RISES-AM Responses to coastal climate change:
Innovative Strategies for high End
Scenarios – Adaptation and Mitigation http://www.cmcc.it/it/projects/rises-am-responses-to-coastal-climate-change-innovative-strategies-for-high-end-scenarios-adaptation-and-mitigation
EC FP7-ENV-2013-two-stage Nov. 2013
Oct. 2016
UPC - Universitat
Politècnica de
Catalunya
CMCC
SAFELAND Living with landslide risk in Europe: Assessment, effects of global change, and
risk management strategies http://www.safeland-fp7.eu/Pages/SafeLand.aspx
EC DG Research (Cooperation-Environment)
May 2009 Apr. 2012
International Centre for
Geohazards (ICG) / Norwegian Geotechnical Institute (Norway)
AMRA, Firenze University, Milano University “Bicocca”, CMCC, SGI-
MI, Salerno University, CSG
SESAME Southern European Seas: Assessing and Modelling Ecosystem changes http://www.sesame-ip.eu/
EC DG Research (Integrating and Strengthening Programme)
Nov. 2006 Apr. 2011
Hellenic Centre for Marine Research (HCMR), Greece
CoNISMa, CNR, CMCC (formally through FEEM), CLU srl, ENEA, ICRAM, IMC Foundation, INGV, Marche Polytechnic University,
OGS, SZN
SPLASH (EUWI ERA-net)
Coordinating European water research for poverty reduction http://www.splash-era.net/
ERA-NET-1-CA-SSA Jan. 2007 Dec. 2011
(DWF) Danish Water Forum (Denmark)
CMCC, IMELS
SPECS Seasonal to decadal climate prediction for the improvement of European Climate
Services http://www.specs-fp7.eu/SPECS/Home.html
EC FP7 2012-2017 Fundació Institut Català de Ciències
del Clima (IC3), Spain
ENEA
STRADA Climate change adaptation strategies for
the management of natural hazards in the trans-boundary areas http://www.progettostrada.net/
ERDF European Regional
Development Fund – European Trabsboundary Cooperation Programme, INTERREG IVA
Jan. 2010
Jul. 2013
Lombardia Region
(& Ticino Republic and Canton, Switzerland)
Aosta Valley Region, ARPA
Lombardia, ARPA Piemonte, ERSAF, Lombardia Region, Piemonte Region
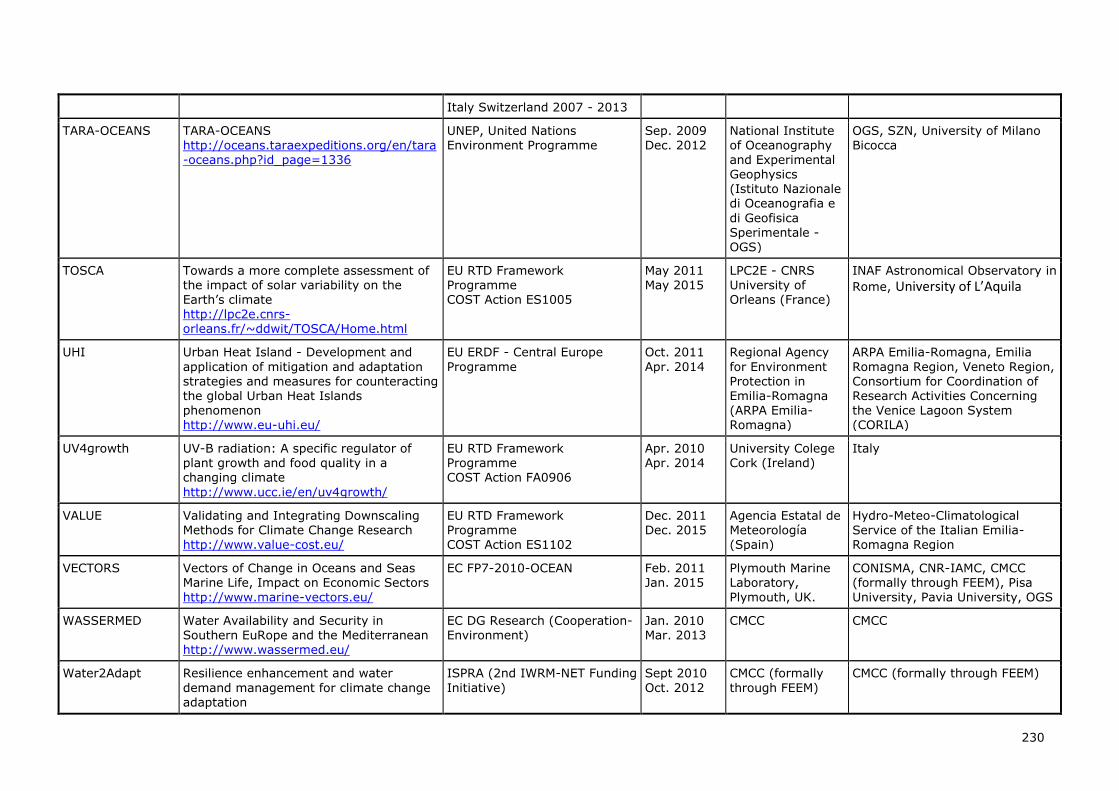
230
Italy Switzerland 2007 - 2013
TARA-OCEANS TARA-OCEANS http://oceans.taraexpeditions.org/en/tara-oceans.php?id_page=1336
UNEP, United Nations Environment Programme
Sep. 2009 Dec. 2012
National Institute of Oceanography and Experimental Geophysics (Istituto Nazionale di Oceanografia e
di Geofisica Sperimentale - OGS)
OGS, SZN, University of Milano Bicocca
TOSCA Towards a more complete assessment of the impact of solar variability on the Earth’s climate http://lpc2e.cnrs-orleans.fr/~ddwit/TOSCA/Home.html
EU RTD Framework Programme COST Action ES1005
May 2011 May 2015
LPC2E - CNRS University of Orleans (France)
INAF Astronomical Observatory in
Rome, University of L’Aquila
UHI Urban Heat Island - Development and
application of mitigation and adaptation strategies and measures for counteracting the global Urban Heat Islands phenomenon
http://www.eu-uhi.eu/
EU ERDF - Central Europe
Programme
Oct. 2011
Apr. 2014
Regional Agency
for Environment Protection in Emilia-Romagna (ARPA Emilia-
Romagna)
ARPA Emilia-Romagna, Emilia
Romagna Region, Veneto Region, Consortium for Coordination of Research Activities Concerning the Venice Lagoon System
(CORILA)
UV4growth UV-B radiation: A specific regulator of plant growth and food quality in a changing climate
http://www.ucc.ie/en/uv4growth/
EU RTD Framework Programme COST Action FA0906
Apr. 2010 Apr. 2014
University Colege Cork (Ireland)
Italy
VALUE Validating and Integrating Downscaling Methods for Climate Change Research http://www.value-cost.eu/
EU RTD Framework Programme COST Action ES1102
Dec. 2011 Dec. 2015
Agencia Estatal de Meteorología (Spain)
Hydro-Meteo-Climatological Service of the Italian Emilia-Romagna Region
VECTORS Vectors of Change in Oceans and Seas Marine Life, Impact on Economic Sectors
http://www.marine-vectors.eu/
EC FP7-2010-OCEAN Feb. 2011 Jan. 2015
Plymouth Marine Laboratory,
Plymouth, UK.
CONISMA, CNR-IAMC, CMCC (formally through FEEM), Pisa
University, Pavia University, OGS
WASSERMED Water Availability and Security in Southern EuRope and the Mediterranean http://www.wassermed.eu/
EC DG Research (Cooperation-Environment)
Jan. 2010 Mar. 2013
CMCC CMCC
Water2Adapt Resilience enhancement and water
demand management for climate change adaptation
ISPRA (2nd IWRM-NET Funding
Initiative)
Sept 2010
Oct. 2012
CMCC (formally
through FEEM)
CMCC (formally through FEEM)
231
http://www.feem-project.net/water2adapt/index.html
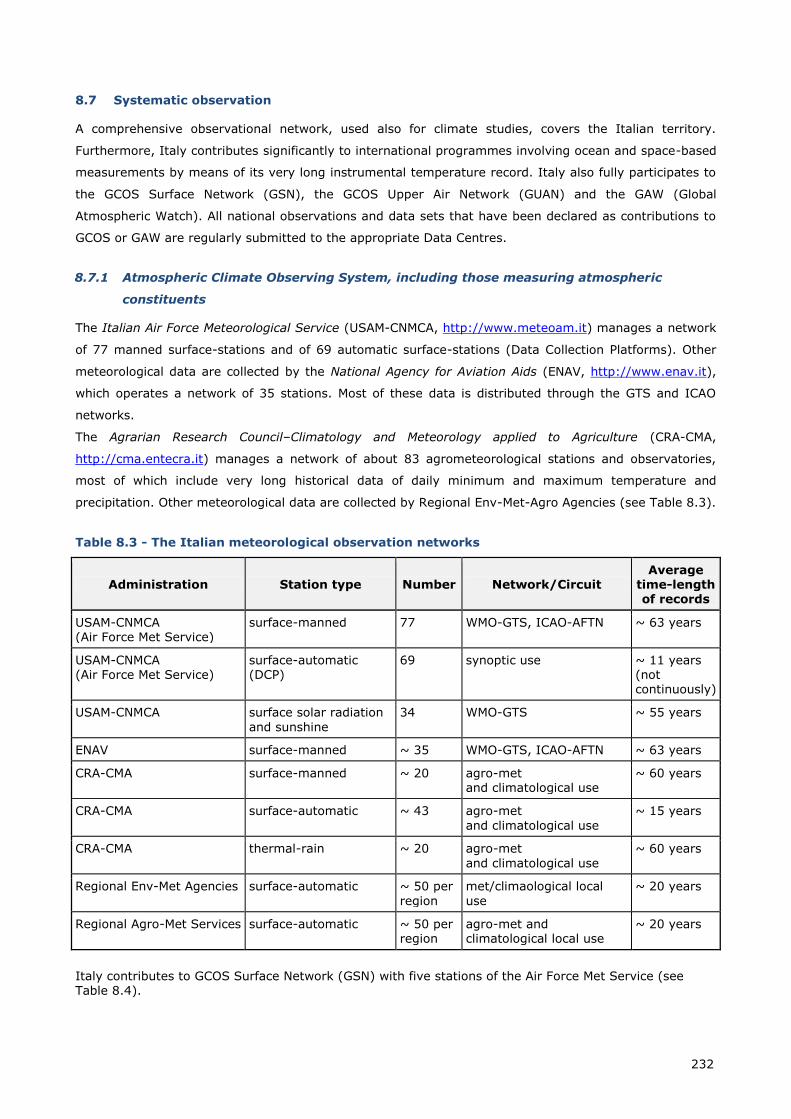
232
8.7 Systematic observation
A comprehensive observational network, used also for climate studies, covers the Italian territory.
Furthermore, Italy contributes significantly to international programmes involving ocean and space-based
measurements by means of its very long instrumental temperature record. Italy also fully participates to
the GCOS Surface Network (GSN), the GCOS Upper Air Network (GUAN) and the GAW (Global
Atmospheric Watch). All national observations and data sets that have been declared as contributions to
GCOS or GAW are regularly submitted to the appropriate Data Centres.
8.7.1 Atmospheric Climate Observing System, including those measuring atmospheric
constituents
The Italian Air Force Meteorological Service (USAM-CNMCA, http://www.meteoam.it) manages a network
of 77 manned surface-stations and of 69 automatic surface-stations (Data Collection Platforms). Other
meteorological data are collected by the National Agency for Aviation Aids (ENAV, http://www.enav.it),
which operates a network of 35 stations. Most of these data is distributed through the GTS and ICAO
networks.
The Agrarian Research Council–Climatology and Meteorology applied to Agriculture (CRA-CMA,
http://cma.entecra.it) manages a network of about 83 agrometeorological stations and observatories,
most of which include very long historical data of daily minimum and maximum temperature and
precipitation. Other meteorological data are collected by Regional Env-Met-Agro Agencies (see Table 8.3).
Table 8.3 - The Italian meteorological observation networks
Administration Station type Number Network/Circuit Average
time-length of records
USAM-CNMCA (Air Force Met Service)
surface-manned 77 WMO-GTS, ICAO-AFTN ~ 63 years
USAM-CNMCA (Air Force Met Service)
surface-automatic (DCP)
69 synoptic use ~ 11 years (not continuously)
USAM-CNMCA surface solar radiation
and sunshine
34 WMO-GTS ~ 55 years
ENAV surface-manned ~ 35 WMO-GTS, ICAO-AFTN ~ 63 years
CRA-CMA surface-manned ~ 20 agro-met and climatological use
~ 60 years
CRA-CMA surface-automatic ~ 43 agro-met
and climatological use
~ 15 years
CRA-CMA thermal-rain ~ 20 agro-met
and climatological use
~ 60 years
Regional Env-Met Agencies surface-automatic ~ 50 per
region
met/climaological local
use
~ 20 years
Regional Agro-Met Services surface-automatic ~ 50 per region
agro-met and climatological local use
~ 20 years
Italy contributes to GCOS Surface Network (GSN) with five stations of the Air Force Met Service (see Table 8.4).
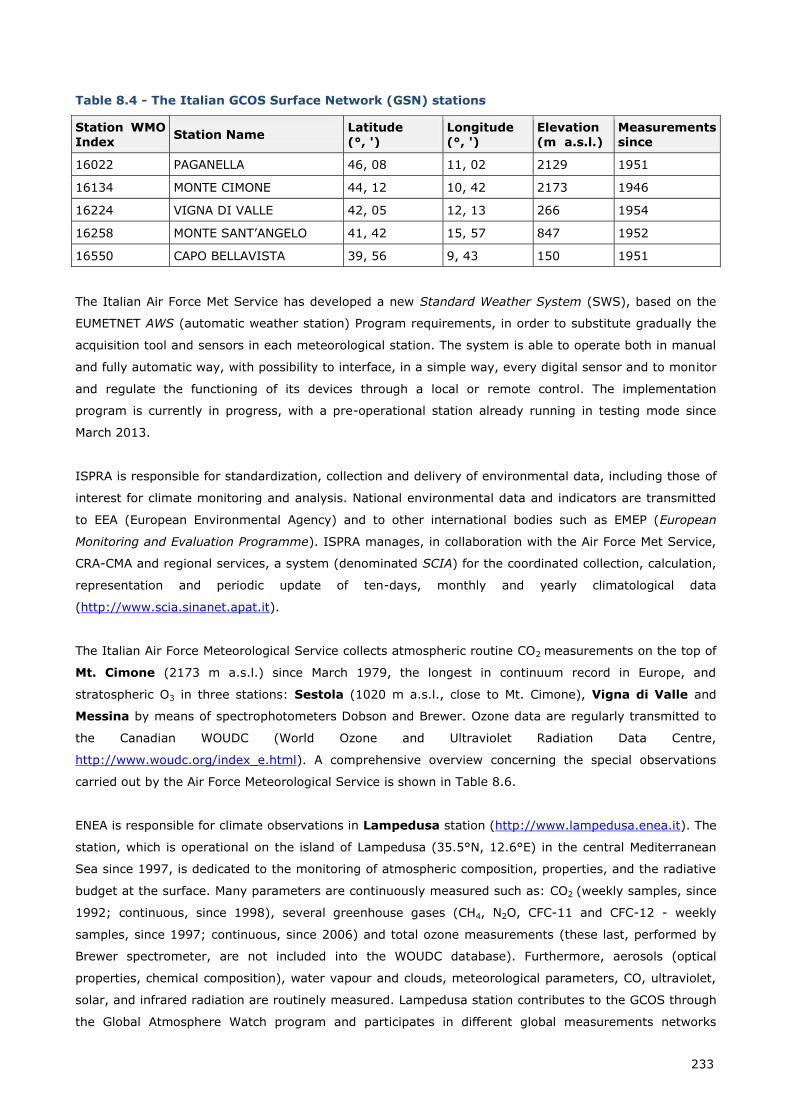
233
Table 8.4 - The Italian GCOS Surface Network (GSN) stations
Station WMO
Index Station Name
Latitude
(°, ')
Longitude
(°, ')
Elevation
(m a.s.l.)
Measurements
since
16022 PAGANELLA 46, 08 11, 02 2129 1951
16134 MONTE CIMONE 44, 12 10, 42 2173 1946
16224 VIGNA DI VALLE 42, 05 12, 13 266 1954
16258 MONTE SANT’ANGELO 41, 42 15, 57 847 1952
16550 CAPO BELLAVISTA 39, 56 9, 43 150 1951
The Italian Air Force Met Service has developed a new Standard Weather System (SWS), based on the
EUMETNET AWS (automatic weather station) Program requirements, in order to substitute gradually the
acquisition tool and sensors in each meteorological station. The system is able to operate both in manual
and fully automatic way, with possibility to interface, in a simple way, every digital sensor and to monitor
and regulate the functioning of its devices through a local or remote control. The implementation
program is currently in progress, with a pre-operational station already running in testing mode since
March 2013.
ISPRA is responsible for standardization, collection and delivery of environmental data, including those of
interest for climate monitoring and analysis. National environmental data and indicators are transmitted
to EEA (European Environmental Agency) and to other international bodies such as EMEP (European
Monitoring and Evaluation Programme). ISPRA manages, in collaboration with the Air Force Met Service,
CRA-CMA and regional services, a system (denominated SCIA) for the coordinated collection, calculation,
representation and periodic update of ten-days, monthly and yearly climatological data
(http://www.scia.sinanet.apat.it).
The Italian Air Force Meteorological Service collects atmospheric routine CO2 measurements on the top of
Mt. Cimone (2173 m a.s.l.) since March 1979, the longest in continuum record in Europe, and
stratospheric O3 in three stations: Sestola (1020 m a.s.l., close to Mt. Cimone), Vigna di Valle and
Messina by means of spectrophotometers Dobson and Brewer. Ozone data are regularly transmitted to
the Canadian WOUDC (World Ozone and Ultraviolet Radiation Data Centre,
http://www.woudc.org/index_e.html). A comprehensive overview concerning the special observations
carried out by the Air Force Meteorological Service is shown in Table 8.6.
ENEA is responsible for climate observations in Lampedusa station (http://www.lampedusa.enea.it). The
station, which is operational on the island of Lampedusa (35.5°N, 12.6°E) in the central Mediterranean
Sea since 1997, is dedicated to the monitoring of atmospheric composition, properties, and the radiative
budget at the surface. Many parameters are continuously measured such as: CO2 (weekly samples, since
1992; continuous, since 1998), several greenhouse gases (CH4, N2O, CFC-11 and CFC-12 - weekly
samples, since 1997; continuous, since 2006) and total ozone measurements (these last, performed by
Brewer spectrometer, are not included into the WOUDC database). Furthermore, aerosols (optical
properties, chemical composition), water vapour and clouds, meteorological parameters, CO, ultraviolet,
solar, and infrared radiation are routinely measured. Lampedusa station contributes to the GCOS through
the Global Atmosphere Watch program and participates in different global measurements networks
234
(AERONET; Carboeurope; NOAA/ESRL/GMD CCGG cooperative air sampling network; MWRnet). In
addition, several intensive measurements campaigns were carried out at Lampedusa (e.g., Ground-based
and air-borne measurements of the aerosol radaitive forcing, GAMARF, in 2008), also as a contrinution to
large international experiments (Hydrological cycle Mediterranean experiment, Hymex in 2012;
Chemistry and Aerosol Mediterranean Experiment, Charmex in 2013). Activities at Lampedusa are
supported by the MIUR, through the NextData and Ritmare projects and by the European Union, through
the GHG-Europe and InGOS projects.
ENEA also participates, jointly with other Institutes (Danish Meteorological Institute; NCAR/USA;
University of Roma and Firenze, INGV), in an international effort aimed at the study of the Arctic climate
through observations carried out at the Thule Air Base (76.5°N, 68.8°W), Greenland
(http://www.ndsc.ncep.noaa.gov/sites/stat_reps/thule/). Thule station is dedicated to the observation of
tropospheric and stratospheric composition and structure; the Italian measurements at Thule started in
1990 and are part of a long-term program. Thule measurements contribute to GCOS through the Network
for the Detection of Atmospheric Composition Change (http://www.ndsc.ncep.noaa.gov/). Italian
activities are presently supported by the Italian Antarctic Programme; they were supported also by the
European Union, the MIUR and by the US National Science Foundation.
Furthermore ENEA participates to the study of the Antarctic climate through observations carried out by
the Italian Meteo-Climatological Antarctic Observatory (http://www.climantartide.it). Started in
1987, the Observatory currently operates 16 Automatic Weather Stations (AWS), active throughout the
year. The AWS's monitoring network covers all the Victoria Lands territory, from the Italian Base "Mario
Zucchelli" (MZS, 74° 41' S, 164° 05' E) to the innermost area of the Antarctic Plateau at the French-
Italian Base "Concordia" (DC, 75° S, 123° E), and towards the Wilkes Lands territory in the direction of
the French Scientific Base "Dumont D'Urville" (DDU, 66° 40' S, 140° 01' E). Seven of the AWSs have a
WMO identifier and their Synop messages are disseminated to the GTS network. Upper air weather
information is acquired by two radiosounding stations: one at MZS (since 1987, two launches per day, at
00 and 12 UTC) and one at DC (since 2005, one launch per day, at 12 UTC). Temperature messages
automatically generated from both stations are disseminated to the GTS network. The Italian Meteo-
Climatological Antarctic Observatory is supported by the Italian Antarctic Programme.
CNR-IDASC (National Research Council Institute of Acoustics and Sensors), together with the Dirección
Nacional Del Antártico (Argentina) and the International Center for Earth Sciences, manages the GAW
station installed in Jubany (Antarctic Peninsula) and collects CO2 data since 1994
(http://www.idasc.cnr.it). Trace gases measurements of all stations can be found at link
http://gaw.kishou.go.jp/wdcgg.html.
CNR-ISAC manages an observatory located close to the Air Force station of Mt. Cimone
(http://www.isac.cnr.it/~cimone/). The principal measurement activity under responsibility of ISAC
regards ‘Surface Ozone’, reported to WDCGG since 1996; NO2 is measured since 1993 by DOAS
(Differential Optical Absorption Spectrometer) instruments; 7Be and 210Pb activity is monitored over paper
filter collected on the top of the mountain; PM10 is measured since 1998; since June 2000 is active the
Aerosol Size Distribution Analyzer. CFC’s have been measured in flask from 1999 until 2000 and since
2001 the measurements are in continuous inside the SOGE project. CH4 has been measured since 2004
by Urbino University in cooperation with ISAC. Finally, CNR-ISAC collects total ozone data in Antarctica at
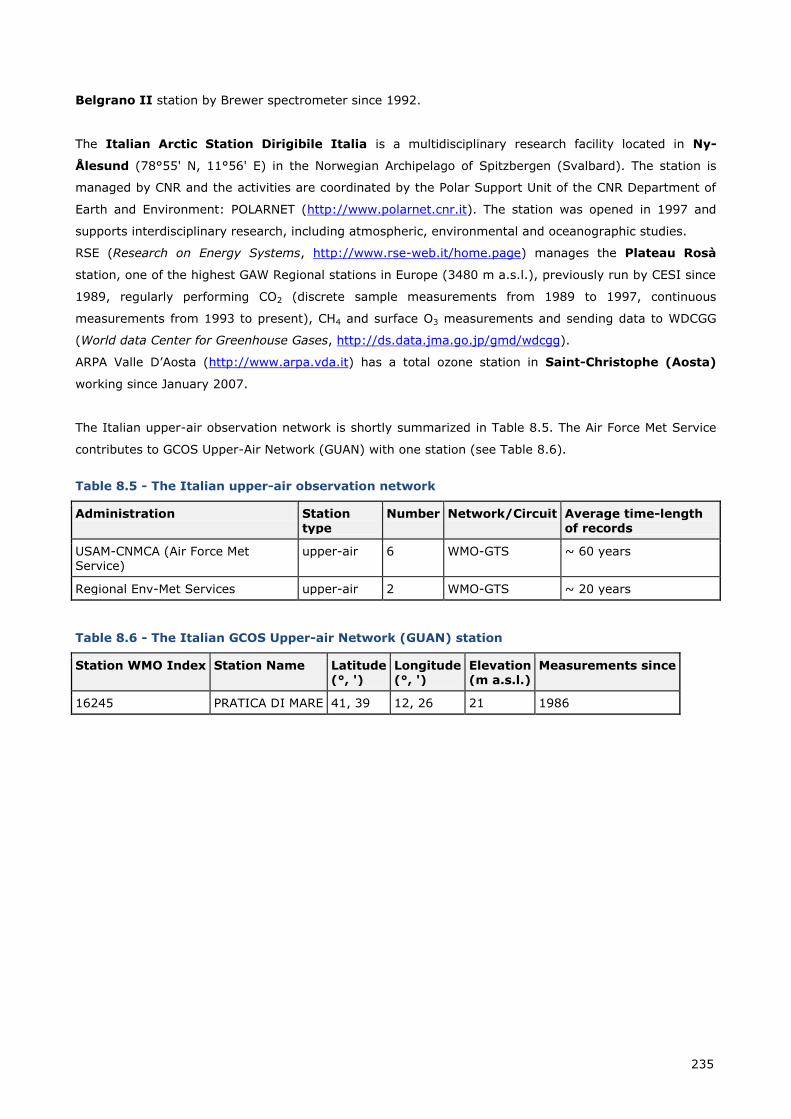
235
Belgrano II station by Brewer spectrometer since 1992.
The Italian Arctic Station Dirigibile Italia is a multidisciplinary research facility located in Ny-
Ålesund (78°55' N, 11°56' E) in the Norwegian Archipelago of Spitzbergen (Svalbard). The station is
managed by CNR and the activities are coordinated by the Polar Support Unit of the CNR Department of
Earth and Environment: POLARNET (http://www.polarnet.cnr.it). The station was opened in 1997 and
supports interdisciplinary research, including atmospheric, environmental and oceanographic studies.
RSE (Research on Energy Systems, http://www.rse-web.it/home.page) manages the Plateau Rosà
station, one of the highest GAW Regional stations in Europe (3480 m a.s.l.), previously run by CESI since
1989, regularly performing CO2 (discrete sample measurements from 1989 to 1997, continuous
measurements from 1993 to present), CH4 and surface O3 measurements and sending data to WDCGG
(World data Center for Greenhouse Gases, http://ds.data.jma.go.jp/gmd/wdcgg).
ARPA Valle D’Aosta (http://www.arpa.vda.it) has a total ozone station in Saint-Christophe (Aosta)
working since January 2007.
The Italian upper-air observation network is shortly summarized in Table 8.5. The Air Force Met Service
contributes to GCOS Upper-Air Network (GUAN) with one station (see Table 8.6).
Table 8.5 - The Italian upper-air observation network
Administration Station type
Number Network/Circuit Average time-length of records
USAM-CNMCA (Air Force Met Service)
upper-air 6 WMO-GTS ~ 60 years
Regional Env-Met Services upper-air 2 WMO-GTS ~ 20 years
Table 8.6 - The Italian GCOS Upper-air Network (GUAN) station
Station WMO Index Station Name Latitude (°, ')
Longitude (°, ')
Elevation (m a.s.l.)
Measurements since
16245 PRATICA DI MARE 41, 39 12, 26 21 1986
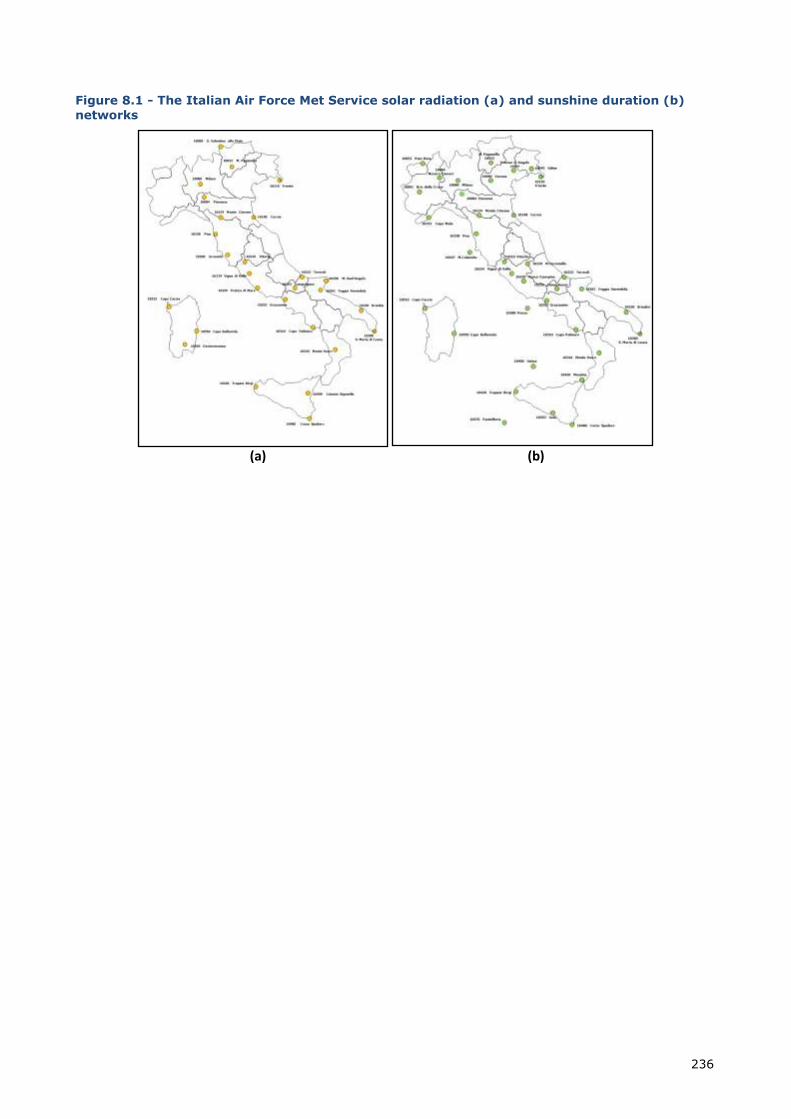
236
Figure 8.1 - The Italian Air Force Met Service solar radiation (a) and sunshine duration (b)
networks
(a) (b)
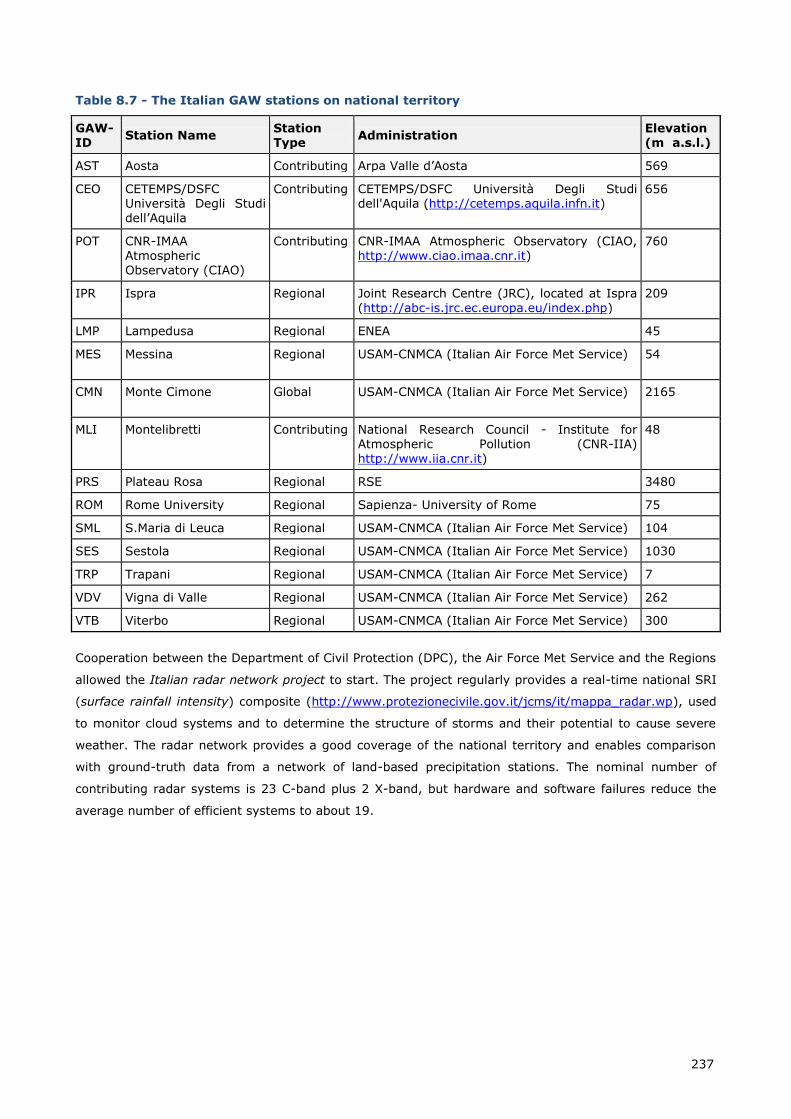
237
Table 8.7 - The Italian GAW stations on national territory
GAW-ID
Station Name Station Type
Administration Elevation (m a.s.l.)
AST Aosta Contributing Arpa Valle d’Aosta 569
CEO CETEMPS/DSFC Università Degli Studi dell’Aquila
Contributing CETEMPS/DSFC Università Degli Studi dell'Aquila (http://cetemps.aquila.infn.it)
656
POT CNR-IMAA Atmospheric Observatory (CIAO)
Contributing CNR-IMAA Atmospheric Observatory (CIAO, http://www.ciao.imaa.cnr.it)
760
IPR Ispra Regional Joint Research Centre (JRC), located at Ispra (http://abc-is.jrc.ec.europa.eu/index.php)
209
LMP Lampedusa Regional ENEA 45
MES
Messina Regional USAM-CNMCA (Italian Air Force Met Service) 54
CMN
Monte Cimone Global USAM-CNMCA (Italian Air Force Met Service) 2165
MLI Montelibretti Contributing National Research Council - Institute for Atmospheric Pollution (CNR-IIA) http://www.iia.cnr.it)
48
PRS Plateau Rosa Regional RSE 3480
ROM Rome University Regional Sapienza- University of Rome 75
SML S.Maria di Leuca Regional USAM-CNMCA (Italian Air Force Met Service) 104
SES Sestola Regional USAM-CNMCA (Italian Air Force Met Service) 1030
TRP Trapani Regional USAM-CNMCA (Italian Air Force Met Service) 7
VDV Vigna di Valle Regional USAM-CNMCA (Italian Air Force Met Service) 262
VTB Viterbo Regional USAM-CNMCA (Italian Air Force Met Service) 300
Cooperation between the Department of Civil Protection (DPC), the Air Force Met Service and the Regions
allowed the Italian radar network project to start. The project regularly provides a real-time national SRI
(surface rainfall intensity) composite (http://www.protezionecivile.gov.it/jcms/it/mappa_radar.wp), used
to monitor cloud systems and to determine the structure of storms and their potential to cause severe
weather. The radar network provides a good coverage of the national territory and enables comparison
with ground-truth data from a network of land-based precipitation stations. The nominal number of
contributing radar systems is 23 C-band plus 2 X-band, but hardware and software failures reduce the
average number of efficient systems to about 19.
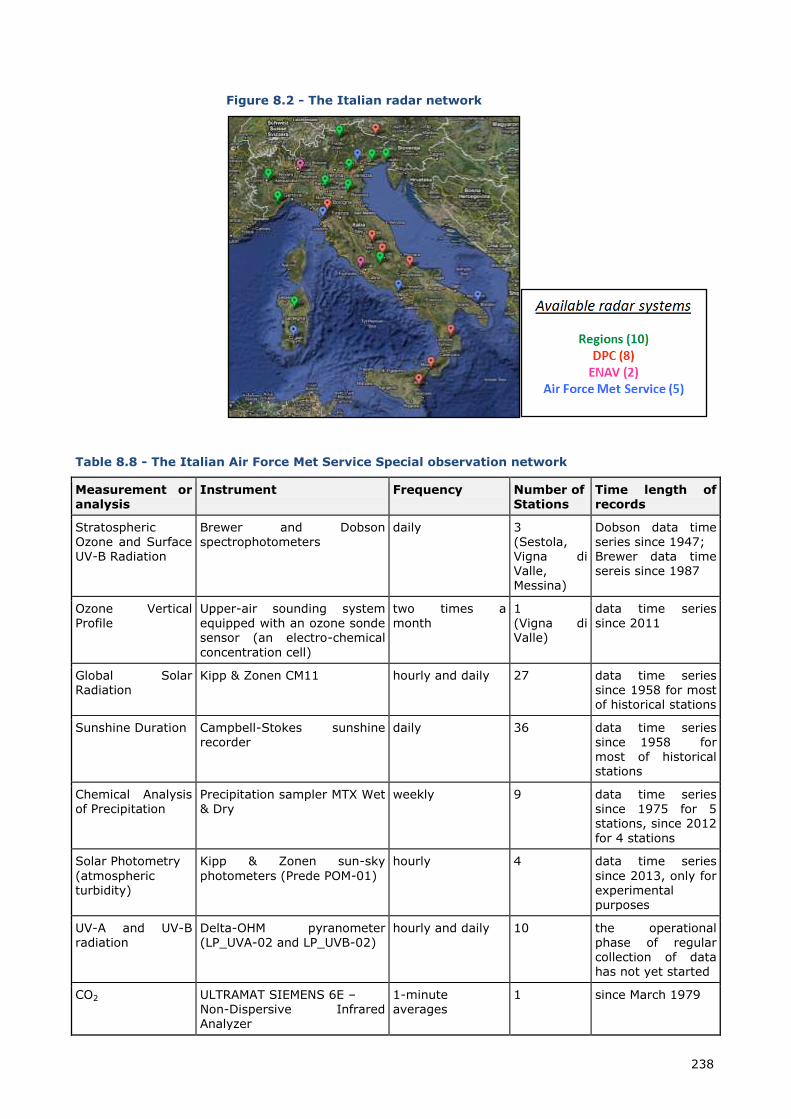
238
Figure 8.2 - The Italian radar network
Table 8.8 - The Italian Air Force Met Service Special observation network
Measurement or analysis
Instrument Frequency Number of Stations
Time length of records
Stratospheric Ozone and Surface UV-B Radiation
Brewer and Dobson spectrophotometers
daily 3 (Sestola, Vigna di Valle, Messina)
Dobson data time series since 1947; Brewer data time sereis since 1987
Ozone Vertical
Profile
Upper-air sounding system
equipped with an ozone sonde sensor (an electro-chemical
concentration cell)
two times a
month
1
(Vigna di Valle)
data time series
since 2011
Global Solar Radiation
Kipp & Zonen CM11 hourly and daily 27 data time series since 1958 for most of historical stations
Sunshine Duration
Campbell-Stokes sunshine recorder
daily
36
data time series since 1958 for most of historical stations
Chemical Analysis of Precipitation
Precipitation sampler MTX Wet & Dry
weekly 9
data time series since 1975 for 5 stations, since 2012
for 4 stations
Solar Photometry
(atmospheric turbidity)
Kipp & Zonen sun-sky
photometers (Prede POM-01)
hourly
4
data time series
since 2013, only for experimental purposes
UV-A and UV-B radiation
Delta-OHM pyranometer (LP_UVA-02 and LP_UVB-02)
hourly and daily
10 the operational phase of regular collection of data has not yet started
CO2
ULTRAMAT SIEMENS 6E – Non-Dispersive Infrared Analyzer
1-minute averages
1
since March 1979
239
Measurement or
analysis
Instrument Frequency Number of
Stations
Time length of
records
CH4
PCF ELETTRONICA 529 - FlD (Flame Ionization Detector) Gaschromatograph
instantaneous measurements every 3 minutes
1
since December 2011 (currently in a experimental stage)
8.7.2 Ocean Climate Observing System
The National Group of Operational Oceanography (GNOO, http://gnoo.bo.ingv.it) is an INGV structure
that coordinates the development of operational oceanography in Italy. GNOO is composed of
representatives from INGV and Italian research agencies and institutions involved in in-situ and satellite
ocean monitoring systems, basin-scale Mediterranean forecasts for hydrodynamics and marine
biochemistry, Mediterranean- and global-scale reanalyses, and limited-area forecasts for the Italian seas.
The actual observing system is composed of a specific implementation of VOS-SOOP, ARGO, meteo-
oceanographic buoys, gliders and analysed satellite data that are both archived and real time. The in-situ
observations have been collected since the early 2000s. The products derived from satellite observations
have been improved and consist of Sea Surface Temperature, Sea Level Anomaly and Chl-a
concentration.
GNOO coordinates the Italian participation to the Copernicus/GMES Marine Service that is the flagship EU
program for the systematic monitoring of the Earth system (http://www.copernicus.eu/). Copernicus
organises the access to multiple sources of data, from Earth observation satellites to in situ platforms,
and provides users with reliable and up-to-date information through a set of services related to
environmental and security issues. For the ocean and the climate Copernicus organises two services and
INGV-Sezione di Bologna has the responsibility of the Mediterranean Monitoring and Forecasting service
and CNR-ISAC the responsibility of the Ocean Color Thematic Assembly centre.
ARGO-ITALY is the Italian component of a worldwide in situ global observing system, based on
autonomous profiling floats, surface drifters, gliders and ship-of-opportunity measurements. It is
primarily focused on the Italian seas, the Mediterranean and Black seas, and includes observations of
temperature, salinity, currents and other water mass properties. ARGO-ITALY contributes to international
programs such as Argo and Euro-Argo (global monitoring of water properties with profiling floats), GDP
(Global Drifter Program to measure near-surface temperature and currents), EGO (gliding vehicles to
measure water properties) and SOOP (Ship-Of-Opportunity Program to temperature profiles), developed
to monitor the entire World Ocean on a long term basis.
Together with the Italian Air Force Met Service, three of GNOO components will participate to the REC-
MMO-Med (REgional Centre specialized for Marine Meteorology and Oceanography over Mediterranean
Sea), in order to build a specilized hub, according to WIS concept (DCPC), for marine meteorology and
oceanography. These above mentioned components are:
ISPRA, responsible for the national tide gauge network (RMN Rete Mareografica Nazionale, with
36 tide gauges - http://www.mareografico.it) and for the national data buoy or wave
measurement network (RON Rete Ondametrica Nazionale, with 15 moored oceanographic buoys -
http://www.telemisura.it);
OGS (http://www.ogs.trieste.it), responsible for the MedARGO program;
240
INGV (Bologna, www.bo.ingv.it), responsible for the oceanographic analyses and forecasts for the
Mediterranean Sea (http://gnoo.bo.ingv.it/mfs/myocean); since 2012 INGV coordinates an
international project called EMSO (European Multidisciplinatry Seafloor Observatory
http://www.emso-eu.org/management), a network of marine observatories devoted to monitor
and study climate change of natural origin or induced by human activity and the evolution of
marine ecosystems.
Furthermore, CNR-ISMAR operates several multi-parametric observing systems (buoys, platforms,
moorings and other fixed sites - http://www.ismar.cnr.it/infrastructures/observational-sites), most of
them are placed along the Italian coasts and transmit data in real time to the receiving stations at coast.
Finally, to be noticed is the activity of the Mareographic station of Trieste, operated by the University of
Trieste (http://www.meteo.units.it) and performing the monitoring every 10 minutes of the sea level and
temperature (surface and 2 m. below sea level) since 1995 (conventional meteorological and radiation
data are monitored since 1979 in the same station).
8.7.3 Terrestrial Climate Observing System
In Italy the hydrological cycle monitoring, as well as that relating to land use, evapotranspiration and soil
conditions, is carried out by regional networks and functional centres since 2002; the analysis and
assessment of resulting data are performed both at regional (Regional Agencies for Environmental
Protection) and national level (ISPRA).
The State Forestry Corps (http://www3.corpoforestale.it) performs environmental monitoring through
two operational programs:
INFC (National Inventory of Forests and forest Carbon pools,
http://www.sian.it/inventarioforestale);
CONECOFOR (Forest Ecosystems Controls).
8.7.4 Support for developing countries to establish and maintain observing systems, and
related data and monitoring systems
ISAC-CNR manages, since March 2006, three permanent automatic meteorological stations: Pyramid,
Kala Patthar and South Col (Nepal, http://evk2.isac.cnr.it/realtime.html) in Khumbu Valley, Mount
Everest National Park, at an altitude respectively of 5050 m asl, 5585 m asl and 7986 m asl. In the last
site above mentioned the in-situ highest meteorological observations in the world take place. Monitoring
activities are carried out in close cooperation with Nepal Hidrology and Meteorology Department (DHM),
Regional Representative Office of WMO.
8.7.5 Other actions taken to support related capacity-building in developing countries
Many Italian Institutions, Universities and Agencies are active participants in international EU funded
projects on climate change related topics and in National projects funded by means of bilateral
agreements, with a special emphasis on research capacity building in developing countries such as:
ABC (Atmospheric Brown Clouds, http://www-abc-asia.ucsd.edu);
AMMA (African Monsoon Multidisciplinary Analysis, http://www.amma-international.org);
CIRCE (Climate Change and Impact Research: the Mediterranean Environment
http://www.circeproject.eu);
241
CLIMRUN (Climate Local Information in the Mediterranean region Responding to User Needs,
www.climrun.eu);
CliMiP (Climate change Mitigation and Poverty reduction)
http://www.feem.it/getpage.aspx?id=5257&sez=research&padre=18&sub=70&idsub=86&pj=Ongo
ing);
IMPACT2C (Quantifying projected impacts under 2°C warming, http://www.hzg.de/mw/impact2c);
EUPORIAS (European Provision Of Regional Impacts Assessments on Seasonal and Decadal
Timescales, http://www.euporias.eu);
ClimAfrica (Climate change predictions in Sub-Saharan Africa: impacts and adaptations,
http://www.climafrica.net);
CLARIS (A Europe-South America Network for Climate Change Assessment and Impact Studies,
http://www.claris-eu.org);
METEOMET (Metrology for Meteorology, http://www.meteomet.org);
NEXTDATA (devoted to climate change in mountain areas, http://www.nextdataproject.it);
SHARE (Station at High Altitude for Research on the Environment,
http://www.evk2cnr.org/cms/it/ricerca/programmi_integrati/share);
SPICE (WMO Solid Precipitation Intercomparison Experiment 2012-2014,
http://www.wmo.int/pages/prog/www/IMOP/intercomparisons/SPICE/SPICE.html);
SUSKAT (A SUStainable atmosphere for the KAThmandu Valley;
http://www.iass-potsdam.de/regional-focus-sustainable-atmosphere-kathmandu-valley);
Activities of the GEO (Group on Earth Observations) Ecosystems SBA
(http://www.earthobservations.org/index.shtml);
Education programmes implemented by means of several training workshops on ‘modelling of
regional climate, extreme events, air quality and human health’
(http://www.ictp.it/homepage.aspx);
Evaluation of the carbon sink potential of an ecosystem of the oasis in Algeria, Rainfall, fire,
elephant, and tree interactions in Southern African savannas and desertification (Italy – South
Africa Bilateral Agreement);
Landfill emissions reduction by waste stabilisation processes: an effective way of managing
renewable energy sources (Italy – South Africa Bilateral Agreement);
Monitoring system for CO2 captured in a used deposit of hydrocarbons (Italy – Algeria Bilateral
Agreement);
Optimization of water use by native plants in arid lands facing climate change and desertification
(Italy – Pakistan Bilateral Agreement).
242
9 EDUCATION, TRAINING AND PUBLIC AWARENESS233
9.1 Education and Public awareness
The trend in the awareness-raising initiatives specifically dedicated to climate change over the last three
years, had a decline at national level while it increased at local level. On the other hand, there is a
growing commitment to raise awareness on sustainable use of resources, in particular energy and
renewable energy.
Like in the rest of Europe, the climate change campaign launched by the European Commission in each
EU Member State –including Italy- with the motto “Turn down. Switch off. Recycle. Walk”, ended, and its
website has been archived on 1/12/2011 (http://ec.europa.eu/environment/climat/campaign/).
Starting from young people and working with them has proven to be the most effective tool to build a
conscious citizenship with regard to environmental issues. In order to build an effective educational path
for young people it is essential to carry out a proper training of trainers and to update courses on specific
environmental issues. It is therefore important the implementation of courses for teachers so that the
school can become a place of awareness and dialogue among students, teachers and experts on the
issues related to climate change.
Schools are at the top for the dissemination and awareness on important issues such as energy saving,
sustainable consumption, CO2 emissions, climate change; in other words, schools are the training ground
of new generations to whom we will leave our Planet.
The key actors in the promotion and implementation of innovative methods for teaching and learning and
raising awareness on climate change in Italy are, as in the previous years, in large part Municipalities,
Regional and Provincial Administrations and Regional Environmental Agencies (ARPAs). Among these, the
most engaged in education and training activities are the Trentino and the Emilia Romagna Regions with
the Environmental Education Network for sustainable development of Trento and the System of
Information, Training and Environmental Education for Sustainability (INFEAS) of Emilia Romagna. The
city of Trento is not by chance at the first place among the Italian cities for better quality of life.
For easier reference, the initiatives on education and public awareness have been divided in two separate
sections below.
Education
In Italy the institutional reference for Environmental Education is the National Programme for
Environmental Education, Information and Training (IN.F.E.A), coordinated by the Ministry for the
Environment Land and Sea (MoE) and by the Regions.
The INFEA is structured as an open and dynamic integration of systems on regional scale, where the
regional administrations play a role of listening, proposal and coordination by fostering a constant
dialogue with the actors involved in the field of the environmental education.
The INFEA Programme has contributed, with financial support, to spread throughout Italy, structures and
tools to assist and strengthen the role of Regions and to direct the actions towards the set up of a
233 Lead author: Stefania Fusani (ISPRA); Contributing authors: Sandra Moscone (ISPRA), Stefania Calicchia (ISPRA),
Daniela Antonietti (ISPRA), Fabrizio Ciocca (ISPRA), Antonella Ceccarelli (ISPRA), Antonietta Licenziato (ISPRA), Maria
Alessia Alessandro (ISPRA), Patrizia Polidori (ISPRA).
Special Thanks to: the Regional Environmental Agencies (ARPAs) of Calabria, Campania, Emilia Romagna, Lazio,
Lombardia, Puglia, Toscana, Umbria, Veneto, the Provincial Environmental Agencies (APPAs) of Trento and Bolzano,
the General Secretariat of Ministry of Environment, Land and Sea and the Italian Civil Protection Department.
243
National System of Education, training and environmental information. During 2007-2009 the IN.F.E.A
Programme realized a number of initiatives on climate change and promoted renewable and efficiency
energies.
Another important institutional point of reference is the Italian National Commission for UNESCO, which
coordinates the activities of the Decade of Education for Sustainable Development (2005-2014). In
particular, every year the National Week of Education for Sustainable Development develops a large
number of initiatives to raise awareness and education throughout the country. To the issue of climate
change has been dedicated the DESS Week in 2007, while in recent years the issues of sustainable
mobility (2010), water (2011), agriculture, ecosystems and power (2012) have been addressed and 2013
was the year of "landscapes of beauty" (www.unescodess.it).
In this framework, the National System for Environmental Protection, composed by ISPRA and the
Regional and Provincial Environmental Agencies, plays an important role, promoting and implementing
educational programs, projects and initiatives on various environmental issues.
The Environmental Education Sector of ISPRA, which coordinates the Network of Focal Points of Education
for Sustainability (Rete di Referenti dell’Educazione Orientata alla Sostenibilità - EOS), collects and
processes data and information related to educational activities carried out in Italy, for their inclusion in
the Environmental Data Yearbook.
The first Italian Region to adopt legislation in the field of environmental education was the Emilia-
Romagna Region with the Regional Law No. 15 of 1996, establishing the INFEA Regional System of
Emilia Romagna. By Regional Law no. 27 of 2009, the INFEA Regional System of the Emilia Romagna
Region was updated to focus more on the dissemination of a Development Plan based on active
citizenship, peace, democracy, human rights, fair development, reasonable use of resources: all these
aspects can be summarized with the concept of sustainability. As a result, in 2009, the INFEA Regional
System has become INFEAS (Information, Training and Environmental Education for
Sustainability). The INFEAS regional system is a network of organizations that engages regional public
and private bodies in a process of active collaboration to promote, disseminate and coordinate the actions
of education for sustainability.
Nowadays the CEAS (Centres for Education to Sustainability), established by the new Regional Law,
deals with all matters related to environment and sustainability; they are targeting children and adults as
well as aiming at the involvement of other local stakeholders.
The Networks of schools for education to sustainability are addressed to the education of the
younger generation towards a sustainable development that can not compromise the life on the planet.
The INFEAS system recognizes to schools a key role in the dissemination of the culture of sustainability
and aims to support and enhance all the institutions (or networks of institutions) which include in their
educational plan these issues or those implementing in-house activities of education for sustainability.
(http://ambiente.regione.emilia-romagna.it/infeas/temi/sistema).
With the Provincial Law no. 3/99, the Autonomous Province of Trento has entrusted the Provincial Agency
for the Protection of the Environment of the coordination and organization of environmental education
projects, promotion, training and information (In.FEA). The Environmental Education Network for
sustainable development of Trento (Rete trentina di educazione ambientale per lo sviluppo
sostenibile) is a network of forty environmental educators that promotes the adoption of best practices
with the aim of forming an "active citizenship" capable of a daily living with a more eco-friendly
consciousness and behaviour. (http://www.appa.provincia.tn.it/educazioneambientale/).
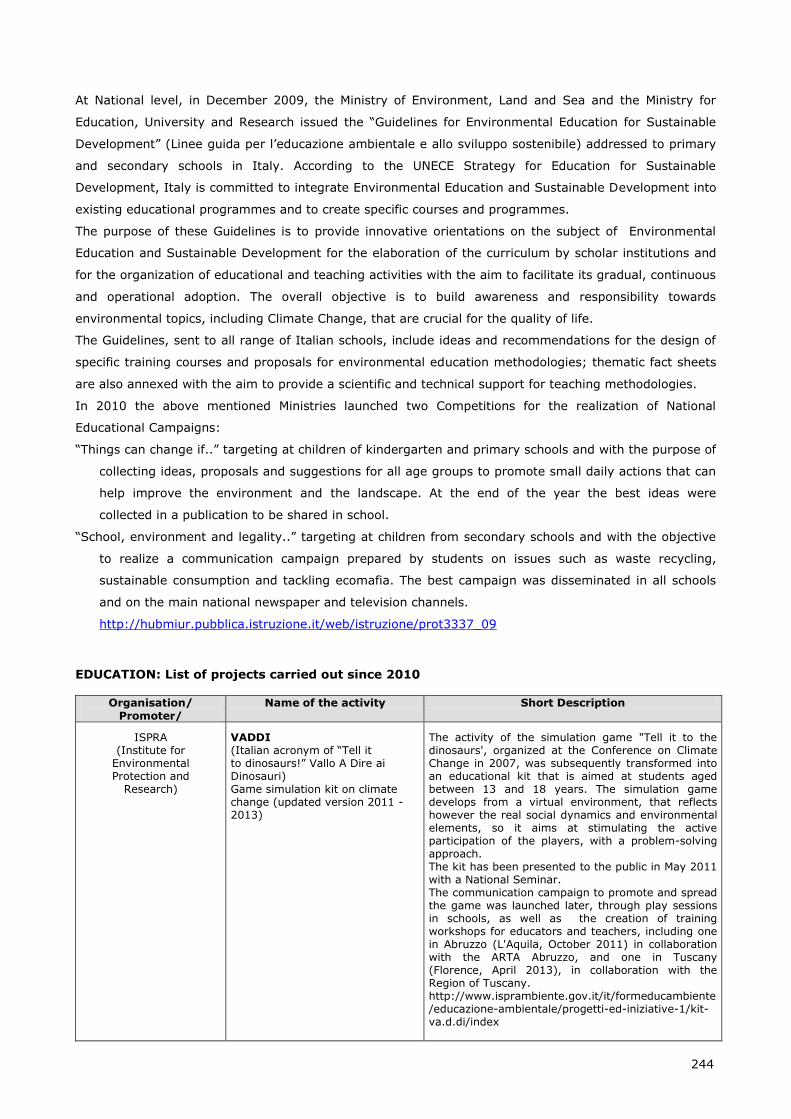
244
At National level, in December 2009, the Ministry of Environment, Land and Sea and the Ministry for
Education, University and Research issued the “Guidelines for Environmental Education for Sustainable
Development” (Linee guida per l’educazione ambientale e allo sviluppo sostenibile) addressed to primary
and secondary schools in Italy. According to the UNECE Strategy for Education for Sustainable
Development, Italy is committed to integrate Environmental Education and Sustainable Development into
existing educational programmes and to create specific courses and programmes.
The purpose of these Guidelines is to provide innovative orientations on the subject of Environmental
Education and Sustainable Development for the elaboration of the curriculum by scholar institutions and
for the organization of educational and teaching activities with the aim to facilitate its gradual, continuous
and operational adoption. The overall objective is to build awareness and responsibility towards
environmental topics, including Climate Change, that are crucial for the quality of life.
The Guidelines, sent to all range of Italian schools, include ideas and recommendations for the design of
specific training courses and proposals for environmental education methodologies; thematic fact sheets
are also annexed with the aim to provide a scientific and technical support for teaching methodologies.
In 2010 the above mentioned Ministries launched two Competitions for the realization of National
Educational Campaigns:
“Things can change if..” targeting at children of kindergarten and primary schools and with the purpose of
collecting ideas, proposals and suggestions for all age groups to promote small daily actions that can
help improve the environment and the landscape. At the end of the year the best ideas were
collected in a publication to be shared in school.
“School, environment and legality..” targeting at children from secondary schools and with the objective
to realize a communication campaign prepared by students on issues such as waste recycling,
sustainable consumption and tackling ecomafia. The best campaign was disseminated in all schools
and on the main national newspaper and television channels.
http://hubmiur.pubblica.istruzione.it/web/istruzione/prot3337_09
EDUCATION: List of projects carried out since 2010
Organisation/
Promoter/
Name of the activity Short Description
ISPRA (Institute for
Environmental Protection and
Research)
VADDI (Italian acronym of “Tell it to dinosaurs!” Vallo A Dire ai Dinosauri) Game simulation kit on climate change (updated version 2011 - 2013)
The activity of the simulation game "Tell it to the dinosaurs', organized at the Conference on Climate Change in 2007, was subsequently transformed into an educational kit that is aimed at students aged between 13 and 18 years. The simulation game develops from a virtual environment, that reflects however the real social dynamics and environmental elements, so it aims at stimulating the active participation of the players, with a problem-solving approach. The kit has been presented to the public in May 2011 with a National Seminar. The communication campaign to promote and spread the game was launched later, through play sessions in schools, as well as the creation of training workshops for educators and teachers, including one in Abruzzo (L'Aquila, October 2011) in collaboration with the ARTA Abruzzo, and one in Tuscany (Florence, April 2013), in collaboration with the Region of Tuscany. http://www.isprambiente.gov.it/it/formeducambiente/educazione-ambientale/progetti-ed-iniziative-1/kit-va.d.di/index
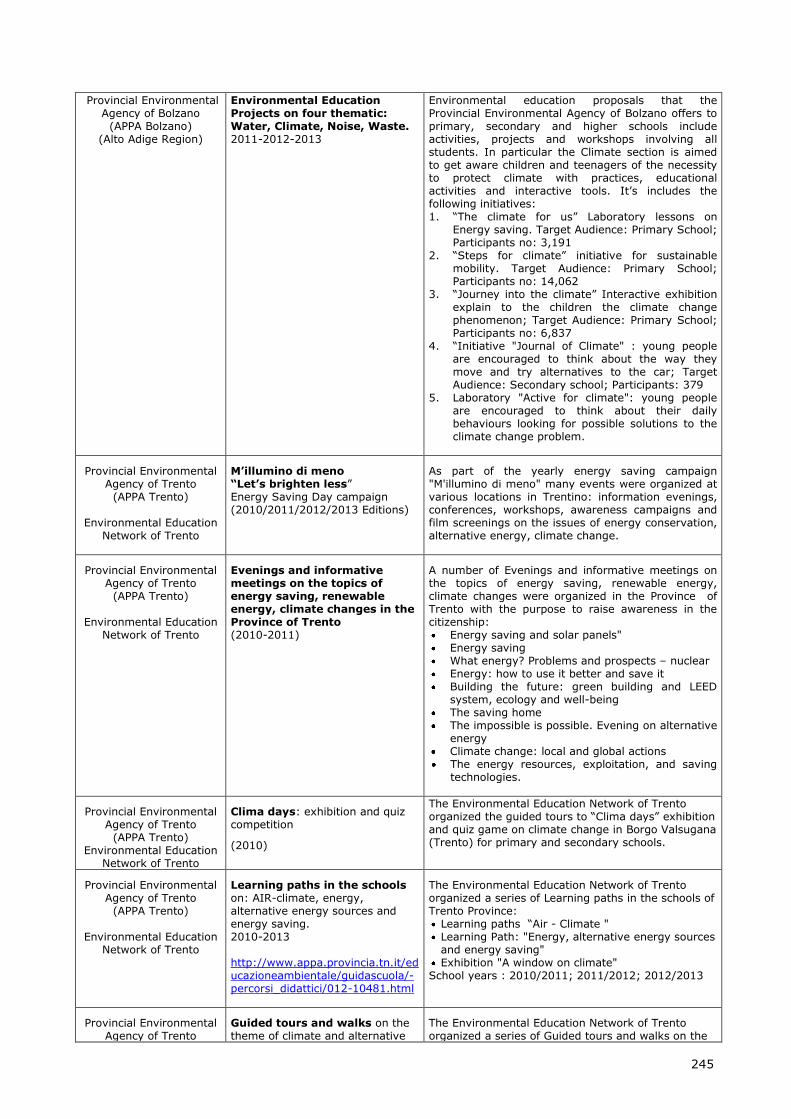
245
Provincial Environmental Agency of Bolzano
(APPA Bolzano) (Alto Adige Region)
Environmental Education Projects on four thematic: Water, Climate, Noise, Waste. 2011-2012-2013
Environmental education proposals that the Provincial Environmental Agency of Bolzano offers to primary, secondary and higher schools include activities, projects and workshops involving all students. In particular the Climate section is aimed to get aware children and teenagers of the necessity to protect climate with practices, educational activities and interactive tools. It’s includes the following initiatives: 1. “The climate for us” Laboratory lessons on
Energy saving. Target Audience: Primary School; Participants no: 3,191
2. “Steps for climate” initiative for sustainable mobility. Target Audience: Primary School; Participants no: 14,062
3. “Journey into the climate” Interactive exhibition explain to the children the climate change phenomenon; Target Audience: Primary School; Participants no: 6,837
4. “Initiative "Journal of Climate" : young people are encouraged to think about the way they move and try alternatives to the car; Target Audience: Secondary school; Participants: 379
5. Laboratory "Active for climate": young people are encouraged to think about their daily behaviours looking for possible solutions to the climate change problem.
Provincial Environmental Agency of Trento
(APPA Trento)
Environmental Education Network of Trento
M’illumino di meno “Let’s brighten less” Energy Saving Day campaign (2010/2011/2012/2013 Editions)
As part of the yearly energy saving campaign "M'illumino di meno" many events were organized at various locations in Trentino: information evenings, conferences, workshops, awareness campaigns and film screenings on the issues of energy conservation, alternative energy, climate change.
Provincial Environmental Agency of Trento
(APPA Trento)
Environmental Education Network of Trento
Evenings and informative meetings on the topics of energy saving, renewable energy, climate changes in the Province of Trento (2010-2011)
A number of Evenings and informative meetings on the topics of energy saving, renewable energy, climate changes were organized in the Province of Trento with the purpose to raise awareness in the citizenship:
Energy saving and solar panels" Energy saving What energy? Problems and prospects – nuclear Energy: how to use it better and save it Building the future: green building and LEED
system, ecology and well-being The saving home The impossible is possible. Evening on alternative
energy Climate change: local and global actions The energy resources, exploitation, and saving
technologies.
Provincial Environmental Agency of Trento
(APPA Trento) Environmental Education
Network of Trento
Clima days: exhibition and quiz competition
(2010)
The Environmental Education Network of Trento organized the guided tours to “Clima days” exhibition and quiz game on climate change in Borgo Valsugana (Trento) for primary and secondary schools.
Provincial Environmental Agency of Trento
(APPA Trento)
Environmental Education Network of Trento
Learning paths in the schools on: AIR-climate, energy, alternative energy sources and energy saving. 2010-2013 http://www.appa.provincia.tn.it/educazioneambientale/guidascuola/-percorsi_didattici/012-10481.html
The Environmental Education Network of Trento organized a series of Learning paths in the schools of Trento Province:
Learning paths “Air - Climate " Learning Path: "Energy, alternative energy sources and energy saving"
Exhibition "A window on climate" School years : 2010/2011; 2011/2012; 2012/2013
Provincial Environmental Agency of Trento
Guided tours and walks on the theme of climate and alternative
The Environmental Education Network of Trento organized a series of Guided tours and walks on the
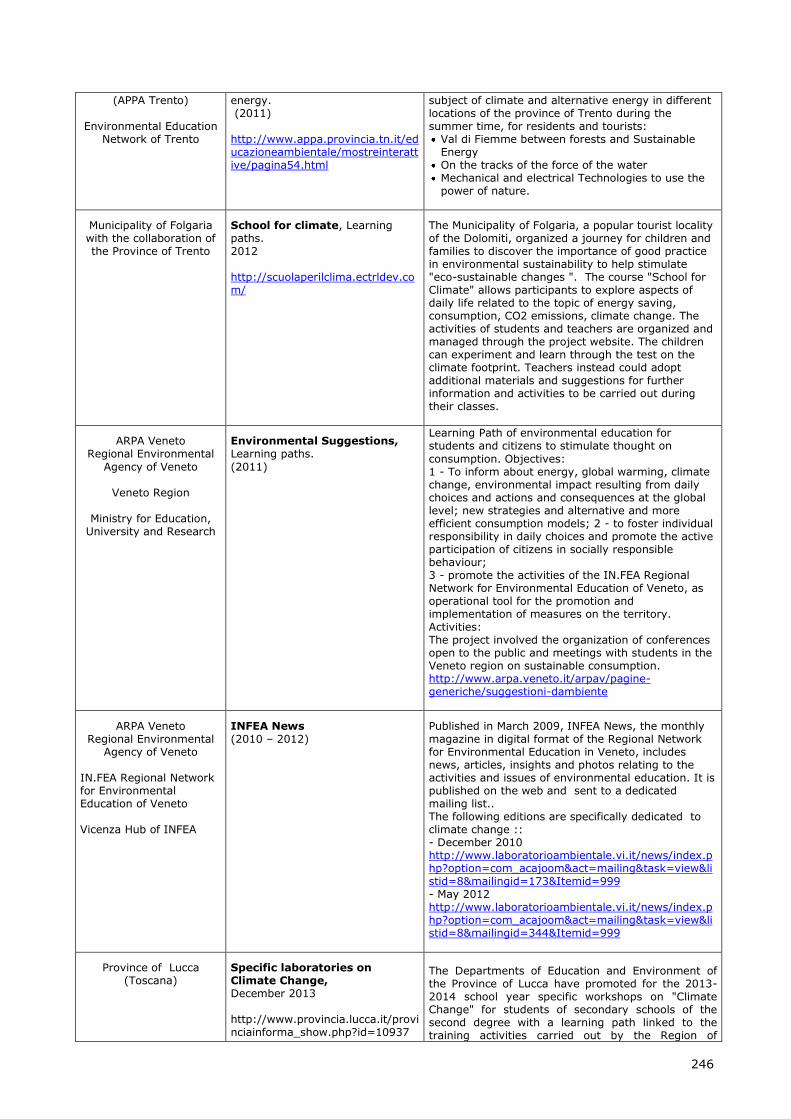
246
(APPA Trento)
Environmental Education Network of Trento
energy. (2011) http://www.appa.provincia.tn.it/educazioneambientale/mostreinterattive/pagina54.html
subject of climate and alternative energy in different locations of the province of Trento during the summer time, for residents and tourists:
Val di Fiemme between forests and Sustainable Energy
On the tracks of the force of the water Mechanical and electrical Technologies to use the power of nature.
Municipality of Folgaria with the collaboration of the Province of Trento
School for climate, Learning paths. 2012 http://scuolaperilclima.ectrldev.com/
The Municipality of Folgaria, a popular tourist locality of the Dolomiti, organized a journey for children and families to discover the importance of good practice in environmental sustainability to help stimulate "eco-sustainable changes ". The course "School for Climate" allows participants to explore aspects of daily life related to the topic of energy saving, consumption, CO2 emissions, climate change. The activities of students and teachers are organized and managed through the project website. The children can experiment and learn through the test on the climate footprint. Teachers instead could adopt additional materials and suggestions for further information and activities to be carried out during their classes.
ARPA Veneto Regional Environmental
Agency of Veneto
Veneto Region
Ministry for Education, University and Research
Environmental Suggestions, Learning paths.
(2011)
Learning Path of environmental education for students and citizens to stimulate thought on
consumption. Objectives: 1 - To inform about energy, global warming, climate change, environmental impact resulting from daily choices and actions and consequences at the global level; new strategies and alternative and more efficient consumption models; 2 - to foster individual responsibility in daily choices and promote the active participation of citizens in socially responsible behaviour; 3 - promote the activities of the IN.FEA Regional Network for Environmental Education of Veneto, as operational tool for the promotion and implementation of measures on the territory. Activities: The project involved the organization of conferences open to the public and meetings with students in the Veneto region on sustainable consumption. http://www.arpa.veneto.it/arpav/pagine-generiche/suggestioni-dambiente
ARPA Veneto Regional Environmental
Agency of Veneto IN.FEA Regional Network for Environmental Education of Veneto Vicenza Hub of INFEA
INFEA News (2010 – 2012)
Published in March 2009, INFEA News, the monthly magazine in digital format of the Regional Network for Environmental Education in Veneto, includes news, articles, insights and photos relating to the activities and issues of environmental education. It is published on the web and sent to a dedicated mailing list.. The following editions are specifically dedicated to climate change :: - December 2010 http://www.laboratorioambientale.vi.it/news/index.php?option=com_acajoom&act=mailing&task=view&listid=8&mailingid=173&Itemid=999 - May 2012 http://www.laboratorioambientale.vi.it/news/index.php?option=com_acajoom&act=mailing&task=view&listid=8&mailingid=344&Itemid=999
Province of Lucca (Toscana)
Specific laboratories on Climate Change, December 2013 http://www.provincia.lucca.it/provinciainforma_show.php?id=10937
The Departments of Education and Environment of the Province of Lucca have promoted for the 2013-2014 school year specific workshops on "Climate Change" for students of secondary schools of the second degree with a learning path linked to the training activities carried out by the Region of
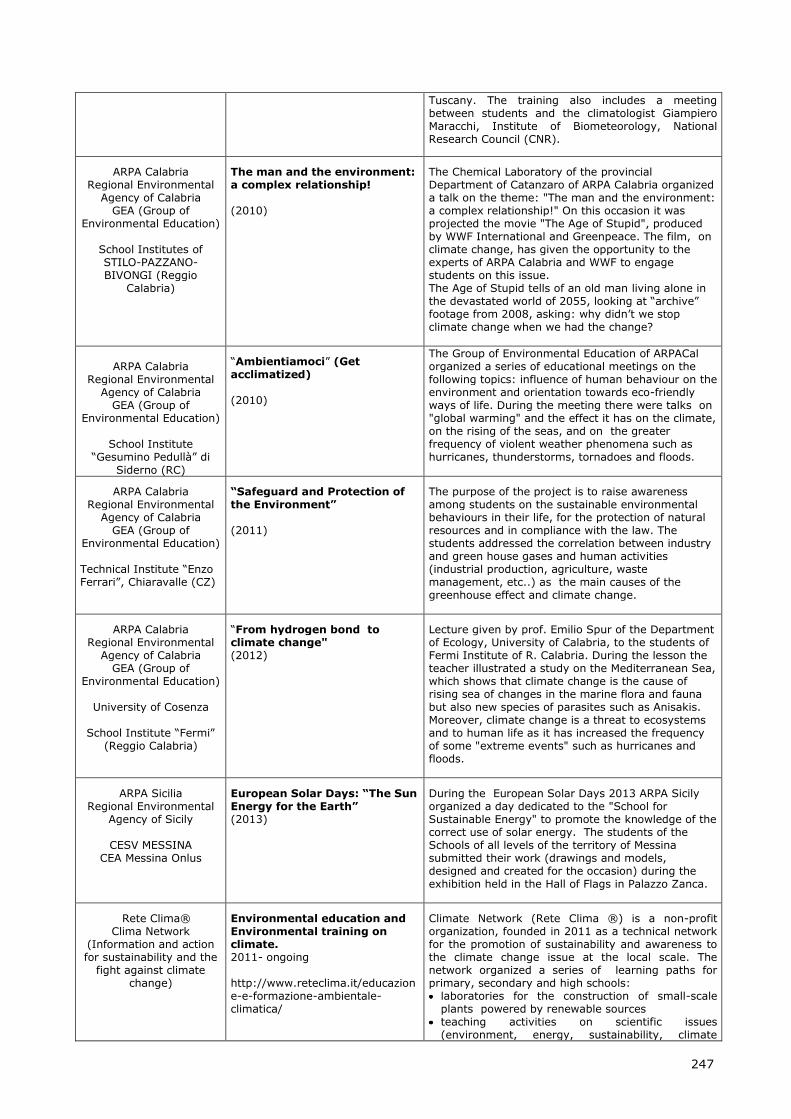
247
Tuscany. The training also includes a meeting between students and the climatologist Giampiero Maracchi, Institute of Biometeorology, National Research Council (CNR).
ARPA Calabria Regional Environmental
Agency of Calabria GEA (Group of
Environmental Education)
School Institutes of STILO-PAZZANO-BIVONGI (Reggio
Calabria)
The man and the environment: a complex relationship! (2010)
The Chemical Laboratory of the provincial Department of Catanzaro of ARPA Calabria organized a talk on the theme: "The man and the environment: a complex relationship!" On this occasion it was projected the movie "The Age of Stupid", produced by WWF International and Greenpeace. The film, on climate change, has given the opportunity to the experts of ARPA Calabria and WWF to engage students on this issue. The Age of Stupid tells of an old man living alone in the devastated world of 2055, looking at “archive” footage from 2008, asking: why didn’t we stop climate change when we had the change?
ARPA Calabria
Regional Environmental Agency of Calabria
GEA (Group of Environmental Education)
School Institute
“Gesumino Pedullà” di
Siderno (RC)
“Ambientiamoci” (Get acclimatized) (2010)
The Group of Environmental Education of ARPACal organized a series of educational meetings on the following topics: influence of human behaviour on the environment and orientation towards eco-friendly ways of life. During the meeting there were talks on "global warming" and the effect it has on the climate, on the rising of the seas, and on the greater frequency of violent weather phenomena such as hurricanes, thunderstorms, tornadoes and floods.
ARPA Calabria Regional Environmental
Agency of Calabria GEA (Group of
Environmental Education) Technical Institute “Enzo Ferrari”, Chiaravalle (CZ)
“Safeguard and Protection of the Environment” (2011)
The purpose of the project is to raise awareness among students on the sustainable environmental behaviours in their life, for the protection of natural resources and in compliance with the law. The students addressed the correlation between industry and green house gases and human activities (industrial production, agriculture, waste management, etc..) as the main causes of the greenhouse effect and climate change.
ARPA Calabria Regional Environmental
Agency of Calabria GEA (Group of
Environmental Education)
University of Cosenza
School Institute “Fermi” (Reggio Calabria)
“From hydrogen bond to climate change" (2012)
Lecture given by prof. Emilio Spur of the Department of Ecology, University of Calabria, to the students of Fermi Institute of R. Calabria. During the lesson the teacher illustrated a study on the Mediterranean Sea, which shows that climate change is the cause of rising sea of changes in the marine flora and fauna but also new species of parasites such as Anisakis. Moreover, climate change is a threat to ecosystems and to human life as it has increased the frequency of some "extreme events" such as hurricanes and floods.
ARPA Sicilia Regional Environmental
Agency of Sicily
CESV MESSINA CEA Messina Onlus
European Solar Days: “The Sun Energy for the Earth” (2013)
During the European Solar Days 2013 ARPA Sicily organized a day dedicated to the "School for Sustainable Energy" to promote the knowledge of the correct use of solar energy. The students of the Schools of all levels of the territory of Messina submitted their work (drawings and models, designed and created for the occasion) during the exhibition held in the Hall of Flags in Palazzo Zanca.
Rete Clima® Clima Network
(Information and action for sustainability and the
fight against climate change)
Environmental education and Environmental training on climate. 2011- ongoing http://www.reteclima.it/educazione-e-formazione-ambientale-climatica/
Climate Network (Rete Clima ®) is a non-profit organization, founded in 2011 as a technical network for the promotion of sustainability and awareness to the climate change issue at the local scale. The network organized a series of learning paths for primary, secondary and high schools: laboratories for the construction of small-scale plants powered by renewable sources
teaching activities on scientific issues (environment, energy, sustainability, climate
248
change) for secondary schools summer camps for education to environmental sustainability
lessons on practices and actions for energy saving at home and at school
design and delivery of "green days" and environmental events for Schools.
Società Cooperativa “La
Lumaca”
Goodlink Srl
Let’s go to School of future! Feb-Apr 2013 http://www.lalumaca.org/stampa/archivio/andiamo-a-scuola-di-futuro
The Goodlink Company is the creator and promoter of the Green Social Festival and, in collaboration with the cooperative company “La Lumaca” organized the educational path "The school of future" for students and teachers of secondary schools in Emilia-Romagna. Classroom sessions and workshops were organized by specialized environmental educators.
Public awareness
At national level, the Ministry for the Environment, Land and Sea organised several communication
campaigns aimed at spreading environmental education and information at large.
Although no events specifically dedicated to climate change were organized, many of the communication
campaigns carried out were targeted at making children aware of environmental issues through the
organization of workshops.
Among the information and educational campaigns targeted at young people, in 2010 the "National Day
of the Tree" was established on 21th of November, with the aim of raising public awareness on the
importance of Italian and global arboreal and woodland heritage, on the protection of biodiversity,
climate change mitigation, prevention of landslide and flood risk, and land security.
In the 2012 edition, a competition was set up, the "Tree Master", open to primary and secondary schools,
inviting classrooms, pupils or interdisciplinary teams to develop journalistic surveys, reports,
documentaries or simple articles about the importance of the trees for human life and the ecosystem.
In 2013 edition, in collaboration with ISPRA, the Municipality of Rome and the Regional Park of Appia
Antica, several learning laboratories were organized for primary schools, with the aim to sensitize
children on the importance of Trees.
In 2010 it was also set up the “National Bike Day”, on the second Sunday of May, in collaboration with
the National Association of Italian Municipalities (ANCI) and the Italian Cycling Federation. The Bike Day
is organized in more than a thousand Italian municipalities.
Furthermore, in 2011 the Secretariat General of the MoE organized the Italian edition of the “European
Mobility Week: In Town without my car" from 16 to 22 September 2011. The EU campaign, now in its
tenth edition, has become over the years an international event that aims to encourage people to use
alternative means of transport than private cars. Its focal theme for 2013 "Clean Air! It's your move",
aims to make people aware on the link between motorized traffic and air pollution in urban areas,
highlighting the active role that each citizen can have in improving air quality through their mobility
choices. (http://www.minambiente.it/pagina/campagne-ed-iniziative).
Besides these National initiatives, that have involved many Italian cities, also Municipalities, Regional and
Provincial Administrations and Regional Environmental Agencies (ARPAs) have realized important
initiatives aimed at raising the awareness of citizens (young or adults) to climate change issues through
specific Communication Campaigns. Among these, ARPA Emilia Romagna is especially active in raising
awareness of public, citizens and young people to the issue of climate change through the
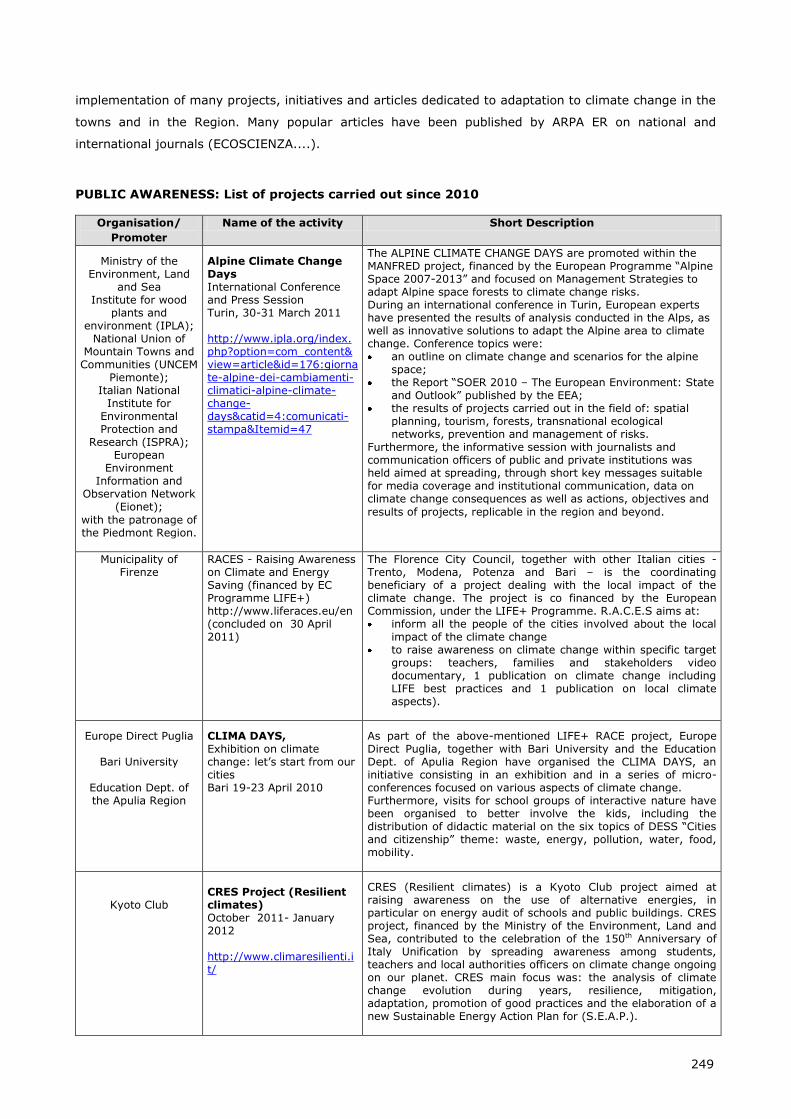
249
implementation of many projects, initiatives and articles dedicated to adaptation to climate change in the
towns and in the Region. Many popular articles have been published by ARPA ER on national and
international journals (ECOSCIENZA....).
PUBLIC AWARENESS: List of projects carried out since 2010
Organisation/
Promoter
Name of the activity Short Description
Ministry of the Environment, Land
and Sea Institute for wood
plants and environment (IPLA);
National Union of Mountain Towns and Communities (UNCEM
Piemonte); Italian National
Institute for Environmental Protection and
Research (ISPRA); European
Environment Information and
Observation Network (Eionet);
with the patronage of the Piedmont Region.
Alpine Climate Change Days International Conference and Press Session Turin, 30-31 March 2011 http://www.ipla.org/index.php?option=com_content&view=article&id=176:giornate-alpine-dei-cambiamenti-climatici-alpine-climate-change-days&catid=4:comunicati-stampa&Itemid=47
The ALPINE CLIMATE CHANGE DAYS are promoted within the MANFRED project, financed by the European Programme “Alpine Space 2007-2013” and focused on Management Strategies to adapt Alpine space forests to climate change risks. During an international conference in Turin, European experts have presented the results of analysis conducted in the Alps, as well as innovative solutions to adapt the Alpine area to climate change. Conference topics were: an outline on climate change and scenarios for the alpine
space; the Report “SOER 2010 – The European Environment: State
and Outlook” published by the EEA; the results of projects carried out in the field of: spatial
planning, tourism, forests, transnational ecological networks, prevention and management of risks.
Furthermore, the informative session with journalists and communication officers of public and private institutions was held aimed at spreading, through short key messages suitable for media coverage and institutional communication, data on climate change consequences as well as actions, objectives and
results of projects, replicable in the region and beyond.
Municipality of Firenze
RACES - Raising Awareness on Climate and Energy Saving (financed by EC Programme LIFE+) http://www.liferaces.eu/en (concluded on 30 April 2011)
The Florence City Council, together with other Italian cities - Trento, Modena, Potenza and Bari – is the coordinating beneficiary of a project dealing with the local impact of the climate change. The project is co financed by the European Commission, under the LIFE+ Programme. R.A.C.E.S aims at: inform all the people of the cities involved about the local
impact of the climate change to raise awareness on climate change within specific target
groups: teachers, families and stakeholders video documentary, 1 publication on climate change including LIFE best practices and 1 publication on local climate aspects).
Europe Direct Puglia
Bari University
Education Dept. of the Apulia Region
CLIMA DAYS, Exhibition on climate change: let’s start from our cities Bari 19-23 April 2010
As part of the above-mentioned LIFE+ RACE project, Europe Direct Puglia, together with Bari University and the Education Dept. of Apulia Region have organised the CLIMA DAYS, an initiative consisting in an exhibition and in a series of micro-conferences focused on various aspects of climate change. Furthermore, visits for school groups of interactive nature have been organised to better involve the kids, including the distribution of didactic material on the six topics of DESS “Cities and citizenship” theme: waste, energy, pollution, water, food, mobility.
Kyoto Club
CRES Project (Resilient climates) October 2011- January 2012 http://www.climaresilienti.it/
CRES (Resilient climates) is a Kyoto Club project aimed at raising awareness on the use of alternative energies, in particular on energy audit of schools and public buildings. CRES project, financed by the Ministry of the Environment, Land and Sea, contributed to the celebration of the 150th Anniversary of Italy Unification by spreading awareness among students, teachers and local authorities officers on climate change ongoing on our planet. CRES main focus was: the analysis of climate change evolution during years, resilience, mitigation, adaptation, promotion of good practices and the elaboration of a new Sustainable Energy Action Plan for (S.E.A.P.).
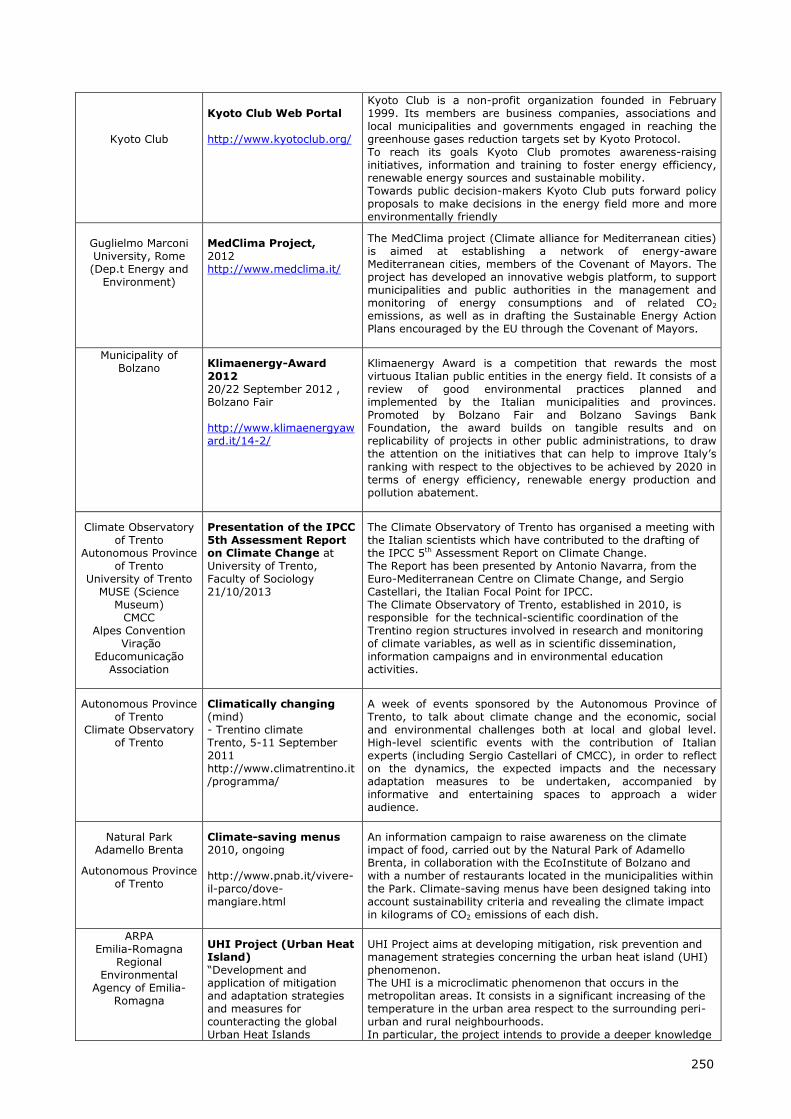
250
Kyoto Club
Kyoto Club Web Portal http://www.kyotoclub.org/
Kyoto Club is a non-profit organization founded in February 1999. Its members are business companies, associations and local municipalities and governments engaged in reaching the greenhouse gases reduction targets set by Kyoto Protocol. To reach its goals Kyoto Club promotes awareness-raising initiatives, information and training to foster energy efficiency, renewable energy sources and sustainable mobility. Towards public decision-makers Kyoto Club puts forward policy proposals to make decisions in the energy field more and more environmentally friendly
Guglielmo Marconi University, Rome (Dep.t Energy and
Environment)
MedClima Project, 2012 http://www.medclima.it/
The MedClima project (Climate alliance for Mediterranean cities) is aimed at establishing a network of energy-aware Mediterranean cities, members of the Covenant of Mayors. The project has developed an innovative webgis platform, to support municipalities and public authorities in the management and monitoring of energy consumptions and of related CO2 emissions, as well as in drafting the Sustainable Energy Action Plans encouraged by the EU through the Covenant of Mayors.
Municipality of Bolzano
Klimaenergy-Award 2012 20/22 September 2012 , Bolzano Fair http://www.klimaenergyaward.it/14-2/
Klimaenergy Award is a competition that rewards the most virtuous Italian public entities in the energy field. It consists of a review of good environmental practices planned and implemented by the Italian municipalities and provinces. Promoted by Bolzano Fair and Bolzano Savings Bank Foundation, the award builds on tangible results and on replicability of projects in other public administrations, to draw the attention on the initiatives that can help to improve Italy’s
ranking with respect to the objectives to be achieved by 2020 in terms of energy efficiency, renewable energy production and pollution abatement.
Climate Observatory of Trento
Autonomous Province of Trento
University of Trento MUSE (Science
Museum) CMCC
Alpes Convention Viração
Educomunicação Association
Presentation of the IPCC 5th Assessment Report on Climate Change at University of Trento, Faculty of Sociology 21/10/2013
The Climate Observatory of Trento has organised a meeting with the Italian scientists which have contributed to the drafting of the IPCC 5th Assessment Report on Climate Change. The Report has been presented by Antonio Navarra, from the Euro-Mediterranean Centre on Climate Change, and Sergio Castellari, the Italian Focal Point for IPCC. The Climate Observatory of Trento, established in 2010, is responsible for the technical-scientific coordination of the Trentino region structures involved in research and monitoring of climate variables, as well as in scientific dissemination, information campaigns and in environmental education activities.
Autonomous Province of Trento
Climate Observatory of Trento
Climatically changing (mind) - Trentino climate Trento, 5-11 September 2011 http://www.climatrentino.it/programma/
A week of events sponsored by the Autonomous Province of Trento, to talk about climate change and the economic, social and environmental challenges both at local and global level. High-level scientific events with the contribution of Italian experts (including Sergio Castellari of CMCC), in order to reflect on the dynamics, the expected impacts and the necessary adaptation measures to be undertaken, accompanied by informative and entertaining spaces to approach a wider audience.
Natural Park Adamello Brenta
Autonomous Province of Trento
Climate-saving menus 2010, ongoing http://www.pnab.it/vivere-il-parco/dove-mangiare.html
An information campaign to raise awareness on the climate impact of food, carried out by the Natural Park of Adamello Brenta, in collaboration with the EcoInstitute of Bolzano and with a number of restaurants located in the municipalities within the Park. Climate-saving menus have been designed taking into account sustainability criteria and revealing the climate impact in kilograms of CO2 emissions of each dish.
ARPA Emilia-Romagna
Regional Environmental
Agency of Emilia-Romagna
UHI Project (Urban Heat Island) “Development and application of mitigation and adaptation strategies and measures for counteracting the global Urban Heat Islands
UHI Project aims at developing mitigation, risk prevention and management strategies concerning the urban heat island (UHI) phenomenon. The UHI is a microclimatic phenomenon that occurs in the metropolitan areas. It consists in a significant increasing of the temperature in the urban area respect to the surrounding peri-urban and rural neighbourhoods. In particular, the project intends to provide a deeper knowledge
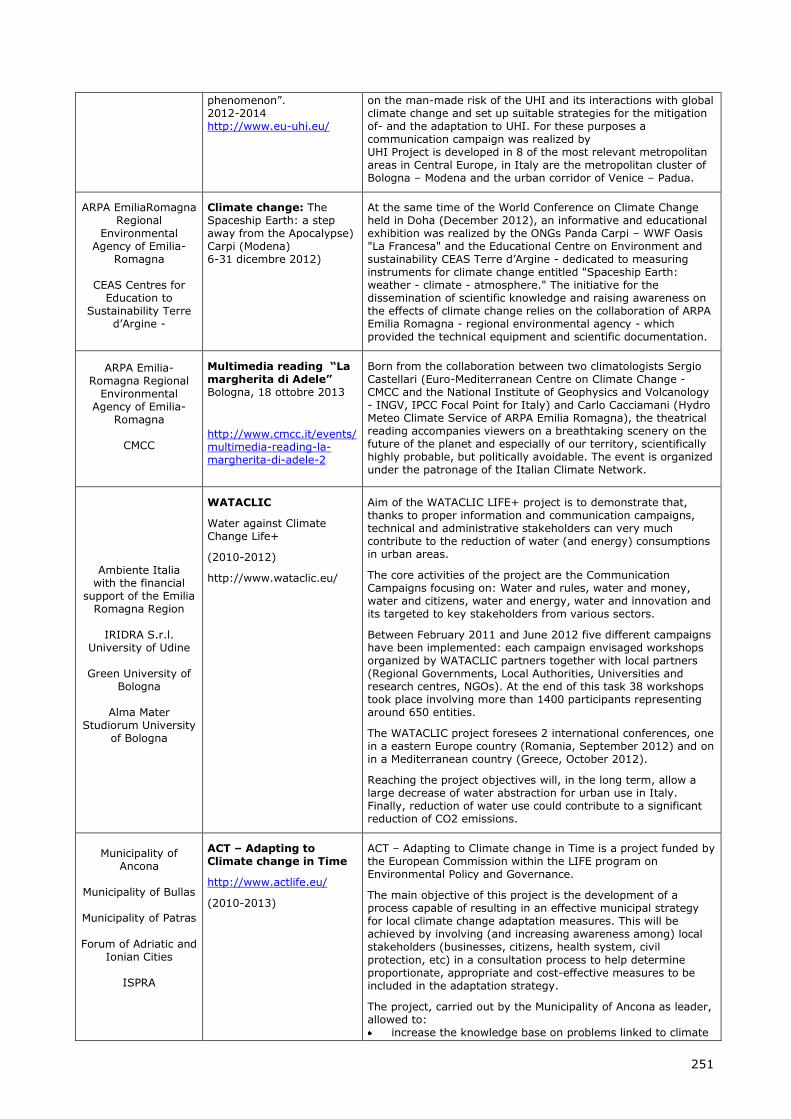
251
phenomenon”. 2012-2014 http://www.eu-uhi.eu/
on the man-made risk of the UHI and its interactions with global climate change and set up suitable strategies for the mitigation of- and the adaptation to UHI. For these purposes a communication campaign was realized by UHI Project is developed in 8 of the most relevant metropolitan areas in Central Europe, in Italy are the metropolitan cluster of Bologna – Modena and the urban corridor of Venice – Padua.
ARPA EmiliaRomagna Regional
Environmental Agency of Emilia-
Romagna
CEAS Centres for Education to
Sustainability Terre d’Argine -
Climate change: The Spaceship Earth: a step away from the Apocalypse) Carpi (Modena) 6-31 dicembre 2012)
At the same time of the World Conference on Climate Change held in Doha (December 2012), an informative and educational exhibition was realized by the ONGs Panda Carpi – WWF Oasis "La Francesa" and the Educational Centre on Environment and sustainability CEAS Terre d’Argine - dedicated to measuring instruments for climate change entitled "Spaceship Earth: weather - climate - atmosphere." The initiative for the dissemination of scientific knowledge and raising awareness on the effects of climate change relies on the collaboration of ARPA Emilia Romagna - regional environmental agency - which provided the technical equipment and scientific documentation.
ARPA Emilia-Romagna Regional
Environmental Agency of Emilia-
Romagna
CMCC
Multimedia reading “La margherita di Adele” Bologna, 18 ottobre 2013
http://www.cmcc.it/events/multimedia-reading-la-margherita-di-adele-2
Born from the collaboration between two climatologists Sergio Castellari (Euro-Mediterranean Centre on Climate Change - CMCC and the National Institute of Geophysics and Volcanology - INGV, IPCC Focal Point for Italy) and Carlo Cacciamani (Hydro Meteo Climate Service of ARPA Emilia Romagna), the theatrical reading accompanies viewers on a breathtaking scenery on the future of the planet and especially of our territory, scientifically highly probable, but politically avoidable. The event is organized under the patronage of the Italian Climate Network.
Ambiente Italia
with the financial support of the Emilia
Romagna Region
IRIDRA S.r.l. University of Udine
Green University of
Bologna
Alma Mater Studiorum University
of Bologna
WATACLIC
Water against Climate Change Life+
(2010-2012)
http://www.wataclic.eu/
Aim of the WATACLIC LIFE+ project is to demonstrate that, thanks to proper information and communication campaigns, technical and administrative stakeholders can very much contribute to the reduction of water (and energy) consumptions in urban areas.
The core activities of the project are the Communication Campaigns focusing on: Water and rules, water and money, water and citizens, water and energy, water and innovation and its targeted to key stakeholders from various sectors.
Between February 2011 and June 2012 five different campaigns have been implemented: each campaign envisaged workshops organized by WATACLIC partners together with local partners (Regional Governments, Local Authorities, Universities and research centres, NGOs). At the end of this task 38 workshops took place involving more than 1400 participants representing around 650 entities.
The WATACLIC project foresees 2 international conferences, one in a eastern Europe country (Romania, September 2012) and on in a Mediterranean country (Greece, October 2012).
Reaching the project objectives will, in the long term, allow a large decrease of water abstraction for urban use in Italy. Finally, reduction of water use could contribute to a significant reduction of CO2 emissions.
Municipality of
Ancona
Municipality of Bullas
Municipality of Patras
Forum of Adriatic and Ionian Cities
ISPRA
ACT – Adapting to Climate change in Time
http://www.actlife.eu/
(2010-2013)
ACT – Adapting to Climate change in Time is a project funded by the European Commission within the LIFE program on Environmental Policy and Governance.
The main objective of this project is the development of a process capable of resulting in an effective municipal strategy for local climate change adaptation measures. This will be achieved by involving (and increasing awareness among) local stakeholders (businesses, citizens, health system, civil
protection, etc) in a consultation process to help determine proportionate, appropriate and cost-effective measures to be included in the adaptation strategy.
The project, carried out by the Municipality of Ancona as leader, allowed to: increase the knowledge base on problems linked to climate
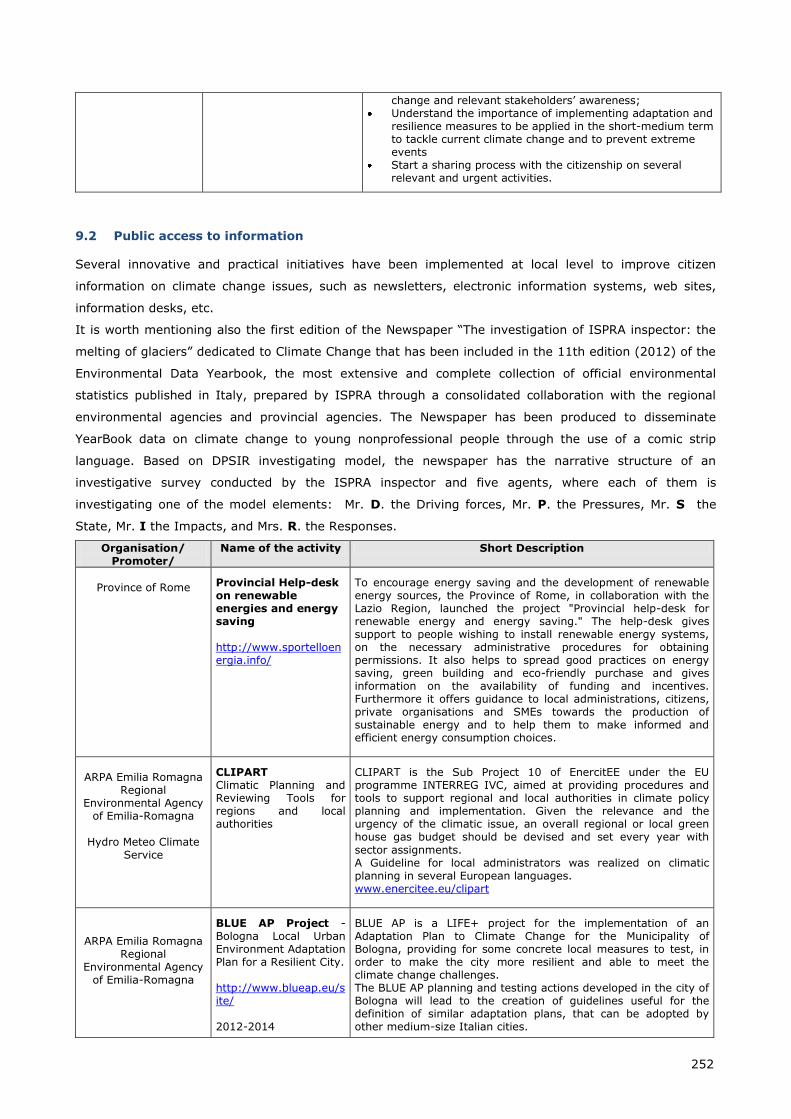
252
change and relevant stakeholders’ awareness; Understand the importance of implementing adaptation and
resilience measures to be applied in the short-medium term to tackle current climate change and to prevent extreme events
Start a sharing process with the citizenship on several relevant and urgent activities.
9.2 Public access to information
Several innovative and practical initiatives have been implemented at local level to improve citizen
information on climate change issues, such as newsletters, electronic information systems, web sites,
information desks, etc.
It is worth mentioning also the first edition of the Newspaper “The investigation of ISPRA inspector: the
melting of glaciers” dedicated to Climate Change that has been included in the 11th edition (2012) of the
Environmental Data Yearbook, the most extensive and complete collection of official environmental
statistics published in Italy, prepared by ISPRA through a consolidated collaboration with the regional
environmental agencies and provincial agencies. The Newspaper has been produced to disseminate
YearBook data on climate change to young nonprofessional people through the use of a comic strip
language. Based on DPSIR investigating model, the newspaper has the narrative structure of an
investigative survey conducted by the ISPRA inspector and five agents, where each of them is
investigating one of the model elements: Mr. D. the Driving forces, Mr. P. the Pressures, Mr. S the
State, Mr. I the Impacts, and Mrs. R. the Responses.
Organisation/ Promoter/
Name of the activity Short Description
Province of Rome
Provincial Help-desk on renewable energies and energy saving http://www.sportelloenergia.info/
To encourage energy saving and the development of renewable energy sources, the Province of Rome, in collaboration with the Lazio Region, launched the project "Provincial help-desk for renewable energy and energy saving." The help-desk gives support to people wishing to install renewable energy systems, on the necessary administrative procedures for obtaining permissions. It also helps to spread good practices on energy saving, green building and eco-friendly purchase and gives information on the availability of funding and incentives. Furthermore it offers guidance to local administrations, citizens, private organisations and SMEs towards the production of sustainable energy and to help them to make informed and efficient energy consumption choices.
ARPA Emilia Romagna
Regional Environmental Agency
of Emilia-Romagna
Hydro Meteo Climate Service
CLIPART Climatic Planning and Reviewing Tools for regions and local authorities
CLIPART is the Sub Project 10 of EnercitEE under the EU programme INTERREG IVC, aimed at providing procedures and tools to support regional and local authorities in climate policy planning and implementation. Given the relevance and the urgency of the climatic issue, an overall regional or local green house gas budget should be devised and set every year with
sector assignments. A Guideline for local administrators was realized on climatic planning in several European languages. www.enercitee.eu/clipart
ARPA Emilia Romagna
Regional Environmental Agency
of Emilia-Romagna
BLUE AP Project - Bologna Local Urban Environment Adaptation Plan for a Resilient City. http://www.blueap.eu/site/ 2012-2014
BLUE AP is a LIFE+ project for the implementation of an Adaptation Plan to Climate Change for the Municipality of Bologna, providing for some concrete local measures to test, in order to make the city more resilient and able to meet the climate change challenges. The BLUE AP planning and testing actions developed in the city of Bologna will lead to the creation of guidelines useful for the definition of similar adaptation plans, that can be adopted by other medium-size Italian cities.
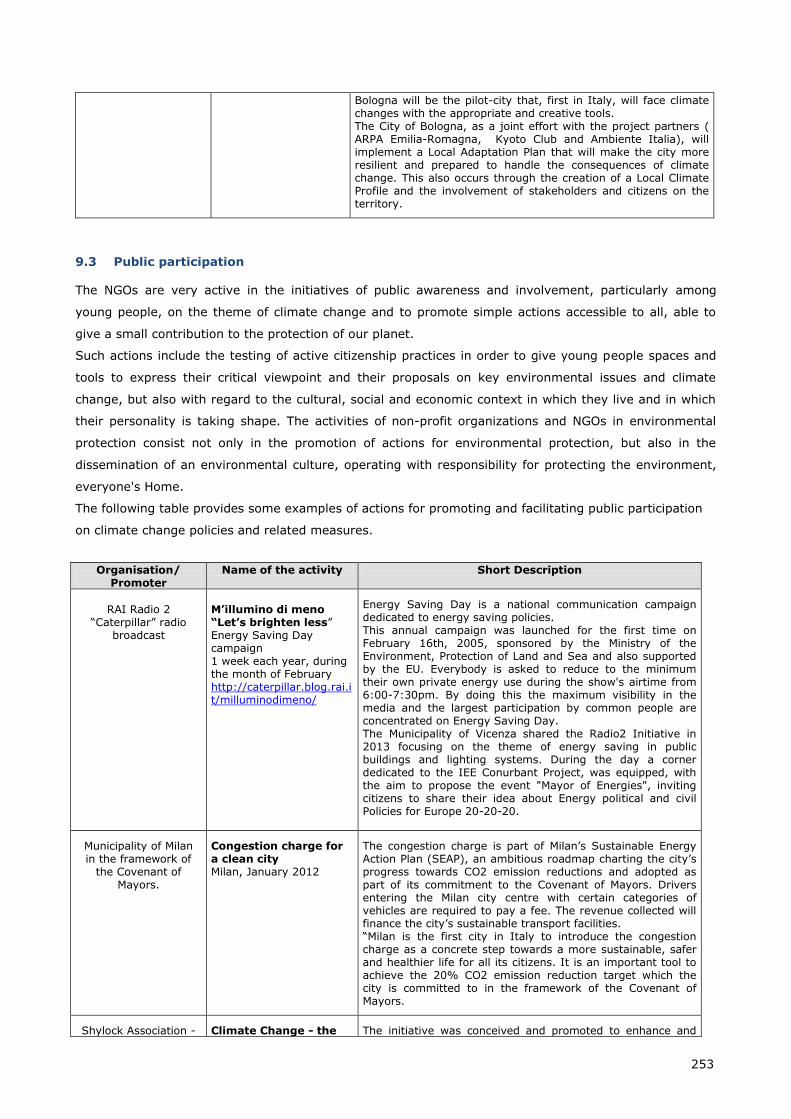
253
Bologna will be the pilot-city that, first in Italy, will face climate changes with the appropriate and creative tools. The City of Bologna, as a joint effort with the project partners ( ARPA Emilia-Romagna, Kyoto Club and Ambiente Italia), will implement a Local Adaptation Plan that will make the city more resilient and prepared to handle the consequences of climate change. This also occurs through the creation of a Local Climate Profile and the involvement of stakeholders and citizens on the territory.
9.3 Public participation
The NGOs are very active in the initiatives of public awareness and involvement, particularly among
young people, on the theme of climate change and to promote simple actions accessible to all, able to
give a small contribution to the protection of our planet.
Such actions include the testing of active citizenship practices in order to give young people spaces and
tools to express their critical viewpoint and their proposals on key environmental issues and climate
change, but also with regard to the cultural, social and economic context in which they live and in which
their personality is taking shape. The activities of non-profit organizations and NGOs in environmental
protection consist not only in the promotion of actions for environmental protection, but also in the
dissemination of an environmental culture, operating with responsibility for protecting the environment,
everyone's Home.
The following table provides some examples of actions for promoting and facilitating public participation
on climate change policies and related measures.
Organisation/
Promoter Name of the activity Short Description
RAI Radio 2
“Caterpillar” radio broadcast
M’illumino di meno “Let’s brighten less” Energy Saving Day campaign 1 week each year, during the month of February http://caterpillar.blog.rai.it/milluminodimeno/
Energy Saving Day is a national communication campaign dedicated to energy saving policies. This annual campaign was launched for the first time on February 16th, 2005, sponsored by the Ministry of the Environment, Protection of Land and Sea and also supported by the EU. Everybody is asked to reduce to the minimum their own private energy use during the show's airtime from 6:00-7:30pm. By doing this the maximum visibility in the media and the largest participation by common people are concentrated on Energy Saving Day. The Municipality of Vicenza shared the Radio2 Initiative in 2013 focusing on the theme of energy saving in public buildings and lighting systems. During the day a corner dedicated to the IEE Conurbant Project, was equipped, with the aim to propose the event "Mayor of Energies", inviting citizens to share their idea about Energy political and civil Policies for Europe 20-20-20.
Municipality of Milan in the framework of
the Covenant of Mayors.
Congestion charge for a clean city Milan, January 2012
The congestion charge is part of Milan’s Sustainable Energy Action Plan (SEAP), an ambitious roadmap charting the city’s progress towards CO2 emission reductions and adopted as part of its commitment to the Covenant of Mayors. Drivers entering the Milan city centre with certain categories of vehicles are required to pay a fee. The revenue collected will finance the city’s sustainable transport facilities. “Milan is the first city in Italy to introduce the congestion charge as a concrete step towards a more sustainable, safer and healthier life for all its citizens. It is an important tool to achieve the 20% CO2 emission reduction target which the city is committed to in the framework of the Covenant of Mayors.
Shylock Association - Climate Change - the The initiative was conceived and promoted to enhance and
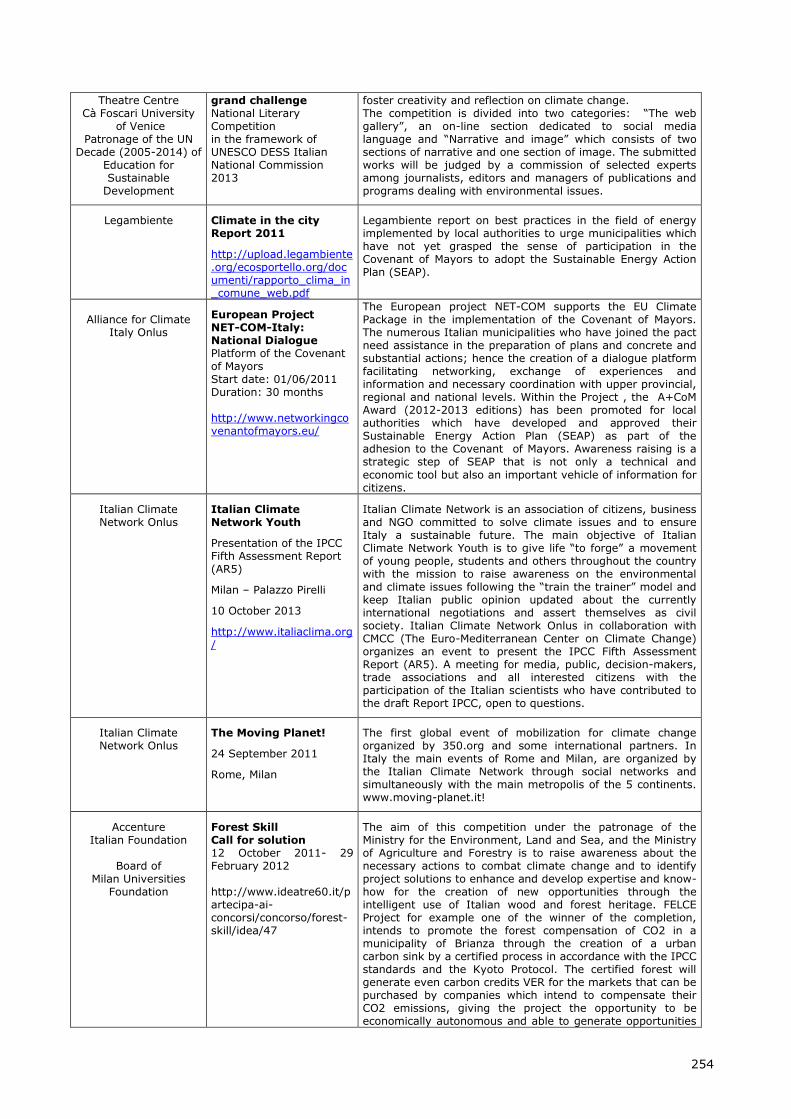
254
Theatre Centre Cà Foscari University
of Venice Patronage of the UN
Decade (2005-2014) of Education for Sustainable
Development
grand challenge National Literary Competition in the framework of UNESCO DESS Italian National Commission 2013
foster creativity and reflection on climate change. The competition is divided into two categories: “The web gallery”, an on-line section dedicated to social media language and “Narrative and image” which consists of two sections of narrative and one section of image. The submitted works will be judged by a commission of selected experts among journalists, editors and managers of publications and programs dealing with environmental issues.
Legambiente
Climate in the city Report 2011
http://upload.legambiente.org/ecosportello.org/documenti/rapporto_clima_in_comune_web.pdf
Legambiente report on best practices in the field of energy implemented by local authorities to urge municipalities which have not yet grasped the sense of participation in the Covenant of Mayors to adopt the Sustainable Energy Action Plan (SEAP).
Alliance for Climate
Italy Onlus
European Project NET-COM-Italy: National Dialogue Platform of the Covenant of Mayors Start date: 01/06/2011 Duration: 30 months http://www.networkingcovenantofmayors.eu/
The European project NET-COM supports the EU Climate Package in the implementation of the Covenant of Mayors. The numerous Italian municipalities who have joined the pact need assistance in the preparation of plans and concrete and substantial actions; hence the creation of a dialogue platform facilitating networking, exchange of experiences and information and necessary coordination with upper provincial, regional and national levels. Within the Project , the A+CoM Award (2012-2013 editions) has been promoted for local authorities which have developed and approved their Sustainable Energy Action Plan (SEAP) as part of the adhesion to the Covenant of Mayors. Awareness raising is a strategic step of SEAP that is not only a technical and
economic tool but also an important vehicle of information for citizens.
Italian Climate Network Onlus
Italian Climate Network Youth
Presentation of the IPCC Fifth Assessment Report (AR5)
Milan – Palazzo Pirelli
10 October 2013
http://www.italiaclima.org/
Italian Climate Network is an association of citizens, business and NGO committed to solve climate issues and to ensure Italy a sustainable future. The main objective of Italian Climate Network Youth is to give life “to forge” a movement of young people, students and others throughout the country with the mission to raise awareness on the environmental and climate issues following the “train the trainer” model and keep Italian public opinion updated about the currently international negotiations and assert themselves as civil society. Italian Climate Network Onlus in collaboration with CMCC (The Euro-Mediterranean Center on Climate Change) organizes an event to present the IPCC Fifth Assessment Report (AR5). A meeting for media, public, decision-makers, trade associations and all interested citizens with the participation of the Italian scientists who have contributed to the draft Report IPCC, open to questions.
Italian Climate Network Onlus
The Moving Planet!
24 September 2011
Rome, Milan
The first global event of mobilization for climate change organized by 350.org and some international partners. In Italy the main events of Rome and Milan, are organized by the Italian Climate Network through social networks and simultaneously with the main metropolis of the 5 continents. www.moving-planet.it!
Accenture Italian Foundation
Board of
Milan Universities Foundation
Forest Skill Call for solution 12 October 2011- 29 February 2012 http://www.ideatre60.it/partecipa-ai-concorsi/concorso/forest-skill/idea/47
The aim of this competition under the patronage of the Ministry for the Environment, Land and Sea, and the Ministry of Agriculture and Forestry is to raise awareness about the necessary actions to combat climate change and to identify project solutions to enhance and develop expertise and know-how for the creation of new opportunities through the intelligent use of Italian wood and forest heritage. FELCE Project for example one of the winner of the completion, intends to promote the forest compensation of CO2 in a municipality of Brianza through the creation of a urban carbon sink by a certified process in accordance with the IPCC standards and the Kyoto Protocol. The certified forest will generate even carbon credits VER for the markets that can be purchased by companies which intend to compensate their CO2 emissions, giving the project the opportunity to be economically autonomous and able to generate opportunities
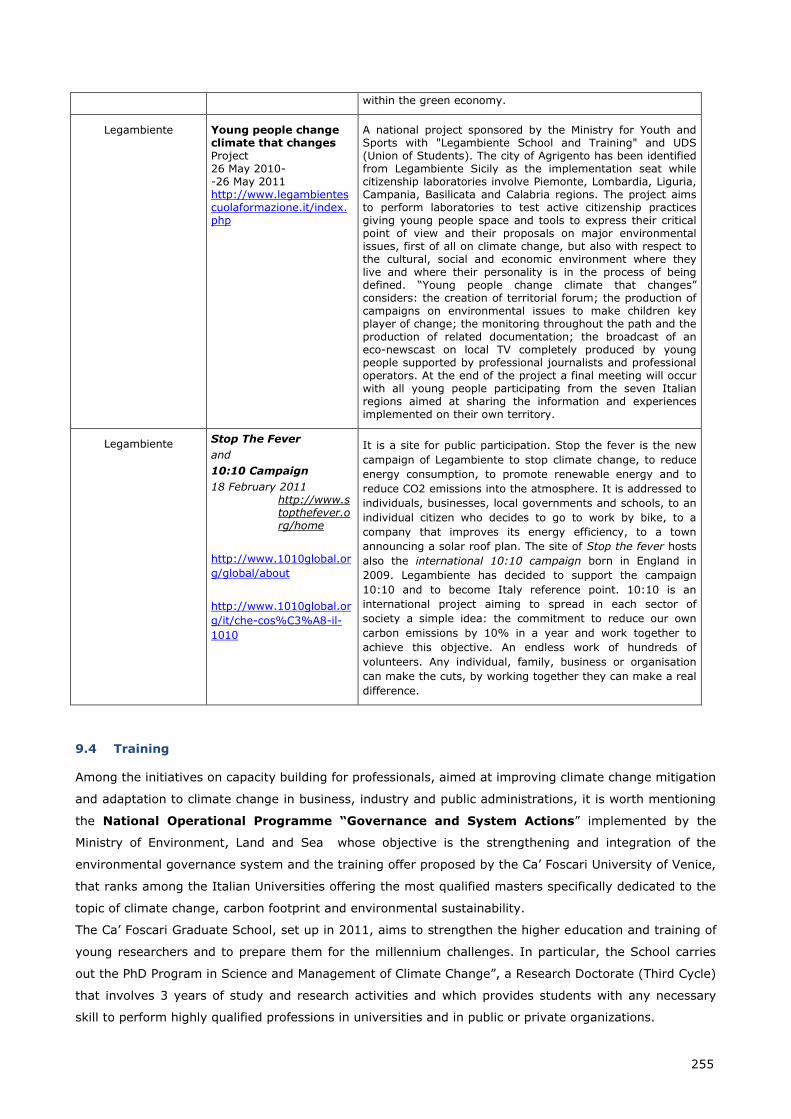
255
within the green economy.
Legambiente
Young people change climate that changes Project 26 May 2010- -26 May 2011 http://www.legambientescuolaformazione.it/index.php
A national project sponsored by the Ministry for Youth and Sports with "Legambiente School and Training" and UDS (Union of Students). The city of Agrigento has been identified from Legambiente Sicily as the implementation seat while citizenship laboratories involve Piemonte, Lombardia, Liguria, Campania, Basilicata and Calabria regions. The project aims to perform laboratories to test active citizenship practices giving young people space and tools to express their critical point of view and their proposals on major environmental issues, first of all on climate change, but also with respect to the cultural, social and economic environment where they live and where their personality is in the process of being defined. “Young people change climate that changes” considers: the creation of territorial forum; the production of campaigns on environmental issues to make children key player of change; the monitoring throughout the path and the production of related documentation; the broadcast of an eco-newscast on local TV completely produced by young people supported by professional journalists and professional operators. At the end of the project a final meeting will occur with all young people participating from the seven Italian regions aimed at sharing the information and experiences implemented on their own territory.
Legambiente
Stop The Fever
and
10:10 Campaign
18 February 2011 http://www.stopthefever.org/home
http://www.1010global.or
g/global/about
http://www.1010global.or
g/it/che-cos%C3%A8-il-
1010
It is a site for public participation. Stop the fever is the new
campaign of Legambiente to stop climate change, to reduce
energy consumption, to promote renewable energy and to
reduce CO2 emissions into the atmosphere. It is addressed to
individuals, businesses, local governments and schools, to an
individual citizen who decides to go to work by bike, to a
company that improves its energy efficiency, to a town
announcing a solar roof plan. The site of Stop the fever hosts
also the international 10:10 campaign born in England in
2009. Legambiente has decided to support the campaign
10:10 and to become Italy reference point. 10:10 is an
international project aiming to spread in each sector of
society a simple idea: the commitment to reduce our own
carbon emissions by 10% in a year and work together to
achieve this objective. An endless work of hundreds of
volunteers. Any individual, family, business or organisation
can make the cuts, by working together they can make a real
difference.
9.4 Training
Among the initiatives on capacity building for professionals, aimed at improving climate change mitigation
and adaptation to climate change in business, industry and public administrations, it is worth mentioning
the National Operational Programme “Governance and System Actions” implemented by the
Ministry of Environment, Land and Sea whose objective is the strengthening and integration of the
environmental governance system and the training offer proposed by the Ca’ Foscari University of Venice,
that ranks among the Italian Universities offering the most qualified masters specifically dedicated to the
topic of climate change, carbon footprint and environmental sustainability.
The Ca’ Foscari Graduate School, set up in 2011, aims to strengthen the higher education and training of
young researchers and to prepare them for the millennium challenges. In particular, the School carries
out the PhD Program in Science and Management of Climate Change”, a Research Doctorate (Third Cycle)
that involves 3 years of study and research activities and which provides students with any necessary
skill to perform highly qualified professions in universities and in public or private organizations.
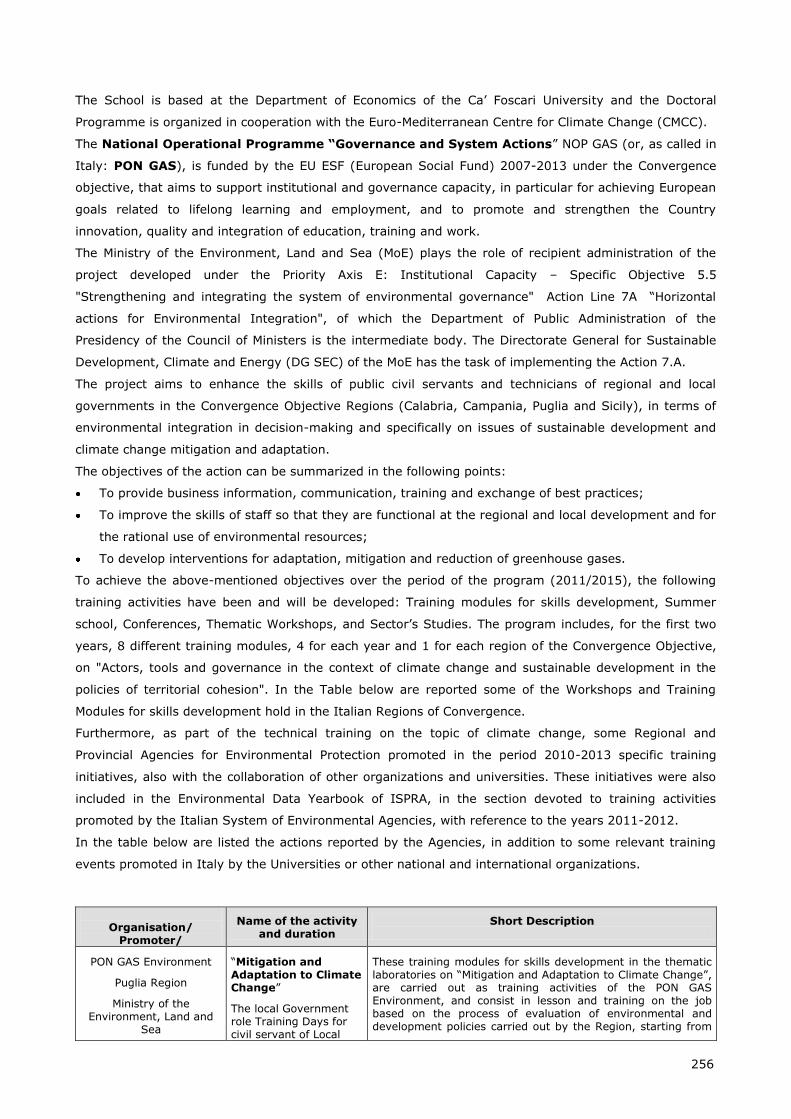
256
The School is based at the Department of Economics of the Ca’ Foscari University and the Doctoral
Programme is organized in cooperation with the Euro-Mediterranean Centre for Climate Change (CMCC).
The National Operational Programme “Governance and System Actions” NOP GAS (or, as called in
Italy: PON GAS), is funded by the EU ESF (European Social Fund) 2007-2013 under the Convergence
objective, that aims to support institutional and governance capacity, in particular for achieving European
goals related to lifelong learning and employment, and to promote and strengthen the Country
innovation, quality and integration of education, training and work.
The Ministry of the Environment, Land and Sea (MoE) plays the role of recipient administration of the
project developed under the Priority Axis E: Institutional Capacity – Specific Objective 5.5
"Strengthening and integrating the system of environmental governance" Action Line 7A “Horizontal
actions for Environmental Integration", of which the Department of Public Administration of the
Presidency of the Council of Ministers is the intermediate body. The Directorate General for Sustainable
Development, Climate and Energy (DG SEC) of the MoE has the task of implementing the Action 7.A.
The project aims to enhance the skills of public civil servants and technicians of regional and local
governments in the Convergence Objective Regions (Calabria, Campania, Puglia and Sicily), in terms of
environmental integration in decision-making and specifically on issues of sustainable development and
climate change mitigation and adaptation.
The objectives of the action can be summarized in the following points:
To provide business information, communication, training and exchange of best practices;
To improve the skills of staff so that they are functional at the regional and local development and for
the rational use of environmental resources;
To develop interventions for adaptation, mitigation and reduction of greenhouse gases.
To achieve the above-mentioned objectives over the period of the program (2011/2015), the following
training activities have been and will be developed: Training modules for skills development, Summer
school, Conferences, Thematic Workshops, and Sector’s Studies. The program includes, for the first two
years, 8 different training modules, 4 for each year and 1 for each region of the Convergence Objective,
on "Actors, tools and governance in the context of climate change and sustainable development in the
policies of territorial cohesion". In the Table below are reported some of the Workshops and Training
Modules for skills development hold in the Italian Regions of Convergence.
Furthermore, as part of the technical training on the topic of climate change, some Regional and
Provincial Agencies for Environmental Protection promoted in the period 2010-2013 specific training
initiatives, also with the collaboration of other organizations and universities. These initiatives were also
included in the Environmental Data Yearbook of ISPRA, in the section devoted to training activities
promoted by the Italian System of Environmental Agencies, with reference to the years 2011-2012.
In the table below are listed the actions reported by the Agencies, in addition to some relevant training
events promoted in Italy by the Universities or other national and international organizations.
Organisation/
Promoter/
Name of the activity and duration
Short Description
PON GAS Environment
Puglia Region
Ministry of the Environment, Land and
Sea
“Mitigation and Adaptation to Climate Change”
The local Government role Training Days for civil servant of Local
These training modules for skills development in the thematic laboratories on “Mitigation and Adaptation to Climate Change”, are carried out as training activities of the PON GAS Environment, and consist in lesson and training on the job based on the process of evaluation of environmental and development policies carried out by the Region, starting from
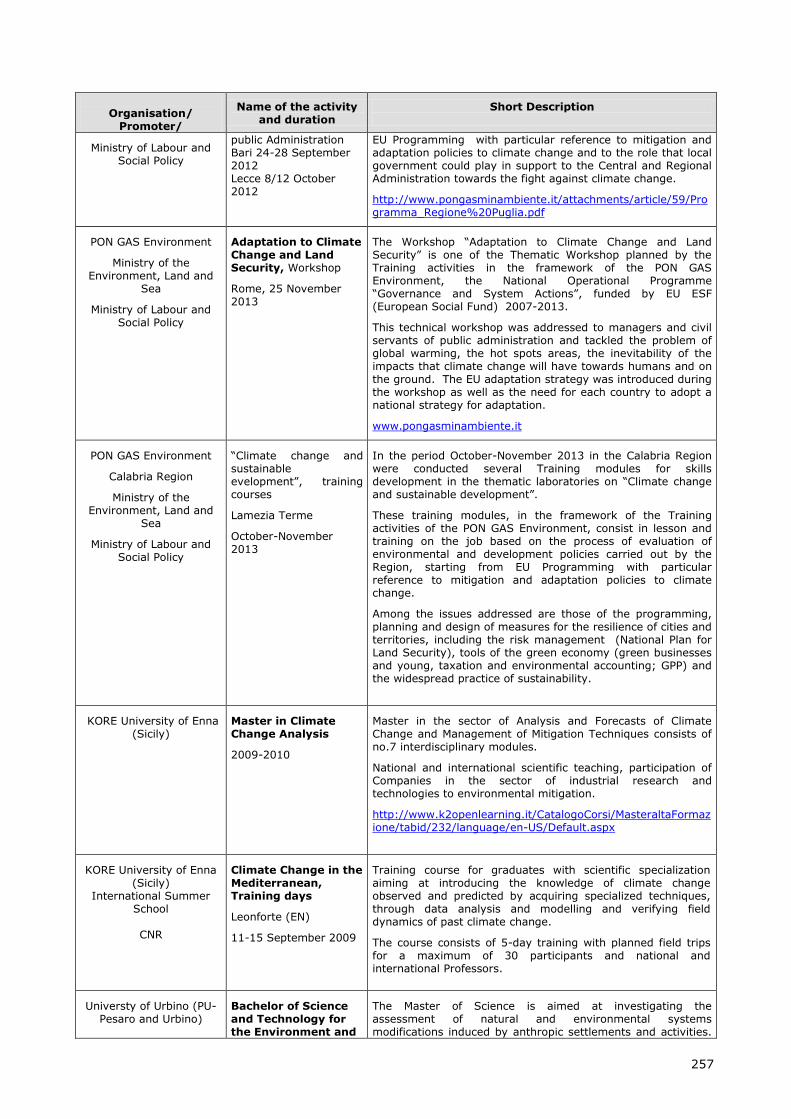
257
Organisation/
Promoter/
Name of the activity and duration
Short Description
Ministry of Labour and Social Policy
public Administration Bari 24-28 September 2012 Lecce 8/12 October 2012
EU Programming with particular reference to mitigation and adaptation policies to climate change and to the role that local government could play in support to the Central and Regional Administration towards the fight against climate change.
http://www.pongasminambiente.it/attachments/article/59/Programma_Regione%20Puglia.pdf
PON GAS Environment
Ministry of the Environment, Land and
Sea
Ministry of Labour and Social Policy
Adaptation to Climate Change and Land Security, Workshop
Rome, 25 November 2013
The Workshop “Adaptation to Climate Change and Land Security” is one of the Thematic Workshop planned by the Training activities in the framework of the PON GAS Environment, the National Operational Programme “Governance and System Actions”, funded by EU ESF (European Social Fund) 2007-2013.
This technical workshop was addressed to managers and civil servants of public administration and tackled the problem of global warming, the hot spots areas, the inevitability of the impacts that climate change will have towards humans and on the ground. The EU adaptation strategy was introduced during the workshop as well as the need for each country to adopt a national strategy for adaptation.
www.pongasminambiente.it
PON GAS Environment
Calabria Region
Ministry of the Environment, Land and
Sea
Ministry of Labour and Social Policy
“Climate change and sustainable evelopment”, training courses
Lamezia Terme
October-November 2013
In the period October-November 2013 in the Calabria Region were conducted several Training modules for skills development in the thematic laboratories on “Climate change and sustainable development”.
These training modules, in the framework of the Training activities of the PON GAS Environment, consist in lesson and training on the job based on the process of evaluation of environmental and development policies carried out by the Region, starting from EU Programming with particular reference to mitigation and adaptation policies to climate change.
Among the issues addressed are those of the programming, planning and design of measures for the resilience of cities and territories, including the risk management (National Plan for Land Security), tools of the green economy (green businesses and young, taxation and environmental accounting; GPP) and the widespread practice of sustainability.
KORE University of Enna (Sicily)
Master in Climate Change Analysis
2009-2010
Master in the sector of Analysis and Forecasts of Climate Change and Management of Mitigation Techniques consists of no.7 interdisciplinary modules.
National and international scientific teaching, participation of Companies in the sector of industrial research and technologies to environmental mitigation.
http://www.k2openlearning.it/CatalogoCorsi/MasteraltaFormazione/tabid/232/language/en-US/Default.aspx
KORE University of Enna (Sicily)
International Summer School
CNR
Climate Change in the Mediterranean, Training days
Leonforte (EN)
11-15 September 2009
Training course for graduates with scientific specialization aiming at introducing the knowledge of climate change observed and predicted by acquiring specialized techniques, through data analysis and modelling and verifying field dynamics of past climate change.
The course consists of 5-day training with planned field trips for a maximum of 30 participants and national and international Professors.
Universty of Urbino (PU- Pesaro and Urbino)
Bachelor of Science and Technology for the Environment and
The Master of Science is aimed at investigating the assessment of natural and environmental systems modifications induced by anthropic settlements and activities.
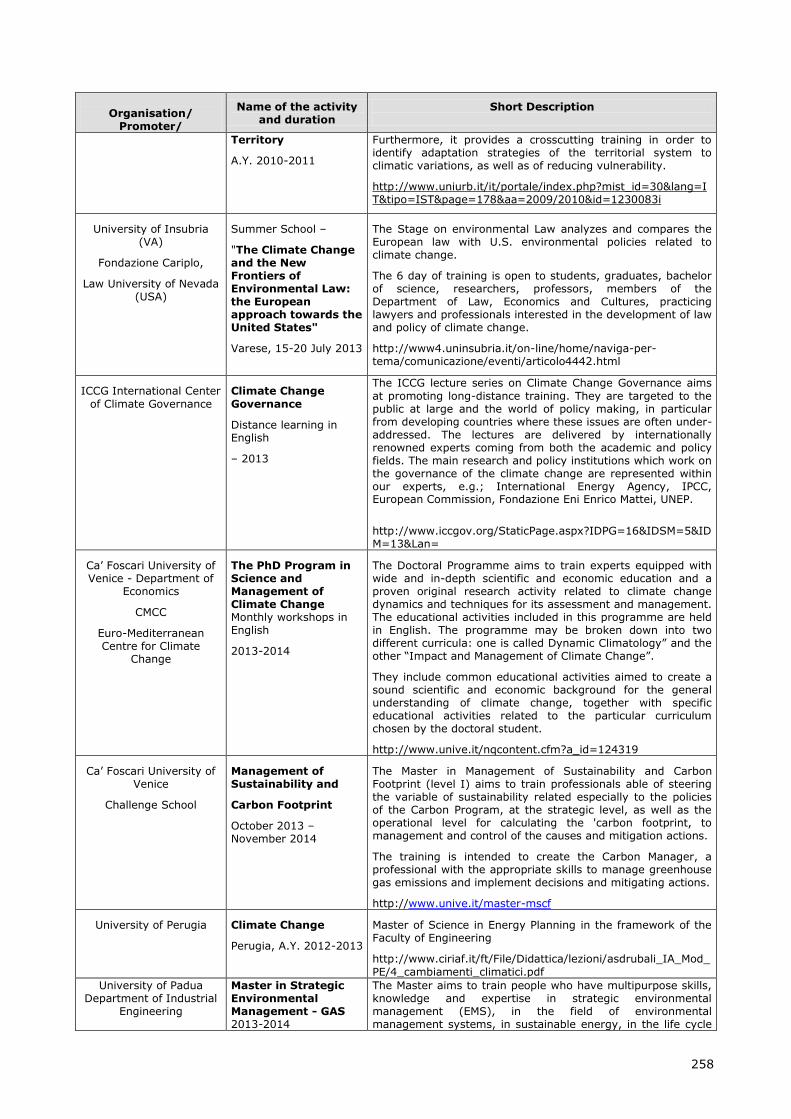
258
Organisation/
Promoter/
Name of the activity and duration
Short Description
Territory
A.Y. 2010-2011
Furthermore, it provides a crosscutting training in order to identify adaptation strategies of the territorial system to climatic variations, as well as of reducing vulnerability.
http://www.uniurb.it/it/portale/index.php?mist_id=30&lang=IT&tipo=IST&page=178&aa=2009/2010&id=1230083i
University of Insubria (VA)
Fondazione Cariplo,
Law University of Nevada (USA)
Summer School –
"The Climate Change and the New Frontiers of Environmental Law: the European approach towards the United States"
Varese, 15-20 July 2013
The Stage on environmental Law analyzes and compares the European law with U.S. environmental policies related to climate change.
The 6 day of training is open to students, graduates, bachelor of science, researchers, professors, members of the Department of Law, Economics and Cultures, practicing lawyers and professionals interested in the development of law and policy of climate change.
http://www4.uninsubria.it/on-line/home/naviga-per-tema/comunicazione/eventi/articolo4442.html
ICCG International Center
of Climate Governance
Climate Change
Governance
Distance learning in English
– 2013
The ICCG lecture series on Climate Change Governance aims
at promoting long-distance training. They are targeted to the public at large and the world of policy making, in particular from developing countries where these issues are often under-addressed. The lectures are delivered by internationally renowned experts coming from both the academic and policy fields. The main research and policy institutions which work on the governance of the climate change are represented within our experts, e.g.; International Energy Agency, IPCC, European Commission, Fondazione Eni Enrico Mattei, UNEP.
http://www.iccgov.org/StaticPage.aspx?IDPG=16&IDSM=5&IDM=13&Lan=
Ca’ Foscari University of Venice - Department of
Economics
CMCC
Euro-Mediterranean Centre for Climate
Change
The PhD Program in Science and Management of Climate Change Monthly workshops in English
2013-2014
The Doctoral Programme aims to train experts equipped with wide and in-depth scientific and economic education and a proven original research activity related to climate change dynamics and techniques for its assessment and management. The educational activities included in this programme are held in English. The programme may be broken down into two different curricula: one is called Dynamic Climatology” and the other “Impact and Management of Climate Change”.
They include common educational activities aimed to create a sound scientific and economic background for the general understanding of climate change, together with specific educational activities related to the particular curriculum chosen by the doctoral student.
http://www.unive.it/nqcontent.cfm?a_id=124319
Ca’ Foscari University of Venice
Challenge School
Management of Sustainability and
Carbon Footprint
October 2013 – November 2014
The Master in Management of Sustainability and Carbon Footprint (level I) aims to train professionals able of steering the variable of sustainability related especially to the policies of the Carbon Program, at the strategic level, as well as the operational level for calculating the 'carbon footprint, to management and control of the causes and mitigation actions.
The training is intended to create the Carbon Manager, a professional with the appropriate skills to manage greenhouse gas emissions and implement decisions and mitigating actions.
http://www.unive.it/master-mscf
University of Perugia
Climate Change
Perugia, A.Y. 2012-2013
Master of Science in Energy Planning in the framework of the Faculty of Engineering
http://www.ciriaf.it/ft/File/Didattica/lezioni/asdrubali_IA_Mod_
PE/4_cambiamenti_climatici.pdf
University of Padua Department of Industrial
Engineering
Master in Strategic Environmental Management - GAS 2013-2014
The Master aims to train people who have multipurpose skills, knowledge and expertise in strategic environmental management (EMS), in the field of environmental management systems, in sustainable energy, in the life cycle
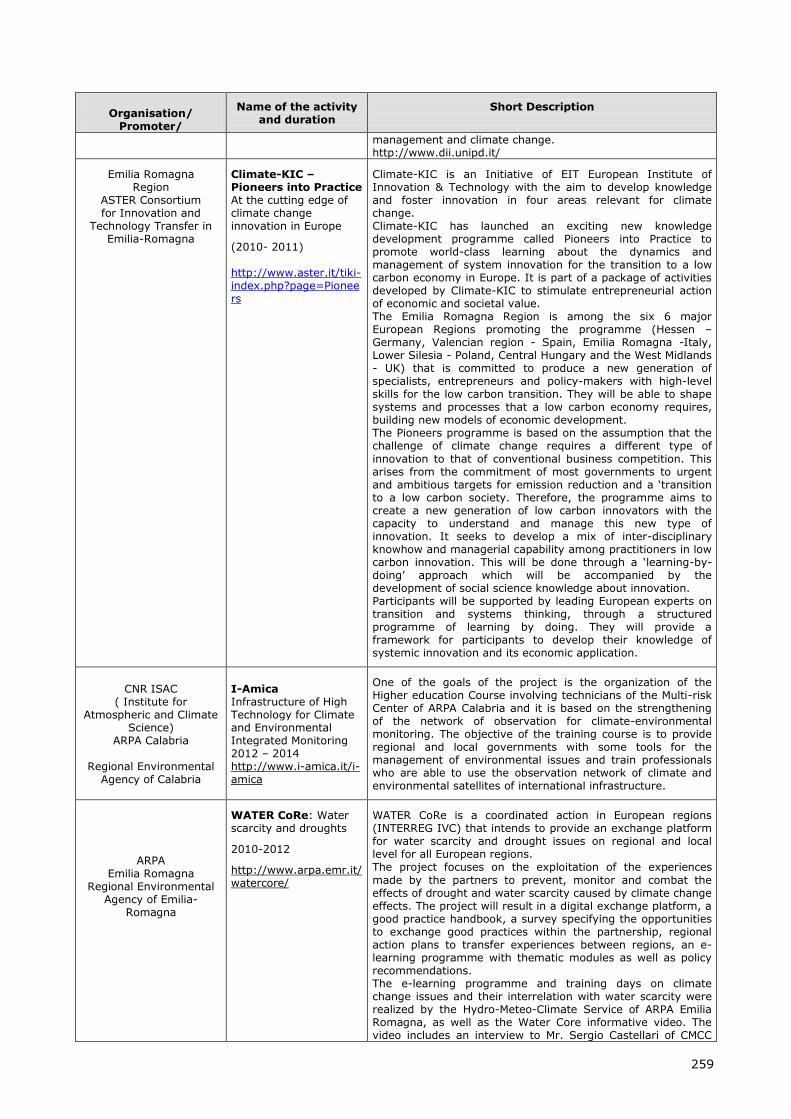
259
Organisation/
Promoter/
Name of the activity and duration
Short Description
management and climate change. http://www.dii.unipd.it/
Emilia Romagna Region
ASTER Consortium for Innovation and
Technology Transfer in Emilia-Romagna
Climate-KIC – Pioneers into Practice At the cutting edge of climate change innovation in Europe
(2010- 2011) http://www.aster.it/tiki-index.php?page=Pioneers
Climate-KIC is an Initiative of EIT European Institute of Innovation & Technology with the aim to develop knowledge and foster innovation in four areas relevant for climate change. Climate-KIC has launched an exciting new knowledge development programme called Pioneers into Practice to promote world-class learning about the dynamics and management of system innovation for the transition to a low carbon economy in Europe. It is part of a package of activities developed by Climate-KIC to stimulate entrepreneurial action of economic and societal value. The Emilia Romagna Region is among the six 6 major European Regions promoting the programme (Hessen –Germany, Valencian region - Spain, Emilia Romagna -Italy, Lower Silesia - Poland, Central Hungary and the West Midlands - UK) that is committed to produce a new generation of specialists, entrepreneurs and policy-makers with high-level skills for the low carbon transition. They will be able to shape systems and processes that a low carbon economy requires, building new models of economic development. The Pioneers programme is based on the assumption that the challenge of climate change requires a different type of
innovation to that of conventional business competition. This arises from the commitment of most governments to urgent and ambitious targets for emission reduction and a ‘transition to a low carbon society. Therefore, the programme aims to create a new generation of low carbon innovators with the capacity to understand and manage this new type of innovation. It seeks to develop a mix of inter-disciplinary knowhow and managerial capability among practitioners in low carbon innovation. This will be done through a ‘learning-by-doing’ approach which will be accompanied by the development of social science knowledge about innovation. Participants will be supported by leading European experts on transition and systems thinking, through a structured programme of learning by doing. They will provide a framework for participants to develop their knowledge of systemic innovation and its economic application.
CNR ISAC ( Institute for
Atmospheric and Climate Science)
ARPA Calabria
Regional Environmental Agency of Calabria
I-Amica Infrastructure of High Technology for Climate and Environmental Integrated Monitoring 2012 – 2014 http://www.i-amica.it/i-amica
One of the goals of the project is the organization of the Higher education Course involving technicians of the Multi-risk Center of ARPA Calabria and it is based on the strengthening of the network of observation for climate-environmental monitoring. The objective of the training course is to provide regional and local governments with some tools for the management of environmental issues and train professionals who are able to use the observation network of climate and environmental satellites of international infrastructure.
ARPA Emilia Romagna
Regional Environmental Agency of Emilia-
Romagna
WATER CoRe: Water scarcity and droughts
2010-2012
http://www.arpa.emr.it/watercore/
WATER CoRe is a coordinated action in European regions (INTERREG IVC) that intends to provide an exchange platform for water scarcity and drought issues on regional and local level for all European regions. The project focuses on the exploitation of the experiences
made by the partners to prevent, monitor and combat the effects of drought and water scarcity caused by climate change effects. The project will result in a digital exchange platform, a good practice handbook, a survey specifying the opportunities to exchange good practices within the partnership, regional action plans to transfer experiences between regions, an e-learning programme with thematic modules as well as policy recommendations. The e-learning programme and training days on climate change issues and their interrelation with water scarcity were realized by the Hydro-Meteo-Climate Service of ARPA Emilia Romagna, as well as the Water Core informative video. The video includes an interview to Mr. Sergio Castellari of CMCC
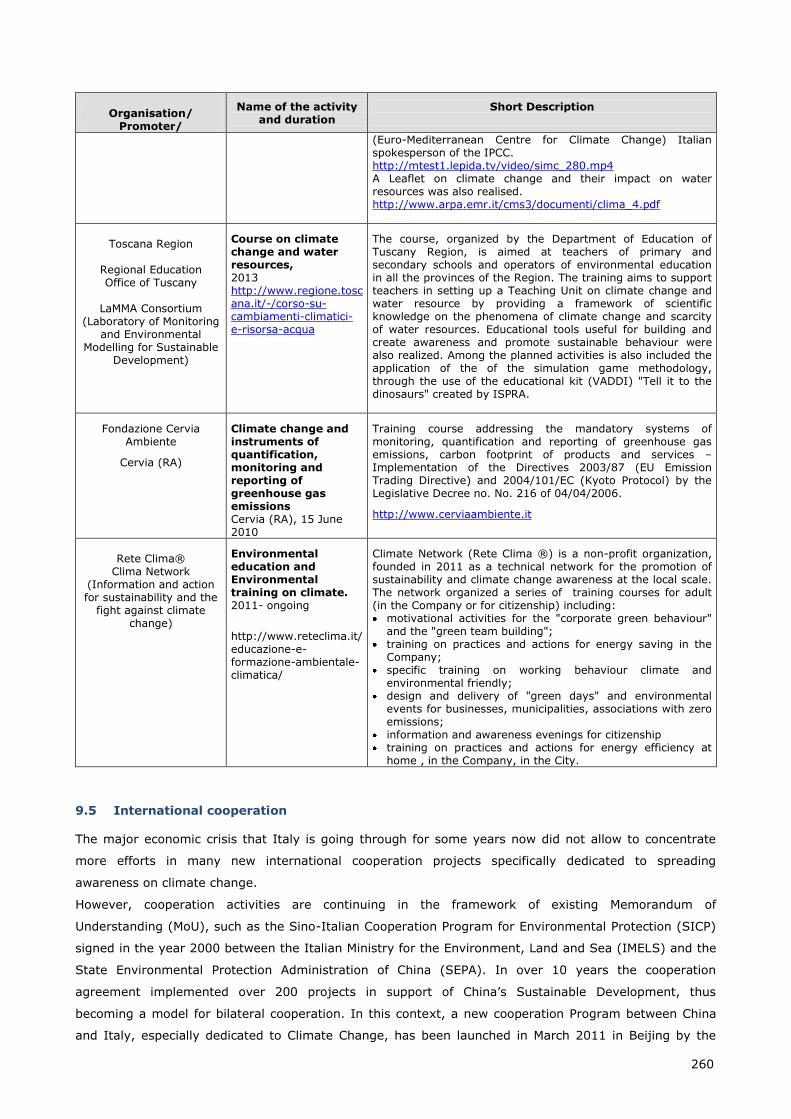
260
Organisation/
Promoter/
Name of the activity and duration
Short Description
(Euro-Mediterranean Centre for Climate Change) Italian spokesperson of the IPCC. http://mtest1.lepida.tv/video/simc_280.mp4 A Leaflet on climate change and their impact on water resources was also realised. http://www.arpa.emr.it/cms3/documenti/clima_4.pdf
Toscana Region
Regional Education Office of Tuscany
LaMMA Consortium
(Laboratory of Monitoring and Environmental
Modelling for Sustainable Development)
Course on climate change and water resources, 2013 http://www.regione.toscana.it/-/corso-su-cambiamenti-climatici-e-risorsa-acqua
The course, organized by the Department of Education of Tuscany Region, is aimed at teachers of primary and secondary schools and operators of environmental education in all the provinces of the Region. The training aims to support teachers in setting up a Teaching Unit on climate change and water resource by providing a framework of scientific knowledge on the phenomena of climate change and scarcity of water resources. Educational tools useful for building and create awareness and promote sustainable behaviour were also realized. Among the planned activities is also included the application of the of the simulation game methodology, through the use of the educational kit (VADDI) "Tell it to the dinosaurs" created by ISPRA.
Fondazione Cervia Ambiente
Cervia (RA)
Climate change and instruments of quantification, monitoring and reporting of greenhouse gas emissions Cervia (RA), 15 June 2010
Training course addressing the mandatory systems of monitoring, quantification and reporting of greenhouse gas emissions, carbon footprint of products and services – Implementation of the Directives 2003/87 (EU Emission Trading Directive) and 2004/101/EC (Kyoto Protocol) by the Legislative Decree no. No. 216 of 04/04/2006.
http://www.cerviaambiente.it
Rete Clima®
Clima Network (Information and action for sustainability and the
fight against climate change)
Environmental education and Environmental training on climate. 2011- ongoing
http://www.reteclima.it/educazione-e-formazione-ambientale-climatica/
Climate Network (Rete Clima ®) is a non-profit organization, founded in 2011 as a technical network for the promotion of sustainability and climate change awareness at the local scale. The network organized a series of training courses for adult (in the Company or for citizenship) including: motivational activities for the "corporate green behaviour"
and the "green team building"; training on practices and actions for energy saving in the
Company; specific training on working behaviour climate and
environmental friendly; design and delivery of "green days" and environmental
events for businesses, municipalities, associations with zero emissions;
information and awareness evenings for citizenship training on practices and actions for energy efficiency at
home , in the Company, in the City.
9.5 International cooperation
The major economic crisis that Italy is going through for some years now did not allow to concentrate
more efforts in many new international cooperation projects specifically dedicated to spreading
awareness on climate change.
However, cooperation activities are continuing in the framework of existing Memorandum of
Understanding (MoU), such as the Sino-Italian Cooperation Program for Environmental Protection (SICP)
signed in the year 2000 between the Italian Ministry for the Environment, Land and Sea (IMELS) and the
State Environmental Protection Administration of China (SEPA). In over 10 years the cooperation
agreement implemented over 200 projects in support of China’s Sustainable Development, thus
becoming a model for bilateral cooperation. In this context, a new cooperation Program between China
and Italy, especially dedicated to Climate Change, has been launched in March 2011 in Beijing by the
261
Director General Corrado Clini of the Italian Ministry for the Environment and the Director General of the
National Development and Reform Commission of China with the aims to start a joint program of
activities in view of the creation of an international centre on climate change. Joint initiatives are
implemented in the field of mitigation and adaptation to climate change, transfer and promotion of low-
carbon technologies, studies and researches as scientific support to decision-making. The cooperation
program includes the following main projects: the Carbon Capture and Storage Comprehensive
Application and Demonstration Project in Sha’anxi Province; the Capacity Building of Coastal Ecosystems
to Adapt to Climate Change; the Xinjiang Uyggur Autonomous Region Climate Change Implementation
Plan; the Climate Change Communication and Public Awareness Raising Project.
In Central and Eastern Europe, IMELS’s activity has been active since 2002, under Memorandum of
Understanding (MoU) called “Environmental Protection Co-Operation”, signed with the former Ministry for
Protection of Natural Resources and Environment of the Republic of Serbia and Montenegro. This
agreement was aimed at developing a programme of bilateral cooperation in the fields of sustainable
development, institutional strengthening and harmonization to both International and European
legislative standards according to funds available from the Italian Law 84/2001 on Balkans’
reconstruction.
More recently the Italian Ministry for the Environment, Land and Sea and the Serbian Ministry of
Environment and Spatial Planning, a Memorandum of Understanding (MoU) on May 2009 in order to,
among else, maintain and enhance bilateral co-operation in the field of the CDM implementation on the
basis of equality, reciprocity and mutual benefit and as an efficient contribution to the sustainable
development and the reduction of greenhouse gases emissions.
In Montenegro MoU signed in 2004 has been replaced by the Cooperation Agreement for Environmental
Protection in Podgorica signed by the two governments in November 2012, represented by the Minister of
the Environment. The agreement allowed the carrying out of activities that include, among others,
support to institutional development and capacity building, and for environmental management,
particularly in the areas of air quality, climate change, prevention and control of pollution.
In the framework of the Cooperation Agreement on environmental protection between the Albanian
Ministry of Environment, Forestry and Water administration and the Italian Ministry for Environment,
Land and Sea, technical support is supplied to Albania for the implementation of the Long Range
Transboundary Air Pollution (LRTAP) Convention then the support to the Albanian team to develop
capacity to assess and plan air quality on local/urban scale, in particular in urban and industrial areas
regulated in the frame of the EU Air Quality Framework Directive 96/92/CE and relative “daughters”
Directives. These activities represented the core of the project “Technical support services for pollutant
emissions inventories implementation and air quality planning in Albania”.
In 2005, the Italian Ministry for the Environment Land and Sea has signed a Memorandum of
Understanding on “Cooperation in the field of the Environment and Sustainable Development” with the
Macedonian Ministry of the Environment and Physical Planning. The cooperation aims to develop
supporting activities for Kyoto Protocol implementation, environmental protection, natural resources
improvement, environmental pollution reduction, legal assistance to adopt the Acquis Communautaire,
and promotion of sustainable development trough programmes, initiatives and jointed projects.
For this purposes, the Task Force for Central and Eastern Europe of the Italian Ministry for the
Environment Land and Sea has established a permanent office in Skopje, in order to provide for the
262
Macedonian counterparts legal and technical assistance necessary to the build-up of institutional
structures, able to realize environmental policies more focused on sustainable development.
Moreover, in 2009 a Memorandum of Understanding on “Establishment of Wind Database in Republic of
Macedonia” between the Italian Ministry for the Environment, Land and Sea and the Macedonian Ministry
of Economy has been signed. It is finalized to measure wind power in the Republic of Macedonia. The
database will provide an institutional plan for the sustainable process of wind measurement and a
database to be used for wind energy generation.
It is also worth mentioning the project “Educate for the future”, created by a Memorandum of
Understanding between the Ministry of Education, University and Research and ENEA and aimed at
promoting and disseminating the knowledge of issues related to sustainable development. In particular,
this project also involved the Ministry of Foreign Affairs - Directorate General for Development
Cooperation and IFAD - International Fund for Agricultural Development and the Ministry for the
Environment Land and Sea. The initiative's main objective is to engage Italian schools in the
implementation of development cooperation projects with Africa on issues such as energy, environment,
biodiversity, climate change, new technologies and responsible consumption.
Another valid model of International Cooperation in developing and transition countries is represented by
the research activities carried out by the EvK2CNR Committee, an autonomous, non-profit association,
which promotes scientific and technological research in mountain areas. Thanks to the close collaboration
with the National Research Council (CNR), in 2007 a Research Unit was established within Ev-K2-CNR,
coordinated by CNR Earth and Environment Department. In Italy, Ev-K2-CNR benefits also of the support
of the Ministry of Foreign Affairs, the Ministry of Education, University and Research, the Ministry of
Economy and Finance, the Ministry of the Environment, Land and Sea and the Ministry of Agriculture and
Forestry.
Ev-K2-CNR carries out scientific and technological research in the Hindu Kush – Karakorum – Himalaya
(HKKH) region, with particular reference to Nepal, and Pakistan. It is best known for the Pyramid
International Laboratory Observatory, located in Nepal, at 5,050 m a.s.l. at the base of Mount
Everest. Due to their relatively remoteness from highly populated and industrialized regions, mountains
are considered ideal locations for investigating the impact of climate changes from regional to global
scales. The promotion of environmental observations in these areas allows the acquisition of unique
information about the background conditions of the environment.
For these reason and following the UN resolutions and indications, Ev-K2-CNR launched the SHARE
project - Stations at High Altitude for Research on the Environment - an observational network of
international and institutional collaborating partners (UNEP, WMO, NASA, ESA and IUCN) with the aim to
promote continuous scientific observations in key high-mountain regions able to contribute to knowledge
on regional and global climate change. It collaborates with the Nepalese Government (Ministry of
Science, Technology and Environment) and with International Research Programs.
Capacity building activity is one of the crucial objectives of SHARE project: local institutions, as the Nepal
Academy of Science & Technology, are directly involved in monitoring and research activities assuring
support to environmental management policies and decision-making processes. By means of awareness
raising, training and technology transfer initiatives, citizens are involved in discovering climate change
and its effects on mountains chains and glaciers for a sustainable use.
Among the wide range of projects supported by EU programs, including climate-related capacity
development actions and strengthening institutional capacity of countries not included in Annex I, it is
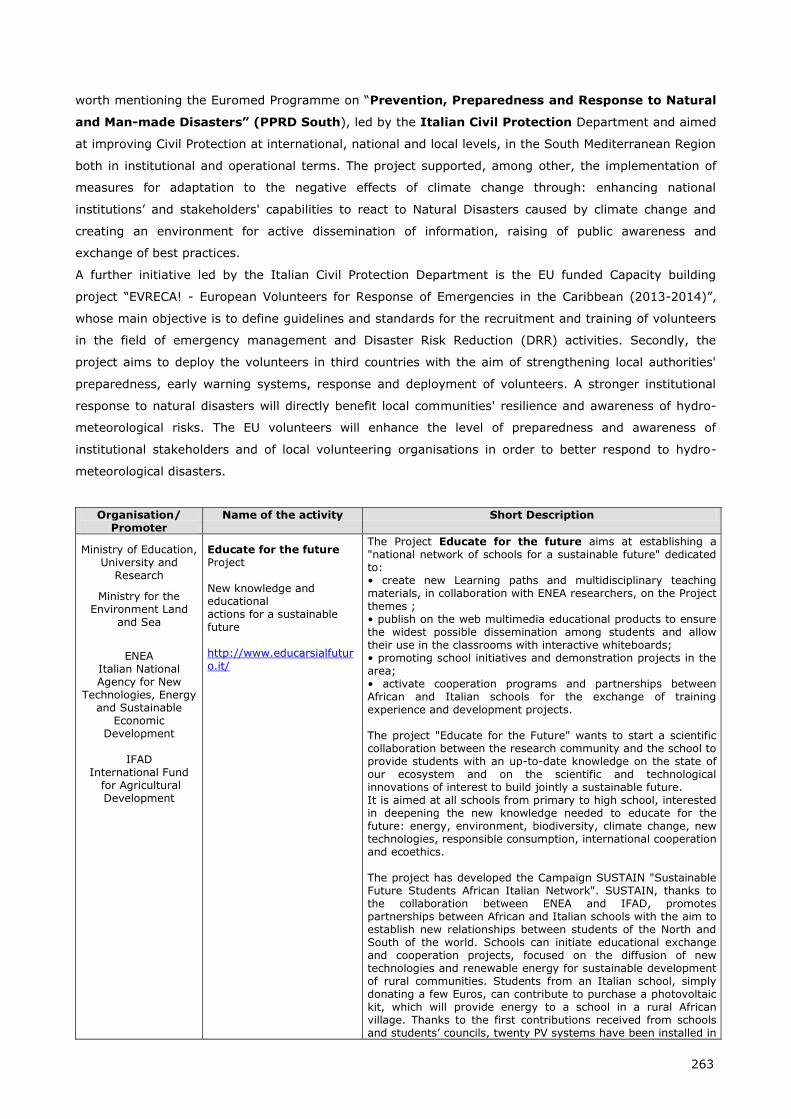
263
worth mentioning the Euromed Programme on “Prevention, Preparedness and Response to Natural
and Man-made Disasters” (PPRD South), led by the Italian Civil Protection Department and aimed
at improving Civil Protection at international, national and local levels, in the South Mediterranean Region
both in institutional and operational terms. The project supported, among other, the implementation of
measures for adaptation to the negative effects of climate change through: enhancing national
institutions’ and stakeholders' capabilities to react to Natural Disasters caused by climate change and
creating an environment for active dissemination of information, raising of public awareness and
exchange of best practices.
A further initiative led by the Italian Civil Protection Department is the EU funded Capacity building
project “EVRECA! - European Volunteers for Response of Emergencies in the Caribbean (2013-2014)”,
whose main objective is to define guidelines and standards for the recruitment and training of volunteers
in the field of emergency management and Disaster Risk Reduction (DRR) activities. Secondly, the
project aims to deploy the volunteers in third countries with the aim of strengthening local authorities'
preparedness, early warning systems, response and deployment of volunteers. A stronger institutional
response to natural disasters will directly benefit local communities' resilience and awareness of hydro-
meteorological risks. The EU volunteers will enhance the level of preparedness and awareness of
institutional stakeholders and of local volunteering organisations in order to better respond to hydro-
meteorological disasters.
Organisation/ Promoter
Name of the activity Short Description
Ministry of Education, University and
Research
Ministry for the Environment Land
and Sea
ENEA
Italian National Agency for New
Technologies, Energy and Sustainable
Economic Development
IFAD
International Fund for Agricultural Development
Educate for the future Project New knowledge and educational actions for a sustainable future http://www.educarsialfuturo.it/
The Project Educate for the future aims at establishing a "national network of schools for a sustainable future" dedicated to: • create new Learning paths and multidisciplinary teaching materials, in collaboration with ENEA researchers, on the Project themes ; • publish on the web multimedia educational products to ensure the widest possible dissemination among students and allow their use in the classrooms with interactive whiteboards; • promoting school initiatives and demonstration projects in the area; • activate cooperation programs and partnerships between African and Italian schools for the exchange of training experience and development projects. The project "Educate for the Future" wants to start a scientific collaboration between the research community and the school to provide students with an up-to-date knowledge on the state of our ecosystem and on the scientific and technological innovations of interest to build jointly a sustainable future. It is aimed at all schools from primary to high school, interested in deepening the new knowledge needed to educate for the future: energy, environment, biodiversity, climate change, new technologies, responsible consumption, international cooperation and ecoethics. The project has developed the Campaign SUSTAIN "Sustainable Future Students African Italian Network". SUSTAIN, thanks to the collaboration between ENEA and IFAD, promotes partnerships between African and Italian schools with the aim to establish new relationships between students of the North and South of the world. Schools can initiate educational exchange and cooperation projects, focused on the diffusion of new technologies and renewable energy for sustainable development of rural communities. Students from an Italian school, simply donating a few Euros, can contribute to purchase a photovoltaic kit, which will provide energy to a school in a rural African village. Thanks to the first contributions received from schools and students’ councils, twenty PV systems have been installed in
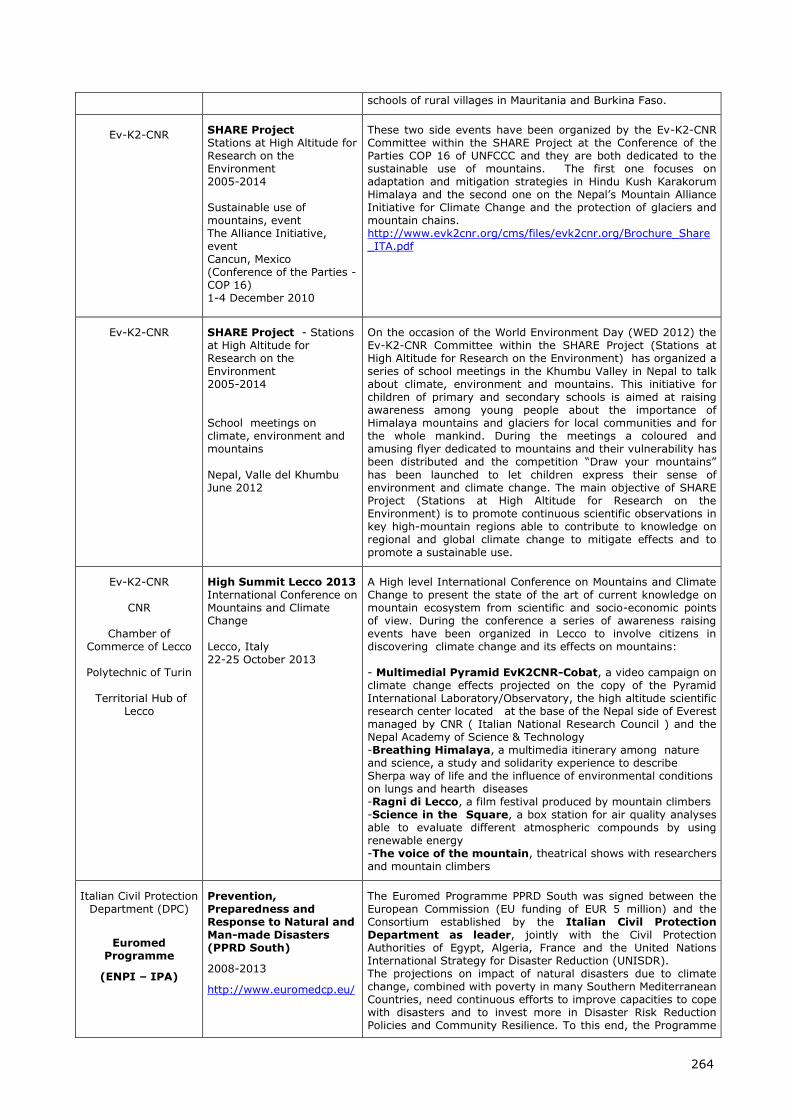
264
schools of rural villages in Mauritania and Burkina Faso.
Ev-K2-CNR
SHARE Project Stations at High Altitude for Research on the Environment 2005-2014 Sustainable use of mountains, event The Alliance Initiative, event Cancun, Mexico (Conference of the Parties - COP 16) 1-4 December 2010
These two side events have been organized by the Ev-K2-CNR Committee within the SHARE Project at the Conference of the Parties COP 16 of UNFCCC and they are both dedicated to the sustainable use of mountains. The first one focuses on adaptation and mitigation strategies in Hindu Kush Karakorum Himalaya and the second one on the Nepal’s Mountain Alliance Initiative for Climate Change and the protection of glaciers and mountain chains. http://www.evk2cnr.org/cms/files/evk2cnr.org/Brochure_Share_ITA.pdf
Ev-K2-CNR
SHARE Project - Stations at High Altitude for Research on the Environment 2005-2014 School meetings on climate, environment and mountains
Nepal, Valle del Khumbu June 2012
On the occasion of the World Environment Day (WED 2012) the Ev-K2-CNR Committee within the SHARE Project (Stations at High Altitude for Research on the Environment) has organized a series of school meetings in the Khumbu Valley in Nepal to talk about climate, environment and mountains. This initiative for children of primary and secondary schools is aimed at raising awareness among young people about the importance of Himalaya mountains and glaciers for local communities and for the whole mankind. During the meetings a coloured and amusing flyer dedicated to mountains and their vulnerability has been distributed and the competition “Draw your mountains”
has been launched to let children express their sense of environment and climate change. The main objective of SHARE Project (Stations at High Altitude for Research on the Environment) is to promote continuous scientific observations in key high-mountain regions able to contribute to knowledge on regional and global climate change to mitigate effects and to promote a sustainable use.
Ev-K2-CNR
CNR
Chamber of Commerce of Lecco
Polytechnic of Turin
Territorial Hub of
Lecco
High Summit Lecco 2013 International Conference on Mountains and Climate Change Lecco, Italy 22-25 October 2013
A High level International Conference on Mountains and Climate Change to present the state of the art of current knowledge on mountain ecosystem from scientific and socio-economic points of view. During the conference a series of awareness raising events have been organized in Lecco to involve citizens in discovering climate change and its effects on mountains: - Multimedial Pyramid EvK2CNR-Cobat, a video campaign on climate change effects projected on the copy of the Pyramid International Laboratory/Observatory, the high altitude scientific research center located at the base of the Nepal side of Everest managed by CNR ( Italian National Research Council ) and the Nepal Academy of Science & Technology -Breathing Himalaya, a multimedia itinerary among nature and science, a study and solidarity experience to describe Sherpa way of life and the influence of environmental conditions on lungs and hearth diseases -Ragni di Lecco, a film festival produced by mountain climbers -Science in the Square, a box station for air quality analyses able to evaluate different atmospheric compounds by using renewable energy -The voice of the mountain, theatrical shows with researchers and mountain climbers
Italian Civil Protection Department (DPC)
Euromed
Programme
(ENPI – IPA)
Prevention, Preparedness and Response to Natural and Man-made Disasters (PPRD South)
2008-2013
http://www.euromedcp.eu/
The Euromed Programme PPRD South was signed between the European Commission (EU funding of EUR 5 million) and the Consortium established by the Italian Civil Protection Department as leader, jointly with the Civil Protection Authorities of Egypt, Algeria, France and the United Nations International Strategy for Disaster Reduction (UNISDR). The projections on impact of natural disasters due to climate change, combined with poverty in many Southern Mediterranean Countries, need continuous efforts to improve capacities to cope with disasters and to invest more in Disaster Risk Reduction Policies and Community Resilience. To this end, the Programme
265
was aimed to contribute to the development and reinforcement of the quality of Civil Protection services in the Euro-Mediterranean region and to the continuation of institutional cooperation in the field, both between the EU and the Mediterranean Partner Countries and among the Mediterranean Partner Countries themselves (Albania, Algeria, Bosnia & Herzegovina, Croatia, Egypt, Israel, Jordan, Lebanon, Montenegro, Morocco, Palestine, Tunisia, Turkey). The objectives of the project have been pursued – in close partnership with the Programme’s network of 13 National Correspondents - through 4 broad areas of activity aimed at: 1. Risk Assessment – by developing tailored national and
regional assessment tools such as the Regional Risk Atlas and the Civil Protection Operational Manual;
2. Prevention and Preparedness – by organizing training workshops, study visits and demand-driven technical assistance, by sensitizing the creation of National Platforms for Disaster Risk Reduction and by supporting regional coordination;
3. Response – by improving the coverage and the coordination on existing Warning Systems and the relevant Operational Centres and implementing simulation exercises;
4. Information/Communication – by developing a user-friendly Web Portal, improving the level of information and the awareness of risk-prone populations regarding risk exposure, prevention and response.
In particular, the “Prevention and Preparedness activities” include the organization and implementation of: 17 thematic training workshops under the prevention and
preparedness area of activity in Albania, Algeria, Croatia, Cyprus, Egypt, France, Jordan, Italy, Lebanon, Morocco, Portugal, Spain, Switzerland, Tunisia and Turkey with around 300 participants coming from the 13 Partner Countries;
3 workshops with table-top and simulation exercises under the Response area of activity in Croatia, France, Morocco and Turkey with more than 110 participants coming from the 13 Partner Countries;
A comprehensive training (4 workshops) under the Response area on “How to design, organize and manage a field exercise”, dedicated to the ENPI Countries;
The thematic training workshops delivered under the Prevention
and Preparedness component focused in particular on: Flood Risk reduction, Information in Emergency, Awareness-Raising, Early Warning System, Emergency Preparedness and Disaster Mitigation for Critical Facilities’ Failure, Tsunami Emergency Preparedness in Mediterranean Coastal Zones, Increasing Disaster Resilience in Urban Settings, Multi-hazard Risk Assessment in Urban Environment. The target audience of the training workshops included high-level managers and operational staff and officials.
Italian Civil Protection
Department (DPC)
EC Humanitarian Aid and Civil Protection
EVRECA!
European Volunteers for Response of Emergencies in the CAribbean'
2013-2014
The Italian Civil Protection Department is the coordinator of the capacity building project 'EVRECA! - European Volunteers for Response of Emergencies in the CAribbean', a Pilot Project EU Aid Volunteers.
The main project’s objective is to define guidelines and standards for the recruitment and training of volunteers in the field of emergency management and disaster risk reduction (DRR) activities. This project deploys volunteers in third countries with the aim of strengthening local authorities' preparedness, early warning systems, response and hosting of volunteers. The EU volunteers will enhance the level of preparedness and awareness of institutional stakeholders and of local volunteering organisations in order to better respond to hydro-meteorological disasters.
Volunteers were trained in order to be deployed in the Caribbean's; a 5-day course will be organised in Italy by the Italian Civil Protection Department. The objective is to provide a better understanding of the socio political context and of the risk exposure of the population.
266
The hosting organisations are located in Grenada. Barbados is considered as a ‘hub’ for capacity building activities in whole the region.
Agriconsulting SpA
CMCC
Centre for Advanced Mediterranean
Agronomic Studies (CIHEAM) of Bari.
Clima South: support to climate change mitigation and adaptation in the ENPI South region
2013-2017
http://www.enpi-info.eu/mainmed.php?id=442&id_type=10
The project seeks to enhance regional cooperation between the EU and its southern Mediterranean neighbours and among the partner countries themselves (South–South) on climate change mitigation and adaptation, mainly through capacity development and information sharing. The overarching goal is to support the transition of ENP South countries towards low carbon development and climate resilience.
Activities include:
Organisation of regional trainings and meetings on mitigation (e.g. monitoring, reporting and verification (MRV) at national and sector level, including the establishment of national greenhouse gas inventories) and about adaptation (data management, vulnerability assessments, national adaptation strategies and plans);
Fostering EU-South and South-South peer-to-peer cooperation by bringing together experts, including academia and civil society, on climate change mitigation and adaptation issues;
Organisation of workshops, trainings and study visits involving the main stakeholders in climate change policy development and implementation;
Creation of a website in Arabic, English and French, as a platform for accessing and sharing information;
Production of targeted climate change material in Arabic, English and French;
Setting up of a flexible expert facility to respond to information and training needs expressed by partner countries' authorities.
The project is implemented by Agriconsulting SpA, an Italian Private Consulting Company, as leader of a Consortium of 7 Institutions, five Italian, one Belgian and one Spanish, among which the CMCC and the Centre for Advanced Mediterranean Agronomic Studies (CIHEAM) of Bari.
CMCC Euro-Mediterranean Centre on Climate
Change
Puglia Region
INGV Istituto Nazionale di Geofisica
e Vulcanologia
Serbian Hydrometeorological
Service
OrientGate
A network for the integration of climate knowledge into policy and planning
SEE (South Eastern
Europe Program)
2012 -2014 www.orientgateproject.org
The OrientGate project aims to implement concerted and coordinated climate adaptation actions across South Eastern Europe (SEE). The partnership comprises 19 financing partners, 11 associates and three observers, covering 13 countries, and the role of the partners can be grouped into three main categories: • National hydrometeorological services, responsible for monitoring climate variability and risk. • Territorial development policy organisations, responsible for translating climate variability and climate risk assessment information into territorial development planning instruments. • Scientific institutions.
The core output to be developed by OrientGate is a set of web tools, designed to provide access to data and metadata from climate observations and simulations that will be available through a data platform connected to the European Climate Adaptation Platform.
Other project outputs will include six pilot studies of specific climate adaptation exercises developed by the project’s three thematic centres (Forest and Agriculture, Drought, Water and Coasts, and Urban Adaptation and Health); capacity-building seminars and workshops; and a working partnership among the hydrometeorological services of SEE countries.

267
ANNEX
ANNEX
Italy
First Biennial Report
December 2013
1. Introduction ..................................................................................................... 270
2. Information on GHG emissions and trends ....................................................... 271
2.1 Summary information on greenhouse gas emissions and trends ....................................................... 271
2.2 National inventory arrangements ....................................................................................................... 271
3. Quantified Economy-wide Emission Reduction Target (QEERT) ........................ 284
3.1 Italy’s quantified economy-wide emission reduction target ............................................................... 284
4. Progress in achievement of QEERT ................................................................... 288
4.1 Action taken and planned to achieve Italy’s QEERT ............................................................................ 288
4.2 Estimates of emission reductions and removals and the use of units from the market-based
mechanisms and land use, land-use changes and forestry activities ........................................................ 301
5. Projections ....................................................................................................... 305
6. Provision of financial, technological support to developing country Parties ..... 312
7. Capacity-building support to developing country Parties ................................. 330
270
1. Introduction
This Annex to the Italy’s 6th National Communication (NC) under the UNFCCC is the 1st Biennial Report
(BR) of the Italy under decision 2/CP.17 of the Conference of the Parties under the UNFCCC.
As defined in the UNFCCC biennial reporting guidelines for developed country Parties1, the information is
structured into:
Information on greenhouse gases (GHG) emissions and trends and the GHG inventory including
information on Italian national inventory arrangements (section 2);
Quantified economy wide emission reduction target (section 3);
Progress in achievement of the quantified economy-wide emission reduction targets (section 3);
Projections (section 5) and
Provision of financial, technological and capacity building support to developing countries (section
6, 7).
Tabular information as defined in the common tabular format (CTF) for the UNFCCC biennial reporting
guidelines for developed country Parties (UNFCCC decision 19/CP.18) are enclosed in the report and have
been officially submitted to the UNFCCC secretariat. For the CTF submission, the electronic reporting
facility provided by the UNFCCC Secretariat has been used as required by UNFCCC decision 19/CP.18.
1 Annex I to UNFCCC decision 2/CP.17
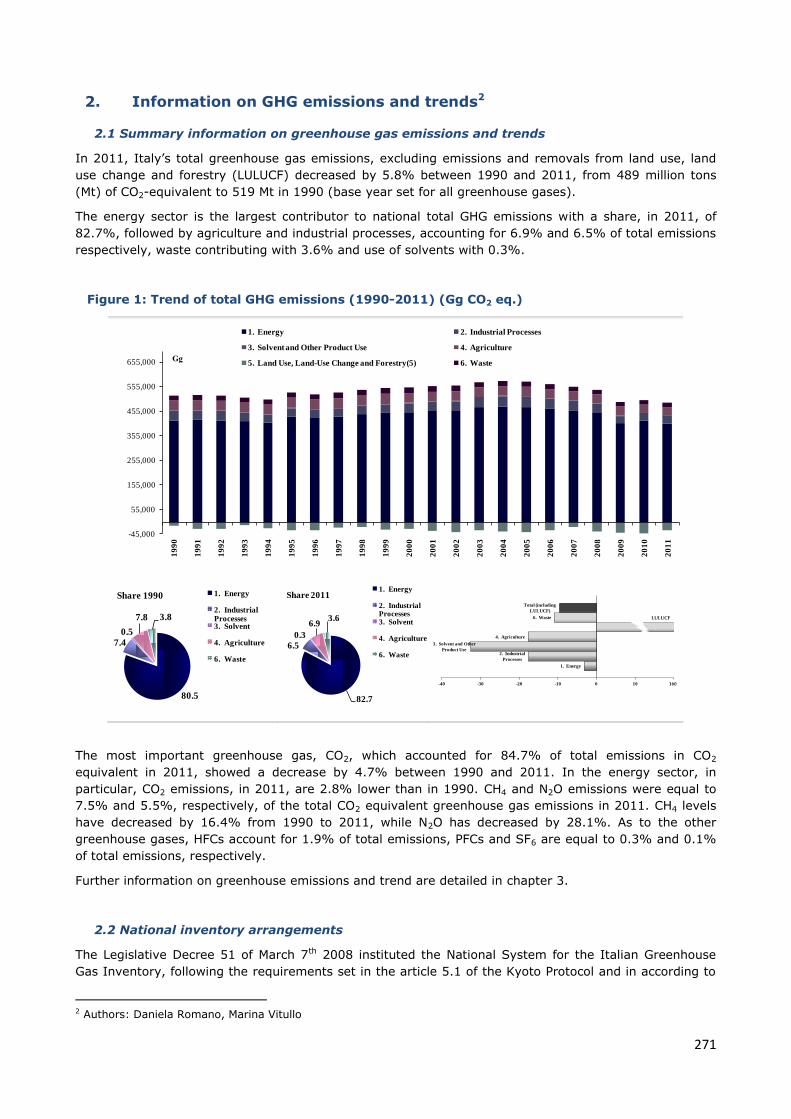
271
2. Information on GHG emissions and trends2
2.1 Summary information on greenhouse gas emissions and trends
In 2011, Italy’s total greenhouse gas emissions, excluding emissions and removals from land use, land
use change and forestry (LULUCF) decreased by 5.8% between 1990 and 2011, from 489 million tons
(Mt) of CO2-equivalent to 519 Mt in 1990 (base year set for all greenhouse gases).
The energy sector is the largest contributor to national total GHG emissions with a share, in 2011, of
82.7%, followed by agriculture and industrial processes, accounting for 6.9% and 6.5% of total emissions
respectively, waste contributing with 3.6% and use of solvents with 0.3%.
Figure 1: Trend of total GHG emissions (1990-2011) (Gg CO2 eq.)
The most important greenhouse gas, CO2, which accounted for 84.7% of total emissions in CO2
equivalent in 2011, showed a decrease by 4.7% between 1990 and 2011. In the energy sector, in
particular, CO2 emissions, in 2011, are 2.8% lower than in 1990. CH4 and N2O emissions were equal to
7.5% and 5.5%, respectively, of the total CO2 equivalent greenhouse gas emissions in 2011. CH4 levels
have decreased by 16.4% from 1990 to 2011, while N2O has decreased by 28.1%. As to the other
greenhouse gases, HFCs account for 1.9% of total emissions, PFCs and SF6 are equal to 0.3% and 0.1%
of total emissions, respectively.
Further information on greenhouse emissions and trend are detailed in chapter 3.
2.2 National inventory arrangements
The Legislative Decree 51 of March 7th 2008 instituted the National System for the Italian Greenhouse
Gas Inventory, following the requirements set in the article 5.1 of the Kyoto Protocol and in according to
2 Authors: Daniela Romano, Marina Vitullo
-45,000
55,000
155,000
255,000
355,000
455,000
555,000
655,000
19
90
19
91
19
92
19
93
19
94
19
95
19
96
19
97
19
98
19
99
20
00
20
01
20
02
20
03
20
04
20
05
20
06
20
07
20
08
20
09
20
10
20
11
1. Energy 2. Industrial Processes
3. Solvent and Other Product Use 4. Agriculture
5. Land Use, Land-Use Change and Forestry(5) 6. Waste
80.5
7.4
0.5
7.8 3.8
Share 1990 1. Energy
2. Industrial Processes3. Solvent
4. Agriculture
6. Waste
82.7
6.5
0.3
6.93.6
Share 20111. Energy
2. Industrial Processes3. Solvent
4. Agriculture
6. Waste
1. Energy
2. Industrial
Processes
3. Solvent and Other
Product Use
4. Agriculture
6. Waste
Total (including
LULUCF)
-40 -30 -20 -10 0 10 20160
LULUCF
272
the Decision n. 280/2004/EC of the European Parliament and of the Council concerning a mechanism for
monitoring Community greenhouse gas emissions and for implementing the Kyoto Protocol (replaced in
2013 by the regulation n. 525/2013 on a mechanism for monitoring and reporting greenhouse gas
emissions and for reporting other information at national and Union level relevant to climate change).
The Italian National System, currently in place, is fully described in the document National Greenhouse
Gas Inventory System in Italy3.
Since the 5th National Communication no changes have occurred in the national inventory arrangements.
3 ISPRA, 2013. National Greenhouse Gas Inventory System in Italy. Rapporti 179/2013
http://www.isprambiente.gov.it/it/pubblicazioni/rapporti/national-greenhouse-gas-inventory-system-in-italy.-year-
2013
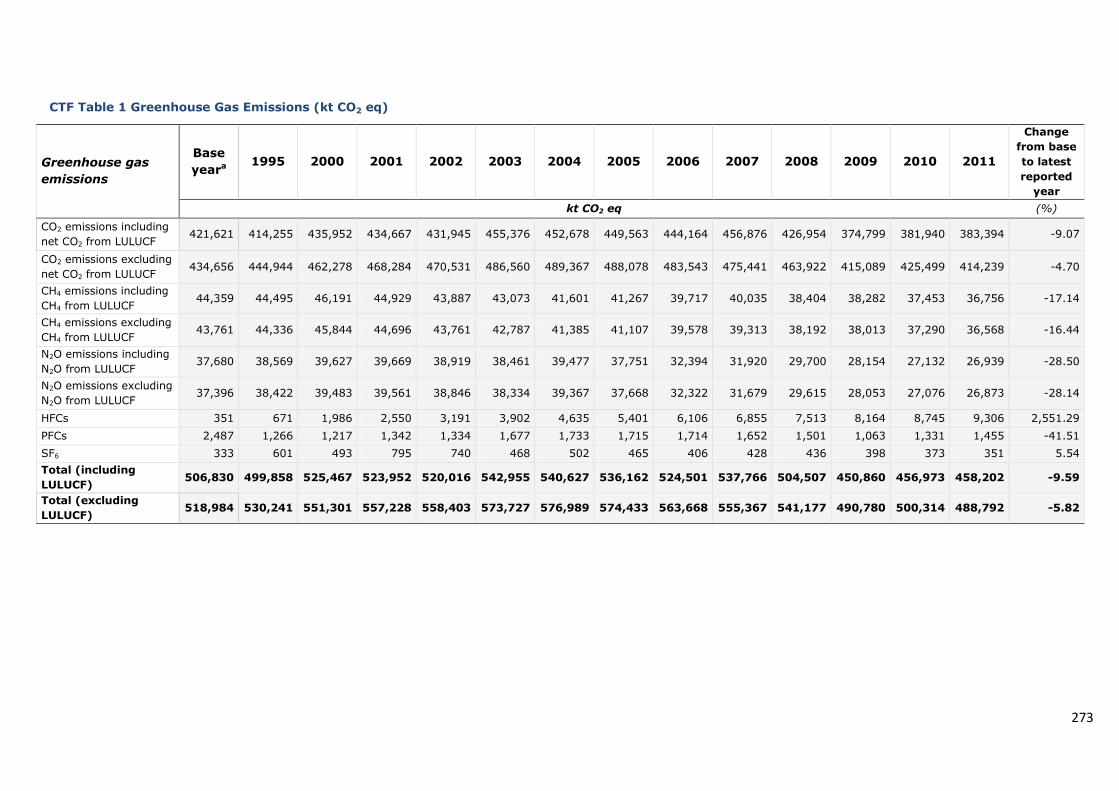
273
CTF Table 1 Greenhouse Gas Emissions (kt CO2 eq)
Greenhouse gas
emissions
Base
yeara 1995 2000 2001 2002 2003 2004 2005 2006 2007 2008 2009 2010 2011
Change
from base
to latest
reported
year
kt CO2 eq (%)
CO2 emissions including
net CO2 from LULUCF 421,621 414,255 435,952 434,667 431,945 455,376 452,678 449,563 444,164 456,876 426,954 374,799 381,940 383,394 -9.07
CO2 emissions excluding
net CO2 from LULUCF 434,656 444,944 462,278 468,284 470,531 486,560 489,367 488,078 483,543 475,441 463,922 415,089 425,499 414,239 -4.70
CH4 emissions including
CH4 from LULUCF 44,359 44,495 46,191 44,929 43,887 43,073 41,601 41,267 39,717 40,035 38,404 38,282 37,453 36,756 -17.14
CH4 emissions excluding
CH4 from LULUCF 43,761 44,336 45,844 44,696 43,761 42,787 41,385 41,107 39,578 39,313 38,192 38,013 37,290 36,568 -16.44
N2O emissions including
N2O from LULUCF 37,680 38,569 39,627 39,669 38,919 38,461 39,477 37,751 32,394 31,920 29,700 28,154 27,132 26,939 -28.50
N2O emissions excluding
N2O from LULUCF 37,396 38,422 39,483 39,561 38,846 38,334 39,367 37,668 32,322 31,679 29,615 28,053 27,076 26,873 -28.14
HFCs 351 671 1,986 2,550 3,191 3,902 4,635 5,401 6,106 6,855 7,513 8,164 8,745 9,306 2,551.29
PFCs 2,487 1,266 1,217 1,342 1,334 1,677 1,733 1,715 1,714 1,652 1,501 1,063 1,331 1,455 -41.51
SF6 333 601 493 795 740 468 502 465 406 428 436 398 373 351 5.54
Total (including
LULUCF) 506,830 499,858 525,467 523,952 520,016 542,955 540,627 536,162 524,501 537,766 504,507 450,860 456,973 458,202 -9.59
Total (excluding
LULUCF) 518,984 530,241 551,301 557,228 558,403 573,727 576,989 574,433 563,668 555,367 541,177 490,780 500,314 488,792 -5.82
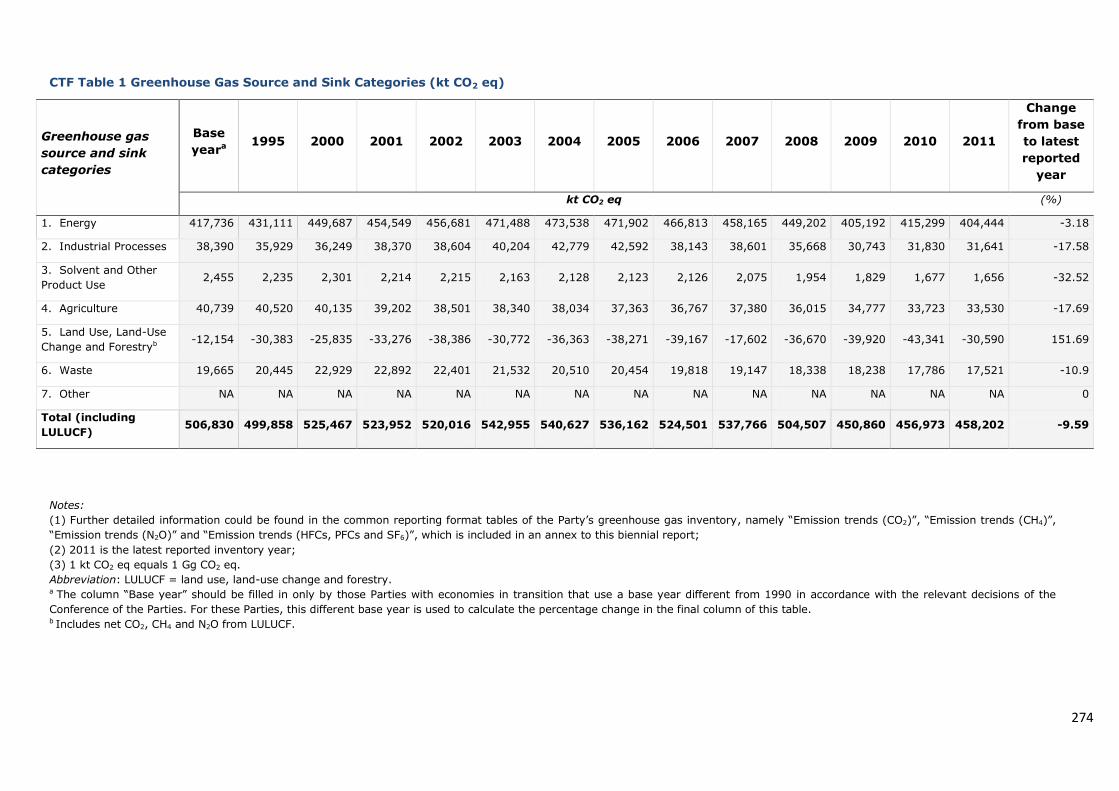
274
CTF Table 1 Greenhouse Gas Source and Sink Categories (kt CO2 eq)
Greenhouse gas
source and sink
categories
Base
yeara 1995 2000 2001 2002 2003 2004 2005 2006 2007 2008 2009 2010 2011
Change
from base
to latest
reported
year
kt CO2 eq (%)
1. Energy 417,736 431,111 449,687 454,549 456,681 471,488 473,538 471,902 466,813 458,165 449,202 405,192 415,299 404,444 -3.18
2. Industrial Processes 38,390 35,929 36,249 38,370 38,604 40,204 42,779 42,592 38,143 38,601 35,668 30,743 31,830 31,641 -17.58
3. Solvent and Other
Product Use 2,455 2,235 2,301 2,214 2,215 2,163 2,128 2,123 2,126 2,075 1,954 1,829 1,677 1,656 -32.52
4. Agriculture 40,739 40,520 40,135 39,202 38,501 38,340 38,034 37,363 36,767 37,380 36,015 34,777 33,723 33,530 -17.69
5. Land Use, Land-Use
Change and Forestryb -12,154 -30,383 -25,835 -33,276 -38,386 -30,772 -36,363 -38,271 -39,167 -17,602 -36,670 -39,920 -43,341 -30,590 151.69
6. Waste 19,665 20,445 22,929 22,892 22,401 21,532 20,510 20,454 19,818 19,147 18,338 18,238 17,786 17,521 -10.9
7. Other NA NA NA NA NA NA NA NA NA NA NA NA NA NA 0
Total (including
LULUCF) 506,830 499,858 525,467 523,952 520,016 542,955 540,627 536,162 524,501 537,766 504,507 450,860 456,973 458,202 -9.59
Notes:
(1) Further detailed information could be found in the common reporting format tables of the Party’s greenhouse gas inventory, namely “Emission trends (CO2)”, “Emission trends (CH4)”,
“Emission trends (N2O)” and “Emission trends (HFCs, PFCs and SF6)”, which is included in an annex to this biennial report;
(2) 2011 is the latest reported inventory year;
(3) 1 kt CO2 eq equals 1 Gg CO2 eq.
Abbreviation: LULUCF = land use, land-use change and forestry. a The column “Base year” should be filled in only by those Parties with economies in transition that use a base year different from 1990 in accordance with the relevant decisions of the
Conference of the Parties. For these Parties, this different base year is used to calculate the percentage change in the final column of this table. b Includes net CO2, CH4 and N2O from LULUCF.
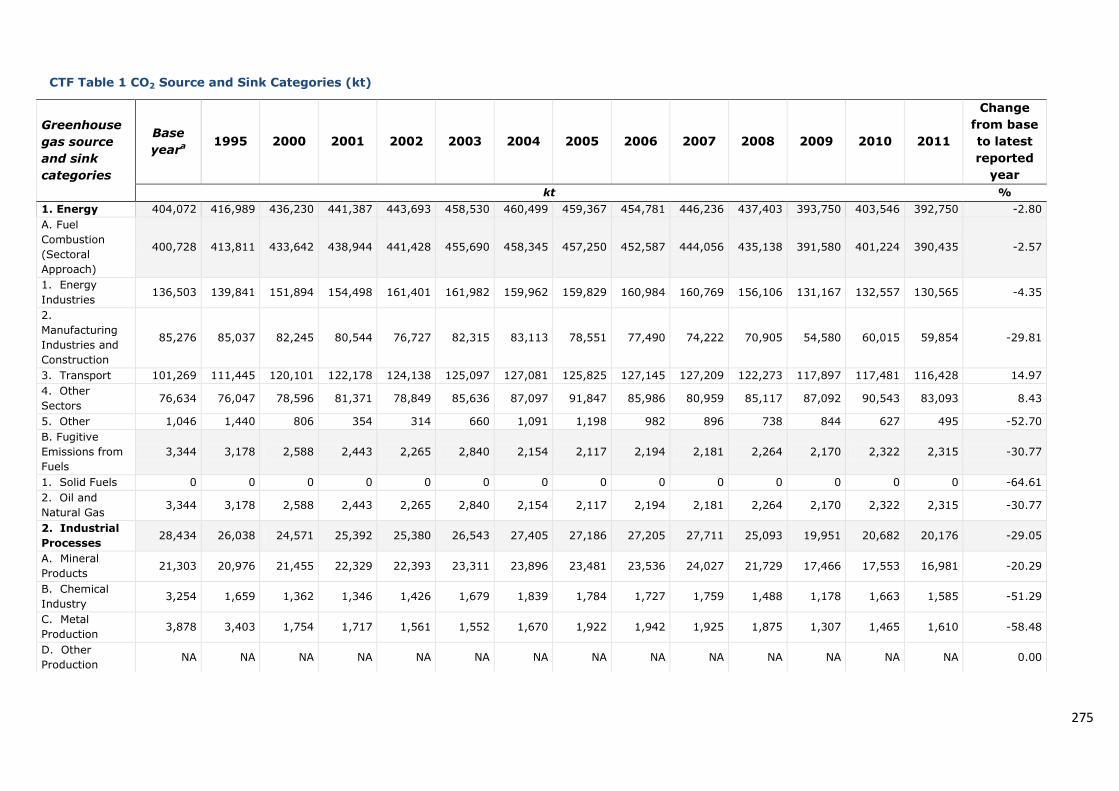
275
CTF Table 1 CO2 Source and Sink Categories (kt)
Greenhouse
gas source
and sink
categories
Base
yeara 1995 2000 2001 2002 2003 2004 2005 2006 2007 2008 2009 2010 2011
Change
from base
to latest
reported
year
kt %
1. Energy 404,072 416,989 436,230 441,387 443,693 458,530 460,499 459,367 454,781 446,236 437,403 393,750 403,546 392,750 -2.80
A. Fuel
Combustion
(Sectoral
Approach)
400,728 413,811 433,642 438,944 441,428 455,690 458,345 457,250 452,587 444,056 435,138 391,580 401,224 390,435 -2.57
1. Energy
Industries 136,503 139,841 151,894 154,498 161,401 161,982 159,962 159,829 160,984 160,769 156,106 131,167 132,557 130,565 -4.35
2.
Manufacturing
Industries and
Construction
85,276 85,037 82,245 80,544 76,727 82,315 83,113 78,551 77,490 74,222 70,905 54,580 60,015 59,854 -29.81
3. Transport 101,269 111,445 120,101 122,178 124,138 125,097 127,081 125,825 127,145 127,209 122,273 117,897 117,481 116,428 14.97
4. Other
Sectors 76,634 76,047 78,596 81,371 78,849 85,636 87,097 91,847 85,986 80,959 85,117 87,092 90,543 83,093 8.43
5. Other 1,046 1,440 806 354 314 660 1,091 1,198 982 896 738 844 627 495 -52.70
B. Fugitive
Emissions from
Fuels
3,344 3,178 2,588 2,443 2,265 2,840 2,154 2,117 2,194 2,181 2,264 2,170 2,322 2,315 -30.77
1. Solid Fuels 0 0 0 0 0 0 0 0 0 0 0 0 0 0 -64.61
2. Oil and
Natural Gas 3,344 3,178 2,588 2,443 2,265 2,840 2,154 2,117 2,194 2,181 2,264 2,170 2,322 2,315 -30.77
2. Industrial
Processes 28,434 26,038 24,571 25,392 25,380 26,543 27,405 27,186 27,205 27,711 25,093 19,951 20,682 20,176 -29.05
A. Mineral
Products 21,303 20,976 21,455 22,329 22,393 23,311 23,896 23,481 23,536 24,027 21,729 17,466 17,553 16,981 -20.29
B. Chemical
Industry 3,254 1,659 1,362 1,346 1,426 1,679 1,839 1,784 1,727 1,759 1,488 1,178 1,663 1,585 -51.29
C. Metal
Production 3,878 3,403 1,754 1,717 1,561 1,552 1,670 1,922 1,942 1,925 1,875 1,307 1,465 1,610 -58.48
D. Other
Production NA NA NA NA NA NA NA NA NA NA NA NA NA NA 0.00
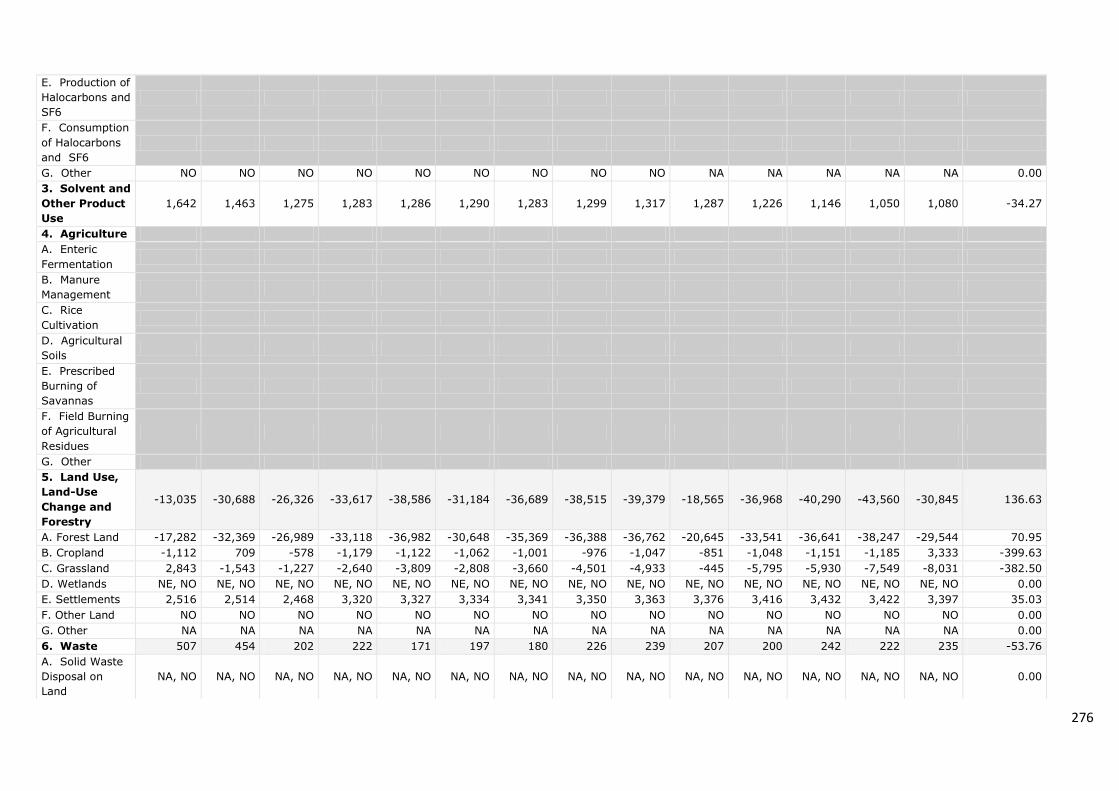
276
E. Production of
Halocarbons and
SF6
F. Consumption
of Halocarbons
and SF6
G. Other NO NO NO NO NO NO NO NO NO NA NA NA NA NA 0.00
3. Solvent and
Other Product
Use
1,642 1,463 1,275 1,283 1,286 1,290 1,283 1,299 1,317 1,287 1,226 1,146 1,050 1,080 -34.27
4. Agriculture
A. Enteric
Fermentation
B. Manure
Management
C. Rice
Cultivation
D. Agricultural
Soils
E. Prescribed
Burning of
Savannas
F. Field Burning
of Agricultural
Residues
G. Other
5. Land Use,
Land-Use
Change and
Forestry
-13,035 -30,688 -26,326 -33,617 -38,586 -31,184 -36,689 -38,515 -39,379 -18,565 -36,968 -40,290 -43,560 -30,845 136.63
A. Forest Land -17,282 -32,369 -26,989 -33,118 -36,982 -30,648 -35,369 -36,388 -36,762 -20,645 -33,541 -36,641 -38,247 -29,544 70.95
B. Cropland -1,112 709 -578 -1,179 -1,122 -1,062 -1,001 -976 -1,047 -851 -1,048 -1,151 -1,185 3,333 -399.63
C. Grassland 2,843 -1,543 -1,227 -2,640 -3,809 -2,808 -3,660 -4,501 -4,933 -445 -5,795 -5,930 -7,549 -8,031 -382.50
D. Wetlands NE, NO NE, NO NE, NO NE, NO NE, NO NE, NO NE, NO NE, NO NE, NO NE, NO NE, NO NE, NO NE, NO NE, NO 0.00
E. Settlements 2,516 2,514 2,468 3,320 3,327 3,334 3,341 3,350 3,363 3,376 3,416 3,432 3,422 3,397 35.03
F. Other Land NO NO NO NO NO NO NO NO NO NO NO NO NO NO 0.00
G. Other NA NA NA NA NA NA NA NA NA NA NA NA NA NA 0.00
6. Waste 507 454 202 222 171 197 180 226 239 207 200 242 222 235 -53.76
A. Solid Waste
Disposal on
Land
NA, NO NA, NO NA, NO NA, NO NA, NO NA, NO NA, NO NA, NO NA, NO NA, NO NA, NO NA, NO NA, NO NA, NO 0.00
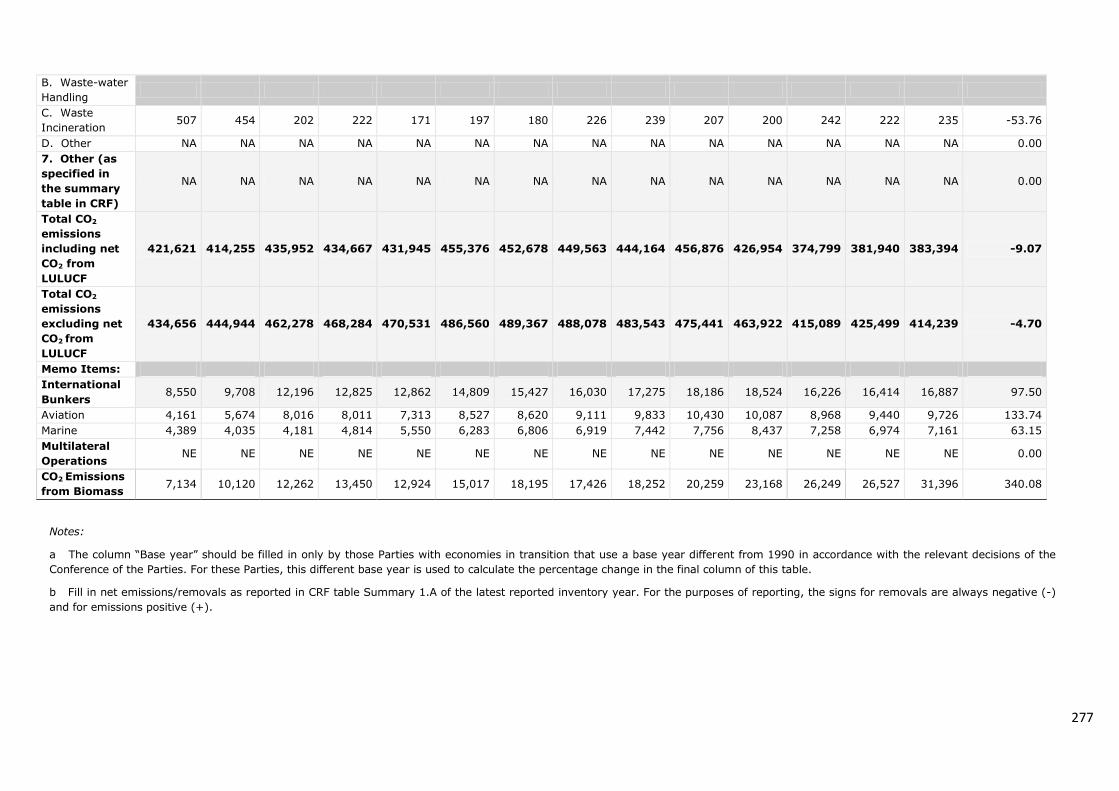
277
B. Waste-water
Handling
C. Waste
Incineration 507 454 202 222 171 197 180 226 239 207 200 242 222 235 -53.76
D. Other NA NA NA NA NA NA NA NA NA NA NA NA NA NA 0.00
7. Other (as
specified in
the summary
table in CRF)
NA NA NA NA NA NA NA NA NA NA NA NA NA NA 0.00
Total CO2
emissions
including net
CO2 from
LULUCF
421,621 414,255 435,952 434,667 431,945 455,376 452,678 449,563 444,164 456,876 426,954 374,799 381,940 383,394 -9.07
Total CO2
emissions
excluding net
CO2 from
LULUCF
434,656 444,944 462,278 468,284 470,531 486,560 489,367 488,078 483,543 475,441 463,922 415,089 425,499 414,239 -4.70
Memo Items:
International
Bunkers 8,550 9,708 12,196 12,825 12,862 14,809 15,427 16,030 17,275 18,186 18,524 16,226 16,414 16,887 97.50
Aviation 4,161 5,674 8,016 8,011 7,313 8,527 8,620 9,111 9,833 10,430 10,087 8,968 9,440 9,726 133.74
Marine 4,389 4,035 4,181 4,814 5,550 6,283 6,806 6,919 7,442 7,756 8,437 7,258 6,974 7,161 63.15
Multilateral
Operations NE NE NE NE NE NE NE NE NE NE NE NE NE NE 0.00
CO2 Emissions
from Biomass 7,134 10,120 12,262 13,450 12,924 15,017 18,195 17,426 18,252 20,259 23,168 26,249 26,527 31,396 340.08
Notes:
a The column “Base year” should be filled in only by those Parties with economies in transition that use a base year different from 1990 in accordance with the relevant decisions of the
Conference of the Parties. For these Parties, this different base year is used to calculate the percentage change in the final column of this table.
b Fill in net emissions/removals as reported in CRF table Summary 1.A of the latest reported inventory year. For the purposes of reporting, the signs for removals are always negative (-)
and for emissions positive (+).
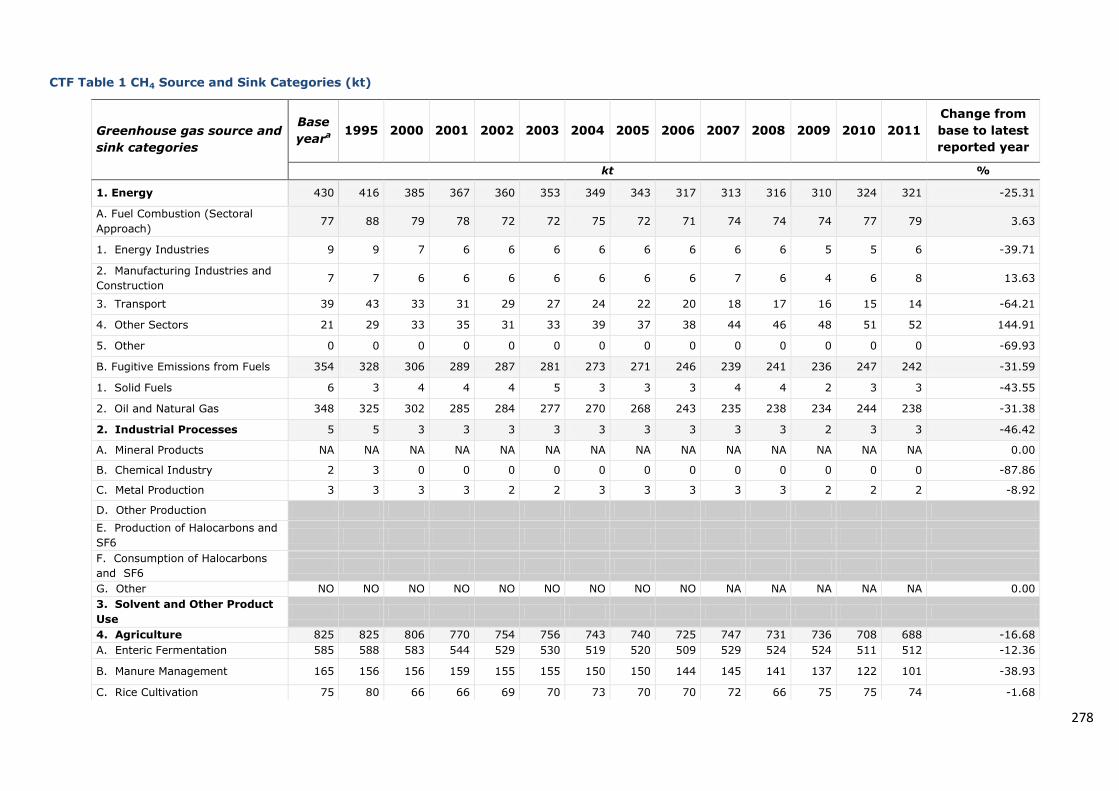
278
CTF Table 1 CH4 Source and Sink Categories (kt)
Greenhouse gas source and
sink categories
Base
yeara 1995 2000 2001 2002 2003 2004 2005 2006 2007 2008 2009 2010 2011
Change from
base to latest
reported year
kt %
1. Energy 430 416 385 367 360 353 349 343 317 313 316 310 324 321 -25.31
A. Fuel Combustion (Sectoral
Approach) 77 88 79 78 72 72 75 72 71 74 74 74 77 79 3.63
1. Energy Industries 9 9 7 6 6 6 6 6 6 6 6 5 5 6 -39.71
2. Manufacturing Industries and
Construction 7 7 6 6 6 6 6 6 6 7 6 4 6 8 13.63
3. Transport 39 43 33 31 29 27 24 22 20 18 17 16 15 14 -64.21
4. Other Sectors 21 29 33 35 31 33 39 37 38 44 46 48 51 52 144.91
5. Other 0 0 0 0 0 0 0 0 0 0 0 0 0 0 -69.93
B. Fugitive Emissions from Fuels 354 328 306 289 287 281 273 271 246 239 241 236 247 242 -31.59
1. Solid Fuels 6 3 4 4 4 5 3 3 3 4 4 2 3 3 -43.55
2. Oil and Natural Gas 348 325 302 285 284 277 270 268 243 235 238 234 244 238 -31.38
2. Industrial Processes 5 5 3 3 3 3 3 3 3 3 3 2 3 3 -46.42
A. Mineral Products NA NA NA NA NA NA NA NA NA NA NA NA NA NA 0.00
B. Chemical Industry 2 3 0 0 0 0 0 0 0 0 0 0 0 0 -87.86
C. Metal Production 3 3 3 3 2 2 3 3 3 3 3 2 2 2 -8.92
D. Other Production
E. Production of Halocarbons and
SF6
F. Consumption of Halocarbons
and SF6
G. Other NO NO NO NO NO NO NO NO NO NA NA NA NA NA 0.00
3. Solvent and Other Product
Use
4. Agriculture 825 825 806 770 754 756 743 740 725 747 731 736 708 688 -16.68
A. Enteric Fermentation 585 588 583 544 529 530 519 520 509 529 524 524 511 512 -12.36
B. Manure Management 165 156 156 159 155 155 150 150 144 145 141 137 122 101 -38.93
C. Rice Cultivation 75 80 66 66 69 70 73 70 70 72 66 75 75 74 -1.68
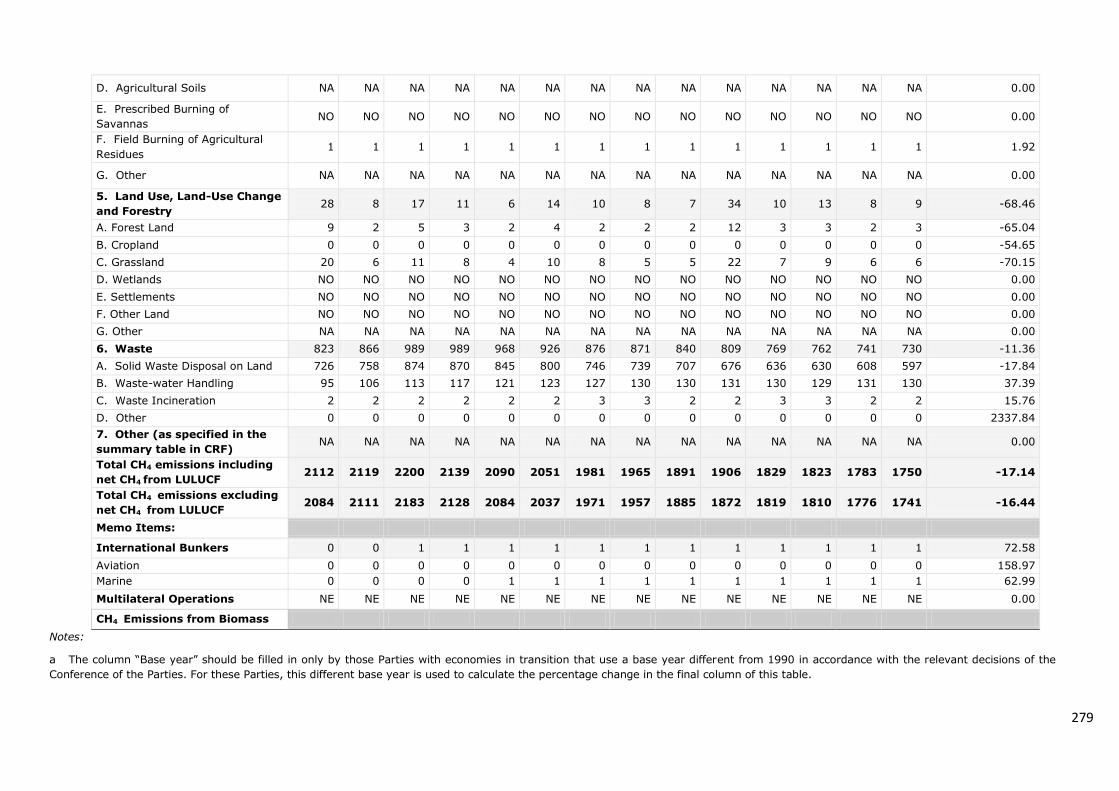
279
D. Agricultural Soils NA NA NA NA NA NA NA NA NA NA NA NA NA NA 0.00
E. Prescribed Burning of
Savannas NO NO NO NO NO NO NO NO NO NO NO NO NO NO 0.00
F. Field Burning of Agricultural
Residues 1 1 1 1 1 1 1 1 1 1 1 1 1 1 1.92
G. Other NA NA NA NA NA NA NA NA NA NA NA NA NA NA 0.00
5. Land Use, Land-Use Change
and Forestry 28 8 17 11 6 14 10 8 7 34 10 13 8 9 -68.46
A. Forest Land 9 2 5 3 2 4 2 2 2 12 3 3 2 3 -65.04
B. Cropland 0 0 0 0 0 0 0 0 0 0 0 0 0 0 -54.65
C. Grassland 20 6 11 8 4 10 8 5 5 22 7 9 6 6 -70.15
D. Wetlands NO NO NO NO NO NO NO NO NO NO NO NO NO NO 0.00
E. Settlements NO NO NO NO NO NO NO NO NO NO NO NO NO NO 0.00
F. Other Land NO NO NO NO NO NO NO NO NO NO NO NO NO NO 0.00
G. Other NA NA NA NA NA NA NA NA NA NA NA NA NA NA 0.00
6. Waste 823 866 989 989 968 926 876 871 840 809 769 762 741 730 -11.36
A. Solid Waste Disposal on Land 726 758 874 870 845 800 746 739 707 676 636 630 608 597 -17.84
B. Waste-water Handling 95 106 113 117 121 123 127 130 130 131 130 129 131 130 37.39
C. Waste Incineration 2 2 2 2 2 2 3 3 2 2 3 3 2 2 15.76
D. Other 0 0 0 0 0 0 0 0 0 0 0 0 0 0 2337.84
7. Other (as specified in the
summary table in CRF) NA NA NA NA NA NA NA NA NA NA NA NA NA NA 0.00
Total CH4 emissions including
net CH4 from LULUCF 2112 2119 2200 2139 2090 2051 1981 1965 1891 1906 1829 1823 1783 1750 -17.14
Total CH4 emissions excluding
net CH4 from LULUCF 2084 2111 2183 2128 2084 2037 1971 1957 1885 1872 1819 1810 1776 1741 -16.44
Memo Items:
International Bunkers 0 0 1 1 1 1 1 1 1 1 1 1 1 1 72.58
Aviation 0 0 0 0 0 0 0 0 0 0 0 0 0 0 158.97
Marine 0 0 0 0 1 1 1 1 1 1 1 1 1 1 62.99
Multilateral Operations NE NE NE NE NE NE NE NE NE NE NE NE NE NE 0.00
CH4 Emissions from Biomass
Notes:
a The column “Base year” should be filled in only by those Parties with economies in transition that use a base year different from 1990 in accordance with the relevant decisions of the
Conference of the Parties. For these Parties, this different base year is used to calculate the percentage change in the final column of this table.
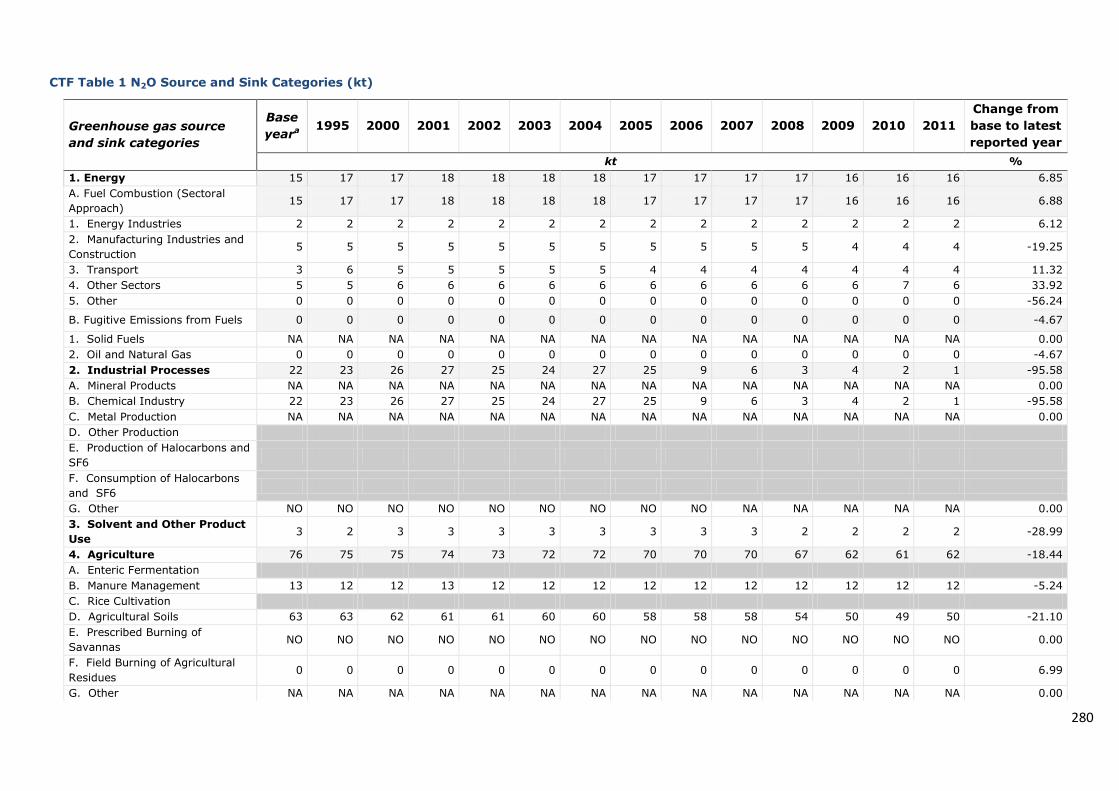
280
CTF Table 1 N2O Source and Sink Categories (kt)
Greenhouse gas source
and sink categories
Base
yeara 1995 2000 2001 2002 2003 2004 2005 2006 2007 2008 2009 2010 2011
Change from
base to latest
reported year
kt %
1. Energy 15 17 17 18 18 18 18 17 17 17 17 16 16 16 6.85
A. Fuel Combustion (Sectoral
Approach) 15 17 17 18 18 18 18 17 17 17 17 16 16 16 6.88
1. Energy Industries 2 2 2 2 2 2 2 2 2 2 2 2 2 2 6.12
2. Manufacturing Industries and
Construction 5 5 5 5 5 5 5 5 5 5 5 4 4 4 -19.25
3. Transport 3 6 5 5 5 5 5 4 4 4 4 4 4 4 11.32
4. Other Sectors 5 5 6 6 6 6 6 6 6 6 6 6 7 6 33.92
5. Other 0 0 0 0 0 0 0 0 0 0 0 0 0 0 -56.24
B. Fugitive Emissions from Fuels 0 0 0 0 0 0 0 0 0 0 0 0 0 0 -4.67
1. Solid Fuels NA NA NA NA NA NA NA NA NA NA NA NA NA NA 0.00
2. Oil and Natural Gas 0 0 0 0 0 0 0 0 0 0 0 0 0 0 -4.67
2. Industrial Processes 22 23 26 27 25 24 27 25 9 6 3 4 2 1 -95.58
A. Mineral Products NA NA NA NA NA NA NA NA NA NA NA NA NA NA 0.00
B. Chemical Industry 22 23 26 27 25 24 27 25 9 6 3 4 2 1 -95.58
C. Metal Production NA NA NA NA NA NA NA NA NA NA NA NA NA NA 0.00
D. Other Production
E. Production of Halocarbons and
SF6
F. Consumption of Halocarbons
and SF6
G. Other NO NO NO NO NO NO NO NO NO NA NA NA NA NA 0.00
3. Solvent and Other Product
Use 3 2 3 3 3 3 3 3 3 3 2 2 2 2 -28.99
4. Agriculture 76 75 75 74 73 72 72 70 70 70 67 62 61 62 -18.44
A. Enteric Fermentation
B. Manure Management 13 12 12 13 12 12 12 12 12 12 12 12 12 12 -5.24
C. Rice Cultivation
D. Agricultural Soils 63 63 62 61 61 60 60 58 58 58 54 50 49 50 -21.10
E. Prescribed Burning of
Savannas NO NO NO NO NO NO NO NO NO NO NO NO NO NO 0.00
F. Field Burning of Agricultural
Residues 0 0 0 0 0 0 0 0 0 0 0 0 0 0 6.99
G. Other NA NA NA NA NA NA NA NA NA NA NA NA NA NA 0.00
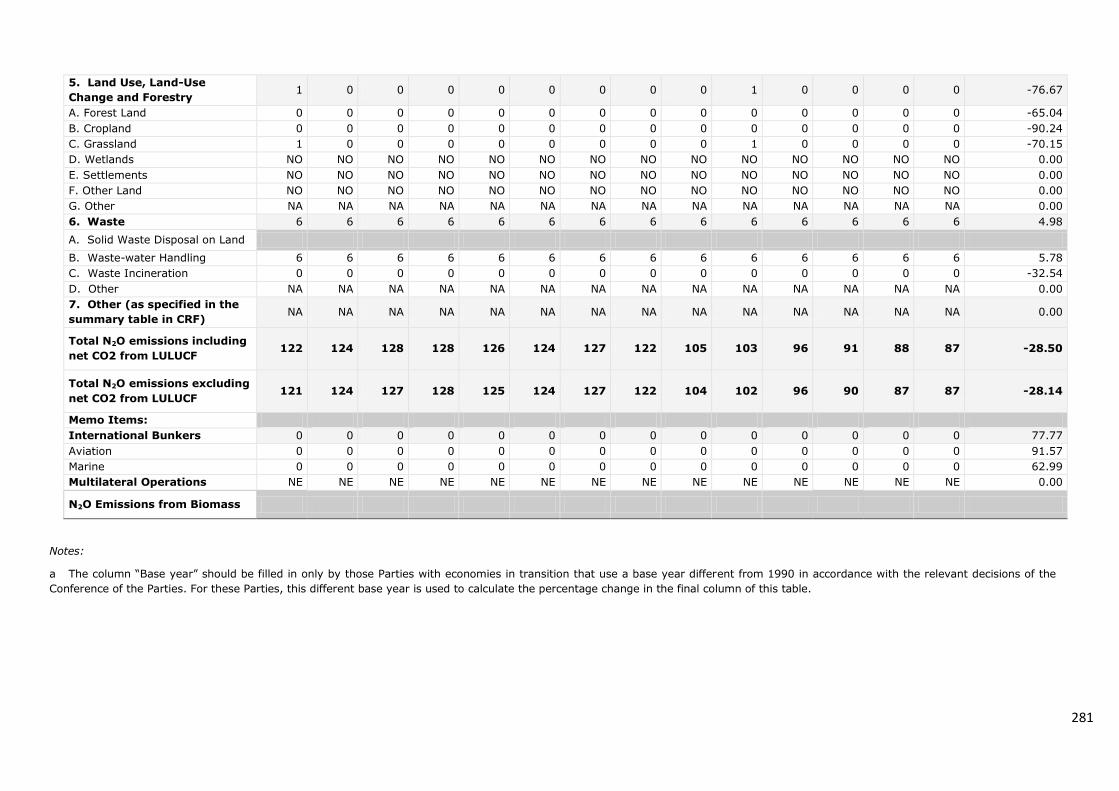
281
5. Land Use, Land-Use
Change and Forestry 1 0 0 0 0 0 0 0 0 1 0 0 0 0 -76.67
A. Forest Land 0 0 0 0 0 0 0 0 0 0 0 0 0 0 -65.04
B. Cropland 0 0 0 0 0 0 0 0 0 0 0 0 0 0 -90.24
C. Grassland 1 0 0 0 0 0 0 0 0 1 0 0 0 0 -70.15
D. Wetlands NO NO NO NO NO NO NO NO NO NO NO NO NO NO 0.00
E. Settlements NO NO NO NO NO NO NO NO NO NO NO NO NO NO 0.00
F. Other Land NO NO NO NO NO NO NO NO NO NO NO NO NO NO 0.00
G. Other NA NA NA NA NA NA NA NA NA NA NA NA NA NA 0.00
6. Waste 6 6 6 6 6 6 6 6 6 6 6 6 6 6 4.98
A. Solid Waste Disposal on Land
B. Waste-water Handling 6 6 6 6 6 6 6 6 6 6 6 6 6 6 5.78
C. Waste Incineration 0 0 0 0 0 0 0 0 0 0 0 0 0 0 -32.54
D. Other NA NA NA NA NA NA NA NA NA NA NA NA NA NA 0.00
7. Other (as specified in the
summary table in CRF) NA NA NA NA NA NA NA NA NA NA NA NA NA NA 0.00
Total N2O emissions including
net CO2 from LULUCF 122 124 128 128 126 124 127 122 105 103 96 91 88 87 -28.50
Total N2O emissions excluding
net CO2 from LULUCF 121 124 127 128 125 124 127 122 104 102 96 90 87 87 -28.14
Memo Items:
International Bunkers 0 0 0 0 0 0 0 0 0 0 0 0 0 0 77.77
Aviation 0 0 0 0 0 0 0 0 0 0 0 0 0 0 91.57
Marine 0 0 0 0 0 0 0 0 0 0 0 0 0 0 62.99
Multilateral Operations NE NE NE NE NE NE NE NE NE NE NE NE NE NE 0.00
N2O Emissions from Biomass
Notes:
a The column “Base year” should be filled in only by those Parties with economies in transition that use a base year different from 1990 in accordance with the relevant decisions of the
Conference of the Parties. For these Parties, this different base year is used to calculate the percentage change in the final column of this table.
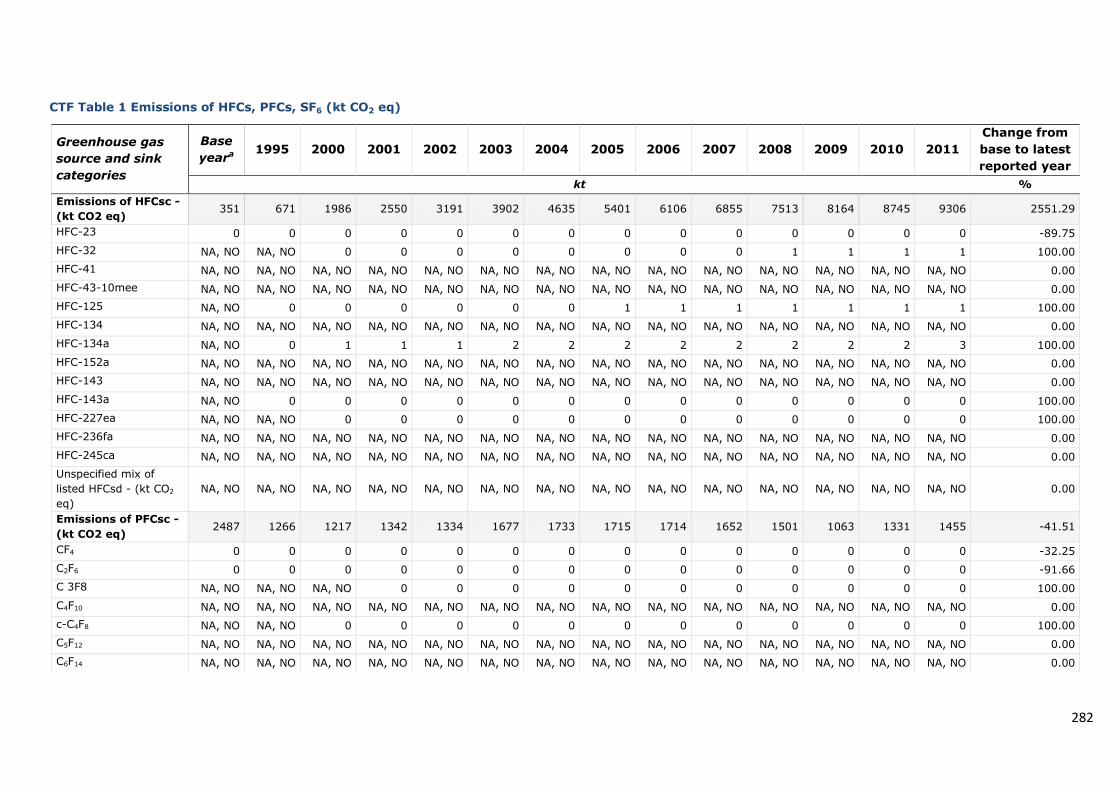
282
CTF Table 1 Emissions of HFCs, PFCs, SF6 (kt CO2 eq)
Greenhouse gas
source and sink
categories
Base
yeara 1995 2000 2001 2002 2003 2004 2005 2006 2007 2008 2009 2010 2011
Change from
base to latest
reported year
kt %
Emissions of HFCsc -
(kt CO2 eq) 351 671 1986 2550 3191 3902 4635 5401 6106 6855 7513 8164 8745 9306 2551.29
HFC-23 0 0 0 0 0 0 0 0 0 0 0 0 0 0 -89.75
HFC-32 NA, NO NA, NO 0 0 0 0 0 0 0 0 1 1 1 1 100.00
HFC-41 NA, NO NA, NO NA, NO NA, NO NA, NO NA, NO NA, NO NA, NO NA, NO NA, NO NA, NO NA, NO NA, NO NA, NO 0.00
HFC-43-10mee NA, NO NA, NO NA, NO NA, NO NA, NO NA, NO NA, NO NA, NO NA, NO NA, NO NA, NO NA, NO NA, NO NA, NO 0.00
HFC-125 NA, NO 0 0 0 0 0 0 1 1 1 1 1 1 1 100.00
HFC-134 NA, NO NA, NO NA, NO NA, NO NA, NO NA, NO NA, NO NA, NO NA, NO NA, NO NA, NO NA, NO NA, NO NA, NO 0.00
HFC-134a NA, NO 0 1 1 1 2 2 2 2 2 2 2 2 3 100.00
HFC-152a NA, NO NA, NO NA, NO NA, NO NA, NO NA, NO NA, NO NA, NO NA, NO NA, NO NA, NO NA, NO NA, NO NA, NO 0.00
HFC-143 NA, NO NA, NO NA, NO NA, NO NA, NO NA, NO NA, NO NA, NO NA, NO NA, NO NA, NO NA, NO NA, NO NA, NO 0.00
HFC-143a NA, NO 0 0 0 0 0 0 0 0 0 0 0 0 0 100.00
HFC-227ea NA, NO NA, NO 0 0 0 0 0 0 0 0 0 0 0 0 100.00
HFC-236fa NA, NO NA, NO NA, NO NA, NO NA, NO NA, NO NA, NO NA, NO NA, NO NA, NO NA, NO NA, NO NA, NO NA, NO 0.00
HFC-245ca NA, NO NA, NO NA, NO NA, NO NA, NO NA, NO NA, NO NA, NO NA, NO NA, NO NA, NO NA, NO NA, NO NA, NO 0.00
Unspecified mix of
listed HFCsd - (kt CO2
eq)
NA, NO NA, NO NA, NO NA, NO NA, NO NA, NO NA, NO NA, NO NA, NO NA, NO NA, NO NA, NO NA, NO NA, NO 0.00
Emissions of PFCsc -
(kt CO2 eq) 2487 1266 1217 1342 1334 1677 1733 1715 1714 1652 1501 1063 1331 1455 -41.51
CF4 0 0 0 0 0 0 0 0 0 0 0 0 0 0 -32.25
C2F6 0 0 0 0 0 0 0 0 0 0 0 0 0 0 -91.66
C 3F8 NA, NO NA, NO NA, NO 0 0 0 0 0 0 0 0 0 0 0 100.00
C4F10 NA, NO NA, NO NA, NO NA, NO NA, NO NA, NO NA, NO NA, NO NA, NO NA, NO NA, NO NA, NO NA, NO NA, NO 0.00
c-C4F8 NA, NO NA, NO 0 0 0 0 0 0 0 0 0 0 0 0 100.00
C5F12 NA, NO NA, NO NA, NO NA, NO NA, NO NA, NO NA, NO NA, NO NA, NO NA, NO NA, NO NA, NO NA, NO NA, NO 0.00
C6F14 NA, NO NA, NO NA, NO NA, NO NA, NO NA, NO NA, NO NA, NO NA, NO NA, NO NA, NO NA, NO NA, NO NA, NO 0.00
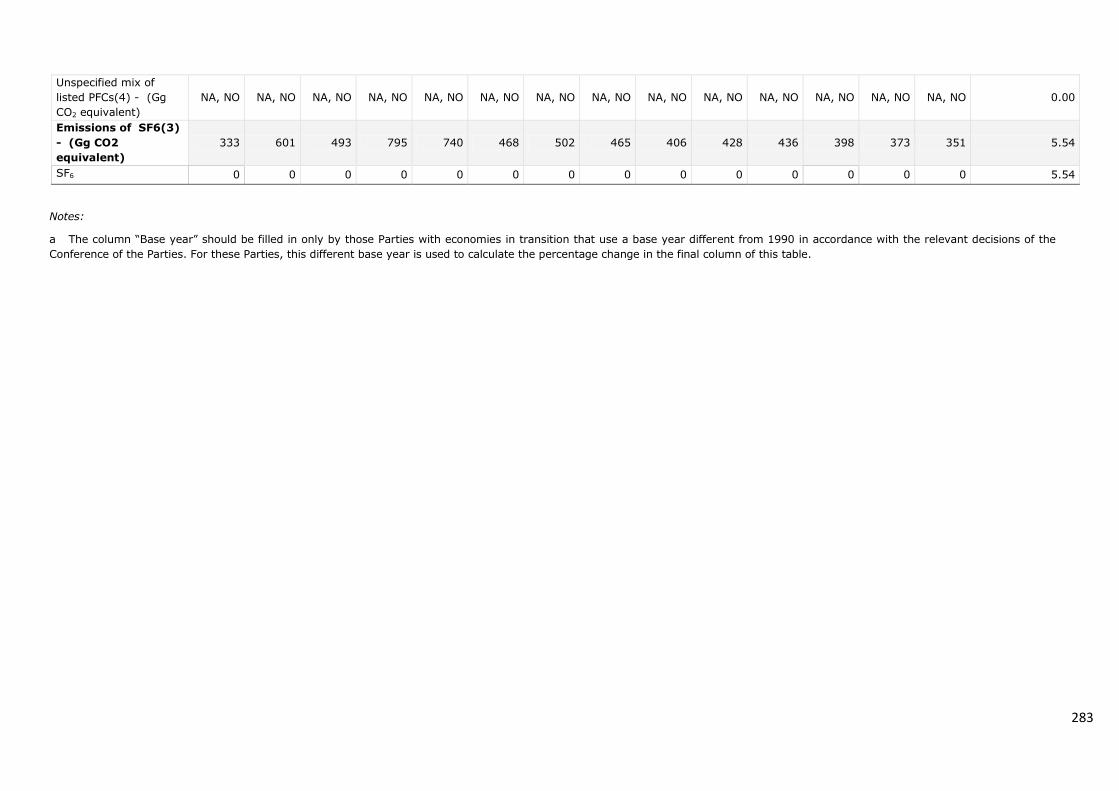
283
Unspecified mix of
listed PFCs(4) - (Gg
CO2 equivalent)
NA, NO NA, NO NA, NO NA, NO NA, NO NA, NO NA, NO NA, NO NA, NO NA, NO NA, NO NA, NO NA, NO NA, NO 0.00
Emissions of SF6(3)
- (Gg CO2
equivalent)
333 601 493 795 740 468 502 465 406 428 436 398 373 351 5.54
SF6 0 0 0 0 0 0 0 0 0 0 0 0 0 0 5.54
Notes:
a The column “Base year” should be filled in only by those Parties with economies in transition that use a base year different from 1990 in accordance with the relevant decisions of the
Conference of the Parties. For these Parties, this different base year is used to calculate the percentage change in the final column of this table.
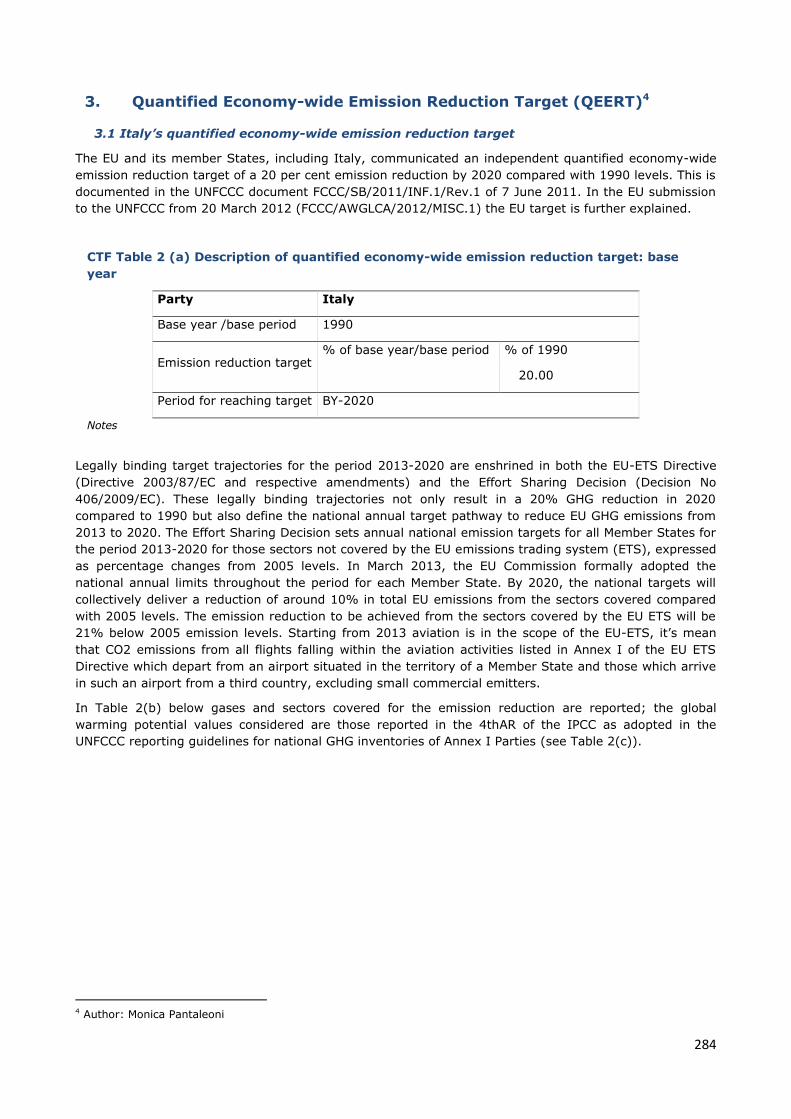
284
3. Quantified Economy-wide Emission Reduction Target (QEERT)4
3.1 Italy’s quantified economy-wide emission reduction target
The EU and its member States, including Italy, communicated an independent quantified economy-wide
emission reduction target of a 20 per cent emission reduction by 2020 compared with 1990 levels. This is
documented in the UNFCCC document FCCC/SB/2011/INF.1/Rev.1 of 7 June 2011. In the EU submission
to the UNFCCC from 20 March 2012 (FCCC/AWGLCA/2012/MISC.1) the EU target is further explained.
Conditions
CTF Table 2 (a) Description of quantified economy-wide emission reduction target: base
year
Party Italy
Base year /base period 1990
Emission reduction target % of base year/base period % of 1990
20.00
Period for reaching target BY-2020
Notes
Legally binding target trajectories for the period 2013-2020 are enshrined in both the EU-ETS Directive
(Directive 2003/87/EC and respective amendments) and the Effort Sharing Decision (Decision No
406/2009/EC). These legally binding trajectories not only result in a 20% GHG reduction in 2020
compared to 1990 but also define the national annual target pathway to reduce EU GHG emissions from
2013 to 2020. The Effort Sharing Decision sets annual national emission targets for all Member States for
the period 2013-2020 for those sectors not covered by the EU emissions trading system (ETS), expressed
as percentage changes from 2005 levels. In March 2013, the EU Commission formally adopted the
national annual limits throughout the period for each Member State. By 2020, the national targets will
collectively deliver a reduction of around 10% in total EU emissions from the sectors covered compared
with 2005 levels. The emission reduction to be achieved from the sectors covered by the EU ETS will be
21% below 2005 emission levels. Starting from 2013 aviation is in the scope of the EU-ETS, it’s mean
that CO2 emissions from all flights falling within the aviation activities listed in Annex I of the EU ETS
Directive which depart from an airport situated in the territory of a Member State and those which arrive
in such an airport from a third country, excluding small commercial emitters.
In Table 2(b) below gases and sectors covered for the emission reduction are reported; the global
warming potential values considered are those reported in the 4thAR of the IPCC as adopted in the
UNFCCC reporting guidelines for national GHG inventories of Annex I Parties (see Table 2(c)).
4 Author: Monica Pantaleoni
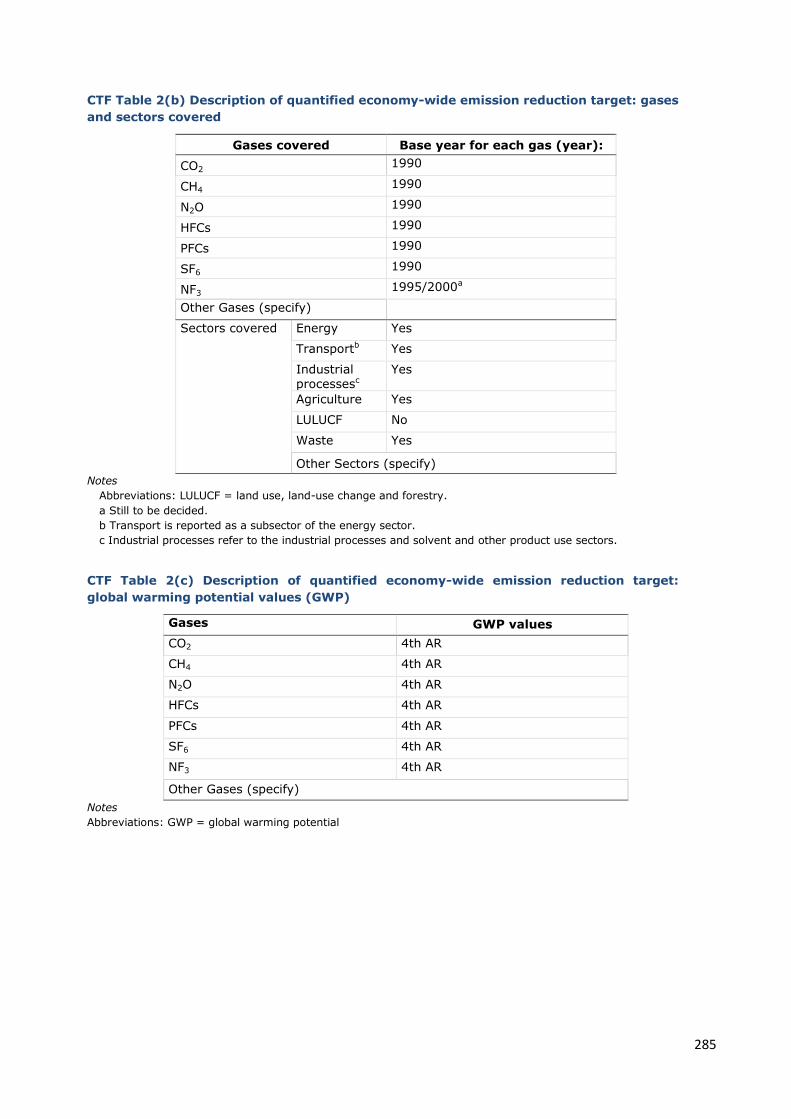
285
CTF Table 2(b) Description of quantified economy-wide emission reduction target: gases
and sectors covered
Gases covered Base year for each gas (year):
CO2 1990
CH4 1990
N2O 1990
HFCs 1990
PFCs 1990
SF6 1990
NF3 1995/2000a
Other Gases (specify)
Sectors covered Energy Yes
Transportb Yes
Industrial
processesc
Yes
Agriculture Yes
LULUCF No
Waste Yes
Other Sectors (specify)
Notes
Abbreviations: LULUCF = land use, land-use change and forestry.
a Still to be decided.
b Transport is reported as a subsector of the energy sector.
c Industrial processes refer to the industrial processes and solvent and other product use sectors.
CTF Table 2(c) Description of quantified economy-wide emission reduction target:
global warming potential values (GWP)
Gases GWP values
CO2 4th AR
CH4 4th AR
N2O 4th AR
HFCs 4th AR
PFCs 4th AR
SF6 4th AR
NF3 4th AR
Other Gases (specify)
Notes
Abbreviations: GWP = global warming potential
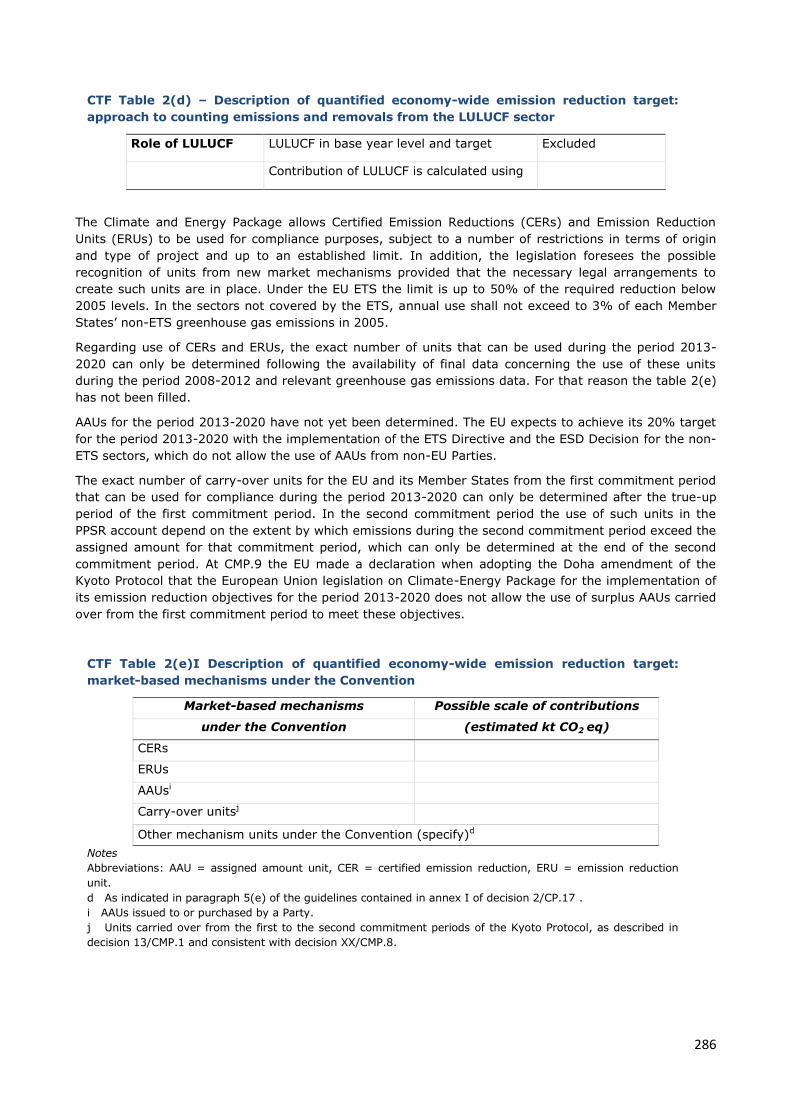
286
CTF Table 2(d) – Description of quantified economy-wide emission reduction target:
approach to counting emissions and removals from the LULUCF sector
Role of LULUCF LULUCF in base year level and target Excluded
Contribution of LULUCF is calculated using
The Climate and Energy Package allows Certified Emission Reductions (CERs) and Emission Reduction
Units (ERUs) to be used for compliance purposes, subject to a number of restrictions in terms of origin
and type of project and up to an established limit. In addition, the legislation foresees the possible
recognition of units from new market mechanisms provided that the necessary legal arrangements to
create such units are in place. Under the EU ETS the limit is up to 50% of the required reduction below
2005 levels. In the sectors not covered by the ETS, annual use shall not exceed to 3% of each Member
States’ non-ETS greenhouse gas emissions in 2005.
Regarding use of CERs and ERUs, the exact number of units that can be used during the period 2013-
2020 can only be determined following the availability of final data concerning the use of these units
during the period 2008-2012 and relevant greenhouse gas emissions data. For that reason the table 2(e)
has not been filled.
AAUs for the period 2013-2020 have not yet been determined. The EU expects to achieve its 20% target
for the period 2013-2020 with the implementation of the ETS Directive and the ESD Decision for the non-
ETS sectors, which do not allow the use of AAUs from non-EU Parties.
The exact number of carry-over units for the EU and its Member States from the first commitment period
that can be used for compliance during the period 2013-2020 can only be determined after the true-up
period of the first commitment period. In the second commitment period the use of such units in the
PPSR account depend on the extent by which emissions during the second commitment period exceed the
assigned amount for that commitment period, which can only be determined at the end of the second
commitment period. At CMP.9 the EU made a declaration when adopting the Doha amendment of the
Kyoto Protocol that the European Union legislation on Climate-Energy Package for the implementation of
its emission reduction objectives for the period 2013-2020 does not allow the use of surplus AAUs carried
over from the first commitment period to meet these objectives.
CTF Table 2(e)I Description of quantified economy-wide emission reduction target:
market-based mechanisms under the Convention
Market-based mechanisms Possible scale of contributions
under the Convention (estimated kt CO2 eq)
CERs
ERUs
AAUsi
Carry-over unitsj
Other mechanism units under the Convention (specify)d
Notes
Abbreviations: AAU = assigned amount unit, CER = certified emission reduction, ERU = emission reduction
unit.
d As indicated in paragraph 5(e) of the guidelines contained in annex I of decision 2/CP.17 .
i AAUs issued to or purchased by a Party.
j Units carried over from the first to the second commitment periods of the Kyoto Protocol, as described in
decision 13/CMP.1 and consistent with decision XX/CMP.8.
287
Regarding CTF Table 2(e)II there are general provisions in place in the EU legislation that allow
for the use of such units. The necessary legal arrangements for the creation of such units have
been put in place in the EU which is not the case at the point in time of the provision of this
report.
CTF Table 2(e)II Description of quantified economy-wide emission reduction target:
other market-based Mechanisms
Other market-based mechanisms Possible scale of contributions
(Specify) (estimated kt CO2 eq)
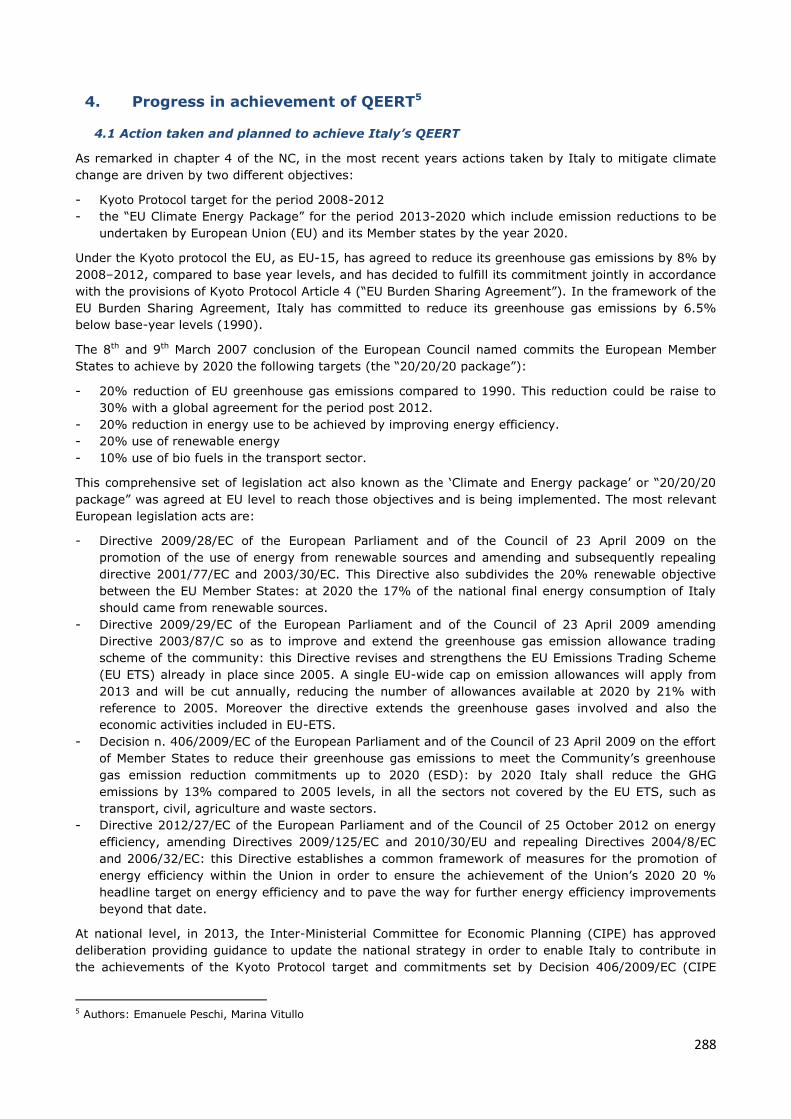
288
4. Progress in achievement of QEERT5
4.1 Action taken and planned to achieve Italy’s QEERT
As remarked in chapter 4 of the NC, in the most recent years actions taken by Italy to mitigate climate
change are driven by two different objectives:
- Kyoto Protocol target for the period 2008-2012
- the “EU Climate Energy Package” for the period 2013-2020 which include emission reductions to be
undertaken by European Union (EU) and its Member states by the year 2020.
Under the Kyoto protocol the EU, as EU-15, has agreed to reduce its greenhouse gas emissions by 8% by
2008–2012, compared to base year levels, and has decided to fulfill its commitment jointly in accordance
with the provisions of Kyoto Protocol Article 4 (“EU Burden Sharing Agreement”). In the framework of the
EU Burden Sharing Agreement, Italy has committed to reduce its greenhouse gas emissions by 6.5%
below base-year levels (1990).
The 8th and 9th March 2007 conclusion of the European Council named commits the European Member
States to achieve by 2020 the following targets (the “20/20/20 package”):
- 20% reduction of EU greenhouse gas emissions compared to 1990. This reduction could be raise to
30% with a global agreement for the period post 2012.
- 20% reduction in energy use to be achieved by improving energy efficiency.
- 20% use of renewable energy
- 10% use of bio fuels in the transport sector.
This comprehensive set of legislation act also known as the ‘Climate and Energy package’ or “20/20/20
package” was agreed at EU level to reach those objectives and is being implemented. The most relevant
European legislation acts are:
- Directive 2009/28/EC of the European Parliament and of the Council of 23 April 2009 on the
promotion of the use of energy from renewable sources and amending and subsequently repealing
directive 2001/77/EC and 2003/30/EC. This Directive also subdivides the 20% renewable objective
between the EU Member States: at 2020 the 17% of the national final energy consumption of Italy
should came from renewable sources.
- Directive 2009/29/EC of the European Parliament and of the Council of 23 April 2009 amending
Directive 2003/87/C so as to improve and extend the greenhouse gas emission allowance trading
scheme of the community: this Directive revises and strengthens the EU Emissions Trading Scheme
(EU ETS) already in place since 2005. A single EU-wide cap on emission allowances will apply from
2013 and will be cut annually, reducing the number of allowances available at 2020 by 21% with
reference to 2005. Moreover the directive extends the greenhouse gases involved and also the
economic activities included in EU-ETS.
- Decision n. 406/2009/EC of the European Parliament and of the Council of 23 April 2009 on the effort
of Member States to reduce their greenhouse gas emissions to meet the Community’s greenhouse
gas emission reduction commitments up to 2020 (ESD): by 2020 Italy shall reduce the GHG
emissions by 13% compared to 2005 levels, in all the sectors not covered by the EU ETS, such as
transport, civil, agriculture and waste sectors.
- Directive 2012/27/EC of the European Parliament and of the Council of 25 October 2012 on energy
efficiency, amending Directives 2009/125/EC and 2010/30/EU and repealing Directives 2004/8/EC
and 2006/32/EC: this Directive establishes a common framework of measures for the promotion of
energy efficiency within the Union in order to ensure the achievement of the Union’s 2020 20 %
headline target on energy efficiency and to pave the way for further energy efficiency improvements
beyond that date.
At national level, in 2013, the Inter-Ministerial Committee for Economic Planning (CIPE) has approved
deliberation providing guidance to update the national strategy in order to enable Italy to contribute in
the achievements of the Kyoto Protocol target and commitments set by Decision 406/2009/EC (CIPE
5 Authors: Emanuele Peschi, Marina Vitullo
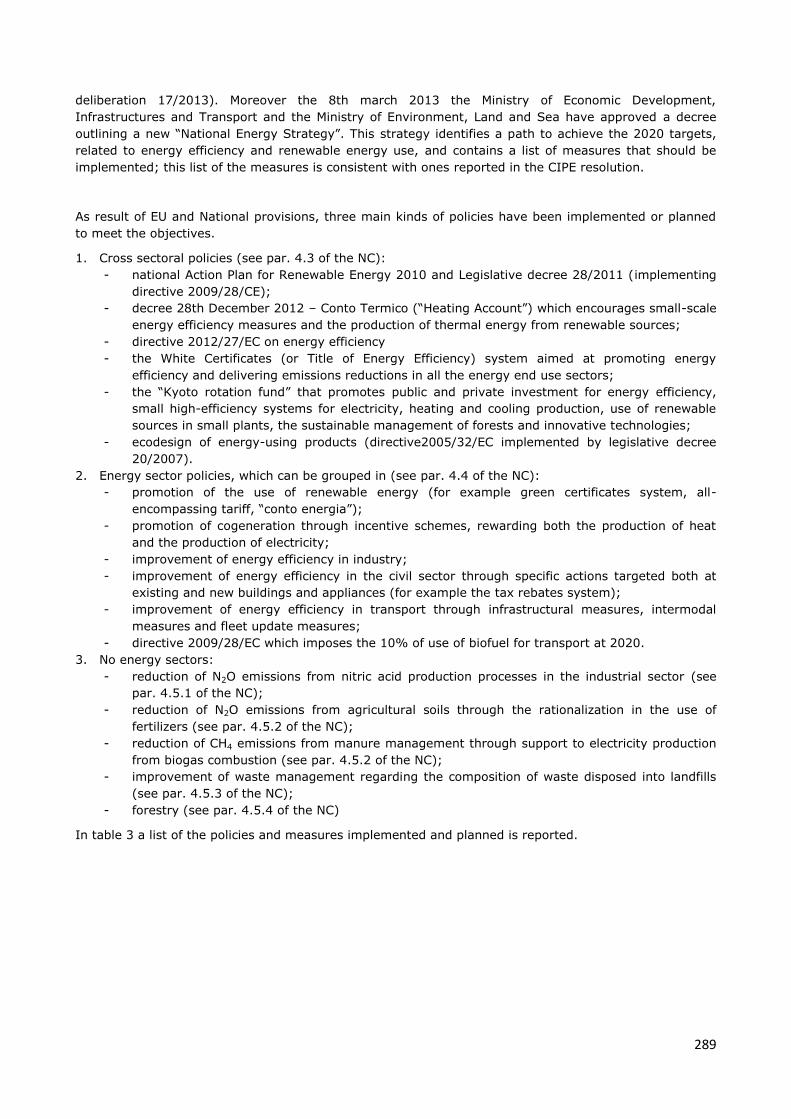
289
deliberation 17/2013). Moreover the 8th march 2013 the Ministry of Economic Development,
Infrastructures and Transport and the Ministry of Environment, Land and Sea have approved a decree
outlining a new “National Energy Strategy”. This strategy identifies a path to achieve the 2020 targets,
related to energy efficiency and renewable energy use, and contains a list of measures that should be
implemented; this list of the measures is consistent with ones reported in the CIPE resolution.
As result of EU and National provisions, three main kinds of policies have been implemented or planned
to meet the objectives.
1. Cross sectoral policies (see par. 4.3 of the NC):
- national Action Plan for Renewable Energy 2010 and Legislative decree 28/2011 (implementing
directive 2009/28/CE);
- decree 28th December 2012 – Conto Termico (“Heating Account”) which encourages small-scale
energy efficiency measures and the production of thermal energy from renewable sources;
- directive 2012/27/EC on energy efficiency
- the White Certificates (or Title of Energy Efficiency) system aimed at promoting energy
efficiency and delivering emissions reductions in all the energy end use sectors;
- the “Kyoto rotation fund” that promotes public and private investment for energy efficiency,
small high-efficiency systems for electricity, heating and cooling production, use of renewable
sources in small plants, the sustainable management of forests and innovative technologies;
- ecodesign of energy-using products (directive2005/32/EC implemented by legislative decree
20/2007).
2. Energy sector policies, which can be grouped in (see par. 4.4 of the NC):
- promotion of the use of renewable energy (for example green certificates system, all-
encompassing tariff, “conto energia”);
- promotion of cogeneration through incentive schemes, rewarding both the production of heat
and the production of electricity;
- improvement of energy efficiency in industry;
- improvement of energy efficiency in the civil sector through specific actions targeted both at
existing and new buildings and appliances (for example the tax rebates system);
- improvement of energy efficiency in transport through infrastructural measures, intermodal
measures and fleet update measures;
- directive 2009/28/EC which imposes the 10% of use of biofuel for transport at 2020.
3. No energy sectors:
- reduction of N2O emissions from nitric acid production processes in the industrial sector (see
par. 4.5.1 of the NC);
- reduction of N2O emissions from agricultural soils through the rationalization in the use of
fertilizers (see par. 4.5.2 of the NC);
- reduction of CH4 emissions from manure management through support to electricity production
from biogas combustion (see par. 4.5.2 of the NC);
- improvement of waste management regarding the composition of waste disposed into landfills
(see par. 4.5.3 of the NC);
- forestry (see par. 4.5.4 of the NC)
In table 3 a list of the policies and measures implemented and planned is reported.
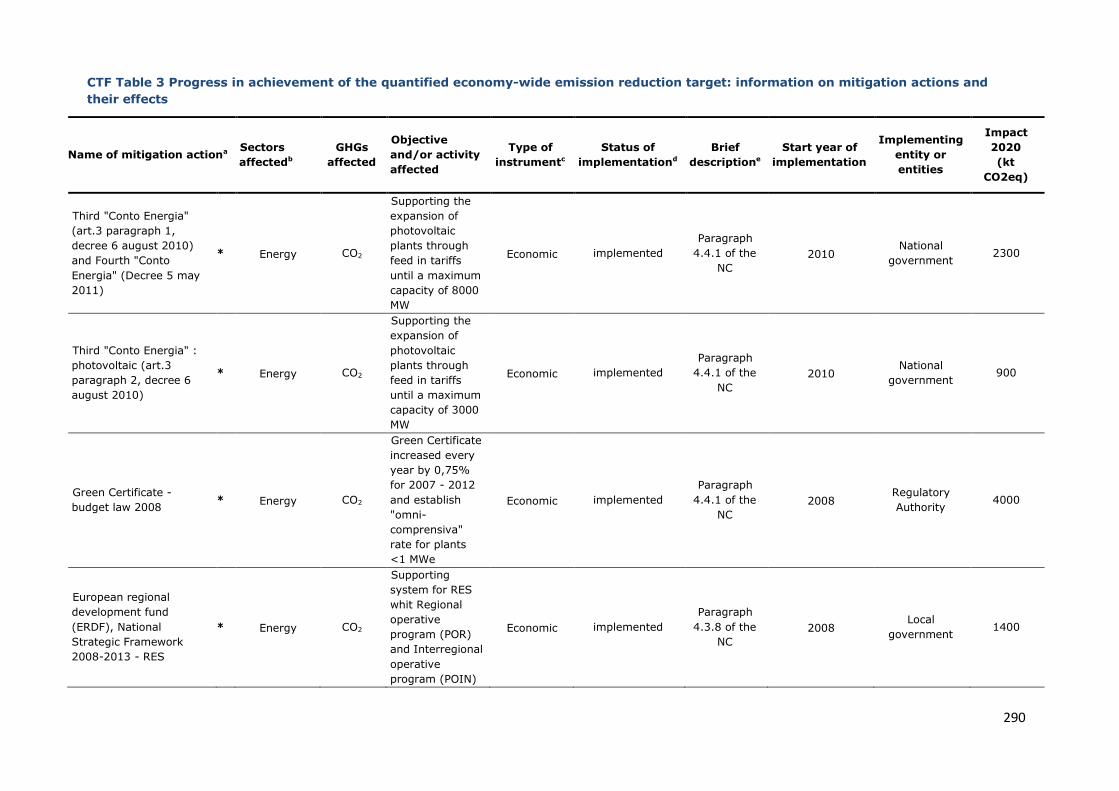
290
CTF Table 3 Progress in achievement of the quantified economy-wide emission reduction target: information on mitigation actions and
their effects
Name of mitigation actiona Sectors
affectedb
GHGs
affected
Objective
and/or activity
affected
Type of
instrumentc
Status of
implementationd
Brief
descriptione
Start year of
implementation
Implementing
entity or
entities
Impact
2020
(kt
CO2eq)
Third "Conto Energia"
(art.3 paragraph 1,
decree 6 august 2010)
and Fourth "Conto
Energia" (Decree 5 may
2011)
* Energy CO2
Supporting the
expansion of
photovoltaic
plants through
feed in tariffs
until a maximum
capacity of 8000
MW
Economic implemented
Paragraph
4.4.1 of the
NC
2010 National
government 2300
Third "Conto Energia" :
photovoltaic (art.3
paragraph 2, decree 6
august 2010)
* Energy CO2
Supporting the
expansion of
photovoltaic
plants through
feed in tariffs
until a maximum
capacity of 3000
MW
Economic implemented
Paragraph
4.4.1 of the
NC
2010 National
government 900
Green Certificate -
budget law 2008 * Energy CO2
Green Certificate
increased every
year by 0,75%
for 2007 - 2012
and establish
"omni-
comprensiva"
rate for plants
<1 MWe
Economic implemented
Paragraph
4.4.1 of the
NC
2008 Regulatory
Authority 4000
European regional
development fund
(ERDF), National
Strategic Framework
2008-2013 - RES
* Energy CO2
Supporting
system for RES
whit Regional
operative
program (POR)
and Interregional
operative
program (POIN)
Economic implemented
Paragraph
4.3.8 of the
NC
2008 Local
government 1400
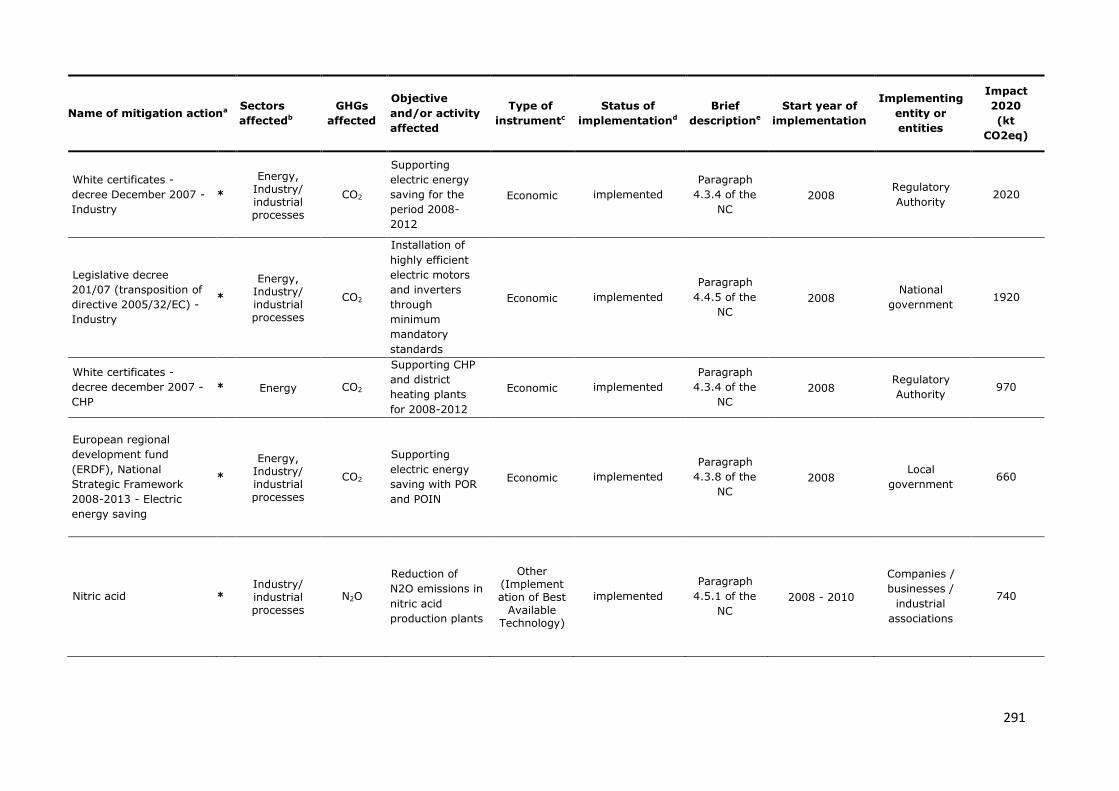
291
Name of mitigation actiona Sectors
affectedb
GHGs
affected
Objective
and/or activity
affected
Type of
instrumentc
Status of
implementationd
Brief
descriptione
Start year of
implementation
Implementing
entity or
entities
Impact
2020
(kt
CO2eq)
White certificates -
decree December 2007 -
Industry
*
Energy, Industry/ industrial processes
CO2
Supporting
electric energy
saving for the
period 2008-
2012
Economic implemented
Paragraph
4.3.4 of the
NC
2008 Regulatory
Authority 2020
Legislative decree
201/07 (transposition of
directive 2005/32/EC) -
Industry
*
Energy, Industry/ industrial processes
CO2
Installation of
highly efficient
electric motors
and inverters
through
minimum
mandatory
standards
Economic implemented
Paragraph
4.4.5 of the
NC
2008 National
government 1920
White certificates -
decree december 2007 -
CHP
* Energy CO2
Supporting CHP
and district
heating plants
for 2008-2012
Economic implemented
Paragraph
4.3.4 of the
NC
2008 Regulatory
Authority 970
European regional
development fund
(ERDF), National
Strategic Framework
2008-2013 - Electric
energy saving
*
Energy, Industry/ industrial processes
CO2
Supporting
electric energy
saving with POR
and POIN
Economic implemented
Paragraph
4.3.8 of the
NC
2008 Local
government 660
Nitric acid * Industry/ industrial processes
N2O
Reduction of
N2O emissions in
nitric acid
production plants
Other (Implementation of Best
Available Technology)
implemented
Paragraph
4.5.1 of the
NC
2008 - 2010
Companies /
businesses /
industrial
associations
740
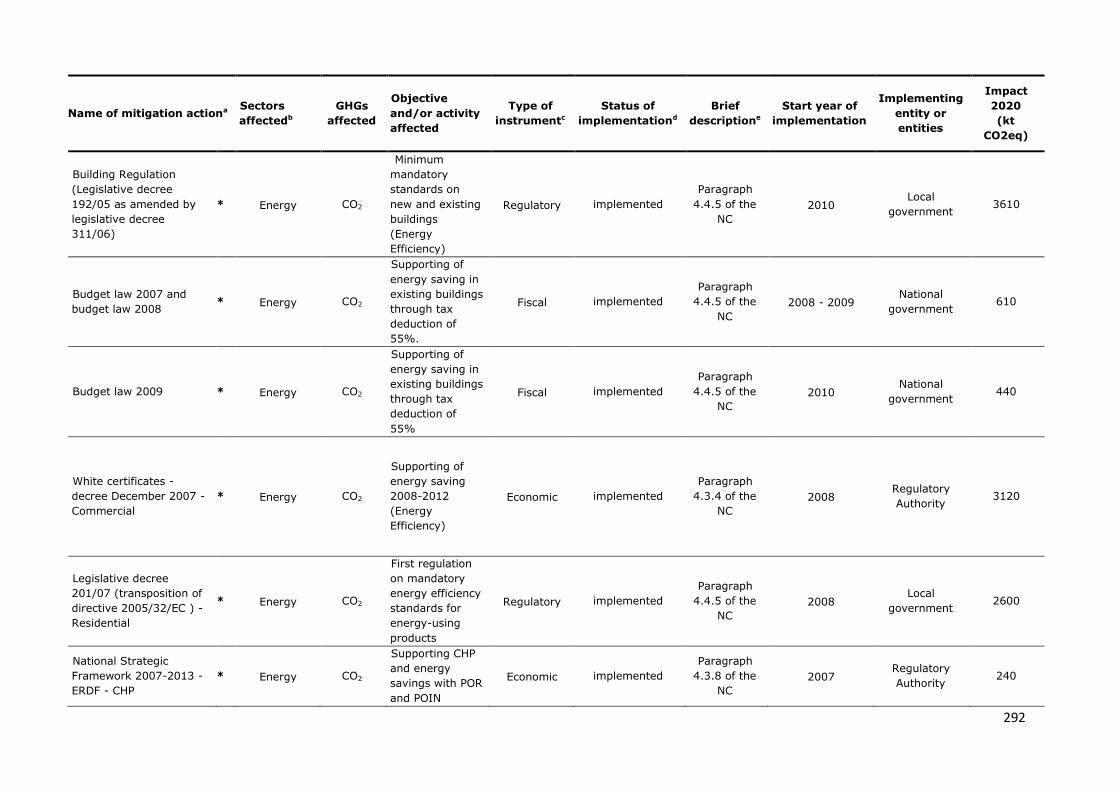
292
Name of mitigation actiona Sectors
affectedb
GHGs
affected
Objective
and/or activity
affected
Type of
instrumentc
Status of
implementationd
Brief
descriptione
Start year of
implementation
Implementing
entity or
entities
Impact
2020
(kt
CO2eq)
Building Regulation
(Legislative decree
192/05 as amended by
legislative decree
311/06)
* Energy CO2
Minimum
mandatory
standards on
new and existing
buildings
(Energy
Efficiency)
Regulatory implemented
Paragraph
4.4.5 of the
NC
2010 Local
government 3610
Budget law 2007 and
budget law 2008 * Energy CO2
Supporting of
energy saving in
existing buildings
through tax
deduction of
55%.
Fiscal implemented
Paragraph
4.4.5 of the
NC
2008 - 2009 National
government 610
Budget law 2009 * Energy CO2
Supporting of
energy saving in
existing buildings
through tax
deduction of
55%
Fiscal implemented
Paragraph
4.4.5 of the
NC
2010 National
government 440
White certificates -
decree December 2007 -
Commercial
* Energy CO2
Supporting of
energy saving
2008-2012
(Energy
Efficiency)
Economic implemented
Paragraph
4.3.4 of the
NC
2008 Regulatory
Authority 3120
Legislative decree
201/07 (transposition of
directive 2005/32/EC ) -
Residential
* Energy CO2
First regulation
on mandatory
energy efficiency
standards for
energy-using
products
Regulatory implemented
Paragraph
4.4.5 of the
NC
2008 Local
government 2600
National Strategic
Framework 2007-2013 -
ERDF - CHP
* Energy CO2
Supporting CHP
and energy
savings with POR
and POIN
Economic implemented
Paragraph
4.3.8 of the
NC
2007 Regulatory
Authority 240
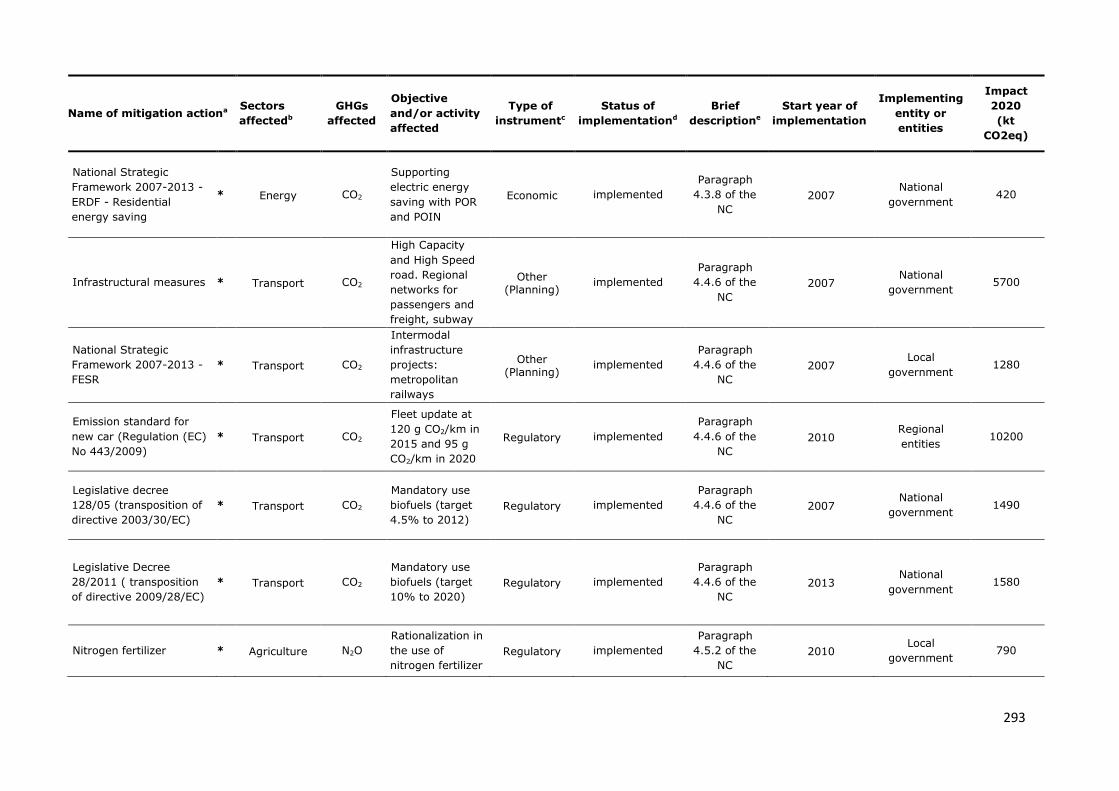
293
Name of mitigation actiona Sectors
affectedb
GHGs
affected
Objective
and/or activity
affected
Type of
instrumentc
Status of
implementationd
Brief
descriptione
Start year of
implementation
Implementing
entity or
entities
Impact
2020
(kt
CO2eq)
National Strategic
Framework 2007-2013 -
ERDF - Residential
energy saving
* Energy CO2
Supporting
electric energy
saving with POR
and POIN
Economic implemented
Paragraph
4.3.8 of the
NC
2007 National
government 420
Infrastructural measures * Transport CO2
High Capacity
and High Speed
road. Regional
networks for
passengers and
freight, subway
Other (Planning)
implemented
Paragraph
4.4.6 of the
NC
2007 National
government 5700
National Strategic
Framework 2007-2013 -
FESR
* Transport CO2
Intermodal
infrastructure
projects:
metropolitan
railways
Other (Planning)
implemented
Paragraph
4.4.6 of the
NC
2007 Local
government 1280
Emission standard for
new car (Regulation (EC)
No 443/2009)
* Transport CO2
Fleet update at
120 g CO2/km in
2015 and 95 g
CO2/km in 2020
Regulatory implemented
Paragraph
4.4.6 of the
NC
2010 Regional
entities 10200
Legislative decree
128/05 (transposition of
directive 2003/30/EC)
* Transport CO2
Mandatory use
biofuels (target
4.5% to 2012)
Regulatory implemented
Paragraph
4.4.6 of the
NC
2007 National
government 1490
Legislative Decree
28/2011 ( transposition
of directive 2009/28/EC)
* Transport CO2
Mandatory use
biofuels (target
10% to 2020)
Regulatory implemented
Paragraph
4.4.6 of the
NC
2013 National
government 1580
Nitrogen fertilizer * Agriculture N2O
Rationalization in
the use of
nitrogen fertilizer
Regulatory implemented
Paragraph
4.5.2 of the
NC
2010 Local
government 790
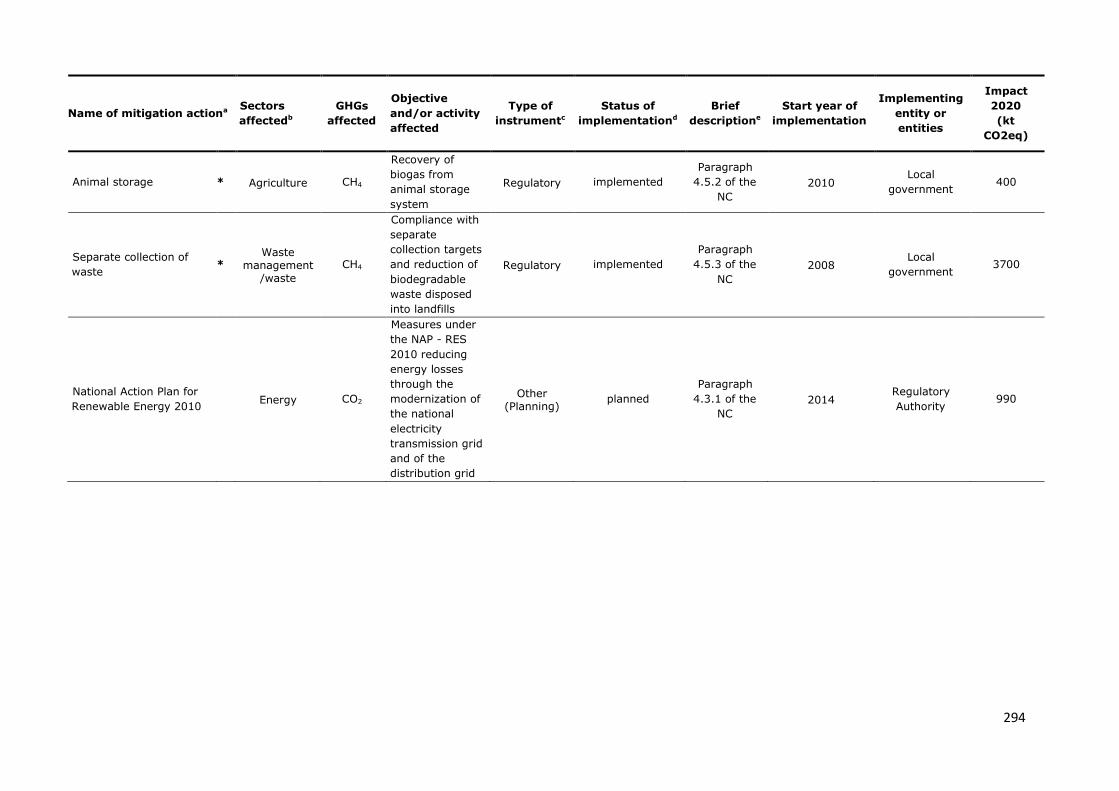
294
Name of mitigation actiona Sectors
affectedb
GHGs
affected
Objective
and/or activity
affected
Type of
instrumentc
Status of
implementationd
Brief
descriptione
Start year of
implementation
Implementing
entity or
entities
Impact
2020
(kt
CO2eq)
Animal storage * Agriculture CH4
Recovery of
biogas from
animal storage
system
Regulatory implemented
Paragraph
4.5.2 of the
NC
2010 Local
government 400
Separate collection of
waste *
Waste management
/waste
CH4
Compliance with
separate
collection targets
and reduction of
biodegradable
waste disposed
into landfills
Regulatory implemented
Paragraph
4.5.3 of the
NC
2008 Local
government 3700
National Action Plan for
Renewable Energy 2010 Energy CO2
Measures under
the NAP - RES
2010 reducing
energy losses
through the
modernization of
the national
electricity
transmission grid
and of the
distribution grid
Other (Planning)
planned
Paragraph
4.3.1 of the
NC
2014 Regulatory
Authority 990
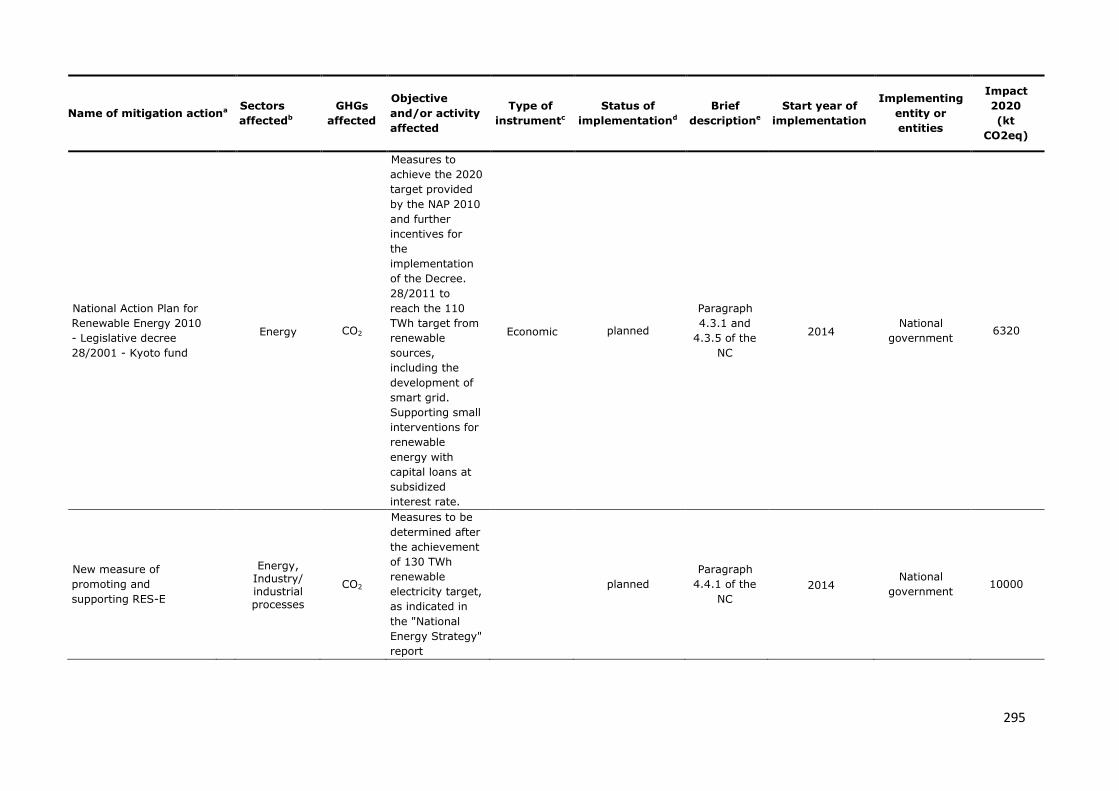
295
Name of mitigation actiona Sectors
affectedb
GHGs
affected
Objective
and/or activity
affected
Type of
instrumentc
Status of
implementationd
Brief
descriptione
Start year of
implementation
Implementing
entity or
entities
Impact
2020
(kt
CO2eq)
National Action Plan for
Renewable Energy 2010
- Legislative decree
28/2001 - Kyoto fund
Energy CO2
Measures to
achieve the 2020
target provided
by the NAP 2010
and further
incentives for
the
implementation
of the Decree.
28/2011 to
reach the 110
TWh target from
renewable
sources,
including the
development of
smart grid.
Supporting small
interventions for
renewable
energy with
capital loans at
subsidized
interest rate.
Economic planned
Paragraph
4.3.1 and
4.3.5 of the
NC
2014 National
government 6320
New measure of
promoting and
supporting RES-E
Energy, Industry/ industrial processes
CO2
Measures to be
determined after
the achievement
of 130 TWh
renewable
electricity target,
as indicated in
the "National
Energy Strategy"
report
planned
Paragraph
4.4.1 of the
NC
2014 National
government 10000
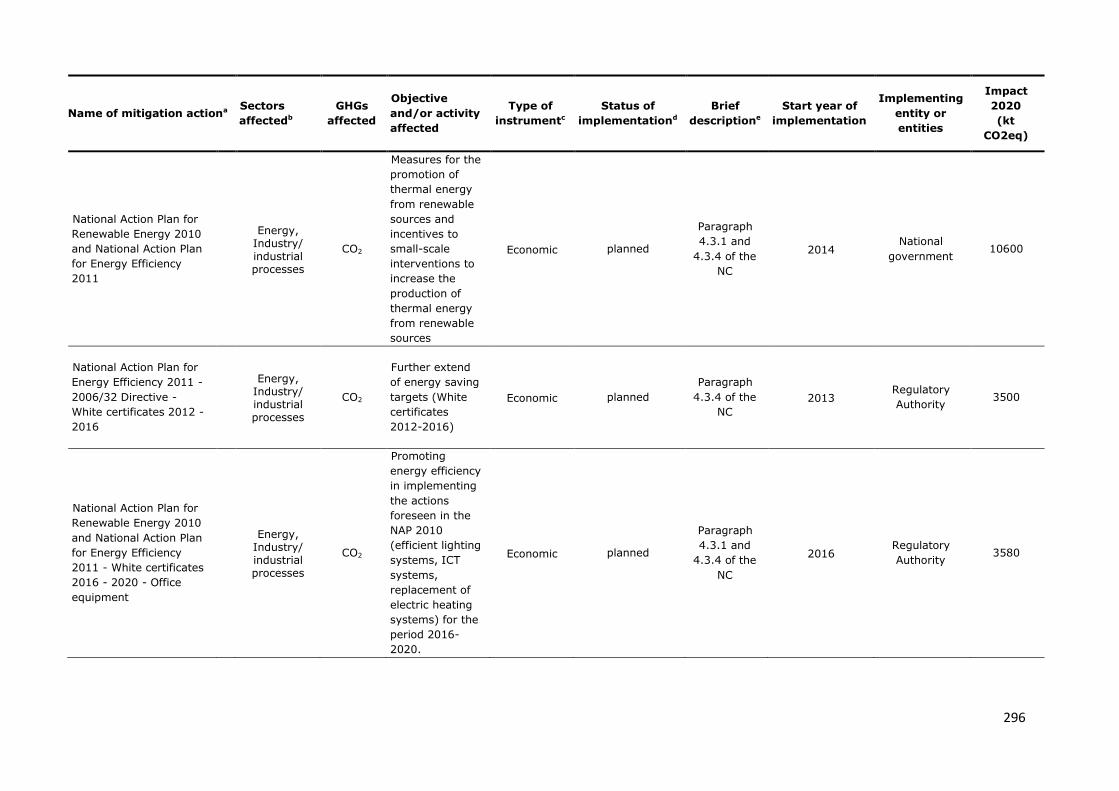
296
Name of mitigation actiona Sectors
affectedb
GHGs
affected
Objective
and/or activity
affected
Type of
instrumentc
Status of
implementationd
Brief
descriptione
Start year of
implementation
Implementing
entity or
entities
Impact
2020
(kt
CO2eq)
National Action Plan for
Renewable Energy 2010
and National Action Plan
for Energy Efficiency
2011
Energy, Industry/ industrial processes
CO2
Measures for the
promotion of
thermal energy
from renewable
sources and
incentives to
small-scale
interventions to
increase the
production of
thermal energy
from renewable
sources
Economic planned
Paragraph
4.3.1 and
4.3.4 of the
NC
2014 National
government 10600
National Action Plan for
Energy Efficiency 2011 -
2006/32 Directive -
White certificates 2012 -
2016
Energy, Industry/ industrial processes
CO2
Further extend
of energy saving
targets (White
certificates
2012-2016)
Economic planned
Paragraph
4.3.4 of the
NC
2013 Regulatory
Authority 3500
National Action Plan for
Renewable Energy 2010
and National Action Plan
for Energy Efficiency
2011 - White certificates
2016 - 2020 - Office
equipment
Energy, Industry/ industrial processes
CO2
Promoting
energy efficiency
in implementing
the actions
foreseen in the
NAP 2010
(efficient lighting
systems, ICT
systems,
replacement of
electric heating
systems) for the
period 2016-
2020.
Economic planned
Paragraph
4.3.1 and
4.3.4 of the
NC
2016 Regulatory
Authority 3580
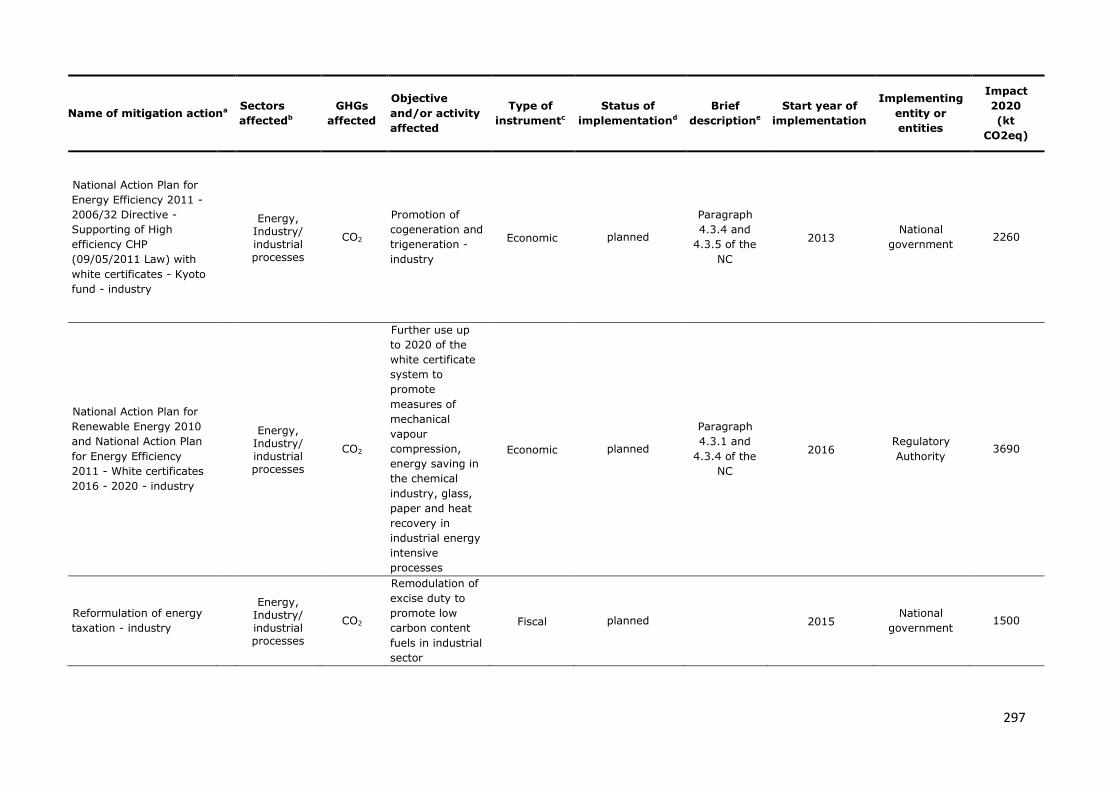
297
Name of mitigation actiona Sectors
affectedb
GHGs
affected
Objective
and/or activity
affected
Type of
instrumentc
Status of
implementationd
Brief
descriptione
Start year of
implementation
Implementing
entity or
entities
Impact
2020
(kt
CO2eq)
National Action Plan for
Energy Efficiency 2011 -
2006/32 Directive -
Supporting of High
efficiency CHP
(09/05/2011 Law) with
white certificates - Kyoto
fund - industry
Energy, Industry/ industrial processes
CO2
Promotion of
cogeneration and
trigeneration -
industry
Economic planned
Paragraph
4.3.4 and
4.3.5 of the
NC
2013 National
government 2260
National Action Plan for
Renewable Energy 2010
and National Action Plan
for Energy Efficiency
2011 - White certificates
2016 - 2020 - industry
Energy, Industry/ industrial processes
CO2
Further use up
to 2020 of the
white certificate
system to
promote
measures of
mechanical
vapour
compression,
energy saving in
the chemical
industry, glass,
paper and heat
recovery in
industrial energy
intensive
processes
Economic planned
Paragraph
4.3.1 and
4.3.4 of the
NC
2016 Regulatory
Authority 3690
Reformulation of energy
taxation - industry
Energy, Industry/ industrial processes
CO2
Remodulation of
excise duty to
promote low
carbon content
fuels in industrial
sector
Fiscal planned 2015 National
government 1500
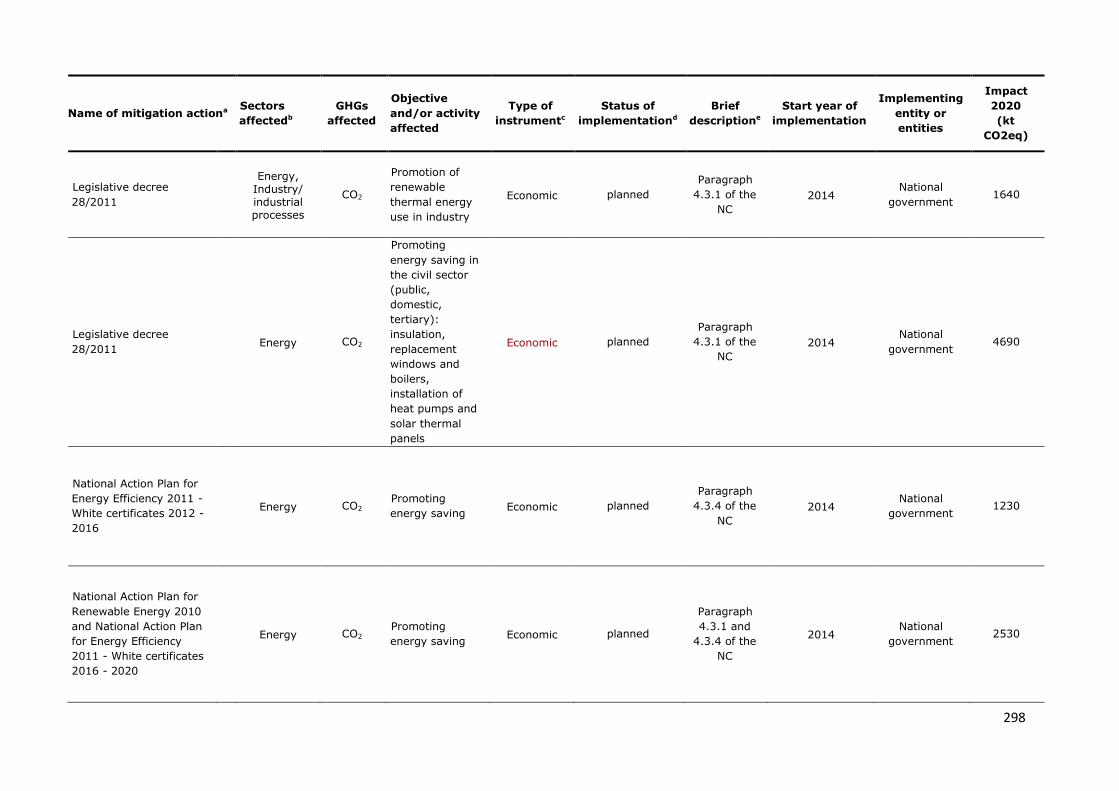
298
Name of mitigation actiona Sectors
affectedb
GHGs
affected
Objective
and/or activity
affected
Type of
instrumentc
Status of
implementationd
Brief
descriptione
Start year of
implementation
Implementing
entity or
entities
Impact
2020
(kt
CO2eq)
Legislative decree
28/2011
Energy, Industry/ industrial processes
CO2
Promotion of
renewable
thermal energy
use in industry
Economic planned
Paragraph
4.3.1 of the
NC
2014 National
government 1640
Legislative decree
28/2011 Energy CO2
Promoting
energy saving in
the civil sector
(public,
domestic,
tertiary):
insulation,
replacement
windows and
boilers,
installation of
heat pumps and
solar thermal
panels
Economic planned
Paragraph
4.3.1 of the
NC
2014 National
government 4690
National Action Plan for
Energy Efficiency 2011 -
White certificates 2012 -
2016
Energy CO2 Promoting
energy saving Economic planned
Paragraph
4.3.4 of the
NC
2014 National
government 1230
National Action Plan for
Renewable Energy 2010
and National Action Plan
for Energy Efficiency
2011 - White certificates
2016 - 2020
Energy CO2 Promoting
energy saving Economic planned
Paragraph
4.3.1 and
4.3.4 of the
NC
2014 National
government 2530
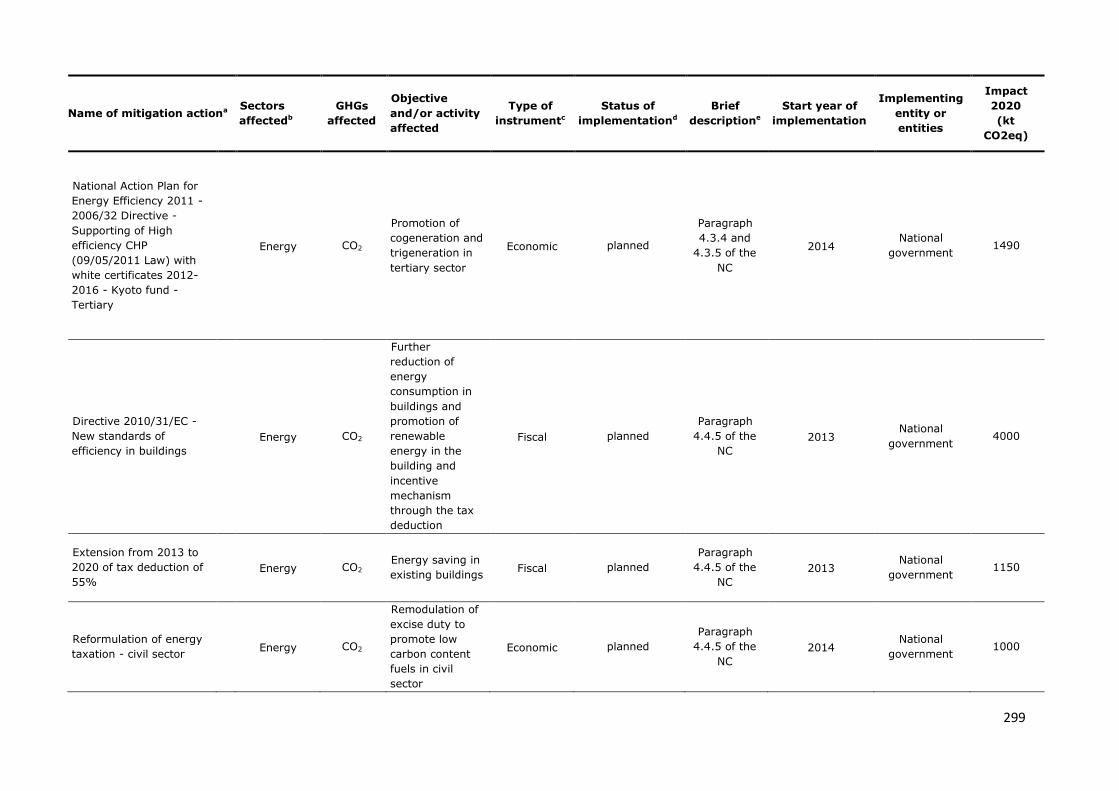
299
Name of mitigation actiona Sectors
affectedb
GHGs
affected
Objective
and/or activity
affected
Type of
instrumentc
Status of
implementationd
Brief
descriptione
Start year of
implementation
Implementing
entity or
entities
Impact
2020
(kt
CO2eq)
National Action Plan for
Energy Efficiency 2011 -
2006/32 Directive -
Supporting of High
efficiency CHP
(09/05/2011 Law) with
white certificates 2012-
2016 - Kyoto fund -
Tertiary
Energy CO2
Promotion of
cogeneration and
trigeneration in
tertiary sector
Economic planned
Paragraph
4.3.4 and
4.3.5 of the
NC
2014 National
government 1490
Directive 2010/31/EC -
New standards of
efficiency in buildings
Energy CO2
Further
reduction of
energy
consumption in
buildings and
promotion of
renewable
energy in the
building and
incentive
mechanism
through the tax
deduction
Fiscal planned
Paragraph
4.4.5 of the
NC
2013 National
government 4000
Extension from 2013 to
2020 of tax deduction of
55%
Energy CO2 Energy saving in
existing buildings Fiscal planned
Paragraph
4.4.5 of the
NC
2013 National
government 1150
Reformulation of energy
taxation - civil sector Energy CO2
Remodulation of
excise duty to
promote low
carbon content
fuels in civil
sector
Economic planned
Paragraph
4.4.5 of the
NC
2014 National
government 1000
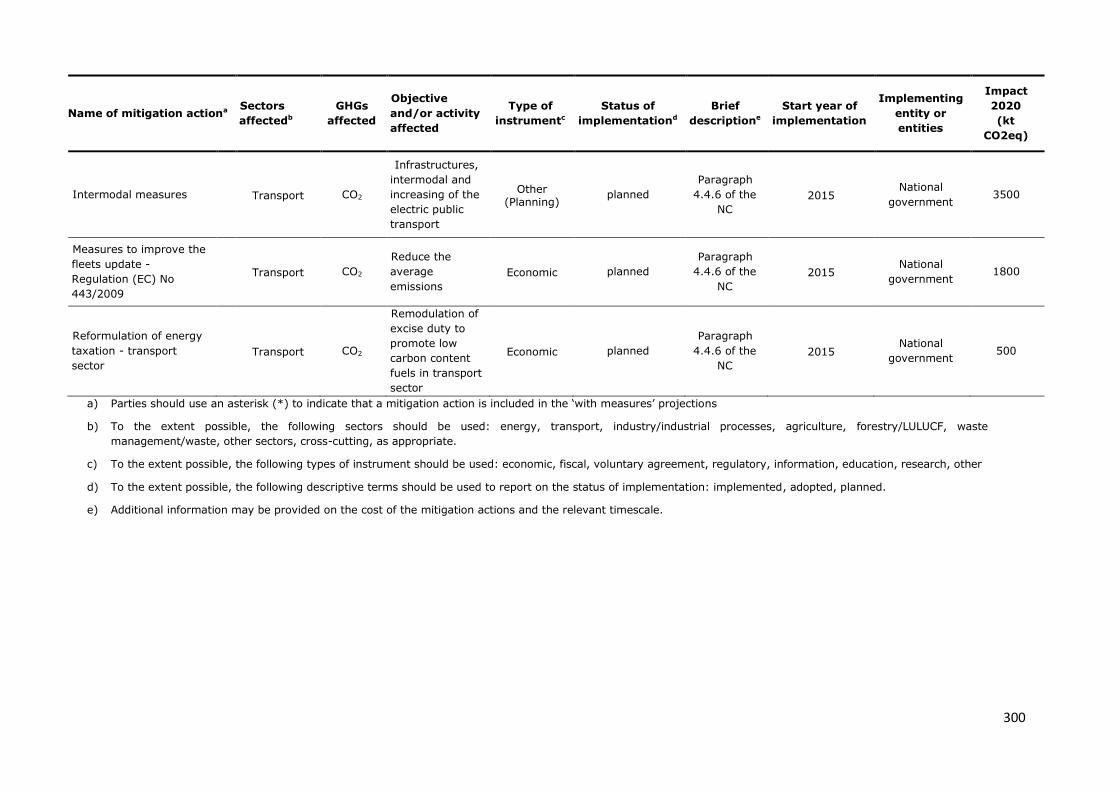
300
Name of mitigation actiona Sectors
affectedb
GHGs
affected
Objective
and/or activity
affected
Type of
instrumentc
Status of
implementationd
Brief
descriptione
Start year of
implementation
Implementing
entity or
entities
Impact
2020
(kt
CO2eq)
Intermodal measures Transport CO2
Infrastructures,
intermodal and
increasing of the
electric public
transport
Other (Planning)
planned
Paragraph
4.4.6 of the
NC
2015 National
government 3500
Measures to improve the
fleets update -
Regulation (EC) No
443/2009
Transport CO2
Reduce the
average
emissions
Economic planned
Paragraph
4.4.6 of the
NC
2015 National
government 1800
Reformulation of energy
taxation - transport
sector
Transport CO2
Remodulation of
excise duty to
promote low
carbon content
fuels in transport
sector
Economic planned
Paragraph
4.4.6 of the
NC
2015 National
government 500
a) Parties should use an asterisk (*) to indicate that a mitigation action is included in the ‘with measures’ projections
b) To the extent possible, the following sectors should be used: energy, transport, industry/industrial processes, agriculture, forestry/LULUCF, waste
management/waste, other sectors, cross-cutting, as appropriate.
c) To the extent possible, the following types of instrument should be used: economic, fiscal, voluntary agreement, regulatory, information, education, research, other
d) To the extent possible, the following descriptive terms should be used to report on the status of implementation: implemented, adopted, planned.
e) Additional information may be provided on the cost of the mitigation actions and the relevant timescale.

301
4.2 Estimates of emission reductions and removals and the use of units from the market-based mechanisms and land use, land-use
changes and forestry activities
The relevant information is provided in CTF Tables 4, 4(a)II and 4(b).
In Table 4 total emissions excluding LULUCF as reported in 2013 submission to the UNFCCC, in the framework of the Convention and the Kyoto Protocol, are
included. Preliminary data have been estimated for 2012.
The contribution from LULUCF has been deduced from the accounting tables provided to the UNFCCC where 2012 data has been estimated as average of the
2008-2011 figures.
CTF Table 4 - Reporting on progress
Total emissions
excluding LULUCF
Contribution
from LULUCFd
Quantity of units from market based
mechanisms under the Convention
Quantity of units from other
market based mechanisms
Yearc (kt CO2 eq) (kt CO2 eq) (number of units) (kt CO2 eq) (number of
units) (kt CO2 eq)
1990 518,984.17 NA NO NO NO NO
2010 500,313.89 -17,631.40 NO NO NO NO
2011 488,792.02 -16,276.40 597,088,153.00 597,088.15
2012 464,553.41 -16,787.65 190,106,903.00 190,106.91
Notes:
Abbreviation: GHG = greenhouse gas, LULUCF = land use, land-use change and forestry.
a Reporting by a developed country Party on the information specified in the common tabular format does not prejudge the position of other Parties with regard to the
treatment of units from market-based mechanisms under the Convention or other market-based mechanisms towards achievement of quantified economy-wide emission
reduction targets.
b For the base year, information reported on the emission reduction target shall include the following: (a) total GHG emissions, excluding emissions and removals from
the LULUCF sector; (b) emissions and/or removals from the LULUCF sector based on the accounting approach applied taking into consideration any relevant decisions of
the Conference of the Parties and the activities and/or land that will be accounted for; (c) total GHG emissions, including emissions and removals from the LULUCF
sector. For each reported year, information reported on progress made towards the emission reduction targets shall include, in addition to the information noted in
paragraphs 9(a–c) of the UNFCCC biennial reporting guidelines for developed country Parties, information on the use of units from market-based mechanisms.
c Parties may add additional rows for years other than those specified below.
d Information in this column should be consistent with the information reported in table 4(a)I or 4(a)II, as appropriate. The Parties for which all relevant information on
the LULUCF contribution is reported in table 1 of this common tabular format can refer to table 1.
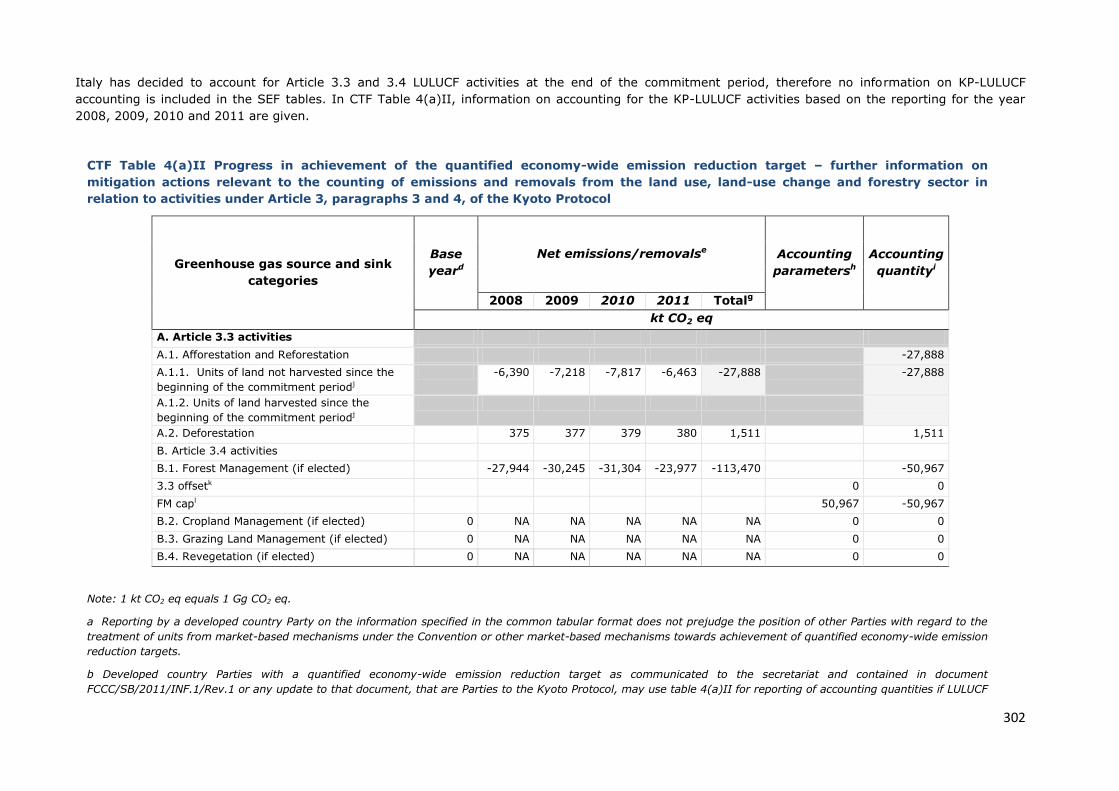
302
Italy has decided to account for Article 3.3 and 3.4 LULUCF activities at the end of the commitment period, therefore no information on KP-LULUCF
accounting is included in the SEF tables. In CTF Table 4(a)II, information on accounting for the KP-LULUCF activities based on the reporting for the year
2008, 2009, 2010 and 2011 are given.
CTF Table 4(a)II Progress in achievement of the quantified economy-wide emission reduction target – further information on
mitigation actions relevant to the counting of emissions and removals from the land use, land-use change and forestry sector in
relation to activities under Article 3, paragraphs 3 and 4, of the Kyoto Protocol
Greenhouse gas source and sink
categories
Base
yeard
Net emissions/removalse Accounting
parametersh
Accounting
quantityi
2008 2009 2010 2011 Totalg
kt CO2 eq
A. Article 3.3 activities
A.1. Afforestation and Reforestation -27,888
A.1.1. Units of land not harvested since the
beginning of the commitment periodj
-6,390 -7,218 -7,817 -6,463 -27,888 -27,888
A.1.2. Units of land harvested since the
beginning of the commitment periodj
A.2. Deforestation 375 377 379 380 1,511 1,511
B. Article 3.4 activities
B.1. Forest Management (if elected) -27,944 -30,245 -31,304 -23,977 -113,470 -50,967
3.3 offsetk 0 0
FM capl 50,967 -50,967
B.2. Cropland Management (if elected) 0 NA NA NA NA NA 0 0
B.3. Grazing Land Management (if elected) 0 NA NA NA NA NA 0 0
B.4. Revegetation (if elected) 0 NA NA NA NA NA 0 0
Note: 1 kt CO2 eq equals 1 Gg CO2 eq.
a Reporting by a developed country Party on the information specified in the common tabular format does not prejudge the position of other Parties with regard to the
treatment of units from market-based mechanisms under the Convention or other market-based mechanisms towards achievement of quantified economy-wide emission
reduction targets.
b Developed country Parties with a quantified economy-wide emission reduction target as communicated to the secretariat and contained in document
FCCC/SB/2011/INF.1/Rev.1 or any update to that document, that are Parties to the Kyoto Protocol, may use table 4(a)II for reporting of accounting quantities if LULUCF
303
is contributing to the attainment of that target.
c Parties can include references to the relevant parts of the national inventory report, where accounting methodologies regarding LULUCF are further described in the
documentation box or in the biennial reports.
d Net emissions and removals in the Party’s base year, as established by decision 9/CP.2.
e All values are reported in the information table on accounting for activities under Article 3, paragraphs 3 and 4, of the Kyoto Protocol, of the CRF for the relevant
inventory year as reported in the current submission and are automatically entered in this table.
f Additional columns for relevant years should be added, if applicable.
g Cumulative net emissions and removals for all years of the commitment period reported in the current submission.
h The values in the cells “3.3 offset” and “Forest management cap” are absolute values.
i The accounting quantity is the total quantity of units to be added to or subtracted from a Party’s assigned amount for a particular activity in accordance with the
provisions of Article 7, paragraph 4, of the Kyoto Protocol.
j In accordance with paragraph 4 of the annex to decision 16/CMP.1, debits resulting from harvesting during the first commitment period following afforestation and
reforestation since 1990 shall not be greater than the credits accounted for on that unit of land.
k In accordance with paragraph 10 of the annex to decision 16/CMP.1, for the first commitment period a Party included in Annex I that incurs a net source of emissions
under the provisions of Article 3 paragraph 3, may account for anthropogenic greenhouse gas emissions by sources and removals by sinks in areas under forest
management under Article 3, paragraph 4, up to a level that is equal to the net source of emissions under the provisions of Article 3, paragraph 3, but not greater than
9.0 megatonnes of carbon times five, if the total anthropogenic greenhouse gas emissions by sources and removals by sinks in the managed forest since 1990 is equal
to, or larger than, the net source of emissions incurred under Article 3, paragraph 3.
l In accordance with paragraph 11 of the annex to decision 16/CMP.1, for the first commitment period of the Kyoto Protocol only, additions to and subtractions from the
assigned amount of a Party resulting from Forest management under Article 3, paragraph 4, after the application of paragraph 10 of the annex to decision 16/CMP.1 and
resulting from forest management project activities undertaken under Article 6, shall not exceed the value inscribed in the appendix of the annex to decision 16/CMP.1,
times five.
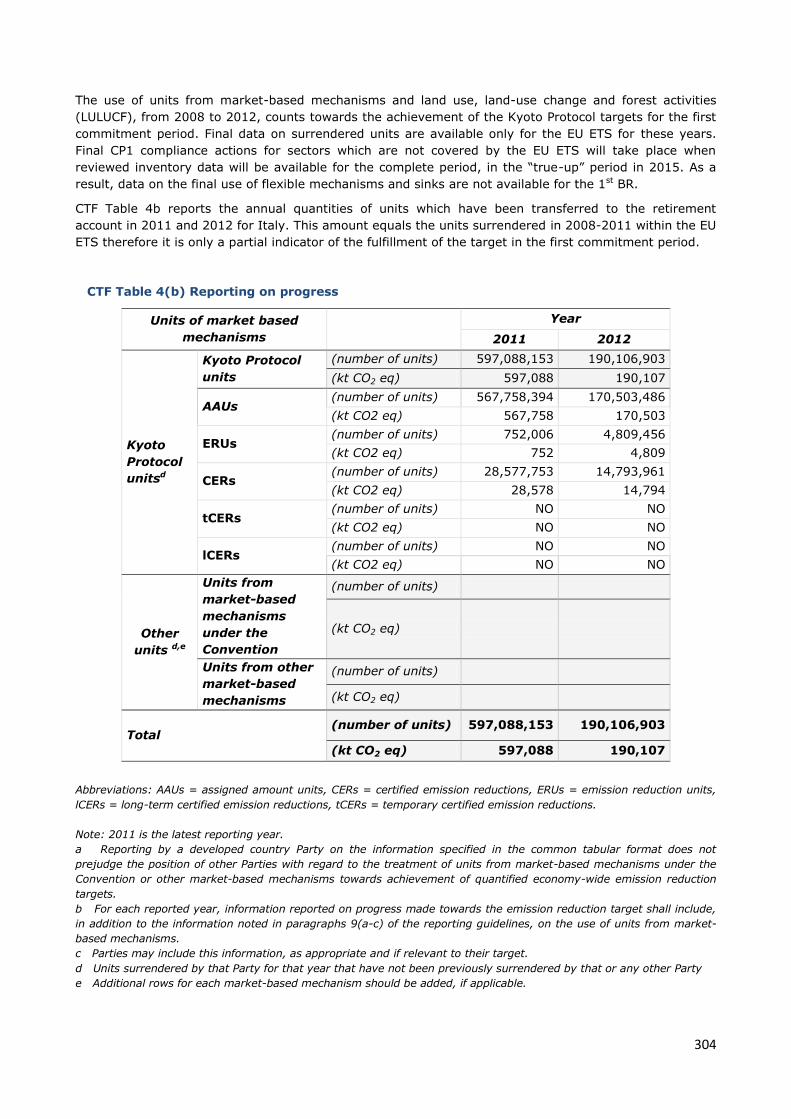
304
The use of units from market-based mechanisms and land use, land-use change and forest activities
(LULUCF), from 2008 to 2012, counts towards the achievement of the Kyoto Protocol targets for the first
commitment period. Final data on surrendered units are available only for the EU ETS for these years.
Final CP1 compliance actions for sectors which are not covered by the EU ETS will take place when
reviewed inventory data will be available for the complete period, in the “true-up” period in 2015. As a
result, data on the final use of flexible mechanisms and sinks are not available for the 1st BR.
CTF Table 4b reports the annual quantities of units which have been transferred to the retirement
account in 2011 and 2012 for Italy. This amount equals the units surrendered in 2008-2011 within the EU
ETS therefore it is only a partial indicator of the fulfillment of the target in the first commitment period.
CTF Table 4(b) Reporting on progress
Units of market based
mechanisms
Year
2011 2012
Kyoto
Protocol
unitsd
Kyoto Protocol
units
(number of units) 597,088,153 190,106,903
(kt CO2 eq) 597,088 190,107
AAUs (number of units) 567,758,394 170,503,486
(kt CO2 eq) 567,758 170,503
ERUs (number of units) 752,006 4,809,456
(kt CO2 eq) 752 4,809
CERs (number of units) 28,577,753 14,793,961
(kt CO2 eq) 28,578 14,794
tCERs (number of units) NO NO
(kt CO2 eq) NO NO
lCERs (number of units) NO NO
(kt CO2 eq) NO NO
Other
units d,e
Units from
market-based
mechanisms
under the
Convention
(number of units)
(kt CO2 eq)
Units from other
market-based
mechanisms
(number of units)
(kt CO2 eq)
Total (number of units) 597,088,153 190,106,903
(kt CO2 eq) 597,088 190,107
Abbreviations: AAUs = assigned amount units, CERs = certified emission reductions, ERUs = emission reduction units,
lCERs = long-term certified emission reductions, tCERs = temporary certified emission reductions.
Note: 2011 is the latest reporting year.
a Reporting by a developed country Party on the information specified in the common tabular format does not
prejudge the position of other Parties with regard to the treatment of units from market-based mechanisms under the
Convention or other market-based mechanisms towards achievement of quantified economy-wide emission reduction
targets.
b For each reported year, information reported on progress made towards the emission reduction target shall include,
in addition to the information noted in paragraphs 9(a-c) of the reporting guidelines, on the use of units from market-
based mechanisms.
c Parties may include this information, as appropriate and if relevant to their target.
d Units surrendered by that Party for that year that have not been previously surrendered by that or any other Party
e Additional rows for each market-based mechanism should be added, if applicable.
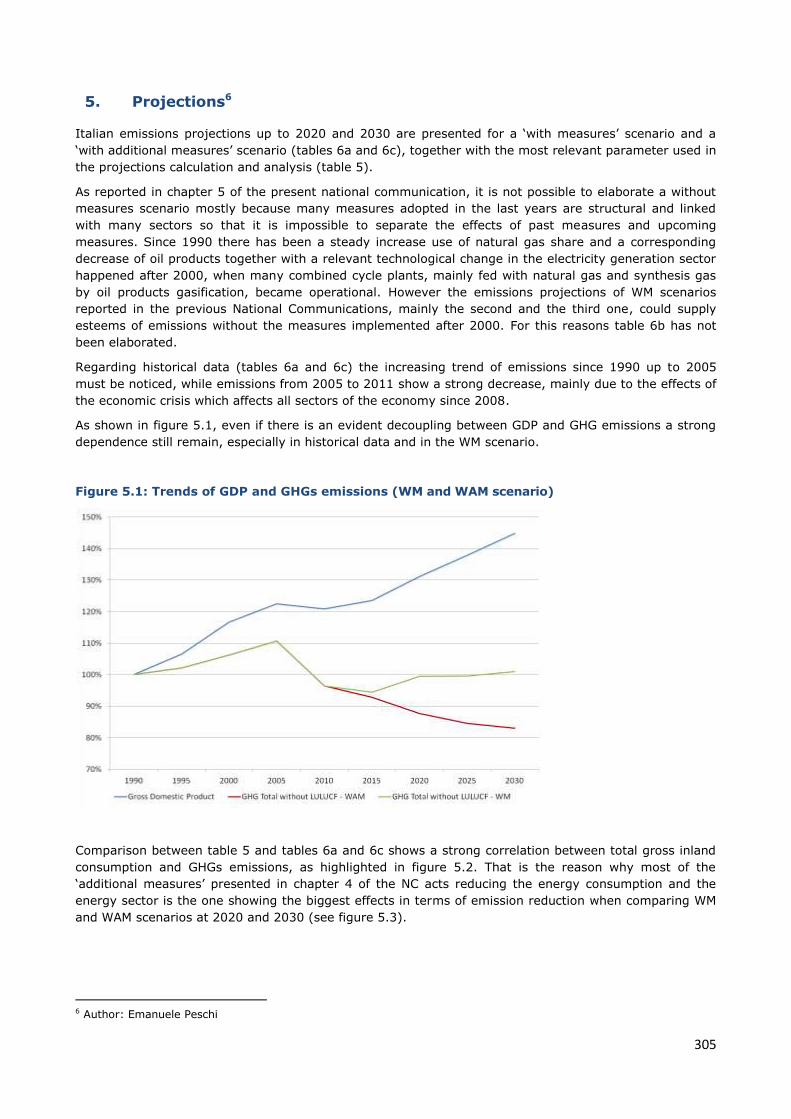
305
5. Projections6
Italian emissions projections up to 2020 and 2030 are presented for a ‘with measures’ scenario and a
‘with additional measures’ scenario (tables 6a and 6c), together with the most relevant parameter used in
the projections calculation and analysis (table 5).
As reported in chapter 5 of the present national communication, it is not possible to elaborate a without
measures scenario mostly because many measures adopted in the last years are structural and linked
with many sectors so that it is impossible to separate the effects of past measures and upcoming
measures. Since 1990 there has been a steady increase use of natural gas share and a corresponding
decrease of oil products together with a relevant technological change in the electricity generation sector
happened after 2000, when many combined cycle plants, mainly fed with natural gas and synthesis gas
by oil products gasification, became operational. However the emissions projections of WM scenarios
reported in the previous National Communications, mainly the second and the third one, could supply
esteems of emissions without the measures implemented after 2000. For this reasons table 6b has not
been elaborated.
Regarding historical data (tables 6a and 6c) the increasing trend of emissions since 1990 up to 2005
must be noticed, while emissions from 2005 to 2011 show a strong decrease, mainly due to the effects of
the economic crisis which affects all sectors of the economy since 2008.
As shown in figure 5.1, even if there is an evident decoupling between GDP and GHG emissions a strong
dependence still remain, especially in historical data and in the WM scenario.
Figure 5.1: Trends of GDP and GHGs emissions (WM and WAM scenario)
Comparison between table 5 and tables 6a and 6c shows a strong correlation between total gross inland
consumption and GHGs emissions, as highlighted in figure 5.2. That is the reason why most of the
‘additional measures’ presented in chapter 4 of the NC acts reducing the energy consumption and the
energy sector is the one showing the biggest effects in terms of emission reduction when comparing WM
and WAM scenarios at 2020 and 2030 (see figure 5.3).
6 Author: Emanuele Peschi
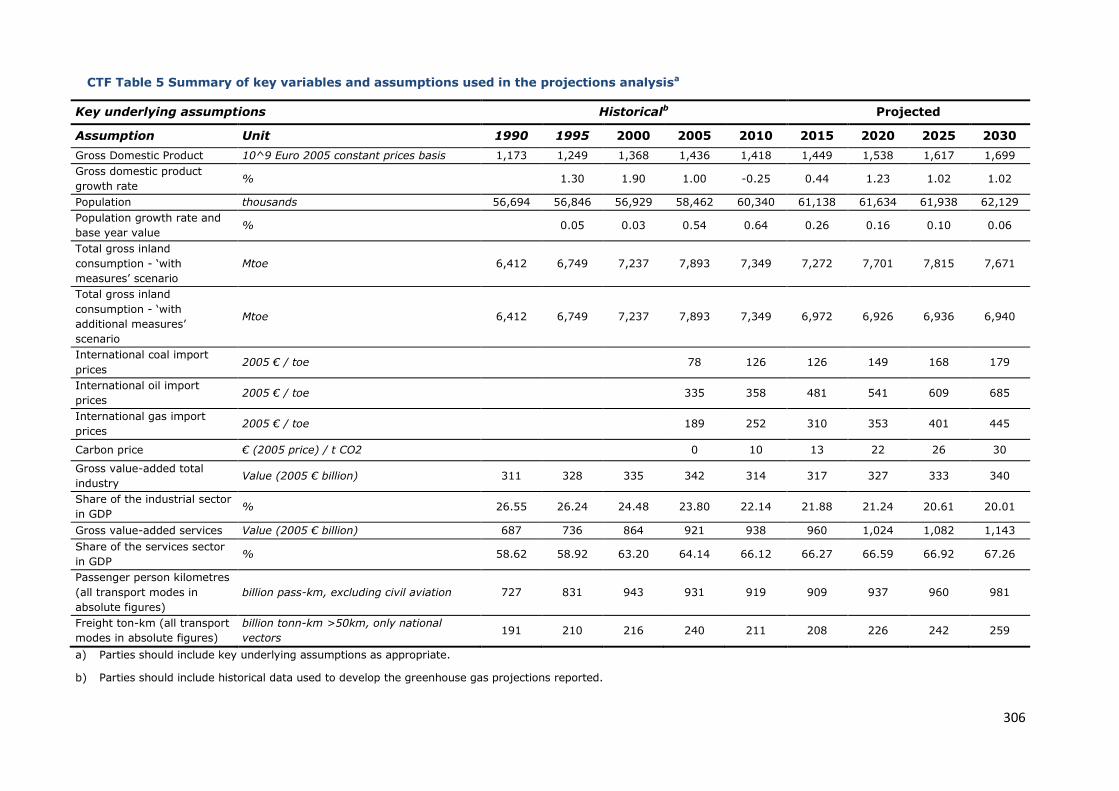
306
CTF Table 5 Summary of key variables and assumptions used in the projections analysisa
Key underlying assumptions Historicalb Projected
Assumption Unit 1990 1995 2000 2005 2010 2015 2020 2025 2030
Gross Domestic Product 10^9 Euro 2005 constant prices basis 1,173 1,249 1,368 1,436 1,418 1,449 1,538 1,617 1,699
Gross domestic product
growth rate % 1.30 1.90 1.00 -0.25 0.44 1.23 1.02 1.02
Population thousands 56,694 56,846 56,929 58,462 60,340 61,138 61,634 61,938 62,129
Population growth rate and
base year value % 0.05 0.03 0.54 0.64 0.26 0.16 0.10 0.06
Total gross inland
consumption - ‘with
measures’ scenario
Mtoe 6,412 6,749 7,237 7,893 7,349 7,272 7,701 7,815 7,671
Total gross inland
consumption - ‘with
additional measures’
scenario
Mtoe 6,412 6,749 7,237 7,893 7,349 6,972 6,926 6,936 6,940
International coal import
prices 2005 € / toe 78 126 126 149 168 179
International oil import
prices 2005 € / toe 335 358 481 541 609 685
International gas import
prices 2005 € / toe 189 252 310 353 401 445
Carbon price € (2005 price) / t CO2 0 10 13 22 26 30
Gross value-added total
industry Value (2005 € billion) 311 328 335 342 314 317 327 333 340
Share of the industrial sector
in GDP % 26.55 26.24 24.48 23.80 22.14 21.88 21.24 20.61 20.01
Gross value-added services Value (2005 € billion) 687 736 864 921 938 960 1,024 1,082 1,143
Share of the services sector
in GDP % 58.62 58.92 63.20 64.14 66.12 66.27 66.59 66.92 67.26
Passenger person kilometres
(all transport modes in
absolute figures)
billion pass-km, excluding civil aviation 727 831 943 931 919 909 937 960 981
Freight ton-km (all transport
modes in absolute figures)
billion tonn-km >50km, only national
vectors 191 210 216 240 211 208 226 242 259
a) Parties should include key underlying assumptions as appropriate.
b) Parties should include historical data used to develop the greenhouse gas projections reported.
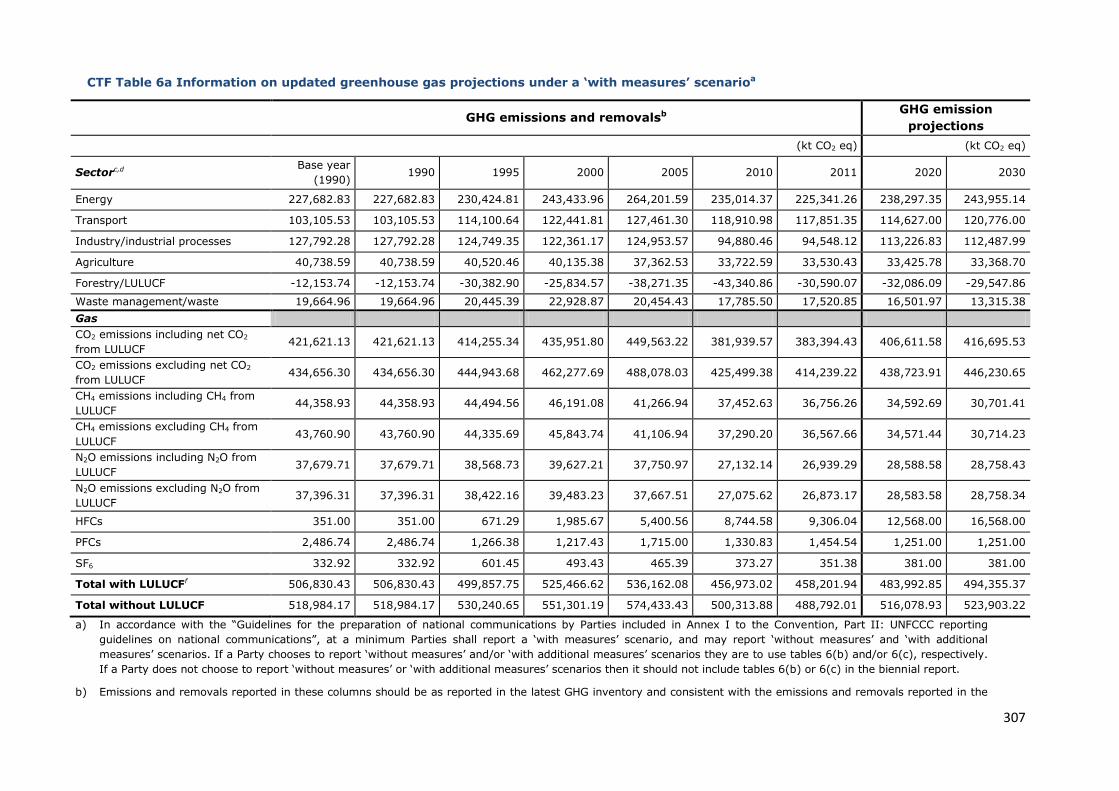
307
CTF Table 6a Information on updated greenhouse gas projections under a ‘with measures’ scenarioa
GHG emissions and removalsb GHG emission
projections
(kt CO2 eq) (kt CO2 eq)
Sectorc,d Base year
(1990) 1990 1995 2000 2005 2010 2011 2020 2030
Energy 227,682.83 227,682.83 230,424.81 243,433.96 264,201.59 235,014.37 225,341.26 238,297.35 243,955.14
Transport 103,105.53 103,105.53 114,100.64 122,441.81 127,461.30 118,910.98 117,851.35 114,627.00 120,776.00
Industry/industrial processes 127,792.28 127,792.28 124,749.35 122,361.17 124,953.57 94,880.46 94,548.12 113,226.83 112,487.99
Agriculture 40,738.59 40,738.59 40,520.46 40,135.38 37,362.53 33,722.59 33,530.43 33,425.78 33,368.70
Forestry/LULUCF -12,153.74 -12,153.74 -30,382.90 -25,834.57 -38,271.35 -43,340.86 -30,590.07 -32,086.09 -29,547.86
Waste management/waste 19,664.96 19,664.96 20,445.39 22,928.87 20,454.43 17,785.50 17,520.85 16,501.97 13,315.38
Gas
CO2 emissions including net CO2
from LULUCF 421,621.13 421,621.13 414,255.34 435,951.80 449,563.22 381,939.57 383,394.43 406,611.58 416,695.53
CO2 emissions excluding net CO2
from LULUCF 434,656.30 434,656.30 444,943.68 462,277.69 488,078.03 425,499.38 414,239.22 438,723.91 446,230.65
CH4 emissions including CH4 from
LULUCF 44,358.93 44,358.93 44,494.56 46,191.08 41,266.94 37,452.63 36,756.26 34,592.69 30,701.41
CH4 emissions excluding CH4 from
LULUCF 43,760.90 43,760.90 44,335.69 45,843.74 41,106.94 37,290.20 36,567.66 34,571.44 30,714.23
N2O emissions including N2O from
LULUCF 37,679.71 37,679.71 38,568.73 39,627.21 37,750.97 27,132.14 26,939.29 28,588.58 28,758.43
N2O emissions excluding N2O from
LULUCF 37,396.31 37,396.31 38,422.16 39,483.23 37,667.51 27,075.62 26,873.17 28,583.58 28,758.34
HFCs 351.00 351.00 671.29 1,985.67 5,400.56 8,744.58 9,306.04 12,568.00 16,568.00
PFCs 2,486.74 2,486.74 1,266.38 1,217.43 1,715.00 1,330.83 1,454.54 1,251.00 1,251.00
SF6 332.92 332.92 601.45 493.43 465.39 373.27 351.38 381.00 381.00
Total with LULUCFf 506,830.43 506,830.43 499,857.75 525,466.62 536,162.08 456,973.02 458,201.94 483,992.85 494,355.37
Total without LULUCF 518,984.17 518,984.17 530,240.65 551,301.19 574,433.43 500,313.88 488,792.01 516,078.93 523,903.22
a) In accordance with the “Guidelines for the preparation of national communications by Parties included in Annex I to the Convention, Part II: UNFCCC reporting
guidelines on national communications”, at a minimum Parties shall report a ‘with measures’ scenario, and may report ‘without measures’ and ‘with additional
measures’ scenarios. If a Party chooses to report ‘without measures’ and/or ‘with additional measures’ scenarios they are to use tables 6(b) and/or 6(c), respectively.
If a Party does not choose to report ‘without measures’ or ‘with additional measures’ scenarios then it should not include tables 6(b) or 6(c) in the biennial report.
b) Emissions and removals reported in these columns should be as reported in the latest GHG inventory and consistent with the emissions and removals reported in the
308
table on GHG emissions and trends provided in this biennial report. Where the sectoral breakdown differs from that reported in the GHG inventory Parties should
explain in their biennial report how the inventory sectors relate to the sectors reported in this table.
c) In accordance with paragraph 34 of the “Guidelines for the preparation of national communications by Parties included in Annex I to the Convention, Part II: UNFCCC
reporting guidelines on national communications”, projections shall be presented on a sectoral basis, to the extent possible, using the same sectoral categories used in
the policies and measures section. This table should follow, to the extent possible, the same sectoral categories as those listed in paragraph 17 of those guidelines,
namely, to the extent appropriate, the following sectors should be considered: energy, transport, industry, agriculture, forestry and waste management.
d) To the extent possible, the following sectors should be used: energy, transport, industry/industrial processes, agriculture, forestry/LULUCF, waste management/waste,
other sectors (i.e. cross-cutting), as appropriate.
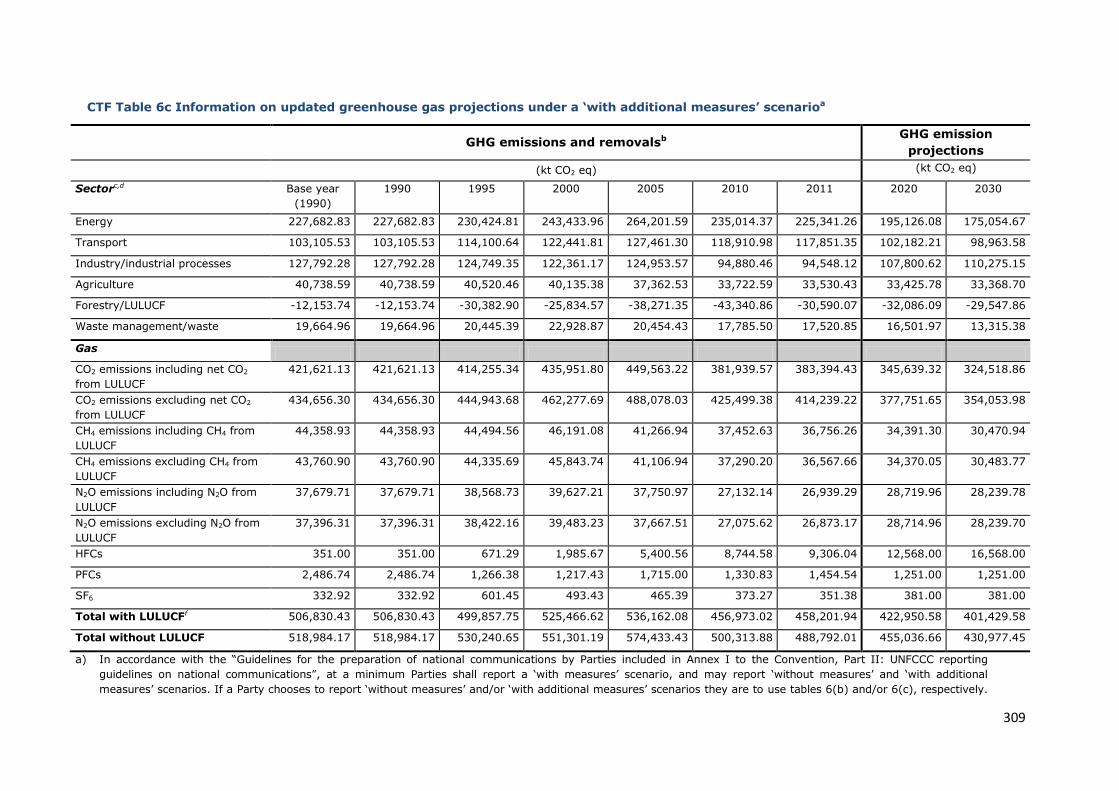
309
CTF Table 6c Information on updated greenhouse gas projections under a ‘with additional measures’ scenarioa
GHG emissions and removalsb GHG emission
projections
(kt CO2 eq) (kt CO2 eq)
Sectorc,d Base year
(1990)
1990 1995 2000 2005 2010 2011 2020 2030
Energy 227,682.83 227,682.83 230,424.81 243,433.96 264,201.59 235,014.37 225,341.26 195,126.08 175,054.67
Transport 103,105.53 103,105.53 114,100.64 122,441.81 127,461.30 118,910.98 117,851.35 102,182.21 98,963.58
Industry/industrial processes 127,792.28 127,792.28 124,749.35 122,361.17 124,953.57 94,880.46 94,548.12 107,800.62 110,275.15
Agriculture 40,738.59 40,738.59 40,520.46 40,135.38 37,362.53 33,722.59 33,530.43 33,425.78 33,368.70
Forestry/LULUCF -12,153.74 -12,153.74 -30,382.90 -25,834.57 -38,271.35 -43,340.86 -30,590.07 -32,086.09 -29,547.86
Waste management/waste 19,664.96 19,664.96 20,445.39 22,928.87 20,454.43 17,785.50 17,520.85 16,501.97 13,315.38
Gas
CO2 emissions including net CO2
from LULUCF
421,621.13 421,621.13 414,255.34 435,951.80 449,563.22 381,939.57 383,394.43 345,639.32 324,518.86
CO2 emissions excluding net CO2
from LULUCF
434,656.30 434,656.30 444,943.68 462,277.69 488,078.03 425,499.38 414,239.22 377,751.65 354,053.98
CH4 emissions including CH4 from
LULUCF
44,358.93 44,358.93 44,494.56 46,191.08 41,266.94 37,452.63 36,756.26 34,391.30 30,470.94
CH4 emissions excluding CH4 from
LULUCF
43,760.90 43,760.90 44,335.69 45,843.74 41,106.94 37,290.20 36,567.66 34,370.05 30,483.77
N2O emissions including N2O from
LULUCF
37,679.71 37,679.71 38,568.73 39,627.21 37,750.97 27,132.14 26,939.29 28,719.96 28,239.78
N2O emissions excluding N2O from
LULUCF
37,396.31 37,396.31 38,422.16 39,483.23 37,667.51 27,075.62 26,873.17 28,714.96 28,239.70
HFCs 351.00 351.00 671.29 1,985.67 5,400.56 8,744.58 9,306.04 12,568.00 16,568.00
PFCs 2,486.74 2,486.74 1,266.38 1,217.43 1,715.00 1,330.83 1,454.54 1,251.00 1,251.00
SF6 332.92 332.92 601.45 493.43 465.39 373.27 351.38 381.00 381.00
Total with LULUCFf 506,830.43 506,830.43 499,857.75 525,466.62 536,162.08 456,973.02 458,201.94 422,950.58 401,429.58
Total without LULUCF 518,984.17 518,984.17 530,240.65 551,301.19 574,433.43 500,313.88 488,792.01 455,036.66 430,977.45
a) In accordance with the “Guidelines for the preparation of national communications by Parties included in Annex I to the Convention, Part II: UNFCCC reporting
guidelines on national communications”, at a minimum Parties shall report a ‘with measures’ scenario, and may report ‘without measures’ and ‘with additional
measures’ scenarios. If a Party chooses to report ‘without measures’ and/or ‘with additional measures’ scenarios they are to use tables 6(b) and/or 6(c), respectively.
310
If a Party does not choose to report ‘without measures’ or ‘with additional measures’ scenarios then it should not include tables 6(b) or 6(c) in the biennial report.
b) Emissions and removals reported in these columns should be as reported in the latest GHG inventory and consistent with the emissions and removals reported in the
table on GHG emissions and trends provided in this biennial report. Where the sectoral breakdown differs from that reported in the GHG inventory Parties should
explain in their biennial report how the inventory sectors relate to the sectors reported in this table.
c) In accordance with paragraph 34 of the “Guidelines for the preparation of national communications by Parties included in Annex I to the Convention, Part II: UNFCCC
reporting guidelines on national communications”, projections shall be presented on a sectoral basis, to the extent possible, using the same sectoral categories used in
the policies and measures section. This table should follow, to the extent possible, the same sectoral categories as those listed in paragraph 17 of those guidelines,
namely, to the extent appropriate, the following sectors should be considered: energy, transport, industry, agriculture, forestry and waste management.
d) To the extent possible, the following sectors should be used: energy, transport, industry/industrial processes, agriculture, forestry/LULUCF, waste management/waste,
other sectors (i.e. cross-cutting), as appropriate.
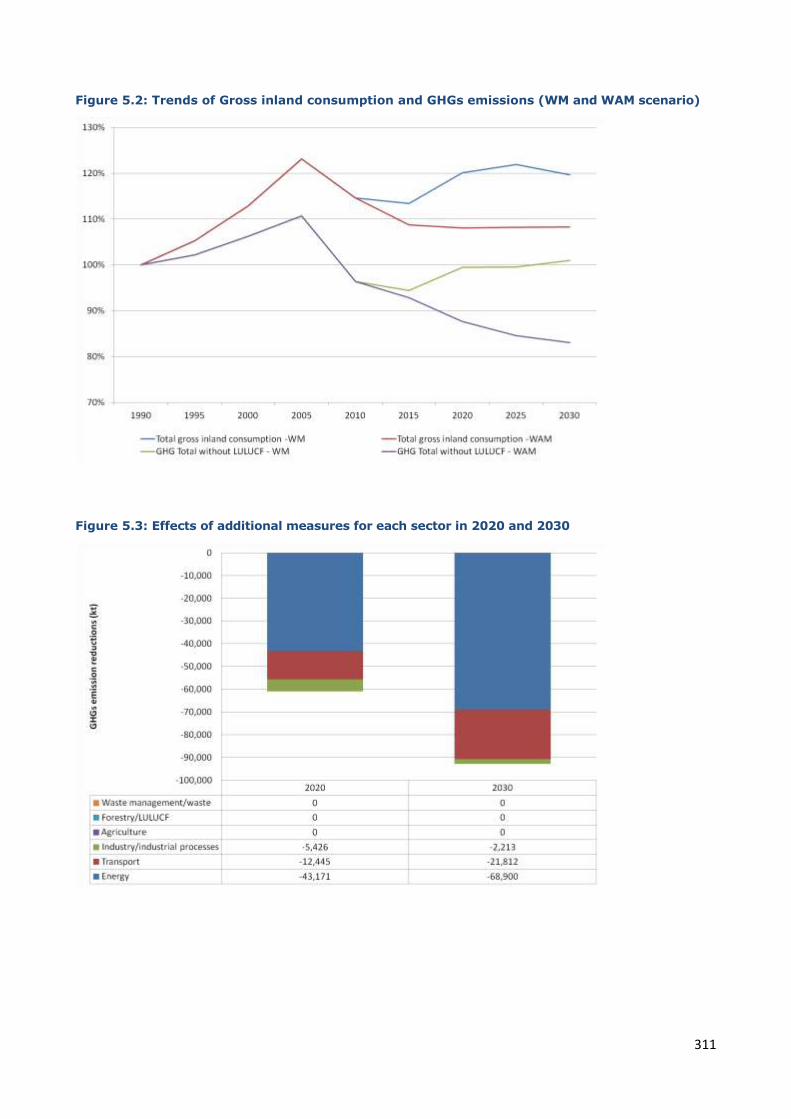
311
Figure 5.2: Trends of Gross inland consumption and GHGs emissions (WM and WAM scenario)
Figure 5.3: Effects of additional measures for each sector in 2020 and 2030
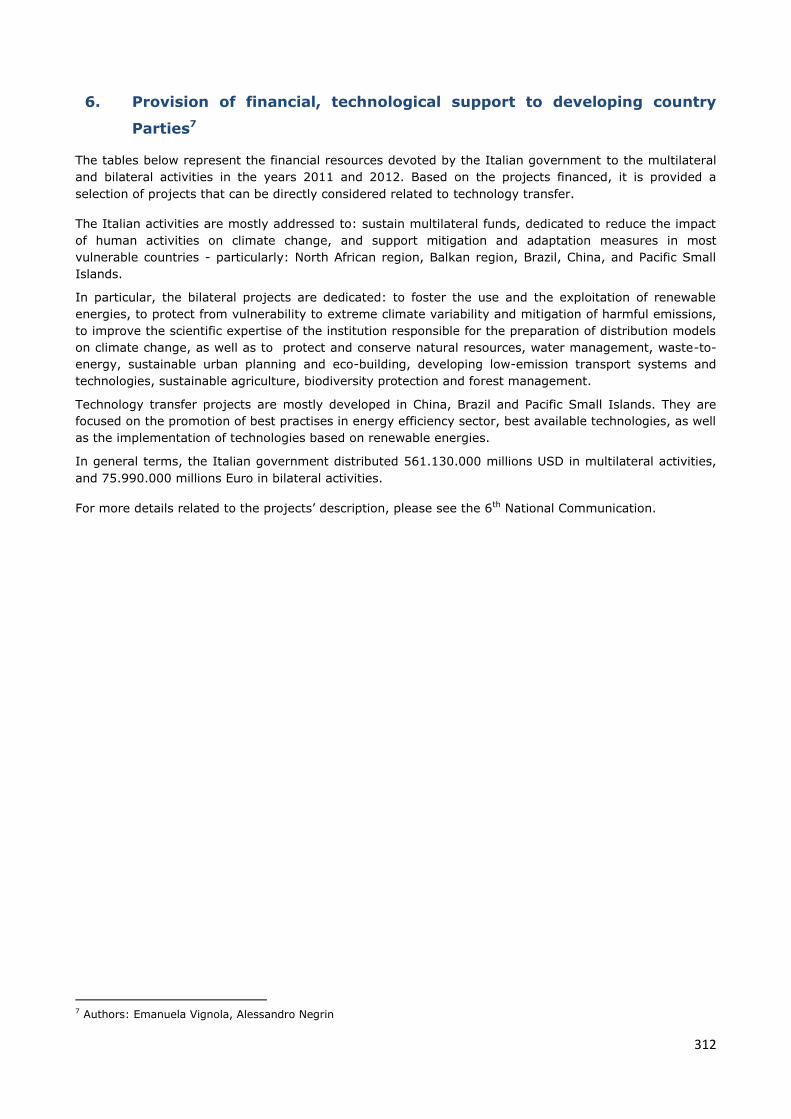
312
6. Provision of financial, technological support to developing country
Parties7
The tables below represent the financial resources devoted by the Italian government to the multilateral
and bilateral activities in the years 2011 and 2012. Based on the projects financed, it is provided a
selection of projects that can be directly considered related to technology transfer.
The Italian activities are mostly addressed to: sustain multilateral funds, dedicated to reduce the impact
of human activities on climate change, and support mitigation and adaptation measures in most
vulnerable countries - particularly: North African region, Balkan region, Brazil, China, and Pacific Small
Islands.
In particular, the bilateral projects are dedicated: to foster the use and the exploitation of renewable
energies, to protect from vulnerability to extreme climate variability and mitigation of harmful emissions,
to improve the scientific expertise of the institution responsible for the preparation of distribution models
on climate change, as well as to protect and conserve natural resources, water management, waste-to-
energy, sustainable urban planning and eco-building, developing low-emission transport systems and
technologies, sustainable agriculture, biodiversity protection and forest management.
Technology transfer projects are mostly developed in China, Brazil and Pacific Small Islands. They are
focused on the promotion of best practises in energy efficiency sector, best available technologies, as well
as the implementation of technologies based on renewable energies.
In general terms, the Italian government distributed 561.130.000 millions USD in multilateral activities,
and 75.990.000 millions Euro in bilateral activities.
For more details related to the projects’ description, please see the 6th National Communication.
7 Authors: Emanuela Vignola, Alessandro Negrin
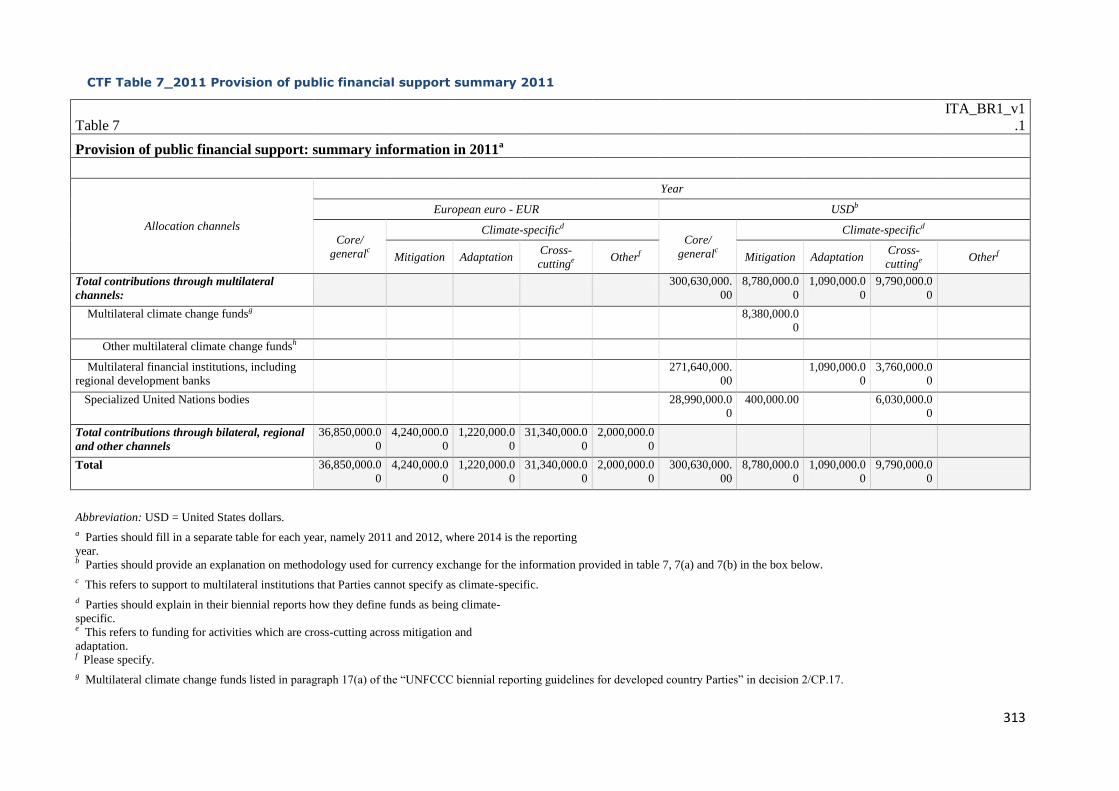
313
CTF Table 7_2011 Provision of public financial support summary 2011
Table 7
ITA_BR1_v1
.1
Provision of public financial support: summary information in 2011a
Allocation channels
Year
European euro - EUR USDb
Core/
generalc
Climate-specificd Core/
generalc
Climate-specificd
Mitigation Adaptation Cross-
cuttinge Otherf Mitigation Adaptation
Cross-
cuttinge Otherf
Total contributions through multilateral
channels:
300,630,000.
00
8,780,000.0
0
1,090,000.0
0
9,790,000.0
0
Multilateral climate change fundsg 8,380,000.0
0
Other multilateral climate change fundsh
Multilateral financial institutions, including
regional development banks
271,640,000.
00
1,090,000.0
0
3,760,000.0
0
Specialized United Nations bodies 28,990,000.0
0
400,000.00 6,030,000.0
0
Total contributions through bilateral, regional
and other channels
36,850,000.0
0
4,240,000.0
0
1,220,000.0
0
31,340,000.0
0
2,000,000.0
0
Total 36,850,000.0
0
4,240,000.0
0
1,220,000.0
0
31,340,000.0
0
2,000,000.0
0
300,630,000.
00
8,780,000.0
0
1,090,000.0
0
9,790,000.0
0
Abbreviation: USD = United States dollars.
a Parties should fill in a separate table for each year, namely 2011 and 2012, where 2014 is the reporting
year.
b Parties should provide an explanation on methodology used for currency exchange for the information provided in table 7, 7(a) and 7(b) in the box below.
c This refers to support to multilateral institutions that Parties cannot specify as climate-specific.
d Parties should explain in their biennial reports how they define funds as being climate-
specific.
e This refers to funding for activities which are cross-cutting across mitigation and
adaptation.
f Please specify.
g Multilateral climate change funds listed in paragraph 17(a) of the “UNFCCC biennial reporting guidelines for developed country Parties” in decision 2/CP.17.
314
h Other multilateral climate change funds as referred in paragraph 17(b) of the “UNFCCC biennial reporting guidelines for developed country Parties” in decision 2/CP.17.
Custom Footnotes
Each Party shall provide an indication of what new and additional financial resources they have provided, and clarify how they have determined that such resources are new and additional. Please
provide this information in relation to table 7(a) and table 7(b).
Documentation Box:
Since 2002, in order to meet the commitment under decisions FCCC/CP/2001/L.14, FCCC/CP/2001/L.15, and the “Bonn Declaration” of 2001, the Italian Ministry for the Environment, Land and
Sea (IMELS) has been authorized by the law June 1, 2002, n° 120, to finance activities in developing countries to contribute to the implementation of the UNFCCC.
Those resources are not considered in the Official Development Assistance register/accounting and are thus considered “new and additional” ones.
In fact, with the signature of the Kyoto Protocol and its ratification, new and additional financial resources aimed at technology transfer in the environmental sector were triggered. These can be
considered additional resources, responding to the commitments set forth by articles 4.3, 4.4 and 4.5 of the Framework Convention on Climate Change, which have to be used by industrialized
countries for assisting developing countries and transition economies in the implementation of policies and strategies according to the Convention objectives. In particular, they are required to supply
financial resources through programs and projects which promote the transfer of technologies bound to reducing the impacts of human activities on climate change and support adaptation measures.
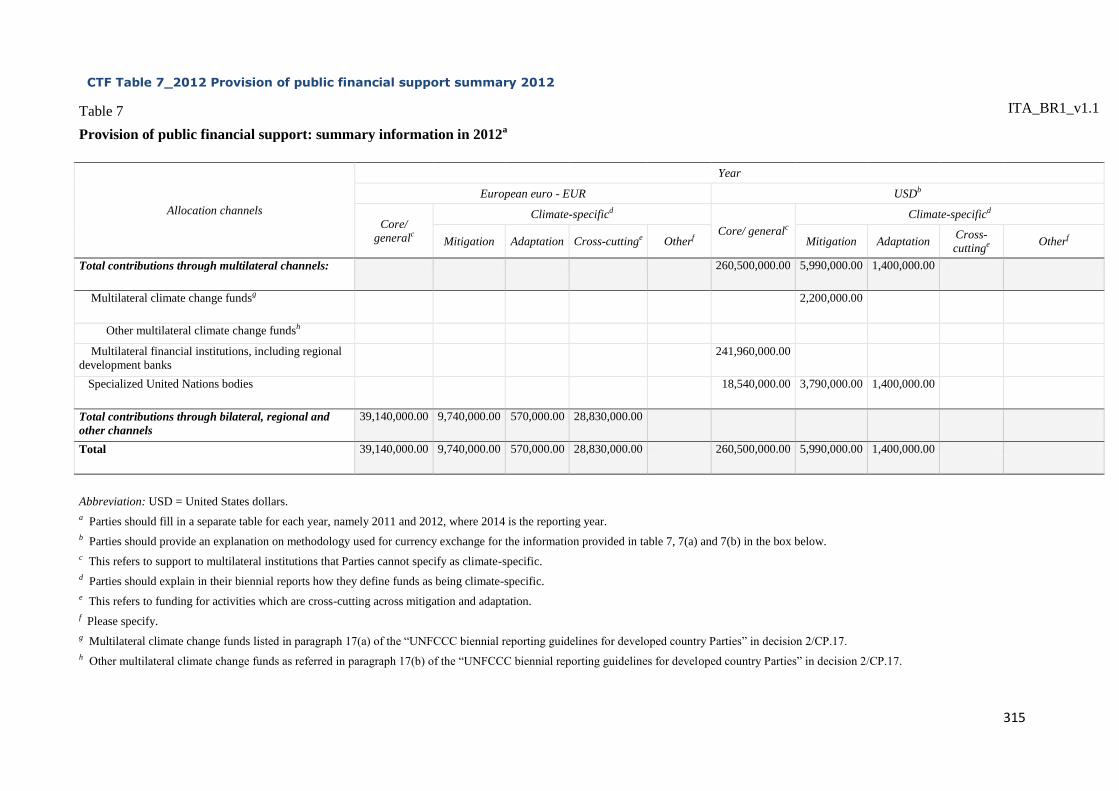
315
CTF Table 7_2012 Provision of public financial support summary 2012
Table 7
ITA_BR1_v1.1
Provision of public financial support: summary information in 2012a
Allocation channels
Year
European euro - EUR USDb
Core/
generalc
Climate-specificd
Core/ generalc
Climate-specificd
Mitigation Adaptation Cross-cuttinge Otherf Mitigation Adaptation Cross-
cuttinge Otherf
Total contributions through multilateral channels: 260,500,000.00 5,990,000.00 1,400,000.00
Multilateral climate change fundsg 2,200,000.00
Other multilateral climate change fundsh
Multilateral financial institutions, including regional
development banks
241,960,000.00
Specialized United Nations bodies 18,540,000.00 3,790,000.00 1,400,000.00
Total contributions through bilateral, regional and
other channels
39,140,000.00 9,740,000.00 570,000.00 28,830,000.00
Total 39,140,000.00 9,740,000.00 570,000.00 28,830,000.00 260,500,000.00 5,990,000.00 1,400,000.00
Abbreviation: USD = United States dollars.
a Parties should fill in a separate table for each year, namely 2011 and 2012, where 2014 is the reporting year.
b Parties should provide an explanation on methodology used for currency exchange for the information provided in table 7, 7(a) and 7(b) in the box below.
c This refers to support to multilateral institutions that Parties cannot specify as climate-specific.
d Parties should explain in their biennial reports how they define funds as being climate-specific.
e This refers to funding for activities which are cross-cutting across mitigation and adaptation.
f Please specify.
g Multilateral climate change funds listed in paragraph 17(a) of the “UNFCCC biennial reporting guidelines for developed country Parties” in decision 2/CP.17.
h Other multilateral climate change funds as referred in paragraph 17(b) of the “UNFCCC biennial reporting guidelines for developed country Parties” in decision 2/CP.17.
316
Custom Footnotes
Each Party shall provide an indication of what new and additional financial resources they have provided, and clarify how they have determined that such resources are new and additional. Please provide this
information in relation to table 7(a) and table 7(b).
Documentation Box:
Since 2002, in order to meet the commitment under decisions FCCC/CP/2001/L.14, FCCC/CP/2001/L.15, and the “Bonn Declaration” of 2001, the Italian Ministry for the Environment, Land and Sea (IMELS)
has been authorized by the law June 1, 2002, n° 120, to finance activities in developing countries to contribute to the implementation of the UNFCCC.
Those resources are not considered in the Official Development Assistance register/accounting and are thus considered “new and additional” ones.
In fact, with the signature of the Kyoto Protocol and its ratification, new and additional financial resources aimed at technology transfer in the environmental sector were triggered. These can be considered
additional resources, responding to the commitments set forth by articles 4.3, 4.4 and 4.5 of the Framework Convention on Climate Change, which have to be used by industrialized countries for assisting
developing countries and transition economies in the implementation of policies and strategies according to the Convention objectives. In particular, they are required to supply financial resources through
programs and projects which promote the transfer of technologies bound to reducing the impacts of human activities on climate change and support adaptation measures.
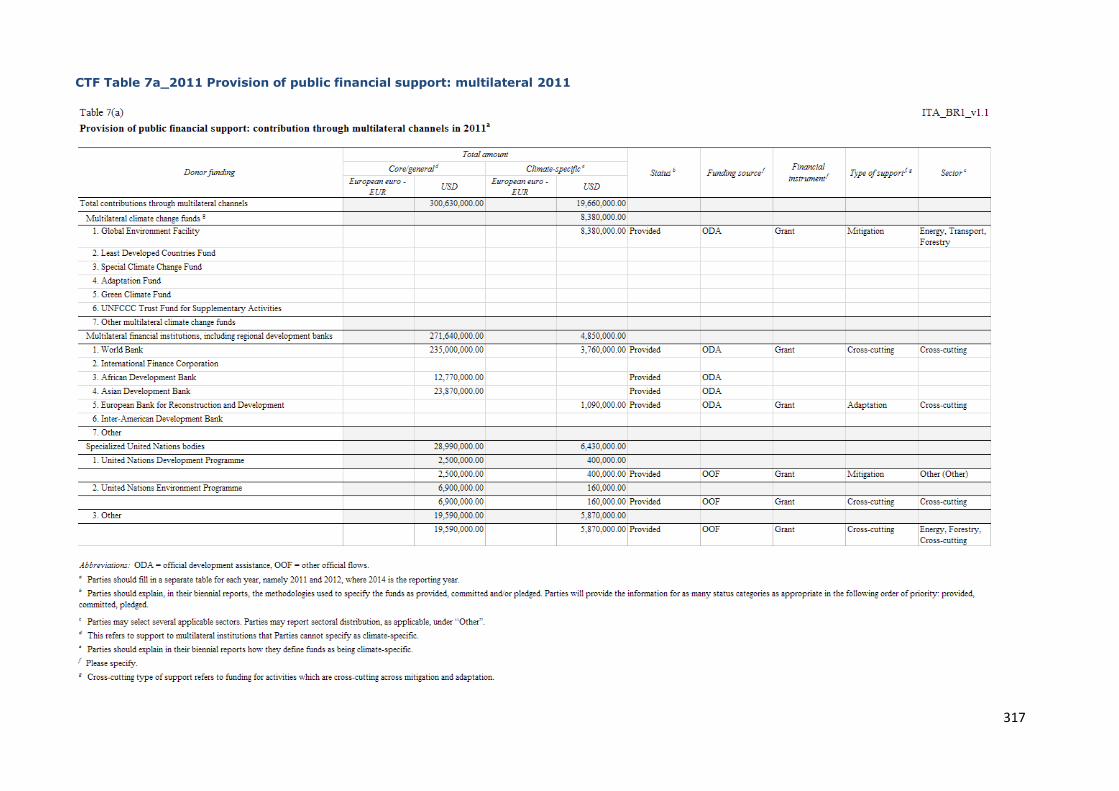
317
CTF Table 7a_2011 Provision of public financial support: multilateral 2011
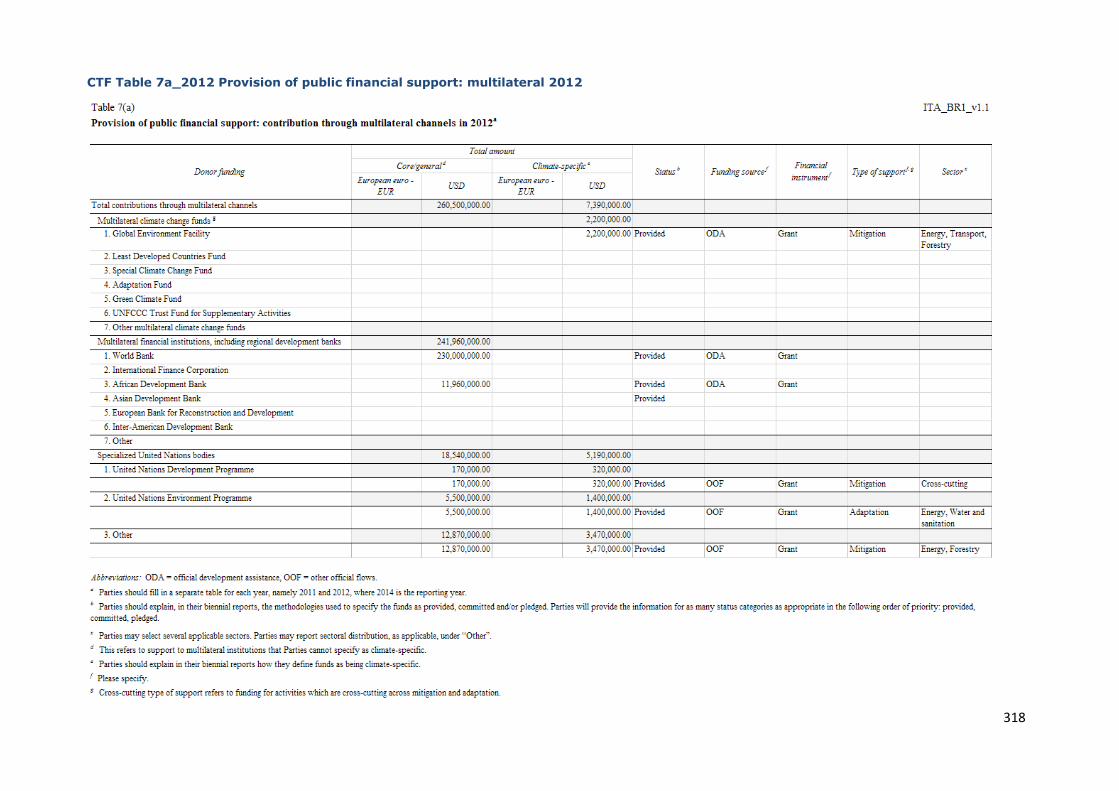
318
CTF Table 7a_2012 Provision of public financial support: multilateral 2012
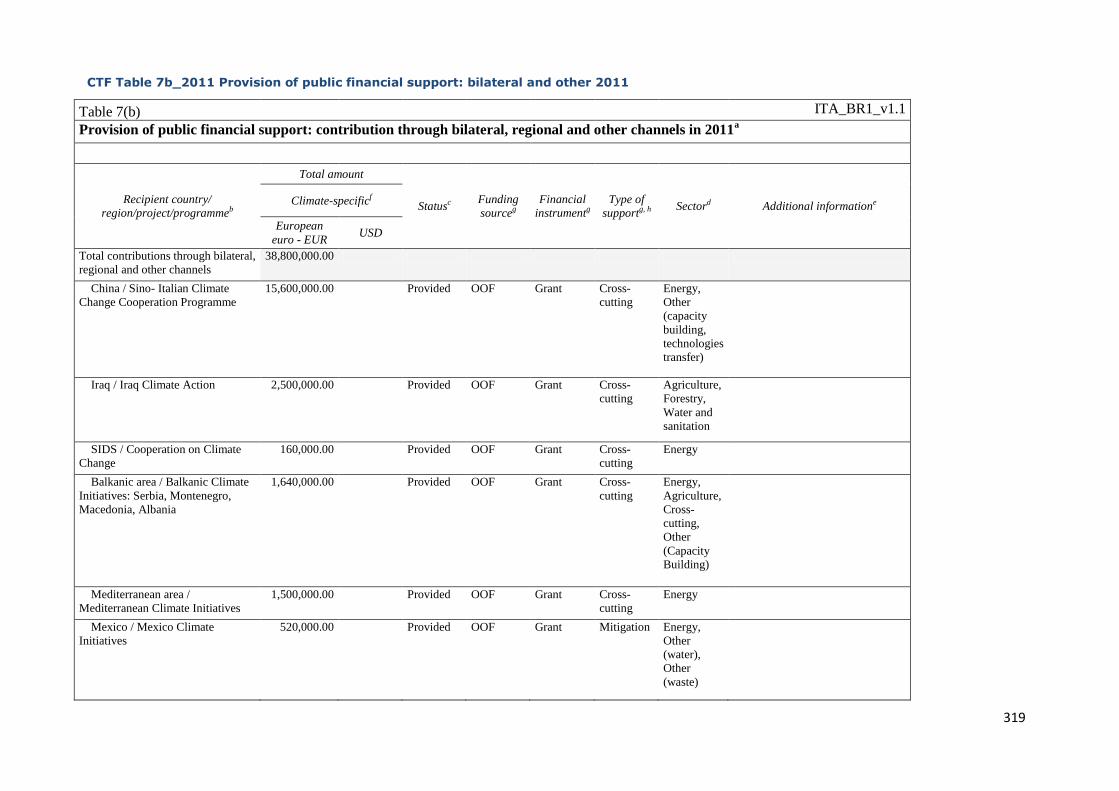
319
CTF Table 7b_2011 Provision of public financial support: bilateral and other 2011
Table 7(b)
ITA_BR1_v1.1
Provision of public financial support: contribution through bilateral, regional and other channels in 2011a
Recipient country/
region/project/programmeb
Total amount
Statusc Funding
sourceg
Financial
instrumentg
Type of
supportg, h Sectord Additional informatione Climate-specificf
European
euro - EUR USD
Total contributions through bilateral,
regional and other channels
38,800,000.00
China / Sino- Italian Climate
Change Cooperation Programme
15,600,000.00 Provided OOF Grant Cross-
cutting
Energy,
Other
(capacity
building,
technologies
transfer)
Iraq / Iraq Climate Action 2,500,000.00 Provided OOF Grant Cross-
cutting
Agriculture,
Forestry,
Water and
sanitation
SIDS / Cooperation on Climate
Change
160,000.00 Provided OOF Grant Cross-
cutting
Energy
Balkanic area / Balkanic Climate
Initiatives: Serbia, Montenegro,
Macedonia, Albania
1,640,000.00 Provided OOF Grant Cross-
cutting
Energy,
Agriculture,
Cross-
cutting,
Other
(Capacity
Building)
Mediterranean area /
Mediterranean Climate Initiatives
1,500,000.00 Provided OOF Grant Cross-
cutting
Energy
Mexico / Mexico Climate
Initiatives
520,000.00 Provided OOF Grant Mitigation Energy,
Other
(water),
Other
(waste)
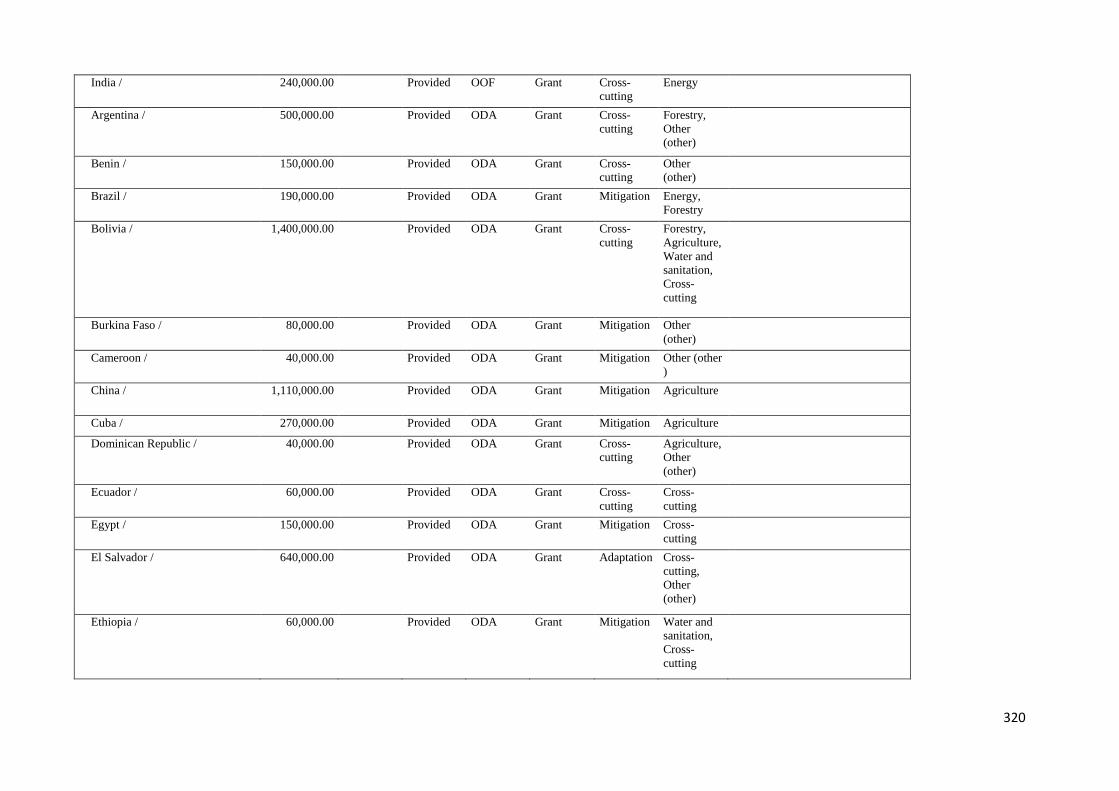
320
India / 240,000.00 Provided OOF Grant Cross-
cutting
Energy
Argentina / 500,000.00 Provided ODA Grant Cross-
cutting
Forestry,
Other
(other)
Benin / 150,000.00 Provided ODA Grant Cross-
cutting
Other
(other)
Brazil / 190,000.00 Provided ODA Grant Mitigation Energy,
Forestry
Bolivia / 1,400,000.00 Provided ODA Grant Cross-
cutting
Forestry,
Agriculture,
Water and
sanitation,
Cross-
cutting
Burkina Faso / 80,000.00 Provided ODA Grant Mitigation Other
(other)
Cameroon / 40,000.00 Provided ODA Grant Mitigation Other (other
)
China / 1,110,000.00 Provided ODA Grant Mitigation Agriculture
Cuba / 270,000.00 Provided ODA Grant Mitigation Agriculture
Dominican Republic / 40,000.00 Provided ODA Grant Cross-
cutting
Agriculture,
Other
(other)
Ecuador / 60,000.00 Provided ODA Grant Cross-
cutting
Cross-
cutting
Egypt / 150,000.00 Provided ODA Grant Mitigation Cross-
cutting
El Salvador / 640,000.00 Provided ODA Grant Adaptation Cross-
cutting,
Other
(other)
Ethiopia / 60,000.00 Provided ODA Grant Mitigation Water and
sanitation,
Cross-
cutting
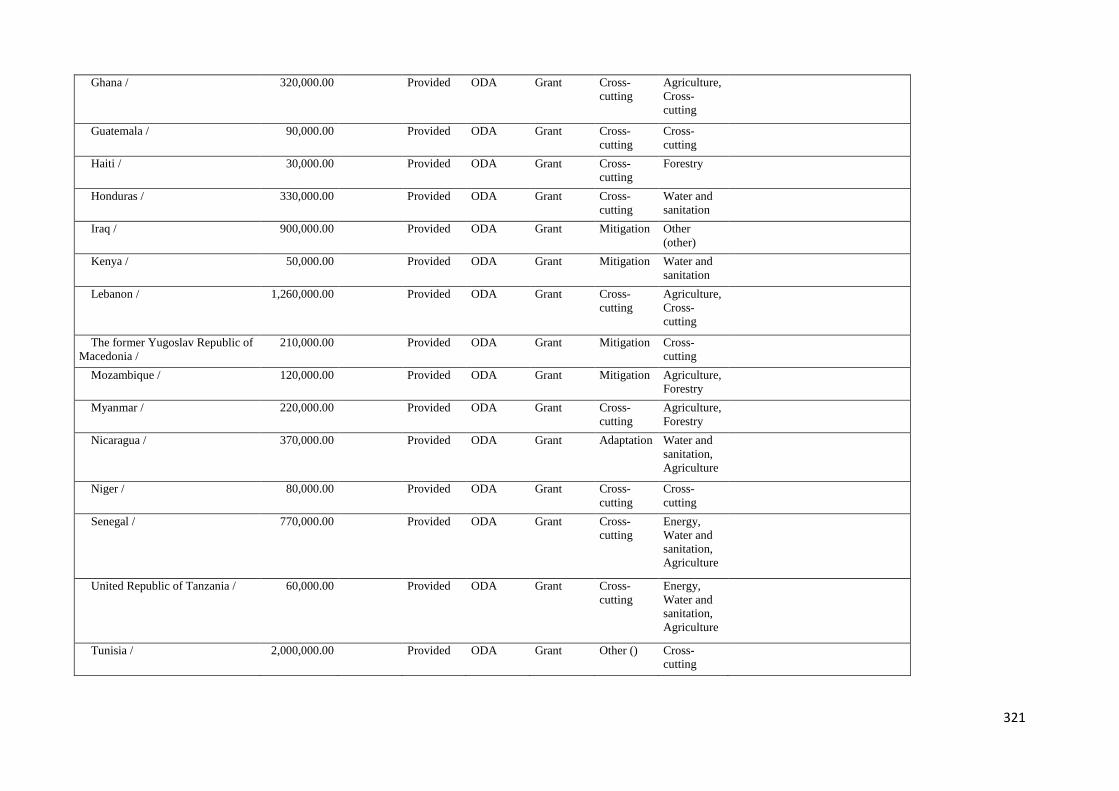
321
Ghana / 320,000.00 Provided ODA Grant Cross-
cutting
Agriculture,
Cross-
cutting
Guatemala / 90,000.00 Provided ODA Grant Cross-
cutting
Cross-
cutting
Haiti / 30,000.00 Provided ODA Grant Cross-
cutting
Forestry
Honduras / 330,000.00 Provided ODA Grant Cross-
cutting
Water and
sanitation
Iraq / 900,000.00 Provided ODA Grant Mitigation Other
(other)
Kenya / 50,000.00 Provided ODA Grant Mitigation Water and
sanitation
Lebanon / 1,260,000.00 Provided ODA Grant Cross-
cutting
Agriculture,
Cross-
cutting
The former Yugoslav Republic of
Macedonia /
210,000.00 Provided ODA Grant Mitigation Cross-
cutting
Mozambique / 120,000.00 Provided ODA Grant Mitigation Agriculture,
Forestry
Myanmar / 220,000.00 Provided ODA Grant Cross-
cutting
Agriculture,
Forestry
Nicaragua / 370,000.00 Provided ODA Grant Adaptation Water and
sanitation,
Agriculture
Niger / 80,000.00 Provided ODA Grant Cross-
cutting
Cross-
cutting
Senegal / 770,000.00 Provided ODA Grant Cross-
cutting
Energy,
Water and
sanitation,
Agriculture
United Republic of Tanzania / 60,000.00 Provided ODA Grant Cross-
cutting
Energy,
Water and
sanitation,
Agriculture
Tunisia / 2,000,000.00 Provided ODA Grant Other () Cross-
cutting
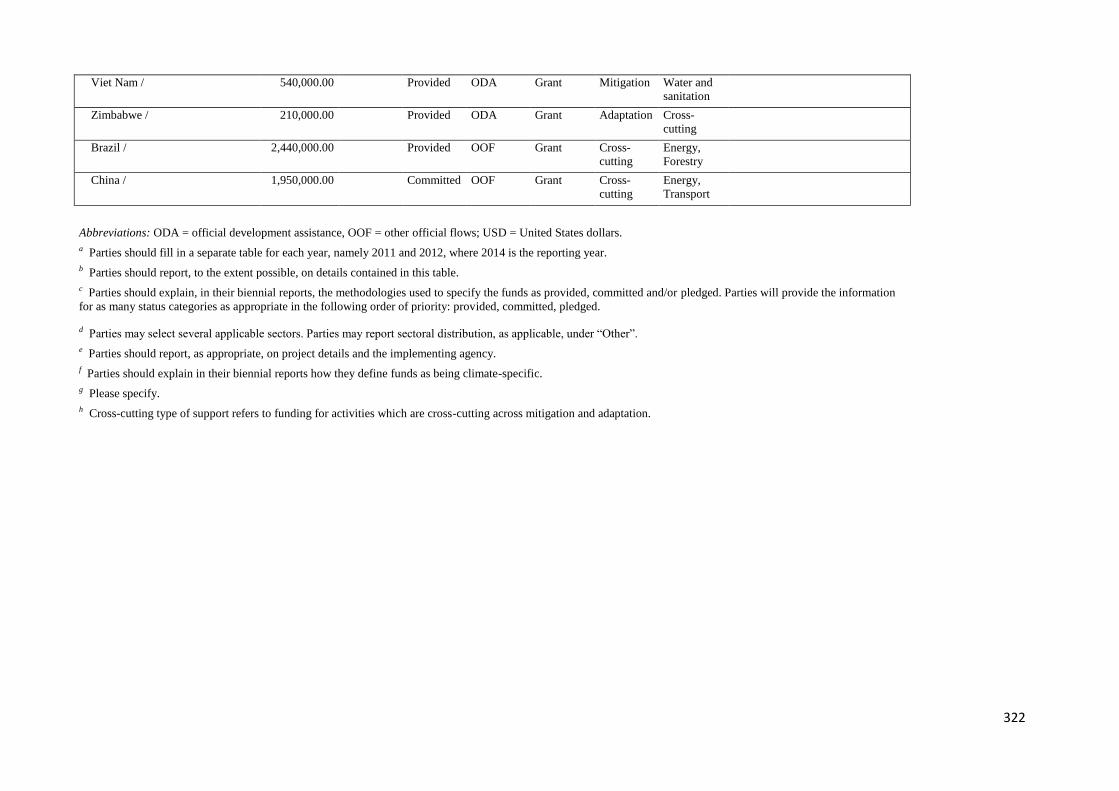
322
Viet Nam / 540,000.00 Provided ODA Grant Mitigation Water and
sanitation
Zimbabwe / 210,000.00 Provided ODA Grant Adaptation Cross-
cutting
Brazil / 2,440,000.00 Provided OOF Grant Cross-
cutting
Energy,
Forestry
China / 1,950,000.00 Committed OOF Grant Cross-
cutting
Energy,
Transport
Abbreviations: ODA = official development assistance, OOF = other official flows; USD = United States dollars. a Parties should fill in a separate table for each year, namely 2011 and 2012, where 2014 is the reporting year.
b Parties should report, to the extent possible, on details contained in this table.
c Parties should explain, in their biennial reports, the methodologies used to specify the funds as provided, committed and/or pledged. Parties will provide the information
for as many status categories as appropriate in the following order of priority: provided, committed, pledged.
d Parties may select several applicable sectors. Parties may report sectoral distribution, as applicable, under “Other”.
e Parties should report, as appropriate, on project details and the implementing agency.
f Parties should explain in their biennial reports how they define funds as being climate-specific.
g Please specify.
h Cross-cutting type of support refers to funding for activities which are cross-cutting across mitigation and adaptation.
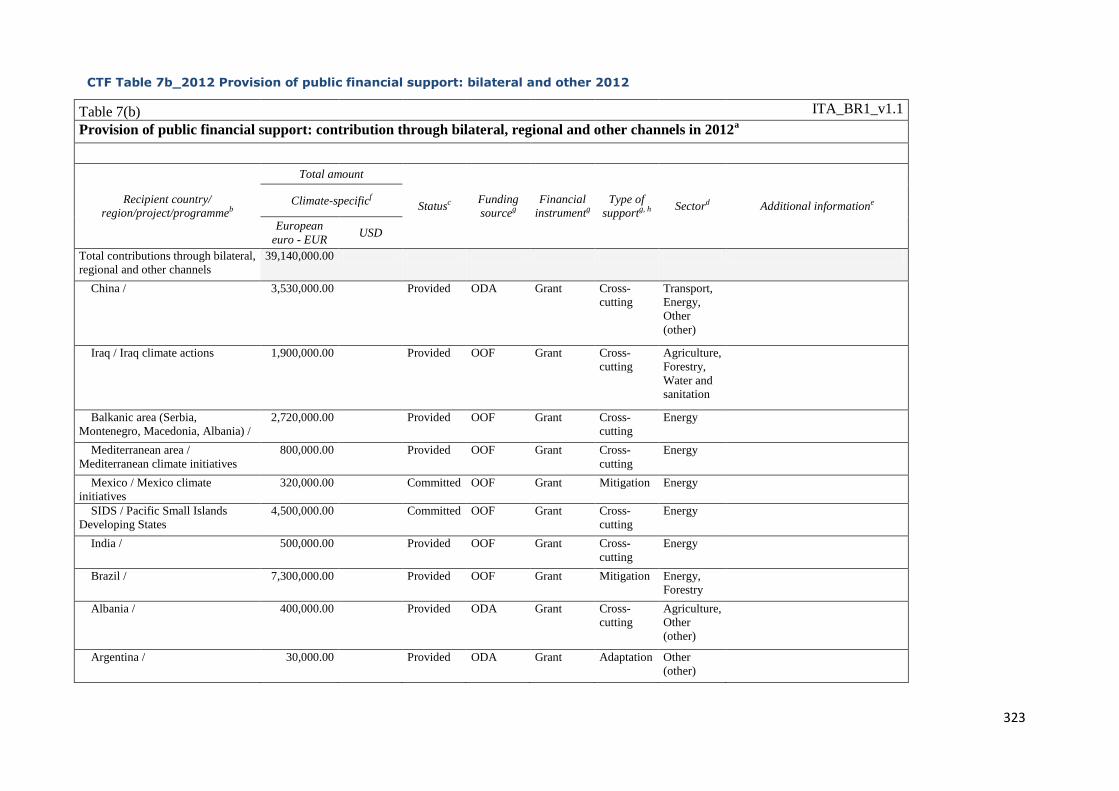
323
CTF Table 7b_2012 Provision of public financial support: bilateral and other 2012
Table 7(b)
ITA_BR1_v1.1
Provision of public financial support: contribution through bilateral, regional and other channels in 2012a
Recipient country/
region/project/programmeb
Total amount
Statusc Funding
sourceg
Financial
instrumentg
Type of
supportg, h Sectord Additional informatione Climate-specificf
European
euro - EUR USD
Total contributions through bilateral,
regional and other channels
39,140,000.00
China / 3,530,000.00 Provided ODA Grant Cross-
cutting
Transport,
Energy,
Other
(other)
Iraq / Iraq climate actions 1,900,000.00 Provided OOF Grant Cross-
cutting
Agriculture,
Forestry,
Water and
sanitation
Balkanic area (Serbia,
Montenegro, Macedonia, Albania) /
2,720,000.00 Provided OOF Grant Cross-
cutting
Energy
Mediterranean area /
Mediterranean climate initiatives
800,000.00 Provided OOF Grant Cross-
cutting
Energy
Mexico / Mexico climate
initiatives
320,000.00 Committed OOF Grant Mitigation Energy
SIDS / Pacific Small Islands
Developing States
4,500,000.00 Committed OOF Grant Cross-
cutting
Energy
India / 500,000.00 Provided OOF Grant Cross-
cutting
Energy
Brazil / 7,300,000.00 Provided OOF Grant Mitigation Energy,
Forestry
Albania / 400,000.00 Provided ODA Grant Cross-
cutting
Agriculture,
Other
(other)
Argentina / 30,000.00 Provided ODA Grant Adaptation Other
(other)
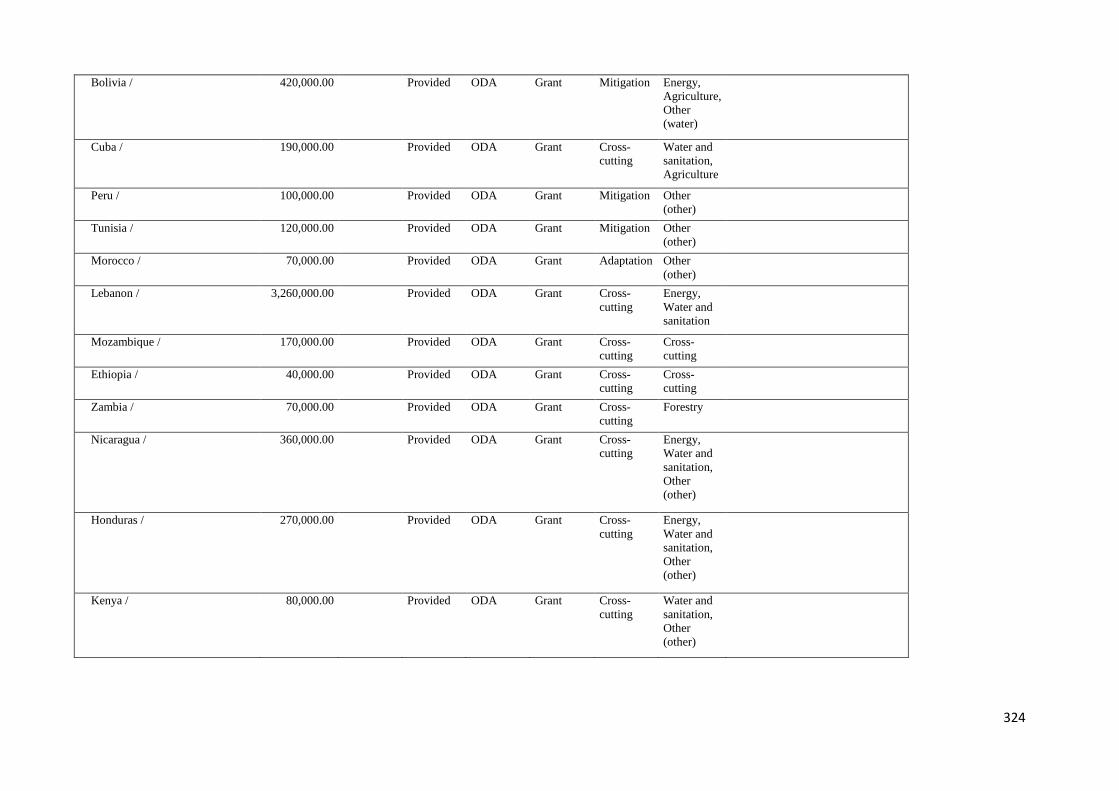
324
Bolivia / 420,000.00 Provided ODA Grant Mitigation Energy,
Agriculture,
Other
(water)
Cuba / 190,000.00 Provided ODA Grant Cross-
cutting
Water and
sanitation,
Agriculture
Peru / 100,000.00 Provided ODA Grant Mitigation Other
(other)
Tunisia / 120,000.00 Provided ODA Grant Mitigation Other
(other)
Morocco / 70,000.00 Provided ODA Grant Adaptation Other
(other)
Lebanon / 3,260,000.00 Provided ODA Grant Cross-
cutting
Energy,
Water and
sanitation
Mozambique / 170,000.00 Provided ODA Grant Cross-
cutting
Cross-
cutting
Ethiopia / 40,000.00 Provided ODA Grant Cross-
cutting
Cross-
cutting
Zambia / 70,000.00 Provided ODA Grant Cross-
cutting
Forestry
Nicaragua / 360,000.00 Provided ODA Grant Cross-
cutting
Energy,
Water and
sanitation,
Other
(other)
Honduras / 270,000.00 Provided ODA Grant Cross-
cutting
Energy,
Water and
sanitation,
Other
(other)
Kenya / 80,000.00 Provided ODA Grant Cross-
cutting
Water and
sanitation,
Other
(other)
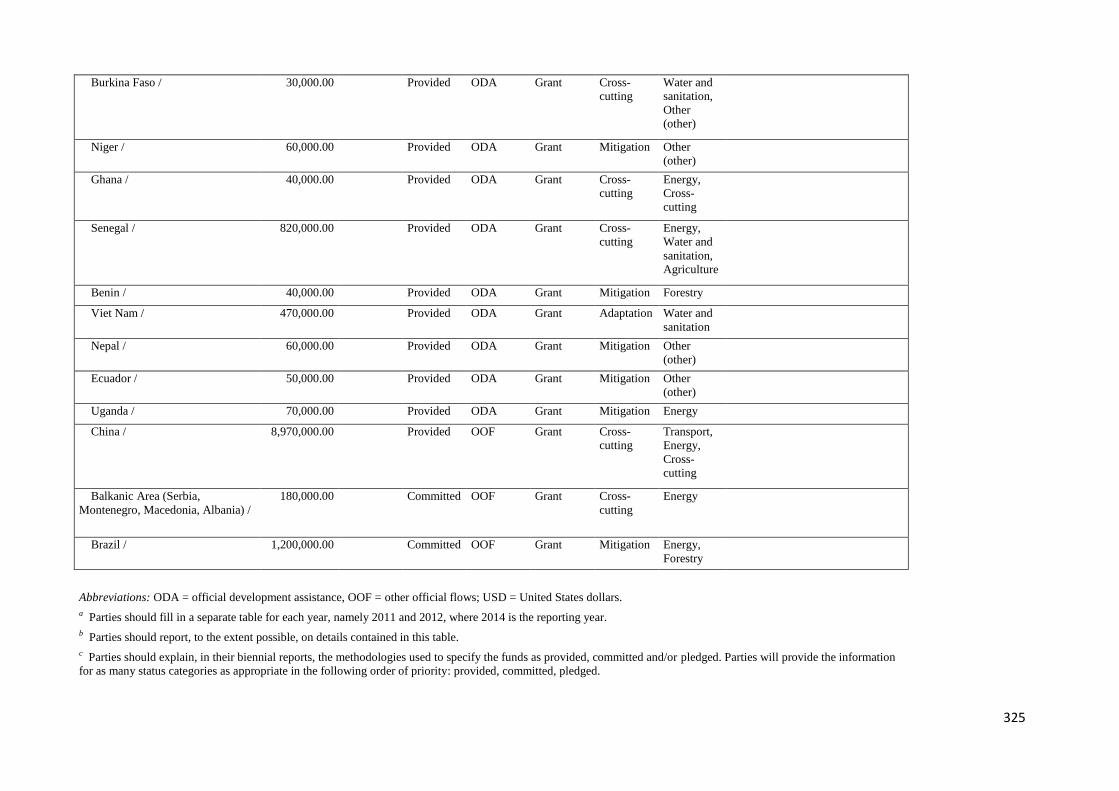
325
Burkina Faso / 30,000.00 Provided ODA Grant Cross-
cutting
Water and
sanitation,
Other
(other)
Niger / 60,000.00 Provided ODA Grant Mitigation Other
(other)
Ghana / 40,000.00 Provided ODA Grant Cross-
cutting
Energy,
Cross-
cutting
Senegal / 820,000.00 Provided ODA Grant Cross-
cutting
Energy,
Water and
sanitation,
Agriculture
Benin / 40,000.00 Provided ODA Grant Mitigation Forestry
Viet Nam / 470,000.00 Provided ODA Grant Adaptation Water and
sanitation
Nepal / 60,000.00 Provided ODA Grant Mitigation Other
(other)
Ecuador / 50,000.00 Provided ODA Grant Mitigation Other
(other)
Uganda / 70,000.00 Provided ODA Grant Mitigation Energy
China / 8,970,000.00 Provided OOF Grant Cross-
cutting
Transport,
Energy,
Cross-
cutting
Balkanic Area (Serbia,
Montenegro, Macedonia, Albania) /
180,000.00 Committed OOF Grant Cross-
cutting
Energy
Brazil / 1,200,000.00 Committed OOF Grant Mitigation Energy,
Forestry
Abbreviations: ODA = official development assistance, OOF = other official flows; USD = United States dollars. a Parties should fill in a separate table for each year, namely 2011 and 2012, where 2014 is the reporting year.
b Parties should report, to the extent possible, on details contained in this table.
c Parties should explain, in their biennial reports, the methodologies used to specify the funds as provided, committed and/or pledged. Parties will provide the information
for as many status categories as appropriate in the following order of priority: provided, committed, pledged.
326
d Parties may select several applicable sectors. Parties may report sectoral distribution, as applicable, under “Other”.
e Parties should report, as appropriate, on project details and the implementing agency.
f Parties should explain in their biennial reports how they define funds as being climate-specific.
g Please specify.
h Cross-cutting type of support refers to funding for activities which are cross-cutting across mitigation and adaptation.
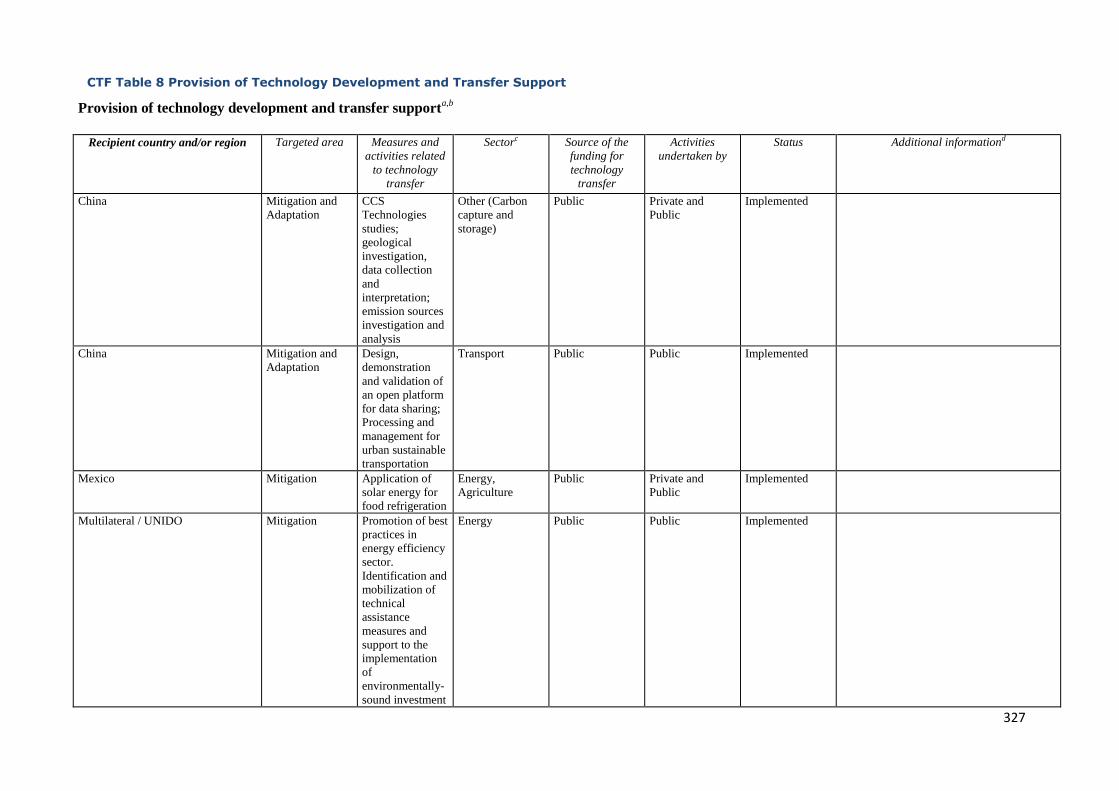
327
CTF Table 8 Provision of Technology Development and Transfer Support
Provision of technology development and transfer supporta,b
Recipient country and/or region Targeted area Measures and
activities related
to technology
transfer
Sectorc Source of the
funding for
technology
transfer
Activities
undertaken by
Status Additional informationd
China Mitigation and
Adaptation
CCS
Technologies
studies;
geological
investigation,
data collection
and
interpretation;
emission sources
investigation and
analysis
Other (Carbon
capture and
storage)
Public Private and
Public
Implemented
China Mitigation and
Adaptation
Design,
demonstration
and validation of
an open platform
for data sharing;
Processing and
management for
urban sustainable
transportation
Transport Public Public Implemented
Mexico Mitigation Application of
solar energy for
food refrigeration
Energy,
Agriculture
Public Private and
Public
Implemented
Multilateral / UNIDO Mitigation Promotion of best
practices in
energy efficiency
sector.
Identification and
mobilization of
technical
assistance
measures and
support to the
implementation
of
environmentally-
sound investment
Energy Public Public Implemented
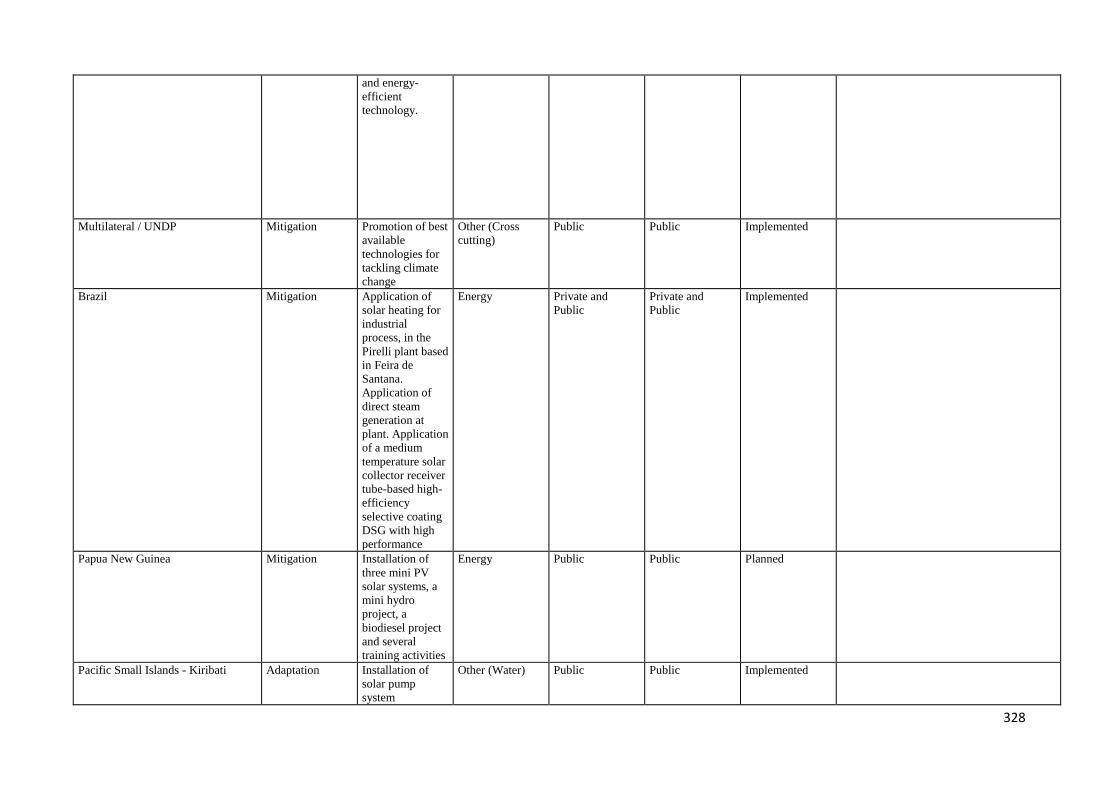
328
and energy-
efficient
technology.
Multilateral / UNDP Mitigation Promotion of best
available
technologies for
tackling climate
change
Other (Cross
cutting)
Public Public Implemented
Brazil Mitigation Application of
solar heating for
industrial
process, in the
Pirelli plant based
in Feira de
Santana.
Application of
direct steam
generation at
plant. Application
of a medium
temperature solar
collector receiver
tube-based high-
efficiency
selective coating
DSG with high
performance
Energy Private and
Public
Private and
Public
Implemented
Papua New Guinea Mitigation Installation of
three mini PV
solar systems, a
mini hydro
project, a
biodiesel project
and several
training activities
Energy Public Public Planned
Pacific Small Islands - Kiribati Adaptation Installation of
solar pump
system
Other (Water) Public Public Implemented
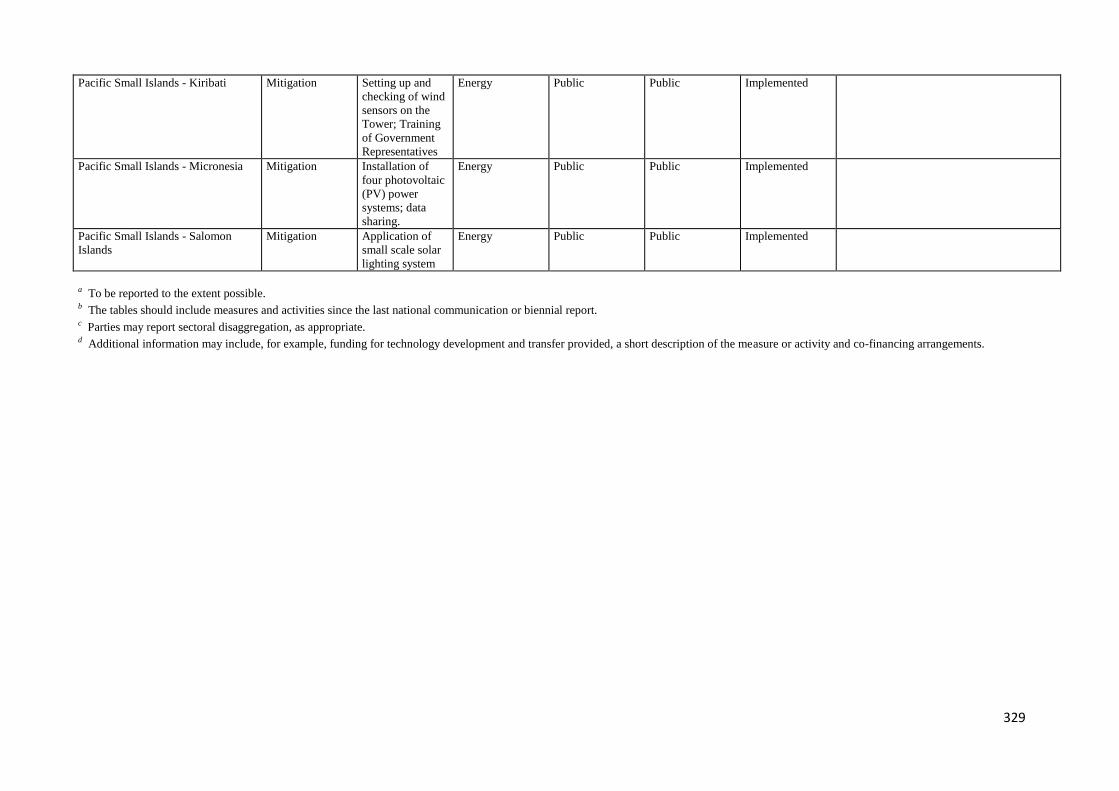
329
Pacific Small Islands - Kiribati Mitigation Setting up and
checking of wind
sensors on the
Tower; Training
of Government
Representatives
Energy Public Public Implemented
Pacific Small Islands - Micronesia Mitigation Installation of
four photovoltaic
(PV) power
systems; data
sharing.
Energy Public Public Implemented
Pacific Small Islands - Salomon
Islands
Mitigation Application of
small scale solar
lighting system
Energy Public Public Implemented
a To be reported to the extent possible. b The tables should include measures and activities since the last national communication or biennial report. c Parties may report sectoral disaggregation, as appropriate. d Additional information may include, for example, funding for technology development and transfer provided, a short description of the measure or activity and co-financing arrangements.
330
7. Capacity-building support to developing country Parties8
The major economic crisis that Italy is going through for some years now, did not allow to concentrate
more efforts in many new bilateral cooperation agreements with developing countries including
specifically capacity building support projects dedicated to training on climate change mitigation or
technology development.
However, cooperation activities are continuing in the framework of existing Memorandum of
Understanding (MoU), such as the Sino-Italian Cooperation Program for Environmental Protection (SICP)
signed in the year 2000 between the Italian Ministry for the Environment, Land and Sea (IMELS) and the
State Environmental Protection Administration of China (SEPA). In over 10 years the cooperation
agreement implemented over 200 projects in support of China’s Sustainable Development, thus
becoming a model for bilateral cooperation. In this context, a new cooperation Program between China
and Italy, especially dedicated to Climate Change, has been launched in March 2011 in Beijing by the
Director General Corrado Clini of the Italian Ministry for the Environment and the Director General of the
National Development and Reform Commission of China, with the aims to start a joint program of
activities in view of the creation of an international centre on climate change. Joint initiatives are
implemented in the field of mitigation and adaptation to climate change, transfer and promotion of low-
carbon technologies, studies and researches as scientific support to decision-making. The cooperation
program includes the following main projects: the Carbon Capture and Storage Comprehensive
Application and Demonstration Project in Sha’anxi Province; the Capacity Building of Coastal Ecosystems
to Adapt to Climate Change; the Xinjiang Uyggur Autonomous Region Climate Change Implementation
Plan; the Training Program on Climate Change and Sustainable Development.
In Central and Eastern Europe, IMELS’s activity has been active since 2002, under Memorandum of
Understanding (MoU) called “Environmental Protection Co-Operation”, signed with the former Ministry for
Protection of Natural Resources and Environment of the Republic of Serbia and Montenegro. This
agreement was aimed at developing a programme of bilateral cooperation in the fields of sustainable
development, institutional strengthening and harmonization to both International and European
legislative standards according to funds available from the Italian Law 84/2001 on Balkans’
reconstruction.
More recently the Italian Ministry for the Environment, Land and Sea and the Serbian Ministry of
Environment and Spatial Planning, signed a Memorandum of Understanding (MoU) on May 2009 in order
to, among else, maintain and enhance bilateral co-operation in the field of the CDM implementation on
the basis of equality, reciprocity and mutual benefit and as an efficient contribution to the sustainable
development and the reduction of greenhouse gases emissions.
In Montenegro the MoU signed in 2004 has been replaced by the Cooperation Agreement for
Environmental Protection in Podgorica, signed by the two governments in November 2012, represented
by the Ministers of the Environment. The agreement allowed the carrying out of activities that include,
among others, support to institutional development and capacity building, and for environmental
management, particularly in the areas of air quality, climate change, prevention and control of pollution.
In the framework of the Cooperation Agreement on environmental protection between the Albanian
Ministry of Environment, Forestry and Water administration and the IMELS technical support is supplied
to Albania for the implementation of the Long Range Transboundary Air Pollution (LRTAP) Convention,
then the support to the Albanian team to develop capacity to assess and plan air quality on local/urban
scale, in particular in urban and industrial areas regulated in the frame of the EU Air Quality Framework
Directive 96/92/CE and relative “daughters” Directives. These activities represented the core of the
project “Technical support services for pollutant emissions inventories implementation and air quality
planning in Albania”.
In 2005, IMELS has signed the Memorandum of Understanding “Cooperation in the field of the
Environment and Sustainable Development” with the Macedonian Ministry of the Environment and
Physical Planning. The cooperation aims to develop supporting activities for Kyoto Protocol
8 Author: Stefania Fusani
331
implementation, environmental protection, natural resources improvement, environmental pollution
reduction, legal assistance to adopt the Acquis Communautaire, and promotion of sustainable
development trough programmes, initiatives and jointed projects.
For this purposes, the Task Force for Central and Eastern Europe of the Italian Ministry for the
Environment Land and Sea has established a permanent office in Skopje, in order to provide for the
Macedonian counterparts legal and technical assistance necessary to the build-up of institutional
structures, able to realize environmental policies more focused on sustainable development.
Moreover, in 2009 a Memorandum of Understanding on “Establishment of Wind Database in Republic of
Macedonia” between the Italian Ministry for the Environment, Land and Sea and the Macedonian Ministry
of Economy has been signed. It is finalized to measure wind power in the Republic of Macedonia. The
database will provide an institutional plan for the sustainable process of wind measurement and a
database to be used for wind energy generation.
Another valid model of International Cooperation in developing and transition countries is represented by
the research activities carried out by the EvK2CNR Committee, an autonomous, non-profit Italian
association, which promotes scientific and technological research in mountain areas. Thanks to the close
collaboration with the Italian National Research Council (CNR), in 2007 a Research Unit was established
within Ev-K2-CNR, coordinated by CNR Earth and Environment Department. In Italy, Ev-K2-CNR benefits
also of the support of the Ministry of Foreign Affairs, the Ministry of Education, Universities and Research,
the Ministry of Economy and Finance, the Ministry of the Environment, Land and Sea and the Ministry of
Agriculture and Forestry. Ev-K2-CNR carries out scientific and technological research in the Hindu Kush –
Karakorum – Himalaya (HKKH) region, with particular reference to Nepal, and Pakistan. It is best known
for the Pyramid International Laboratory Observatory, located in Nepal, at 5,050 m a.s.l. at the base of
Mount Everest. Due to their relatively remoteness from highly populated and industrialized regions,
mountains are considered ideal locations for investigating the impact of climate changes from regional to
global scales.
For these reasons and following the UN resolutions and indications, Ev-K2-CNR launched the SHARE
project - Stations at High Altitude for Research on the Environment - an observational network of
international and institutional collaborating partners (UNEP, WMO, NASA, ESA and IUCN) with the aim to
promote continuous scientific observations in key high-mountain regions able to contribute to knowledge
on regional and global climate change. It collaborates with the Nepalese Government (Ministry of
Science, Technology and Environment) and with International Research Programs.
Capacity building activity is one of the crucial objectives of SHARE project: local institutions, as the Nepal
Academy of Science & Technology, are directly involved in monitoring and research activities assuring
support to environmental management policies and decision-making processes. By means of awareness
raising, training and technology transfer initiatives, citizens are involved in discovering climate change
and its effects on mountains chains and glaciers for a sustainable use.
Among the wide range of projects supported by EU programs including climate-related capacity
development actions and strengthening institutional capacity of countries not included in Annex I, it is
worth mentioning the Euromed Programme on “Prevention, Preparedness and Response to Natural and
Man-made Disasters” (PPRD South), led by the Italian Civil Protection Department and aimed at
improving Civil Protection at international, national and local levels, in the South Mediterranean Region
in both institutional and operational terms.
The projections on impact of natural disasters due to climate change, combined with poverty in many
Southern Mediterranean Countries, need continuous efforts to improve capacities to cope with disasters
and to invest more in Disaster Risk Reduction Policies and Community Resilience. To this end, the
Programme is aimed to contribute to the development and reinforcement of the quality of Civil Protection
services in the Euro-Mediterranean region and to the continuation of institutional cooperation in the field,
both between the EU and the Mediterranean Partner Countries and among the Mediterranean Partner
Countries themselves (Albania, Algeria, Bosnia & Herzegovina, Croatia, Egypt, Israel, Jordan, Lebanon,
Montenegro, Morocco, Occupied Palestinian Territories, Tunisia, Turkey). The project supports, among
other, the implementation of measures for adaptation to the negative effects of climate change through:
enhancing national institutions’ and stakeholders' capabilities to react to Natural Disasters caused by
climate change and creating an environment for active dissemination of information, raising of public
332
awareness and exchange of best practices. Among the four components of the project, the “Prevention
and Preparedness” component includes the organization of training workshops, study visits and demand-
driven technical assistance, by sensitizing the creation of National Platforms for Disaster Risk Reduction
and by supporting regional coordination.
A further initiative led by the Italian Civil Protection Department is the EU funded Capacity building
project 'EVRECA! “European Volunteers for Response of Emergencies in the Caribbean” whose main
objective is to define guidelines and standards for the recruitment and training of volunteers in the field
of emergency management and Disaster Risk Reduction (DRR) activities. Secondly, the project aims to
deploy the volunteers in third countries with the aim of strengthening local authorities' preparedness,
early warning systems, response and hosting of volunteers. A stronger institutional response to natural
disasters will directly benefit local communities' resilience and awareness of hydro-meteorological risks.
The EU volunteers will enhance the level of preparedness and awareness of the institutional stakeholders
and of the local volunteers’ organizations in order to better respond to hydro-meteorological disasters.
In Table 9 are provided details of these capacity building activities achieved by Italy.
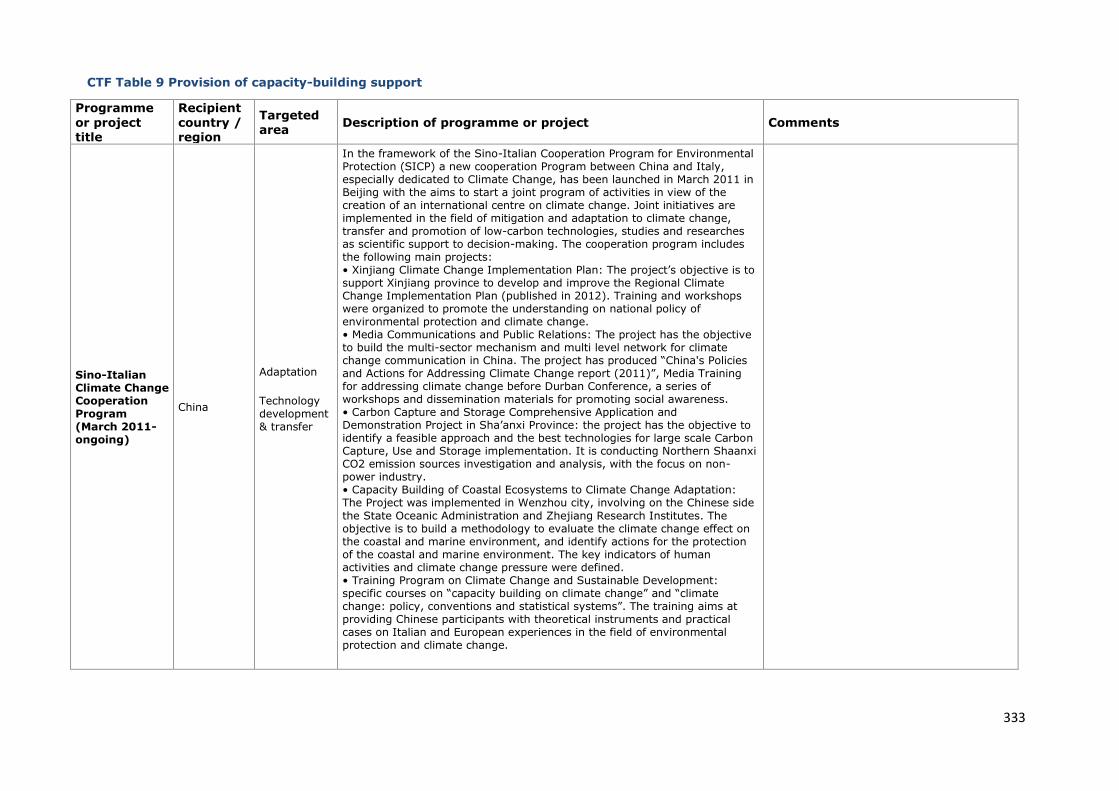
333
CTF Table 9 Provision of capacity-building support
Programme
or project title
Recipient
country / region
Targeted area
Description of programme or project Comments
Sino-Italian Climate Change Cooperation Program (March 2011-ongoing)
China
Adaptation
Technology development & transfer
In the framework of the Sino-Italian Cooperation Program for Environmental Protection (SICP) a new cooperation Program between China and Italy, especially dedicated to Climate Change, has been launched in March 2011 in Beijing with the aims to start a joint program of activities in view of the creation of an international centre on climate change. Joint initiatives are implemented in the field of mitigation and adaptation to climate change, transfer and promotion of low-carbon technologies, studies and researches as scientific support to decision-making. The cooperation program includes the following main projects: • Xinjiang Climate Change Implementation Plan: The project’s objective is to support Xinjiang province to develop and improve the Regional Climate Change Implementation Plan (published in 2012). Training and workshops were organized to promote the understanding on national policy of environmental protection and climate change. • Media Communications and Public Relations: The project has the objective to build the multi-sector mechanism and multi level network for climate change communication in China. The project has produced “China's Policies and Actions for Addressing Climate Change report (2011)”, Media Training for addressing climate change before Durban Conference, a series of workshops and dissemination materials for promoting social awareness. • Carbon Capture and Storage Comprehensive Application and Demonstration Project in Sha’anxi Province: the project has the objective to identify a feasible approach and the best technologies for large scale Carbon Capture, Use and Storage implementation. It is conducting Northern Shaanxi CO2 emission sources investigation and analysis, with the focus on non-power industry. • Capacity Building of Coastal Ecosystems to Climate Change Adaptation: The Project was implemented in Wenzhou city, involving on the Chinese side
the State Oceanic Administration and Zhejiang Research Institutes. The objective is to build a methodology to evaluate the climate change effect on the coastal and marine environment, and identify actions for the protection of the coastal and marine environment. The key indicators of human activities and climate change pressure were defined. • Training Program on Climate Change and Sustainable Development: specific courses on “capacity building on climate change” and “climate change: policy, conventions and statistical systems”. The training aims at providing Chinese participants with theoretical instruments and practical cases on Italian and European experiences in the field of environmental protection and climate change.
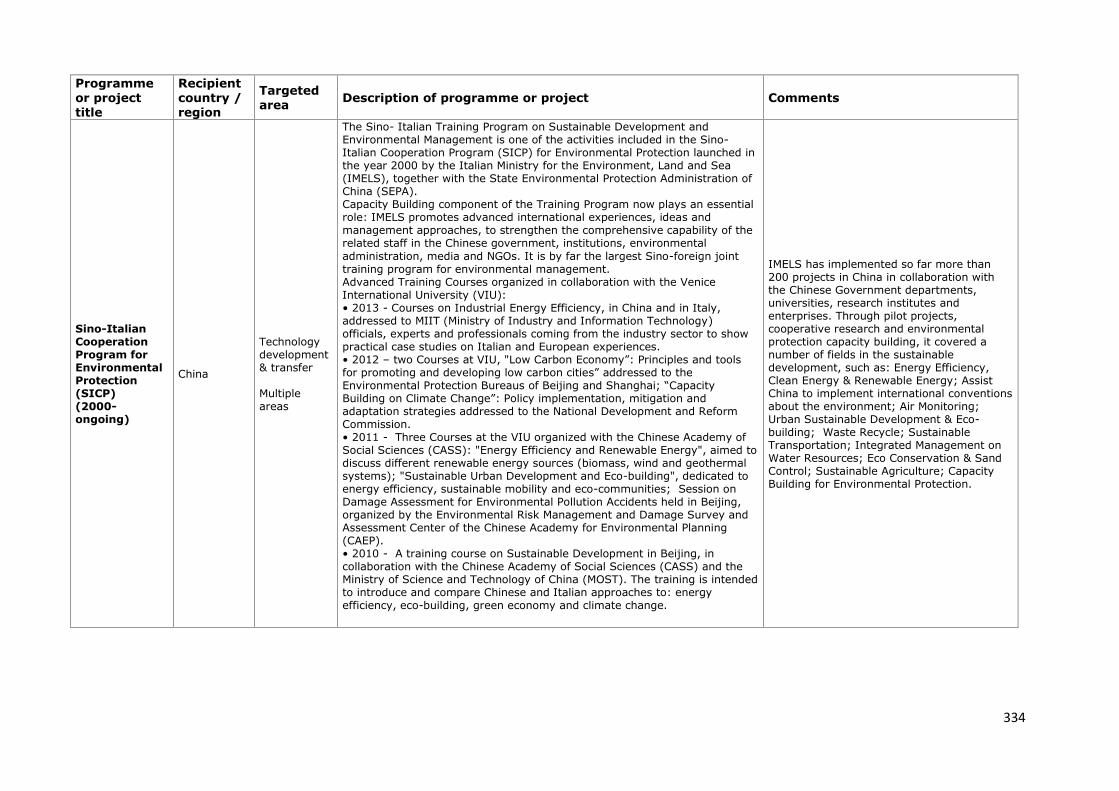
334
Programme or project title
Recipient country / region
Targeted area
Description of programme or project Comments
Sino-Italian Cooperation Program for Environmental Protection (SICP) (2000-ongoing)
China
Technology development & transfer Multiple areas
The Sino- Italian Training Program on Sustainable Development and Environmental Management is one of the activities included in the Sino-Italian Cooperation Program (SICP) for Environmental Protection launched in the year 2000 by the Italian Ministry for the Environment, Land and Sea (IMELS), together with the State Environmental Protection Administration of China (SEPA). Capacity Building component of the Training Program now plays an essential role: IMELS promotes advanced international experiences, ideas and management approaches, to strengthen the comprehensive capability of the related staff in the Chinese government, institutions, environmental
administration, media and NGOs. It is by far the largest Sino-foreign joint training program for environmental management. Advanced Training Courses organized in collaboration with the Venice International University (VIU): • 2013 - Courses on Industrial Energy Efficiency, in China and in Italy, addressed to MIIT (Ministry of Industry and Information Technology) officials, experts and professionals coming from the industry sector to show practical case studies on Italian and European experiences. • 2012 – two Courses at VIU, "Low Carbon Economy”: Principles and tools for promoting and developing low carbon cities” addressed to the Environmental Protection Bureaus of Beijing and Shanghai; “Capacity Building on Climate Change”: Policy implementation, mitigation and adaptation strategies addressed to the National Development and Reform Commission. • 2011 - Three Courses at the VIU organized with the Chinese Academy of Social Sciences (CASS): "Energy Efficiency and Renewable Energy", aimed to discuss different renewable energy sources (biomass, wind and geothermal systems); "Sustainable Urban Development and Eco-building", dedicated to energy efficiency, sustainable mobility and eco-communities; Session on Damage Assessment for Environmental Pollution Accidents held in Beijing, organized by the Environmental Risk Management and Damage Survey and Assessment Center of the Chinese Academy for Environmental Planning (CAEP). • 2010 - A training course on Sustainable Development in Beijing, in collaboration with the Chinese Academy of Social Sciences (CASS) and the Ministry of Science and Technology of China (MOST). The training is intended to introduce and compare Chinese and Italian approaches to: energy efficiency, eco-building, green economy and climate change.
IMELS has implemented so far more than 200 projects in China in collaboration with the Chinese Government departments, universities, research institutes and enterprises. Through pilot projects, cooperative research and environmental protection capacity building, it covered a number of fields in the sustainable development, such as: Energy Efficiency, Clean Energy & Renewable Energy; Assist China to implement international conventions about the environment; Air Monitoring; Urban Sustainable Development & Eco-building; Waste Recycle; Sustainable Transportation; Integrated Management on Water Resources; Eco Conservation & Sand Control; Sustainable Agriculture; Capacity Building for Environmental Protection.
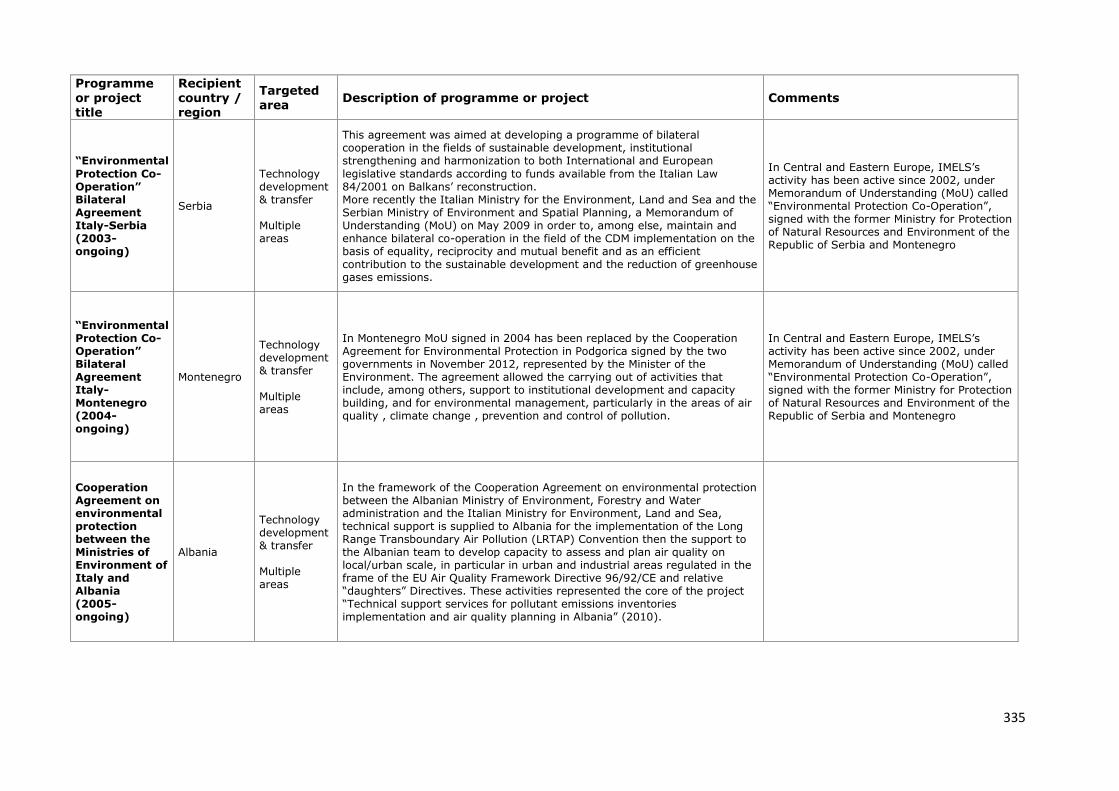
335
Programme or project title
Recipient country / region
Targeted area
Description of programme or project Comments
“Environmental
Protection Co-Operation” Bilateral Agreement Italy-Serbia (2003-ongoing)
Serbia
Technology development & transfer Multiple areas
This agreement was aimed at developing a programme of bilateral cooperation in the fields of sustainable development, institutional strengthening and harmonization to both International and European
legislative standards according to funds available from the Italian Law 84/2001 on Balkans’ reconstruction. More recently the Italian Ministry for the Environment, Land and Sea and the Serbian Ministry of Environment and Spatial Planning, a Memorandum of Understanding (MoU) on May 2009 in order to, among else, maintain and enhance bilateral co-operation in the field of the CDM implementation on the basis of equality, reciprocity and mutual benefit and as an efficient contribution to the sustainable development and the reduction of greenhouse gases emissions.
In Central and Eastern Europe, IMELS’s activity has been active since 2002, under Memorandum of Understanding (MoU) called “Environmental Protection Co-Operation”, signed with the former Ministry for Protection of Natural Resources and Environment of the Republic of Serbia and Montenegro
“Environmental Protection Co-Operation” Bilateral Agreement Italy-Montenegro (2004-ongoing)
Montenegro
Technology development & transfer Multiple areas
In Montenegro MoU signed in 2004 has been replaced by the Cooperation Agreement for Environmental Protection in Podgorica signed by the two governments in November 2012, represented by the Minister of the Environment. The agreement allowed the carrying out of activities that include, among others, support to institutional development and capacity building, and for environmental management, particularly in the areas of air quality , climate change , prevention and control of pollution.
In Central and Eastern Europe, IMELS’s activity has been active since 2002, under Memorandum of Understanding (MoU) called “Environmental Protection Co-Operation”, signed with the former Ministry for Protection of Natural Resources and Environment of the Republic of Serbia and Montenegro
Cooperation Agreement on environmental protection between the Ministries of Environment of Italy and Albania (2005-ongoing)
Albania
Technology development & transfer Multiple areas
In the framework of the Cooperation Agreement on environmental protection between the Albanian Ministry of Environment, Forestry and Water administration and the Italian Ministry for Environment, Land and Sea, technical support is supplied to Albania for the implementation of the Long Range Transboundary Air Pollution (LRTAP) Convention then the support to the Albanian team to develop capacity to assess and plan air quality on local/urban scale, in particular in urban and industrial areas regulated in the frame of the EU Air Quality Framework Directive 96/92/CE and relative “daughters” Directives. These activities represented the core of the project “Technical support services for pollutant emissions inventories implementation and air quality planning in Albania” (2010).
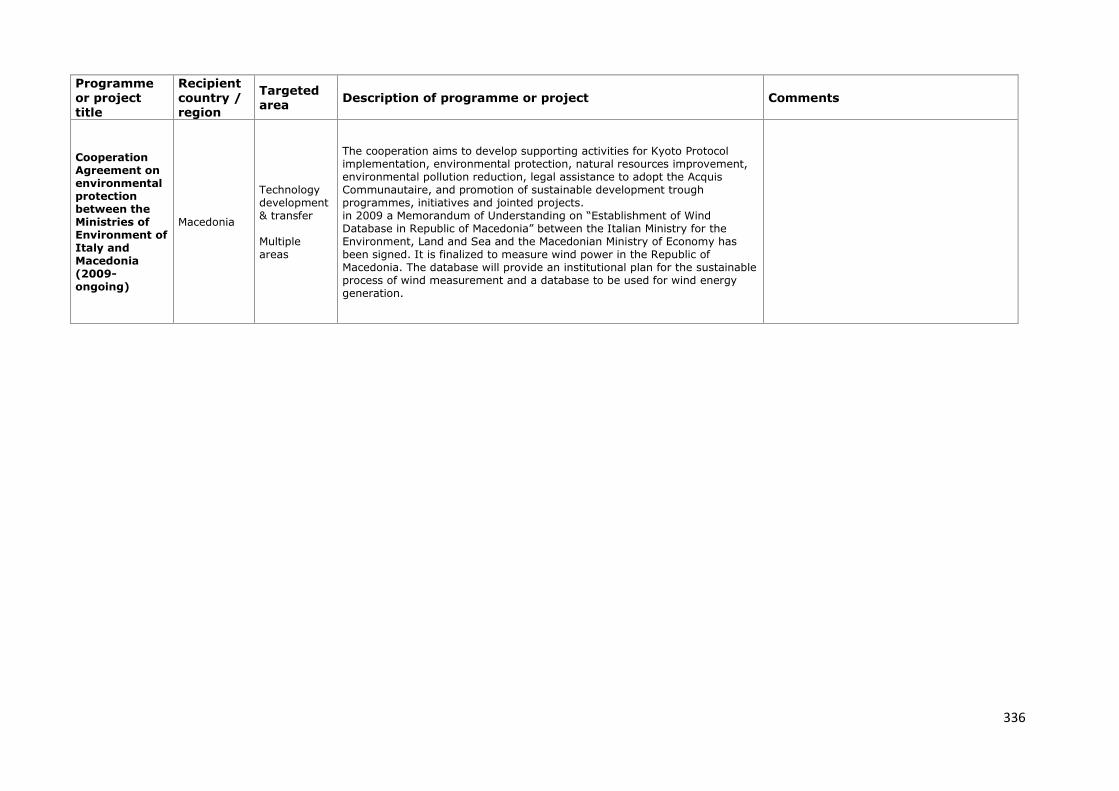
336
Programme or project title
Recipient country / region
Targeted area
Description of programme or project Comments
Cooperation Agreement on environmental protection between the Ministries of Environment of Italy and Macedonia (2009-ongoing)
Macedonia
Technology development & transfer Multiple areas
The cooperation aims to develop supporting activities for Kyoto Protocol implementation, environmental protection, natural resources improvement, environmental pollution reduction, legal assistance to adopt the Acquis Communautaire, and promotion of sustainable development trough programmes, initiatives and jointed projects. in 2009 a Memorandum of Understanding on “Establishment of Wind Database in Republic of Macedonia” between the Italian Ministry for the Environment, Land and Sea and the Macedonian Ministry of Economy has been signed. It is finalized to measure wind power in the Republic of Macedonia. The database will provide an institutional plan for the sustainable process of wind measurement and a database to be used for wind energy generation.
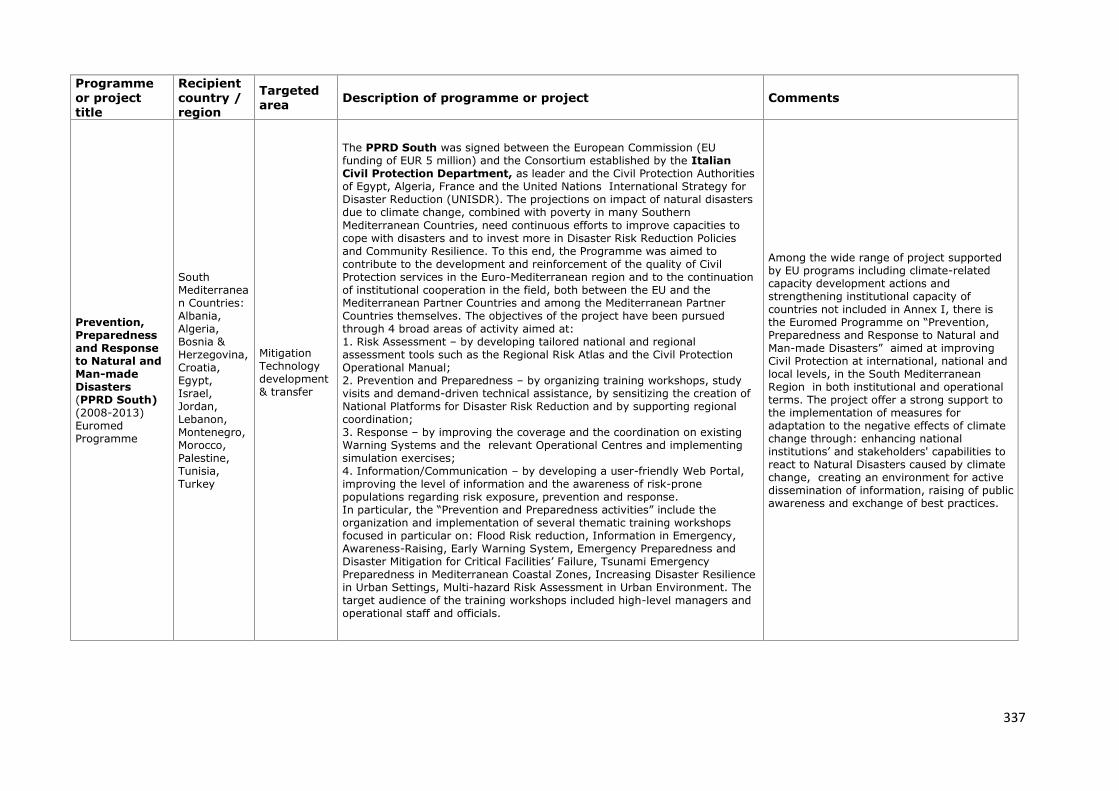
337
Programme or project title
Recipient country / region
Targeted area
Description of programme or project Comments
Prevention, Preparedness and Response to Natural and Man-made Disasters (PPRD South) (2008-2013) Euromed Programme
South Mediterranean Countries: Albania, Algeria, Bosnia & Herzegovina, Croatia, Egypt, Israel, Jordan, Lebanon, Montenegro, Morocco, Palestine, Tunisia, Turkey
Mitigation Technology development & transfer
The PPRD South was signed between the European Commission (EU funding of EUR 5 million) and the Consortium established by the Italian Civil Protection Department, as leader and the Civil Protection Authorities of Egypt, Algeria, France and the United Nations International Strategy for Disaster Reduction (UNISDR). The projections on impact of natural disasters due to climate change, combined with poverty in many Southern
Mediterranean Countries, need continuous efforts to improve capacities to cope with disasters and to invest more in Disaster Risk Reduction Policies and Community Resilience. To this end, the Programme was aimed to contribute to the development and reinforcement of the quality of Civil Protection services in the Euro-Mediterranean region and to the continuation of institutional cooperation in the field, both between the EU and the Mediterranean Partner Countries and among the Mediterranean Partner Countries themselves. The objectives of the project have been pursued through 4 broad areas of activity aimed at: 1. Risk Assessment – by developing tailored national and regional assessment tools such as the Regional Risk Atlas and the Civil Protection Operational Manual; 2. Prevention and Preparedness – by organizing training workshops, study visits and demand-driven technical assistance, by sensitizing the creation of National Platforms for Disaster Risk Reduction and by supporting regional coordination; 3. Response – by improving the coverage and the coordination on existing Warning Systems and the relevant Operational Centres and implementing simulation exercises; 4. Information/Communication – by developing a user-friendly Web Portal, improving the level of information and the awareness of risk-prone populations regarding risk exposure, prevention and response. In particular, the “Prevention and Preparedness activities” include the organization and implementation of several thematic training workshops focused in particular on: Flood Risk reduction, Information in Emergency, Awareness-Raising, Early Warning System, Emergency Preparedness and Disaster Mitigation for Critical Facilities’ Failure, Tsunami Emergency Preparedness in Mediterranean Coastal Zones, Increasing Disaster Resilience in Urban Settings, Multi-hazard Risk Assessment in Urban Environment. The target audience of the training workshops included high-level managers and operational staff and officials.
Among the wide range of project supported by EU programs including climate-related capacity development actions and strengthening institutional capacity of countries not included in Annex I, there is the Euromed Programme on “Prevention, Preparedness and Response to Natural and Man-made Disasters” aimed at improving Civil Protection at international, national and local levels, in the South Mediterranean Region in both institutional and operational terms. The project offer a strong support to the implementation of measures for adaptation to the negative effects of climate change through: enhancing national institutions’ and stakeholders' capabilities to react to Natural Disasters caused by climate change, creating an environment for active dissemination of information, raising of public awareness and exchange of best practices.
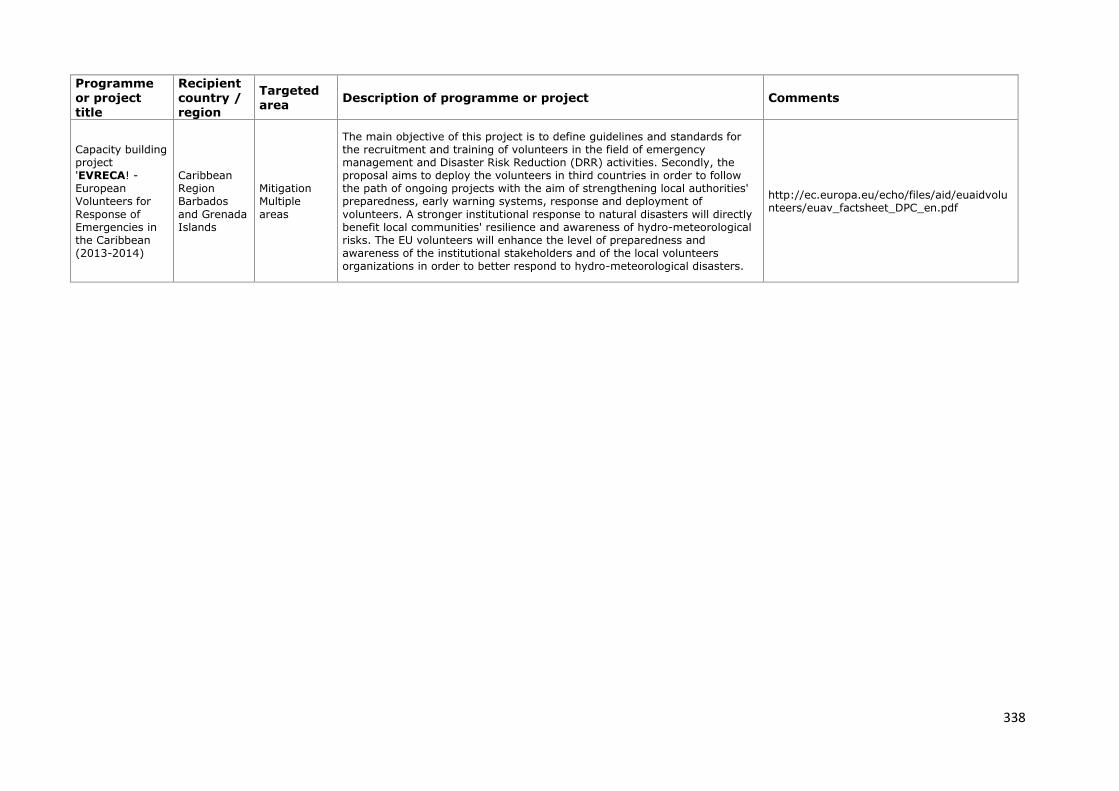
338
Programme or project title
Recipient country / region
Targeted area
Description of programme or project Comments
Capacity building project 'EVRECA! - European Volunteers for
Response of Emergencies in the Caribbean (2013-2014)
Caribbean Region Barbados
and Grenada Islands
Mitigation Multiple
areas
The main objective of this project is to define guidelines and standards for the recruitment and training of volunteers in the field of emergency management and Disaster Risk Reduction (DRR) activities. Secondly, the proposal aims to deploy the volunteers in third countries in order to follow the path of ongoing projects with the aim of strengthening local authorities' preparedness, early warning systems, response and deployment of
volunteers. A stronger institutional response to natural disasters will directly benefit local communities' resilience and awareness of hydro-meteorological risks. The EU volunteers will enhance the level of preparedness and awareness of the institutional stakeholders and of the local volunteers organizations in order to better respond to hydro-meteorological disasters.
http://ec.europa.eu/echo/files/aid/euaidvolunteers/euav_factsheet_DPC_en.pdf
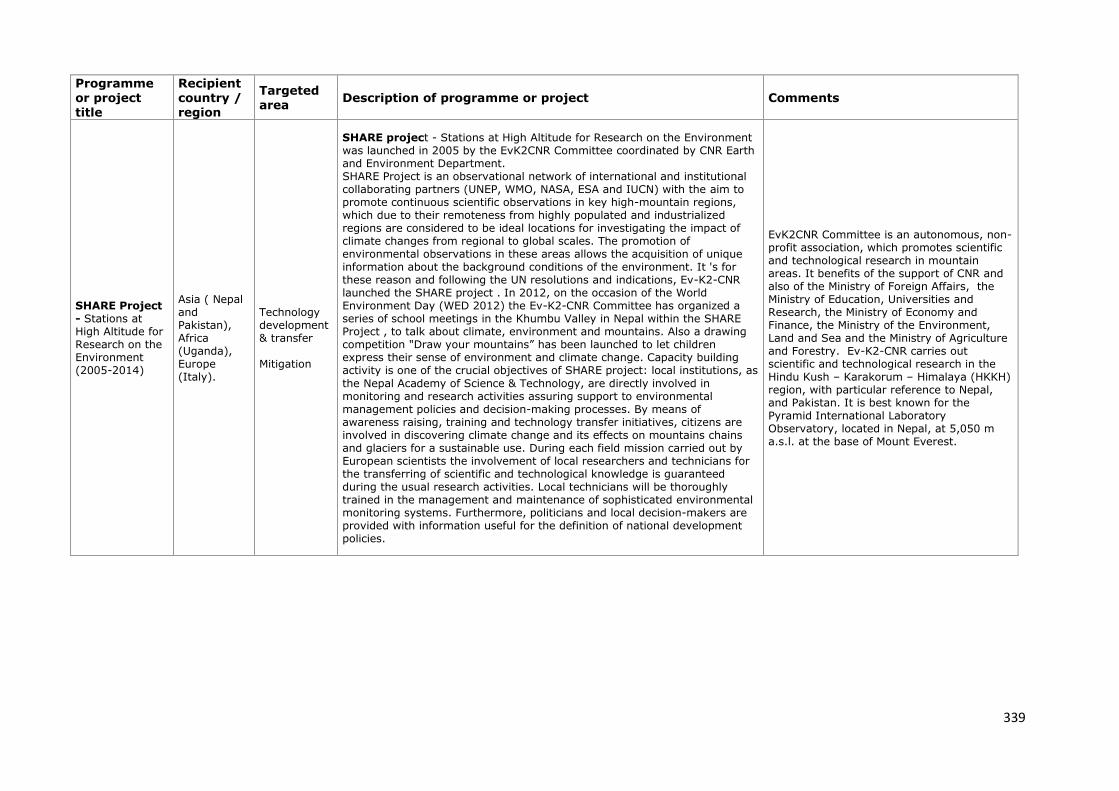
339
Programme or project title
Recipient country / region
Targeted area
Description of programme or project Comments
SHARE Project - Stations at High Altitude for Research on the Environment (2005-2014)
Asia ( Nepal and Pakistan), Africa (Uganda), Europe (Italy).
Technology development & transfer Mitigation
SHARE project - Stations at High Altitude for Research on the Environment was launched in 2005 by the EvK2CNR Committee coordinated by CNR Earth and Environment Department. SHARE Project is an observational network of international and institutional collaborating partners (UNEP, WMO, NASA, ESA and IUCN) with the aim to promote continuous scientific observations in key high-mountain regions, which due to their remoteness from highly populated and industrialized regions are considered to be ideal locations for investigating the impact of climate changes from regional to global scales. The promotion of environmental observations in these areas allows the acquisition of unique information about the background conditions of the environment. It 's for these reason and following the UN resolutions and indications, Ev-K2-CNR launched the SHARE project . In 2012, on the occasion of the World Environment Day (WED 2012) the Ev-K2-CNR Committee has organized a series of school meetings in the Khumbu Valley in Nepal within the SHARE Project , to talk about climate, environment and mountains. Also a drawing competition "Draw your mountains” has been launched to let children express their sense of environment and climate change. Capacity building activity is one of the crucial objectives of SHARE project: local institutions, as
the Nepal Academy of Science & Technology, are directly involved in monitoring and research activities assuring support to environmental management policies and decision-making processes. By means of awareness raising, training and technology transfer initiatives, citizens are involved in discovering climate change and its effects on mountains chains and glaciers for a sustainable use. During each field mission carried out by European scientists the involvement of local researchers and technicians for the transferring of scientific and technological knowledge is guaranteed during the usual research activities. Local technicians will be thoroughly trained in the management and maintenance of sophisticated environmental monitoring systems. Furthermore, politicians and local decision-makers are provided with information useful for the definition of national development policies.
EvK2CNR Committee is an autonomous, non-profit association, which promotes scientific and technological research in mountain areas. It benefits of the support of CNR and also of the Ministry of Foreign Affairs, the Ministry of Education, Universities and Research, the Ministry of Economy and Finance, the Ministry of the Environment, Land and Sea and the Ministry of Agriculture and Forestry. Ev-K2-CNR carries out scientific and technological research in the Hindu Kush – Karakorum – Himalaya (HKKH) region, with particular reference to Nepal, and Pakistan. It is best known for the Pyramid International Laboratory Observatory, located in Nepal, at 5,050 m a.s.l. at the base of Mount Everest.
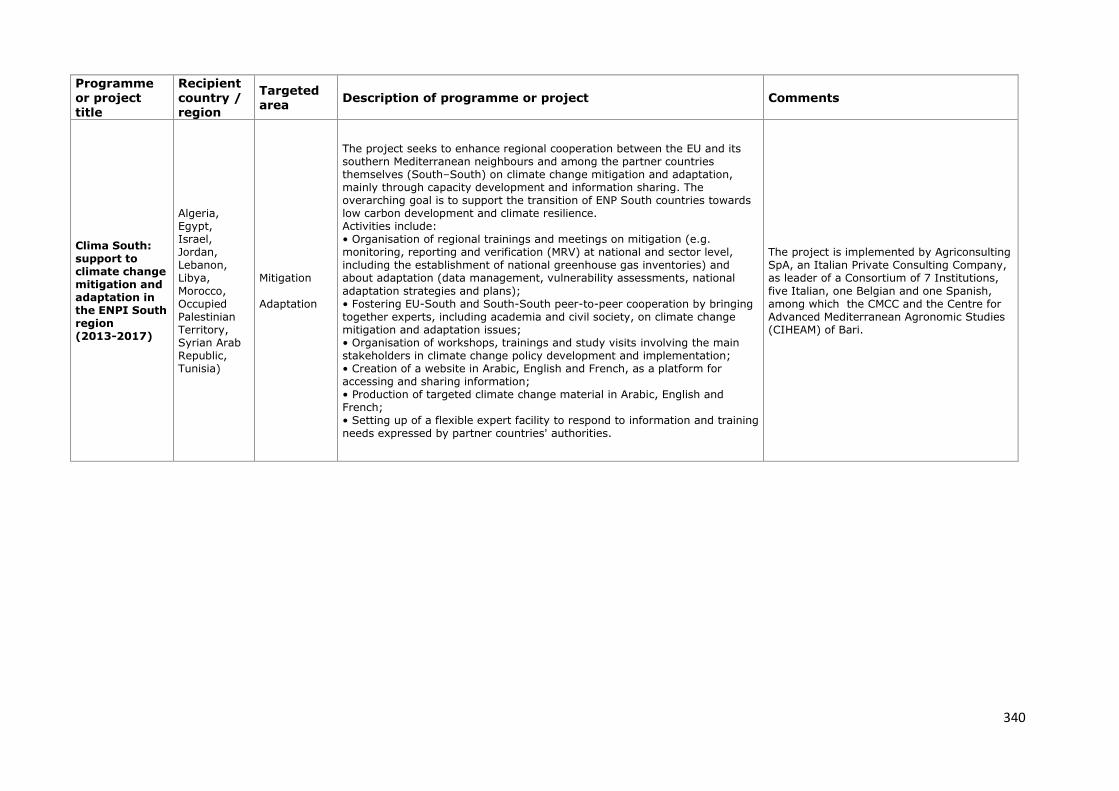
340
Programme or project title
Recipient country / region
Targeted area
Description of programme or project Comments
Clima South: support to climate change mitigation and adaptation in the ENPI South region (2013-2017)
Algeria, Egypt, Israel, Jordan, Lebanon, Libya,
Morocco, Occupied Palestinian Territory, Syrian Arab Republic, Tunisia)
Mitigation
Adaptation
The project seeks to enhance regional cooperation between the EU and its southern Mediterranean neighbours and among the partner countries themselves (South–South) on climate change mitigation and adaptation, mainly through capacity development and information sharing. The overarching goal is to support the transition of ENP South countries towards low carbon development and climate resilience. Activities include: • Organisation of regional trainings and meetings on mitigation (e.g. monitoring, reporting and verification (MRV) at national and sector level, including the establishment of national greenhouse gas inventories) and about adaptation (data management, vulnerability assessments, national
adaptation strategies and plans); • Fostering EU-South and South-South peer-to-peer cooperation by bringing together experts, including academia and civil society, on climate change mitigation and adaptation issues; • Organisation of workshops, trainings and study visits involving the main stakeholders in climate change policy development and implementation; • Creation of a website in Arabic, English and French, as a platform for accessing and sharing information; • Production of targeted climate change material in Arabic, English and French; • Setting up of a flexible expert facility to respond to information and training needs expressed by partner countries' authorities.
The project is implemented by Agriconsulting SpA, an Italian Private Consulting Company, as leader of a Consortium of 7 Institutions,
five Italian, one Belgian and one Spanish, among which the CMCC and the Centre for Advanced Mediterranean Agronomic Studies (CIHEAM) of Bari.
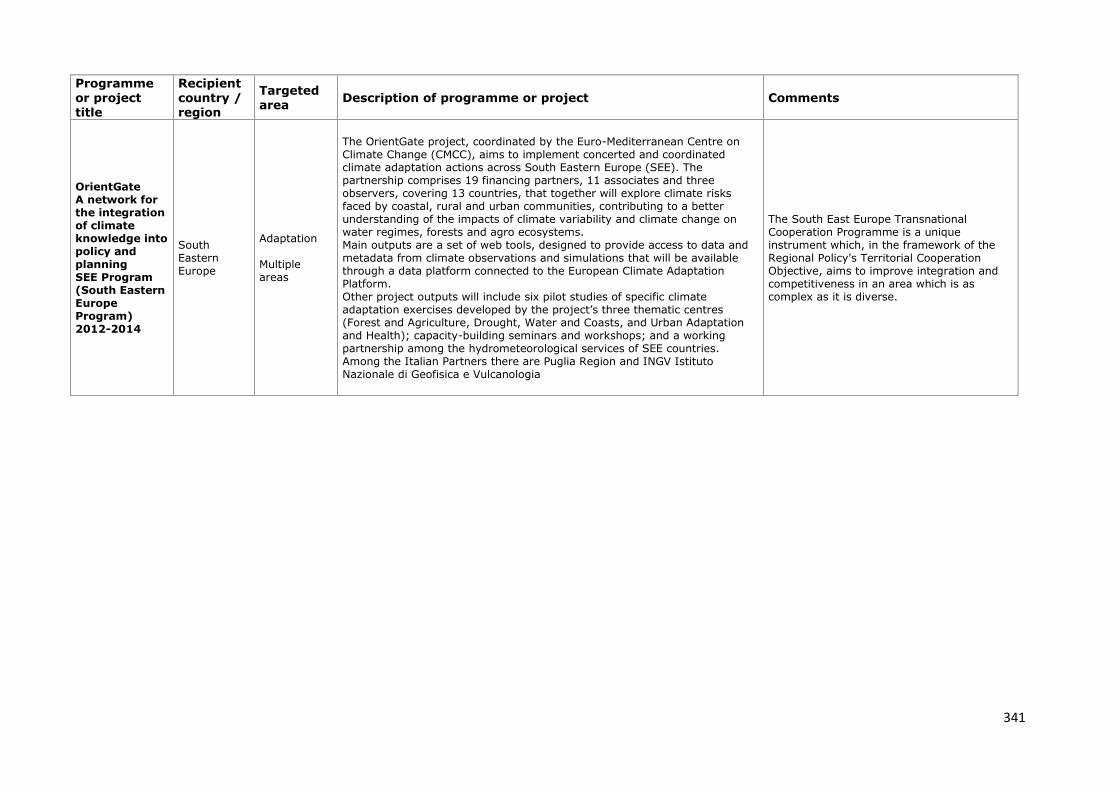
341
Programme or project title
Recipient country / region
Targeted area
Description of programme or project Comments
OrientGate A network for the integration of climate knowledge into policy and planning SEE Program (South Eastern Europe Program) 2012-2014
South Eastern Europe
Adaptation Multiple areas
The OrientGate project, coordinated by the Euro-Mediterranean Centre on Climate Change (CMCC), aims to implement concerted and coordinated climate adaptation actions across South Eastern Europe (SEE). The partnership comprises 19 financing partners, 11 associates and three observers, covering 13 countries, that together will explore climate risks faced by coastal, rural and urban communities, contributing to a better understanding of the impacts of climate variability and climate change on water regimes, forests and agro ecosystems. Main outputs are a set of web tools, designed to provide access to data and metadata from climate observations and simulations that will be available through a data platform connected to the European Climate Adaptation Platform. Other project outputs will include six pilot studies of specific climate adaptation exercises developed by the project’s three thematic centres (Forest and Agriculture, Drought, Water and Coasts, and Urban Adaptation and Health); capacity-building seminars and workshops; and a working partnership among the hydrometeorological services of SEE countries. Among the Italian Partners there are Puglia Region and INGV Istituto Nazionale di Geofisica e Vulcanologia
The South East Europe Transnational Cooperation Programme is a unique instrument which, in the framework of the Regional Policy's Territorial Cooperation Objective, aims to improve integration and competitiveness in an area which is as complex as it is diverse.