size and concentration patterns of the world's largest reinsurance ... · outreville (1995)...
TRANSCRIPT
The Geneva Papers on Risk and Insurance, 23 (No. 86, January 1998) 68-80
Size and Concentration Patternsof the World's Largest Reinsurance Companies
by J. François d'Outreville *
Abstract
By examining the distribution of the total net premiums written by the 100 largest rein-surance companies in the world, this paper documents two dimensions of the change inmarket concentration: the trend in concentration in the world's largest companies, and therelative position of these companies by countries. A statistical analysis is developed andfactors that may have an impact on concentration patterns are examined.
1. Introduction
The relative decline in economic power of the United States has been well-documentedby the popular press. Industries once dominated by American such as the electronic equip-ment, the automobile industry, and the financial services industry have been subjected tosevere pressures from foreign competitors. A comparable shift appears to be occuring in thereinsurance industry which is a significant component of the current account balance ofsome of the OECD countries (Walter, 1988).
In 1980, eight of the twenty largest reinsurance companies in the world were Germanreinsurers, seven were American reinsurers and only one was a Japanese company. In 1994,eight were German, six were Japanese, but only five were American companies.Thirty com-panies from only eight countries share about 70 percent of the world reinsurance market. Atthe same time, the world market share of the top ten companies also has increased fromabout 40 percent in 1980 to approximately 45 percent today.
Traditionally, there were only very few international reinsurance markets. London wasthe most important one because of its unique organization "Lloyds". Germany andSwitzerland developed their own reinsurance markets, which still play an important role inthe world markets. For many years the United States depended on foreign reinsurance,however, the growth of the US reinsurance companies and the development of markets
* The author is Economic Officer with the United Nations Office at Geneva.A first draft of the paper was presented at the International Insurance Society Meeting in July 1996
in Amsterdam. Comments from the referees are acknowledged. The opinions expressed in this paperare those of the author and do not necessarily reflect the views of the Organization.
68

similar to that of Lloyds have been major trends affecting the increase of reinsurance capa-city in the United States. More recently, the rapid expansion of Japanese reinsurance com-panies has changed the leadership in some reinsurance activities at the expense of reinsurersfrom the United States and some European countries.
The standard and Poor's Insurance Rating services in their survey continues to believethe 1990s will see a consolidation of the reinsurance industry. Larger players will be increa-singly controlling a bigger share of the market. Furthermore, liberalization of trade in finan-cial services inevitably will have an impact on the number of mergers, acquisitions, shareswapping, and working arrangements around the world. Changes in the structure of theinternational market started in 1994 with the acquisition of some major players by US com-panies. More recently, two US companies took a majority interest in german reinsurancecompanies. The two moves have placed the US companies closer to the German reinsuranceindustry.
This paper has two objectives. The first is the documentation of the relative size andmarket share of the largest reinsurance companies in the world. The second objective is toidentify the factors which may explain changes in the positions in the large reinsurance com-panies in the two major reinsurance markets, i.e. the United States and Germany.
In the next section the data used for the 100 largest reinsurance companies in the worldis described. In section 3 the world's largest reinsurance companies by country are presentedand in the following section an empirical analysis of the growth of the majore reinsurancemarkets is developed and the result are presented.
2. The loo largest reinsurance companies in the world
The sizes and quantities of risks normally vary from one company to another and alsofrom one country to another. Previous empirical researches by Mayers and Smith (1990) andOutreville (1995) document that factors such as ownership structure, firm size, market size,geographic concentration and line-of-business concentration influence the demand forreinsurance.
Obtaining comparable data for all reinsurers in all countries is nearly an impossibletask.The review ReActions has worked with the International Insurance Solvency and Stan-dard and Poor's to collect data on the world's largest reinsurance companies since 1986.1Data published for the top 100 reinsurance companies from 1987 to 1995 has been used tocalculate the percent of total net premiums written of the 100 largest reinsurance companiesfor every year.
Theoretically, it would be preferable to have the total net premiums written in theworld market to calculate market shares. Because it is a nearly impossible task, market sha-res are based on a denominator consisting of the total net premiums written by the 100
1 The listings concentrate on reinsurance premiums and corporate statistics.The premium sectionsrelate to reinsurance operations only and the criterion for inclusion in the list is the level of property-casualty business written. Information on consolidated groups is also provided but to insure consistencyin the data from 1987 to 1995. Information provided for each company within a group has been used.It is hypothesized that reporting errors for some companies are constant over time.
69
largest companies. In a compilation of this magnitude problems always arise. Data are diffi-cult or impossible to obtain from companies in certain countries. It is said that the figuresfrom Japan are debatable. Mergers also affect relative rankings from one year to the other.Despite these limitations, it remains the most accurate presentation of the relative positionof the largest reinsurers in the world and can be used to construct measures of the relativepositions of countries as reinsurance centers.
This section presents the results of static and dynamic measures of concentration, allbased on the market shares qi of each company derived from the proportion of net pre-miums written.
2.1. Static measures
The first static measure is the well-known Herfindahl-Hirschman index calculated forthe top loo companies:
FI = ; {qi]2
The advantage of this measurement is that it makes it possible to calculate a "numberequivalent" of companies (N5 = 1/H) where N5 is the potential number of companies of thesame size which could exist on the market for a given degree of concentration.2
The second measure is Kwoka's (1977) Dominance index:
D = E [qi - qi + 1]2
This emphasizes the gap between successive firms when they are ranked by size. The valuesof this measure range from 1 to O, with the former value indicating a monopolistic market.Conversely, the closer to zero the measure is, the lower is the power of any single company.
2.2. Dynamic measures
The other measures reflect changes (dynamic approach).These measures have been cal-culated for the top 30 companies for the sub-periods 1987-1990, 1990-1993 and 1993-1995.The period has been divided in egal sub-periods (except for the last period) for the needs ofthe dynamic analysis.
Hymer and Pashigian (1962) developed an index of market share instability:
I=E Iqi- qi,t-nI
If a company was not in the top 30 at either r or rn, its market share for that year isset to zero. The higher the value of!, the greater the degree of change in market shares overthe period, and by implication, the greater the competitive turbulence and the amount ofentry and exit.
2 An alternative measure to quantify the degree of concentration would be the use of Theil's levelof entropy.
70

Grossack (1965) has suggested, for determining whether a change in concentration isstatistically significant or not, to regress the market shares qi,t on qi,t-n. If the slope coef-ficient is greater than 1, then concentration as measured by the Herfindahl-Hirschmanindex has increased. Similarly, if it is less than 1, concentration has decreased.
Tables 1 and 2 present the results of the calculations of the static and dynamic measuresrespectively. Casual observation reveals some interesting trends. From 1987 to 1994 themarket share of the three largest companies slightly fluctuated but at the same time themarket share of the ten and fifteen largest companies slightly increased until 1994.
Table 1:Measures of concentration of the world reinsu rance market
Overall, the number of potential competitors derived from the Herfindhal index onlyslightly fluctuated but the dominance index for the same period decreased. Market shareinstability has increased from 1987-1990 to 1990-1993. On the other hand, the measure ofthe change in concentration shows that concentration significantly decreased from 1987 to1990 and remained unchanged from 1990 to 1995.
Table 2:Dynamic measures of concentration
71
Percentage shareof the first:
1987 1988 1989 1990 1991 1992 1993 1994 1995
3 companies 25.11 24.97 24.76 24.46 24.68 23.90 25.61 29.22 24.55
5 companies 30.75 30.72 31.66 31.89 31.73 31.11 32.23 35.51 31.05
10 companies 43.09 43.79 45.09 45.77 46.02 45.19 45.31 48.09 43.67
15 companies 52.68 53.71 55.30 54.52 56.20 55.33 54.29 55.23 51.47
30 companies 70.65 70.59 72.26 70.51 72.33 71.21 69.70 69.91 66.82
Herfindahi Index .0374 .0377 .0386 .0376 .0383 .0353 .0378 .0483 .0372
Number equivalent 26.7 26.5 25.8 26.6 26.1 28.3 26.4 20.7 26.9
Dominance index .0083 .0085 .0088 .0090 .0069 .0048 .0057 .0120 .0088
1987-1990 1990-1993 1993-1995
Market share instability 0.2144 0.3374 0.2780
Change in concentration: Coefficient 0.71 0.97 0.98Standard error 0.11 0.04 0.18
Compared to the same measures calculated for the world's 100 largest banks in 1979 byTschoegl (1982), the values of the Herfindhal index, Dominance index and market share ins-tability are quite high.
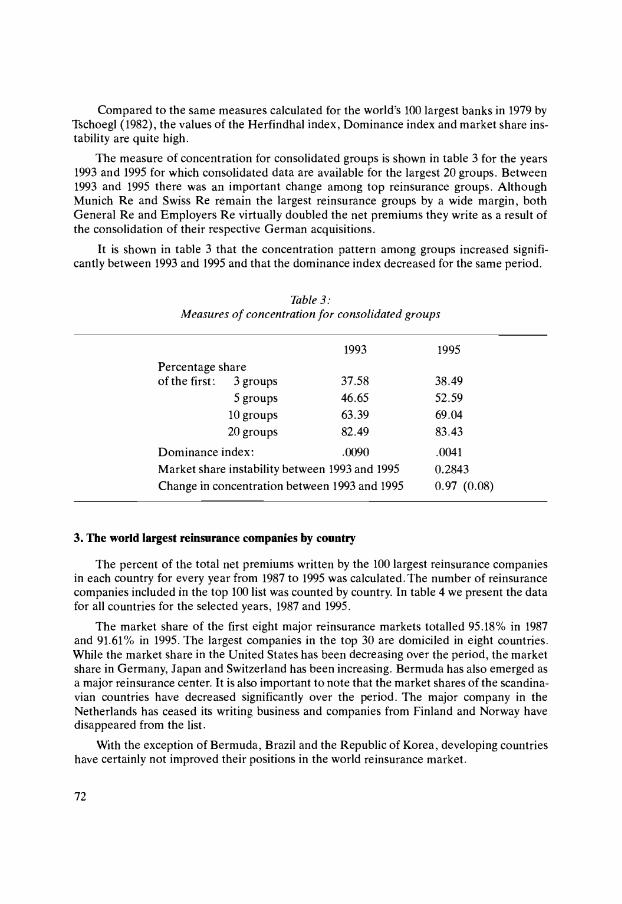
The measure of concentration for consolidated groups is shown in table 3 for the years1993 and 1995 for which consolidated data are available for the largest 20 groups. Between1993 and 1995 there was an important change among top reinsurance groups. AlthoughMunich Re and Swiss Re remain the largest reinsurance groups by a wide margin, bothGeneral Re and Employers Re virtually doubled the net premiums they write as a result ofthe consolidation of their respective German acquisitions.
It is shown in table 3 that the concentration pattern among groups increased signifi-cantly between 1993 and 1995 and that the dominance index decreased for the same period.
Table 3:Measures of concentration for consolidated groups
3. The world largest remsurance companies by country
The percent of the total net premiums written by the 100 largest reinsurance companiesin each country for every year from 1987 to 1995 was calculated. The number of reinsurancecompanies included in the top 100 list was counted by country. In table 4 we present the datafor all countries for the selected years, 1987 and 1995.
The market share of the first eight major reinsurance markets totalled 95.18% in 1987and 91.61% in 1995. The largest companies in the top 30 are domiciled in eight countries.While the market share in the United States has been decreasing over the period, the marketshare in Germany, Japan and Switzerland has been increasing. Bermuda has also emerged asa major reinsurance center. It is also important to note that the market shares of the scandina-vian countries have decreased significantly over the period. The major company in theNetherlands has ceased its writing business and companies from Finland and Norway havedisappeared from the list.
With the exception of Bermuda, Brazil and the Republic of Korea, developing countrieshave certainly not improved their positions in the world reinsurance market.
72
1993 1995
Percentage shareof the first: 3 groups 37.58 38.49
5 groups 46.65 52.59
10 groups 63.39 69.0420 groups 82.49 83.43
Dominance index: .0090 .0041
Market share instability between 1993 and 1995 0.2843Change in concentration between 1993 and 1995 0.97 (0.08)

Table 4:Market share and number of reinsurance companies by countries
100.00 100 100.00 100
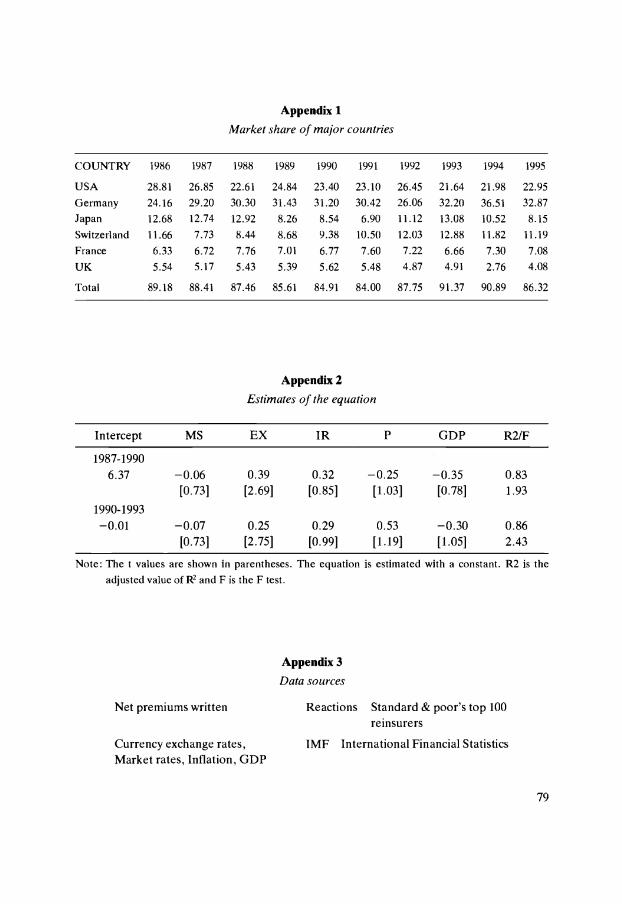
The data from 1986 to 1995 for the six major reinsurance countries are presented inAppendix 1.There are sizable changes in market shares from the beginning to the end of thetime period. Figure 1 presents the market shares of these countries.
If the value of a foreign currency increases, obviously the value of the net premiumamount written in a country will increase relative to the US market, since all data areconverted to a common currency, the US Dollar. The question arises as to whether all thechanges noted above are only due to the changes in exchange rate valuation.
For example, the US experienced an increase in market share from 1988 to 1989 whenthe Dollar was stronger, but this hypothesis cannot explain the increase in 1992. The samerelationship can also be observed for Japan in 1989 when the Yen was weaker relative to theUS Dollar.
73
1987 1995COUNTRY Market Number Market Number
share of cies share of cies
Germany 29.20 15 32.87 15
United States of America 26.85 29 22.95 27
Japan 12.74 16 8.15 13
Switzerland 7.73 4 11.19 8
France 6.72 10 7.08 9
United Kingdom 5.17 7 4.08 7
Sweden 3.46 3 1.00 2
Italy 3.31 2 4.24 2
Finland 1.00 4 - -Netherlands 0.95 1 - -Norway 0.64 1 - -Denmark 0.50 2 0.72 1
Bermuda 0.48 2 2.80 6Bahrain 0.36 1 0.33 1
Korea, Rep. of 0.35 1 0.87 1
Brazil 0.27 1 0.77 1
Iraq 0.27 1 - -Australia - - 1.03 2
Spain - - 0.30 1
Barbados - - 0.42 1
Ireland - - 0.55 2
Taiwan - - 0.65 1

1arket Share
40
74
40
30-
20 -
10
o
20-
10-
0-
1986
-10 -
1986 1988
Figure 1:Market shares of the six major reinsurance centers
Figure 2:The relationship between the german market share and the GDP
differential between Germany and the United States
Vea r
o--- Germany* GDP-Oiflerentiai
USA
Germany
Japan
S w tze ria nd
France
UK
M
Year1988 1990 1992 1994 1996
1990 1992 1994 1996

From Figure, 1 it is interesting to notice the inverse relationship between the relativemarket shares of Germany and the United States which may give some rationale for mer-gers among companies in these two countries.These two countries also have a large nationalmarket base supporting the reinsurance activities of their companies. It is important toverify if economic factors in the two countries, other than currency fluctuations, exhibit asimilar pattern.
3.1. A graphical analysis of economic factors
Past research in the banking sector suggests that rankings of banks are affected bygrowth of the domestic economy, levels of international trade and investment, exchangerate fluctuations and differences in government politics (Hart and Pearce (1986), Dohnerand Terrel (1988), Goldberg and Hanweck (1991)). At constant exchange rates, interestrates and expected inflation, real growth of the Gross Domestic Product (GDP) should leadto a greater insurance base and, therefore, should be positively correlated with market share.
The impact of these variables was tested for the periods 1986 to 1995 by comparing themacroeconomic variables for Germany and the United States. The difference between theGDP (in real terms), the money market rate and the inflation rate (based on the consumerprice index) was calculated for the two countries and plotted against the market share ofGerman reinsurance companies. The results are reported in Figures 2 to 4 and show a simi-lar pattern of fluctuation.
Figure 3:The relationship between the German market share and the
interest rate differential between Germany and the United States
Year
0---- GemanyS Interest Rate Difterential
75

40
10-
-101986 1988
The model is similar to a stock adjustment model and includes the market share of the countryat the previous period. It is hypothesized that the adjustment of the market share is due to exogeneouseconomic factors.
76
0-
Figure 4:The relationship between the German market share and theinflation differential between Germany and the United States
1990 1992 1994
Yar
4. An econometric analysis of the major reinsurance markets
A number of previous papers have dealt with related questions and serve as methodolo-gical bases for the current paper. Some of these papers have examined the growth of theworld's largest banks (Goldberg and Hanweck, 1991). Hart and Pearce (1986) have exami-ned the growth patterns of the world's largest firms by using a constant sample of firms fromlists published in Fortune magazine.
Using the same model to explain the growth or decline of the market share of reinsu-rance centers, the author (Outreville, 1996) analyzed the statistical relationship of pooleddata for the eight major centers over the sub-periods 1987-1990 and 1990-1993. The resultsare reported in appendix 2 and the model is represented below:3
Yj = f(MSj, EXj, IRj, Pj, GDPj)whereYj = change in percent of market share of the 100 largest reinsurance com-
panies in country j;MSj = initial market share in country j;EXj = appreciation or depreciation of currency in country j;IRj = change in market interest rates in country j;Pj = rate of inflation per period in country j;GDPj = rate of change in real GDP per period in country j;j = country subscript.
1996
Germany
$ Inflation Differential
30 >20
Changes in a national currency as compared to the average value of Special DrawingRights (SDR) are used for the eight countries of the analysis.4 As expected the appreciationof the national currency significantly explains the increase in the country's world marketshare.
Changes in interest rates positively affect the market shares of the countries. However,this relationship is not statistically significant over the periods considered in the analysis.
A reduction in inflation or actual deflation of domestic prices has the dual effect of rai-sing relative expected real yields on domestic assets and reversing the deficit and futuredemand for financing that may affect the stability of the national currency in terms of Spe-cial Drawing Rights. A negative relationship between inflation and market share schould beexpected. However, a country's inflation rate is likely to be positively associated with agrowth in the country's assets and insurancxe premiums. The adjustment of exchange rateand relative prices among countries may neutralize the effect of inflation. These adjust-ments may also take time before having a perceptible effect.
Surprisingly the relationship between GDP growth and market shares is not statisticallysignificant and shows a negative sign contrary to the expectations.
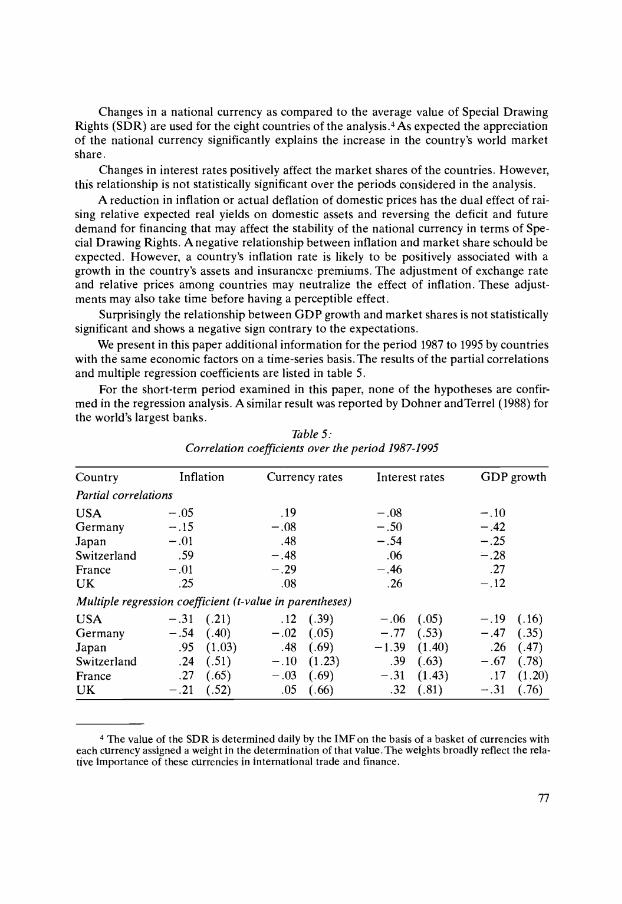
We present in this paper additional information for the period 1987 to 1995 by countrieswith thé same economic factors on a time-series basis. The results of the partial correlationsand multiple regression coefficients are listed in table 5.
For the short-term period examined in this paper, none of the hypotheses are confir-med in the regression analysis. A similar result was reported by Dohner andTerrel (1988) forthe world's largest banks.
Table 5:Correlation coefficients over the period 1987-1995
Country Inflation Currency rates Interest rates GDP growth
Partial correlations
USA -.05 .19 -.08 -.10Germany - .15 - .08 - .50 - .42Japan - .01 .48 - .54 - .25Switzerland .59 - .48 .06 - .28France - .01 - .29 - .46 .27UK .25 .08 .26 - .12Multiple regression coefficient (t-value in parentheses)
USA -.31 (.21) .12 (.39) - .06 (.05) -.19 (.16)Germany - .54 (.40) - .02 (.05) - .77 (.53) - .47 (.35)Japan .95 (1.03) .48 (.69) -1.39 (1.40) .26 (.47)Switzerland .24 (.51) - .10 (1.23) .39 (.63) - .67 (.78)France .27 (.65) -.03 (.69) -.31 (1.43) .17 (1.20)UK - .21 (.52) .05 (.66) .32 (.81) -.31 (.76)
The value of the SDR is determined daily by the IMF on the basis of a basket of currencies witheach currency assigned a weight in the determination of that value. The weights broadly reflect the rela-tive importance of these currencies in international trade and finance.
77

5. Conclusion
There have been a number of changes in the distribution of large reinsurance marketsover the period 1987-1995. These changes have caught the attention of professionals and,recently, have attracted some academic interest. By examining the distribution of the reinsu-rance net premiums of the 100 largest companies in the world, some of these changes havebeen documented.
Also, there has been an attempt to verify, statistically, which factors may explain thesechanges. It is clear from the analysis that, on a short-term period, exchange rates are animportant factor in determining a country's role as a world reinsurance center. Other coun-tries' domestic factors do not appear to systematically affect the development of world rein-surance centers, at least not on a short-term basis.
Perhaps the lack of confirmation of hypotheses relating to a country's growth is due toincreasing internationalization of reinsurance activities. When comparing the economic fac-tors for Germany and the United States, we found some rationale for mergers between corn-panics in these two countries. Perhaps, a similar analysis should be extended, in futureresearch, to other countries to determine the likelihood of mergers.
From the data collected here it is not possible to begin an analysis of the reasons parti-cular countries have developed or not developed as world reinsurance centers. Examinationof many of the countries as case studies, would prove to be interesting and useful. The pri-mary objective of this paper is to investigate the major reasons for the changes in positionsamong countries.
78
Appendix 1
Market share of major countries
Appendix 2
Estimates of the equation
Note: The t values are shown in parentheses. The equation is estimated with a constant. R2 is theadjusted value of R2 and F is the F test.
Appendix 3
Data sources
Net premiums written Reactions Standard & poor's top 100reinsurers
Currency exchange rates, IMF International Financial StatisticsMarket rates, Inflation, GDP
79
COUNTRY 1986 1987 1988 1989 1990 1991 1992 1993 1994 1995
USA 28.81 26.85 22.61 24.84 23.40 23.10 26.45 21.64 21.98 22.95
Germany 24.16 29.20 30.30 31.43 31.20 30.42 26.06 32.20 36.51 32.87
Japan 12.68 12.74 12.92 8.26 8.54 6.90 11.12 13.08 10.52 8.15
Switzerland 11.66 7.73 8.44 8.68 9.38 lO.50 12.03 12.88 11.82 11.19
France 6.33 6.72 7.76 7.01 6.77 7.60 7.22 6.66 7.30 7.08
UK 5.54 5.17 5.43 5.39 5.62 5.48 4.87 4.91 2.76 4.08
Total 89.18 88.41 87.46 85.61 84.91 84.00 87.75 91.37 90.89 86.32
Intercept MS EX IR P GDP R2/F
1987-1990
6.37 -0.06 0.39 0.32 -0.25 -0.35 0.83[0.731 [2.69] [0.85] [1.03] [0.78] 1.93
1990-1993
-0.01 -0.07 0.25 0.29 0.53 -0.30 0.86[0.73] [2.75] [0.99] [1.19] [1.05] 2.43

80
BIBLIOGRAPHY
DOHNER, R. S. andTERRELL, H. S .,'The Determinants of the Growth of Multinational BankingOrganizations: 1972-1986", Board of Governors of the Federal Reserve System,Washington: Inter-national Finance Discussion Paper, No. 326, June 1988.
GOLDBERG, L. G. and HANWECK, G. A .,"The Growth of the World's 300 Largest Banking Orga-nizations by Country", Journal of Banking and Finance, vol. 15, 1991, pp. 207-223.
GROSSACK, I. M., "Towards an Integration of Static and Dynamic Measures of Industry Concentra-tion", Review of Economics and Statistics, vol. 47, No. 3, 1965, pp. 301-308.
HART, P. E. and PEARCE, R. D.," Growth Patterns of the World's Largest Firms", Weltwirtschaft.liches Archiv, vol. 122, 1986, pp. 65-79.
HYMER, S. and PASHIGIAN, P., "Turnover of Firms as a Measure of Market Behavior", Review ofEconomics and Statistics, vol. 44, Feb. 1962, pp. 82-87.
KWOKA, J. E., "Large Firm Dominance and Price-Cost Margins in Manufacturing Industries",Southern Economic Journal, vol. 44, July 1977, pp. 183-189.
KWOKA, J. E., "The Effect of Market Share Distribution on Industry Performance", Review of Eco-nomics and Statistics, vol. 61, Feb. l979,pp. 101-109.
MAYERS, D. and SMITH, C. W., "On the Corporate Demand for Insurance: Evidence from the Rein-surance Market", Journal of Business, vol. 63, 1990, pp. 19-40.
OUTREVILLE, J. F., "Reinsurance in Developing Countries", Journal of Reinsurance, vol.2, No. 3,1995, pp. 42-51.
OUTREVILLE, J. F, "Growth and Concentration Patterns of the World's 100 Largest ReinsuranceCompanies", Paper presented at the International Insurance Society meetings, Amsterdam,Netherlands, 1996.
RHOADES, S. A., "Concentration of World Banking and the Role of the US Banks among the 100Largest", Journal of Banking and Finance, vol. 7, 1983, pp. 427-437.
TSCHOEGL, A. E., "Size, Growth andTransnationality among the World's Largest Banks", Journal ofBusiness, vol. 56, No. 2, 1983, pp. 187-201.
TSCHOEGL, A. E ., "Concentration among International Banks", Journal of Banking and Finance,vol. 6, 1982, pp. 567-578.
WALTER, I., Global Competition in Financial Services, Cambridge: Ballinger, 1988.