size effect of squat shear walls extrapolated by
TRANSCRIPT

75ACI Structural Journal/May 2019
ACI STRUCTURAL JOURNAL TECHNICAL PAPER
Recent earthquakes revealed poor performance of very tall shear walls. This is no surprise because the design for size effect has long been hampered by the lack of large-size tests and by mingling of different concretes and different test parameters among the existing test data. Fortunately, recent progress in material modeling and computer power permits overcoming this obstacle by extending the data to large sizes computationally. Herein, a large classical set of reduced-scale shear wall tests performed (at ETH) are selected and used to verify and calibrate the finite element simulations with the crack band model, in which a powerful constitutive damage model—microplane model M7—is implemented. Then the cali-brated computer code is used to predict the strength and ductility of much larger shear walls. As expected, the size effect is found to occur if the shear in concrete controls the failure load but not if the steel bar yielding does. Increasing the reinforcement ratio may compromise ductility; it may cause the shear in concrete to control the peak load and the failure to occur before the steel bars begin to yield. Increasing the height-to-width aspect ratio of the wall is shown to lead to flexural failure, which does not show size effect on the shear wall strength. Increasing the wall size may change the failure mechanism, cause the concrete to fail at a lower stress, and shorten or remove the yield plateau. Adding horizontal reinforcing bars to vertical ones tends to prevent inclined shear cracks in the web, although it has little effect on sliding shear. Computer simu-lations of the present type are helpful for checking the design of large shear walls.
Keywords: crack band model; cracking; failure mechanism; finite element analysis; fracture; microplane model; shear wall; size effect.
INTRODUCTIONMuch has been learned from numerous shear wall tests1-12
and various practical design methods have been proposed1,12 to predict the strength of shear walls. Nevertheless, recent experience from some earthquakes (for example, that in Chile 2015) shows that tall shear walls are much weaker than predicted in design. Obviously, the fracture mechanics- based size effect, already generally accepted for the shear strength of beams13,14 and for punching strength of slabs,15,16 comes into play. The current methods of analysis of large shear walls appear to be insufficient. Because they are based on the concept of material strength and yield criteria and ignore the release of stored energy from the structure into the fracturing zone, they cannot capture the deterministic effect of structure size on the nominal strength of structure.
A pervasive problem that has long inhibited progress in design is that the previous series of tests of shear walls as well as other structures have been made with different concretes, and that many test parameters varied simultane-ously with the size. To evidence the theoretical scaling law purely experimentally, one would have to test a large, statis-
tically significant number of shear walls of different sizes covering the entire size range of interest, using one and the same concrete, and varying from test to test only a single parameter—the size—while keeping the others constant. Such tests, however, would be extremely costly, have never been done, and hardly ever will.
Fortunately, a way to overcome this dilemma has been offered by the progress in fracture modeling of quasi-brittle materials and in computational mechanics. A highly realistic material model for the fracturing and nonlinear behavior of concrete, such as the microplane model, has appeared, and its use in large-scale computations recently became feasible thanks to the growth of computer power. Moreover, avoiding spurious mesh sensitivity of finite element simulations of damage and failure has recently also become possible, even for a computationally demanding material model.
By virtue of this progress, important additional infor-mation including the size effect can now be obtained by extending the test results to larger sizes computationally. This is done here in two stages. In the first stage, the finite element program with a highly realistic material model such as the microplane model is calibrated and verified by fitting all the test results on one and the same concrete (using both the structural and material tests). In the second stage, the calibrated finite element program (with a localization limiter such as that in the crack band model) is used to predict the response of similar structures of much larger sizes and possibly also other shapes and different reinforcements. This approach has already been fruitfully applied to extend to the size effect the existing test results for: 1) the flexural strength of prestressed concrete beams,17 which occurs by compression-shear fracture of concrete in the compression zone; and 2) punching shear strength of slabs.16 For both, the size effect law has thus been calibrated.
RESEARCH SIGNIFICANCEIn brittle failure of shear walls, the nominal strength of a
structure generally decreases with the structure’s size, and the evidence from several recent earthquakes confirms that. Unfortunately, scaled tests and full-scale tests of large shear walls are currently unavailable. Therefore, the only way to determine the brittleness and size effect in large shear walls is a computer simulation that is based on a realistic material
Title No. 116-S55
Size Effect of Squat Shear Walls Extrapolated by Microplane Model M7by Mohammad Rasoolinejad and Zdenek P. Bažant
ACI Structural Journal, V. 116, No. 3, May 2019.MS No. S-2018-086.R1, doi: 10.14359/51714478, was received June 8, 2018, and
reviewed under Institute publication policies. Copyright © 2019, American Concrete Institute. All rights reserved, including the making of copies unless permission is obtained from the copyright proprietors. Pertinent discussion including author’s closure, if any, will be published ten months from this journal’s date if the discussion is received within four months of the paper’s print publication.

76 ACI Structural Journal/May 2019
model and is validated and calibrated by the existing test data. The significance of this approach, pursued herein, is that it makes possible a safer design of large shear walls, especially for seismic regions.
PREVIOUS SHEAR WALL TESTSThe failure load is influenced by several factors: the aspect
ratio, vertical and transverse web reinforcement ratios, ratio of reinforcement along the boundary, vertical axial force, concrete compressive strength, and cross section shape of the wall.5 These factors can lead to diverse failure mech-anisms, including diagonal tension, diagonal compression, and sliding shear.18 The cross section shape can generally be rectangular, barbell, and flanged. This study deals with the first, although similar rules likely apply to the other two.
The height-to-width aspect ratio of the shear wall plays a major role in determining the failure mechanism. The squat walls, defined as those with a height-to-length ratio less than 2, are prone to shear failures, while the slender walls, having a higher aspect ratio, are prone to flexural failure.18 The squat walls are found in low-rise to medium-rise buildings and are more common than slender walls. Several design codes and experimental data deal with slender walls but are unsuitable for squat walls. The load-displacement diagram is characterized by post-peak softening in the case of shear failure, but a plateau in the case of flexural failure. In shear failure, the maximum (or ultimate) load is controlled by the failure of concrete. Concrete is one of many quasi-brittle materials (including fiber composites, tough ceramics, many rocks, stiff soils, sea ice, wood, carton, rigid foams, and so on), which all exhibit the same size effect. By now it is well established that the nominal strength in fracture of all quasi-brittle materials decreases with the structure size.19 So, in the case of shear failure, the size effect is no surprise and needs to be characterized quantitatively, whereas in the case of ductile flexural failure due to steel yielding, no size effect can occur.
Uniformly distributed vertical and horizontal reinforce-ment is known to be effective in suppressing the inclined shear cracks in the squat walls. While some tests1,9-11,20 indicate that horizontal transverse reinforcement has only a slight effect on the failure load, those done on squat walls reveal that it affects the failure mechanism significantly.3,4 In squat walls, a sufficient uniformly distributed vertical and transverse reinforcements can alter the failure mode from diagonal compression or tension to sliding shear.
While many test data exist from reduced-scale tests of shear walls, data from full-scale walls are only a few. No geomet-rically scaled tests, which are the easiest and most unambig-uous to interpret, have been reported. Some experiments21 indicated that the shear wall strength can be predicted using reduced-scale prototype walls, but their failure modes were flexural. Interesting were the tests of Ghorbani-Relani et al.,21 in which the material compressive strength was different for the model and the prototype, yet the response was almost the same. This indicates that, in these tests, the reinforcement controlled the failure load rather than concrete, which made the failure load independent of the compressive strength of concrete. So, in absence of upscaled large-size experiments,
the only way to clarify the effect of wall size is to conduct computer simulations in which all the factors other than the wall size are kept constant, using a realistic material model validated and calibrated fitting the test data on the existing shear wall tests. Such simulations can, of course, also clarify the role of other design parameters.
SIZE EFFECTThe nominal shear strength of structures, such as a shear
wall, is defined as
vFbth= � (1)
where Fh is the maximum (or ultimate) shear load under short-time monotonic loading; b is wall width (or length, in horizontal direction), and t is wall thickness. Because in elasticity with strength limit, as well as plastic limit design (underlying the present design code), ultimate strength vu is independent of structure size, the size effect is generally understood as the dependence of the nominal strength of the structure, in this case the vu, on the characteristic structure size D, which is here taken to be equal to the wall height, D = h. In the case of plastic limit analysis, as well as elastic analysis with a strength limit, there is no size effect—that is, vu is independent of h or D. But concrete is quasi-brittle rather than plastic, and so a size effect must be expected if the failure load is controlled by the failure of concrete instead of steel reinforcement.
To characterize the lateral displacement for all wall sizes, the average shear strain of the wall is defined as
γ = ∆h
(2)
where Δ is the lateral displacement at top of the wall; and h is the wall height (or length, in vertical direction). The average shear strain represents a measure for comparing the ductility of the wall through the scales.
The ductility of the wall is closely related to its failure mechanism. The flexural failure is ductile and is associated with reinforcement yielding. On the other hand, the shear failures of walls are generally governed by the failure of concrete and, therefore, are usually brittle. The brittle failure is highly catastrophic. Preventing them is essential for earthquake-resistant design.
The size effect is of two types. Type I characterizes fail-ures occurring right at the initiation of a continuous crack from a representative volume element (RVE) of a heteroge-neous material such as concrete, and has a strong statistical component, which was first mathematically formulated in 1939 by Weibull. The Type I size effect occurs in most plain concrete structures, which is not the case of shear walls. As qualitatively explained already by Mariotte in the middle of the 17th century, it is caused by the fact that, in a larger structure, the minimum value of random material strength within the structure volume (weighted by stress magnitude) is likely to be lower than in a smaller one. When mechanics dictates the final fracture to occur in one place instead of anywhere in the structure volume, as in beam shear, the

77ACI Structural Journal/May 2019
statistical part of size effect on the mean structure strength is negligible. This applies generally to Type II failures.
The reinforced concrete structures usually exhibit the Type II size effect, which is characterized by a stable growth of a large crack prior to maximum load and by similarity of the dominant failure cracks in geometrically similar struc-tures of different sizes. The Type II size effect on the mean nominal strength of structures is deterministic and is caused by the release of stored energy mediated by stress redistri-bution during crack growth. It is well described by the size effect law formulated first in 1984.22 It has been thoroughly documented for shear of reinforced concrete beams and for punching of slabs, and is what must be expected in shear walls as well.
NUMERICAL ANALYSIS OF SHEAR WALL FAILURE
To avoid spurious mesh sensitivity due to softening cracking damage, the finite element simulation must use some localization limiter, which can be one of the nonlocal models or the crack band model. The latter, proposed in 1982,23,24 is chosen for its simplicity and is also favored in commercial software for concrete (for example, ATENA). The model requires that either the finite element size in the cracking zone must be kept constant and roughly equal to the RVE size, or the post-peak softening slope of the tensile response must be adjusted if the element size is increased to make energy dissipation independent of the chosen element size. The latter introduces some numerical error and, to avoid it, the element size is better kept constant (and equal to 25 mm [1 in.]) for all the shear wall sizes, even though, in the case of large shear walls, it leads to large finite element systems.
For the material model, the present simulations employ the microplane model M7, which is the latest in a series of microplane models developed at Northwestern University since 1984.25-28 In these models, the damage constitutive law is defined not in terms of tensors but in terms of stress and strain vectors acting on a generic plane of any orienta-tion within the material, called the microplane. The vectors allow direct physical modeling of oriented cracking, split-ting, and dilatant frictional slip. The idea of using vectors was proposed for plastic (nonsoftening) metals in 1938 by
Taylor,29 with the stress vector being the projection of stress tensor. For softening damage, it was found necessary for the strain (rather than stress) vector be the projection of the continuum tensor, in which case the stress vectors had to be related to the stress tensor by the variational principle of virtual work.25,26 The effectiveness of model M7 has already been verified in a number of failure simulations. Herein, M7 is incorporated into the commercial software ABAQUS, version 6.14, via user-defined material subroutine VUMAT.
To calibrate the code and the parameters of M7, the mate-rial test results were fitted using eight-node hexahedral elements. Because the shear walls are big structural elements requiring many finite elements, only the monotonic response has been simulated even though the main objective of the model is to simulate seismic loading which is cyclic. The monotonic calibration does not appear to be a serious restric-tion for applications because it has been well documented that the hysteretic behavior of concrete under cyclic loading is bounded by the monotonic loading response, regardless of the load history.30-32 So, to reduce the simulation costs, only monotonic loading tests of shear walls are considered herein.
TESTS USED TO CALIBRATE FINITE ELEMENT AND MATERIAL MODELS
In 1985, Maier and Thürlimann11 tested 10 relatively large shear walls, S1 through S10. The walls covered different geometries, reinforcements, and loading patterns. Walls S5 and S7 were subjected to lateral cyclic loading, and no signif-icant reduction in the ultimate strength and ductility were observed, compared with similar walls under monotonic loading. Walls S4 and S9 had no boundary beams and were tested under monotonic quasi-static loading up to failure. The simulated experiments involved walls with two hori-zontal beams and a web which was 1.18 m (46.5 in.) wide, 1.20 m (47.2 in.) high, and 0.1 m (3.94 in.) thick. Hydraulic jacks imposed a horizontal displacement of the top beam, which transmitted shear into the wall while the bottom beam was clamped to a stiff laboratory floor. Figure 1 shows the schematic of the walls and possible failure mechanisms.
The walls were scaled in two dimensions (2-D), in which the wall thickness for walls of various sizes was kept constant. For the 2-D scaling, the computational burden grows only quadratically, which avoids massive simulation
Fig. 1—(a) Diagonal tension failure; (b) flexural failure; (c) sliding shear at top; (d) sliding shear at bottom; (e) schematic of wall S4; (f) schematic of wall S9; (g) schematic of elongated S4; and (h) schematic of elongated S9.
78 ACI Structural Journal/May 2019
costs. But also, and mainly, the 2-D scaling avoids taking into account a relatively weaker additional size effect of wall thickness due to the ratio of wall thickness to the thickness of a boundary layer, which is roughly equal to the maximum aggregate size. The effect of wall thickness generally includes the elastic wall effect (due to different properties of the boundary layer and to Poisson ratio effect). It also includes the inelastic shear-lip effect (due to crack surface warping), and the effect of three-dimensional (3-D) singu-larity at the crack intersection with wall surface. Although these effects are relatively weak, they would complicate interpretation of the simulations.
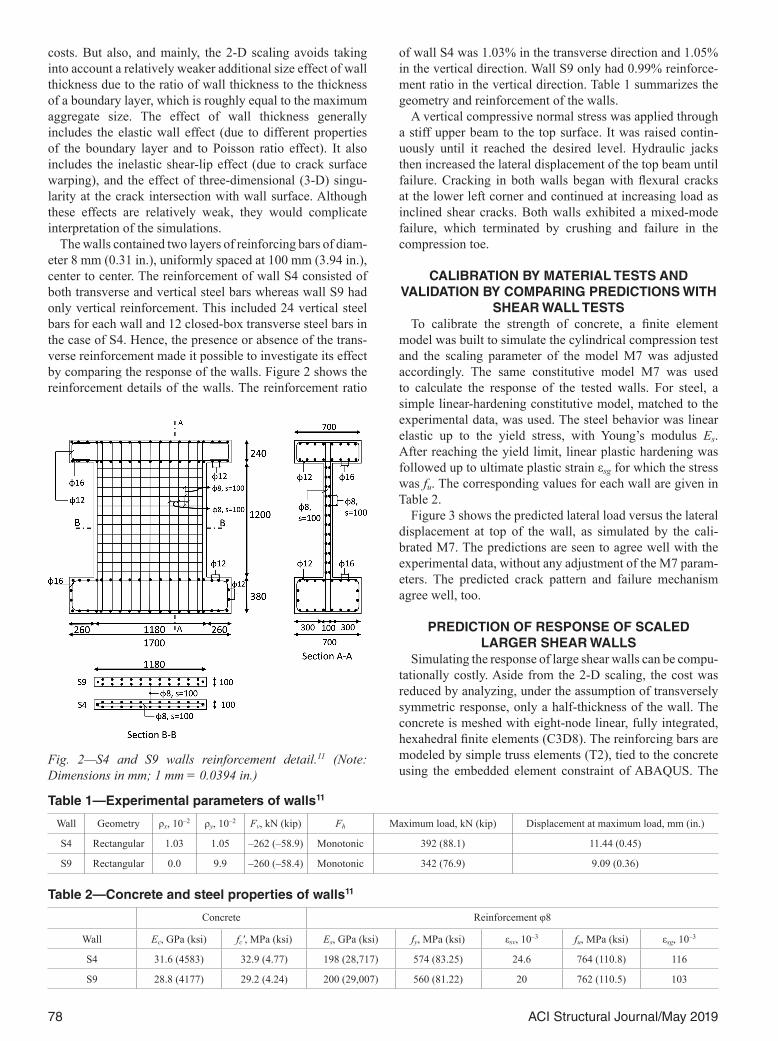
The walls contained two layers of reinforcing bars of diam-eter 8 mm (0.31 in.), uniformly spaced at 100 mm (3.94 in.), center to center. The reinforcement of wall S4 consisted of both transverse and vertical steel bars whereas wall S9 had only vertical reinforcement. This included 24 vertical steel bars for each wall and 12 closed-box transverse steel bars in the case of S4. Hence, the presence or absence of the trans-verse reinforcement made it possible to investigate its effect by comparing the response of the walls. Figure 2 shows the reinforcement details of the walls. The reinforcement ratio
of wall S4 was 1.03% in the transverse direction and 1.05% in the vertical direction. Wall S9 only had 0.99% reinforce-ment ratio in the vertical direction. Table 1 summarizes the geometry and reinforcement of the walls.
A vertical compressive normal stress was applied through a stiff upper beam to the top surface. It was raised contin-uously until it reached the desired level. Hydraulic jacks then increased the lateral displacement of the top beam until failure. Cracking in both walls began with flexural cracks at the lower left corner and continued at increasing load as inclined shear cracks. Both walls exhibited a mixed-mode failure, which terminated by crushing and failure in the compression toe.
CALIBRATION BY MATERIAL TESTS AND VALIDATION BY COMPARING PREDICTIONS WITH
SHEAR WALL TESTSTo calibrate the strength of concrete, a finite element
model was built to simulate the cylindrical compression test and the scaling parameter of the model M7 was adjusted accordingly. The same constitutive model M7 was used to calculate the response of the tested walls. For steel, a simple linear-hardening constitutive model, matched to the experimental data, was used. The steel behavior was linear elastic up to the yield stress, with Young’s modulus Es. After reaching the yield limit, linear plastic hardening was followed up to ultimate plastic strain εsg for which the stress was fu. The corresponding values for each wall are given in Table 2.
Figure 3 shows the predicted lateral load versus the lateral displacement at top of the wall, as simulated by the cali-brated M7. The predictions are seen to agree well with the experimental data, without any adjustment of the M7 param-eters. The predicted crack pattern and failure mechanism agree well, too.
PREDICTION OF RESPONSE OF SCALED LARGER SHEAR WALLS
Simulating the response of large shear walls can be compu-tationally costly. Aside from the 2-D scaling, the cost was reduced by analyzing, under the assumption of transversely symmetric response, only a half-thickness of the wall. The concrete is meshed with eight-node linear, fully integrated, hexahedral finite elements (C3D8). The reinforcing bars are modeled by simple truss elements (T2), tied to the concrete using the embedded element constraint of ABAQUS. The
Fig. 2—S4 and S9 walls reinforcement detail.11 (Note: Dimensions in mm; 1 mm = 0.0394 in.)
Table 1—Experimental parameters of walls11
Wall Geometry ρx, 10–2 ρy, 10–2 Fv, kN (kip) Fh Maximum load, kN (kip) Displacement at maximum load, mm (in.)
S4 Rectangular 1.03 1.05 –262 (–58.9) Monotonic 392 (88.1) 11.44 (0.45)
S9 Rectangular 0.0 9.9 –260 (–58.4) Monotonic 342 (76.9) 9.09 (0.36)
Table 2—Concrete and steel properties of walls11
Concrete Reinforcement φ8
Wall Ec, GPa (ksi) fc', MPa (ksi) Es, GPa (ksi) fy, MPa (ksi) εsv, 10–3 fu, MPa (ksi) εsg, 10–3
S4 31.6 (4583) 32.9 (4.77) 198 (28,717) 574 (83.25) 24.6 764 (110.8) 116
S9 28.8 (4177) 29.2 (4.24) 200 (29,007) 560 (81.22) 20 762 (110.5) 103

79ACI Structural Journal/May 2019
hexahedral elements had a size of 25 mm (0.98 in.), kept the same for calibration and simulation at all the scales.
The integration algorithm was explicit, with a mass scaling factor of 4 for the chosen time steps. The mass scaling is, of course, fictitious, because the problem is static and is needed only to stabilize the integration. It was checked in each step that the kinetic energy of the fictitious mass did not exceed the strain energy of the elements by more than 1%. If violated, the simulation was rerun with no mass scaling and much smaller time steps.
To investigate the effect of reinforcement ratio, two geometrically scaled sets of models were built for each wall, with exactly the same geometries as S4 and S9 except that the reinforcement ratio was half and twice as large as in the experiment. Furthermore, to investigate the effect of the height-to-width aspect ratio, another wall was simulated, considering the height to be doubled but the width the same as in the experiment. In theory, increasing the aspect ratio pushes the walls towards the flexural mode of failure.
Because the test of normally reinforced wall S4 already showed flexural failure, increasing the height of this wall was of no interest. So, the height was increased only for the highly reinforced wall, which was already failing in shear, so as to see whether this can change the failure mechanism. For each case, four scaled walls were simulated to inves-tigate the size effect. The wall was scaled to half, normal, double, and quadruple sizes, and in total, 32 finite element wall models were built.
The loading, applied to mimic the action of the stiff top beam, was simplified as equal horizontal displacements of all the nodes at the top boundary. Compressive vertical normal stresses were applied uniformly over all of the top surface, with no restriction on vertical displacements. After reaching the desired level, the vertical compressive stresses on the top boundary were held constant, while a uniform lateral displacement of top boundary nodes continued up to
failure. The action of the stiff lower beam was simplified as a fixed boundary. These simplifications made it unnecessary to analyze the upper and lower beams by finite elements.
To investigate the size effect, it is important to keep the ratio of shear and normal (or horizontal and vertical) load components constant at all scales. As the wall is scaled up, the lateral failure load decreases, and so the ratio of the applied vertical compressive stress to the shear stress can no longer be kept the same as it was in the lab tests. The problem is that the shear load at failure is not known in advance.
To tackle the problem, two methods are proposed: first, both the vertical and lateral loads are applied in same loading step and then increased proportionally up to failure to keep the ratio constant, as in a load-controlled test. The load control, however, cannot capture the post-peak because the system becomes unstable as soon as the peak load is reached. In theory, the displacement control would ensure stability. But this would cause other problems—for example, the vertical compressive stress could increase while the shear force softens, and proportionality of horizontal and vertical loads could not be enforced. These problems would change not only the load ratio but also the failure mechanism.
A better way, which in fact conforms to the actual experi-ment procedure, is to readjust the normal compressive force after each simulation so as to make it proportional to the hori-zontal force at the peak load. The load ratio is kept constant at the test value because changing the vertical load would change the horizontal shear failure load. So, the vertical load is changed iteratively until the vertical load changes converge—that is, until the vertical load changes in the iter-ations become sufficiently small. The simulations conducted in this manner indicate that an increase of the axial force will increase the peak shear strength of a squat wall while reducing its ductility. This procedure agrees with what is observed consistently in the experimental studies.1,3,4,9-11,20
Fig. 3—Predicted load-displacement curves and failure crack pattern versus experiment for S4 and S9 walls. (Note: 1 mm = 0.0394 in.; 1 kN = 224.4 lb.)

80 ACI Structural Journal/May 2019
FAILURE MODES REVEALED BY NUMERICAL SIMULATIONS WITH M7
The simulations included walls with halved, normal, and doubled reinforcement ratios, among which the normal reinforcement ratio was the same as in the test. Geometric scaling was obtained when the reinforcement ratios for different wall sizes were the same and the reinforcement spacing was scaled in proportion to the wall sizes.
Figure 4 shows the simulation results for walls S4 and S9 with low reinforcement. Both types of walls fail in the flexural mode, and the maximum load is governed by yielding of the reinforcing bars. The results for S4 are more systematic, while those for S9 are not due to scatter with partial load drops. These drops may be explained by shear cracks forming because of the lack of transverse reinforce-ment in these walls. As the structure size increases, the failure becomes dominated by shear and post-peak softening shows up (wall S9), which is because the concrete fails at lower stress levels.
Figure 5 demonstrates, for normally reinforced walls, the load-displacement curves (in terms of average shear strain and stress). The smaller walls of S4 type, with a low rein-forcement, are seen to fail in the flexural mode, manifested by a ductile plateau. Importantly, though, a transition from hardening to softening, with a loss of ductility, occurs for the wall of quadruple size. For that wall, the concrete fails earlier than in smaller walls, but the maximum load is still controlled by steel yielding. For still-bigger sizes, the shear failure of concrete must be expected to dominate the wall strength and a stronger size effect to set on.
The walls of S9 type, with normal reinforcement ratio, behaved differently (Fig. 5). The failure mechanism changed from a flexural mode to a diagonal tension mode, except for the smallest size, which showed ductility. The reduction of maximum average shear stress in these walls is clearly noticeable. Figure 6 shows how closely the nominal strength of these walls agrees with the size effect law.22,23 The strength of the smallest wall is seen to be a bit higher than
Fig. 4—Average stress-strain curves for low reinforced S4 and S9 walls. (Note: 1 MPa = 0.145 ksi.)
Fig. 5—Average stress-strain curves for normally reinforced S4 and S9 walls. (Note: 1 MPa = 0.145 ksi.)
Fig. 6—Size effect plots of normally reinforced S9 wall: (a) linear scale regression plot; and (b) logarithmic scale. (Note: 1 m = 39.4 in.; 1 MPa = 0.145 ksi.)
81ACI Structural Journal/May 2019
indicated by the optimum fit with the size effect law, but that is because the failure mechanism, at this small scale, was not strictly the shear.
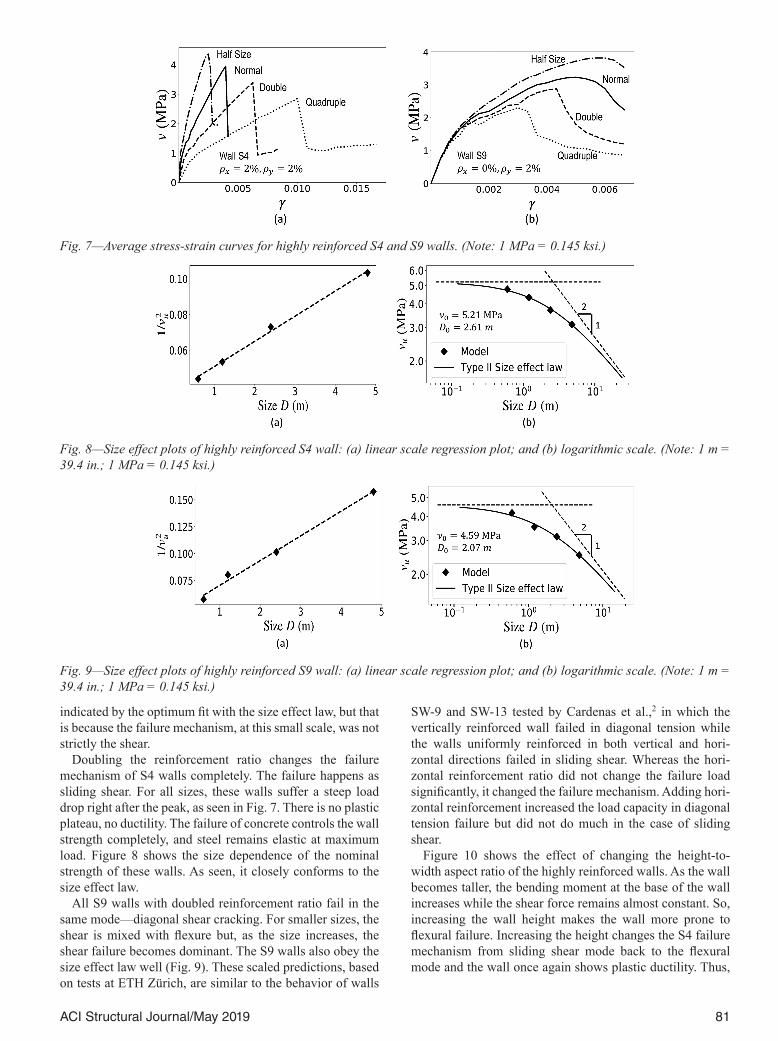
Doubling the reinforcement ratio changes the failure mechanism of S4 walls completely. The failure happens as sliding shear. For all sizes, these walls suffer a steep load drop right after the peak, as seen in Fig. 7. There is no plastic plateau, no ductility. The failure of concrete controls the wall strength completely, and steel remains elastic at maximum load. Figure 8 shows the size dependence of the nominal strength of these walls. As seen, it closely conforms to the size effect law.
All S9 walls with doubled reinforcement ratio fail in the same mode—diagonal shear cracking. For smaller sizes, the shear is mixed with flexure but, as the size increases, the shear failure becomes dominant. The S9 walls also obey the size effect law well (Fig. 9). These scaled predictions, based on tests at ETH Zürich, are similar to the behavior of walls
SW-9 and SW-13 tested by Cardenas et al.,2 in which the vertically reinforced wall failed in diagonal tension while the walls uniformly reinforced in both vertical and hori-zontal directions failed in sliding shear. Whereas the hori-zontal reinforcement ratio did not change the failure load significantly, it changed the failure mechanism. Adding hori-zontal reinforcement increased the load capacity in diagonal tension failure but did not do much in the case of sliding shear.
Figure 10 shows the effect of changing the height-to-width aspect ratio of the highly reinforced walls. As the wall becomes taller, the bending moment at the base of the wall increases while the shear force remains almost constant. So, increasing the wall height makes the wall more prone to flexural failure. Increasing the height changes the S4 failure mechanism from sliding shear mode back to the flexural mode and the wall once again shows plastic ductility. Thus,
Fig. 7—Average stress-strain curves for highly reinforced S4 and S9 walls. (Note: 1 MPa = 0.145 ksi.)
Fig. 8—Size effect plots of highly reinforced S4 wall: (a) linear scale regression plot; and (b) logarithmic scale. (Note: 1 m = 39.4 in.; 1 MPa = 0.145 ksi.)
Fig. 9—Size effect plots of highly reinforced S9 wall: (a) linear scale regression plot; and (b) logarithmic scale. (Note: 1 m = 39.4 in.; 1 MPa = 0.145 ksi.)

82 ACI Structural Journal/May 2019
there is no size effect in the elongated, geometrically scaled S4 walls.
The S9 wall, on the other hand, failed due to inclined shear cracking which, for smaller walls, moves toward a mixed-mode failure. So, increasing the aspect ratio has not affected the failure mechanism. Figure 11 shows the size effect plots for geometrically scaled elongated S9 walls. The first point deviates because of a change in failure mode. Similar to the S4 wall, the reinforcement ratio was doubled, which is a case to be compared with highly reinforced walls, to see the effect of aspect ratio.
Generally, increasing the reinforcement ratio and the axial force increases the failure load while it also makes the wall more brittle. Increasing the size tends to decrease the failure stress in the case of shear failure, and also tends to make the
wall more brittle in the case of flexural failure. Increasing the aspect ratio pushes the wall towards the flexural failure mode, which is more ductile. The transverse reinforcement, alongside the vertical one, has the effect of preventing inclined shear cracks in the web of the wall. While most of the walls exhibit mixed-mode failure mechanisms, Tables 3 and 4 show the dominant failure mechanisms at maximum load for walls S4 and S9, respectively.
FURTHER OBSERVATIONSThe flexural failure mode happens with boundary cracking
at the lower corners and with yielding of steel bars, which is manifested by plastic ductility in the load-displacement curve. In this case, the steel bar plasticity controls the peak load, and thus no size effect exists. Nevertheless, as
Fig. 10—Average stress-strain curves for elongated S4 and S9 walls. (Note: 1 MPa = 0.145 ksi.)
Fig. 11—Size effect plots of elongated S9 wall: (a) linear scale regression plot; and (b) logarithmic scale. (Note: 1 m = 39.4 in.; 1 MPa = 0.145 ksi.)
Table 3—Dominant failure mechanism for wall S4
Half Normal Double Quadruple
Low reinforced Flexural Flexural Flexural Flexural
Normally reinforced Flexural Flexural Flexural Sliding shear
Highly reinforced Sliding shear Sliding shear Sliding shear Sliding shear
Elongated wall Flexural Flexural Flexural Flexural
Table 4—Dominant failure mechanism for wall S9
Half Normal Double Quadruple
Low reinforced Flexural Flexural Flexural Flexural
Normally reinforced Flexural Diagonal tension Diagonal tension Diagonal tension
Highly reinforced Diagonal tension Diagonal tension Diagonal tension Diagonal tension
Elongated wall Diagonal tension Diagonal tension Diagonal tension Diagonal tension

83ACI Structural Journal/May 2019
displacement in the flexural mode increases beyond the peak load point, diagonal tension cracks will develop. This will produce post-peak softening and cause a size effect such that the post-peak softening would become steeper for larger walls, as the softening shifts to earlier stages of loading and the concrete fails at a lower stress. The size effect on post-peak steepness does not affect the peak load, except when the wall is so large that concrete softening occurs before bar yielding. However, a steeper post-peak softening always promotes the failure under earthquake, impact, and other dynamic loads, which can be revealed and quantified by finite element simulations with a material model such as M7.
The fact that an increase in structure size can alter the failure mechanism from ductile, which exhibits no size effect, to brittle, which does, is important for interpreting the laboratory tests of shear walls. Small-scale laboratory tests may show the desired ductile response, while the real shear wall may exhibit brittle failure with the shear strength reduced by size effect. Thus, it is important to back up the laboratory tests with simulation for the real size.
The S9 walls are more susceptible to diagonal shear failure. The reason is that the horizontal steel bars in the S4 walls help to keep the inclined shear cracks in the wall closed. As the reinforcement ratio increases, the S4 failure mechanism shifts to sliding shear, in which the diagonal shear cracks are well resisted by steel reinforcement. On the other hand, the S9 walls always fail by diagonal tension, except when the reinforcement ratio is too low. This shows the importance of reinforcing the shear walls in both directions.
An increase of reinforcement ratio may be unhelpful because it may cause the concrete to fail in shear before the steel bars reach plastic yielding. This inevitably causes the concrete to control the maximum load, which leads to the size effect on nominal strength. By increasing the height-to-width aspect ratio, the failure mechanism of highly reinforced S4 walls returns, as expected, to the flexural mode while, in the case of S9, the wall of the same dimensions is found to fail in diagonal tension. That again emphasizes the ineffec-tiveness of the S9 wall in capturing the inclined cracks.
If the concrete, rather than the steel reinforcement, controls the maximum load and if softening emerges on the load- displacement curve, then a size effect must always be expected. That has already been well demonstrated for beam shear,13,14 punching shear15,16 and torsion33,34 and, based on the analysis and reduced-scale model tests, also for compression- shear failures in columns35,36 and prestressed concrete beams.37,38 It must be noted that changing the size might cause a change of the failure mechanism, and then a deviation from the size effect law would occur. This is because the size effect law assumes the cracking pattern and failure mode to remain the same through the entire size range to which the law is applied.
NEEDED: SIZE EFFECT FACTOR FOR DESIGNFigures 4 through 11 demonstrate that the shear capacity of
squat shear walls can be subjected to size effect that approxi-mately follows the deterministic (non-statistical) size effect law, according to which the ultimate shear strength vu of concrete is reduced as follows39
vvD Du =
+0
01 /
(3)
where vo is the ultimate shear strength for small sizes, for which the plastic limit analysis is applicable; D is the char-acteristic wall size; and D0 is a certain transitional size. This means that, in the geometrical 2-D scaling of the wall, the total load capacity of large walls grows in proportion to D3/2, while according to plastic limit analysis, it grows in propor-tion to D2.
However, the size effect does not occur for all the wall designs—for example, for the cases of flexural failures or low reinforcement ratios. Based on this study, it is impos-sible to propose a general rule that could be proposed for design. That goal will require studies of many different walls and is beyond the scope of the present study.
CONCLUSIONSBased on the result of the current study, the following
conclusions are drawn:1. The size effect can be avoided if reinforcement yielding
controls the peak load and post-peak behavior, but is inevi-table if the shear in concrete controls.
2. Increasing the reinforcement ratio may produce the size effect due to causing the shear in concrete to control the peak load. That is caused by the failure of concrete before the reinforcement yields. This also eliminates ductility, causing a catastrophic sudden failure due to steep load capacity drop after the peak load.
3. Increasing the height-to-width aspect ratio of the wall results in a flexural failure mode in which there is no size effect on the peak load.
4. Scaling up the wall size can change the failure mecha-nism and cause the concrete to fail at a lower stress in larger walls. It can also shorten or remove the yield plateau.
5. Supplementing vertical reinforcing bars with horizontal ones has a large effect on prevention of inclined shear cracks but it does not help much in the case of sliding shear.
6. Lacking the transverse (that is, horizontal) reinforce-ment can cause shear cracking and, therefore, the size effect.
7. The design of large shear walls can be checked and updated by finite element simulations of the kind demonstrated herein.
AUTHOR BIOSACI member Mohammad Rasoolinejad is a Graduate Research Assistant in the Department of Civil and Environmental Engineering at Northwestern University, Evanston, IL. His research interests include computational solid mechanics, fracture and size effect of quasi-brittle materials, and nonlinear and time-dependent behavior of solids—especially concrete.
ACI Honorary Member Zdeněk P. Bažant is the McCormick Institute and W.P. Murphy Professor of Civil and Mechanical Engineering and Mate-rials Science at Northwestern University. He is a member and past Chair of Joint ACI-ASCE Committee 446, Fracture Mechanics of Concrete, and a member of ACI Committees 209, Creep and Shrinkage of Concrete, and 348, Structural Reliability and Safety; and Joint ACI-ASCE Committees 334, Concrete Shell Design and Construction; 445, Shear and Torsion; and 447, Finite Element Analysis of Reinforced Concrete Structures.
REFERENCES1. Barda, F.; Hanson, J. M.; and Corley, W. G., “Shear Strength of
Low-Rise Walls with Boundary Elements,” Reinforced Concrete Structures

84 ACI Structural Journal/May 2019
in Seismic Zones, SP-53, N. M. Hawkins and D. Mitchell, eds., American Concrete Institute, Farmington Hills, MI, 1977, pp. 149-202.
2. Cardenas, A.; Russell, H.; and Corley, W., “Strength of Low-Rise Structural Walls,” Reinforced Concrete Structures Subjected to Wind and Earthquake Forces, SP-63, American Concrete Institute, Farmington Hills, MI, 1980, pp. 221-242.
3. Dabbagh, H., “Strength and Ductility of High-Strength Concrete Shear Walls under Reversed Cyclic Loading,” PhD thesis, University of New South Wales, Sydney, NSW, Australia.
4. Farvashany, F. E.; Foster, S. J.; and Rangan, B. V., “Strength and Deformation of High-Strength Concrete Shearwalls,” ACI Structural Journal, V. 105, No. 1, Jan.-Feb. 2008, pp. 21-29.
5. Gulec, C. K.; Whittaker, A. S.; and Stojadinovic, B., “Shear Strength of Squat Rectangular Reinforced Concrete Walls,” ACI Structural Journal, V. 105, No. 4, July-Aug. 2008, pp. 488-497.
6. Gupta, A., and Rangan, B. V., “High-Strength Concrete (HSC) Structural Walls,” ACI Structural Journal, V. 95, No. 2, Mar.-Apr. 1998, pp. 194-204.
7. Hidalgo, P.; Jordan, R.; and Martinez, M., “An Analytical Model to Predict the Inelastic Seismic Behavior of Shear-Wall, Reinforced Concrete Structures,” Engineering Structures, V. 24, No. 1, 2002, pp. 85-98. doi: 10.1016/S0141-0296(01)00061-X
8. Hidalgo, P. A.; Ledezma, C. A.; and Jordan, R. M., “Seismic Behavior of Squat Reinforced Concrete Shear Walls,” Earthquake Spectra, V. 18, No. 2, 2002, pp. 287-308. doi: 10.1193/1.1490353
9. Lefas, I. D., and Kotsovos, M. D., “Strength and Deformation Charac-teristics of Reinforced Concrete Walls under Load Reversals,” ACI Struc-tural Journal, V. 87, No. 6, Nov.-Dec. 1990, pp. 716-726.
10. Lefas, I. D.; Kotsovos, M. D.; and Ambraseys, N. N., “Behavior of Reinforced Concrete Structural Walls: Strength, Deformation Charac-teristics, and Failure Mechanism,” ACI Structural Journal, V. 87, No. 1, Jan.-Feb. 1990, pp. 23-31.
11. Maier, J., and Thürlimann, B., “Bruchversuche an Stahlbeton-scheiben,” Bericht/Institut für Baustatik und Konstruktion, ETH Zürich, Zürich, Switzerland, V. 8003, No. 1, 1985.
12. Wood, S. L., “Shear Strength of Low-Rise Reinforced Concrete Walls,” ACI Structural Journal, V. 87, No. 1, Jan.-Feb. 1990, pp. 99-107.
13. Bažant, Z. P., “Size Effect in Shear Failure of Longitudinally Rein-forced Beams,” ACI Journal Proceedings, V. 81, No. 5, Sept-.Oct. 1984, pp. 456-468.
14. Yu, Q.; Le, J.-L.; Hubler, M. H.; Wendner, R.; Cusatis, G.; and Bažant, Z. P., “Comparison of Main Models for Size Effect on Shear Strength of Reinforced and Prestressed Concrete Beams,” Structural Concrete, V. 17, No. 5, 2016, pp. 778-789. doi: 10.1002/suco.201500126
15. Bažant, Z. P., and Cao, Z., “Size Effect in Punching Shear Failure of Slabs,” ACI Structural Journal, V. 84, No. 1, Jan.-Feb. 1987, pp. 44-53.
16. Dönmez, A., and Bažant, Z. P., “Size Effect on Punching Strength of Reinforced Concrete Slabs with and without Shear Reinforcement,” ACI Structural Journal, V. 114, No. 4, July-Aug. 2017, p. 875. doi: 10.14359/51689719
17. Vorel, J., and Bažant, Z. P., “Size Effect in Flexure of Prestressed Concrete Beams Failing by Compression Softening.” Journal of Structural Engineering, ASCE, V. 140, No. 10, 2004, pp. 04014068-1-04014068.
18. Paulay, T., and Priestley, M. N., Seismic Design of Reinforced Concrete and Masonry Buildings, Wiley, New York, 1992.
19. Bažant, Z. P., and Planas, J., Fracture and Size Effect in Concrete and Other Quasibrittle Materials, CRC Press, Boca Raton, FL, 1997.
20. Oesterle, R. G.; Fiorato, A. E.; Johal, L. S.; Carpenter, J. E.; Russell, H. G.; and Corley, W. G., 1976, “Earthquake Resistant Structural Walls—Test of Isolated Walls,” Report No. GI-43880/RA-760815, National Science Foundation, Arlington, VA, 315 pp.
21. Ghorbani-Renani, I.; Velev, N.; Tremblay, R.; Palermo, D.; Massi-cotte, B.; and Léger, P., “Modeling and Testing Influence of Scaling Effects on Inelastic Response of Shear Walls,” ACI Structural Journal, V. 106, No. 3, May-June 2009, pp. 358-367.
22. Bažant, Z. P., “Size Effect In Blunt Fracture: Concrete, Rock, Metal,” Journal of Engineering Mechanics, ASCE, V. 110, No. 4, 1984, pp. 518-535. doi: 10.1061/(ASCE)0733-9399(1984)110:4(518)
23. Bažant, Z. P., “Crack Band Model for Fracture of Geomaterials,” Proceedings of the 4th International Conference on Num. Meth. in Geome-chanics, Z. Eisenstein, ed., University of Alberta, Edmonton, AB, Canada, V. 3, 1982, 1137-1152.
24. Bažant, Z. P., and Oh, B. H., “Crack Band Theory for Fracture of Concrete,” Materiales de Construcción, V. 16, No. 3, 1983, pp. 155-177. doi: 10.1007/BF02486267
25. Bažant, Z. P., “Microplane Model for Strain-Controlled Inelastic Behavior,” Chapter 3, Mechanics of Engineering Materials, C. S. Desai and R. H. Gallagher, eds., John Wiley, London, UK, 1984, pp. 45-59
26. Bažant, Z. P., and Oh, B.-H., “Microplane Model for Progres-sive Fracture of Concrete and Rock,” Journal of Engineering Mechanics, ASCE, V. 111, No. 4, 1985, pp. 559-582. doi: 10.1061/(ASCE)0733-9399(1985)111:4(559)
27. Caner, F. C., and Bažant, Z. P., “Microplane Model M7 for Plain Concrete. I: Formulation,” Journal of Engineering Mechanics, ASCE, V. 139, No. 12, 2012, pp. 1714-1723. doi: 10.1061/(ASCE)EM.1943-7889.0000570
28. Caner, F. C., and Bažant, Z. P., “Microplane Model M7 for Plain Concrete. II: Calibration and Verification,” Journal of Engineering Mechanics, ASCE, V. 139, No. 12, 2013, pp. 1724-35.
29. Taylor, G. I., “Plastic Strain in Metals,” Our Inst Metals, V. 62, 1938, pp. 307-324.
30. Karsan, I. D., and Jirsa, J. O., “Behavior of Concrete under Compres-sive Loadings,” Journal of the Structural Division, ASCE, V. 95, No. 12, 1969, pp. 2543-2564.
31. Yankelevsky, D. Z., and Reinhardt, H. W., “Response of Plain Concrete to Cyclic Tension,” ACI Materials Journal, V. 84, No. 5, Sept.-Oct. 1987, pp. 365-373.
32. Yankelevsky, D. Z., and Reinhardt, H. W., “Uniaxial Behavior of Concrete in Cyclic Tension,” Journal of Structural Engi-neering, ASCE, V. 115, No. 1, 1989, pp. 166-182. doi: 10.1061/(ASCE)0733-9445(1989)115:1(166)
33. Bažant, Z. P.; Şener, S.; and Prat, P. C., “Size Effect Tests of Torsional Failure of Plain and Reinforced Concrete Beams,” Materials and Struc-tures, V. 21, No. 6, 1988, pp. 425-430. doi: 10.1007/BF02472322
34. Kirane, K.; Singh, K. D.; and Bažant, Z. P., “Size Effect in Torsional Strength of Plain and Reinforced Concrete,” ACI Structural Journal, V. 113, No. 6, Nov.-Dec. 2016, pp. 1253-1262. doi: 10.14359/51689149
35. Bažant, Z., and Kwon, Y., “Failure of Slender and Stocky Reinforced Concrete Columns: Tests of Size Effect,” Materials and Structures, V. 27, No. 2, 1994, pp. 79-90. doi: 10.1007/BF02472825
36. Brocca, M., and Bažant, Z., P., “Size Effect in Concrete Columns: Finite-Element Analysis with Microplane Model,” Journal of Structural Engineering, ASCE, V. 127, No. 12, 2001, pp. 1382-1390. doi: 10.1061/(ASCE)0733-9445(2001)127:12(1382)
37. Bažant, Z. P., and Cao, Z., “Size Effect of Shear Failure in Prestressed Concrete Beams,” ACI Journal Proceedings, V. 83, No. 2, Mar.-Apr. 1986, pp. 260-268.
38. Bažant, Z. P., and Kazemi, M. T., “Size Effect on Diagonal Shear Failure of Beams without Stirrups,” ACI Structural Journal, V. 88, No. 3, Mar.-Apr. 1991, pp. 268-276.
39. Bažant, Z. P., and Le, J.-L., “Probabilistic Mechanics of Quasibrittle Structures: Strength, Lifetime, and Size Effect,” Cambridge University Press, London, UK, 2017.