size of bubbles and gas holdup in bubble columns
TRANSCRIPT

Memoirs of the School of Engineering, Okayama University Vol. 20, No.2, February 1986
Size of Bubbles and Gas Holdup in Bubble Columns
* *Toshiro M~YAHARA and Teruo TAKAHASHI
(Received January 16, 1986)
SYNOPSIS
Bubble columns are extensively used in the
chemical industry. This paper evaluates the present
state of the art on the size of bubbles from a sieve
plate and gas holdup, mainly on the basis of the results
of the authors, including previous ones.
The size of bubbles formed from a sieve plate has
an insignificant effect of chamber volume, and gas
holdup shows some different behavior, depending on the
hole diameter to liquid depth.
INTRODUCTION
Bubble columns are widely used in chemical process industries as
contactors for carrying out gas-liquid or gas-liquid-solid reactions
such as oxidations, hydrogenations, chlorination, coal liquefaction,
aerobic fermentations, etc., because of their simplicity of
construction and their high volumetric coefficient, leading to a
large number of publications. Therefore, we have come across a
considerable number of relevant papers on the size of bubbles and gas
holdup available to the design and the operation of bubble columns.
However, there remains uncertainties in the correlating equations
because of different results of each investigator. The authors have
also investigated these properties.
* Department of Industrial Chemistry

2 Tashiro MIYAHARA and Teruo TAKAHASHI
This paper reveals the present state of the art on the size of
bubbles and gas holdup from point of view of the results of the
h (12-14) h . h .aut ors toget er Wlt prevlous ones.
1. EXPERIMENTAL APPARATUS AND PROCEDURE
The experimental apparatus is shown diagramatica11y in Figure 1.
CD Column<l> Viewing box3 Pressure tap4 Air chamber5 Perforated plate6 Compressor7 Air filter8 Buffer tank9 Orifice flow rate meter
[]:J®5
@
<D
@
@
@
14
Fig. 1 Schematic diagram of experimental apparatus
Three different transparent acrylic-resin columns 1 were used, with
internal diameters of 5, 10 and 15 em. Most of the sieve plates 5,
shown in Table 1, which show plate P-1 - P-22, were made of brass, with
holes arranged in the form of equilateral triangles, except for plate
P-4, for which the arrangement was square. To examine the effect of
plate materials, polyethylene, po1yviny1ch1oride, acrylic resin and
teflon sieve plates, which are plate P-23 - P-31, were used;the column
diameter was 5 em, all the sieve plates employed for the purpose had
the number of holes of 15 and the pitch of 1 em, and distilled water
was used as liquid. Details of the geometry are given in Table 1.
Only teflon plate has a characteristic of non-wettabi1ity, showing
a contact angle of liquid on a plate of more than 90 degrees.
The liquids used for most of the tests were distilled water and

Table 1 Details of plates employed
Plate d [m] m[-] P[m] l[m] P/d [-] DT[m] Material Contact_________~ ~ ~~g1~lE~Ql_
P-l 0.0005 19 0.01 0.001 20 0.05 Brass 0.52P-2 0.001 19 0.01 0.001 10 0.05 Brass 0.52P-3 0.0005 37 0.007 0.001 14 0.05 Brass 0.52P-4 0.0005 37 0.002 0.001 4 0.05 Brass 0.52P-5 0.0005 19 0.001 0.001 2 0.05 Brass 0.52P-6 0.0005 19 0.002 0.001 4 0.05 Brass 0.52P-7 0.0005 19 0.003 0.001 6 0.05 Brass 0.52P-8 0.0005 19 0.004 0.001 8 0.05 Brass 0.52P-9 0.0008 19 0.003 0.001 3.75 0.05 Brass 0.52P-I0 0.0005 85 0.01 0.001 20 0.1 Brass 0.52P-ll 0.0013 84 0.01 0.0008 7.69 0.1 Brass 0.52P-12 0.0018 84 0.01 0.0008 5.56 0.1 Brass 0.52P-13 0.001 1 - 0.001 - 0.15 Brass 0.52P-14 0.001 2 0.01 0.001 10 0.15 Brass 0.52P-15 0.001 3 0.01 0.001 10 0.15 Brass 0.52P-16 0.001 5 0.01 0.001 10 0.15 Brass 0.52P-17 0.001 10 0.01 0.001 10 0.15 Brass 0.52P-18 0.001 15 0.01 0.001 10 0.15 Brass 0.52P-19 0.001 17 0.01 0.001 10 0.15 Brass 0.52P-20 0.0005 10 0.01 0.001 20 0.15 Brass 0.52P-21 0.0005 13 0.01 0.001 20 0.15 Brass 0.52P-22 0.0005 17 0.01 0.001 20 0.15 Brass 0.52P-23 0.0005 19 0.01 0.002 20 0.05 Polyethylene 1.22P-24 0.0005 19 0.01 0.002 20 0.05Polyvinylchloride 1.08P-25 0.001 19 0.01 0.002 10 0.05Polyvinylchloride 1.08P-26 0.0015 19 0.01 0.002 6.67 0.05Polyvinylchloride 1.08P-27 0.0005 19 0.01 0.002 20 0.05 Acryl resin 0.87P-28 0.0005 19 0.01 0.001 20 0.05 Teflon 1.66P-29 0.0008 19 0.01 0.001 12.5 0.05 Teflon 1.66P-30 O.OOIDI 19 0.01 0.001 10 0.05 Teflon 1.66P-31 0.0015 19 0.01 0.001 6.67 0.05 Teflon 1.66
~~!;ll;:;..~IJi
'"'""-~:::::
!:;l"
~~
~g,.~'"
w

4 Tashiro MIYAHARA and Teruo TAKAHASHI
ethanol. The liquid depth was 25-100 em.
Photographs were taken of bubbles at intervals of approximately
5 em along the column. The negatives were enlarged, and the major
and minor axes of each bubble, assumed to be ellipsoidal, were
measured. The volumetric mean bubble diameter was calculated from
the expression
E6Vb /n: )1/3( n (1)
The number of bubbles was 40-100, a level of which is reliable for
statistical purpose under the above experimental conditions (6) .
Since under these experimental conditions, there was no appreciable
variation in the size of bubbles in the longitudinal direction along
the column, bubbles were photographed at a position 40-45 cm above
sieve plate, except when we were examining the effect of the number
of holes. Then, the photographs were taken at a depth of 25 cm.
Gas holdup was calculated by the usual static pressure method.
2. RESULTS AND DISCUSSION
2.1 Size of Bubbles Generated from a Sieve Plate
1) Effect of hole number
According to the previous work(15), the size of bubbles formed
at single orifice is influenced by the volume of gas chamber; the
same is true of bubbles generated from a sieve plate. On the other
hand, the report by Koide et al. (6) suggested that the size of bubbles
from sieve plate is independent of gas chamber volume. In an attempt
to find out the effect of the number of holes on the relationship
between bubble size and chamber volume, we examine the bubble size
for three cases of the chamber number N <1, l<N <9, 9<N (15), thec c c
results being shown in Figure 2. As can be seen, the effect of
gas-chamber volume is much weaker with increase of the number of
holes, the critical point being aroud 15 in the region of column
diameters of 5-15 cm as shown in Figure 3. This is probably due to
the liquid flow around the bubble induced by bubble formation.
Accordingly, our subsequent experiments were carried out using 15 or
more holes.

2
'"7lLJ 101
£:??:::-
0 6
~ 4--a:O't--0M 21"0
100
'"7l10
1U£:?~-0 6"00
4-.......--a.Q1
0 2roM
100
n~
101
c:?...-.-0"0 6S-a:: 4O't
---0M1"0 2
Size of Bubbles ulld GIiS Holdu!J ill Bubble Columns
KeyI I
Tadaki et a1.15) I (a )NcC- J
0 0·75 Ke, NcC-]~ e 2·98 .6. 0·543 EthanolI- CD 12·7 ... 3.17 do=0.000393 -l- I:,. 13-6 m-f- Air-water -
~CD.4ID CD CD ~ CD CDCDCD CD CD CD~~ ~ ~oI- ~eee e 0 -~e e e e~ ee"eee .6.c9
'0 o 0 cA::>O d' 0 00 -~~
P-13. do=0.00/m.H=0.25m. m=l II I I
I I I(b )Key NcC- ]
I- 0 0·86 -f- e 3·41 -- CD 14·3-- Air-water
-- -- CD CDCD CD~5ac5=O -- e &e e e -
e00 00
- 0 -.P-15. do=O.OOj m, H=0·25m, m=3. P/do=10
I I 'I
KeyI Koide et al.6) I ( c )
NcC- J_ 0 O· 71 Key doCmJ mC-]
e 3.16 ... 0·0005 31CD 10·0 .6. 0·001 31
- Air-water I:,. 0.001 85- ~i.A ,
e eg~~
P-19. d =O·OOlm, H=0.25m.m=17. P/do=lOI I I I II I I I I I I I II I
5
6 10 0
Nw2 4
[-J6 10 1 2
Fig. 2 Effect of chamber volume
2) Bubble size distribution
Figure 4 shows the volumetric mean diameter of bubbles for a
low and a high value of pitch to hole diameter ratio p/d. Wheno
P/do
is high, the volumetric mean diameter d30
shows a minimum value,
whereas it does not show for low vales of p/d. At gas velocityo
corresponding to the minimum bubble diameter, bubbles are generated
from all the holes. The above result for low value of p/d is dueo
to the coalescence at the moment of bubble formation.

6 Tashiro MIYAHARA and Teruo TAKAHASHI
JKey doCm] P/do C-
° Ne <'1e 1<Nc<9 0·001 10<D 9<NcI:J. Nc<l.tI. 1<Nc<9 0·0005 20.... 9<Nc
6
4n
I
U 2
.II
4 ~:=-===~-t-¢=!-
M-~ 10
1
:g-a: 6-2}oM
1"0
2(15 )
10°0 2 4 6 8 10 12 14 16 18 20
m [-J
Fig. 3 Effect of number of holes
102
Air-water
n 6 '0' .-.-."-~CY<¥O°-oCb-O-°OO-E 4 ,o~O_(5ODU Key Plate P/doC-J
00 P-1 20M
1"0 2 P-6• 4
163
Vc=130xlO- 6 m 3
2 4 6 10-2 2 4 6 10-1 2·
Uge Cm/s]
Fig. 4 Volumetric mean diameter of bubbles
generated from sieve plate

Size of Bubbles and Gas Holdup in Bubble Columns
Key Ugc Cm/s] Key Ugc Cm/s] 10([)
a 0·00365 a 0·0042 lL. e 0·0081 0·00754<II e- ([) 0·0178 0·0184III10
([)
!<II • 0·0856L.
01 nc ~20 Air-water Air-water
~U P-l P-6 I
~ a: 40 H=0·7 m H=0·7m iL.
<II 60 Vc =130x 106 m3Vc=130Xlo-Gm3g<II
.!) NE 1II d:JC "080
I<II <II> - P/de =20 P/de = 4290~ 1II:J C q>E III
~~:J .cu
995 2 5 2 5 10-2 2
d em] d em]
Fig. 5 Bubble size distribution
Figure 5 shows the bubble size distribution correspondinq to
Figure 4. The data are fitted well by a logarithmic normal probability
distribution, the results agreeing with those of Tadaki et ale (15)~Towell et ale (17) and Akita et ale (1). The distribution function can
be expressed by
7
f(d, d )g
Here,
r-= - 2 21/(t2nlns)exp[~{ln(d/d )} /{2(lns) }j
g(2)
(3 )
s =- 2 1/2exp[E{ln(d/d )} In]
g( 4 )
The size of bubbles for bubble columns is usually calculated as
Sauter mean diameter d32 . The Sauter mean diameter can be expressed
on the basis of logarithmic normal probability distribution as

8 Tashiro MIYAHARA and Teruo TAKAHASHI
2exp{-(lns) } ( 5)
Since s is close to unity as shown in Figure 6, we expect that
d30 is nearly equal to d32 according to Eq. (5) .
2
.4 52
e P-7(9 P- 8ill P - 9<t P-10
Key Plate
2 4 6
Nw [- ]4 6
__~_~~-e~-;-Tadaki et at ~5)
65
2
10'Key Plate
6 e P-1~ P-2
4 () P-30 P-6
nI
U
(/)
Fig. 6 Geometric standard deviation
3) Mean bubble diameter
Figure 7 shows the correlation for the dimensionless bubble
diameter against the dimensionless parameter N (15) for P/d >8,w 0
the experimental results and the correlation of Koide et al. (6) also
being shown. The solid line is
( 6)
where
f (Nw
)
f (Nw
)
f (Nw
)
f (N )w
2.92.9N -0.188
w1. 8N 0.5
w3.6
N <1w=
l<N <2w
2<N <4w=
4<Nw
The dashed lines in the same graph are the correlation of Tadaki et
al. (15), the experimental results of this study being close to the
result of Tadaki et ale for Nc
=4. The value of Nw=2 corresponds to

Size of Bubbles and Gas Holdup in Bubble Columns 9
~ 5
4 Key Plate Liquid Vc [m 3 J H [mJ
0 P-1 Water 130x 10-6 0·7
2e P-1 Water 666x10-~ 0.7
n CD P-1 Water 130x10· 6 0.5I e P-2 Water 130 x10- 0·7 _.- 6)
U Q P-2 Water 666x10-6 0.7P-3 Water 130 xlO-6 0.7 Koideetal.
101 ()M () P-3 Water 666x10-6 0·7- 0 P-10 Water 1025x10-6 0.7~.......0 6 • P-1 Ethanol 130xlO-6 0·7"0
_~::_~_:i~_c!_~_~~~.:g4-a:' _ -" L:,. l::l: .,-- " ....
$ Eq. (6 )--r--=::::'~ ...."0 2M
Koide et at. 6 ) 15 <P Ido<601"0
100+ 53 vol~/o Glycerine aq.X 80vol~/o Glycerine aq.L:,. Water
6 ... 1vol."Io Isoamyl alcohol aq.5
2 4 6 100 2 4 6 101 2 4 5
Nw C-J
Fig. 7 Correlation of volumetric mean diameter
of bubbles
the transitional points at which bubbles are generated from all the
holes.
The following correlation has been found to be valid at low
values of P/d as shown in Figure 8.o
3.6 P/d <8o(7 )
4) Effect of inorganic electrolyte~
The addition of inorganic electrolytes to water has an
insignificant effect on the size of bubbles generated from plates
for P/d >8, whereas the bubble size for plates of P/d <8 showso 0
complicated characteristics as dependent on concentrations and sorts
of electrolyte, the bubble size being always smaller than that
obtained by Eq.(7). The most likely reason is the inhibition of
coalescence between adjacent bubbles at the plate due to the existence
of inorganic electrolytes though P/d is small.oMarrucci(9) has recently proposed an idea for the thinning
process of liquid film. This theory indicates that the bubble
coalescence is hindered by the value of crbk 2/0.

10 Tashiro MIYAHARA and Teruo TAKAHASHI
20 ,....,..'T""T"""n----y--r-r-r..,...,IT-r--...,
nI
UlOM~,..........-..-8 5~
~oSo 2n5)
Air-wateor system3 -6 3H=O.7 m Vc= 1 OxlO m
20
Fig. 8 Effect of P/do
Then, crbk2/0 represents the difficulty of bubble coalescence.
The correlation of the bubble size for the addition of inorganic2electrolyte is illustrated in Figure 9 by a vs. crbk /0; where a is
LiquidPlateKey
1·0 @ aaO.g \ ~~ t"$-;0.8 '- $ 7) -~'------t
" Koide et al. V"'- --- -- - - - - -_.\. -- --- - ----0·7......
IL..I 0·6
H=0.7 mVc =130x lO-p
m3
100 mol/m3NaCI
1000mol/rrfNaCIlOOmol/m3BaCI2100mol/m3 NaCIlOOOmollm3NaCI1000mol/m3NaCI
P-6P-6P- 6P-7P- 7p-g
oeeCD()
~
~ 0·5
0·4
0·3
0·20.1 '--..L---'----''--...J..--'----'_...J..---'----''--........--'----'
a 4 8 12 16 20 24
Crk~6 [-]
Fig. 9 Effect of inorganic electrolytes

Size of Bubbles and Gas Holdup in Bubble Columns
the ratio of dimensionless bubble diameter in aqueous inorganic
electrolytes to that in pure water.
The dashed line in this graph shows the result of bubble diameter
for porous plate at the critical gas velocity below which bubble
diameter does not depend on gas velocity, which was found by Koide
et al. (7). It is clearly seen that the addition of inorganic
electrolyte strongly affects the size of bubbles from porous plate.
5) Effect of plate materials
The size of bubbles from plates of non wettable materials, whose
characteristics depend on a contact angle of liquid on a plate of
more than 90 dgrees is independent of Nw
for both P/do >8 and P/do <8
as shown in Figure 10.
11
54 Key Plate
d30=0.007 m
-e~-~-c:e-<S~~cj)~-j)]'ite
Air- water system
nE
102U
0M 6I"U
4
22
•~
oe
4
P - 28P - 29P - 30P - 31
6 2[-]
4 6 2
Fig. 10 Volumetric mean diameter of bubbles from
various plates of non-wettable materials
The size of bubbles is about 7 rom, while the size distribution
follows a normal probability distribution approximately when the
standard deviation is given by
s'id 1/2 = 0.08 (8)o
as shown in Figure 11 above N =2 at which bubbles are generated atw
all the holes.

12 Tashiro MIYAHARA and Terua TAKAHASHI
Key Plate
5.--...,.--r--'r"""T'".......,..~--.,..-r--r-T-r-r-T"'T~-...,
4n
N--E 2u
N
;:'°10-1"'0:---l/} 6
42'---I--I-...l....l....L.J.~::-----L~..l.-..L....I.........J.-I..~---'
246 246 2
[-J
Fig. 11 Standard deviation
Table 2 Bubble size correlations in bubble column
Investigator Correlation
Koide et al. 6) d { /(ad )}1/3=2 94N 0.07130 gpR, 0 • W
Kumar et al. 8) d32{~pg/(ad02)}1/4=1.56Rego.058
l<Re <10
d32{~pg/(ado2)}1/4=0.32RegO.425 .g
10<Re <2100
d32{~pg/(ado2)}1/4=100Reg-0.4 g
Akita et al. 1)
4000<Re <70000g
(u /~)-0.12( 0 3/ 2)-0.12x gc g T g T vR,
6) Previous bubble size correlations
A number of correlations for bubble size have been proposed,
however, the scatter in reported data does not allow a single
correlation. Some of the important correlations have been listed in
Table 2.
Figure 12 shows the comparison among Eq.(6), the correlations
sho~m in Table 2 and the present measurements.

Size of Bubbles and Gas Holdup in Bubble Columns 13
N
00·5-xo
1-8 0.2
nEu
2
1
-----Koide et al.6)-'- Kumar et al.8)-"- Akita et al.l)
_ ..__ Air-water system
. "--"-- ~Eq. (6) ..~- ---:::-:-~ _ ~..;a:-=_~~=--=@i"i-
.:==~"~,~~ ~~. Ke Vc x 10 6Cm 3 ]
~. 0 130~ p- 1 • 666
H=0.7m, Dr=0.05m
2 5Ugh
10 20[m/s]
50 100
Fig. 12 Comparison between previous correlations
and bubble size measurements
2.2 Gas Holdup in Bubble Column
1) Maximum gas holdup
Gas holdup in bubble columns increases with increasing gas
velocity in the uniform bubbling regime, where bubbles rise
independently with fairly uniform spacing between them, represents
the maximum value and decreases in liquid circulation regime where
the dynamic interaction of gross circulation and large bubbles becomes
frequent and violent.
The maximum gas holdup is given for air-water system by the
following equation(18)
(1 - w) = ° 0083{mP/(d D 2)}0.29max' 0 T ( 9)
The critical superficial gas velocity which is defined as the
velocity at the point of incipient regular circulation, where a
transition from bubble to turbulent circulation flow occurs, depends
on clear liquid height under a uniform stable gas distribution and isgiven by (10)

14
ugc
Tashiro MIYAHARA and Teruo TAKAHASHI
0.042H- 0 • S (10)
Bubble columns are usually operated below the critical gas velocity.
2) Gas holdup in bubble column
Generally, as is well known, the liquid in bubble column flows
up in the center of the column and down near the wall, though it is
considered that bubbles rise uniformly over the cross-section of the
column. For the gross circulation of liquid, the radial
non-uniformity of gas holdup could be observed. The radial variation
of gas holdup is given as lS )
(11)
where n, ~c and I~ - ~ )/~ are empirical constants.c w cFigure 13 shows the vertical profile of mean liquid fraction
Air-water systemzxl00 [m]
o 5 10 15 20 25
..!. 0·5~
I
5 10 15 20 25Zxl00 [m]
(a) ( b)
Kev Hl mJ0 0.03
• 0·05Q 0·07.()- 0.1() 0·15lD 0·2
Fig. 13 Vertical profile of mean liquid fraction
on a sieve plate, measured by means of y-ray techniqu~~6)The mean
liquid fraction decreases suddenly near the surface of a sieve plate,
then shows a constant and decreases near the top of the froth as can
be seen from Figure 13. The region, in which gas holdup is roughly
constant, increases with liquid depth, bubble column corresponding

Size of Bubbles and Gas HolduP in Bubble Columns
to this case, i.e., the long constant gas holdup region.
Now, the gas holdup in shallow liquid is correlated well with
the Froude number based on liquid depth(16). The gas-to-liquid
holdup ratio in a deep liquid of D.3 m to 1 m depth is presented in
Figure 14 in terms with (l-W)/W against Fr. The dashed lines are
given by the following equations(16)
15
(l - W) /W
(1 - W) /W
-4Fr<8.5xlD-48.5xlD <Fr<l
(12)
(13)
2 5 10-4 22Fr =Ugc/(gH) [-]
5 5
Fig. 14 Gas liquid holdup ratio versus Froude number
From this chart, gas holdup is satisfactory agreement with Eq. (12)
for large d /H, whereas for small d /H it is larger than that ofo 0
Eq. (12) and d /H does not affect gas holdup for large Froude numbers.oWhen d /H is less than about 3xlO-3 , gas holdup is independent of
oliquid depth. For this reason, it is presumed that liquid depth
usually does not affect the gas holdup in bubble column.
Figure 15 shows the correlation of gas holdup in terms of
(l-W)/W against Fr' (=u 2/(gd)) for d /H<3xlD- 3 • From this figure,gc 0 0
the following empirical equation is obtained

16 Toshiro MIYAHARA and Teruo TAKAHASHI
10° Air-waterKe Plate H[m] Ke Plat HEm]
5 0 P-1 O· 7 • P-l1 O· 3 -;::.::;:;e P-l 0·5 6 P-12 1·0 Eq (1~. ~(I) P-1 0·3 A P-12 0·6 . ~. 0 ~ ~
e P-2 0·7 A P-1 0·3 '2 ~ P- 3 O· 7 ~ P-30 0.3 .
() P-lO 1·0 v P-31 0·5 NJ/ Air-watern () P-l0 0·6 .~ H)' • P-lO 0.3 . Ke Plate H[m]
o P-11 1.0 .20°/0 ':20°1. ~ P -31 0·3
~ !3 P -11 O· 6 ..-(~ " P-28 0·7~ P-23 0·7- 5 v P-30 0·7........ ~ir-ethanOI~ ~ P - 31 0·7
~I!#i KeYIPlatel HEm]'V P-27 0·7...
2 &~~. ~~ '1 P- 1 0·7'V P - 28 O.~- v P -28 O·!---- Y"
ty/.v P -30 0·5
10-2 /10-3 2 5 2 5 10-' 2 5 10° 2 3
Fr' =Ug~ I(g do ) [-J
Fig. 15 Correlation of gas holdup
(1 - Il-') /Il-' 0.4/Pr' Fr' = U 2/(gd), d /H<3xlO- 3gc 0 0
(1 - Il-')«l - Il-')max
(14)
It seems that (l-Il-')/Il-' in d /H>3xlO- 3 or turbulent circulation flowo
regime could be estimated by Egs. (12) and (13).
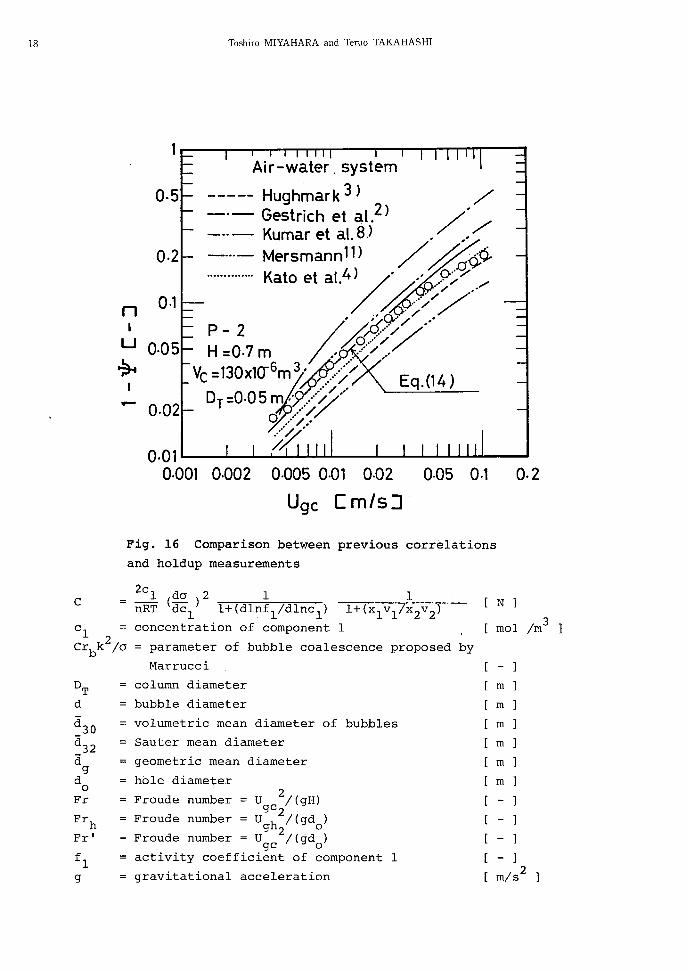
4) Previous gas holdup correlations
Some previously important correlations for gas holdup in bubble
columns having a sieve plate are shown in Table 3.
Figure 16 shows the comparison among Eg. (14), the correlations
in Table 3 and the present measurements.
CONCLUDING REMARKS
The size distribution of bubbles formed from a sieve plate
may follow a logarithmic normal probability distribution when the
geometric standard deviation is close to unity, whereas the size
distribution of bubbles from a sieve plate of non-wettable material,
being independent of the plate geometry, follows a normal probability

Size of Bubbles and Gas Holdup in Bubble Columns
Table 3 Holdup correlations in bubble column
Investigator Correlation
17
Hughmark 3) (1-1jI)=[2+(0.35/U ) {(Po/p ) (a/a ) }1/3]-1gc N W W
Gestrich et a1. 2) (1_W)=0.89(H/DT
)0.036(-15.7+109 K) (db/DT
) 0.3
x{(U 2/(gd )}0.025(2.6+1ogK)KO.047 - 0.05gc b
3 4K=P10 /(g~l ), d b=0.003 m
Kumar et a1. 8)
9)Mersmann
* *2 _*3(1-1jI)=0.728U -0.485U +O~D915U
{ 2 3/( 4~ )}1/24( / )5/72xPR, a ~R, pg PR, Pg
llP=P -P1 9
Kato et a1. 4,5) (l-IjI)=U /vgc b
vb
=O.31+0.4 U O.8(1_eY)gc 1.3
8=4.5-3.5e- 25 • 5DT
y=-716U 1. 8/8gc
distribution.
The gas holdup on a sieve plate is different above and below
a value of d /H of 3xlO-3 • The gas holdup in bubble column is wellocorrelated with the Froude number based on hole diameter, as
independent of liquid depth.
NOMENCLATURE
A = Hamaker constant [ J ]
18 Toshiro MIYAHARA and Teruo TAKAHASHI
Air-water. system
0.5 ----- Hughmark 3> /_.- Gestrich et al.2) /',/'_ .. - Kumar et al.8) .'_ ...- Mersmann11) / dt.'.{j.:o,.............. Kata et al.4 ) /' h··r;v~;.~./
/ /A>...../' /'.• Q.. . / ,/, , ~ / ,,"
p- 2 / /4;/'VC~1;~·:1~~6m:;..~'Eq.{14J
Dr :0·0 5 m /0;~....//o ..../.
;j<"0.01L..-_L....-..L.......L-'-L..J-I...L..I...._....L--'-....I.....l.....I....I....&....I...I.._......
0·001 0·002 0·005 0·01 0·02 0·05 0·1 0·2
Ugc [m/sJ
0·2
n 0·1I
u 0·05~
- 0·02
Fig. 16 Comparison between previous correlations
and hqldup measurements
C
DTd
d30d32d
gd oFr
Frh
Fr'
2c l do 2 1 1nRT (dC
l) 1+(dlnf1/dlnc
l) 1+(x
1v
1!x
2v
2)
concentration of component 1
= parameter of bubble coalescence proposed by
Marrucci
column diameter
bubble diameter
volumetric mean diameter of bubbles
Sauter mean diameter
geometric mean diameter
hole diameter
Froude number U 2/(gH)gC2Froude number U h /(gd )
Ug
2/ ( 'do)Froude number gc g 0
activity coefficient of component 1
gravitational acceleration
N ]
mol /m3 ]
[ - ]
[ m 1[ m ]
[ m 1[ m ]
[ m ]
[ m ]
[ - ]
[ - ]
[ - ]
[ - ]
[ m/s 2

24V (Pl-p )g/(nd P)c g 0 c
H
1
m
k
NcNwPcP
R
n
Reg
RT
r
sg
UghUgcv
l,v
2Wexl ,x
2
Size of Bubbles and Gas Holdup in Bubble Columns
liquid depth
thickness
hole number
{(2nO/(Arb
)}1/3
chamber number
we/Frh
0 .5
pressure in chamber
pitch
gas constant
total number of moles of ions per mole of
Reynolds number = d U hP /Uo g g gcolumn radius
radial distance
bubble radius
standard deviation
geometric standard deviation
hole velocity
superficial gas velocity
molar volume of component 1 and 22
Weber number = P1Ugh /0
mole fraction of component 1 and 2
[ m ]
[ m ]
[ ]
[ lim[ ]
[ ]
[ Pa ]
[ m ]-1 -1{J.K .mol ]
electrolyte [ - ]
m
m
m
m
m/s
m/s ]
m3/mol
19
Greek letters
a ratio of dimensionless bubble diameter in aqueous
gas holdup
gas holdup at center and wall
mean liquid holdup
liquid holdup
inorganic electrolytes to that in water
~g'~l = viscosity of gas and liquid
v l kinematic viscosity = ~l/Pl
P ,Pl,P = density of gas, liquid and waterg w
0,0 surface tension of liquid and waterw
ljl
REFERENCES
[
[ Pa.s.]2[ m /s ]
[ kg/m3 ]
[ N/m ]
[ - ]
[ - ]
[ - ]
[ - ]
(1) K. Akita and F. Yoshida: Ind. Eng. Chern., Process Design
Develop., 13 (1974), 84.

20 Tashiro MIYAHARA and Teruo TAKAHASHI
(2) W. Gestrich and W. Rahse: Chemie-Ing-Tech., !l (1975), 8.
(3) G.A. Hughmark: Ind. Eng. Chem., Process Design Develop., 6
(1967), 218.
(4) Y. Kato and A. Nishiwaki: Intern. Chem. Eng., 12 (1972), 182.
(5) Y. Kato, M. Nishinaka and S. Morooka: Kagaku Kogaku Ronbunshu,
1:. (1975), 530.
(6) K. Koide, T. Hirahara and H. Kubota: Kagaku Kogaku, iQ (1966),
712.
(7) K. Koide, T. Hayashi, M. Nora, Y. Takemura, N. Kawamata and
H. Kubota: J. Chem. Eng. Japan, ~ (1972), 236.
(8) A. Kumar, T.E. Dega1eesan, G.S. Laddha and H.E. Hoelscher:
Can. J. Chem. Eng., 54 (1976), 503.
(9) G. Marrucci: Chem. Eng. Sci., ~ (1965), 975.
(10) T. Maruyama, S. Yoshida and T. Mizushina: J. Chem. Eng. Japan,
14, (1981), 352.
(11) A. Mersmann: Ger. Chem. Eng., 1:. (1978), 1.
(12) T. Miyahara, Y. Matsuba and T. Takahashi: Kagaku Kogaku
Ronbunshu, ~ (1982), 13.
(13) T. Miyahara, S. Kaseno and T.Takakhashi: Kagaku Kogaku
Ronbunshu, ~ (1982), 643.
(14) T. Miyahara, Y. Matsuba, S. Kaseno and T. Takahashi: J. Chem.
Eng. Japan, 15 (1982), 391.
(15) T. Tadaki and S. Maeda: Kagaku Kogaku, ~ (1963), 402.
(16) T. Takahashi, T. Miyahara and K. Shimizu: J. Chem. Eng. Japan,
7.- (1974), 75.
(17) G.D. Towell, C.P. Strand and G.H. Ackerman: AIChE-I. Chem.
Eng. Symp. Series (London), No.10 (1965), 97.
(18) F. Yamashita and H. Inoue: J. Chem. Eng. Japan, 8 (1975), 334.