sizing and performance of constructed ... and performance of constructed wetlands: case studies 1...
TRANSCRIPT
SIZING AND PERFORMANCE OF CONSTRUCTEDWETLANDS: CASE STUDIES 1
Robert S. Hedin
and
Robert W. Nairn 2
Abstract: Iron removal in three Pennsylvania wetlands constructed to treat acid minedrainage was evaluated. All wetlands were constructed with a mushroom compost substrateand were planted with Typha spp. Performance was evaluated by calculating area‐adjustediron loadings and removals as Fe g day‐1 m‐2 (gdm). An initial model of the iron removalcapabilities of constructed wetlands was also evaluated. Relationships between pH,concentration, flow, loading and removal were considered. At the Somerset Site (avg.influent pH=4.0), influent iron loading, which was primarily a function of concentration, wasconsiderably more variable than iron removal. The relationship between the two appearedasymptotic, with removal being independent at loadings above 15 gdm (avg. removal = 10.6gdm) and averaging 54% of loading at loadings less than 15 gdm. Conversely, at the LatrobeSite (avg. influent pH=3.0), variation in iron loading was primarily a consequence of flowvariation. Removal averaged 2.7 gdm at flows > 100 L min‐1 and 4.3 gdm when flow < 100 Lmin‐1. The overall average removal was 3.6 gdm. A significant relationship between loadingand removal was not found. At the Friendship Hill Wetland, influent pH was 2.7, and ironremoval averaged 3.3 gdm. The narrow range of loadings at this site prevented detailedanalysis of loading:removal relationships. Overall, these data were used to developpreliminary wetland sizing criteria based upon iron loadings. In situations where minedrainage has flow > 50 L min‐1 and iron concentration > 50 mg L‐1, loading‐based criteriaresult in significantly larger wetlands than conventional flow‐based criteria.
1 Paper presented at the 1990 Mining and Reclamation Conference and Exhibition, Charleston,West Virginia, April 23‐26, 1990.
2 Robert S. Hedin, and Robert W. Nairn, are Research Ecologist and Research Biologist, at theU.S. Bureau of Mines, Pittsburgh Research Center, Pittsburgh, PA.
Introduction
Constructed wetland technology has advanced considerably in recent years, but sizing criteriahave evolved very little from initial suggestions that 5.0‐15.0 m2 of wetland were needed foreach liter per minute (L min‐1) of contaminated flow (Kleinmann et al . 1986, Girts et al .

1987). Although this sizing standard was only intended for drainage with flow less than 40 Lmin‐1, pH greater than 4 and iron concentration less than 50 mg L‐1 , it has been applied tosystems that receive much higher flows and poorer water quality. Many of these systems donot perform satisfactorily, probably in part because they are undersized. A better sizingstandard that incorporates contaminant concentrations as well as flow is needed.
The belief that a "correct" sizing methodology exists derives from an assumption that a squaremeter of wetland can remove a predictable amount of contaminant in a day's operation. Thissizing hypothesis can be evaluated empirically by analyzing iron‐removal by existingconstructed wetlands. In this paper, the iron‐removal capabilities of three constructedwetland systems are evaluated. We focus on iron because it is the principal metalcontaminant in coal mine drainage and appears, thus far, to be most suited to wetlandtreatment.
Evaluation of Wetland Performance
To make reliable evaluations of wetland performance, a measure should be used that allowscomparison of contaminant removal for systems of different sizes that receive drainage withdifferent flow rates and chemical compositions. In the past, concentration efficiency (CE%)has been a common measure of performance (Girts et al. 1987, Stark et al. 1988). For iron(Fe) the calculation is:
In many cases, this is a poor measure of performance. Comparisons of iron removalefficiencies for different wetland systems fail to provide sizing insights because thecalculations do not include any measure of contaminant masses or wetland size.
A better evaluation procedure involves several components. First, the daily mass of iron ateach sampling station must be calculated:
(where 1.44 is the adjustment factor needed to convert minutes to days [1,440] andmilligrams to grams [0.001]). This value, grams of iron per day, is commonly referred to asthe iron "loading." The amount of iron removed by the wetland between two sampling stationsis calculated by comparing iron loadings at the two points.
Conventionally, a comparison of the influent and the final effluent station is made todetermine the effect of the whole wetland on iron loading. However, when additional watersamples are collected, the iron removed by individual cells can be calculated.
The second calculation involves adjusting the iron loading for wetland size. For inlet stations,

the amount of the daily iron load apportioned to each square meter of downflow wetland can
be estimated by:
An estimate of the amount of iron removed by each square meter of wetland between twosampling points can be calculated:
These values will be referred to as "area‐adjusted." The units, grams of iron per day per m2 ofwetland, will be referred to as "gdm." We will focus in this paper on 1) area‐adjusted ironloading, which is the average amount of iron that each square meter of wetland is exposed toin one day, and 2) area‐adjusted iron removal, which is the average amount of iron removedby each square meter of wetland per day.
To illustrate the use of iron loading and area‐adjusted iron loading estimates, consider thehypothetical data presented in Table 1. In Systems A and B, changes in iron concentrationsare the same (60 mg L‐1), but because system B receives four times more flow and thus higheriron loading, it actually removes four times more iron from the water (see rem in g day‐1).The concentration efficiencies of the two wetlands are equivalent, but masses of ironremoved are quite different.
Hypothetical data are shown for System C for three sampling dates on which flow rates andinfluent iron concentrations vary. On the first date (Cl), the wetland removes all of the ironthat it receives. On the next two dates (C2 and C3), iron loadings are higher and the wetlandeffluent contains iron. From an efficiency standpoint, performance is best on the first dateand worst on the third date. But from an iron‐removal perspective, the system is removingthe least amount of iron on the first date. On the second and third dates the wetland removessimilar amounts of iron (2880 and 3024 g day‐1). Variation in effluent chemistry results, notfrom changes in the wetland's iron‐removal performance, but from variation in influent ironloading.
Lastly, consider a comparison o wetland systems of different size. System D removes moreiron than any wetland considered (5400 g day‐1 ), but it is also larger. One would expect, allother factors being equal, that a larger wetland would remove more iron. When wetland area

is incorporated into the measure by calculating area‐adjusted iron removal values, System Bemerges as the most effective wetland considered (see removal gdm values).
Iron Removal Model
In addition to evaluating iron removal on a whole wetland basis, we analyzed the relationshipbetween area‐adjusted iron loading and removal for individual wetland cells. The objective ofthis analysis was to initiate the development of a model of iron removal in constructedwetlands. Figure 1 is a plot of loading and removal for a hypothetical model wetland. Theshape of the plot results from an assumption that iron removal processes are limited to amaximum rate (point A"). When inflow loading is less than the maximum rate, 100% removalcan occur (removal = loading). The low flow data from hypothetical wetland C1 plots on thisline. At inflow loads greater than the maximum rate (point A'), constant iron removal occurs.The high flow data from wetland C (C2 and C3) fall near this line.
One goal of this paper is to determine how accurately the performance of constructedwetlands is represented by this model. We were also interested in determining whether area‐adjusted iron removal rates differed between wetlands and, if so, whether this variationcould be attributed to particular characteristics of the influent water (e.g. pH, Eh, [Fe]).
Selection of Study Wetlands
Study wetlands must satisfy some basic standards if comparisons of iron removal are toprovide insights into system performance. The wetlands being evaluated and compared mustbe built using similar designs and materials. In northern Appalachia, the "standard" wetlandconsists of 30‐45 cm of compost substrate planted with cattails (Typha spp.). Water in thestandard wetlands flows primarily by surface routes. The study systems must have distinctinlet and outlet stations where accurate flow measurements and representative samples canbe collected. No significant or unquantifiable inputs of fresh or contaminated water to thewetland should exist. Data should be collected for at least one year after system constructionand preferably for several years. This ensures that short term effects associated withchemical properties of the compost will not unduly bias results, and that the systems will beevaluated with an established plant cover.

The screening conditions described above exclude from analysis many wetlands that wereconstructed using different designs and materials (e.g. the TVA wetlands in southernAppalachia) or that do not have exact influent points. We do not intend to imply that thesesites are inferior to the ones discussed. Many of these wetlands are very effective (Girts et a].1987, Brodie et al. 1988), however, their inclusion in this paper would complicate theinterpretation of the results. We leave comparisons of the effectiveness of wetlandsconstructed with different designs to other papers.
Materials and Methods
The surface area of each study wetland was determined from field measurements orengineering drawings. Water flows were determined using a bucket and stop watch. All flowrates reported are the average of three to five measurements. Raw and acidified watersamples were collected for chemical analysis. Samples were not filtered prior to acidificationbecause 1) previous comparisons of filtered (0.45 um) and unfiltered samples showednegligible differences in metal concentrations, and 2) regulatory standards are based on total(unfiltered) metal concentrations. Total iron was determined on the acidified samples by ICPspectroscopy. Sample pH was measured both in the field and in the laboratory. For influentsamples discussed in this paper, the results were not substantially different, thereforelaboratory values are reported.
Study Sites
Somerset Wetland
The Somerset wetland, located in Somerset County, PA, treats water draining from 12‐year‐old surface mine spoils. It was built in 1984. Originally, seven seeps existed on the property,but a drainage system was installed that collects all drainage into a single pipe that serves asthe influent to the 2 wetland. The system consists of two cells (277 m and 268 M2) connectedin series, each constructed with 30 cm of crushed limestone and 45 cm of mushroom compost.A dense growth of cattails covers both cells.
The site was first sampled in March 1987. Monthly sampling of water and flow rates wasinitiated in November 1988. Water samples were collected from the influent pipe, betweencells, and from the effluent pipe. Flow measurements were made at the influent and effluentpipes. Loading calculations are based on the average of the inlet and outlet flow rates.
Latrobe Wetland
The Latrobe wetland, located in Westmoreland County, PA, treats water draining from bothreclaimed surface spoils and an abandoned drift mine. The wetland was constructed in June1987. Water is collected in a shallow pit and flows down a 30 m long ditch into a wetlandsystem that consists of three rectangular cells in series (695 m2 , 802 m2, and 1301 m2 ) . Thewetland substrate consists of 10 cm of crushed limestone covered with 30‐45 cm of mushroomcompost. Cattails cover about 80% of wetland surface, most of the open area being due tomuskrat activity during the summer of 1988.
Beginning in July 1988, water samples were collected from the influent, effluent andbetween each cell. Flows were measured at the influent and effluent stations beginning inOctober 1988. Periodic problems with leakage of water through a berm in the third cellprevented use of all the chemical and flow data collected from the final effluent station. Wetherefore focused our analytical efforts on the first two cells of the wetland. Loadingcalculations were based on influent flow rates.
In the summer of 1989, extensive modifications were made to the system. The pit, in whichthe seepage is collected before flowing into the wetland, was filled with spent mushroomcompost. Following this modification the water flowing into the wetland had atypicalchemistry (circumneutral pH, high concentrations of dissolved organics and hydrogen sulfide).Data from this period will not be presented. Most of the effects of the modification onwetland influent water chemistry appeared to stabilize in August 1989. Data for August,September and October 1989 are presented. Because of the unusual pretreatment of water atthis site, these data should be interpreted with caution.
Friendship Hill Wetland
The Friendship Hill wetland was constructed by the Bureau of Mines for research purposesduring the summer of 1988. It is located at the Friendship Hill National Historic Site inFayette County, PA. Inflow water to the wetland system is drawn out of Ice Pond Run, a smallfirst order stream that drains an abandoned drift mine about 1 km upstream of the site.
Six wetland cells were constructed. Details of the design are included in a paper by McIntireand Edenborn (1990) in these proceedings. All cells contain 15 cm of gravel covered with 45cm of spent mushroom compost. The cells were planted with cattails in October 1988. Growthresulted in approximately 75% coverage by July 1989.
Data are presented for the summer of 1989 (first growing season) for the three wetland cellsdesignated A2, B2 and C2. The surface areas of the cells are 104 m2, 103 m2, and 123 m2,respectively.
While cells at the Somerset and Latrobe wetland are connected serially (cell 1 flows into cell2), the Friendship Hill cells are parallel. Because all three cells receive water from a commonsource, they can be considered experimental replications. Flow rates to all cells arecontrolled by valves which are monitored and adjusted weekly. Water samples are collectedfrom the common influent pool and from the effluent of each cell.
RESULTS AND DISCUSSION
Somerset Wetland
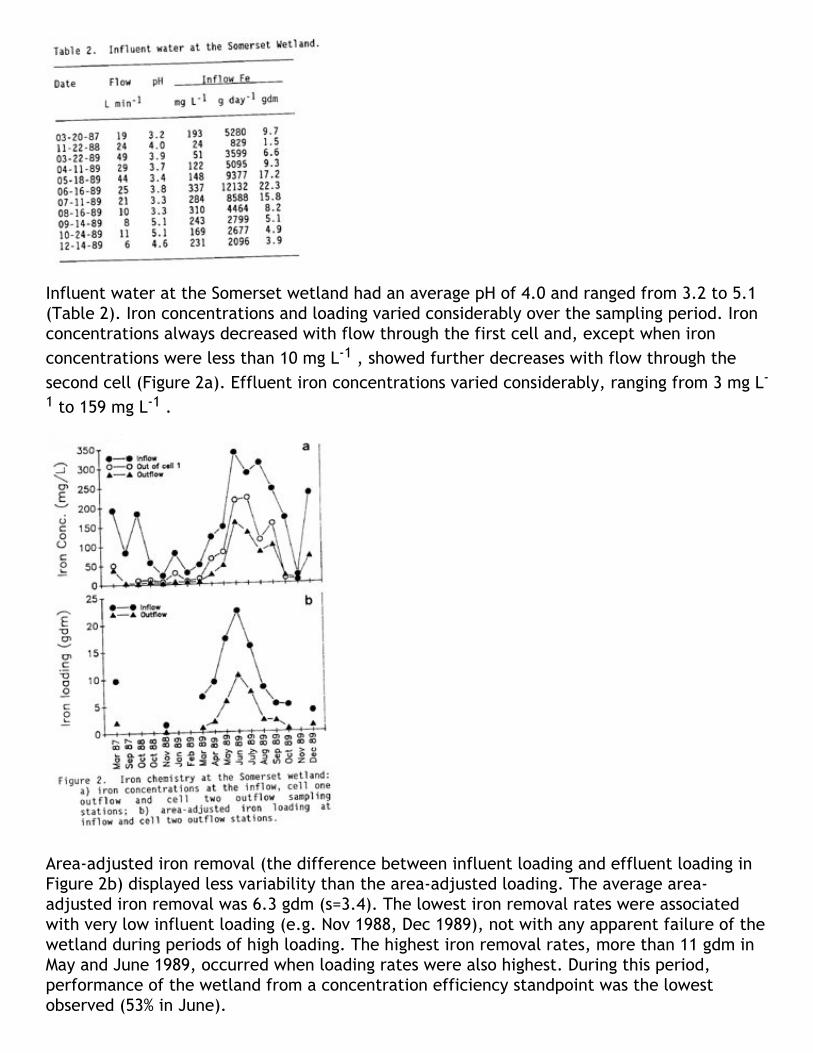
Influent water at the Somerset wetland had an average pH of 4.0 and ranged from 3.2 to 5.1(Table 2). Iron concentrations and loading varied considerably over the sampling period. Ironconcentrations always decreased with flow through the first cell and, except when ironconcentrations were less than 10 mg L‐1 , showed further decreases with flow through thesecond cell (Figure 2a). Effluent iron concentrations varied considerably, ranging from 3 mg L‐1 to 159 mg L‐1 .
Area‐adjusted iron removal (the difference between influent loading and effluent loading inFigure 2b) displayed less variability than the area‐adjusted loading. The average area‐adjusted iron removal was 6.3 gdm (s=3.4). The lowest iron removal rates were associatedwith very low influent loading (e.g. Nov 1988, Dec 1989), not with any apparent failure of thewetland during periods of high loading. The highest iron removal rates, more than 11 gdm inMay and June 1989, occurred when loading rates were also highest. During this period,performance of the wetland from a concentration efficiency standpoint was the lowestobserved (53% in June).
Latrobe Wetland
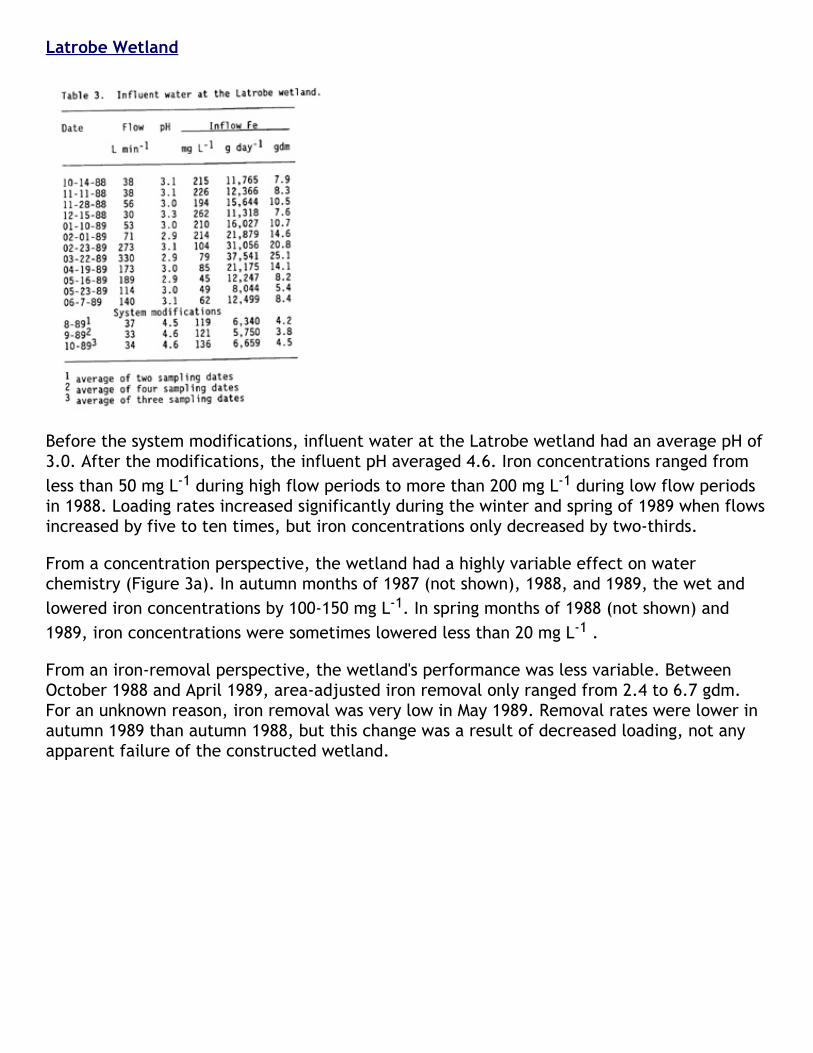
Before the system modifications, influent water at the Latrobe wetland had an average pH of3.0. After the modifications, the influent pH averaged 4.6. Iron concentrations ranged fromless than 50 mg L‐1 during high flow periods to more than 200 mg L‐1 during low flow periodsin 1988. Loading rates increased significantly during the winter and spring of 1989 when flowsincreased by five to ten times, but iron concentrations only decreased by two‐thirds.
From a concentration perspective, the wetland had a highly variable effect on waterchemistry (Figure 3a). In autumn months of 1987 (not shown), 1988, and 1989, the wet andlowered iron concentrations by 100‐150 mg L‐1. In spring months of 1988 (not shown) and1989, iron concentrations were sometimes lowered less than 20 mg L‐1 .
From an iron‐removal perspective, the wetland's performance was less variable. BetweenOctober 1988 and April 1989, area‐adjusted iron removal only ranged from 2.4 to 6.7 gdm.For an unknown reason, iron removal was very low in May 1989. Removal rates were lower inautumn 1989 than autumn 1988, but this change was a result of decreased loading, not anyapparent failure of the constructed wetland.
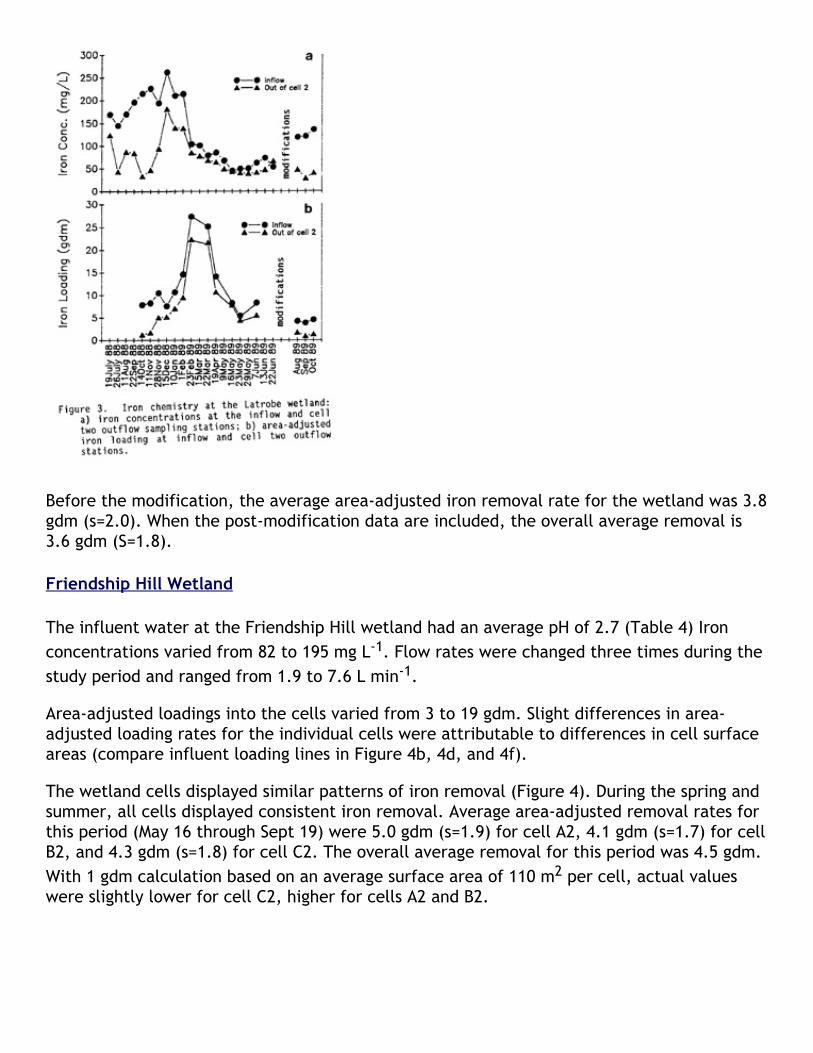
Before the modification, the average area‐adjusted iron removal rate for the wetland was 3.8gdm (s=2.0). When the post‐modification data are included, the overall average removal is3.6 gdm (S=1.8).
Friendship Hill Wetland
The influent water at the Friendship Hill wetland had an average pH of 2.7 (Table 4) Ironconcentrations varied from 82 to 195 mg L‐1. Flow rates were changed three times during thestudy period and ranged from 1.9 to 7.6 L min‐1.
Area‐adjusted loadings into the cells varied from 3 to 19 gdm. Slight differences in area‐adjusted loading rates for the individual cells were attributable to differences in cell surfaceareas (compare influent loading lines in Figure 4b, 4d, and 4f).
The wetland cells displayed similar patterns of iron removal (Figure 4). During the spring andsummer, all cells displayed consistent iron removal. Average area‐adjusted removal rates forthis period (May 16 through Sept 19) were 5.0 gdm (s=1.9) for cell A2, 4.1 gdm (s=1.7) for cellB2, and 4.3 gdm (s=1.8) for cell C2. The overall average removal for this period was 4.5 gdm.With 1 gdm calculation based on an average surface area of 110 m2 per cell, actual valueswere slightly lower for cell C2, higher for cells A2 and B2.
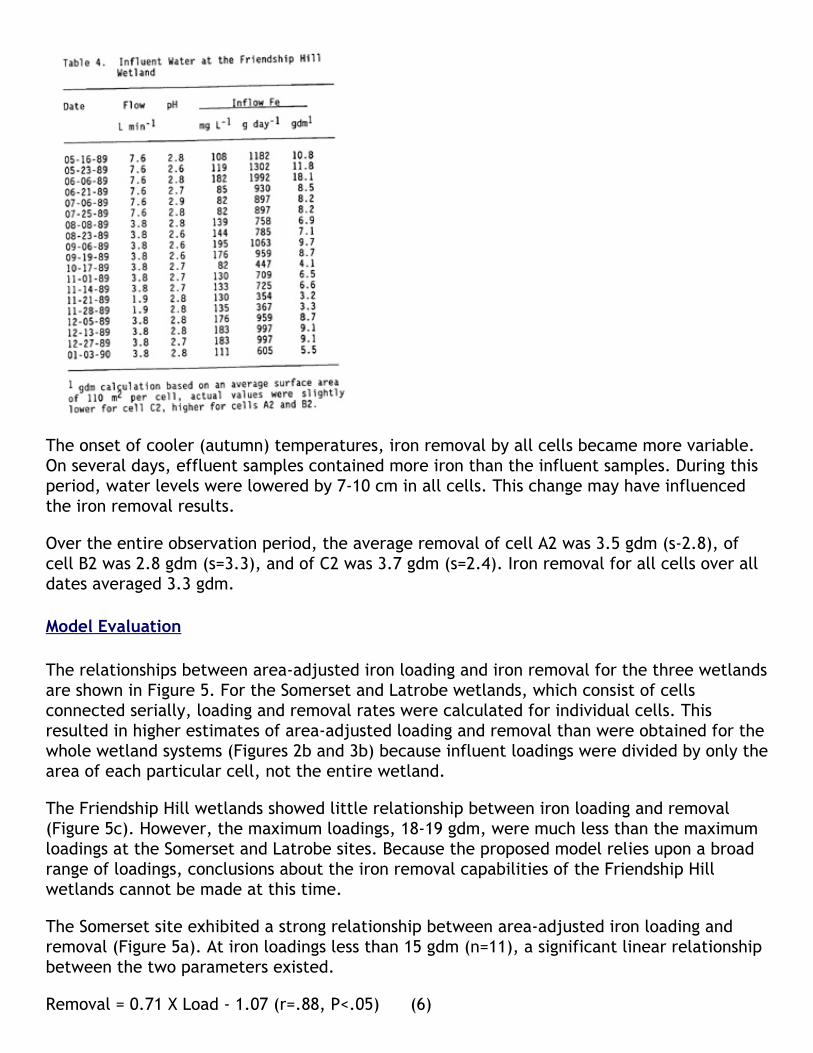
The onset of cooler (autumn) temperatures, iron removal by all cells became more variable.On several days, effluent samples contained more iron than the influent samples. During thisperiod, water levels were lowered by 7‐10 cm in all cells. This change may have influencedthe iron removal results.
Over the entire observation period, the average removal of cell A2 was 3.5 gdm (s‐2.8), ofcell B2 was 2.8 gdm (s=3.3), and of C2 was 3.7 gdm (s=2.4). Iron removal for all cells over alldates averaged 3.3 gdm.
Model Evaluation
The relationships between area‐adjusted iron loading and iron removal for the three wetlandsare shown in Figure 5. For the Somerset and Latrobe wetlands, which consist of cellsconnected serially, loading and removal rates were calculated for individual cells. Thisresulted in higher estimates of area‐adjusted loading and removal than were obtained for thewhole wetland systems (Figures 2b and 3b) because influent loadings were divided by only thearea of each particular cell, not the entire wetland.
The Friendship Hill wetlands showed little relationship between iron loading and removal(Figure 5c). However, the maximum loadings, 18‐19 gdm, were much less than the maximumloadings at the Somerset and Latrobe sites. Because the proposed model relies upon a broadrange of loadings, conclusions about the iron removal capabilities of the Friendship Hillwetlands cannot be made at this time.
The Somerset site exhibited a strong relationship between area‐adjusted iron loading andremoval (Figure 5a). At iron loadings less than 15 gdm (n=11), a significant linear relationshipbetween the two parameters existed.
Removal = 0.71 X Load ‐ 1.07 (r=.88, P<.05) (6)

As loading increased beyond 15 gdm, no further increase in removal was observed.
Removal = 0.17 X Load + 6.30 (r=.45, P>.05) (7)
The average removal of these nine high‐loading observations was 10.6 gdm (s.e. = 1.1). Thisvalue is an estimate of the iron removal capability of the Somerset wetland.
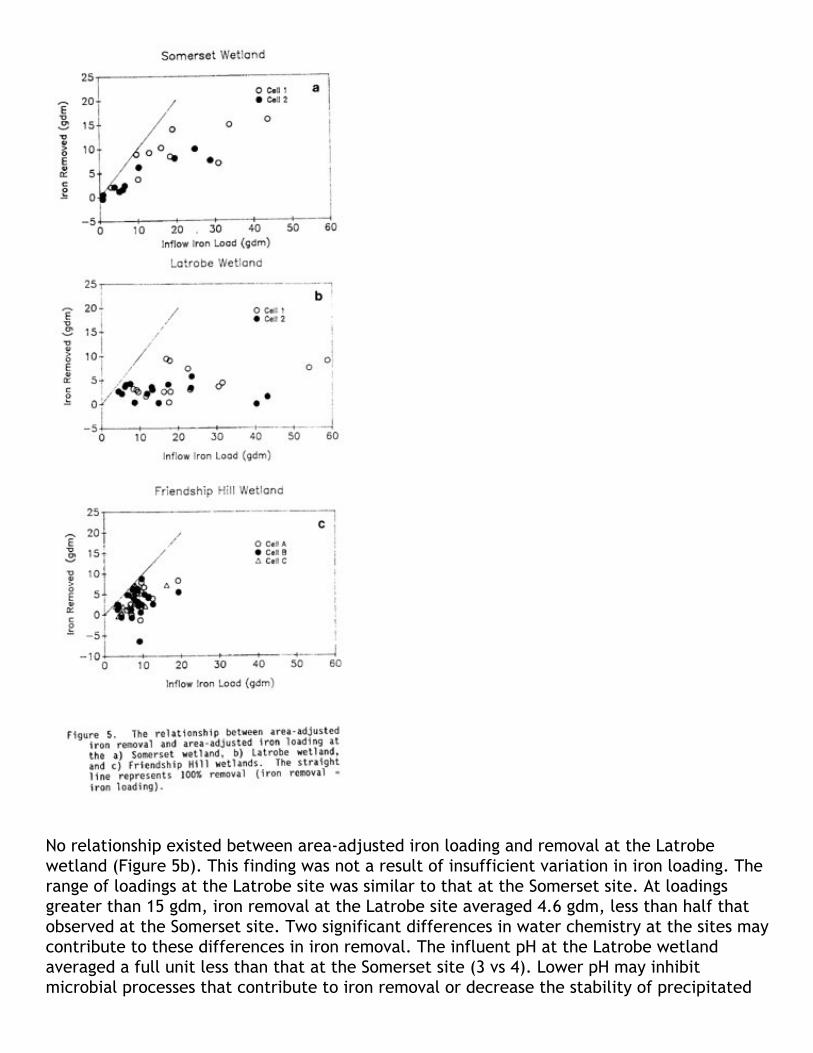
No relationship existed between area‐adjusted iron loading and removal at the Latrobewetland (Figure 5b). This finding was not a result of insufficient variation in iron loading. Therange of loadings at the Latrobe site was similar to that at the Somerset site. At loadingsgreater than 15 gdm, iron removal at the Latrobe site averaged 4.6 gdm, less than half thatobserved at the Somerset site. Two significant differences in water chemistry at the sites maycontribute to these differences in iron removal. The influent pH at the Latrobe wetlandaveraged a full unit less than that at the Somerset site (3 vs 4). Lower pH may inhibitmicrobial processes that contribute to iron removal or decrease the stability of precipitated

iron oxyhydroxide and sulfide compounds. Close scrutiny of the data results in contradictoryevidence with regard to this hypothesis. The highest iron removal rates at the Somerset sitewere not associated with the highest influent pH values (which ranged as high as 5.1, seeTable 2). However, at the Latrobe site the highest iron‐removal rates occurred when thewetland was also increasing the pH of water as it flowed through the wetland (Hedin andHammack, in review).
A second difference between the Somerset and Latrobe sites is the makeup of the high ironloadings. At the Somerset site, high loadings (>15 gdm) were due to high concentrations ofiron (122‐337 mg L‐1) combined with moderate flow rates (10‐44 L min‐1). At the Latrobe site,high loadings were dye to high flows of drainage (273‐330 L min‐1 ) combined with moderateiron concentrations (79‐104 mg L‐1). It is possible that iron removal rates are correlated withiron concentration. Higher iron removal rates may occur at higher iron concentrations. If thishypothesis is correct, then it may be necessary in future analyses of wetland performance toseparate loading estimates into their flow and concentration components.
A common finding at all sites was that complete iron removal (< 1 mg L‐1 ) did not occur,even at very low loadings. Thus, the capability to remove 10 gdm at high loadings does nottranslate into complete iron removal at loadings less than 10 gdm. At the Somerset site, highloading events resulted in an average removal of 10.6 gdm. At loadings less than 15.0 gdm,iron removal averaged 54% of the inlet load. This decreased iron removal capability cannot beattributed to simply a concentration effect as several low loadings occurred‐when ironconcentrations were greater than 100 mg L‐1 .
Implications for Wetland Sizing
If the data presented here represent a crude estimate of iron removal capabilities inconstructed wetlands, how does this bode for systems being built today using the originalflow‐dependent criteria? Sizing calculations for several hypothetical systems are shown inTable 5. Sizing estimates are made based on the original flow criteria and loading criteriadeveloped from the data presented in this paper. We assume with the loading criteria thatvariation in iron removal results from pH effects, and that wetlands with pH 4 influents canremove 10 gdm of iron, while wetlands with pH 3 influents remove only 4 gdm of iron.
Comparisons of wetland sizes based on flow and loading criteria indicate that wetland size

estimates differ considerably depending on iron loading and pH (Table 5). For the highlycontaminated drainage shown in systems C and D, the loading criteria suggest larger wetlandneeds than are suggested by either flow criterium. At pH 3, the methods differ by more than300%.
For low flows of moderately contaminated water (systems A and B), the largest wetland sizesare produced by the 15 m2 flow criterium. This finding probably reflects the fact that the 15m2 criterium was developed empirically from the size:flow relationships of wetlands thatsuccessfully lowered iron concentrations to regulatory levels. The iron removal criteriadeveloped in this paper were derived from high‐loading situations. Because iron removalcapabilities appeared to decrease under low‐loading situations, it is possible that larger areasof wetland are needed for removal of the last 10‐20 mg L‐1 of iron.
These calculations should be considered preliminary, particularly for the low pH systems.Clearly, more data from these and other systems are necessary to confidently characterizethe iron removal capabilities of constructed wetlands. Papers in this session by Kepler (1990)and Stark et al. (1990) should provide additional iron removal information for sites with pH 5and pH 6, respectively.
Literature Cited
Brodie, G. A., Hammer, D. A. and D. A. Tomljanovich. 1988. Constructed wetlands for aciddrainage control in the Tennessee Valley. In: Mine Drainage and Surface Mine Reclamation,Vol. I: mine Water and Mine Waste, BuMines IC 9183, pp. 325‐331.
Girts, M. A., R. L. P. Kleinmann and P. E. Erickson. 1987. Performance data on Typha andSphagnum wetlands constructed to treat coal mine drainage. In: Proc. of the 8th AnnualSurface Mine Drainage Task Force Symp., Morgantown, WV.
Kleinmann, R. L. P., Brooks, R., Huntsman, B. and B. Pesavento. 1986. Constructing Wetlandsfor the Treatment of Mine Water. Mini‐course Notes, 1986 National Symposium on SurfaceMining, Hydrology, Sedimentology, and Reclamation, University of Kentucky, Lexington, KY.
Kepler, D. 1990. Wetland sizing ‐‐ design and treatment effectiveness. In J. Skousen and J.Sencindiver (eds.) Proceedings of the 1990 Mining and Reclamation Conference andExhibition, Charleston, WV.
McIntire, P. and H. Edenborn. 1990. The use of bacterial sulfate reduction in the treatment ofdrainage from coal mines. In J. Skousen and J. Sencindiver (eds.) Proceedings of the 1990Mining and Reclamation Conference and Exhibition, Charleston, WV.
Stark, L. R., Kolbash, R. L., Webster, H. J., Stevens, S. E., Dionis, K. A. and E. R. Murphy.1988. The Simco #4 wetland: biological patterns and performance of a wetland receiving minedrainage. In: Mine Drainage and Surface Mine Reclamation, Vol. I: Mine Water and MineWaste, BuMines IC 9183, pp. 332‐344.
Stark, L. R. , Stevens, S. E. , Webster, H. J. , and W. Wenerick. 1990. Iron loading, efficiency,and sizing in a constructed wetland receiving mine drainage. In J. Skousen and J. Sencindiver

(eds.) Proceedings of the 1990 Mining and Reclamation Conference and Exhibition,Charleston, WV.