ska’ana - university of wisconsin–madisoncanoe.slc.engr.wisc.edu/design papers/2015 -...
TRANSCRIPT

Ska’ana
University of Washington
ASCE Concrete Canoe
Design Paper 2015
National Competition
Clemson, South Carolina
June 20-22, 2015

2014-2015
Ska’ana | i
Table of Contents Executive Summary ...................................................................................................... ii
Project Management ..................................................................................................... 1
Organization Chart ........................................................................................................ 2
Hull Design ................................................................................................................... 3
Structural Analysis ........................................................................................................ 4
Testing and Development .......................................................................................... 5-7
Construction ............................................................................................................... 8-9
Project Schedule.......................................................................................................... 10
Design Drawing .......................................................................................................... 11
List of Figures
Figure 1: 2015 Program Innovation. ............................................................................. ii
Figure 2: Critical Path. .................................................................................................. 1
Figure 3: Project Work-hours by Category. .................................................................. 1
Figure 4: Project Revenue vs. Expenses. ...................................................................... 1
Figure 5: Hull Profile of Ska’ana.................................................................................. 3
Figure 6: Canoe-Beam Moment Demands. .................................................................. 4
Figure 7: Bending Direction of Floor. .......................................................................... 4
Figure 8: Local Floor Moment Demands...................................................................... 4
Figure 9: Cross Section of Three Layer Design............................................................ 5
Figure 10: Selection of Optimal Structural Concrete. .................................................. 5
Figure 11: Selection of Lightweight Thickness. ........................................................... 6
Figure 12: Cylinder, Cubes, and Wire. ......................................................................... 6
Figure 13: Placing Assessment. .................................................................................... 7
Figure 14: Composite Panel Testing. ............................................................................ 7
Figure 15: Mold Fabrication Stages. ............................................................................. 8
Figure 16: Floor Layer Schematic. ............................................................................... 8
Figure 17: Reinforcing Layout...................................................................................... 8
Figure 18: Anchor and Sawn Channel. ......................................................................... 9
Figures E1-E4: Bow Damage at Regional Conference............................................... E2
List of Tables
Table 1: Ska’ana Specifications .................................................................................... ii
Table 2: Ska’ana Material Properties ........................................................................... ii
Table 3: Failure State Safety Factors ............................................................................ 4
Table 4: Comparison to Baseline Mixes ....................................................................... 5
List of Appendices
APPENDIX A: References .................................................................................... A-1-2
APPENDIX B: Mixture Proportions ..................................................................... B-1-4
APPENDIX C: Bill of Materials............................................................................... C-1 APPENDIX D: Example Structural Calculation ................................................... D-1-2
APPENDIX E: Repair Procedures Report ............................................................. E-1-2
Cover picture: “Orca” by Kim is licensed under CC BY 2.0 and can be found at https://flic.kr/p/8cR5Kg.

Executive Summary 2014-2015
Ska’ana | ii
Table 1. Ska’ana Specifications The origin of the Orca whale embodies a legend of sustainability for the native
Haida people of the Pacific Northwest. The story begins with a man who raises
two wolf pups he finds on a beach. Once grown, the wolves swim into the ocean
daily to hunt whales for food. Each day the wolves would hunt, accumulating
far too much food. The Great Above Person saw this wastefulness and punished
the wolves by creating a fog while they were hunting at sea, rendering them
unable to hunt or return to the shore. These wolves remained at sea,
transforming into the Orca whales of today. The Haida people refer to Orca
whales as “ska’ana,” or supernatural spirit.
As descendants of wolves, the Huskies related to this legend and built the 2015
team around reducing waste and learning from the past. By reflecting on the 2013 and 2014 competitions, the
2015 program set out to increase responsibility in finance, safety, sustainability, and quality assurance. The
University of Washington presents the 2015 canoe, Ska’ana, which represents the power of the Orca and the
innovation of the 2015 Huskies.
Located in Seattle, the University of Washington
Concrete Canoe Team competes in the Pacific Northwest
ASCE Student Conference. In the past three years at the
Conference level, the University of Washington placed
2nd
overall in 2012, 1st in 2013, and 1
st in 2014. At the
National Competition in 2013 and 2014, the team placed
16th
and 18th
respectively, credited to strong paddlers and
a fast canoe design. One of the highlights included the
2014 Design Paper which narrowly missed top ten by
placing 11th
and set the standard for future competitions.
The Huskies once again look to excel at the national level
with an impressive performance.
Ska’ana’s hull features a lightweight, asymmetric design
with a well-balanced rocker and redefined cross-section
geometry. Two reinforcing types are decoupled and
efficiently resist both canoe-bending and local floor
loads. The composite buildup featured in Ska’ana is
based on two structural layers sandwiching a lightweight layer for an ultra-lightweight and durable composite
structure. Tables 1 and 2 summarize Ska’ana’s basic specifications and material properties. For the first time in
recent history, the Huskies successfully integrated a lightly post-tensioned repair system to prevent tension
cracking in the canoe gunwale.
This year the Huskies aim high for the National Competition incorporating innovations across the program.
With the breakthroughs summarized in Figure 1, the Huskies proudly deliver Ska’ana, a canoe crafted with a
45% faster placing, a 55% cost reduction, and a 45% lighter weight. The Huskies look forward to a great
competition and the program’s continued success.
Table 2. Ska’ana Material Properties
Project Management Financial strategies Knowledge transfer workshops Critical Design Review Seasonal newsletter Final Product Unveiling Hosted high school students
Design Asymmetric hull design Double curvature in stern section Mold parting features in forms High range water reducer Understanding composite behavior Post-tensioned repair system
Construction Recycled 2014 ESP mold Workspace inventory Improved safety procedures Material mass flows Plastic densities per batch Curved underside of gunwales
Figure 1. 2015 Program Innovation

Project Management 2014-2015
Ska’ana | 1
Figure 2. Critical Path
O&D Meetings Mix Development Mix Selection Structural Design Critical Review Final Prep. Concrete Placing Curing Canoe Finishing Floatation Test Critical Repairs Product Unveiling Regional Conf. National Prep. Ship Equipment National Comp.
10/15/14 12/4/14 12/5/14 1/5/15 1/8/15 1/16/15 1/17/15 1/30/15 4/3/15 4/4/15 4/8/15 4/9/15 4/17/15 6/9/15 6/10/15 6/20/15
Critical Path
Construction 1,400
Project Hours 2,870hrs
Mix Design 450
Financing 370
Academics 330
Structural 250
Hull Design 280
Outreach 120
Figure 3. Project Work-hours by Category
$6,400 Regional Conf.
$1,645 Construction
$1,600 Trailer Repairs
$500 Outreach
Project Expenses $23,375
$13,230 National Comp.
Project Revenue $37,370
$8,800
$14,350
$8,550
$5,670
Personal Donations
Business Donations
Material & Services
Grants
Figure 4. Project Revenue vs. Expenses
To begin the 2015 project, Objective & Deliverable (O&D) meetings occurred in the
first weeks of class. The O&D meetings set team-wide expectations, responsibilities,
and a clear direction which allowed horizontal and autonomous operations. To secure
smooth operations, weekly lead meetings covered objectives, watch items, and
mitigation strategies. Following lead meetings, general meetings covered milestones,
resource allocation, and design discussions. The 2015 management discussed
direction and rationale throughout the design and construction of Ska’ana.
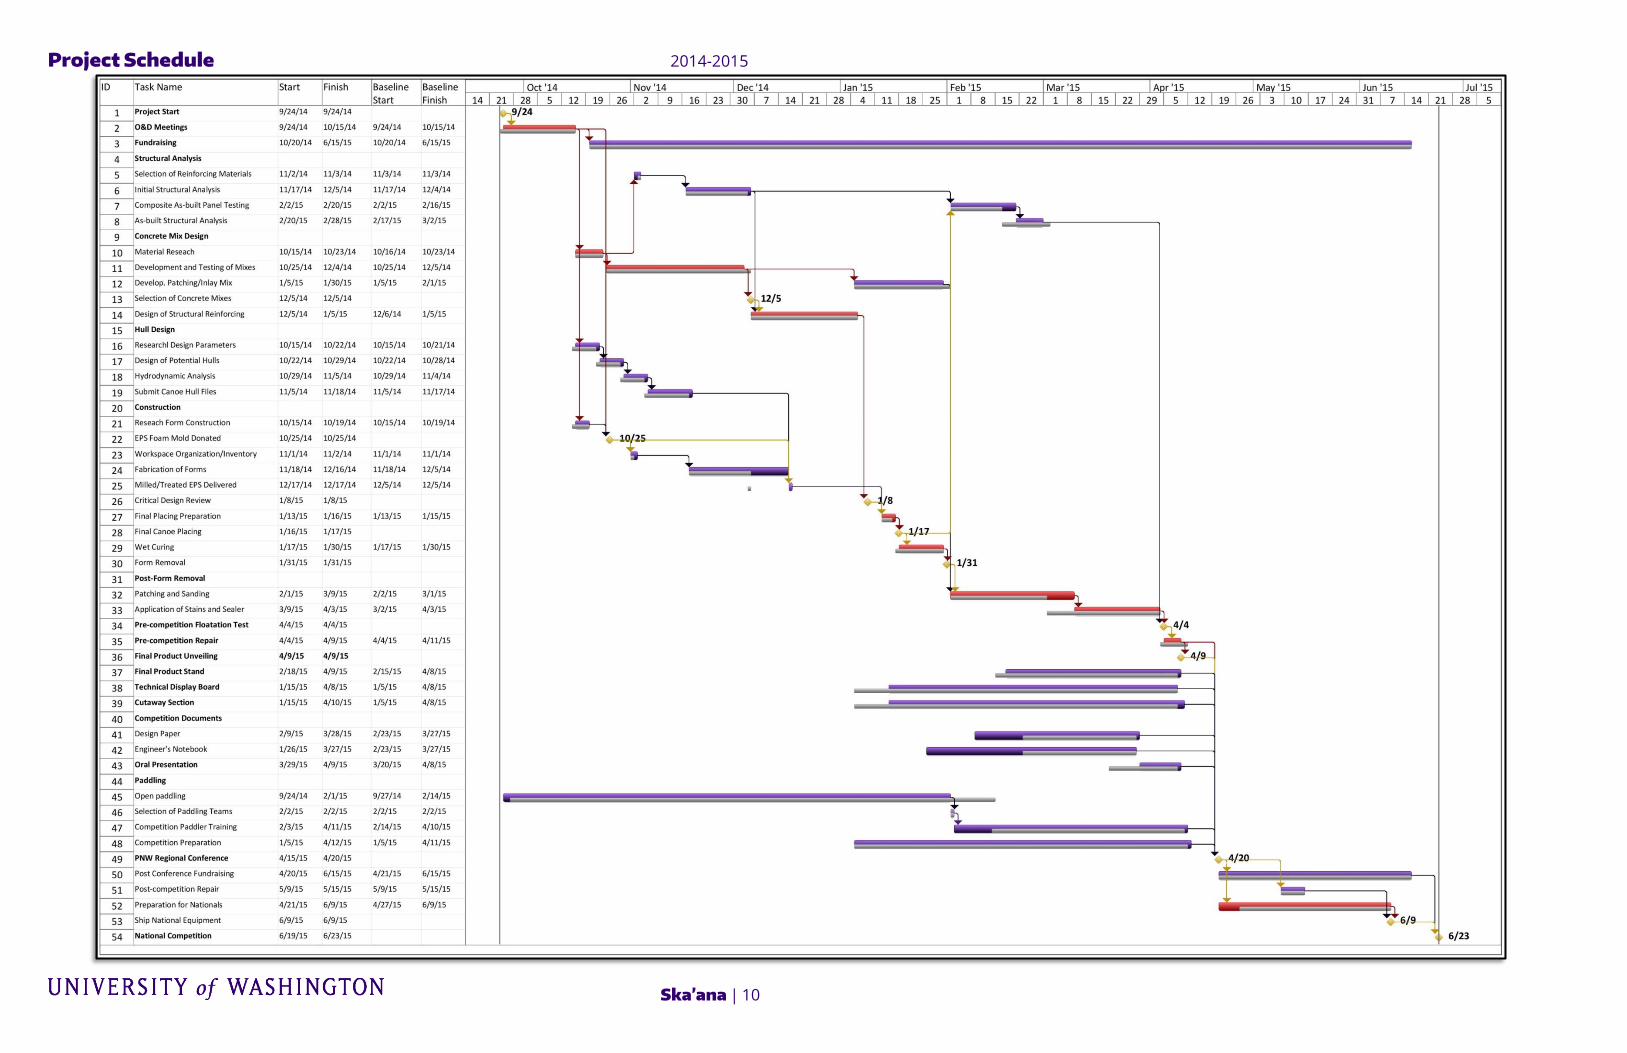
Critical milestones, emphasized in Figure 2, maintained project flow while design
and construction tasks ran in parallel chains to shorten overall project schedule. Prior
to placing, a Critical Review was held with industry experts to verify and refine
design rationale and construction sequences. To further shorten the critical path,
composite panel testing was conducted after canoe placing as a noncritical chain.
Historically, composite testing is the most material/time-intensive test; however, this
year only one as-built panel set was fabricated and tested which reduced significant
material consumption and time. Prior to placing, detailed structural analysis
was conducted to substantiate local strengths and as-built flexural test results
were as expected. One significant change to the 2015 schedule was moving
canoe placing from late-November to mid-January. Placing in January
allowed more resources for design, preparation, and a quicker strength gain
due to warmer temperatures. Because a later placing decreased canoe
finishing time, more resources were allocated to patching/sanding and an
aesthetic design which took 60% less time was selected. Despite gunwale
tension and floatation failures during the Floatation Test, no delays to the
critical path were experienced because adequate slack was introduced before
the Product Unveiling; the Unveiling milestone acted as a final net to catch
discrepancies prior to the Regional Conference. Because of the risk
mitigation and technical expertise of the 2015 team, deviations to the original
schedule did not affect the completion date. The breakdown of project work-hours is shown in Figure 3.
Financial resources were spent on competition
registration and personnel/equipment transportation. Less
than 10% of the resources went towards materials and
construction because most materials were donated.
Funding up until the Regional Conference was covered
by local business donations. After the team qualified for
the National Competition, the project budget doubled and
funding was earned through a rigorous crowdfunding
program. Additionally, grants from local organizations
were pursued throughout the project. A comparison of
project revenue and expenses is shown in Figure 4.
Safety and quality were treated as critical team-wide responsibilities. The 2015 safety program featured testing
equipment/tool training, Job Hazard Analysis Forms, workday safety orientations, and a safety equipment
station. As for quality, multiple assurances were introduced in the 2015 program. Major practices included
taking plastic densities of concrete batches for real-time feedback, providing hands-on concrete placing
trainings, and assigning experienced members as mentors and quality personnel. Maintaining a clean workspace
was a major objective for both safety and quality reasons. The 2015 safety and quality assurance procedures
were vital reasons Ska’ana was delivered at 178 pounds with astounding finishing detail and with zero injuries.

Organization Chart 2014-2015
Ska’ana | 2
List of Members
PA: Paddling AS: Aesthetics SD: Structural Design FI: Finances HD: Hull Design MD: Mix Design CO: Construction OR: Outreach TR: Transportation
Leadership Team
Nigel Lyons Project Manager Structural Design
Robert Frankel Finances
Matt Hazenberg Transportation
Kim Tsai Aesthetics
Nick Orsi Construction
Paddling
Ian Dahl Construction
James Neher Mix Design
Hull Design
Marissa Karpack Mix Design
Mark Chen Outreach
Paddling

Hull Design 2014-2015
Ska’ana | 3
The 2015 design team had a clear picture of the previous design’s performance because the same hull was
featured for two consecutive years with Undammed (2013) and The Lady (2014). The previous designs achieved
great straight-line speed due to very long and narrow hulls (2 feet wide by 21.5 feet long). However, the overall
control of the canoe was poor because the canoe easily over steered, exhibited very poor tracking capabilities,
and demonstrated sliding movements of the stern section. The poor control was attributed to the very soft stern
chine, extremely high 4 inch stern rocker, and a very low 0.5 inch bow rocker. With these features in mind, the
2015 team design intended to increase control by reducing turning capabilities while still maintaining straight-
line speed.
The design team researched basic geometric canoe performance parameters and reviewed photographs of
national ranking concrete canoes for inspiration and general hull shapes. Four initial designs were drafted by
altering The Lady based on qualitative adjustments. Two designs were eliminated based on general look and
constructability issues (too narrow of end sections). Of the two remaining designs, a final design was
quantitatively selected through a geometric analysis and comparison to the previous years. Straight-line speed
was compared by assessing wetted surface areas, entry angles, and prismatic coefficients (Sailboat, Winters).
Areas and moments of inertia of the lateral water plane were compared to evaluate turning and tracking, which
were inversely proportional. Rolling stability was assessed by the moments of inertia of the transverse water
plane about the longitudinal axis.
The top profile was changed to maintain and increase straight-line speed. The asymmetric top profile features
an increased stern curvature, a sharper bow, and a beam placed 13 inches aft. Changes to the keel were meant to
increase the control and tracking of the canoe. The canoe rocker was balanced by reducing the stern rocker from
4 to 2 inches and by increasing the bow rocker from 1 to 2 inches. Additionally, to improve the balanced control
of the canoe, the flat midsection was moved to be more centered and elongated from 86 to 129 inches. These
features can be observed in Figure 5. Cross section changes served multiple purposes including increased
buoyancy, increased tracking, a more aft steerer, and improved concrete placing and mold parting.
Because the rocker was reduced and the lateral water plane was increased, turning capabilities of the canoe were
reduced. However, redefined chines and mid sections of Ska’ana in conjunction with a veteran paddling team
will ensure competitive competition turns. As a new design, Ska’ana is fast, lightweight, and looks to dominate
the waters just as its powerful name embodies.
Figure 5. Hull Profiles of Ska’ana
Improved stern curvature Sharper bow Beam 13 inches aft

Structural Analysis 2014-2015
Ska’ana | 4
-6
-4
-2
0
2
-10 -8 -6 -4 -2 0 2 4 6 8 10
Mo
men
t (k
-in
)
Length Along Canoe (ft)
Display
Figure 6. Canoe-Beam Moment Demands
2-Male
Coed
Figure 7. Bending Direction of Floor
Transverse Axis
Longitudinal Axis
-450
-300
-150
0
150
300
0 3 6 9 12 15 18
Mo
men
t (l
bs-
in)
Width Across Floor (in)
No Paddler
Figure 8. Local Floor Moment Demands
Balanced
Leaning
Demands for canoe-beam shear/bending were determined from vertical
and rotational equilibrium between paddlers, self-weight and buoyancy.
Buoyancy along the length of the canoe was a function of mean water
draft and canoe inclination. A spreadsheet iterated draft and inclination
until vertical and rotational equilibrium were met. Internal shear/bending
was determined after support conditions were satisfied. Load cases
included 2-Male (controlling), Coed, and Display (shown in Figure 6).
Long distance transportation within a vehicle was neglected because a
uniformly supported condition was assumed. See Appendix D for a
simplified hand verification of 2-Male demands.
To analyze stresses imparted from the canoe-beam demands, the following assumptions applied: sections
remained planar after bending, proportional stress-strain relationships, and negligible reinforcing stiffness. A
spreadsheet calculated section properties, and demands were multiplied by the applicable moduli to determine
internal stresses of a given cross section (see Appendix D for programming and applicable equations). Tension
stresses were then compared to the minimum of adjusted split cylinder tests or the rupture modulus estimated
per ACI 9.5.2.3 (selected limit, see Appendix D). Shear stresses were compared with allowables based on ACI
11.1.2.1. Safety factors are shown in Table 3 for canoe-beam behavior.
Demands on the canoe floor due to local paddler/hydrostatic loads were
found by analyzing one-way bending of a panel. Floors bended about the
longitudinal canoe axis as the walls provided rigidity against bending
about the transverse direction (comparable to one-way slabs).
Additionally, local reinforcing was stiffer in the transverse direction
which transferred floor loads to the walls. Figure 7 shows the bending
behavior of the canoe floor and annotates the canoe axes. The models
were fixed at both ends and lateral loads on the walls were applied as
equivalent end moments on the panel. Load cases included the following:
a single, asymmetric point load representing a leaning paddler
(controlling), two equal point loads centered for a balanced paddler, and a
no paddler case with a uniform hydrostatic pressure. The local floor
demands are shown in Figure 8, and safety factors are presented in Table
3. Stress demands in the floors were calculated with similar assumptions
in canoe-beam analysis while capacities were based on as-built composite
tests.
Tension failure in the gunwales corresponded to a low factor of safety
because the original design used conservative allowables prior to
checking ACI recommendations. Construction variance in the gunwales resulted with tension cracks during the
pre-competition floatation test. However, Ska’ana was not at risk of ultimate failure because local reinforcing
was carried 8 inches up the walls. To prevent further cracking, a steel wire rope was lightly post-tensioned to 25
pounds in each gunwale. The amount of post-tensioning force required to bring gunwale stress to the rupture
limit was 12 pounds. A factor of safety of 2.0
was applied to account for variance and
prevent further cracking. Despite critical pre-
conference repairs, the 2015 team witnessed
Ska’ana endure all competition demands and
dominate the waters at the Regional
Conference.
Table 3. Failure State Safety Factors

Testing and Development 2014-2015
Ska’ana | 5
Table 4. Comparison to Baseline Mixes
Figure 9. Cross Section of Three Layer Design
Structural
Lightweight
0
500
1000
1500
2000
2500
3000
0 500 1000 1500 2000 2500
Stre
ngt
h-S
pec
ifc
Gra
vity
Rat
io (
7-d
ay, p
si)
Cube Strength (7-day, psi)
Figure 10. Selection of Optimal Structural Mix
The development of the 2015 concrete mixes focused
on reducing density to meet the new floatation
requirements and improving workability for better
quality control during placing. Strength, density, and
workability were optimized by iterating several design
parameters. These parameters included water-cement
ratio, paste content, cementitious material replacement, aggregate gradation, and admixture dosage. Additional
consideration was given for streamlined design methods and improved documentation for future teams. Despite
numerous challenges, the 2015 team developed concrete mixes that led to one of the lightest and most cost-
effective canoes in recent years. A comparison of this year’s structural concrete mix to those of 2014 is seen in
Table 4; values in parentheses are for the lightweight concrete mix.
Ska’ana’s mix design team faced several obstacles at the beginning of the 2015 program. First, heavy
expenditures for the 2014 National Competition left the mix design team with a more restrictive budget than
previous years. Second, the excessive weight of last year’s canoe was attributed to poor mixture consistency and
control when placing. The poor placing control necessitated major alterations in the concrete design and placing
procedure. Lastly, the retirement of longtime faculty advisor Don Janssen created a large gap of knowledge and
experience. His retirement forced the design team to develop a novel approach to mixture design. The team
used these challenges to motivate improvements in responsible material usage, quality assurance, and
documentation for future years.
After considering alternatives, the team decided to build upon the
2013 and 2014 three-layer composite system, using previous
mixes as baselines. In the previous two years, the Huskies
implemented a three-layer composite system. The composite
system employed a variation of structural and lightweight mixes,
as illustrated in Figure 9. This build-up allows for optimization of
the mixes to match the varying strength requirements throughout
the wall and floor of the canoe. Thin high strength outer and inner
layers provide efficient localized flexural strength in the areas experiencing the highest stresses. A low density
middle layer maintains a low composite density in order to reduce canoe weight and increase buoyancy forces
when fully submerged and flooded. The Lady featured different inner and outer mixes with air entraining
included in only the inner mix. Ska’ana utilized one structural concrete mix for the inner and outer layers with
The Lady’s interior structural serving as a baseline. The reduction in both material costs and personnel hours
outweighed any minor optimizations that could be attained by
development of different inner and outer structural mixes.
The development team planned weekly lab sessions to analyze
results and determine variables to test. To account for
scheduling risk, a new design approach was implemented for
the structural mix which facilitated the concurrent development
of the structural analysis and mix design. Instead of developing
a mix based on stress specifications from the structural analysis
as in the past, the team maximized the strength-density ratio
with the intent of selecting the canoe thicknesses to meet the
demands determined by analysis, as seen in Figure 10.
Preliminary analysis set a maximum limit of 1500 psi on the 7-
day strength. Above this strength, the calculated layer thickness
required to meet strength demands was too thin to be feasibly
placed, and thus stronger, denser mixes were not considered.

2014-2015
Ska’ana | 6
Figure 11. Selection of Lightweight Thickness
0.0
0.5
1.0
1.5
2.0
2.5
3.0
0 0.2 0.4 0.6 0.8 1 1.2
Per
form
ance
Sco
re
Lightweight Concrete Thickness (inches)
Figure 12. Cylinders, Cubes, and Wire
Thickness of the lightweight middle layer was selected based on
balancing structural demands, density to pass the floatation test,
and low overall weight favorable for racing. Structural layers
were kept to a minimal 0.125 inch to maintain a low specific
gravity, while the thickness of the middle layer was varied. A
decision matrix was developed comparing desired values of
specific gravity, weight, and local safety factors to their calculated
counterparts based on the variation of the lightweight mix
thickness. Performance scores were assigned based on the ability
of each mix to achieve the desired values. Shown in Figure 11, the
thickness of lightweight concrete was selected as 0.5 inches.
Test samples consisted of 2 inch cubes used for compression and
specific gravity and, 3x6 inch cylinders used for split tensile
strength (Figure 12). Composite panels were used for final
verification of the built member. Testing methods included standard and
modified versions of ASTM C109 for compressive strength, C496 for tensile
strength, C78 and C293 for composite strength, C138 for specific gravity, and
C1437 for slump. Cube compression strengths were factored by 0.8 to account
for overestimates of strengths due to friction along the boundaries and the
nature of cube failure planes (Mackenzie). The cube failure planes can be seen
in Figure 12. Composite as-built panels were tested at the panel halves and
thirds to determine flexure and shear responses as shown on the next page in
Figure 14. For quality assurance, overconsolidated samples were prepared to
measure worst case specific gravities as an upper bound for hand-placed
consolidation in the actual canoe. In addition to typical slump measurements,
the team performed qualitative comparisons of workability by placing on
vertical and curved surfaces to simulate canoe placing conditions as shown in
Figure 13. In addition to concrete tests, samples of the 0.125 inch steel wire
rope were also tested in tension to verify the strength of the cable and crimped
aluminum ferrules (Figure 12). The slip-critical ferrules failed within 3% of 800
pounds in all samples.
Materials used in Ska’ana’s concrete mixes mimic those of previous years due
to availability of leftover materials and familiarity with their design properties.
White Portland Cement was used as the primary cement in each mix for its
aesthetic qualities, and Ground Granulated Blast Furnace Slag was used as the
primary cementitious material replacement for its low density and reduced
water demand. Metakaolin was added due to its fineness compared to other
cementitious materials and resulting improvement of particle gradation, while
CTS Komponent was utilized to reduce shrinkage of the concrete (UW, 2014).
Slag proportioning was increased by 7% for the structural, inlay, and patching
mix, which decreased density, allowed for reductions in water, and improved
the sustainability of the mixes without decreasing strength (WHRP, 2007). Higher replacements were
considered, but a sharp reduction in efficiency was observed. For the patching mix, Metakaolin was also
increased to improve workability and flow, while additional CTS Komponent was increased to mitigate surface
cracking on the exterior when the patching mix was applied in thin layers with large exposed surface area.
Similar changes were avoided in the other mixes due to observed reductions in strength. The consistency of the
lightweight mix was found to be highly sensitive to changes in cement proportioning and was unchanged.

2014-2015
Ska’ana | 7
Figure 13. Placing Assessment
Figure 14. Composite Panel Testing
Lightweight, spherical aggregates included four different diameters of
Poraver expanded glass granulate and Elemix lightweight synthetic particles.
Poraver in 0.1-1 mm range was used every mix, with the exception of the
patching mix, which used 0.04-0.125 mm Poraver exclusively for improved
ability to fill small voids. Elemix was included in the lightweight mix because
of its extremely low specific gravity of 0.04, but excluded from all other
mixes due to its low strength for the structural mix and its visibility for the
inlay and patching mixes. Additionally, the lightweight mix features 8 mm
chopped fiberglass fibers for improved durability of the lightweight cellular
structure (UW, 2014). The aggregate gradation was refined from previous years to fit a transformed Fuller’s
Curve with the typical assumed exponent of n = 0.5 (Shakhmenko). This new gradation was very effective and
led to an approximately 7% increase in the 7-day strength-specific gravity ratio of the structural mix and
significant reductions in the density of the lightweight mix due to higher Elemix proportioning.
Many admixtures were maintained from the 2014 design: Daraweld C latex polymer was used in all mixes to
improve bonding between concrete layers and improve tensile strength, Daravair 1000 liquid air-entrainer was
used in the structural mix, while Rheocell 30 liquid foaming agent was used in the lightweight mix to achieve
extremely high air contents. No air-entraining admixtures were used in either the patching or inlay mixes in
order to facilitate a smooth exterior for reduced drag and aesthetic appeal. One major change from previous
years is the addition of Rheobuild 1000, a high range water reducer, into the structural, inlay, and lightweight
mixes. The additional workability provided by a high range water reducer is generally used to create low water-
cement ratio mixes with high strengths. However, in this application, the reducer was used to lower the paste
content and reach lower densities while maintaining most of the strength and workability. An undesirable side
effect of the high range water reducer was faster slump loss for the mixtures. The slump loss issues were
mitigated with increased focus on faster concrete placing by training team members before canoe placing. Also,
to account for slump loss issues the slump of the lightweight mix was vastly decreased from previous years
which expedited placement of layers with a precise thickness.
From experience with the composite design, lower paste contents would
decrease the layer bond strength. To offset these negative effects, latex
dosage of the lightweight mix was increased. Additional measures were
taken during placing to improve layer bond strength by protecting fresh
layers from water evaporation with damp cloths while waiting for the
subsequent layer. During as-built composite flexural testing, over half of
the samples failed in interface shear/delamination between layers instead
of rupture of the glass fiber (Figure 14). Delamination was the
controlling ultimate failure after initial tension cracks formed. These
failures were not expected and a detailed analysis of the results had to
verify local composite strengths in the floor of the canoe. Comparison of
the testing results and the structural analysis on the canoe floor
determined a safety factor of 2.7 against interface shear and the design
team was satisfied Ska’ana would resist all local point loads.
To facilitate faster placing, batch sizes were increased to better match the
mixer capacity and all dry concrete materials were pre-proportioned and
bagged to minimize batching time on placing day. This also improved
quality control in batching and aided in monitoring the mass flow of concrete material going into the canoe.
After multiple iterations and assessments based on construction and structural requirements, the 2015 concrete
mixes were ready for canoe placing.

Construction 2014-2015
Ska’ana | 8
Figure 15. Mold Fabrication Stages
Figure 16. Floor Layer Schematic
Glass Fiber
Carbon Fiber
Lightweight
Lightweight
Structural
1/8”
1/2”
1/8” Glass Fiber
Structural
Figure 17. Reinforcing Layout
The 2013 and 2014 canoe mold was a donated combination of expanded
polystyrene (EPS) foam billets, a computer numerically controlled (CNC)
milling, and a durable polyurea surface treatment. Based on experience, a
donated milled/treated EPS mold was the most efficient means of
constructing a high quality canoe. The team selected a female style mold
based on the resulting high quality outer surface and successes of past
years. The fabrication stages for the milled/treated EPS mold are shown
in Figure 15. The 2015 construction team set out to build Ska’ana with a
heightened focus on safety, quality assurance, and environmental
responsibility.
The team began construction organizing the workspace. Keeping
sustainability in mind, a detailed inventory was taken to initiate
discussion on reuse and recycling of materials. The team concluded to
reuse surplus reinforcing materials from 2013 and 2014 to recycle
available materials and save costs. Timber features from the 2014 EPS
mold were stripped and resized to be placed on the 2015 EPS mold. The
remaining 2014 EPS was responsibly disposed of at a specialized foam
recycling plant. These recycling procedures set precedent for future team
practices in sustainability.
Organizing and maintaining the workspace was driven by efficiency and
safety. The 2013 and 2014 teams were burdened with limited storage,
construction space, and a hazardous working environment. Disposing and
storing of materials and equipment cleared floor space. Trip hazards and
low-lying sharp objects were cleared to improve jobsite safety. Unstable
items in high places were removed, stabilized/tied, or stored at ground
level to eliminate collapse hazards. Jobsite Hazard Analysis Forms were
implemented to maintain awareness and importance of safety throughout
construction phases. Initial organization and a continued clear worksite
increased laborer efficiency, comfort, and safety.
Fabrication of the forms occurred simultaneously with workspace
organization. Before final donations for the forms were confirmed,
alternative mold construction was researched to prevent scheduling risks.
Once the materials and services were granted, the team coordinated the
fabrication schedule and transportation of the mold between fabrication
sites until completion. The team also prefabricated gunwale forms meant
to be erected during final stages of canoe placing. Form fabrication
concluded by adhering foam letter cutouts to the mold interior to leave
letter imprinted inlays after placing.
Concrete and reinforcing placement balanced structural efficiency and
constructability. First, structural concrete was placed in a thin layer. Then,
transversely running sheets of glass fiber reinforcing were placed on the
structural concrete throughout the canoe and embedded with a thin
structural skim layer. Next, lightweight concrete was placed over the structural skim. Then, longitudinally
running strips of carbon fiber reinforcing were embedded in the lightweight concrete in the gunwales and keel.
Lastly, a final structural layer was placed with a second layer of embedded, transversely running glass fiber.
Figure 16 shows an exploded floor section. The floors slightly differed from the walls. Instead of 0.5 inch layer

2014-2015
Ska’ana | 9
Figure18. Anchor and Swan Channel
of lightweight mix, the sidewalls detailed a 0.25 inch lightweight layer. The thinner lightweight layer in the wall
lowered placing time by an hour and reduced the weight of Ska’ana by 20 pounds. Figure 17 shows the typical
reinforcing layout.
During the 2014 placing, the carbon reinforcing warped on curved surfaces. The warping required excess
concrete to fill the voids which resulted in The Lady being 100% over the design weight. To eliminate excessive
weight, carbon reinforcing was placed in the lightweight mix because of its higher flow. The higher flow mix
allowed easier consolidation around the reinforcing and eliminated the need for excess concrete. Additionally,
the contribution to canoe weight would be small if any excess lightweight concrete was used.
Following concrete placing, curing used wetted burlap cloth for two weeks in a heated moisture sealed facility.
After curing, the facility was disassembled and mold halves were parted. Improvements to Ska’ana’s mold
allowed easier access points for parting the mold with reduced stress on the canoe. Finishing began with
patching and sanding the canoe. Pigment-colored concrete was placed as letter inlays. Exterior and interior
graphics were then sketched and stained. Concrete finishing concluded by applying a silane-based sealer with a
Volatile Organic Compounds content of 39 grams per liter. The sealer applied to Ska’ana differed from the
sealer applied to The Lady to provide a better application to vertical surfaces and for significant reductions to
VOC levels. The stains remained the same as those featured on The Lady because of the vibrant results seen in
2014.
After sealing concluded, the team performed a pre-competition floatation test. During the test, Ska’ana failed to
self-surface and float unassisted. Ska’ana failed to float because water seeped into the lightweight concrete
voids. Seepage occurred through openings between the inlay lettering concrete and structural outer concrete.
Extensive patching of the interface prevented further seepage, and
foam inserts were integrated as floatation redundancy. The foam
inserts were covered with 0.25 inch fiberglass-reinforced structural
concrete, and repairs were finished with original methods.
After the floatation test, large tension cracks were observed in the
gunwales. The tension cracks formed because thickness in the
gunwales did not account for placing variance, and resultant rupture
stresses were reached. To prevent further cracking, a post-tensioned,
0.125 inch steel wire rope was placed into a channel sawn into the
gunwales. Structural concrete was consolidated around the post-
tensioned cable for bond strength. An anchor system was constructed
as a redundancy to the concrete-steel bond and to hold the post-
tension forces while the concrete strengthened. The anchor system
was constructed by sawing notches at the ends of Ska’ana, slipping
the cable through bearing plates, and then crimping the steel wire
with aluminum ferrules upon tensioning. Figure 18 shows the stern
anchor and sawn channel. All repair reinforcing and anchors were
covered with adequate structural concrete and finished with original
methods.
The 2015 Huskies pioneered numerous innovations during construction of Ska’ana. The 2015 practices resulted
with heightened emphasis on safety, quality assurance, and environmental responsibility. Ska’ana was delivered
with exceptional quality, cost/labor savings, and environmental responsibility. The critical repairs provided an
unmatched learning experience for even senior members and will provide valuable experience going into
industry. The University of Washington Huskies are excited to present their technical expertise, competitive
spirit, and powerful canoe Ska’ana at the 2015 National Concrete Canoe Competition.
Project Schedule 2014-2015
Ska’ana | 10

Design Drawing 2014-2015
Ska’ana | 11
23.50
Ska’ana

Appendix A: References 2014-2015
Ska’ana | A-1
ACI Committee 318 (2011). Building Code Requirements for Structural Concrete (ACI 318-11). ACI (2011).
ASCE/NCCC (2015). “2015 American Society of Civil Engineers® National Concrete Canoe
CompetitionTM
Rules and Regulations.”
<https://www.asce.org/uploadedFiles/Membership_and_Communities/Student_Chapters/Concrete_
Canoe/Content_Pieces/nccc-rules-and-regulations.pdf > (March 27, 2015).
ASTM (2013). “Standard Specification for Concrete Aggregates.” ASTM C33/C33M-13, ASTM
International, West Conshohocken, PA.
ASTM (2013). “Standard Test Method for Flow of Hydraulic Cement Mortar.” ASTM C1437-13, ASTM
International, West Conshohocken, PA.
ASTM (2012). “Standard Specification for Expansive Hydraulic Cement.” ASTM C845/C845M-12, ASTM
International, West Conshohocken, PA.
ASTM (2012). “Standard Specification for Portland Cement.” ASTM C150/C150M-12, ASTM
International, West Conshohocken, PA.
ASTM (2012). “Standard Test Method for Density (Unit Weight), Yield, and Air Content (Gravimetric) of
Concrete.” ASTM C138/C138M-12a, ASTM International, West Conshohocken, PA.
ASTM (2011). “Standard Test Method for Flexural Strength of Concrete (Using Simple Beam with Third-
Point Loading)” ASTM C78/C78M-10e1, ASTM International, West Conshohocken, PA
ASTM (2011). “Standard Test Method for Splitting Tensile Strength of Cylindrical Concrete Specimens,”
ASTM C496/C496M-11, ASTM International, West Conshohocken, PA.
ASTM (2010). “Standard Specification for Fiber-Reinforced Concrete.” ASTM C1116/C1116M-10a,
ASTM International, West Conshohocken, PA.
ASTM (2010). “Standard Specification for Air Entraining Admixtures for Concrete.” ASTM C260/C260M-
10a, ASTM International, West Conshohocken, PA.
ASTM (2010). “Standard Test Method for Flexural Strength of Concrete (Using Simple Beam with Center-
Point Loading).” ASTM C293/C293M-10, ASTM International, West Conshohocken, PA.
ASTM (2009). “Standard Test Method for Compressive Strength of Hydraulic Cement Mortars (Using 2 in.
or [50 mm]) Cube Specimens,” ASTM C 109, ASTM International, West Conshohocken, PA.
ASTM (2008). “Standard Test Method for Length Change of Hardened Hydraulic Cement Mortar and
Concrete.” ASTM C157/C157M-08, ASTM International, West Conshohocken, PA.
Janssen, Donald. Concrete Canoe Team Advisor - Reference. University of Washington Department of Civil
& Environmental Engineering, September 2014-March 2015.
LaBarca, Foley, and Cramer (2007). “Effects of Granulated Ground Blast Furnace Slag in Portland Cement
Concrete – Expanded Study.” Wisconsin Highway Research Program, January 2007.

2014-2015
Ska’ana | A-2
Mackenzie, Peter. Structural Analysis Advisor - Reference. University of Washington Department of Civil
& Environmental Engineering, September 2014-March 2015.
National Ready Mixed Concrete Association. (2000). “Concrete in Practice.”
<http://www.nrmca.org/aboutconcrete/cips/16p.pdf> (Mar. 20, 2015).
Native Languages of the Americas Website. (1998). “Wolf and the Sea.” < http://www.native-
languages.org/haida-legends.htm> (Mar. 25, 2015).
Sailboat Cruising Website. “Hullspeed and the Speed/Length Ratio.” <http://www.sailboat-
cruising.com/hullspeed.html> (Mar. 28, 2015).
Sailboat Cruising Website. “Understanding the Prismatic Coefficient.” <http://www.sailboat-
cruising.com/prismatic-coefficient.html> (Mar. 28, 2015)
Shakhmenko, Genadij, and Juris Birsh. (1998). “Concrete Mix Design and Optimization.” Riga Techniqucal
University, Department of Building Materials. <http://www.dogateknik.com.tr/teknik-belgeler/concrete-
mix-design-and-optimization.pdf> (Mar. 28, 2015).
University of Washington Concrete Canoe Team (2014). The Lady. Design Paper.
University of Washington Concrete Canoe Team (2013). Undammed. Design Paper.
University of Washington Concrete Canoe Team (2012). Hermes. Design Paper.
University of Wisconsin Madison Concrete Canoe Team. (2012). NCC Design Papers 2000-Present.
<http://canoe.slc.engr.wisc.edu/designpapers/index.htm> (March 15, 2015).
Winters, John. “The Shape of the Canoe. Part 1: Residual Resistance.”
<http://www.greenval.com/shape_part2.html> (Mar. 28, 2015).

Appendix B: Mixture Proportions 2014-2015
Ska’ana | B-1
Mixture ID: Structural Design Proportions (Non SSD)
Actual Batched Proportions
Yielded Proportions YD Design Batch Size (ft
3): 0.08
Cementitious Materials SG Amount (lb/yd3)
Volume (ft3)
Amount (lb)
Volume (ft3)
Amount (lb/yd3)
Volume (ft3)
CM1 Portland Cement 3.15 294.04 1.496 0.87 0.004 277.19 1.410
CM2 Slag 2.90 233.89 1.293 0.69 0.004 220.49 1.218
CM3 Metakaolin 2.50 73.51 0.471 0.22 0.001 69.30 0.444
CM4 Expansive K 2.98 66.83 0.359 0.20 0.001 63.00 0.339
Total Cementitious Materials: 668.27 3.62 1.98 0.01 629.97 3.41
Aggregates
A1 .1-.3 mm Poravair Abs: 35.0% 0.66 246.98 6.019 0.73 0.018 232.83 5.674
A2 .3-.5 mm Poravair Abs: 28.0% 0.57 110.44 3.084 0.33 0.009 104.11 2.908
A3 .5-1 mm Poravair Abs: 20.0% 0.41 117.34 4.545 0.35 0.013 110.61 4.284
Total Aggregates: 474.76 13.65 1.41 0.04 447.55 12.87
Water
W1 Water for CM Hydration (W1a + W1b)
1.00
213.85 3.427 0.63 0.010 201.59 3.231
W1a. Water from Admixtures 23.87
0.07
22.51
W1b. Additional Water 189.97 0.56 179.08
W2 Water for Aggregates, SSD 1.00 140.84 0.42 132.76
Total Water (W1 + W2): 354.68 3.43 1.05 0.01 334.35 3.23
Solids Content of Latex, Dyes and Admixtures in Powder Form
S1 Daraweld C (Latex) 1.00 21.44 0.344 0.06 0.001 20.21 0.324
Total Solids of Admixtures: 21.44 0.34 0.06 0.00 20.21 0.32
Admixtures (including Pigments in Liquid Form)
% Solids
Dosage (fl
oz/cwt)
Water in Admixture
(lb/yd3)
Amount (fl oz)
Water in Admixture
(lb)
Dosage (fl
oz/cwt)
Water in Admixture
(lb/yd3)
Ad1 Daraweld C (Latex) 8.3 lb/gal 53% 92.18 18.87 1.83 0.06 92.18 17.79
Ad2 Daravair 3000 8.5 lb/gal 10% 3.68 1.47 0.07 0.00 3.68 1.39
Ad3 Rheobuild 9.0 lb/gal 0% 7.52 3.53 0.15 0.01 7.52 3.33
Water from Admixtures (W1a): 23.87 0.07 22.51
Cement-Cementitious Materials Ratio 0.440 0.440 0.440
Water-Cementitious Materials Ratio 0.320 0.320 0.320
Slump, Slump Flow, in. 2.5 +/- 1 in 2.75 2.75
M Mass of Concrete. Lbs 1519.15 4.50 1432.08
V Absolute Volume of Concrete, ft3 21.04 0.06 19.83
T Theorectical Density, lb/ft3 = (M / V) 72.21 72.21 72.21
D Design Density, lb/ft3 = (M / 27) 56.26
D Measured Density, lb/ft3 53.06 53.06
A Air Content, % = [(T - D) / T x 100%] 22.1% 26.5% 26.5%
Y Yield, ft3 = (M / D) 27 0.085 27.000
Ry Relative Yield = (Y / YD) 1.061

2014-2015
Ska’ana | B-2
Mixture ID: Middle Design Proportions (Non SSD)
Actual Batched Proportions
Yielded Proportions YD Design Batch Size (ft3): 0.12
Cementitious Materials SG Amount (lb/yd3)
Volume (ft3)
Amount (lb)
Volume (ft3)
Amount (lb/yd3)
Volume (ft3)
CM1 Portland Cement 3.15 160.41 0.816 0.71 0.004 160.19 0.815
CM2 Slag 2.90 88.07 0.487 0.39 0.002 87.95 0.486
CM3 Metakaolin 2.50 34.60 0.222 0.15 0.001 34.55 0.221
CM4 Expansive K 2.98 31.45 0.169 0.14 0.001 31.41 0.169
Total Cementitious Materials: 314.52 1.69 1.40 0.01 314.10 1.69
Fibers
F1 Fiber 1 1.30 6.72 0.083 0.03 0.000 6.71 0.083
Total Fibers: 6.72 0.08 0.03 0.00 6.71 0.08
Aggregates
A1 .1-.3 mm Poravair Abs: 35.0% 0.66 56.09 1.367 0.25 0.006 56.02 1.365
A2 .3-.5 mm Poravair Abs: 28.0% 0.57 24.92 0.696 0.11 0.003 24.88 0.695
A3 .5-1 mm Poravair Abs: 20.0% 0.41 26.74 1.036 0.12 0.005 26.70 1.034
A4 Elemix Abs: 0.0% 0.04 13.37 5.103 0.06 0.023 13.36 5.097
Total Aggregates: 121.12 8.20 0.54 0.04 120.96 8.19
Water
W1 Water for CM Hydration (W1a + W1b)
1.00
125.81 2.016 0.56 0.009 125.64 2.013
W1a. Water from Admixtures 23.34
0.10
23.31
W1b. Additional Water 102.47 0.46 102.33
W2 Water for Aggregates, SSD 1.00 31.96 0.14 31.91
Total Water (W1 + W2): 157.77 2.02 0.70 0.01 157.56 2.01
Solids Content of Latex, Dyes and Admixtures in Powder Form
S1 Daraweld C (Latex) 1.00 23.33 0.374 0.10 0.002 23.30 0.373
P1 Pigment 1 (Powder Form) 1.00 0.00 0.000 0.00 0.000 0.00 0.000
Total Solids of Admixtures: 23.33 0.37 0.10 0.00 23.30 0.37
Admixtures (including Pigments in Liquid Form)
% Solids
Dosage (fl
oz/cwt)
Water in Admixture
(lb/yd3)
Amount (fl oz)
Water in Admixture
(lb)
Dosage (fl
oz/cwt)
Water in Admixture
(lb/yd3)
Ad1 Daraweld C (Latex) 8.3 lb/gal 53% 214.73 20.69 3.00 0.09 214.73 20.66
Ad2 Rheocell 8.5 lb/gal 0% 4.60 0.96 0.06 0.00 4.60 0.96
Ad3 Rheobuild 9.0 lb/gal 0% 7.67 1.70 0.11 0.01 7.67 1.70
Water from Admixtures (W1a): 23.34 0.10 23.31
Cement-Cementitious Materials Ratio 0.510 0.510 0.510
Water-Cementitious Materials Ratio 0.400 0.400 0.400
Slump, Slump Flow, in. 4 +/- 1 in 4.00 4.00
M Mass of Concrete. lbs 623.46 2.77 622.63
V Absolute Volume of Concrete, ft3 12.37 0.05 12.35
T Theorectical Density, lb/ft3 = (M / V) 50.41 50.41 50.41
D Design Density, lb/ft3 = (M / 27) 23.09
D Measured Density, lb/ft3 23.10 23.10
A Air Content, % = [(T - D) / T x 100%] 54.2% 54% 54%
Y Yield, ft3 = (M / D) 27 0.120 27.000
Ry Relative Yield = (Y / YD) 1.000

2014-2015
Ska’ana | B-3
Mixture ID: Inlay Design Proportions (Non
SSD)
Actual Batched Proportions
Yielded Proportions YD Design Batch Size (ft3): 0.08
Cementitious Materials SG Amount (lb/yd3)
Volume (ft3)
Amount (lb)
Volume (ft3)
Amount (lb/yd3)
Volume (ft3)
CM1 Portland Cement 3.15 294.04 1.496 0.87 0.004 311.08 1.583
CM2 Slag 2.90 233.89 1.293 0.69 0.004 247.45 1.367
CM3 Metakaolin 2.50 73.51 0.471 0.22 0.001 77.77 0.499
CM4 Expansive K 2.98 66.83 0.359 0.20 0.001 70.70 0.380
Total Cementitious Materials: 668.27 3.62 1.98 0.01 706.99 3.83
Aggregates
A1 .1-.3 mm Poravair Abs: 35.0% 0.66 244.93 5.969 0.73 0.018 259.12 6.315
A2 .3-.5 mm Poravair Abs: 28.0% 0.57 109.52 3.059 0.32 0.009 115.87 3.236
A3 .5-1 mm Poravair Abs: 20.0% 0.41 116.36 4.507 0.34 0.013 123.10 4.768
Total Aggregates: 470.81 13.53 1.40 0.04 498.10 14.32
Water
W1 Water for CM Hydration (W1a + W1b)
1.00
213.85 3.427 0.63 0.010 226.24 3.626
W1a. Water from Admixtures 22.40
0.07
23.70
W1b. Additional Water 191.44 0.57 202.54
W2 Water for Aggregates, SSD 1.00 139.66 0.41 147.76
Total Water (W1 + W2): 353.51 3.43 1.05 0.01 374.00 3.63
Solids Content of Latex, Dyes and Admixtures in Powder Form
S1 Daraweld C (Latex) 1.00 21.28 0.341 0.06 0.001 22.51 0.361
P1 Pigment 1 (Powder Form) 1.00 11.69 0.187 0.03 0.001 11.05 0.177
Total Solids of Admixtures: 32.96 0.53 0.10 0.00 33.56 0.54
Admixtures (including Pigments in Liquid Form)
% Solids
Dosage (fl
oz/cwt)
Water in Admixture
(lb/yd3)
Amount (fl oz)
Water in Admixture
(lb)
Dosage (fl
oz/cwt)
Water in Admixture
(lb/yd3)
Ad1 Daraweld C (Latex) 8.3 lb/gal 53% 92.18 18.87 1.83 0.06 92.18 19.96
Ad2 Rheobuild 9.0 lb/gal 0% 7.52 3.53 0.15 0.01 7.52 3.74
Water from Admixtures (W1a): 22.40 0.07 23.70
Cement-Cementitious Materials Ratio 0.440 0.440 0.440
Water-Cementitious Materials Ratio 0.320 0.320 0.320
Slump, Slump Flow, in. 2.5 +/- 1 in 2.00 2.00
M Mass of Concrete. lbs 1525.56 4.52 1612.64
V Absolute Volume of Concrete, ft3 21.11 0.06 22.31
T Theorectical Density, lb/ft3 = (M / V) 72.27 72.27 72.28
D Design Density, lb/ft3 = (M / 27) 56.50
D Measured Density, lb/ft3 59.78 59.78
A Air Content, % = [(T - D) / T x 100%] 21.8% 17.3% 17.3%
Y Yield, ft3 = (M / D) 27 0.076 26.978
Ry Relative Yield = (Y / YD) 0.945

2014-2015
Ska’ana | B-4
Mixture ID: Patching Design Proportions (Non SSD)
Actual Batched Proportions
Yielded Proportions YD Design Batch Size (ft3): 0.04
Cementitious Materials SG Amount (lb/yd3)
Volume (ft3)
Amount (lb)
Volume (ft3)
Amount (lb/yd3)
Volume (ft3)
CM1 Portland Cement 3.15 339.20 1.726 0.47 0.002 362.82 1.846
CM2 Slag 2.90 474.88 2.624 0.66 0.004 507.94 2.807
CM3 Metakaolin 2.50 271.36 1.739 0.38 0.002 290.25 1.861
CM4 Expansive K 2.98 271.36 1.459 0.38 0.002 290.25 1.561
Total Cementitious Materials: 1356.79 7.55 1.88 0.01 1451.26 8.07
Aggregates
A1 .04-.125 mm Poravair Abs: 36.0% 0.99 500.28 8.121 0.69 0.011 535.11 8.686
Total Aggregates: 500.28 8.12 0.69 0.01 535.11 8.69
Water
W1 Water for CM Hydration (W1a + W1b)
1.00
568.74 9.114 0.79 0.013 608.34 9.749
W1a. Water from Admixtures 13.26
0.02
14.18
W1b. Additional Water 555.48 0.77 594.16
W2 Water for Aggregates, SSD 1.00 180.10 0.25 192.64
Total Water (W1 + W2): 748.84 9.11 1.04 0.01 800.98 9.75
Solids Content of Latex, Dyes and Admixtures in Powder Form
S1 Daraweld C (Latex) 1.00 14.95 0.240 0.02 0.000 15.99 0.256
Total Solids of Admixtures: 14.95 0.24 0.02 0.00 15.99 0.26
Admixtures (including Pigments in Liquid Form)
% Solids
Dosage (fl
oz/cwt)
Water in Admixture
(lb/yd3)
Amount (fl oz)
Water in Admixture
(lb)
Dosage (fl
oz/cwt)
Water in Admixture
(lb/yd3)
Ad1 Daraweld C (Latex) 8.3 lb/gal 53% 31.90 13.26 0.60 0.02 31.90 14.18
Water from Admixtures (W1a): 13.26 0.02 14.18
Cement-Cementitious Materials Ratio 0.250 0.250 0.250
Water-Cementitious Materials Ratio 0.419 0.419 0.419
Slump, Slump Flow, in. 3.5 +/- 1 in 3.50 3.50
M Mass of Concrete. lbs 2620.86 3.63 2803.34
V Absolute Volume of Concrete, ft3 25.02 0.03 26.77
T Theorectical Density, lb/ft3 = (M / V) 104.74 104.74 104.74
D Design Density, lb/ft3 = (M / 27) 97.07
D Measured Density, lb/ft3 96.97 96.97
A Air Content, % = [(T - D) / T x 100%] 7.3% 7.4% 7.4%
Y Yield, ft3 = (M / D) 27 0.037 28.909
Ry Relative Yield = (Y / YD) 0.935

Appendix C: Bill of Materials 2014-2015
Ska’ana | C-1
Canoe Construction Materials Units Unit Cost Quantity Total
White Portland Cement (Type I) lb $ 0.32 47.8 $ 15.30
GGBF Slag, Grade 100 lb $ 0.07 33.1 $ 2.32
Metakaolin lb $ 0.58 11.3 $ 6.50
CTS Cement Komponent lb $ 0.34 10.3 $ 3.50
Poraver (0.04-0.125 mm) lb $ 0.70 4.15 $ 2.91
Poraver (0.1 – 0.3 mm) lb $ 0.70 30.4 $ 21.28
Poraver (0.25 – 0.5 mm) lb $ 0.70 13.6 $ 9.52
Poraver (0.5 – 1.0 mm) lb $ 0.70 14.5 $ 10.15
Elemix lb $ 3.48 1.7 $ 5.92
8 mm Fiberglass Strands lb $ 10.13 0.84 $ 8.51
Daraweld C lb $ 0.89 9.3 $ 8.28
Rheocell 30 fl oz $ 0.12 1.8 $ 0.21
Rheobuild fl oz $ 0.13 7.6 $ 0.99
Daravair 1000 fl oz $ 0.10 2.3 $ 0.24
Black Pigment lb $ 8.32 0.6 $ 4.99
CT 275 Carbon Fiber Reinforcement sq ft $ 2.97 55 $ 163.17
Fiberglass Reinforcement sq ft $ 0.80 160 $ 128.00
Sealer gal $ 25.45 1 $ 25.45
Mold Release gal $ 16.00 1 $ 16.00
Stains pt $ 50.00 3 $ 150.00
1/8” X 4’ X 8’ Plywood sheet $19.00 1 $19.00
Insulating Foam Sealant fl oz $5.00 4 $20.00
1/8” Ferrules EA $2.00 4 $8.00
1/8” Steel Wire Rope EA $17.00 1 $17.00
Subtotal: $ 647.22
Mold Construction Materials Units Unit Cost Quantity Total
Mold EA $ 8025.00 1 $ 8025.00
¼” 4’ X 8’ Plywood sheet $ 19.00 0 (reused) $ 0
Foam Lettering EA $ 7.00 1 $ 7.00
Subtotal: $ 8032.00
TOTAL COST $ 8592.22

Appendix D: Example Structural Calculation 2014-2015
Ska’ana | D-1

2014-2015
Ska’ana | D-2

Appendix E: Repair Procedures Report 2014-2015
Ska’ana | E-1

2014-2015
Ska’ana | E-2
Figure E-2. Bow Damage Right Figure E-1. Bow Damage Left
Figure E-3. Bow Damage Front Figure E-4. Before Conference Damage