skilling uganda btvet strategic plan 2012/3 to...
TRANSCRIPT

THE REPUBLIC OF UGANDA
MINISTRY OF EDUCATION & SPORTS
Developed in partnership with:
SKILLING UGANDA
BTVET STRATEGIC PLAN 2012/3 to 2021/2
The World Bank
CONTENTS
CONTENTS 1
ACRONYMS 2
EXECUTIVE SUMMARY 4
1 BACKGROUND AND CONTEXT 9
2 CURRENT SITUATION OF SKILL DEVELOPMENT IN UGANDA 11
3 PRIORITY REFORMS AND INVESTMENTS 14
4 OBJECTIVES AND STRATEGIES 18
5 COSTS AND FINANCING 36
6 OPERATIONAL PLAN FOR SKILLS DEVELOPMENT 43
ANNEXES 45
1 Skilling Uganda - BTVET Strategic Plan 2012/3-2021/2

ACRONYMS
ASDC Agricultural Skill Development CentreATP Assessment and Training PackagesBA Business AssociationBTVET Business, Technical and Vocational Education and TrainingCBET Competency-based education and trainingCBO Community-based OrganizationCGC Career guidance and counsellingCoE Centre of ExcellenceCPTI Community Polytechnic Teachers InstituteDATIC District Agriculture Training and Information CentreDES Directorate of Education StandardsDHE Department of Higher EducationDIT Directorate of Industrial TrainingDTIM Diploma in Technical Institutions ManagementDTIT Department of Teachers and Instructors Training E-BTVET Electronic BTVETEMIS Education Management Information SystemESC Education Service CommissionESSP Education Sector Strategic PlanFBO Faith-based organizationFUE Federation of Uganda EmployersGDP Gross Domestic ProductGoU Government of UgandaGWPE Government White Paper on EducationHAPEB Health and Allied Professional Examination BoardHRD Human Resource DevelopmentICT Information and Communication TechnologyIGA Income generating activitiesIQM Internal Quality ManagementITC Industrial Training CouncilJAB Joint Admission BoardKfW KreditanstaltfürWiederaufbau(Germanfinancialcooperation)LG Local GovernmentLMIS Labour-market information system MAAIF Ministry of Agriculture, Animal Industries and FisheriesMIS Management Information System MoES Ministry of Education and SportsMoFPED Ministry of Finance, Planning and Economic DevelopmentMoGLSD Ministry of Gender, Labour and Social DevelopmentMoICT Ministry of Information, Communication and TechnologyMoJ Ministry of JusticeMoPS Ministry of Public ServiceMoTTI Ministry of Tourism, Trade and IndustryMSE Micro and small enterprisesNAADS National Agricultural Advisory ServicesNARO National Agricultural Research OrganizationNCDC National Curriculum Development CentreNDP National Development PlanNFTP Non-Formal Training ProgrammeNGO Non-governmental organizationNPA National Planning AuthorityNTF National Training FundNUDIPU National Union of Disabled Persons in Uganda
2Skilling Uganda - BTVET Strategic Plan 2012/3-2021/2

OFID OPEC Fund for International DevelopmentPPTP Promotion of Private Training ProvidersIP-BTVET Investment Programme – BTVETPPP Public-Private PartnershipPSFU Private Sector Foundation UgandaPWD Persons with DisabilitiesSDB Skill development bodySDC Skill Development CentreSFD Saudi Fund for DevelopmentSWAp Sector-wide approachTI Training InstituteTNA Training Needs AssessmentTSC Technical Sector CommitteeTU Trade UnionTVET Technical and Vocational Education and TrainingUBOS Uganda Bureau of StatisticsUBTEB Uganda Business and Technical Education BoardUGAPRIVI Uganda Association of Private Vocational InstitutesUGX Uganda ShillingsUMA Uganda Manufacturers’ AssociationUNEB Uganda National Examinations BoardUNMEB Uganda Nurses and Midwifes Examination BoardUPPET Universal Post-primary Education and TrainingUSD US DollarsUVQF UgandaVocationalQualificationsFrameworkVTC Vocational Training CentreVTI Vocational Training InstituteWAN Wide-area networkWS Workshop
3 Skilling Uganda - BTVET Strategic Plan 2012/3-2021/2

EXECUTIVE SUMMARYBACKGROUND AND CONTEXT
Technical-vocational skills are essential for individuals, enterprises and the economy. Skills enable individuals to increase productivity and raise incomes. A skilled workforce enables enterprises to increase their productivity and profits.Skillsenabletheeconomytoexpandandgrow.EmployersinUgandaoftencomplainaboutskillsshortagesthat constrain production and expansion. Large segments of the population, including those working in the informal sector, lack the skills they need to raise themselves out of poverty. The economy faces critical skills gaps that threaten to limit the growth of key sectors, including agriculture and energy.
ThisStrategicPlanonBusiness,TechnicalandVocationalEducationandTraining (BTVET)addresses theseskillshortages. ThePlan (2012/3 to2021/22)buildsonconsiderableprogress in the reformof theBTVETsystemachieved during the last decade, notably the BTVET Act of 2008 and the establishment of the Uganda Vocational QualificationsFramework(UVQF).
Uganda’s development framework forms the point of departure of the Strategic plan, especially as formulated inUganda’sVision2025and theNationalDevelopmentPlan (NDP)2010/11–2014/15.TheStrategicPlan isembedded in the education policy framework and hinged on the BTVET Act of 2008. It incorporates activities by theBTVETDepartmentandtheDirectorateofIndustrialTraining(DIT)undertheMinistryofEducationandSports(MoES).
The Strategic Plan has been based on a comprehensive analysis of the BTVET sub-sector in terms of relevance, equity,quality,organizationaleffectivenessandfinance/internalefficiency(Chapter2).
The Strategic Plan – A Paradigm Shift in BTVET
The Strategic Plan is titled “Skilling Uganda”, which denotes a paradigm shift for skills development in Uganda. The BTVET system will be transformed from an educational sub-sector into a comprehensive system of skills development for employment, enhanced productivity and growth. The main purpose will be to create employable skills and competenciesrelevantinthelabourmarketinsteadofeducationalcertificates.ItwillembraceallUgandansinneedof skills, not only primary and secondary school leavers.
Main purpose
Target Groups
Delivery context
Management
Educationalcertificates
Skills and competenciesrelevant in the labourmarket
All Ugandans in need ofskills development
Flexible, workplaceoriented envronment
Public/privatepartnership
(Low achieving)school leavers
School system
Government
Paradigm Shift in BTVET
4Skilling Uganda - BTVET Strategic Plan 2012/3-2021/2

Priority Reforms and Investments
Four sets of policy and institutional interventions are critical to BTVET reform:
• Engaging the private sector – both enterprises and private training providers- in BTVET reforms • Expanding the UVQF scope and ensuring that training content corresponds to work requirements• BuildingastrongunifiedorganizationformanagingskillsdevelopmentinUganda• ReformingthesystemofBTVETfundingtoraiserevenuesandusethemmoreefficiently
InlinewiththesecriticalinterventionstheStrategicPlanidentifiespriorityinvestmentprogrammesasfollows:
Investments to expand output in critical sectors:1. Expanding BTVET in NDP priority sectors, e.g. oil production2. Expansion and improvement of agriculture training3. Skills for productivity in the informal sector
Investments to raise the quality of training:1. Expanding the scope of the UVQF, including related curriculum development2. Upgrading existing training institutions3. Instructor training
Objectives and Strategies
The Strategic Plan is meant to accelerate reforms and guide the rational use of investments. The Plan aims at the following high-level development objective:
Ugandans and enterprises acquire the skills they need to raise their productivity and incomes.
ThePlanhasfivespecificobjectivestoreachthedevelopmentobjective:
1. Raise the economic relevance of BTVET 2. Increase the quality of skills provision3. Provide equitable access to skills development4. AchievegreaterorganizationalandmanagementeffectivenessinBTVET5. IncreaseinternalefficiencyandresourcesavailableforBTVET
The BTVET Strategic Plan is a full-sub-sector plan, integrating existing and already planned activities with new strategies to further improve and expand skills development in Uganda. The objectives and strategies are the following:
Objective 1: Raise the economic relevance of BTVET
1. Strengthen the role of the business community and employers in BTVET1.1. Strengthen the role in BTVET planning and decision-making1.2. Strengthen employer-based training
2. Expand the coverage of the UVQF and accelerate its development 2.1. Clarify the UVQF conceptual framework and strengthen management capacities2.2. Implement UVQF-based BTVET throughout the BTVET system
3. Makethetrainingsupplymoreflexibleanddemand-driven
5 Skilling Uganda - BTVET Strategic Plan 2012/3-2021/2

4. BoostBTVETsupplyincriticaloccupations,e.g.inagriculture,energy5. Expand and improve agriculture training
5.1. Establish, improve and expand facilities for agriculture BTVET 5.2. Strengthen linkages of BTVET institutions with research institutions, industry and farmers5.3. Strengthencompetency-basedtraining(CBET)inagriculture
6. Promoteskillsforproductivityintheinformalsectorandformicroandsmallenterprises(MSEs)6.1. Establish non-formal training as an integral part of the BTVET system6.2. Build capacities among skills development providers in training for the informal sector6.3. Create networks for information, cooperation and coordination 6.4. PromoteinnovationinskillsdevelopmentforMSEsandtheinformalsector
7. Establishalabourmarketinformationsystem(LMIS)
Objective 2: Increase the quality of skills provisions
1. Strengthen institutional capacities for BTVET provision2. Achieve better production and deployment of instructors and managers
2.1. Strengtheninginstructorstraininginstitutionsandtheinstructorqualificationssystem2.2. BoosttheavailabilityofcompetentandqualifiedBTVETinstructorsandtutors2.3. Deregulate recruitment and employment and improve instructor the working conditions
3. Introduce better quality assurance systems for public and private BTVET providers3.1. Introduce an accreditation system for BTVET providers3.2. Introduce an internal quality management system in BTVET institutions
Objective 3: Provide equitable access to skills development
1. Ensure access to formal and non-formal BTVET2. Expand private training provision3. Build and resource public BTVET supply4. CreateawarenessaboutBTVET5. Enhance access of disadvantaged target groups to skills development
5.1. Promote access of disadvantaged groups through bursaries5.2. Promote female participation in BTVET5.3. Enhance access for persons with disabilities
Objective 4: Achieve Greater Effectiveness in BTVET management and organization
1. Consolidate BTVET functions in an integrated organization for skills development 2. Devolve authority to public BTVET institutions and make them accountable for performance
2.1. Decentralize authority to BTVET institutions2.2. Introduce instruments to increase accountability of BTVET institutions
3. Establish an effective management information system and sub-sector monitoring system
Objective 5: Increase internal efficiency and resources available for BTVET
1. IncreasetheefficiencyofBTVETprovisionthroughresults-orientedtransfermechanisms2. Increase the resources available for BTVET
2.1. Increase income of public BTVET institutions through income generating activities2.2. Introduce a training levy
3. Establish a Skills Development Fund
6Skilling Uganda - BTVET Strategic Plan 2012/3-2021/2

Costs and Financing
Implementation of the BTVET Strategic Plan is estimated to cost 2 001 billion UGX, or 870 million USD over the ninefiscalyears2012/3to2021/2.Recurrentcostsaccountfor55%ofthetotalanddevelopmentcosts45%.Theestimates represent full sub-sector costs to government.
About40%oftherecurrentbudgetisearmarkedforraisingaccessandquality.About433billionUGXwouldbespent on capitation grants/bursaries to support school leavers attending formal BTVET programmes. Enrolment in formalBTVETisprojectedtoincreasefrom42000traineesto103000traineesin2019/20,anannualgrowthof10%.Percapitafundingwillberaisedgraduallytoensurethattrainingisprovidedatgoodstandards.About40%ofthe formal BTVET trainees will receive public scholarships.
Non-formal BTVET will be integrated permanently into the public BTVET portfolio. The plan allocates 160 billion for non-formal BTVET. This will increase enrolment in publicly sponsored non-formal training from 20,000 persons in 2010/11to40,000in2015and60,000by2016..The bulk of development expenditures is earmarked for rehabilitating and strengthening existing BTVET institutions, bothpublicandprivate,andforagriculturetraining(muchofwhichwillbebornebytheMAAIF).Duringthefirstphase,aboutonefifthoftotaldevelopmentcostswillfinancenewBTVETinstitutionsunderexistingloanagreements.From2014/15onwards,nofurtherinvestmentisbudgetedfornewpublicinstitutions.Instead,incentiveswillbeintroduced to expand private provision, e.g.matching grants.
A substantial funding gap exists between requirements of the Strategic Plan and currently projected public expenditureundertherevisedESSP(2010Revision).Forthefirstfouryears,correspondingtothecurrentMTEF,thefundinggapamountsto60%oftotalestimatedcosts,424billionUGX.Optionsforclosingthefundinggapincludeincreased public allocation to BTVET , an increased engagement of development partners, co-funding by other government sectors, and development of more cost-effective training delivery. Further, the Strategic Plan envisages theintroductionofatraininglevy,whichmaybecomeasignificantadditionalrevenuesourcefortheBTVETsystemfrom 2015/16 onwards. The current calculations exclude any potential proceeds from a levy.
Prioritieswillhavetobedefinedwithinthestrategyshouldanygapsremain.
Operational Plan for Skills Development
The MoES has the main responsibility for implementing and monitoring of the Strategic Plan. Other ministries and stakeholder are involved and assume responsibility for selected strategies, notably the Ministry of Agriculture, AnimalIndustriesandFisheries(MAAIF).
The Strategic Plan, however, goes beyond the previous mandate of the MoES. The strategy to establish a new unifiedbodyforskillsdevelopmentreflectsthebroadenedmandateoftheBTVETsectorandtheneedforbroaderpartnerships. The new organization will become the owner and main implementer of this Strategic Plan.
1Closing the funding gap will require increasing the share of MoES spending for BTVET from 4%-5% in 2010 to 12.6% in 2012/3 and 9.2% in 2014/5 based on current projections.
7 Skilling Uganda - BTVET Strategic Plan 2012/3-2021/2

Annexes 2-4 present adetailed implementation plan including targets, activities, phasing and outputs.
A BTVET Reform Task Force will be formed to oversee the implementation of the Strategic Plan until the new integrated skillsorganizationisestablished.TheOfficeofthePrimeMinisterwillappointtotheTaskForceeminentpersonalitiesandexpertsinthefieldsofskillsdevelopment,economicandbusinesssectordevelopmentandsocialpartners.Atleast half the members of the Task Force will represent the private sector. The Task Force will be facilitated by a BTVET Reform Secretariat comprising a small number of high-level BTVET experts recruited on a contract basis. The TaskForcewillworkunderthetechnicalguidanceoftheMoESandreporttotheOfficeofthePrimeMinister.TheTaskForcewillfunctionuntiltheunifiedskillsdevelopmentbodyisestablished.ThecostsofReformTaskForceareestimatedatUGX3900million(USD1.7million)overthefirstfouryears.
The responsibility for monitoring and evaluation of the Strategic Plan and the BTVET development also rests initially with the BTVET Reform Task Force. Annex 2 provides indicators for all objectives, strategies and outputs.
8Skilling Uganda - BTVET Strategic Plan 2012/3-2021/2

1 BACKGROUND AND CONTEXT
1.1 INTRODUCTION
Technical-vocational training is vitally important for the production of critical skills in Uganda. Technical-vocational training is a sound investment for the individual, the employer, and the economy. For the individual, the economic returns on this investment accrue in the form of increased earnings. For companies, the economicreturnsarerealizedthroughgainsinproductivityandprofits.Foraneconomy,thereturnsarefoundin the expanded output of goods and services and economic growth. Skills development for participants in the labour force is important in Uganda for several reasons. Technological change, higher value added andtheincreasedcompetitionflowingfromtradeliberalizationacceleratethedemandforhigherskillsandproductivity among workers. Skilled workers are more readily able to adapt to new processes. Growing, competitiveeconomiesbenefitfromtheirpresenceandtheirmovementtomoreproductiveemployment.
It is equally important to invest in the skills of economically vulnerable people. Skills development is essential for individual prosperity. Skills enable the individual to increase productivity and incomes. This is especially important for the people who muse eke out a living in the informal sector of the economy. Uganda clearly will not be able to generate enough wage jobs for those entering the labour market. The vast majority of new entrants to the labour market will have no alternative but to work in the informal sector. Knowledge and technical skills are essential for workers in the informal sector to increase their productivity and incomes, and raise them out of poverty.
EmployersinUgandaoftencomplainabouttheshortageofappropriatelyskilledandqualifiedworkers.Skillsgaps in some sectors such as construction actually constrain enterprise production and expansion. AIDS depletesscarcehumancapitalandmagnifiestheneedtoreplaceskillsacrossawiderangeofoccupations.The direct impact in companies is manifest, inter alia, in staff turnover, skill shortfalls and high retraining costs. Large segments of the population, including those in the informal sector of the economy, youth and women, lack access to the skills they need for productivity and incomes.
TheUgandansystemofskillsprovision–Business,TechnicalandVocationalEducationandTraining(BTVET)- faces major challenges in improving linkages with the world of work, raising standards and expanding coverage.
ThistenyearplanforBusiness,TechnicalandVocationalEducationandTraining(BTVET)setsoutthemainreforms needed for upgrade the skills of the Ugandan labour force. The strategy builds on considerable progress in the reform of the BTVET system achieved during the last decade, which included the adoption oftheBTVETActin2008andtheestablishmentoftheUgandaVocationalQualificationsFramework(UVQF).
2The BTVET strategy was drafted by a joint team of Ugandan and international experts from late 2010-to mid--2011 under the supervision of a BTVET Working Group. The team consulted with some 300 stakeholders and visited over 70 BTVET providers. Its analytical report was reviewed by 120 stakeholders during a workshop in February 2011. The analysis and views expressed formed the basis for the Strategic Plan.
9 Skilling Uganda - BTVET Strategic Plan 2012/3-2021/2
1.2 ECONOMIC CONTEXT
Uganda’s development framework forms the point of departure of the Strategic plan, especially Uganda’s Vision2025,andmorespecificallyintheNationalDevelopmentPlan(NDP)2010/11–2014/15.TheNDPenvisages to transform the Ugandan society “from a peasant to a modern and prosperous country within 30 years”, reaching middle-income country status by the year 2017. Accordingly, the theme of the Plan is “growth, employment and socio-economic transformation for prosperity”. The Plan puts considerable emphasis on balancing growth with progress in social equity in order to sustainably reduce poverty. It accords high importance to skills development as a means to raise productivity and incomes and enhance competitiveness of the economy, in particular in view of the evolving East African Common Market. NDP targetsandstrategiestoaddressthisnationalskillgap,notablyinitschapters7.2to7.4,havebeenincludedin this Strategic Plan.
1.3 SECTORAL CONTEXT
The Strategic Plan is embedded in the overall education policy framework. The Government White Paper on Education(GWPE1992)laidthefoundationfortheBTVETreformanditsimportantroleinpovertyreduction.It underscored the need to orient BTVET towards employment and national economic needs. BTVET is anintegratedsub-sectoroftheEducationSectorStrategicPlan(ESSP).TheBTVET-specificobjectivesoftheESSPdefinespecific targets to increaserelevanceandquality,andaccessandequity.TheupdatedESSP(2010-2015)envisagesthatBTVETwillcontinuetoexpandparticularlyatpost-primarylevel,withanenrolmenttargetof30%oftotalpostprimaryenrolment.ThetotalBTVETenrolmenttargetfortheendoftheplanperiodissetat290,000students.Overall,theESSPemphasisesashifttowardsqualityofeducationand training with a focus on standards and improving sector governance.
The BTVET Strategic Plan also draws from the Draft BTVET Policy that was formulated in 2003 by a Task Force under the MoES. The draft policy document outlined the framework of an integrated, competency-basedBTVETsystem. Itaimsatwideandequitableaccess,qualityandrelevanceof training,financialsustainabilityandinstitutionalefficiency.Itcallsfortheintegrationofdifferentprovidersystemsincludingformal,non-formal,enterprise-basedtraining,anddiversifiedskillsdelivery.
The Strategic Plan hinges on the BTVET Act of 2008 and incorporates BTVET activities of existing actors, specificallytheBTVETDepartmentandtheDirectorateofIndustrialTraining(DIT)undertheMoES.
10Skilling Uganda - BTVET Strategic Plan 2012/3-2021/2

2 CURRENT SITUATION OF SKILL DEVELOPMENT IN UGANDA
ThepresentBTVET system suffers fromweaknesses in five areas, as summarized in the problem treeanalysis(Annex1):(i)relevancetoeconomicgrowth;(ii)qualityofskillsprovision;(iii)accessandequity;(iv)organisationaleffectiveness;and(v)financingandinternalefficiency.
2.1 RELEVANCE TO PRODUCTIVITY AND ECONOMIC GROWTH
The Ugandan BTVET system is relevant to economic growth to the extent it equips Ugandans with the right set of skills to make a living through self-employment and enables companies to compete in domestic, regional and international markets.
The BTVET system still does not produce the appropriately skilled workforce that Uganda needs to increase incomesandemployment,andtocompeteintheEastAfricanandinternationalmarkets.Fewerthan40%oflargeandmediumfirmsconsidercoursesofferedbyBTVETinstitutionstoberelevanttotheirrequirements.
A demand-responsive skills system require greater engagement of employers in the BTVET system, a more flexiblestructureoftrainingsupplyandbetterinformationaboutlabourmarketdemands.
Some progress has been achieved recently with introduction of the Uganda Vocational QualificationsFramework (UVQF). TheUVQF isamajor tool toensure that trainingcontentsarealignedwith theskilldemands in the labour market, and that training is re-focused to practical competencies. However, the UVQF requires more vigorous implementation. Major issues of relevance include:
• BTVETprogrammesforagri-businessdevelopmentandinformalsectoremploymentarestrikinglyinsufficientinenrolment,contentandtrainingmethodologies.Agricultureandtheinformalsectorarethemost important sub-sectors of the Ugandan labour market now and for the foreseeable future. Agricultural employmentabsorbssome70%oftheUgandanworkforce.Thenon-farminformalsector,whichcomprisesmainly micro enterprises, own account workers and unpaid family workers, accounts for 18% of totalemployment,andalmost60%ofthenon-agriculturalemployment.
• BTVETprogrammescoveranarrowrangeofoccupationsanddonotaddressskillsneedsinmodernproductivesectors.Skillsdeficitsoccurinthehospitalityindustry,ICTsector,businessmanagementandfinancialsector,miningandengineering,oilandgas,andforenvironmentaltechnologies,amongothers.• EmployersassertthatBTVETgraduatesoftenlackpracticalcompetencies.Techniciansespeciallyneed more practical training. • Softskillsnecessaryformodernworkareunderemphasizedintrainingprogrammes.Theseincludecommunication, computer literacy, customer care, problem solving, work attitudes and ethics.
3The Strategic Plan uses the term “skills development” to refer to the actual process of imparting skills and the outcome of education and training, i.e. improved skills and competencies. “BTVET” applies to the institutional system, i.e. the source of education and training.
11 Skilling Uganda - BTVET Strategic Plan 2012/3-2021/2

2.2 QUALITY OF SKILLS PROVISION
Quality is the effectiveness of training in relation to intended outputs. Good quality ensures trainees achieve expected competencies.
Several public and private BTVET institutions have been upgraded in recent years with government and international funding. Some are well-managed and resourced, able to deliver quality training. However, most of the more than 1,000 private and public BTVET institutionsfail to deliver training commensurate with required standards. One indicator is the low pass rate in BTVET examinations. About half of all registrants for UNEB BTVET examinations fail to pass their examinations. Results in DIT trade testing are slightly better, but also indicate severe problems particularly in modern occupations.
Better quality required better qualified BTVET instructors as well as better training infrastructure. Thephysical infrastructure of many institutions is dilapidated and inadequate for the number of enrolled students. Most workshops lack essential training equipment and tools. The BTVET system fails to provide adequate quality control. Further, BTVET institutions lack incentives to improve their performance. They are not held accountable for results.
2.3 ACCESS AND EQUITY IN BTVET
Access and equity refer to the opportunities of people to acquire needed skills through relevant training programmes. Equity means the extent to which all segments of the population , including females, persons with disabilities and other disadvantaged groups, have equal access to training.
Opportunities for skills training have been increasing. Enrolments in public BTVET increased by 25%between2007and2009. TheNon-Formal TrainingProgramme (NFTP) launchedby theMoES in2010also increased the number of Ugandans who acquired employment-relevant non-formal skills. New BTVET institutionscurrentlyunderconstructionin14districtswillcreatenewtrainingopportunitiesinpresentlyunder-served areas.
Still,relatively few school leavers – and fewer adults and dropouts – access organized training, especially throughformalBTVET.Publictrainingprovidersaccommodateonlyabout1%ofprimarysevencompleters,3%ofO’leveland7%ofA’levelgraduates.Evenifprivateprovisionistakenintoaccount,theselevelsstillfallfarshortofNDPtargets.TheNDPcallsfortheBTVETsub-sectortoenrol10%ofallP.7graduatesand30%ofO’levelcompleters.Ironically,manyBTVETinstitutionsoperatebelowcapacity.
ManygroupsdonotbenefitfairlyfromBTVETprovision.Inparticular,-
• Lowincomegroupstendnottoparticipatebecauseofhighfeesandhighopportunitycostscaused bylongtrainingdurations;• Thosewhodroppedoutbeforecompletingprimaryschool,almosthalftheyouth,werenot addressed at all until 2010when the NFTP was initiated. • FemalesaccountforonlyaboutonefourthofpublicBTVETenrolments,andareconcentratedin traditional female occupations.• Personswithdisabilities,around16%ofthepopulation,arevirtuallyexcludedfromtraining opportunities in the public system.• Adultshavefewavenuestoupgradeorlearnnewskills.• PersonslivinginKaramojaandtheNorthernregionshaveconsiderablyfeweropportunitiesto acquire skills through training programmes.
12Skilling Uganda - BTVET Strategic Plan 2012/3-2021/2

2.4 ORGANISATIONAL EFFECTIVENESS
Better skills development requires strong organization and management of BTVET. Important steps were accomplished in recent years, including restructuring of the MoES, strengthening of the DIT as a semi-autonomous body and especially expanding public-private partnerships. The Uganda Association of Private Vocational Institutions (UGAPRIVI)hasemergedasastrongprivatesectororganisation facilitatingskillsprovision.
However, the management of BTVET remains highly fragmented. Within the MoES sixteen directorates, departments, divisions and institutions are fully or partly charged with different BTVET functions. These include the DIT, the BTVET Department, DES, UNEB, NCDC, the Department of Higher and Vocational Education and Training, the Department of Teachers and Instructor Education and Training, and others. Other ministries and institutions are involved in managing their own BTVET institutions, and in policy development (e.g. theNationalPlanningAuthority–NPA).Manyof the involvedorganisationsandunitsare poorly resourced. Responsibilities between different players are often unclear and overlapping. Main decisions onBTVET aremadewithin theMinistry’s SWAp (sector-wide approach)mechanism,which isdominated by general education stakeholders and has only limited representation of BTVET interests. The expertise of core BTVET stakeholders, such as employers and business sector representatives, employee representatives, civil society as well as other sector ministries is not systematically used for BTVET planning, policy development and monitoring.
Additionally, public BTVET institutions lack authority to take action on their own. Governing bodies have considerable responsibilities, however key decisions, e.g. about training fees and budgets, require MoES approval. Decisions about training courses are in reality taken in theMinistry. Lack of authority stiflesincentives and results in a “dependency syndrome”, where institutions expect the central Ministry to solve theirproblems.Itdiscouragesinitiativeandinnovationatthelocallevel,andconstrainsflexibleresponsesto local market opportunities. This is reinforced by the lack of accountability in public institutions. Neither the BTVET Department nor governing bodies have performance agreements with institutional managers. Managers, instructors and governing bodies are not held accountable for training results. Good or poor examination pass rates do not lead to recognition, rewards or sanctions. Teacher absenteeism occurs widely without consequences for headmasters or teachers.
2.5 FINANCING AND INTERNAL EFFICIENCY
Shortage of funding is clearly among the binding constraints of BTVET development in Uganda. Resource constraints affect all levels of the BTVET system, including the regulatory structure and BTVET institutions. At BTVET institutions funding shortages result in low teacher salaries, out-dated equipment and facilities and unavailability of training material, all negatively affecting the quality and the image of BTVET. At the regulatorylevel,financialconstraintsleadtounderstaffingandslowimplementationofreforms,,suchasthedevelopmentofAssessmentandTrainingPackages(ATPs).
BTVETlacksdiversifiedsourcesoffunding.ThetwomajorsourcesofBTVETfunding,thepublicbudgetandprivatehouseholds(throughtrainingfees)facetightconstraints.TheshareofBTVETintheMoESbudgetisrelativelylowat4%.AlsopublicunitspendingislowevenbyAfricanstandards.PrivatefinancingofBTVETcontributes substantiallythrough fees in public and private institutions, but poverty and low household incomes limit the scope for increasing private contributions.
13 Skilling Uganda - BTVET Strategic Plan 2012/3-2021/2

3 PRIORITY REFORMS AND INVESTMENTS
3.1 SKILLING UGANDA: THE PARADIGM SHIFT
The Strategic Plan is titled “Skilling Uganda”. The concept of “Skilling Uganda” denotes a paradigm shift for skillsdevelopmentinUganda(Figure1).TheBTVETsystemwillbetransformedfromaneducationalsub-sector into a comprehensive system of skills development for employment, productivity and growth. Instead ofeducationalcertificates,themainpurposewillbetocreateemployableskillsandcompetenciesrelevantin the labour market. Training contents will be aligned with skills requirements in the labour market. The new BTVET system will embrace all Ugandans in need of skills, not only school leavers.
Figure 1
This reform requires new thinking and new concepts for the way BTVET is planned, organized and implemented. It calls for a broader scope of BTVET in (i) stakeholder participation, particularly employers, (ii) target groups, including adults, disabled and out-of-school youth), (iii) occupations, and (iv) ministries, including agriculture, industry.
3.2 PRIORITY REFORMS
Fourmain policy and institutional interventions are critical for a successful BTVET reform: • buildingprivateparticipationinskillstraining; • creatingstrongBTVETorganizationandmanagementcontrolledbyallmajorstakeholders; • makingworkrequirementsthebenchmarkforallBTVETqualifications;and • reformingthesystemoffinancingBTVETtoachievelong-termsustainability.
Building private sector participation in BTVET
Thepublicsectorneedstofurtherstrengthenpartnershipsbothwithemployers(thedemandsideofskills)andprivatetrainingproviders(supplyside).Internationalexperienceshowsthateffectiveandrelevantskillsdevelopment systems invariably are built on strong alliances with employers and the business sector. Such
Main purpose
Target Groups
Delivery context
Management
Educationalcertificates
Skills and competenciesrelevant in the labourmarket
All Ugandans in need ofskills development
Flexible, workplaceoriented envronment
Public/privatepartnership
(Low achieving)school leavers
School system
Government
Paradigm Shift in BTVET
14Skilling Uganda - BTVET Strategic Plan 2012/3-2021/2

alliances involve joint efforts in policy development, planning, monitoring and quality assurance. However, equallyimportantarepartnershipsintrainingdeliveryandtrainingfinance.Until recently,Ugandanemployerswerebyand largepassivebeneficiariesof technical-vocational training.However, private firms show an increasing interest in skills development, and some sectors are planningindustry-driven initiatives to skills development. Notable examples include the construction sector and companies in the oil industry. The Plan explicitly welcomes such initiatives and seeks to support employer-based training initiatives with a favourable regulatory environment, appropriate incentives and specificprogrammes.
Under the Strategy private training providers, already with more than 1,000 institutions, will be supported to expand further to foster a market-led expansion of BTVET supply. Private providers (which include private commercial,faith-basedandNGO-runinstitutions)willreceiveaccesstoallsupportschemesofferedtoBTVETinstitutions, and will be assisted with public subsidies if they invest in under-served regions and build training supply in priority occupations.
Employers will be made an important part of the governance structures in the BTVET system, both at central and institutional levels. Employers, and the business community at large, know best what skills the market requires. They must become equal partners of government in policy development, planning, governance of the BTVET system and allocation of funds.
Creating strong BTVET organization and management controlled by all major stakeholders: building a unified organization for skill development
Taking into consideration international experience in other African countries and elsewhere, a new autonomous BTVET organisation will be established that integratesunder one roof currently isolated stakeholders and fragmented public BTVET managements. This will provide BTVET with the power to coordinate. Employers, representatives of the business community, employee representatives, civil society and other sector ministries will acquire a strong voice on skills development.
Making work requirements the benchmark for BTVET qualifications: expanding the scope of the UVQF
TheUVQFseeks toalignBTVETprogrammesandqualificationswith theneedsof the labourmarket. TheUVQFensuresthatemployersandindustryexpertsdefineoccupationalstandardsandtrainingcontent,Itisan antidote against supply-driven, academia-focussed formal training programmes, which failed to provide graduates with competencies and skills relevant to the needs of the labour market. All formal and (where possibleandappropriate)non-formalprogrammeswillbebasedonUVQFstandardstoensurethatallBTVETgraduates are equipped with employable skills. Completers will be assessed against these standards. This will facilitateupwardsprogressionwithintheBTVETsystem.Occupational-specificpartsofBTVETcurricula,forwhicheducationalcertificatesareawarded,willbebasedonUVQFstandards.
TheUVQFreformwillbeexpandedtoencompassdiplomaqualifications.Thisrespondstotheurgentrequestof employers to produce more diploma-level BTVET graduates with relevant practical skills. Curriculum development will be accelerated based on UVQF standards.
Reforming the system of BTVET funding
Under-fundingofBTVETcontributessignificantlytopoorrelevanceandlowquality.BTVETreformwillrequireadditional resources to improve the quality of training, build quality assurance, and increase access. The reformwillfailunlessthefoundationsarelaidatthestartforefficientandsustainablefinancing.
15 Skilling Uganda - BTVET Strategic Plan 2012/3-2021/2

TheStrategicPlanaddressesfinancialsustainabilityintwoways:(1)linkingfinancialtransfermechanismstoperformance;hisisdesignedtoraiseinternalefficiency,andproducebetterresults;(2)diversifyingfundingsources for BTVET, notably through the introduction of a training levy and efforts to increase income generated by BTVET institutions.
3.3 PRIORITY INVESTMENTS
TheStrategicPlanidentifiesfivepriorityinvestmentstoachieveitsambitiousreformsinexpansionandquality:
(a) Investments to expand training outputs in critical sectors:
i. Expanding training in NDP priority sectors
Thecurrenttrainingsupplyisnarrowinscopeanddoesnotreflectskillsneedstosupporteconomicgrowth,modern technology and implementation of NDP investments. New needed programmes range from modern serviceoccupations(e.g.financialservices),specializedengineeringandconstructionprogrammes,energytechnologiestogreentechnologies.TertiaryBTVETneedstobereconfiguredtoincreasenationaloutputsintechnology programmes.
Atthemomentonly15%ofalltertiaryBTVETenrolmentisrecordedinTechnicalColleges.Trainingcapacityneeds to be expanded based on industry priorities and standards. Notably the oil industry and construction sector anticipates a significant demand for trained labour over the near to medium term. Industry hasindicated strong interest to support necessary skills development. Initiatives will start immediately to expand the relevant BTVET supply.
ii. Expanding and improving agriculture training
Employmentinagricultureaccountsfor70%oftotalemploymentinUganda.Thisshareisnotexpectedtodropsignificantlyinthenearfuture.Morethanhalfamillionnewlabourmarketentrantseveryyeararelikelytobeforcedfindworkintheagriculturalsector.
Agricultural production in Uganda is largely uncompetitive. Unacceptably high post harvest losses occur, and farm mechanization is low. Farmers lack modern production skills. Jobs in modern agri-businesses are often held by foreigners. For export promotion and import substitution, farmers need to diversify into new products and enterprises, which require skills that are presently unavailable.
In spiteof the importance of agriculture training has never been accorded appropriate attention. Enrolment in publicandprivateagricultureBTVETatalllevelsislow,accommodatingonlyaround4,600newtraineeseachyear.Trainingoffersareinsufficientlydiversifiedintermsofspecializations,unevenlydistributedthroughoutthe country andnot specific toneedsof different target groups.Programmesare generally of lowqualitycaused by inadequate resources.
The plan therefore envisages considerable investment in the expansion of the agricultural BTVET supply, rehabilitation and revitalization of training facilities, new and improved curricula and human resource development for instruction and management of training. The plan calls for more than 100 billion UGX to be investedinagricultureduringthe9-yearsplanperiod.
Agricultural training has long suffered from inadequate communication and coordination between the training system and the relevant agencies in agricultural development. Coordination and linkages between the MoES andtheMinistryofAgriculture,AnimalIndustriesandFisheries(MAAIF)andotheragriculturestakeholders
16Skilling Uganda - BTVET Strategic Plan 2012/3-2021/2

will be strengthened and institutionally established. Farm schools will be transformed into Agricultural Skills DevelopmentCentres(ASDC)withthemandatetotrainschoolleaversaswellasfarmersasneeded.Newandhigher-level institutions will have to be built, once the quality of existing institutions is improved. The transfer of farm schools from the MoES to the MAAIF will be considered to increase the relevance of agriculture training.
New standard and curricula will be developed to increase quality and relevance of agriculture training. The introductionofpostS4levelagriculturetrainingwillcloseanexistinggapinqualificationsandwillensurethatagriculture trainees have opportunities for educational progression.
iii. Skills for productivity in the informal sector
Uganda’s informal sector operates at low levels of productivity and employment has declined in recent years. Yettheinformalsectorremainsastrongholdofemployment,accountingforalmost60%ofnon-agriculturalemployment in Uganda. Increased productivity in the informal sector requires, inter alia, improved skills.
However, the BTVET system has largely neglected the training needs for informal sector employment. There is no systematic approach to skills development for people already in or expected to enter the informal sector. Much of the training is supply driven, not based on market assessments and only duplicates formal sector training at very low levels. Some effective programmes cannot be replicated due to lack of information exchange and resources.Trainingfortheinformalsectorislargelydonor-financedandthereforenotsustainable.
Recognizing the importance of micro and small enterprises for economic growth and employment generation, the Strategic Plan includes bold steps to expand training for the informal sector, improve its relevance and effectiveness and to make it an integral part of BTVET in Uganda. The Plan focuses on building targeted informal sector training based on the needs of local markets. It will invest in building the capacities of non-formal training providers. Regional centres will be established to facilitate communication, coordination and support networks. An Innovation Challenge Fund will be set up to stimulate new training approaches. Programmes will also expand and improve traditional apprenticeship training.
(b) Investment to raise the quality of trainingi. Strengtheningexisting BTVET institutions
Sub-standard BTVET quality contributes to the low image of skills training in Uganda and to low capacity utilization. Quality improvements in the training delivery are therefore a top priority of BTVET development over the next ten years.
Public investment in BTVET will address mainly the quality challenges by strengthening existing BTVET institutions. It will include rehabilitation and expansion of buildings and workshops, up-to-date training equipment and thorough human resource development. For this, the GoU will seek support from its developmentpartners.CentresofExcellence(CoE)willbesetupforcriticaloccupations.
After current projects are completed to establish new BTVET institutions, no new BTVET institutions will be built (exceptforexceptionalcases),untiltheexistingBTVETinfrastructureisraisedtointernationallycomparablestandards.
ii. BTVET instructors trainingThe plan also features bold investments to develop pre- and in-service instructor training. More instructors are requiredtoserviceplannedexpansion.BetterinstructorsarerequiredfitforthenewcompetencerequirementsforUVQFcourses.Thecurrentinstructorstrainingsystemwillbereconfigured,whichincludesacurriculumreform and the designation of new BTVET institutions as instructor training centres.
17 Skilling Uganda - BTVET Strategic Plan 2012/3-2021/2

4 OBJECTIVES AND STRATEGIES
The Strategic Plan is meant to accelerate reforms and guide the rational use of investments. The 10-year Strategic Plan covers 2012/3 to 2021/2. The Plan aims at the following high-level development objective:
Ugandans and enterprises acquire the skills they need to raise their productivity and incomes.
The Strategic Plan contributes to the achievement of Uganda’s Vision 2025, more specifically the goals andobjectivesformulatedintheNationalDevelopmentPlan(NDP)2010/11–2014/15initschapters7.2to7.4,andtotheBTVETspecificobjectivesoftheEducationSectorStrategicPlan.
ThePlanhasfiveobjectivestoreachthedevelopmentobjective:
1. Raise the economic relevance of BTVET 2. Increase the quality of skills provision3. Provide equitable access to skills development4. AchievegreatereffectivenessinBTVETmanagementandorganisation5. IncreaseinternalefficiencyandresourcesavailabletoBTVET
The BTVET Strategic Plan is a full sub-sector plan, integrating existing and planned activities with new strategies to improve and expand skills development in Uganda.
4.1 OBJECTIVE 1: RAISE THE ECONOMIC RELEVANCE OF BTVET
Objective 1 clusters seven strategies aimed at making the BTVET system more relevant and responsive to labour market needs.
Achievement of the objective will be measured by the degree of satisfaction of employers with the competencies of BTVET graduates, and by the level and nature of graduate employment after training.
The individual strategies are geared to address the most urgent challenges: linking BTVET and the business community, gearing occupational standards and curriculato labour market needs, adjusting training provision to market needs of their clientele, and broadening training supply in occupations essential for the country’s development – including agriculture, the informal sector and emerging technologies.
18Skilling Uganda - BTVET Strategic Plan 2012/3-2021/2

TargetsObjective 1: Raise the economic relevance of BTVET
By 2020:70%ofemployerssatisfiedwithcompetenciesofBTVETgraduates80% of BTVET graduates entering the labour markethave found employment / self-employment generating sufficientincome
Strategy 1: Strengthen the role of the business community(includinginformalsector)andemployersinBTVET
Enhanced role of the business community and employers in BTVET
Strategy 2: Expand the coverage of the UVQF and accelerate its development
UVQF is the legally recognised and implemented frameworkforBTVETqualificationsuptoLevel5
Strategy 3:Makethetrainingsupplymoreflexibleanddemand-driven
BTVET institutions continuously adjust their programmes and curricula in response to changing needs of the labour market
Strategy 4: Boost BTVET supply in critical occupations Share of UTC graduates of all tertiary BTVET graduates increasedto40%by2020(baseline:15%in2008)At least 50% of all post secondary BTVET enrolmentcoversdefinedpriorityareas
Strategy 5: Expand and improve agriculture training Completers of agriculture BTVET increased to xxx by 2020
Strategy 6: Promote skills for productivity in the informal sector and for MSEs
Atleast70%ofparticipatinginformalsectorenterprisesconfirm that upgraded skills contribute to higherproductivity and raising of product quality
Strategy 7: Establish Labour Market Information System (LMIS)
LMIS regularly produced data and information for BTVET planning and career guidance
19 Skilling Uganda - BTVET Strategic Plan 2012/3-2021/2
Strategy 1: Strengthen the role of the business community and employers in BTVET
Strong employer involvement is an essential ingredient in a relevant and dynamic system of skills development, as employers tend to know best what skills are needed. The Strategic Plan therefore seeks to deepen the partnership betweenemployers(andthebusinesscommunityatlarge),governmentandtraininginstitutions.Thiswillbuildonthe increasing interest of Ugandan employers in skills development and preparedness to play a more active role.
The Strategy has two sub-strategies:
1. Strengthen the role in BTVET planning and decision-making:
EmployersandotheractorsofthebusinesscommunitywillbeaddedinsufficientnumbersasmembersinthegoverningbodiesofallBTVETinstitutions.Thetargetisthatby201550%ofallmembersofgoverningbodies of BVTVET institutions represent employers and members of the business community. This will requireamodificationofregulations.
Employers will also represent a strong force in the governing board of the new skill development body once created. A stronger role in policy development, planning and monitoring of BTVET also requires capacity building of employers. Therefore, special capacity building programmes will be organised, and employer and business sector representatives will participate in all relevant study tours and other capacity building events for BTVET experts.
2. Strengthen employer-based training:
Training activities by employers will be supported, either in-house or delivered by external training providers. The GoU (including theMinistry of Finance, Planning and Economic Development) in cooperationwithemployers and their associations will design and launch an attractive incentive package, which may include tax incentives and cost-reimbursements once the training levy is set up.
Theprovisionofinternshipsiscurrentlynotsufficienttomeetthegrowingdemand.Togetherwithemployers,trainingauthoritieswilldevelopaplantoimprovetheavailabilityofinternships.Thiswillincludeaflexibleacademic calendar to ensure that internships can be provided year round. Furthermore, pilot programmes willbesupportedforthedevelopmentofpartnershipsintraining(e.g.dualtraining).
Strategy 2: Expand the coverage of the UVQF and accelerate its development
TheUVQFwith itsoccupationalprofiles,assessmenttoolsandtrainingmodules(compiledintheso-calledATPs)bases training contents on skills requirements of the real world of work. Its further development and systematic implementation is therefore key to improving the relevance of BTVET. Two sub-strategies will work towards this:
1. Clarify the conceptual framework for the UVQF and strengthen related management capacities:
ThehorizontalandverticalscopeoftheUVQFstillneedstobedefined,androlesandresponsibilitiesinassessmentclarified, to avoid costly duplication in curriculum development and assessment/certification. This requiresconsultationsamongstakeholders,includingemployers.Conceptualissuesstilltobeclarifiedinclude:
• TheinclusionoftertiaryBTVETqualificationsintheUVQFtoaddresstheneedforpractically orientedtechnician-leveltraining;• ThehorizontalscopeoftheUVQF,forexamplewithrespecttohealthprofessionsandothers;
20Skilling Uganda - BTVET Strategic Plan 2012/3-2021/2
• TheroleoftheUgandaBusinessandTechnicalExaminationsBoard(UBTEB)andotherexaminations boards(UNMEBandHAPEB)inassessment/certificationvis-à-vistheDIT;• TheprogrammestructureofformalBTVETprogrammes--duration,howtointegratetechnical educationwithUVQFstandards,andflexibleentryandexitthroughmodularisation.
The institutionalcapacitiesofDIT, instaffingandresources,willbesignificantlystrengthenedtoaccelerateATPdevelopment and to conduct wider ATP-based assessments. Technical sector committees of the ITC will be established to guide these processes.
2. Implement UVQF-based training throughout the BTVET system:
Resources will be provided to DIT for the development of competency-based training through ATPs for all relevant occupations. The target is to have ATPs in 200 occupations by 2015. By 2020, ATPs should form the basis of all formaltraininginUganda.ATPswillbegivenpriorityfornewoccupations(seeStrategy1.4)andagriculturetraining.EmployersandbusinessassociationswillbeinvitedtoleadATPdevelopmentintheirrespectiveoccupationalfields.
Assessment centres will be accredited, the test item bank further developed and substantial training provided for assessors. By the end of the plan all leavers of BTVET programmes will have access to UVQF assessment and certification.Curriculaforformaloccupation-specifictrainingwillberevisedtoUVQFstandards.
Strategy 3: Make training more flexible and demand-driven
The lengthy, narrow training supply is not responsive to changes in the labour markets and to skills people need. The introductionofmodular,competency-basedtrainingallowsformoreflexibilityandresponsiveness.BTVETinstitutionswill take initiative to introduce new programmes, adapt existing curricula and close or suspend programmes with low demand in accordance with market surveys. Governing bodies and managers of BTVET institutions will be offered training to improve their capacities to offer demand-responsive training. Capacity building programmes in market and training needs assessments will complement this. Institutions will be required to conduct tracer studies regularly for monitoring purposes.
The formal BTVET programmes will be restructured into shorter courses concentrated on practical work skills. . During the Plan period formal training programmes will be modularised to facilitate shorter training. All programmes will be based on occupational standards developed by employers under the UVQF.
Curriculum reformwill continue for post-secondary certificateanddiploma level programmes.Programswill beshortened by an average one year each with the introduction of competency-based modular training.
Post-primary Technical Schools and Community Polytechnics will be converted into Skills Development Centres (SDC). The centres will offer modularised programmes with flexible entry and exit points, along with short,community oriented non-formal training programmes. SDCs will target P.7 leavers providing options for both educational progression and employment. However, their mandate will also be to serve training needs for adults in the communities.
New curricula BTVET curricula will also emphasizethe so-called soft skills that are largely underdeveloped among the Ugandan workforce.
21 Skilling Uganda - BTVET Strategic Plan 2012/3-2021/2

Strategy 4: Boost BTVET supply in critical occupations
The availability of workshop facilities and instruction staff, rather than needs in the labour market, dictate the kinds of training offered. New skillsare important to keep Uganda abreast with technological developments regionally and internationally, but have been neglected. Training and skills upgrading have not been provided for priority investments under the NDP. Labour market information indicates training needs in the ICT and hospitality sectors, forserviceprofessionalsathigherqualificationlevels(e.g.financialservices),inmetalandmachineryoccupations,construction technologies and machine operators, modern mechanics, and oil and gas technologies. Skills are also missinginenergyandenvironmental(green)technologies.NDPprioritiesfurthercallforare-adjustmentofhealthtraining to meet the country’s health targets.
The Strategic Plan will expand or create programmes to produce these critical skills. It will identify priority occupations based on market information and employer requirements. Training infrastructure will be adapted to accommodate newprogrammes.Enrolmentintechnologywillbesignificantlyexpandedattertiarylevel.
Immediatepriority will be to develop and put in place skills development programmes for the oil industry. At least 10,000 jobs can be created directly and indirectly during the initial phase of oil extraction in Uganda. The oil industry hasalreadyindicateditsinteresttodrivethetrainingprocessfromidentificationthroughdelivery.Thesectorhasthepotential to spearhead the implementation of the Strategic Plan by producing “quick wins” and produce examples for other key sectors.
Strategy 5: Expand and improve agriculture training
The range of training offers will be expanded in food processing, animal husbandry, agri-business and agricultural mechanization. Programmes will be modernized in accordance with CBET principles. Coordination between the MoES and the MAAIF will be strengthened. The option to transfer the existing farm schools to the MAAIF will also be explored. Activities under three sub-strategies include:
1. Establish, improve and expand facilities for agriculture BTVET:
Considerable resources will be invested to improve and expand the training infrastructure for agriculture training. Generally the Strategic Plan seeks to improve existing training facilities rather than build new ones, but agriculture is an exception. During the plan existing Farm Schools will be upgraded and converted into AgriculturalSkillDevelopmentCentres(ASDCs)withabroadermandateforagriculturetraining.Successdepends on solid coordination mechanisms between the MoES and the MAAIF.
TrainingfacilitieswillbeupgradedintheDistrictAgriculturalTrainingandInformationCentres(DATIC).Onenew ASDC will be built in Northern Uganda, currently undersupplied with agricultural training. Furthermore, the Bukalasa Agricultural College and the Fisheries Institute will be upgraded to Centres of Excellenceand new specialised departments established in all existing agricultural training centres. Eventually, new BTVET institutions for Veterinary and Food Science and Technology will be established.
2. Strengthen linkages of BTVET institutions with research, industry and farmers:
Linkages between BTVET institutions and research, industries and farmers will be strengthened, inter alia throughtheappointmentofaspecialliaisondeskofficerintheMAAIF.
3. Strengthencompetency-basedtraining(CBET)inagriculture:
22Skilling Uganda - BTVET Strategic Plan 2012/3-2021/2

ATPs will be developed for new agricultural occupations. New courses woll be facilitated through curriculum development and teachers training. These activities will benefit from the strengthened coordinationmechanismsbetweenMoESandMAAIF.NewstandardsandcurriculaneedtobedevelopedforpostS4agricultural BTVET to ensure that ASDC graduates have the chance for educational progression.
Strategy 6:Promote skills for productivity in the informal sector and for micro and small enterprises (MSEs)
Well-designed and targeted skills development programmes will be expanded for existing and potential MSE operators and informal sector workers. New markets, value chains and product innovations are essential for increased productivity. This requires capacity building of local training providers in business viability and training needs assessments. The strategy aims to unlock the potential of NGOs, CBOs, or business sector programmes, for example, as well as of traditional apprenticeship training provided by master craftspersons.
The Strategy embodies four sub-strategies:
1. Establish non-formal training as an integral part of the BTVET system:
Non-formal skills development will be recognized as a core segment of the national BTVET system. This requires an appropriate representation of informal sector representatives in all BTVET bodies, including the ITC and its technical sector committees, governing bodies of BTVET institutions as well as any future new governing BTVET body. Public allocations for non-formal training will be integrated into the overall BTVET budget.AspecialdeskofficerwillbeemployedintheBTVETDepartmenttoensureappropriateattentionto non-formal training.
2. Build human and institutional capacities among skills development providers in training for the informal sector:
Special competencies are required among providers to develop and deliver relevant, market-oriented skills development for informal sector employment. These competencies include conducting market and businessviabilityassessments(suchasidentificationofnewmarketsandproducts),programmeplanningand management, curriculum and training material development, and specialized instructional skills. Capacity building programmes will target managers of BTVET institutions, instructors as well as master craftspersons involved in traditional apprenticeship training.
3. Create information, cooperation and coordination networks:
Non-formal training initiatives need to be coordinated and cooperative networks developed locally . For this purposeRegionalSupportCentres (RSC)will be created in each region. These centreswill initiallytake the form of a special function in one selectedBTVET institution per defined region, chargedwithfacilitating necessary coordination and capacity building among non-formal skills providers. Establishing and maintaining an inventory of all providers in the region would be an initial task of the centres.
4. PromoteinnovationinskillsdevelopmentforMSEsandtheinformalsector:
Skills development for informal sector employment cannot follow a uniform approach, but must be tailored tospecifictargetgroupsandmarkets.Newdeliveryapproachesandpartnershipswithotherstakeholderscan raise the relevance, quality and cost-effectiveness of programmes. Successful programmes in other countriesmaybeadaptedtofitUganda.Skillsdevelopmentneedstobelinkedtotechnologyresearchandinnovation. An InnovationChallengeFund (ICF)will thereforebe created tohelpprovidersdevelop,pilotand evaluate new approaches to non-formal skills development. The purpose of the fund is to stimulate
23 Skilling Uganda - BTVET Strategic Plan 2012/3-2021/2

innovation in skills development, and to findoutwhichapproachesworkwell inUgandaandwhichdonot.TheICFwillthereforespecificallyemphasizemonitoringandevaluationofsupportedprojectsandadiscussion on best practices in Uganda. Successful models will be funded throughout the country. The fund willalsofinancespecialprogrammesaimingatexpandingandimprovingtraditionalapprenticeshiptraining.
Strategy 7: Establish a Labour Market Information System (LMIS)
Market failure exists oninformation about demand and supply of skills. Labour market information is currently not systematically and regularly collected in Uganda. Available information is scarce and sketchy, especially on skill needs. Market information is needed to inform BTVET planning processes, and also to inform, guide and vocationally counsel those who have to make occupational choices.
The Strategic Plan therefore envisages setting up a BTVET-LMIS for Uganda. The conceptualization process will draw on international good practice and will be harmonized with the agreed joint initiatives of the EAC partner countries. Systemdesignandimplementationwillinvolverelevantstakeholders,specificallythebusinesssector,theMinistryofGender,LabourandSocialDevelopment(MoGLSD)andtheUgandaBureauofStatistics(UBOS).Itisnotproposedto transfer the current MoGLSD information system to BTVET, but to create capacities within the BTVET system to prepare needed labour market information for BTVET planning purposes. Such a function would consolidate, analyseand interpretexistingdata,analysefindings fromtracerstudiesand localmarketsurveysconductedbyBTVET institutions, as well as organise consultative processes with employers. The LMIS design therefore needs to provide for an operational system of interaction between central and local institutions for data collection and disseminationofinformation.ItwillbelinkedtotheBTVETManagementInformationSystem(MIS).
4.2 OBJECTIVE 2: INCREASE THE QUALITY OF SKILLS PROVISION
Quality improvements in Uganda’s training supply are a pre-requisite for improved relevance in the BTVET system. The Plan intends to raise quality by investing in instructors’ training, strengthening of BTVET infrastructure, andintroducing modern quality assurance systems.
4See Objective 4, Strategy 3.
Targets
Objective 2: Increase the quality of skills provision BUVQF assessment pass rates increased to 90% by2020
Strategy 1: Strengthen institutional capacities of BTVET providers
At least 250 public and private BTVET institutions upgraded by 2020
Strategy 2: Better production and deployment of instructors/tutors
Number of active BTVET instructors increased to xx by 2015 and to xx by 2020
Strategy 3: Introduce better quality assurance systems for public and private BTVET providers
Quality assurance system in place in line with regional standards and practices
ThemainmeasureofsuccesswillbeincreasedpassratesofBTVETcompletersinnational(UVQF)assessments.
24Skilling Uganda - BTVET Strategic Plan 2012/3-2021/2

Strategy 1: Strengthen institutional capacities for BTVET provision
The Strategic Plan envisages considerable investment in the rehabilitation, revitalization and improvement of the existingtraininginfrastructure.However,improvingthetraininginfrastructurealonewillnotsufficetomaketrainingbetter. Better physical infrastructure must be accompanied by better institutional planning, human resources and curricula and training materials.
Throughouttheplanatleast40publicBTVETinstitutionswillundergocomprehensiveinstitutionalstrengthening.Selectioncriteriaincludegeographicalspreadandpriorityoccupationalfieldsforskillsdevelopment.Developmentofthe oil industry in Uganda will be given immediate priority. In view of limited capacities within Uganda, the Government of Uganda will seek external assistance. Partnership arrangements with leading vocational and technical institutions in other countries would be preferred.
Further, a BTVET Investment Fund will be set-up to be accessed by private and public BTVET providers on a competitive basis based on institutional development plans. The Fund will provide resources for expansion or rehabilitation, for human resource development and new programmes based on labour market needs. The fund is designed to stimulate initiatives from the grass roots. It would require self-assessment and initiatives by institutions to improve quality.Thedesignof thenew fundwillconsider lessons fromtheGermanKfW-financedmodelof thePPTP/IP-BTVET.
Aconcept forCentresofExcellence (CoEs)willbedevelopedbasedonexperiences inothercountries.CoEsareplaceswhere technical expertise (experienced staff, assisted by outside experts) is concentrated for particularoccupations. The CoEswill be located close to the relevant industries and labour markets to facilitate a close relationship between training and the world of work. Where possible, CoEs will be managed by or in cooperation with industry(orindustryassociations).Cooperationwillbeexploredintheconstructionindustry,whichhasexpresseditsdesire to foster skills development in its sector.
All public and several private BTVET institutions will receive support during the plan period to upgrade their ICT facilities in order to introduce ICT-based training and improve training management. This will be based on a strategy to introduce “E-BTVET” in Uganda.
Strategy 2: Achieve better training and deployment of managers and instructors by reforming qualifications and recruitment practices.
Theshortageofskilledinstructorsisabindingconstraintforqualityimprovement.Institutionshavemajordifficultiesin recruiting and retaining sufficient qualified instructors. The shortage will become evenmore acute with theexpansion of CBET in accordance with UVQF standards and the expansion of non-formal training, both of which emphasize practical instruction. The Strategic Plan addresses this challenge with three sub-strategies. These are further elaborated in the Plan for Development of BTVET Instructors and Health Tutors for the BTVET System in Uganda.
1. Raisetheoutputcapacityofinstructortraininginstitutionsandbuildinganappropriatequalification system for BTVET instructors:
Lead institutions will be selected for pre- and in-service instructors training and comprehensive institutionalcapacitybuildingundertakentoraisetheoutputofwell-qualifiedBTVETinstructors.These lead institutions include Nakawa VTI, JinjaVTI, Abilonino CPIC and Mulago Health Tutors Training Institute. Another institution to be developed into a lead institution for in-service training willbeidentified.Amajorchallengeatthestartwillbetodevelopacorpsofcompetentandqualifiedmaster trainers.
25 Skilling Uganda - BTVET Strategic Plan 2012/3-2021/2
The curricula of the technical teachers’ education are biased towards theoretical and pedagogical education. They lack emphasis on acquisition of practical skills and are not appropriate to instructor requirements in the new CBET training system. They will be revised and harmonised with the new Vocational Training Instructionqualificationsdevelopedunder theUVQF.Theaim is tocreateoneunifiedBTVET Instructorsqualificationsystemformingthebaseofbothpre-serviceandin-serviceinstructorstraining.
2. RaisetheavailabilityofcompetentandqualifiedBTVETinstructorsandtutors:
Theaims is to increaseenrolment inBTVET instructortrainingby10%annuallyandwidentherangeofoccupational areas in line with labour market priorities.. Major efforts will also be undertaken to upgrade theexistingcorpsofBTVETinstructorstomakethemfitforCBETtraining.Thetargetistoupgradeupto500 existing BTVET instructors annually by 2015. A Incentives and rewards will be developed and launched to increase the attractiveness of the BTVET instruction as a profession. Funds have been set aside to kick-start incentive schemes for BTVET instructors.
3. Deregulate recruitment and improve the working conditions of BTVET instructors:
The current recruitment system of BTVET instructors does not allow skilled practitioners to be used as instructors, even with evident shortages. The Strategic Plan therefore envisages revisiting the recruitment criteria to allow such practitioners to join BTVET institutions as instructors. Furthermore, industries and hospitals will be encouraged to second staff for part-time teaching in BTVET institutions. Appropriate incentives will be put in place.
Strategy 3: Install better quality assurance systems for public and private BTVET providers
Systematic quality assurance is largely absent at the moment. The MoES inspection system lacks resources and technical expertise to address quality issues at BTVET institutions. Private training institutions are not addressed by public quality assurance. Private providers account for the bulk of skills training in Uganda, but most are not registered withtheMoES.Thecurrentsystemofofficiallicensingandregistrationisburdensomeandoverlycentralized.Theregulatorybarriersmakeitdifficultandcostlyforinstitutionstocomply,particularlythoseawayfromKampala.TheStrategic Plan addresses quality assurance with two sub-strategies:
1. Introduce an accreditation system for BTVET providers:
In cooperation with UGAPRIVI, a new accreditation system will be developed and launched based on the evaluation of models and experience in other countries. This system will encourage private providers to seek formal recognition and support institutions to raise quality and training standards. Electronic accreditation procedures will be introduced to lower costs and increase accessibility. UGAPRIVI will play a key role in implementing the accreditation process and will be provided public funding to do so. The initial objective is tobringprivatetrainingsupplyintoquality-assuredmainstreamBTVET;lateraccreditationwouldalsocoverpublic institutions.
2. Introduce an internal quality management system in BTVET institutions:
An InternalQualityManagement (IQM) systemwill bedevelopedandgradually introduced forUgandanBTVET institutions. Quality management in training institutions seeks to deliver training services that meet customer expectationsbetter, more consistently and more cost-effectively. Quality management encompassescustomer focus, leadership, involvement of people, process approaches, systems of management, decision-making and relationships with beneficiaries and stakeholders. The introductionof quality management will require design work based on experiences in other countries. Intensive management training will be provided.
26Skilling Uganda - BTVET Strategic Plan 2012/3-2021/2

4.3 OBJECTIVE 3: PROVIDE EQUITABLE ACCESS TO SKILLS DEVELOPMENT
The Strategic Plan addresses the need for increased access by supporting additions to training supply and by providing trainees with scholarships and bursaries. The main strategy to increase available training places is to stimulateexpansionofprivateprovision.Targetedpoliciesandprogrammeswillreducefinancialbarrierstoaccessoflearnersfrompoorfamilies,femalelearnersandpersonswithdisabilities(PWD).
Targets
Objective: Increase equitable access to skills development
Number of BTVET graduates increased to 450,000annually,with50%femaleparticipationrate
Strategy 1: Increase access to formal and non-formal BTVET through public subsidies
At least 650,000 learners in formal and non-formal BTVET programmes assisted through bursaries and scholarships by 2020
Strategy 2: Expand private training provision Enrolment in private BTVET institutions increased by at least10%annuallyEnrolment in private BTVET institutions in Northern region and Karamoja increased to xx
Strategy 3: Support and expand public BTVET supply X number of public BTVET institutions receive base funding
Strategy 4: Create awareness about BTVET career patterns
Career guidance and vocational counselling leads to improved training and career choices of learnersReduced drop-out rates
Strategy 5: Enhanced participation of disadvantaged groups to skills development
Enrolment of disadvantaged groups increased differentiated by target group matched by baseline data
Strategy 1: Ensure access to formal and non-formal BTVET
UndertheStrategicPlan,anincreasingnumberofyouthwillbeassistedfinanciallytoattendrelevantformalandnon-formal skills development.
The non-formal training programme, launched in 2010 with an initial intake of around 15,000 trainees, will become aregularpublic-fundedprogramme.Thetargetistoincreasethenumberofbenefittingyouthfrom25,000in2012to40,000 in2015. Theprogrammewill continue to inviteBTVETproviders to request funding for employment-oriented short courses targeting mainly youth with different educational background. The range of training providers eligible under this programme will be expanded to also include NGOs, business development projects and private companies. Non-formal courses in the Northern regions and Karamoja will be supported through special quotas. The initial implementation of the non-formal BTVET programme in 2010 was not without problems. Often, training offers were supply driven. There is no evidence as yet whether and to what extent the programmes supported youth in their way into employment and self-employment. Interventions under Strategy 1.6 comprising capacity building of non-formal BTVET providers, measures to improve coordination and cooperation, as well as the Innovation Challenge Fund will assist improving non-formal training and making it relevant to labour market contexts.
27 Skilling Uganda - BTVET Strategic Plan 2012/3-2021/2

The number of school leavers sponsored under the UPPET programme and through Window 1 at post-secondary level toattendBTVETprogrammeswillbeexpandedby10%annually.40%ofalllearnersinformalBTVETprogrammeswill receivefinancialsupport tostudy.Capitationgrantswillbegradually increased to reach fullactualcostsby2020. From 2013 onwards, scholarships under the capitation grant scheme will be replaced or complemented by a bursary scheme accessible to needy students.
Strategy 2: Expand private training provision
The expansion of private training supply is the core strategy to increase enrolment in the BTVET system. Private BTVET providers include private commercial training institutions, faith-based training institutions, training run by NGOs, CBO and projects.
The expansion of private training provision has been a successful strategy for increasing the training supply in many countries.Privatetrainingproviderstendtobemarketoriented,moreflexible,moreresponsiveandmoreinnovativecompared to public providers, e.g. in launching new programmes. Expansion through private training providers would relievemuchofthefinancialburdenongovernment,inparticularfordevelopmentcosts.
The Strategic Plan will develop a comprehensive policy and strategy for support of private providers in cooperation withUGAPRIVI.Aninventoryofformalandnon-formalprivatetrainingproviders isanessentialfirststeptowardssuch a policy.
Instruments that will be considered include:
• Reductionofregulatorybarriersforprivatetrainingprovidersandsimplifyingregistration/ accreditationprocedures;• Incentivesforinitiatingandexpandingprivateprovision,e.g.throughmatchinginvestmentgrants, introductionofredeemablevouchers,etc;• AccesstoallsupportschemesofferedtoBTVETinstitutions.
Special incentives will be provided for investment to introduce or expand BTVET in under-served areas such as the Northern region and Karamoja, and in high demand occupations.
Strategy 3: Build and resource public BTVET supply
Fourteennew Technical Institutes will be established under existing loan agreements with OPEC Fund for International Development (OFID)andSaudi Fund forDevelopment (SFD) inHoima,Kamuli,Masaka,Mukono,Nakasongola,Namutamba, Pader, Yumbe, AmuriaAdjumani, Bukedea, Kiboga, Lyantonde and Kyenjojo districts.
All public BTVET institutions will receive funding initially to cover salaries of BTVET instructors. To increase incentives for BTVET institutions to improve capacity utilization, institutional funding will gradually be changed to a performance-based funding formula, based on actual enrolment. It is expected that the new funding formula will be introduced from 2015 onwards.
Strategy 4: Create awareness about BTVET
A public campaign will be launched to inform the public about job chances and BTVET options so as to improve the largely negative image of BTVET in the Ugandan public.
With the exception of a few private providers, there is no career guidance and vocational counselling in Uganda. During
28Skilling Uganda - BTVET Strategic Plan 2012/3-2021/2

the plan period, a strategy will be developed for the systematic introduction of career guidance and counselling. The strategywilldefinetheroleofdifferentpartners,includingschools,BTVETinstitutionsandgovernment,andwillforlong-term implementation.
In addition, programmes will be introduced at primary school level to make school children appreciate BTVET careers as alternative progression pathways.
Strategy 5: Enhance access of disadvantaged target groups to skills development
A major thrust of the Strategic Plan is to increase access of disadvantaged target groups to relevant skills training. Thestrategyisdividedintothreesub-strategies,eachdefiningspecificinstrumentsforthethreemaintargetgroupsaddressed,i.e.youthfrompoorhouseholds,girlsandpersonswithdisabilities(PWD).
1. Promote access of disadvantaged groups through bursaries:
Direct costs for fees, coupled with the indirect – i.e. opportunity – costs, prevent low income groups from attending training institutions. The current scheme to subsidize trainees, i.e. the capitation-grant-based scholarship scheme, is based on merit and tends to discriminate against students from disadvantaged families. The merit-based scholarship system will be replaced or complemented by a scheme of bursaries accessible to students from low-income families. A concept will be worked out for fair and reliable means testing,drawingonexperienceinothercountriesandincooperationwiththeJointAdmissionBoard(JAB).Thepilotintroductionofdemand-sidefinancing,usingavoucherscheme,willbeconsideredduringtheplanning.The bursary scheme will also provide for preferential access for poor students from the Northern regions andKaramoja,forexamplethroughspecialquotas.Theintroductionofbursarieswillbecompletedby2014.
2. Promote female participation in BTVET:
Females make up only one-fourth of the total enrolment in formal BTVET, and they are concentrated in a few female dominated occupations. The training environment in many institutions is often not suitable for girls. Hostels are lacking, sanitary facilities are often not appropriate. Sexual harassment is reported to be prevalent. The Strategic Plan therefore foresees to develop and implement a Gender in BTVET Strategy. The Gender Strategy will include a national gender awareness programme, improvement of hostel facilities for girls, special assistance in job placements, strict policies on sexual harassment and abuse. Special incentives or quotas for girls may be introduced in the bursary scheme, described above. BTVET institutions willberequiredtooperationalizetheGenderinBTVETStrategyininstitution-specificmeasures.
DITwillprioritizethedevelopmentofATPsinthoseoccupationsthatarespecificallyattractiveforwomen,until at least35%of all available training programmes fall under this category of occupations. FemaleBTVET graduates will be given preferential access to BTVET instructors training to increase the share of female instructors in the BTVET system.
3. Enhance access for persons with disabilities:
PWD are barely represented in the mainstream BTVET system because of inadequate facilities and absence of special programmesand trained instructors.So farPWD,whoconstitute some16%of theUgandanpopulation, have been targeted mainly by NGOs. To address the gap, an integration strategy will be developed to mainstream interests of PWD in skills development. PWD compatible facilities will be introduced in selectedBTVETinstitutions.Specificemployment-orientedskillsdevelopmentprogrammesforPWDwillbeinitiatedthroughtheInnovationChallengeFund(seeObjective1,Strategy6).
29 Skilling Uganda - BTVET Strategic Plan 2012/3-2021/2

4.4 OBJECTIVE 4: ACHIEVE GREATER EFFECTIVENESS IN BTVET MANAGEMENT AND ORGANIZATION
The implementation of the envisaged key reforms in skills development requires strong organization and management of BTVET. Presently the BTVET management is fragmented. It lacks focussed direction and incentives to increase performance. The Strategic Plan therefore foresees the establishment of an integratedmanagement body for BTVET, devolution of administrative power to training institutions while introducing accountability, and building a management information system dedicated to skills development.
Targets
Objective: Achieve greater effectiveness in BTVET organization and management
BTVET reform implementation progressed in line with BTVET Strategic Plante
Strategy 1: Consolidate BTVET functions in an integrated body for skills development
The integrated skills development body manages the BTVET system in line with labour market requirements
Strategy 2:Devolve authority to public BTVET institutions and make them accountable for performance outcomes
Better performance of training providers in use of resources and successful graduation of trainees. IncreasedinstitutionalefficiencyshownthroughtheMIS
Strategy 3: Establish an effective BTVET management information system (MIS) and BTVET sub-sectormonitoring system
Updated management information informs BTVET sub-sector monitoring
Strategy 1: Consolidate BTVET functions in an integratedorganization for skills development
A consultative process will be carried out to explore possible options to create anintegrated organization for skills development. . The purpose is to give skills development a stronger weight in Uganda, to overcome fragmentation in the public management of BTVET and to allow different public and private stakeholders to participate in the decision-making on BTVET.Preferably, the organization should be an autonomous body. The possibility to create an authority for skills development is one of the options to be further explored. The envisaged body should combine all major functions in the BTVET management under one roof. These functions include policy-making, standard-setting,assessmentandcertificationandotherqualityassurancefunctions,information,monitoringandevaluation,accreditationoftrainingproviders,financingandpossiblythemanagementofpublictraininginstitutions.Itwouldthus incorporate functions of existing organisational units in the MoES (DIT, DES, BTVET Department, UBTEB and otherexaminationbodies)andpossiblyofotherministries.
Amainjustificationfortheestablishmentofanautonomousbodyistoinvolvestakeholders,especiallyemployers,in the direction and evaluation of the training system. A single body with comprehensive responsibilities can consolidate fragmented organizational units and achieve economies of scale in performing the various functions, thus potentially reducing the overall resource requirements for BTVET management.If placed outside the normal government bureaucracy, the body can respond more quickly to changing conditions in the labour market. By involving diverse stakeholders the body can broaden the scope of attention to all forms of skills development and wider target groups, rather than narrowly focusing on youth in schools. If placed outside the civil service, it could provide incentives and build professional capacity to oversee skills development. In addition, an independent status could help raise the image of skills development and counter the prevailing negative attitude towards technical-vocational training.
30Skilling Uganda - BTVET Strategic Plan 2012/3-2021/2

Different organisational options will need to be evaluated and analysed, which will include an assessment of experience in other African countries that have introduced similar bodies. Design issues to be addressed include mechanisms to:
• Ensurethatemployersandotherstakeholdershavesufficientinfluenceandtaketheirrolein
governanceseriously;
• Ensurethatthebodyisheadedbya“champion”,arecognisedleaderforskillsdevelopmentinthe
country;
• Guaranteethenecessaryindependenceinthemanagementoftheskillsdevelopmentbody;
• Avoidunclearduplicationsandfunctionsofthenewbodyvis-à-vistheMoESandotherministries;
• ClarifytherolesoftheMoHandthenewbodyinhealth-relatedBTVETtoensurehighqualityand
expandinghealthtraining;
• Ensurethatthebodyissufficientlystaffedwithappropriatelyqualifiedandmotivatedexperts;
• ManagepublicBTVETinstitutionseffectively.AkeyquestionwouldbewhetherpublicBTVET
institutionsshouldbemanagedunderthenewbody-whichcouldraiseissuesofconflictofinterest
inthelongrun-orremainwiththeircurrentparentministries(e.g.theMoES);
• Ensurethatthebodycanacteffectivelyatthelocallevel.Thismayincludeconsiderationstocreate
regional branches, as done, for example, in Tanzania.
The conceptual discussion will encompass a wide range of stakeholders. It will include an in-depth analysis of the performance, strengths and weaknesses of the existing institutions involved in BTVET. Transferring DIT into the newunifiedbodyforskillsdevelopmentmaybeoneoption.Oncethenewbodyisconceptualizedandagreed,newlegislation will be required. The actual establishment of the body is planned for the second phase of the plan period. Institutional development requires considerable building of staff capacity. After its establishment, the new bodymay assume the major responsibility for the implementation of this Strategic Plan and the further BTVET development .
Strategy 2: Gradually devolve authority to public BTVET institutions and make them accountable for performance
Lack of authority and accountability at the level of public BTVET institutions limits their performance and the market relevance of their training.. Authority will be devolved gradually to BTVET institutions, starting with pilot arrangements at selected colleges. The legal and regulatory environment will be amended to enable such devolution.
Devolution will involve two aspects:
1. Decentralization of authority to BTVET institutions:
Ultimately, BTVET institutions will be self-governed, able to set their own fees and budgets, receive funds andsubsidiesfromthecentre,hireandfireteachingandotherstaffwithinsomeflexiblenationalnorms,andintroduceorchangetrainingprogrammesinresponsetomarketneeds.Thefirststagewilldevelopand pilot the administrative changes in selected colleges. Necessary legal amendments, for example with respect to staff management,will be addressed after evaluation of the pilot phase.
Devolution of authority will be linked to the establishment of an IQM system and the creation of a new accreditation system.
5For more information see Annex 4 on national training authorities.
31 Skilling Uganda - BTVET Strategic Plan 2012/3-2021/2

2. Introduction of instruments to increase accountability of BTVET institutions:
Greater authority requires that institutions and their governing bodies be held responsible for results. This requires the development of targets and institutional strategic plans against which to monitor institutional performance. Performance measures will be developed, such as pass rates of trainees, or management related indicators such as cooperation with industry. Governing bodies and central authorities will have performance contracts with managers of institutions.
Incentives for increased performance will be created, including linking budget allocation to results, publishing examination results of institutions, rewarding managers and staff for good performance, and sanctions for poor performance.
Strategy 3: Establish an effective management information system and sub-sector monitoring system
Timely information is essential to support planning and monitoring of the training reform. However, no effective management information system exists for BTVET. The development of a BTVET-MIS system will therefore be a priority. It will systematically capture public and private training provision, and will be integrated with the LMIS. The BTVET-MIS will be among the core functions of the new organization for skills development. Until this is established, theBTVETmoduleintheEducationManagementInformationSystem(EMIS)willbeupgraded,anddatacollectionimproved.
4.5 OBJECTIVE 5: INCREASE INTERNAL EFFICIENCY AND RESOURCES AVAILABLE FOR BTVET
Overcoming past neglect and implementing the above reforms inevitably requires additional resources. Adequate and sustainable resourcesneed to be ensured for training delivery and for quality assurance. The Strategic Plan identifies two long-termstrategicdirections: (1)managingexisting resourcesmoreefficiently,and (2)mobilizingadditional resources.
Strategy 1: Increase the efficiency of BTVET provision through results-oriented transfer mechanisms
Efficiencycanbeincreasedbyraisingtheoutputforagivenlevelofresources,orbyreducingcostsforagivenlevelofoutputs.Someofthereformstrategiesoutlinedbeforewillalsoincreaseefficiencyinthetrainingsystem.Amongtheseare,forexample,theshorteningoftrainingdurations,theincreaseinflexibilityinorganizingtrainingprogrammes,andtheintegrationofmanagementfunctionsundertheumbrellaofaunifiedbodyforskillsdevelopment.
TargetsObjective: Increase internal efficiency and resources available for BTVET
Unit spending of BTVET institutions increased compared to baselineBTVET management functions adequately resourced
Strategy 1: IncreasetheefficiencyofBTVETprovisionthrough results-oriented transfer mechanisms
Cost effectiveness indicators improved compared to baseline
Strategy 2: Increase resources available for BTVET Domestic funding levels of BTVET gradually increased to regional average by 2020
Strategy3:EstablishaSkillsDevelopmentFund(SDF) BTVET funding managed by SDF
32Skilling Uganda - BTVET Strategic Plan 2012/3-2021/2

The way funds are transferred can be as important as the amounts. The Strategic Plan calls for the systematic introduction of competition and performance-criteria in the transfer of funds from the central level to BTVET institutions. Allocating funds by competition and performance will stimulate higher enrolment, more responsive training and more emphasis on strategic institutional management.
Budget allocation to BTVET institutions will be linked to performance results. Currently, institutional base-funding is provided through payment of staff salaries. This funding mode is not related to the actual number of trainees enrolled or to other indicators of institutional performance. It furthermore discriminates against those institutions thatencounterdifficultiestoattractteachers,for instancebecausetheinstitutionis locatedinaremotearea.Anew funding formula will therefore be developed and gradually implemented based on actual performance, thus stimulating institutional initiatives to improve results. As a starting point, allocations should be based on the number of trainees enrolled. More outcome-oriented indicatorsmay be introduced at a later stage, for example trainee completion rates, exam pass rates and success of graduates in securing employment .
Strategy 2: Increase the resources available for BTVET through income generating activities of public BTVET institutions and the introduction of a training levy
TheresourcebaseoftheBTVETsystemneedstobeincreasedanddiversified.Dependingonthetypeandleveloftraining, annual unit cost of between 1.5 and 3.5 million UGX have to be calculated to deliver training at acceptable standards. Costs involved in non-formal basic level skills development are estimated at around 350,000 UGX for a threemonthsprogramme.Privatehouseholdsbearaconsiderableshareof trainingcosts,at least45%.Lowaveragehousehold incomes limit thescope for furtherburdeninghouseholdswithextra costs to financebetterquality training. Tthe low capacity utilization in many training institutions can be explained largely by the training fees that are unaffordable by many potential users.
The Strategic Plan seeks to develop two additional sources of income for BTVET.
1. Increase income of public BTVET institutions through income generating activities:
Public training institutions will be encouraged to increase income generating activities as a supplementary income source. Such activities may include: sale of items produced during training, services such as car repairor runninga restaurant,contractwork (e.g.construction),saleofagriculturalproduce, rentingoffacilities, organization of special courses, and others.
Currently public providers have considerable discretion in generating income at the institution level, but appear to under-estimate the importance of this source of income. Based on EMIS data, income generated fromthesaleofproductsandservicesonlyaccountto0.2%-2.1%oftotalexpenditures.Experienceinothercountries(e.g.theBotswanabrigades)suggeststhatuptoaboutone-fourthoftotaltrainingcostscanberecoveredfromincomegenerationactivities.Apartfromfinancialreturns,incomegeneratingactivitiescanalso link the institution better with local markets and stimulate a business culture.
Means to stimulate a more pro-active approach to income generationinclude management training, experience sharing among training institutions – inside and outside of Uganda – and possibly matching grants for investment projects funded by own income. Institutional governing bodies will need to play a key role in monitoring income generating activities, to ensure that attention is not distracted from training delivery and that institutional activities do not distort local markets.
6See Annex 5 for more information about financial transfer mechanisms
33 Skilling Uganda - BTVET Strategic Plan 2012/3-2021/2

2. Introduce a training levy:
The introduction of a training levy, stipulated in the BTVET Act of 2008 but put on hold, will be reconsidered.
Training levies can effectively expand the resource base for training, as experience in at least 62 countries worldwide shows. A levy system can also encourage enterprises to invest more in training, and can help counter the fear of poaching in those enterprises that train their workers.
During the initial years of the plan period, considerable efforts will be made to facilitate consultative processes about the design of the levy system, in particular with employers and the business community in Uganda. Questions that need to be answered include:
• Howtoensureagreementofemployerstothelevy,whichisimportanttoensurecompliance;
• WhetherUgandaneedarevenue-generatingtypeoflevy,wherebyallproceedsareusedto
supplement public BTVET resources, orrather a levy-grant scheme, which reimburses training
coststothoseenterprisesthatareinvestingthemselvesintraining;Amixedtypemaybean
alternative, as in South Africa.
• Therateofthelevyandthetargetedfirms(sectorsandsize).
• Appropriatecollectionmethodsareappropriate,andwhocollectsthelevy;
• Ensuringthatlevyproceedsaresecuredfrommismanagementandre-allocationtonon-intended
uses;
• Eligibleusesforlevyproceeds;
• Howtoensureindependentdecision-makingstructurethatprovidesforastronginfluenceof
employersintheuseoftheproceeds;thegovernanceofthelevysystemisamongthemost
important issues, in particular the question of autonomy of the fund administration and of the role of
employers in the governance structures. Managing the levy system through the suggested new integrated
organization for skills development may be an appropriate solution.
• Howtoexemptanyexistingsector-widelevysystemssothatemployersarenotburdenedtwice.
Once the design is decided for the training levy, the legal framework will be revised and an appropriate
institutional arrangement established .
34Skilling Uganda - BTVET Strategic Plan 2012/3-2021/2

Strategy 3: Establish a Skills Development Fund
ASkillsDevelopmentFund (SDF)willbeestablished.TheSDFwillpoolallpublic resourcesavailable forBTVETin Uganda including the income from the training levy, allocations from the public budget, contributions from development partners and other income. The fund will fund training provision, to resource special support and development programmes and to fund the new organisational set-up for BTVET management.
As experience in other countries show , the fund will be instrumental to:-
• Involveemployersandfostercollaborationamongstakeholdersinfundingdecisions;• Channelresourcestolabourmarketpriorities;• Enhancequalitythroughperformanceconditionsplacedonrecipients(e.g.accreditation,institution developmentplans);• Induceefficienciesthroughcompetitionforfinancing;• Focusresourcesonneglectedgroups,suchassmallenterprises,women,unemployed;• Havetheflexibilitytoredirectresourcesquicklyasprioritieschange;• Facilitateresourcemobilization,includingresourcesfromdevelopmentpartners.
7See Annex 6 for more information about training levies.8See Annex 7 for more information about training funds.
35 Skilling Uganda - BTVET Strategic Plan 2012/3-2021/2

PublicresourcesrequiredtoimplementtheBTVETStrategicPlanoverthefiscalyears2012/13to2021/22areestimatedat2001billionUGX,or870millionUSD.Recurrentcostsamountto55%,anddevelopmentcoststo45%.The estimates represent full sub-sector costs to government .
Table 1: BTVET Strategic Plan – Total Estimated (public) Costs
Phase I2012/3-2015/6
Phase II2016/7-2021/2
Total 2012-2021
UGX(’000000)
USD(’000)
UGX(’000000)
USD(’000)
UGX(’000000)
USD(’000)
Total Recurrent 316952 137 805 781359 339721 1098311 477526Total Development 385 701 167696 516784 224689 904485 392385Grand Total 702 653 305 501 1298143 564410 2000796 869911
Source: Strategic Plan estimates, see Annex
Table 2 presents estimated costs by objective. Table 2 shows that the access policy goal requires most of the recurrentresources,i.e.67%duringthefirstphaseand74%onaverageinthesecondhalfoftheplanperiod.Themajor share of development resources will fund increased quality of training provision. Most of the latter is related to the rehabilitation and capacity building of existing BTVET institutions and increased efforts in instructors training. Themajorshareofdevelopmentcostsforrelevance(Objective1)isallocatedtodevelopagricultureinfrastructure.
Figure 2
9The plan envisages the establishment of three new entities, namely the unified BTVET management body, the training levy and the National Training Fund. All three institutions are expected to become operational from the beginning of the second Plan Phase in 2015/16. Recurrent costs of these institutions during the second phase are not yet included in this Plan. More design work that clarifies inter alia the relationship between the new with currently existing institutions is necessary to realistically estimate the financial implications of the new institutional set-up. It can be expected that the envisaged integration of management responsibilities within one unified body will lead to economies of scale, hence more management efficiency.
5 COSTS AND FINANCING
516,784
781,359385,701
385,701
Recurrent and Developmetn Costsby Phase
Development
Recurrent
2011-15 2015-2020
1,400,000
1,200,000
1,000,000
800,000
600,000
400,000
200,000
0
36Skilling Uganda - BTVET Strategic Plan 2012/3-2021/2

Table 2: BTVET Strategic Plan Cost Estimates by Objective, in ‘000 000 UGX and % of total
Phase I Phase II2012-13) 2013/14 2014/15 2015/16 Total 2016/7-
/2021/2Recurrent:
Objective 1: Relevance 16 777 20 573 23334 25434 86 118 160 226
Objective 2: Quality 5799 6 683 7493 8409 28 385 58 700
Objective 3: Equitable Access 35922 44886 54995 66408 202 210 560793
Objective4:ImproveMgmt 60 60 60 60 240 1640
Objective 5: Enhance Financing
Total Recurrent 58 558 72 202 85 882 100 310 316952 781359
Development:
Objective 1: Relevance 49657 22743 16 787 24362 113549 52411
Objective 2: Quality 40348 43725 46861 47151 178 085 449884
Objective 3: Equitable Access 24491 30443 30329 1985 87248 6955
Objective4:ImproveMgmt 406 677 913 2943 4940 5 660
Objective 5: Enhance Financing 554 225 460 641 1 880 1 875
Total Development 115456 97813 95351 77 082 385 701 516784
Grand Total 174014 170 015 181 232 177392 702 653 1298143
In %
Recurrent:
Objective 1: Relevance 28.7 28.5 27.2 25.4 27.2 20.5
Objective 2: Quality 9.9 9.3 8.7 8.4 9.0 7.5
Objective 3: Equitable Access 61.3 62.2 64.0 66.2 63.8 71.8
Objective4:ImproveMgmt 0.1 0.1 0.1 0.1 0.1 0.2
Objective 5: Enhance Financing
Total Recurrent 100.0 100.0 100.0 100.0 100.0 100.0
Development:
Objective 1: Relevance 43.0 23.3 17.6 31.6 29.4 10.1
Objective 2: Quality 34.9 44.7 49.1 61.2 46.2 87.1
Objective 3: Equitable Access 21.2 31.1 31.8 2.6 22.6 1.3
Objective4:ImproveMgmt 0.4 0.7 1.0 3.8 1.3 1.1
Objective 5: Enhance Financing 0.5 0.2 0.5 0.8 0.5 0.4
Total Development 100.0 100.0 100.0 100.0 100.0 100.0
Source: Strategic Plan Cost Assessment
37 Skilling Uganda - BTVET Strategic Plan 2012/3-2021/2

5.1 Recurrent CostsTheestimatedrecurrentBTVETbudgetforthefiscalyear2012/13is58.6billionUGX,increasingto100.3billionin2015/16,oranincreaseof71%duringthefirstfouryears.Theplannedincreaseistheresultoftwofactors:(1)enrolmentgrowthinbothformalandnon-formalBTVET,and(2)increasedpercapitafundingnecessarytoensurequality improvements.
About40percentoftherecurrentbudget,433billionUGX, isearmarkedforcapitationgrantsandbursariestosupport school leavers attending formal BTVET programmes. The cost estimates for formal BTVET programmes are based on enrolment projections as demonstrated in the graph overleaf. The projections envisage an increase in enrolmentinformalBTVETfrom42000to103000in2021/22,anannualenrolmentgrowthrateof10%.
Table 3: BTVET Strategic Plan –Recurrent Costs, in ‘000 000 UGXTotal Phase 1:
2012/3-2015/6Total Phase II:
2016/7-2021/2
In% In%UVQF implementation: DIT operational costs, assessment incl. UNMEB
82 118 25.9 152047 19.5
Supporttonon-formaltraining(RSC,NFPgrants) 51 370 16.2 107 250 13.7
Capitation grants/bursaries for formalBTVET 92033 29.0 341038 43.6
InstructorsDevelopment(Trainingandincentives) 28376 9.0 58 657 7.5
Institutionalbase-funding(salariesforpublicBTVETinstitutions)and BTVET Department
60127 19.0 115 805 14.8
Other 2928 0.9 6 562 0.8
Total recurrent 316952 100.0 781359 100.0
Source: Strategic Plan Cost Assessment
TheStrategicPlanenvisagesanincreaseincapitationgrants(orpercapitabursaries).Thecurrentcapitationgrantlevelsofbetween432,000and600,000UGXperyear/learneraregrosslyinsufficienttomeettrainingcosts.Anincrease is necessary to improve the quality of training delivery, and to avoid the imposition of extra fees on students with scholarships. The grant projections assume that capitation grants will gradually reach the cost-recovery level by 2021/2, i.e. 1.5 million UGX for post primary BTVET, 2.1 million UGX for post O’level programmes and 3.2 million on average for tertiary BTVET. These assumptions are based on estimates from the MoES BTVET Department and may be revised after results from the unit-cost assessment are available.
Thecalculationalsoassumesthat40%oftheentireformalBTVETstudentpopulationwillbeprovidedwithapublicscholarship.Thisassumptionreflectscurrenttargets.Itmaybereconsideredandraisedto100%atalaterstage,inthe light of new universal secondary education policies.
10Compare the calculation in Annex 8-3.11Enrolment estimates quoted here only refer to enrolment in the public formal BTVET system, i.e. those that are relevant for public finance. Total enrolment, including enrolment in the private provider system and in non-formal training programmes, are expected to rise from 206 000 in 2011/12 to 448 000 in 2019/20. See also enrolment projections in Annex 8.
38Skilling Uganda - BTVET Strategic Plan 2012/3-2021/2

The enrolment targets for formal BTVET are set lower than previous targets indicated in the NPD and the Revised ESSP.TheseplansstipulatedatriplingofpostP.7enrolment,andatargetof30%BTVETenrolmentoftheentirelearnerpopulationatpostS.4andpost-S.6levels.TheNDPandESSPtargetswouldhaveincreasedtotalformalBTVETenrolmenttosome420000learnersannually,whichwouldhavetranslatedintoanannualfundingcommitmentof390billionUGXforcapitationgrantsonly.Thedownwardadjustmentofenrolmenttargetsensuresanincreaseinpublic per capita spending while keeping the resource requirements at reasonable levels during the early years of the BTVET reform .
The envisaged curricular reform, which foresees a reduction of the training duration at all levels, will increase the intake capacity of the formal BTVET system at constant enrolment levels. The graph shows that a doubling of the enrolment between 2011 and 2020 represents an increase of the total annual intake from 15 000 2011/12 to 61 000in2019/20.AssumingthatduringthefirstphaseoftheplanperiodthepostP.7programmeswillgraduallybeconverted into modular courses with one year duration on average, the total intake at this level is expected to rise by 540%.Theexpectedincreaseis220%forBTVETatpostS.4levelsand185%atpostS.6level.
Figure 3
The projected increases in enrolment will require more teachers in both in public and private institutions. The plan estimates that the number of teachers in the public system and the enrolment in instructor training institutions will havetoincreaseby10%annually.InordertocreateincentivesforskilledtechnicianstojointheBTVETinstructionprofession, the cost estimates assume that capitation grants/bursaries will be paid to every learner enrolled in BTVET instructors/health tutors training institutions. An additional budget line of 62 billion UGX has been set aside for funding extra incentives for BTVET instructors on top of their regular salaries.
The Strategic Plan is committed to broaden the target groups of the BTVET system beyond the traditional school leaver group of the previous system. Servicing new target groups requires deliberate approaches to non-formal skillsdevelopment.Suchnewgroupsincludeout-of-schoolyouth(withorwithoutprimaryschoolcertificate),adults and women, and those in the workforce needing skills upgrading. The Strategic Plan integrated non-formal BTVET into the public BTVET portfolio. The cost estimates in the plan foresee a total allocation of 160 billion fornon-formalBTVET,anincreaseofpublicnon-formaltrainingfrom20,000in2010/11to40,000in2015and60,000by2016.Non-formaltrainingaccountsforanaverageof15%ofthetotalrecurrentbudget.
39 Skilling Uganda - BTVET Strategic Plan 2012/3-2021/2

5.2 Development CostsThemajorshareofthedevelopmentexpenditure,35%duringthefirstand82%duringthesecondphaseoftheplan period, is earmarked for rehabilitating and strengthening the existing network of BTVET institutions (without agriculture),bothpublicandprivate.Thisincludesarrangementsforcomprehensiveinstitutionalstrengtheningforselected public institutions, preferably in partnership with leading technical institutes abroad and with the support of considerable international technical assistance. Development costs include the establishment of Centres of Excellence, rehabilitation and expansion of physical facilities, modernization of equipmentand workshops, staff development including overseas training of instructors, support to curriculum development and development of training and learning materials, and management capacity building. The estimated costs also include the BTVET Investment Fund, which will allocate grants for institutional strengthening to public and private BTVET institutions onacompetitivebasis.Itisexpectedthatupto40institutionswillreceivegrantsupportundertheInvestmentFund every year.
Table 4: BTVET Strategic Plan – Investment Programmes
Phase I:2012/3-2015/6
Phase II:2016/7-2021/2
% %DIT strengthening, ATP development 8 160 2.1 5 563 1.1
Curriculum development, capacity building BTVET institutions 14331 3.7 13 007 2,5
Expansion/Improvement of agriculture BTVET 82 226 21.3 20 022 3.9
Skills for productivity 6 681 1.7 12 305 2,4
LMIS 1610 0,4 1 065 0,2
Institutionalstrengthening(rehabilitationofBTVETinstitutions) 135199 35.1 416875 80.7
BTVET instructors development (institutional strengthening and in-servicetraining)
40413 10.5 31319 6,1
Expansion of private training provision (subventions for new investmentsandothers)
4954 1,3 5 765 1,1
Establishment of new public BTVET institutions (existing loan agreements)
80500 20.9 0,0
MIS 3292 0.9 2 300 0,4
Skill development body 1030 0,3 2463 0,5
Levy system 867 0,2 835 0,2
Skill Development Fund 516 0,1 543 0,1
Other 5922 1.5 4723 0.9
Total development 385 701 100,0 516 785 100,0
Source: Strategic Plan Cost Assessment
40Skilling Uganda - BTVET Strategic Plan 2012/3-2021/2

Aboutonefifthoffirstphasedevelopmentcosts,or102billionUGX,areallocatedtodevelopagriculturetraining.Much of this will be borne by the MAAIF. This includes selected new training facilities, the substantial rehabilitation and upgrading of existing institutions under the MoES and the MAAIF.
OnefifthoffirstphasedevelopmentcostsisalsoearmarkedfortheestablishmentofnewBTVETinstitutionsunderexisting loan agreements. From 2015/16 onwards, no further investment in new public institutionsis expected. Instead,incentives will be established for the expansion of the private provider network, i.e. matching grants. Currently, some 11 billion UGX have been budgeted for support and incentives to private provision. This allocation may rise once the development plan for private providers is approved.
Another major line in the development budget is earmarked for the implementation of the instructors development strategy, in particular for the rehabilitation and expansion of instructors/tutors training institutions.
ThedevelopmentofnewATPs,theestablishmentofasufficientassessmentinfrastructure,aswellascurriculumdevelopmentwillrequire41billionUGXovertheplanperiod.Thisinvestmentisessentialforre-orientingthetrainingsupply to market requirements and to complete the UVQF reform. Most of the curricula for the formal BTVET system need to be revised or developed anew.
Aconservative19billionUGXhasbeenallocatedforthefurtherdevelopmentofnon-formaltraining,servingnon-traditional target groups and aimed at supporting productivity improvements in the informal sector. Development funds in the second phase aremainly earmarked for resourcing the Innovation Challenge Fund(ICF). The fundis important to stimulate new, innovative modes of non-formal skills development. The ICF will also support the development and expansion of training for PWD.
Fundsarealsoallocatedforconsultativeandanalyticalprocesses,designandinstitutionbuildingofthenewunifiedbody for skills development, the training levy system, the Skills Development Fund and other systems and institutions envisaged during the plan, for example accreditation, IQM and others.
5.3 Funding GapThe currently projected budget for BTVET under the ESSP underestimates actual requirements. Unit costs, for example, are based on the present low expenditure level that caused severe underfunding of BTVET institutions. Resource requirements for the rehabilitation of existing BTVET infrastructure and for the development of a competent corps of BTVET instructors were also underestimated.
Consequently, the funding gap is substantial between requirements for the BTVET Strategic Plan and allocations forBTVETundertherevisedESSP(2010Revision).Forthefirstfouryearsoftheplanperiod,coveringthecurrentMTEF,thetotalfundinggapamountsto424billionUGX,60%ofthetotal.Forrecurrentexpenditure,thefundinggapincreasesoverthefouryearsfrom50%in2012/13to56%in2015/16,whilethegapinthedevelopmentbudgetdecreasesfromahigh77%in2012/13to51%in2015/16.Overall,thegapdecreasesoverthefouryearsfrom68%to54%.
41 Skilling Uganda - BTVET Strategic Plan 2012/3-2021/2

Table 5: BTVET Strategic Plan – Total Cost 2012/3 to 2015/6 (UGX ‘000 000)
2012/13 2013/14 2014/15 2015/16 Total Phase I
BTVET Strategic PlanRecurrent 58 558 72 202 85 882 100 310 316952Development 115456 97813 95351 77 082 385 702Total 174014 170 015 181 233 177392 702654ESSP Expenditure Projections for BTVET including development partnersRecurrent 29120 36490 36990 44320 146920Development 27040 31 650 34860 37910 131460Total 56 160 68140 71 850 82 220 278 370Funding GapRecurrent 29438 35 712 48892 55990 170 032Development 88416 66 163 60491 39172 254242Total 117854 101 875 109383 95162 424274Funding gap in %Recurrent 50.3 49.5 56.9 55.8 53.6Development 76.6 67.6 63.4 50.8 65.9Total 67.7 59.9 60.4 53.6 60.4
Source: Revised ESSP of 2010.
Option for closing the funding gap include:
• IncreasingpublicallocationtoBTVET.ClosingthefundinggapwillrequireincreasingtheshareofMoESspendingforBTVETfrom4%-5%to12.6%in2012/3and9.2%in2014/5basedoncurrentprojections.
• In view of the importance of skills development within Uganda’s overall development framework,
development partners - among them the World Bank, the Governments of Belgium and the Netherlands - may consider supporting the investment programme.
• Initscomprehensiveapproachtoskillsdevelopment,thestrategiesoftheplangobeyondthetraditionalformal BTVET under the education sector. The plan serves development interests of other sectors, notably agriculture, health, trade, tourism and industry. Part of the total costs will therefore be borne by government sectors other than education.
• Justoverhalfof theestimatedrecurrentexpenditure isrequiredtoexpandenrolments in formalBTVETprogrammes (capitation grants, teacher salaries). Enrolment at fixed levels of public expenditure maybe increased by channelling more funds through private BTVET providers, and by shifting parts of the BTVETsupplytowardscooperative(dual)trainingandenterprise-basedtraining.Thelatterwouldrequireadedicated approach to the policy of strengthening employer-based and dual training.
• TheStrategicPlanenvisagestheintroductionofatraininglevy,whichmaybecomeasignificantadditionalrevenue source for the BTVET system from 2015/16 onwards. Further investigation to estimate potential levy proceeds is necessary and will be part of the conceptual and design work in preparation of the training levy. The current cost and expenditure estimates are not offset yet by potential levy proceeds.
Operationalprioritieswithintheplanwillbedefinedincasefundinggapsremain.
42Skilling Uganda - BTVET Strategic Plan 2012/3-2021/2

6 OPERATIONAL PLAN FOR SKILLS DEVELOPMENT
6.1 MANAGEMENT.
BTVET is under the purview of the MoES. As such, the MoES, with its different organizational units involved in BTVET, has the main responsibility for the implementation and monitoring of the Strategic Plan within its current procedures for planning, budgeting and annual reviews. Other ministries and stakeholder are involved and assume responsibility for selected strategies. The matrix in Annex 1 depicts the organisations and stakeholders expected to drive the implementation of the individual strategies.
The Strategic Plan, however, goes beyond the previous mandate of the MoES. It calls for increased attention and investment in skills development for target groups beyond the realm of formal education. It envisages deepened partnerships with the private sector and with other government ministries. Parts of the planned investments will beborneunderotherministries’budgets(e.g.agriculture)orbyprivateproviders.ThebroadenedmandateoftheBTVETsector,andtheneedforbroaderpartnerships,isreflectedintheproposedintegratedorganisationforskillsdevelopment in Uganda. The new body would become the owner and main implementer of this Strategic Plan.
6.2 IMPLEMENTATION PLAN.
Annexes2-4presentadetailedimplementationplanincludingtargets,activities,phasingandoutputs.
6.3 REFORM TASK FORCE
A BTVET Reform Task Force will be formed to oversee the implementation of the Strategic Plan until the new integratedskillsorganizationisestablished.TheOfficeofthePresident/OfficeofthePrimeMinisterwillappointtotheTaskForceeminentpersonalitiesandexpertsinthefieldsofskillsdevelopment,economicandbusinesssectordevelopment and social equity. The Task Force will be comprised of members from the private and public sector. Private sector representatives will comprise at least half of the members of the Task Force. Responsibilities of the Task Force include:
• Commissioningandoverseeing theconceptualprocessand legalwork for theestablishmentof thenew
integratedorganizationforskillsdevelopment,thetraininglevyandtheSkillsDevelopmentFund;
• Commissioningandoverseeingtheconceptualanddesignworkonotherreformprocessesinlinewiththe
StrategicPlan;
• Facilitatingtheprocessofsettingstrategicprioritiesinaccordancewiththeresourceenvelope;
• Facilitationandcoordinationofthepreparationofconsolidatedannualworkplansofthedifferentactorsin
theimplementationoftheStrategicPlan;
• MonitoringoftheStrategicPlanImplementation,whichincludesthedevelopmentofamonitoringsystem.
The Task Force will be supported by a BTVET Reform Secretariat comprising a small number of high-level BTVET experts recruited on a contract basis. The Task Force and its Secretariat will function until the unified skillsdevelopment body is established.
The Reform Task Force has been budgeted separately. As shown in Table 6, it is estimated that the task force will requirea totalUGX3900million (USD1.68million) toaccomplish its taskover thefirst fouryearsof theplan
43 Skilling Uganda - BTVET Strategic Plan 2012/3-2021/2

period. This covers meeting costs of the Task Force, national and international technical assistance to facilitate the work as well as operational costs. The calculation assumes that two national full-time staff will be employed in the secretariat of the Task Force assisted by about eight months of international expertise annually.
Table 6: Estimated costs of the Reform Task Force 2012/3 to 2015/6 (in ‘000 000 UGX)
12/13 13/14 14/15 15/16 Total (inUSD)
Task Force 150 150 150 150 600 260 870Technical Assistance (national andinternational)
748 748 748 748 2992 1 300 870
Secretariat Operational Cost 128 48 48 48 270 117391Total 1 026 946 946 946 3 862 1679130
6.4 MONITORING AND EVALUATION
BTVET sub-sector monitoring has been weak. Yet thorough monitoring is an essential management tool to strengthen skillsdevelopment.SystematicmonitoringofBTVEToutcomeswillbe introduced for thefirst time.Anumberofbaseline studies will be carried out in the set-up of the monitoring system.
The overall responsibility for monitoring and evaluation of the Strategic Plan and the BTVET development rests with theReformTaskForce,untiltheunifiedbodyforskillsdevelopmentisformed.
TheStrategicPlan(seeAnnex1)definesindicatorsforallobjectives,strategiesandoutputs.Theseserveasguidesuntil the comprehensive monitoring system is built. In the process of developing the monitoring system, the initial indicatorswillberevisedandquantified,meansofverificationestablished,baselinestudiesidentifiedandcommissioned, and data collection responsibilities and methods set. Substantial responsibilities for data collection will rest with the BTVET institutions in form of market assessment and tracer studies. A coordination structure for data collection and analysis between the different levels of the BTVET system will be established.
At objective level, the following indicators are suggested:
Objectives Suggested Indicators1 – Make BTVET relevant 70% of employers satisfied with competencies of
BTVETgraduatesby202080%ofBTVETgraduatesentering the labour market have found employment/self-employment generating sufficient income tomake a living by 2020
2 – Increase quality of skills development UVQFassessmentpass rates increased to90%by2020
3 – Increase equitable access NumberofBTVETgraduatesincreasedto450,000annually,with50%femaleparticipation
4–Improve effectiveness in management and organization
BTVET reform implementation progressed in line with Strategic Plan
5–Increase internal efficiency and resources available for BTVET
Unit spending of BTVET institutions increased compared to baseline BTVET functions adequately resourced and costs per graduate decreased.
44Skilling Uganda - BTVET Strategic Plan 2012/3-2021/2

ANNEXES
45 Skilling Uganda - BTVET Strategic Plan 2012/3-2021/2

4
ANN
EXE
1
46Skilling Uganda - BTVET Strategic Plan 2012/3-2021/2

ANNEX 2: BTVET STRATEGIC PLAN 2011 – 202012 : OBJECTIVES, STRATEGIES, OUTPUTS AND TARGETS
Development Goal for the BTVET Sector:Business Technical Vocational Education and Training ensures that Ugandans and enterprises acquire the skills they need to raise productivity and income
Overview of Objectives:
1.Make BTVET relevant to productivity development and economic growth
2.Increase the quality of skills provision
3.Increase equitable access to skills development
4.ImprovetheefficiencyinBTVETmanagementandorganisation
5.IncreaseinternalefficiencyandresourcesavailableforBTVET
12Note: the Government subsequently decided that the Plan period should be 2012/3 to 2021/22. The dates in the annexes have been converted yet to this new schedule.11Responsibilities of the BTVET Department, the Department of Teachers and Instructors Training (DTIT), DIT and other ministerial management units will be shifted to the unified management body once it is established.
47 Skilling Uganda - BTVET Strategic Plan 2012/3-2021/2

48Skilling Uganda - BTVET Strategic Plan 2012/3-2021/2

49 Skilling Uganda - BTVET Strategic Plan 2012/3-2021/2
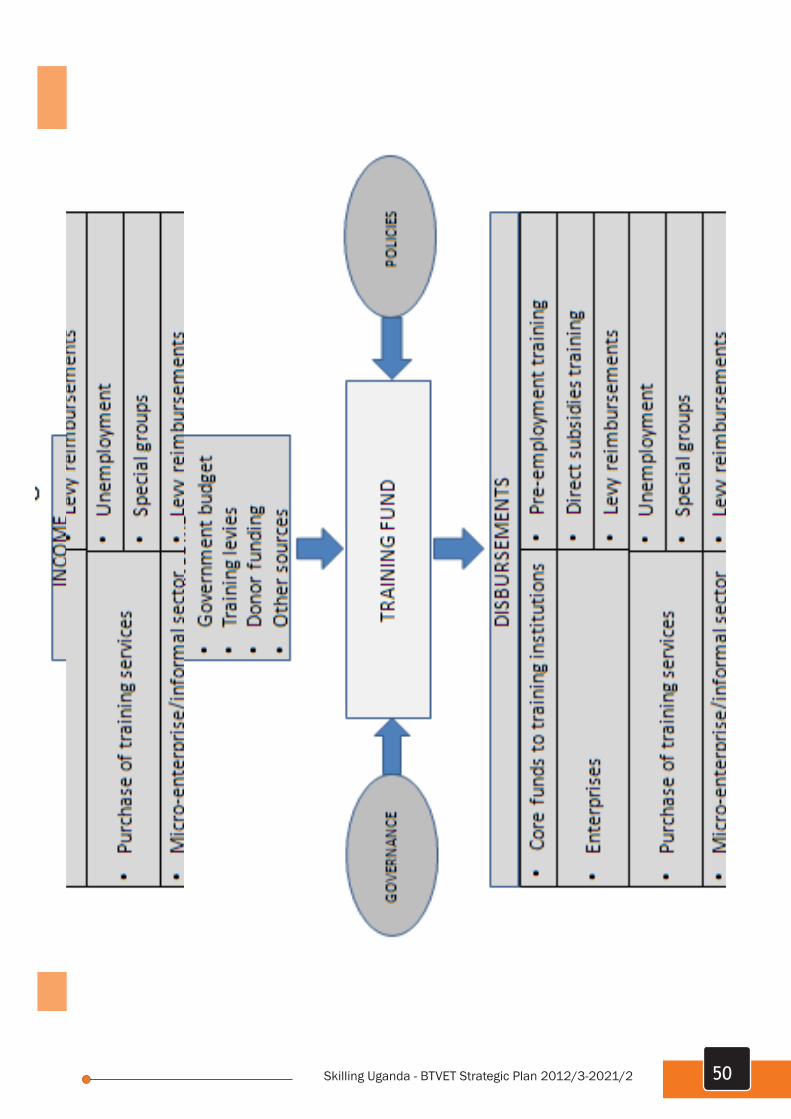
50Skilling Uganda - BTVET Strategic Plan 2012/3-2021/2

51 Skilling Uganda - BTVET Strategic Plan 2012/3-2021/2
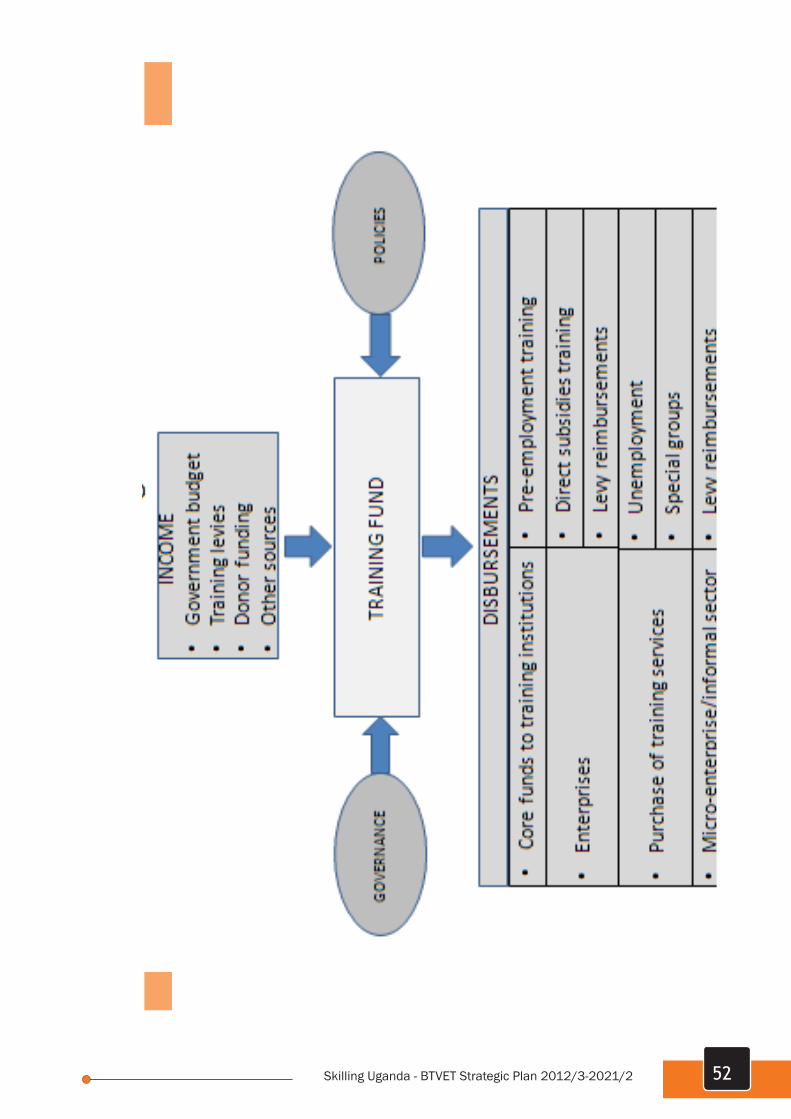
52Skilling Uganda - BTVET Strategic Plan 2012/3-2021/2

53 Skilling Uganda - BTVET Strategic Plan 2012/3-2021/2

54Skilling Uganda - BTVET Strategic Plan 2012/3-2021/2

55 Skilling Uganda - BTVET Strategic Plan 2012/3-2021/2

56Skilling Uganda - BTVET Strategic Plan 2012/3-2021/2

57 Skilling Uganda - BTVET Strategic Plan 2012/3-2021/2

ANNEX 3: BTVET Strategic Plan 2011 – 2020 : OBJECTIVES, STRATEGIES AND OUTPUTS WITH IMPLEMENTATION SCHEDULE
Development Objective:Business Technical Vocational Education and Training ensures that Ugandans and enterprises acquire the skills they need to raise productivity and income
Overview of Objectives:
1.Make BTVET relevant to productivity development and economic growth
2.Increase the quality of skills provision
3.Increase equitable access to skills development
4.ImprovetheefficiencyinBTVETmanagementandorganisation
5.IncreaseinternalefficiencyandresourcesavailableforBTVET
14Note: the Government subsequently decided that the Plan period should be 2012/3 to 2021/22. The dates in the annexes have been converted yet to this new schedule.
58Skilling Uganda - BTVET Strategic Plan 2012/3-2021/2

59 Skilling Uganda - BTVET Strategic Plan 2012/3-2021/2

60Skilling Uganda - BTVET Strategic Plan 2012/3-2021/2

61 Skilling Uganda - BTVET Strategic Plan 2012/3-2021/2

62Skilling Uganda - BTVET Strategic Plan 2012/3-2021/2

63 Skilling Uganda - BTVET Strategic Plan 2012/3-2021/2

64Skilling Uganda - BTVET Strategic Plan 2012/3-2021/2

65 Skilling Uganda - BTVET Strategic Plan 2012/3-2021/2
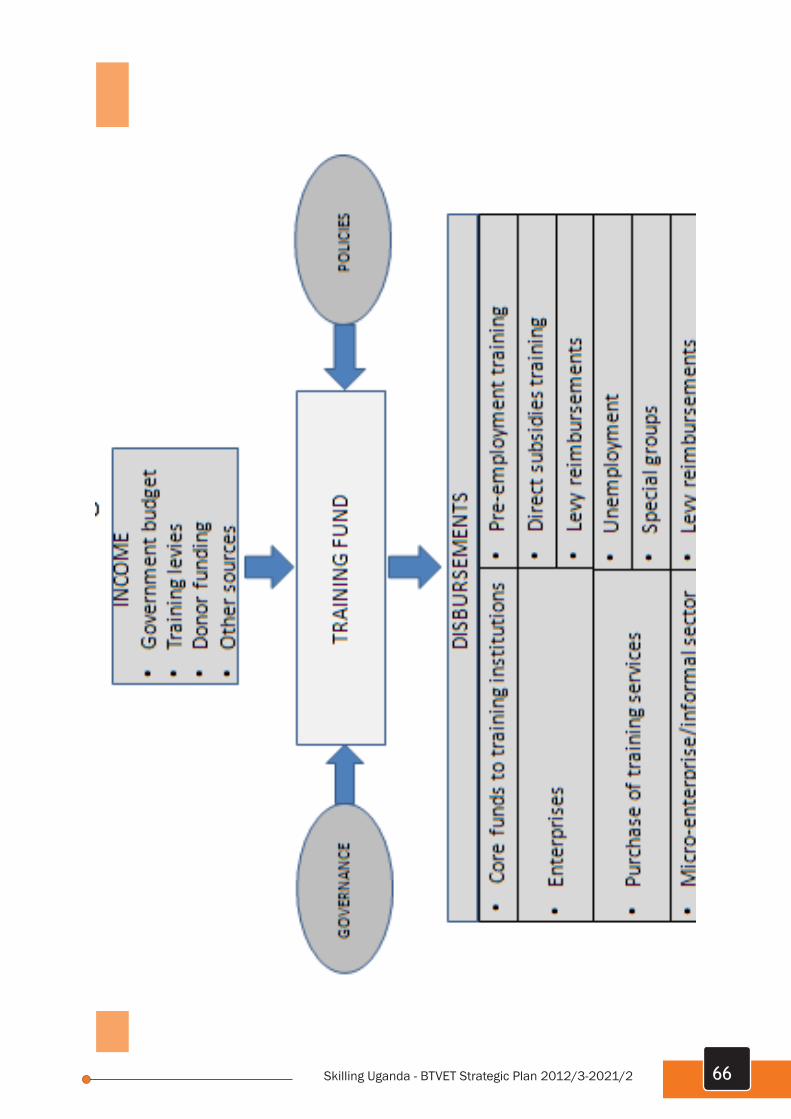
66Skilling Uganda - BTVET Strategic Plan 2012/3-2021/2

67 Skilling Uganda - BTVET Strategic Plan 2012/3-2021/2

15N
ote:
the
Gov
ernm
ent s
ubse
quen
tly d
ecid
ed th
at th
e Pl
an p
erio
d sh
ould
be
2012
/3 to
202
1/22
. Th
e da
tes
in th
e an
nexe
s ha
ve b
een
conv
erte
d ye
t to
this
new
sch
edul
e.
ANN
EX 4
: B
TVET
Str
ateg
ic P
lan
2011
– 2
020
: OB
JECT
IVES
, STR
ATEG
IES
AND
OU
TPU
TS W
ITH
ACT
IVIT
IES
(com
piledataworkshopwithpublicandprivateBTVETexpertsinFebruary2011)
68Skilling Uganda - BTVET Strategic Plan 2012/3-2021/2
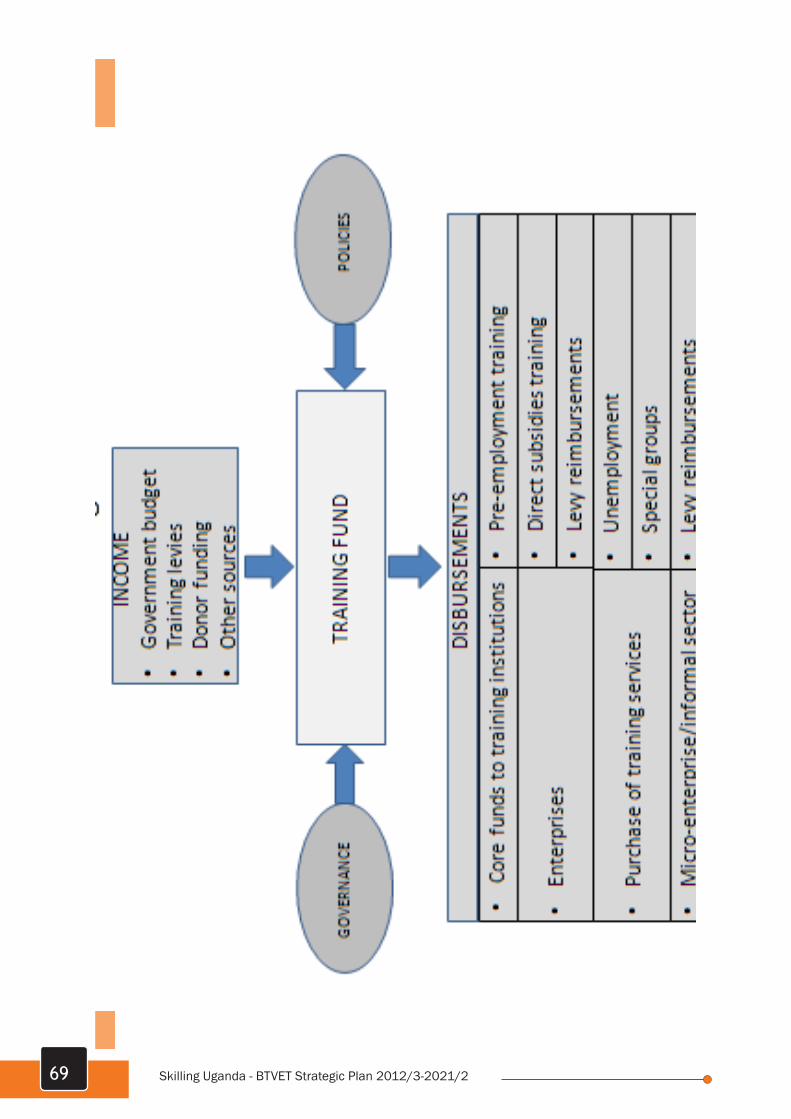
69 Skilling Uganda - BTVET Strategic Plan 2012/3-2021/2

70Skilling Uganda - BTVET Strategic Plan 2012/3-2021/2

71 Skilling Uganda - BTVET Strategic Plan 2012/3-2021/2

72Skilling Uganda - BTVET Strategic Plan 2012/3-2021/2

73 Skilling Uganda - BTVET Strategic Plan 2012/3-2021/2

74Skilling Uganda - BTVET Strategic Plan 2012/3-2021/2

75 Skilling Uganda - BTVET Strategic Plan 2012/3-2021/2

76Skilling Uganda - BTVET Strategic Plan 2012/3-2021/2

77 Skilling Uganda - BTVET Strategic Plan 2012/3-2021/2

78Skilling Uganda - BTVET Strategic Plan 2012/3-2021/2

79 Skilling Uganda - BTVET Strategic Plan 2012/3-2021/2
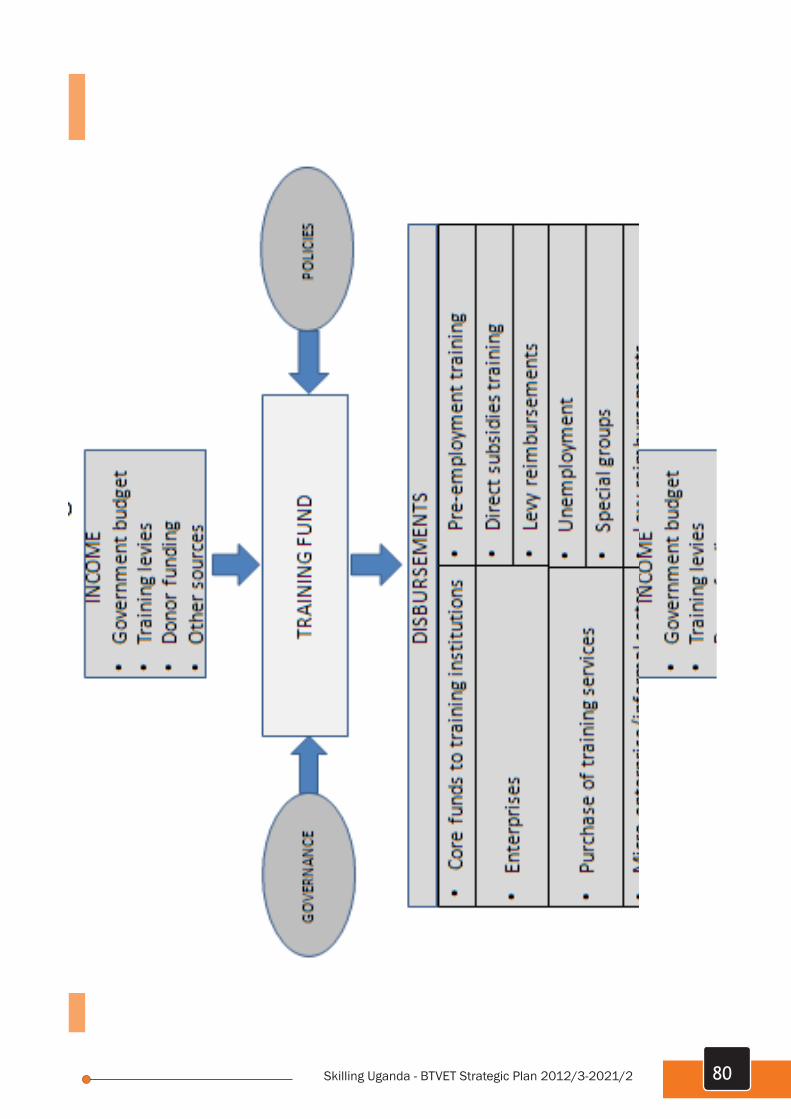
80Skilling Uganda - BTVET Strategic Plan 2012/3-2021/2

ANNEX 5: NOTES ON TRAINING AUTHORITIES
National Training Authorities
Characteristics– National training authorities are becoming increasingly an institutional mechanism of choice to promote demand-driven training. Such authorities exist in much of Latin America, and have been increasing in Anglophone Africa. ExamplesoftrainingauthoritiesintheregionincludetheBotswanaTrainingAuthority(BOTA),theNamibiaTrainingAuthority(NTA),theIndustrial-VocationalTrainingBoard(IVTB)inMauritius,TEVETAinZambiaandinMalawi,VETAin Tanzania, and Workforce Development Agency in Rwanda.
The common characteristics of training authorities is that they are independent of government ministries, are governedbytri-partiteboards,andoftenincludetrainingfundsfinancedbypayrolllevies.Thedegreeofemployerinvolvementvariesgreatly.Madagascar(IDAfunded)10ofthe12membersontheBoardoftheNationalCouncilforTechnicalandVocationalTraining(CNFTP)wereemployers.InCoted’Ivoire(FDFP)andKenya(NITC)employersmadeuponethirdofthemembershipoftri-partitebodies.InTanzania(VETA)only2of11membersofthemanagementboard are employer representatives. In Brazil – SENAI the service is controlled entirely by employers without worker representation. In Singapore’s WDA employers have a near majority (7 of 15 positions, including both Chair and Vice-Chair)comparedwiththreepositionsforunionrepresentativesandfourforgovernment.
The functions of training authorities vary, but may include the following:1. Market research on skills requirements2. Policy development*3. Strategic planning4. Developmentofoccupationalandtrainingstandards5. Development of curricula6. Assessment&certificationoftrainees7. Regulation of training providers8. Monitoring and evaluation of training9. Informationdissemination10. Financingoftraining;and11. Management of training institutions*.
*In some cases training policy and management of training delivery are functions retained by government ministries.
Rationale for Training Authorities1. The main reason to establish an independent training authority is to involve stakeholders, especially employers,
in directing and evaluating the training system. This cannot be done easily while TVET is the responsibility solely of government. Under exclusive government control employers tend to be
16An alternative to separate, independent national training authorities could be training boards or councils. However, training boards have met with mixed results. One type of board is thecommittee or council that operates only in an advisory capacity. In Ghana, attempts to set up a national overseer body for training in 1990 led to the establishment of the NACVET, a largely advisory body within the Ministry of Education that does not have separate legal status. A recent World Bank project completion report found that the NACVET still lacked legal authorityover the actors in the field more than a decade after its establishment. In Kenya, the National Industrial Training Council is purely advisory and has little real impact. It has presided over an on-going deterioration in public provision of training. Following a controversial start, the new NSA in South Africa has been allocated a purely advisory role.(Johanson and Adams 2004 and Ziderman 2003, p. 76).
81 Skilling Uganda - BTVET Strategic Plan 2012/3-2021/2

marginalizedandhavelittleincentivetoparticipate.Experienceselsewhere(Singapore,Brazil,Madagascar)suggest that major employer participation is key to success in orienting vocational training to the kinds and quality of skills required in the job market.
In turn, greater employer involvement in all aspects of the design, management and delivery of training pays dividends – it enables better links with the labour market – matching training to employment needs. (In contrast, a common problem with school-based systems of TVET under ministries is that they tend to operate andcontinue tobefinanced in isolation from the labourmarket.) Inaddition,anemployer role insystemdirectioncouldhelpstimulategreateremployerfinancialcontributionstoskillsdevelopment.
2. Responsiveness. Another major reason to establish independent training authorities is flexibility andresponsiveness – by being outside the normal government bureaucracy training authorities can respond more quickly to changing conditions in the labour market.
3. Consolidation and coherence—A single training authority can consolidate fragmented units and achieve economies of scale in performing the various functions. It can combine relevant government agencies into one body at the central level for more coherent policymaking and allocation of public funds. In addition, it could better address cross-sectoral issues and requirements. And located outside any Ministry it could avoid vested interests of sectoral training infrastructure.
4.Comprehensiveness.Anotherreasonforaconsolidatedtrainingagencywouldbetobroadenthescopeofattention to all forms of skills development and all types of providers, i.e. not just pre-employment training in public institutions, but enterprise-based training in the modern sector and in the informal sector.
5. Professionalism. Being outside the civil service a training authority could potentially offer higher salaries and thereby attract, retain and motivate high quality staff. It could build the professional capacity and incentives necessarytomanagetheTVETsystemproperly.Itcouldestablishmoreefficientandaccountableprocedures.Thus, a training authority could become a force for revitalization and expansion of skills provision.
6. Training markets. A training authority could become an intermediary to help stimulate a training market. Promotion of private (non-government) training – can be done more readily/easily by an independentorganization with private participation.
7. Status. Independent status could help raise the image of skills development counter the prevailing negative social attitude towards technical-vocational training.
Risks, Lessons and Design Considerations. 1.Ensuresufficientauthority.Nationaltrainingauthoritiesmustbevestedwithrealauthority.Toooftenthesebodies lack teeth and are essentially consultative to the relevant minister. Such organizations, despite their value, do not radically improve matters unless they can make decisions and control the allocation of resources. Lessons: The training authority should be independent. The autonomy of these bodies also helps preserve their pluralism. Employers and unions should select their own Board members.
2. Avoid unclear division of authority and responsibilities. Often government ministries maintain some residual responsibility for TVET once a training authority is established. In some cases, e.g.
17Routine administrative tasks can be effectively carried out hierarchical bureaucratic structures and processes, such as rules and standard operating procedures under routine administration of general education programs. These are termed “mechanistic” approaches. However, effective training organizations require high degrees of adaptation to uncertain, changing labor markets and clienteles, or “adaptive” management. (Middleton, Adams and Ziderman, Skills for Productivity. World Bank, 1993, 274-276.)
82Skilling Uganda - BTVET Strategic Plan 2012/3-2021/2

TEVETAinZambia,thislackofclarityledtoprotractedtensionsandunproductiveconflict.Thelessonhereunderlines the need for crystal clear division of authority and responsibilities between the training authority and any residual ministerial functions.
3. Ensuresufficientemployer representation- Balanced representation is critical to thesuccessofNTAs,especially the weight of employers in governing bodies. In Tanzania, only 2 employers sit on the 11-member VETABoard. InMadagascar, the Conseil National de la Formation Technique Professionnelle (CNFTP) hasan employermajority (10 of 12 seats). In Côte d’Ivoire and Zambia, employers represent one-third of themembers.IntheIVTBinMauritius,theprivatesector(employers)hasa50percentshareingovernance.Unlessemployersaregivensufficientpowerinthedecision-makingprocess,trainingmaynotbeadjustedtoservetheskills needs of the business community. In addition, it is important that employer representatives have close and frequent contact with their membership. Bureaucrats in employer organizations do not ascertain labour trends in industry automatically. The experience of other countries shows that balanced representation is criticaltothesuccessofnationaltrainingstrategies(seebox).
Lessons: Employers should have a major role in direction of the training authority. If one thing could be done to ensuretheeffectiveness,thiswouldbeit.Experienceelsewhere(Brazil,Singapore)suggeststhatemployerswilltake training seriously if they have major stake in it, i.e. a direct majority role in direction of the system. In addition, consideration should be given to ensuring a non-government Chairman of the Board, and the post should be held for a minimum of three years and not rotate among stakeholders. Moreover, it is essential that employers be equal partners in designing any training authority.
Box, Employer-Owned and Managed Training in Brazil
Experiences in Brazil, one of the earliest countries to adopt levy-financed training authorities,underscore the importance of ownership and employer participation. The chronic gulf between sup-ply and demand is bridged by giving full control of training to its users, The National IndustrialApprenticeship Service (Serviço Nacional de Aprendizage Industrial [SENAI] was created in the 1940s and operates under the pwnership of the Federation of Industries. SENAI was followed by four other sector-specific services aimed at, respectively, commerce SENAC), rural areas (SENAR), small enterprises (SEBRAE), and transport (SENAT). All the institutions operate under the same basic structure and legal framework. The industries tax themselves to fund their training programs. A 1 percent levy on the payroll funds the training operations, and the chambers of employers run the institutions with full independence and under private sector statutes. All five institutions have evolved in separate directions. SENAI maintains a network of 500 training institutions and trains 2 million workers a year. SENAR and SEBRAE were first created as government bureaucracies, but this led to inefficiencies, lack of responsiveness and flexibility, and political spoils. They were recreated more recently with ownership, management, and budgets given to the respective employer associations.Because training markets had already been developed in the country, both SENAR and SEBRAE opted to buy training in the market rather than establish their own training institutions, SENAT, the most recent offshoot of SENAI, with the same rules and legal framework, took an entirely different path for delivery of training. It created an extensive network for training via satellite for more than 1,000 firms throughout the country.
83 Skilling Uganda - BTVET Strategic Plan 2012/3-2021/2

4. Avoidconflictsof interest-potentialconflictsof interestarisewhen the trainingauthoritybothprovidesfinancingandowns(manages)itsowntraininginstitutions.TanzaniaandMauritiusillustratetheproblemofconflict.Tanzania’sVocationalEducationandTrainingAuthority(VETA)isfinancedthroughatwopercentpayrolltaxonformalsectorenterprises.TherevenuefinancesmainlytheoperationsofVETAitself–theadministrationand the functioning of its training centres. The more than 700 private training providers outside the VETA systeminthepastreceivedonlyfivepercentofthetotallevyrevenue.Aprivatetrainingmarketexists,butitisnotencouragedordevelopedthroughVETAbecauseVETAtakescareofitsowninstitutionsfirst.SubsequentstructuralchangesinMauritiushaveeliminatedtheconflictofinterest.TheIndustrialVocationalTrainingBoard(IVTB)wasinitiallyaprovider,afacilitatorandaregulatoroftraininginMauritius.However,experienceshowedthatthethreerolesofIVTBcouldgiverisetoconflictsofinterestandwereinconsistentwiththeprincipleofgood governance. It was decided in 2001 that the IVTB would concentrate on its role as provider of training. In 2002,theroleofregulatorwastransferredtotheMauritiusQualificationAuthority(MQA).Theroleoffacilitator(designandmanagementof the levygrantscheme)wastransferredto theHumanResourceDevelopmentCouncil(HRDC)in2004.
However, there are no guarantees that a training authority would in fact be better than arrangements under agovernmentministry.ADANIDAevaluationofitsassistancetotrainingauthoritiesinTanzaniaandZambiapointed to the complexities and difficulties involved in establishing national training authorities. Enablinglegislationwasdelayed inZambiaand itwasdifficult to“createaneworganizationalculture” inTanzania.DANIDA indicated that the new national training bodies were a considerable improvement over the purely advisory boards that they replaced; however,most did not function as effectively as envisaged. EmployerrepresentationwaslimitedinTanzaniaandsustainablefinancingwasnotassuredinZambia.
Sources:John Middleton, Arvil Van Adams and Adrian Ziderman. 1993. Skills for Productivity. World Bank.
Indermit Gill, Fred Fluitman and Amit Dar. 2000. Vocational Education and Training Reform: Matching Skills to Markets and Budgets. ILO and
World Bank.
Adrian Ziderman. 2003. Financing Vocational Training in Sub-Saharan Africa. World Bank.
Richard Johanson and Arvil Van Adams. 2004. Skills Development in Sub-Saharan Africa. World Bank.
84Skilling Uganda - BTVET Strategic Plan 2012/3-2021/2

ANNEX 6: NOTES ON FINANCIAL TRANSFER MECHANISMS
Financial Transfer Mechanisms
Thewayfundsaretransferred(financialtransfermechanisms)canbeasimportantastheamountstransferred.Funds can be transferred in ways to provide incentives to achieve TVET policy objectives. Such mechanisms typically do not require additional resources.
Ad hoc funding. In public training institutions funds are typically transferred based on last years’ budget, negotiations and available funds, that is, based on previous history. This is often augmented by across-the board incremental budgetincreases.Thissystemoffinancialtransfersisrootedinthestatusquo.Fewornoperformanceconditionsareattachedtothetransfers.Themajorshortcomingsofadhocfundingarelackofincentivesto(1)promotegreaterefficiencyor(2)adapttolabourmarketneeds.Adhocfundingencouragescomplacencyamongtrainingproviders.Salaries and budgets are received regardless of performance. Training provision remains static and supply-driven. Instead of transferring resources to institutions on a historical basis, public resources could be transferred on the basis of input or output criteria.
Input based funding- (normativefinancing). Institutionscouldbefinancedaccording to theestimatedcostsofinputs, for example by using norms such as the number of trainees enrolled or the number of classed taught. Themostcommonapproachistomultiplyenrolmentsbyaparameterofunitcosts.Formulascanberefinedbyprovidingdifferentweights(coefficients)toreflectthedifferingcostsoftraining.Theycanalsoprovidepremiumsfor enrolment of disadvantaged students. Funding formulas based on average costs clearly promote expansion of enrolments. By linking funding to the cost of training, input funding also achieves greater accountability than ad hoc budgeting. However, incentives for enrolment expansion do not take into account quality of training offered or its job relevance. Moreover, input budgeting promotes training in isolation from employment needs and the job market. Thus,inputfundingdoesnotovercometheinherentweaknessesofdirectallocations–(i)thelackofincentivesforqualityassuranceorefficiency;and(ii)thelackof incentivestoclosethegapbetweentrainingandemploymentneeds.
Output –based funding–(performance-basedfunding).Thesecriteriapayonthebasisofresults.Output-basedfunding rewards training institutions for meeting predetermined levels of training delivery. Output targets can be defined inabsolute terms (e.g.numberofcoursecompletions,pass ratesonexaminations)or in relative terms(yearsofcompletion.)Output-basedfundingrelatedmainlytoprocess,theinternaltrainingactivitiesofthetrainingprovider.Output-basedfundingpromisesenhancedefficiencyofthetrainingprocess.However,itisunlikelytoforgebetter absorption of trainees in the labour market, i.e. it does not result in a greater demand-driven orientation of training.
Another form of output-based funding focuses on outcomes, how well the training programs impact on the labour market. Outcome targets measure the success of training providers in meeting labour market needs (e.g. job placementwithinareasonabletime.)Thekeyforbothtypesoftargetsistodefinetransparentandmeasureablecriteriathatareeasilycompletedbutnoteasilymanipulated.Thiscanbedifficult.Outcomes,forexample,arenoteasily measured. Training providers could resort to “creaming”—screening out less promising candidates so as to maximize results. Creaming is likely to exclude the poor, unemployed youth, and other disadvantaged groups. This can be countered by giving greater weight in the reward structure to performance of the disadvantaged population. Performance-based funding can also lead to instability, particularly during weak economic growth cycles. Thus, output-based funding is unlikely to be successful if used as the sole criterion for funding.
18This annex is derived mainly from Adrian Ziderman, 2003, Financing Vocational Training in Sub-Saharan Africa. World Bank, pp. 130-134.
85 Skilling Uganda - BTVET Strategic Plan 2012/3-2021/2

Sinceoutput-basedfinancingmaynotbesuccessfulbyitself,acompositefundingformulamaybemostappropriate.The composite formula could include such elements as institutional inputs, outputs, desired labour market outcomes andthetrainingofspecialgroups.Theinputelement(probablytotalenrolment)wouldofferfundingstability;theoutputelementwouldprovideincentivesforinternalefficiency(e.g.completions);theoutcomeselement(e.g.jobplacement)wouldrewardexternalefficiencyandlabourmarketlinkages;thetargetgroupelementwouldfacilitateachievement of social goals.
Contract funding. – Transferring funds to training institutions by means of contracts between the funding agency andthetraininginstitution.Thecontractspecifiestherangeoftrainingservicestobeprovidedandperhapsalsoperformance conditions for payments. However, if the practice is limited to public institutions it can operate as a “closed shop” denying entry to private providers. A system of competitive bidding for contracts can provide a better cost-conscious environment if private providers can compete on equal terms with public providers.
Competitive funding. Funds are normally accessed on a competitive basis using a transparent process of proposal submission, peer review and management approval. They are usually implemented through performance agreements thatincludepreviouslydefinedmeasurableoutcomeindicators.Thecompetitiveaspectofthesefundsgenerallymakesthemmoreefficientinstrumentsfortheallocationofpublicfundingthanmoretraditionalapproachesbasedon ad hoc budgetary planning. Second, they have proven to be effective mechanisms for improving educational quality and relevance in TVET. In this regard, they have been particularly useful in promoting the introduction of self-evaluationandstrategicplanningwithinTVETinstitutionsandfostering“ownership,”(i.e.,commitment)amonginstitutional staff. Finally, competitive funds are flexible and can quickly respond to changing policy priorities.Adjustments to institutional eligibility criteria and proposal evaluation criteria can easily re-orient the fund from one year to the next. Competitive funds have been used frequently in World Bank TVET projects with some success, such as for informal sector training in Cote d’Ivoire. However, competitive funds have some limitations. They are not particularly effective in promoting system-wide or policy reforms. They may not lend themselves to being used in countries with wide-ranging differences in institutional capacities. In such cases strong institutions may capture the lion’s share of fund resources.
Vouchers (indirect allocations-trainee-basedfunding.)Ratherthanstatesupporttopublictrainingbytransferoffunds directly to the institution, an alternative would be to transfer funds to trainees. One way to do this is through training vouchers. Trainees could use the vouchers to pay for tuition and other fees charged by the institutions. Vouchers could be tenable at private training institutions, increasing market competition and widening trainee choices.Benefitsofcompetition,atleastintheory,aretobroadenthetypeofcourses,raisequalityandreducecosts.Severalexamplesexistofexperimentswithvouchersforspecificpurposes–theJuaKaliprojectinKenya,theintake voucher scheme in Ghana and a scheme in Mauritius for SMEs. In Kenya availability of demand-side vouchers stimulated a training supply response among master craftspeople. Experiences this far also suggest that effective vouchersystemsrequire(i)sufficientadministrativecapacitytoimplementthem,(ii)sufficientinstitutionswithinacatchmentareatoprovidegenuinechoice,and(iii)safeguardstoavoidcollusionbetweenthevoucherholderandtrainingprovider(e.g.theproviderprovidesakick-backtothevoucherholderwithoutactuallyprovidingthetraining.)
86Skilling Uganda - BTVET Strategic Plan 2012/3-2021/2

Table 1- Summary of transfer mechanisms by objective
Policy Objective Appropriate transfer mechanism
1. Increase relevance to labour market • Earmarkedgrantsorscholarshipsfortraineestotraininpriorityfields
• Formula funding thatassignsgreaterweights tohighpriorityfields
• Competitive funds with priority given to therelevance of program offerings.
2. Increase access • Input-based funding, such as per-studentfinancing
• Uncapped enrolment-based funding formulasprovide a strong incentive to institutions to increase enrolments
3. Increase equity • Ad hoc budgets and input-based formulas tendnot to help disadvantaged students because the institutions, rather than the individual, received the funds. One exception could be paying institutions premiums for enrolling and graduating disadvantaged students (a type of performance-basedfunding.)
• Instead, support trainees directly to raise theirparticipation through vouchers.
4. Raisequality • Funding formulas based on defined qualitymeasures, e.g. trainee pass rates on national assessments
• Competitive funds are probably the best way toachieve quality improvement and innovation. They can target key innovations likely to raise quality.
• Demandsidevouchersshouldfostercompetitionamong institutions for trainees and increase system quality
5. Increaseinternalefficiencyinuseofresources • Formulafundingbasedonaverageunitcostsperstudent.
• Competition for funds with the private sectoreligible to compete with public institutions on an equal basis
• Performance-basedcontractsthatlinkfundingtoperformanceoncosts(e.g.costspergraduate.)
Based in part on JamilSalmi and Arthur Hauptman, 2006, Innovations in Tertiary Education Financing: A comparative Evaluation of Allocation Mechanisms. Education Working Paper Series No. 4, World Bank.
87 Skilling Uganda - BTVET Strategic Plan 2012/3-2021/2

ANNEX 7: NOTES ON TRAINING LEVIES
TRAINING LEVIES
Overview of levy systems. Earmarked taxes for training can be levied on turnover, production or contracts. The most common form is a levy based on company payroll. Payroll training levies are basically of two types: revenue generating levies and incentive schemes for enterprises. Incentive schemes, in turn, are made up of three types: cost reimbursement, levy grant and levy exemption or rebate. However, few pure models exist and they tend to change over time. For example, training levies that started as purely revenue-generating schemes have become mixed with the inclusion of elements of levy grant or rebate.
Over sixty countries have, or had, training levies of various kinds. Most of these are in Latin America and the Caribbean, Sub-Sahara Africa or Europe. The three main types are revenue-raising, levy-grant and levy-exception. The great potential of levy schemes for expanding the tax base for training explains the wide dissemination of training levies.
Training levies are not restricted to larger countries. They operate in countries with relatively small populations – Fiji, Marshall Islands, Botswana, Mauritius, Barbados, Jamaica, Namibia and countries of Central America. However, levy successdependsonasufficientlywideeconomicbaseintheformalsectorandreasonableadministrativecapacity.These schemes are more effective in countries with large formal sector, i.e. a large tax base. They are less effective in countries with highly informal economies. Therefore training levies tend to apply almost exclusively in middle and upper income countries where these two essential conditions exist, not in low income countries.
The coverage of levy systems varies widely from country to country. Most schemes exclude the public sector from collections(Mauritius,Tanzania,SouthAfrica.)Thismayresultinacrosssubsidizationoftrainingforpublicsectoremployees by the private sector to the extent that public employees are trained with levy money. Size of company includedalsovaries.TheNigerianschemecoversenterpriseswith25ormoreworkers,SENATIinPeruwith≥20workers,≥10workersinColombia,and≥fiveworkersinHonduras,VenezuelaandCostaRica.TheSouthAfricanlevy isassessedonfirmswithannualpayrollsoverR500,000. Mostof the revenuecollectedby training fundscomesfromlargeandmediumsizedfirms.Giventheadministrativecostsandlikelyyield,collectionsfromsmallfirmsmaynotbecost-effective.
Collectionmethodsvaryandinclude:self-collectionbythetrainingfund(Kenya),collectionbythesocialsecurityagency(Namibia),butthemostcommonandeffectiveiscollectionbythetaxadministration(SouthAfrica).VETAinTanzania increased its revenue dramatically when it switched collections from the social security agency to the tax revenue authority in 2001.
In several cases payroll levies are appropriated by the central government and never reach the training fund. This hashappened inCostaRica,Gabon,Togoand,briefly, inCoted’Ivoire. Inothercasespayroll levieshave led tounspent surpluses, in effect becoming an over-sheltered source of funding.
19This annex is summarized from Richard Johanson, A Review of National Training Funds, SP Discussion Paper 0922, World Bank, November 2009.20The 17 countries in SSA with training levies include: Benin, Burkina Faso, Botswana, Cote d’Ivoire, the Gambia, Kenya, Malawi, Male, Mauritius, Namibia, Nigeria, Senegal, South Africa, Tanzania, Togo, Congo and Zimbabwe. See Attachment 1.
88Skilling Uganda - BTVET Strategic Plan 2012/3-2021/2

Table 1- Summary of transfer mechanisms by objective
Advantages Limitations
• Earmarkedpayrollleviescanbeviewedas“benefittaxation,” i.e. those that benefit (employers andworkers)payforthetraining.
• Earmarked taxation does not conform well withtheprinciplesofsoundpublicfinanceandweakenattempts to unify the national tax system.
• Levy systems can augment substantially theresource base for training.
• Payroll levies raise the cost of labour to theemployer, possibly discouraging employment.
• Increased training resources, in turn, cansubstantially increase the incidence of training
• Employersmayshifttheincidenceofthelevyontoworkersintheformofloweredwages;inthiscase, workers and not the employers bear the burden of the tax.
• Leviescanprovideasteadyandprotectedsourceof funding for training, particularly in the context of unstable public budgets.
• Insecurity of income: Under fiscal pressure,government may divert levy proceeds into general public tax revenues for non-training uses
• Levy-grant systems can encourage firms tointensify their training efforts, increase training capacity and raise training quality
• Unequal access: many firms, particularly smallones,donotbenefitfromthescheme;thisbreedsresentment, opposition and compromises the statusoftrainingleviesas“benefittaxation”
• Training levies collected from formal sectoremployers can serve as a vehicle for cross subsidization, e.g. for smaller employers and especiallyforfirmsintheinformalsector.
• Inefficiency: Payroll levies may constitute anover-sheltered source of funding, leading to unspent surpluses, inefficiencies and top-heavybureaucracies
• Funds with tri-partite management can forgecooperation among the social partners and facilitate formulation of appropriate training policies.
• Red tape may erect high barriers for firms toaccess funds
• Fundscaninfluencethequalityoftrainingthroughaccreditation procedures and helping to stimulate a competitive training market.
• Levy-financed funds can also help correctimbalances in training access by pooling funds – e.g. for training disadvantaged segments of society, unemployed, those in the informal sector. This redistribution can be termed “cross-subsidization.”
• Establishmentofaseparatetrainingfundaccountcan facilitate transparency and minimize distrust between employers and the public sector
Sectoral levies. Sectoral, or industry-specific, training funds are an alternative to national (centralized) fundingmodels. Sectoral leviesare limited toadefinedsectorof theeconomy, suchas industryor transport. In somecountries sectoral training funds have been established based on training levies. This includes Brazil (SENAI in industry;SENACincommerce;SENARinagriculture;SENATintransport),Peru(SENATIinindustryandSENCICOinconstruction)andinSouthAfrica(23sectoraltrainingauthorities-SETAs.)
89 Skilling Uganda - BTVET Strategic Plan 2012/3-2021/2

A national system of sectoral funds can focus on the training needs of particular sectors and in principle engender agreatersenseofownershipamongtheenterprises.Sometimesectoralfundscanaddressspecificmanpowerorqualificationshortages.Anationalsystemofsectoralfundsofferstheadvantagesofflexibilityandtheabilitytofocusmore directly on the particular, often differing, sectoral training needs. They may be more palatable to employers because of a sense of greater industry-specific orientation, less bureaucracy and greater sense of ownership.However, sectoral funds suffer from narrow focus which runs counter to an integrated, national approach to skills development. The argument against these sectoral funds is that they lock up resources in the sector when national interest may require reallocation of training funds across sectors, i.e. from non-growing sectors with old technology torapidlygrowingsectorswithnewtechnology.Theydonotfacilitateredistributingfundsacrosssectorsorfinancingnon-sector related skill priorities. Sectoral funds may duplicate efforts and fail to develop common core skills, transferable across industries. A purely sector-by-sector approach is also poorly adapted to regional needs.
Addressing small enterprises. Virtually all levy-financed training funds experience difficulties in fosteringparticipation by small enterprises. Several factors account for this. lack capacity to assess training needs and design appropriateprograms.Productionsufferswhenkeyemployeesarereleasedfortraining;thetimeawayfromworkcanbecostlyinforegoneoutput.Smallenterprisesoftenfaceconstraintsincashflowtopayfortraining.Thesmallerscaleoftrainingrequiredaddstocosts.Smallfirmsmaybeunawareofthebenefitsandavailabilityoftraining.Smallcompanies tended to lag behind because of diseconomies of scale, lack of knowledge about how to train, lack of financingandlowskillsdemandfromuseofmaturetechnologies.BoththeSDFandHRDFhavedevelopedexplicitprogramsto targetsmallenterprises.These includedvouchers toeasecashflowconstraints,grants for trainingneedsanalysisandcoursedesign,andsimplificationofadministrativeapprovals.
Type 1: Levies to raise revenue for pre-employment training.The principal rationale of pre-employment training funds is to increase the supply of well-trained individuals in the labour market and reduce the gap between supply and demand for skills. The objectives typically are to create an adequate training supply for the needs of employers and create the necessary training capacity to do so. The sourceoffinancingisacompulsoryrevenue-generatingpayrolllevyonformalsectorenterprisesemployingatleastaminimumnumberofemployees(usually5-20).Enterprisespayingthelevydonotbenefitdirectlyinthattheirworkersareusuallyexcludedfromthepre-employmenttraining.However,theybenefitindirectlyinbeingabletorecruitmorehighlytrainingworkers.Themodusoperandiisforthepayrolllevytofinancetheestablishmentandoperationpre-employment vocational-technical training institutions owned and operated by the training agency. Pre-employment trainingfundsarefoundmostlyinCentralandSouthAmerica,butalsoinHungary,Mauritius(previously)Tanzaniaand Fiji. Pre-employment training funds have built training capacity and increased substantially training output in several countries. For example, SENAI in Brazil trains 2.8 million people p.a. and has accounted for over 30 million trainees since its creation. Where governed by employers pre-employment training funds can increase the relevance of training to economic requirements.
90Skilling Uganda - BTVET Strategic Plan 2012/3-2021/2

Table 2. Advantages and limitations of revenue-generating levy systems
Advantages Limitations
Constitute a sheltered source of funding for national trainingsystems,morestablethanpublicfinancing.
Develop large bureaucracies in some cases. Some agencies under-provide training and accumulate unnecessary surpluses and use payroll funds for non-trainingpurposes.(e.g.Zimbabwe.)SENAinColombiabuilt up surpluses to expand gradually into agriculture, construction and training for self-employment.
Increasethevolumeoffinancingavailablefortraining,reducing the burden of training funding falling on the state.
Usefundsinefficiently,insomecases
Compensateforweakpublicfinancingoftrainingwherepublic sources are severely constrained.
Lack direct incentives for enterprise training.
Build competent national training capacities, as in Brazil and Colombia.
Donotbenefitemployersinproportiontothepaidlevies.For example, enterprises with high average wages may have highly trained workers and pay high levies, but receive little training. Itmaybedifficult tosustainemployer interest.
Enhanceaccountabilitytoemployerswhofinancethem,e.g. in Brazil,
Tend not to build training markets, as the agencies financetheirowntraininginstitutionsfirstandforemost.It is important not to crowd out private training providers
Foster more efficient institutional management whenemployers are in charge.
Can cause government to reduce or eliminate its funding oftraining(example:Tanzania).
Type 2: Levies to Stimulate Enterprise Training.Therationaleofenterprisetrainingleviesistoraisetheproductivityandcompetitivenessoffirmsthroughworkertraining.Theobjectiveistoincreasetheincidenceoftrainingwithinfirms.Thesourceoffinancingisenterpriselevies,usuallyonpayroll. Themodusoperandivariesaccording to typeofscheme: (a)cost reimbursement, (b)levy-grantand(c)levyexemption(train,orpay).Beneficiariestendtobelargerenterprises,andwithinenterprises,thoseathigheroccupationallevels.Smallfirmstendnottobenefit.Enterpriseincentivefundsarethemostcommonform of levy scheme world-wide. They require administrative capacity to operate and often discourage participation because of red tape. Although rigorous evaluation is generally lacking, in some cases levy schemes have led to an increase in the volume of training within enterprises.
1. Cost-Reimbursement. Formal sector employers above a minimum number of employees pay a levy into a training fund usually based on the payroll. Approved training expenditures are reimbursed in part, within the limits of the levy paid by the enterprise. In practice, reimbursement is set below the levy paid to cover central administration costs and sometimes to allow for central expenditures on other training services. Nigerian IndustrialTrainingFund(ITF)isanexample.Firmscanqualifyfornotmorethan60percentofthelevypaid,andinpracticelessthan15percentoffirmsapplyforreimbursementfortrainingcosts.
21In addition to operating the cost-reimbursement scheme, the ITF finances and operates its own training centers, provides advisory services to companies on training and in developing training plans.
91 Skilling Uganda - BTVET Strategic Plan 2012/3-2021/2
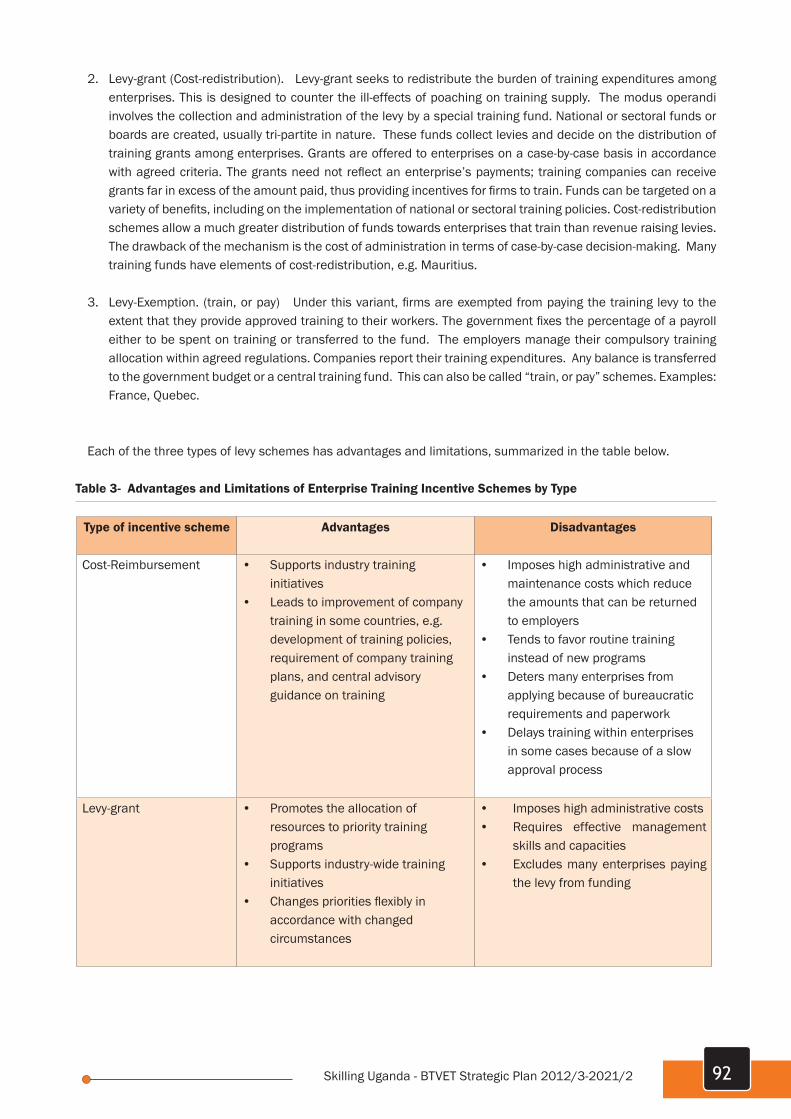
2. Levy-grant(Cost-redistribution).Levy-grantseekstoredistributetheburdenoftrainingexpendituresamongenterprises. This is designed to counter the ill-effects of poaching on training supply. The modus operandi involves the collection and administration of the levy by a special training fund. National or sectoral funds or boards are created, usually tri-partite in nature. These funds collect levies and decide on the distribution of training grants among enterprises. Grants are offered to enterprises on a case-by-case basis in accordance withagreedcriteria.Thegrantsneednotreflectanenterprise’spayments;trainingcompaniescanreceivegrantsfarinexcessoftheamountpaid,thusprovidingincentivesforfirmstotrain.Fundscanbetargetedonavarietyofbenefits,includingontheimplementationofnationalorsectoraltrainingpolicies.Cost-redistributionschemes allow a much greater distribution of funds towards enterprises that train than revenue raising levies. The drawback of the mechanism is the cost of administration in terms of case-by-case decision-making. Many training funds have elements of cost-redistribution, e.g. Mauritius.
3.Levy-Exemption.(train,orpay) Underthisvariant,firmsareexemptedfrompayingthetraininglevytotheextentthattheyprovideapprovedtrainingtotheirworkers.Thegovernmentfixesthepercentageofapayrolleither to be spent on training or transferred to the fund. The employers manage their compulsory training allocation within agreed regulations. Companies report their training expenditures. Any balance is transferred to the government budget or a central training fund. This can also be called “train, or pay” schemes. Examples: France, Quebec.
Each of the three types of levy schemes has advantages and limitations, summarized in the table below.
Table 3- Advantages and Limitations of Enterprise Training Incentive Schemes by Type
Type of incentive scheme Advantages Disadvantages
Cost-Reimbursement • Supportsindustrytraininginitiatives
• Leadstoimprovementofcompanytraining in some countries, e.g. development of training policies, requirement of company training plans, and central advisory guidance on training
• Imposeshighadministrativeandmaintenance costs which reduce the amounts that can be returned to employers
• Tendstofavorroutinetraininginstead of new programs
• Detersmanyenterprisesfromapplying because of bureaucratic requirements and paperwork
• Delaystrainingwithinenterprisesin some cases because of a slow approval process
Levy-grant • Promotestheallocationofresources to priority training programs
• Supportsindustry-widetraininginitiatives
• Changesprioritiesflexiblyinaccordance with changed circumstances
• Imposeshighadministrativecosts• Requires effective management
skills and capacities• Excludesmanyenterprisespaying
the levy from funding
92Skilling Uganda - BTVET Strategic Plan 2012/3-2021/2

Type of incentive scheme Advantages Disadvantages
Levy-Exemption • Keepsfinancialallocationswithinenterprises;employersarefreeto plan, manage their funds and administer their training.
• Economizesoncosts--Centraladministration of funds is not required;thenationalcostofadministration is low.
• Forgeslinksbetweenemployers,schools and agencies, and stimulates the development of private training markets through the option for training institutions to compete for employer grants (Frenchapprenticeshiptax).
• Ineffective spending of thecompulsory allocation in some cases
• Cannot support broader sectoral(ornational)trainingprioritiesandactivities.
Some common concerns training funds, including levy funds, are presented in the Annex on Training Funds. This includes governance, who decides on allocations, administrative autonomy, degree of competition and support for small enterprises.
Specific Considerations for Levy-financed Training FundsLevy schemes have had a positive impact on quantity of in-service training of workers. At least quantitatively, training levies achieved their objective of increasing the incidence of enterprise-based training. (Brazil, Singapore, Malaysia, SouthAfrica). However, thebenefitsof levy-financedtrainingfundswerenotevenlydistributed. Theytendedtomirrortheincidenceofenterprise-basedtrainingingeneral.Largerfirmsbenefitdisproportionately.Smallerfirmsrarelyparticipatedforreasonsexplainedabove.“Smallandmid-sizedemployershaverarelybenefitedfrompayrollleviesinanycountryforwhichwehaveavailableevidence.”Somelevyfundsaccumulatedsignificantsurpluses(Zimbabwe, Colombia) which led in part to significant overstaffing (Nigeria Industrial Training Fund.) Revenue-generatingfundsthatgavepreferentialfinancingtotheirowntraininginstitutionstendedtocrowdoutothertrainingproviders(Kenya,DepartmentofIndustrialTraining;Tanzania.)Otherfundssufferedunderexcessivegovernmentcontrol(Hungary,Togo),orexcessiveredtape.
The following list synthesizes good practices in the design and operation of levy-financed training funds.
1. Appropriateness- Avoid premature introduction of payroll levies. Payroll levies may not be appropriate in low income countries where the industrial base is limited and levy-income generating capacity is weak. Thereforeaprimaryrequirementisasufficientnumberofformalsectorenterpriseswithsufficientincometo generate revenue. In low-income countries the industrial base may be too narrow, or the majority of enterprises located in the informal sector so as to preclude payroll levies
2. Employer agreement or “buy-in” -- Employer-buy-in for levy schemes is crucial. Extensive consultations andconsensuswithemployers isessentialontheneedandbenefitsbefore introducinga levyscheme.Enterprises often see as an additional tax that they will recoup by lowering wages of the workers. Employers need to be consulted early and thoroughly – something that was not done in Tanzania and for which the levy scheme still lacks employer support.
93 Skilling Uganda - BTVET Strategic Plan 2012/3-2021/2

3. Conflict of interest. Funds that give preference to institutions they own (Tanzania, Kenya, formerly inMauritius)haveaninherentconflictof interest.Givingpreferencetoafundingagency’sowninstitutionscancrowdoutother(private,NGO)trainingproviders.InKenyaandTanzania,withthelevygoingtosupporttraining institutions owned by the training authority, non-governmental providers of craft training tend to be neglected. This is also a tendency in Brazil where SENAI operates its own network of training institutions. There are exceptions to this rule, however, as in TPAF of Fiji which produces excellent training in its own institutions. Generally, however, training agencies and funds should avoid a direct training role, as does Chile’s SENCE.
4. Cross-subsidization.Whatshareofthefund,ifany,shouldbedevotedto“cross-subsidization”,e.g.trainingfor those in the informal sector, or for small enterprises that have not contributed? Cross-subsidization allowsfundstobechannelledtoprioritiesoutsidetheimmediatecollectionarea.Colombia(SENA),Coted’Ivoire, and Burkina Faso, Mali, Benin all permitted funds raised from formal sector enterprises to be spent on training of workers in the informal sector. In South Africa cross subsidization is built into the levy design: 20 percent of levy proceeds are allocated to the National Skills Fund for equalizing access to skills.
5. Global versus sectoral coverage – A standard, national payroll levy is preferred to a sectoral levy for its greater ability to permit funds to be allocated where training needs are greatest. On the other hand, keeping funds in the sector where they were collected can increase the sense of ownership of training. Brazil has relatively few sectoral training funds (five) comparedwith the highly fragmented systemof 23 sectoralauthorities in South Africa, many of which may not be viable in size. Sectoral levies are more common in Europe, particularly in the UK, Denmark and the Netherlands – but most of these are the result of collective bargainingandsufficientadministrativecapacityexiststooperatethem.Onbalance,nationalleviesarepreferable in developing countries as they foster an integrated, national approach to skills development and require comparatively less administrative capacity than sectoral funds.
6. Periodicallyrevisedlevyrate.ExperiencesinLatinAmerica(Venezuela)andAfrica(Zimbabwe,Mauritius)show that a rate too high may lead to surpluses and lavish bureaucracies The lesson, therefore, is to adjust the rate periodically to ensure that the training is neither underfunded nor leads to surpluses. In Mauritius the rate was lowered when surpluses emerged.
7. Levy collection—Use effective agents. How to collect the funds efficiently without costing more inadministrative expenses than the levy collects – integrating the levy collection with collection of taxes (South Africa) or social security oftenworks; separate collection by a training agency usually does not(Kenya,Tanzania).
8. Securityoflevyproceeds–Avoiddiversiontootherpurposes,includingtreasuryconfiscation.Levyfundsshould not be used for other government expenses, as has happened in the past in Costa Rica, Cote d’Ivoire briefly,TheGambiaandTogo.Fundsshouldbeearmarkedtobeusedonlyfortrainingpurposes,avoidingextraneous activities.
9. Typesoflevies.Whichworkbest,andunderwhatcircumstances?Pre-employmentfundssupportedbyrevenue-generation schemes should be seen as an initial means to establish national training institutions, to be augmented later by more cost-effective systems such as employer training incentives. All three typesofin-service(enterpriseincentive)schemesrequireadministrativecapacityandtoanextentimposebarrierstoaccessbyfirms.Levy-grantmechanismshavetheadvantageofbeingabletoaddressnationalpriorities directly. Cost-reimbursement schemes can impose a high administrative burden on the training fund.Levy-exemptionmayhavethedisadvantageofa“levellingeffect,”i.e.firmsthatwouldotherwisehaveinvested more in training tend to reduce their effort to that required by law. More evaluation is needed to determine the relative cost-effectiveness of the different types of levies.
94Skilling Uganda - BTVET Strategic Plan 2012/3-2021/2
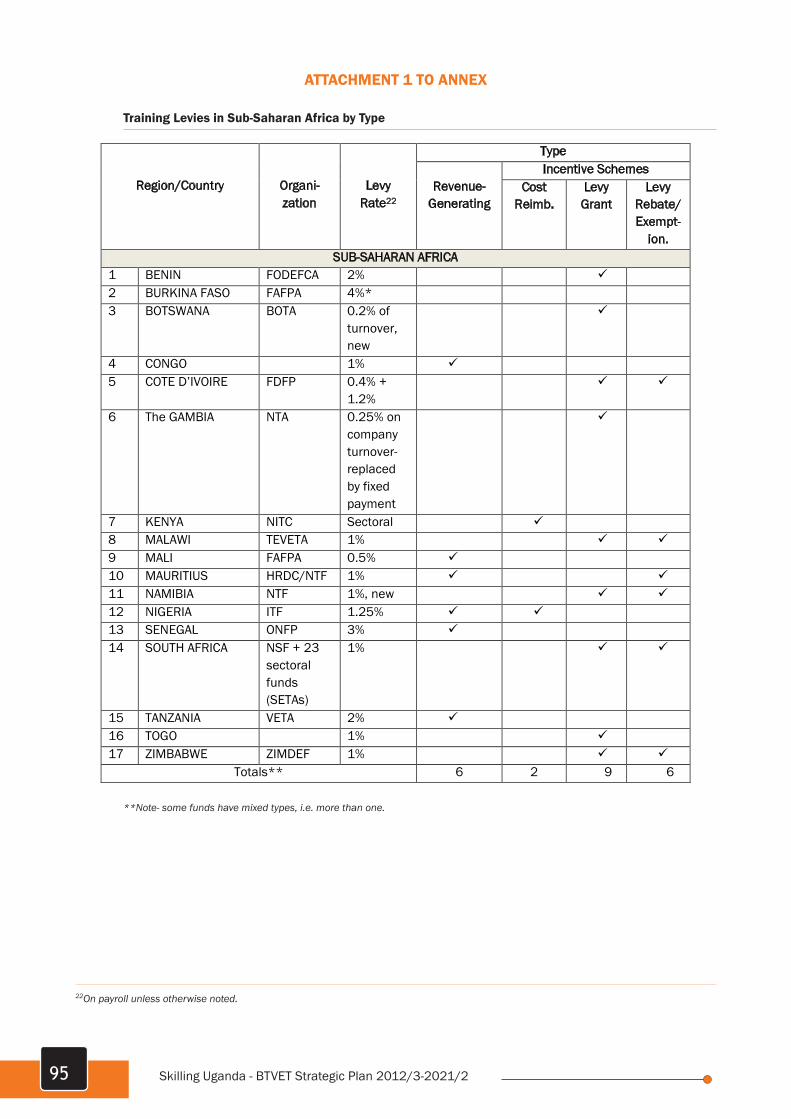
ATTACHMENT 1 TO ANNEX
Training Levies in Sub-Saharan Africa by Type
Training Levies in Sub-Saharan Africa by Type
Region/Country
Organi- zation
Levy Rate22
Type
Revenue- Generating
Incentive Schemes Cost
Reimb. Levy Grant
Levy Rebate/ Exempt-
ion. SUB-SAHARAN AFRICA
1 BENIN FODEFCA 2% 2 BURKINA FASO FAFPA 4%* 3 BOTSWANA BOTA 0.2% of
turnover, new
4 CONGO 1% 5 COTE D’IVOIRE FDFP 0.4% +
1.2%
6 The GAMBIA NTA 0.25% on company turnover- replaced by fixed payment
7 KENYA NITC Sectoral 8 MALAWI TEVETA 1% 9 MALI FAFPA 0.5% 10 MAURITIUS HRDC/NTF 1% 11 NAMIBIA NTF 1%, new 12 NIGERIA ITF 1.25% 13 SENEGAL ONFP 3% 14 SOUTH AFRICA NSF + 23
sectoral funds (SETAs)
1%
15 TANZANIA VETA 2% 16 TOGO 1% 17 ZIMBABWE ZIMDEF 1%
Totals** 6 2 9 6 **Note- some funds have mixed types, i.e. more than one.
**Note- some funds have mixed types, i.e. more than one.
22On payroll unless otherwise noted.
95 Skilling Uganda - BTVET Strategic Plan 2012/3-2021/2

ANNEX 8: NOTES ON NATIONAL TRAINING FUNDS
TRAINING FUNDS (TFS)
OverviewA‘trainingfund’isadedicatedstockorflowoffinancingoutsidenormalgovernmentbudgetarychannelsforthepurpose of developing productive skills for work. The overall purpose of training funds is to raise the productivity, competitiveness and incomes of enterprises and individuals by providing them with needed skills. Many training fundsarefinancedbyleviesonenterprises,butmayalsobebasedonpubliccontributionsanddonorfinancing.
National training funds are an increasingly common vehicle for financing training. Training funds are a centralinstrumentforfinancingtraininginmanycountriesworld-wide.TFsprovideaninstitutionalframeworkforcollectingand allocating funding to training providers.
The functions may differ, but training funds often have the same objectives, coverage and modus operandi. Figure 1.1 shows the overall framework for training funds, depicting sources and uses of funds
Figure 1.1 above emphasizes the diversity of sources of financing – including public, private and donor sources – and the diversity of beneficiaries
of fund expenditures.
23This Annex is based mainly on Adrian Ziderman, 2003, Financing Vocational Training in Sub-Saharan Africa, World Bank and Richard Johanson, 2009, A Review of National Training Funds, World Bank.
96Skilling Uganda - BTVET Strategic Plan 2012/3-2021/2

A major question is why it is necessary to establish training funds separate from an account within government. Trainingfundspromiseseveraladvantagescomparedwithfinancingoftrainingthroughpublicministries.Theycan(a)contributetoresourcemobilizationfromenterprisesanddonors;(b)involveemployersandfostercollaborationamongstakeholdersandsocialpartners; (c) relate trainingsupplybetter tomarket requirementsthroughactiveparticipation by employers; (d) enhance quality through accreditation of training providers and insistence onperformance conditions; (e) induce efficiency in the use of resources through competitive bidding on trainingcontracts. Moreover, they can focus attention on neglected segments, such as small and informal enterprises, the unemployed and needs of women.
Generallynationaltrainingfundsserveto(a)unifyvarioussourcesoffinancingfortraining,(b)augmentthevolumeofresourcesfortraining,and(c)allocatethefundsinaccordancewithnationalpoliciesandpriorities. Trainingfunds may be single purpose, but most tend to have multiple objectives. These may include the following:
1. Unifyandcoordinatevarioussourcesofrevenue,i.e.poolingofincomefromdifferentsources;2. Mobilizeresourcesandincreaserevenueavailablefortraining;3. Buildpre-employmenttrainingsystemsandcapacities;4. Expandthevolumeofemployer-basedtrainingbyencouragingenterprisestoinvestmoreinworkertraining;5. Provideequalityofopportunityforaccesstotrainingservicesbydisadvantagedpopulations;6. Improvetherelevanceoftraining,e.g.allocatefundsaccordingtoemployerprioritiesandmarketneeds;7. Raisethequalityoftraining,e.g.throughaccreditationoftrainingprovidersandspecificationofperformance conditions;8. Usetrainingresourcesefficiently,e.g.lowertheunitcostsoftraining;9. Developcompetitivetrainingmarkets;and10. Foster involvement by employers and collaboration among stakeholders
Multiple objectives also make it extra important to specify objectives clearly and to evaluate systematically outputs, outcomes and impact in relation to the stated objectives.
Types of training fundsThreemaintypesoftrainingfundscanbedifferentiatedbypurpose:pre-employmenttrainingfundsthatfinancepre-employmenttraining,enterprisetrainingfundsthatfinancein-servicetrainingofworkers,andequitytrainingfundsthat target disadvantaged groups.
Table 1.1- Types of Training Funds
Type Main Purpose Financing Sources
1. Pre-employment Training Fund
Finance the expansion and delivery of initial training before employment
Payroll levy- revenue generating
2. Enterprise Training Fund
Provide incentives to increase in-service training of workers within enterprises
Payroll levy- incentive schemes
3. Equity-Oriented Training Fund
Increase opportunities for skills acquisition by disadvantaged groups not covered by enterprise schemes
Public subsidy, levy or donors
97 Skilling Uganda - BTVET Strategic Plan 2012/3-2021/2

Characteristics of training fundsTraining funds originated with earmarked training levies – developed in several Latin American countries in the 1940sand1950s.Aprotecteddepositorywasdevelopedfortheproceedsofthelevywhichaccountsforthegrowthofspecial trainingfunds.Early trainingfunds(e.g.Brazil) tendedtobesinglepurpose–aimedatfinancingpre-employment training. Others focused on expanding the volume of in-service training within enterprises. Typically trainingfundsexhibitedahighdegreeofcongruencebetweenthosewhofinancedthelevyandthosewhoreceivedthebenefits.Morerecently,trainingfundshavebeenincreasinglyregardedasageneralfundingpoolforawidevarietyofbeneficiaries.
Most training funds receive their income from training levies, alone or in concert with funding from other sources, mainly government budgets. In other cases, no training levy exists and the government and donors remain the principalfinanciers.
Figure 1.1, above, shows the major categories for the destination of funds, sometimes called “funding windows.” A fund may not cover all the purposes. Each of the categories aims at different clients and represents a response to different training needs and policy objectives.
• Corefundingforpre-employmenttrainingintraininginstitutionsconstitutestheprimaryandmosttraditionaluse. This pertains mainly to formal sector occupations and employment.
• Thesecondusecanbefortrainingofworkersinenterprises,throughapprenticeships,on-the-jobtrainingortraining off the premises. This constitutes the bulk of training provided through training levies.
• Third,trainingfundsmayofferservicestobuildtheskillsandproductivityofpeopleworkinginmicroenterprisesand the informal sector. Given the small scale of such operators, the way to reach them is often through intermediaries, such as informal sector associations. Training for the needs of micro-enterprises and the informal sector has generally been neglected in traditional training programs.
• Fourth,trainingfundsmayopenafundingwindowtotraintheunemployedordisadvantagedgroups.Suchtraining traditionally has been regarded as a government responsibility, but competitive contracting for such trainingisbecomingapreferredmechanismtofinanceit.
The effectiveness of a training fund depends to a large extent on the degree of autonomy, participation of stakeholders and composition of governing bodies. Governance varies considerably across training funds. Some TFs are part of broader, usually autonomous national training authorities, vested with a wide range of powers and responsibilities. Othersaremorenarrowlyfocusedonspecificsectorsoftheeconomy. Mosttrainingfundsarestatutory,quasi-autonomous bodies. They usually operate under the general umbrella of labor ministries and under the direction of a board with varying degrees of stakeholder representation. Board representation is typically tripartite (government, employersandunions),oftendividedequallyamongthethreeparties.
Historically, separate training funds were developed as part of training levy systems to protect the levy proceeds from government encroachment. But the main rationale for training funds is not protective. Rather, it is to evaluate and plan the needs of the training system as a whole, minimize political intervention in the allocation of funding, and ensurethatdisbursementscoincidewithmarketneeds.Thebenefitsofautonomyareunlikelywhereministerialcontrol remains strong and where governing boards are unrepresentative of stakeholders, and advisory only rather than managerial.
Training funds are typically allocated functions that transcend simple disbursements. They must monitor the effects of the expenditures and the training system. They may also provide related services, such as advising enterprises on how to develop and improve training capacity. Some training funds, such as SENAI, are moving beyond training togivetechnologicaladvicetofirms.Oftentrainingfundsareusedtofinancethewiderresponsibilitiesofnationaltrainingauthorities,suchasdevelopingtrainingpolicies,supervisingnationalskillstestingandcertification,andproviding information about training demand and supply. Training authorities often are responsible for accreditation
98Skilling Uganda - BTVET Strategic Plan 2012/3-2021/2

of training providers. More recently, national training authorities throughout the world have become involved in developingnationalqualificationframeworksthatestablishskillsstandardsandpromisegreaterportabilityofskills.Independence from close ministerial control and strong representation of employers on NTA management boards canprovideforstrongenterpriselinks,flexibilityandresponsivenessandforfosteringprivatetrainingmarkets.
KEY QUESTIONS AND GOOD PRACTICE IN TRAINING FUNDS
Someconcernstendtobecommonacrossallthreetypesoftrainingfunds.Othersarespecifictolevyorequityfunds.
Common concerns.1. Governance. In levy-based funds countries that allocate a leading role to employers tend to be successful
–e.g.Brazil,Singapore. However,balanced, tripartitegovernance (employers,unions, government) canalso be successful – as in Cote d’Ivoire. However, over-control by government can have deleterious results (e.g.,Togo).InHungaryemployersfeltthatgovernmentexertedexcessivecontroloverfundsandlimitedtheireffectiveness(Dar,et.al.,2003)Allowingemployerstohaveamajor--ifnotmajority--sayonfundallocationscan go a long way to gaining their support for the levy. This is done in Brazil, where the employers control the allocation of training levies, and also largely in Singapore. The matter of governance and oversight is equally important in equity training funds. An example of good practice was the CNFTP in Madagascar on which ten of the 12 members represented employers. Where funds aim at assisting workers in the informal sector, representation by informal sector associations is appropriate.
2. Allocations.Whodecidesontheallocationofmoneytobeneficiaries,andbasedonwhatcriteria?Whatrolewill employers and workers play in allocating the funds? Their participation is crucial for success. -- Advice: if possible, give employers a strong, even majority, voice in allocations of funds they provide to ensure relevance (MadagascarCNFTP).
3. Administrativeautonomy,capacityandefficiency.Administrativecapacityisessential.Mostsuccessfullevy-financedtrainingfundsinLatinAmericaandelsewherehaveahighdegreeofadministrativeindependence.Administrativeefficiencyisrequiredtoreduceredtapeandeaseaccesstofundsbydeservingfirms.TheSingapore SDF, French levy-exemption scheme and the Malaysian levy-reimbursement schemes exemplify welladministeredprograms (Gasskov1994 inDar,et.al.2003)Transparency indecision-making isalsoimportant, as practiced in the Singapore SDF and Chile’s FONCAP.
4. Competition.The levysystems inFranceandCoted’Ivoireactivelyencouragecompetitionamongtrainingprovidersanddevelopmentoftrainingmarkets.Chile’sFONCAP,anequityfund,financestrainingonlythroughcompetitive bids from among one thousand registered and pre-approved training providers. Competition for fundswasincorporatedintoseveraldonor-financedequitytrainingfunds.Thosethatfosteredcompetitionamongtrainingproviderstendedtohelpstimulatetrainingmarkets(PNG).InCoted’Ivoireprivatetrainingproviders garnered the lion’s share of the contracts awarded under competitive bidding (Annex 5.1).Competition also led to lower unit training costs in Cote d’Ivoire and PNG. However, in Cambodia unit costs for trainingweresetsolowtheyeffectivelyeliminatedprivateproviders.Withoutasufficientlywidespectrumoftrainingproviders,attemptsatcompetitiondidnotsucceed(i.e.bidsfailed)inBurkinaFaso,MaliandBenin.
5. Support for small enterprises. Both enterprise funds and equity funds attempted partly to assist small enterprises. Small enterprises operate under tight constraints that militate against participation in training, e.g. cash flow problems, inability to releaseworkers for training, lack of knowledge and expertise abouttraining.MalaysiaandSingapore(Box2.3)exemplifygoodpracticeintailoringservicestosmallenterprisesthrough vouchers (to relieve problems of cash flow), technical assistance to assess needs and designprograms,makingdeliver flexible to avoid time constraints felt by small enterprisesand simplificationof
99 Skilling Uganda - BTVET Strategic Plan 2012/3-2021/2

administrative procedures. Chile’s FONCAP uses intermediaries to organize and contract training for groups of small enterprises, something they would not have capacity to do by themselves. Several equity training fundswereabletoprovideskillstopeopleworkingintheinformalsector(Coted’Ivoire,Cambodia,PNG.)
6. Evaluation of outcomes and impact. Few training funds went beyond enumeration of outputs (e.g. persons trained) to analyze impact (e.g. employment, worker productivity) and impact (e.g. increased individualincomesorcompanyprofits).Twodonor-supportedequityfundsdidthis–Coted’IvoireandCambodia–butonly Cambodia compared the impact to training costs. Clearly, more and better evaluation is needed on the performance of training funds.
Key Considerations in Levy-financed Training Funds(SeeannexonLevyFinancing)
Key Considerations in Equity-Oriented Training FundsEquity-orientedtrainingfundscanbeaneffectivealternativetolevy-financedfundsinlow-incomecountrieswherelevyfinancingmaynotbefeasible. Coted’Ivoire,PNGandCambodiademonstratedthatdonor-financedtrainingfunds can provide income-generating and income-increasing skills to vulnerable groups in the informal sector. They alsostimulatedcompetitionamongprovidersandachievedefficienciesbyreducingunitcostsoftraining.Not as much evidence is available to provide examples of good practice for equity training funds. Still, equity-oriented training funds need to be designed to answer the following questions:
1. Targeting. The whole point of equity funds is to provide training services to disadvantaged groups. These groups are often dispersed in rural areas and not part of organized production. The cases in Cote d’Ivoire, PNG and Cambodia illustrate the importance of information campaigns and decentralized fund operations in reaching rural populations. In particular, employers in the informal sector often do not see the value of traininginimprovingprofits.Informationcampaignsareonemeanstochangethisview.Thefundsecretariatin Cote d’Ivoire had to be reorganized by adding a unit to deal with informal sector sub-projects.
2. Will funds be allocated to pre-determined quotas for funding “windows”, or open-ended in response to applications? How many windows can be serviced effectively? Will stakeholders be able to generate their own proposals? Proliferation of windows and sub-windows should be avoided– (South Africa’s NSF has nine mainfundingwindowsandninesub-windows–toomanytoadministereffectively;Chile’sFONCAPhadtwelveprogramsofwidelyvaryingsize.)
3. Willprivatetraining institutionsbeeligibletoreceivefunds–bothnon-profitandfor-profit?Ifso,onwhatterms?(Chileexemplifiesgoodpracticeinusingcompetitionamongpre-approvedprivatetrainingproviders.Coted’Ivoire,CambodiaandPNGalsofinancedtrainingthroughprivatetrainers).
4. Howwillqualitybeensuredinthedeliveryoftraining?Insomecases(e.g.ChileFONCAP)trainingprovidersare pre-screened and have to meet minimum criteria to be able to receive funds. Development of training packages also helps to ensure standard content that meet quality requirements (as was done in Cote d’Ivoire andPNG).However,fewfundsrequiretestingforcompetenciesacquiredasaresultofthetraining.
5. Howwill theuseof fundsbeaccountedforandaudited inspecificsub-projectsandcontracts? Thiscanbecome complex when numerous training providers win contracts. Proper accounting and auditing of sub-project funds must be designed before disbursements start. South Africa initially had trouble with venal practices in several of its SETAs.
6. Complementary inputs. In both Cote d’Ivoire and PNG lack of other necessary inputs (water, micro-credit andmarketing) limited the impact onbeneficiaries. Goodpracticewould ensure theavailability of such
100Skilling Uganda - BTVET Strategic Plan 2012/3-2021/2

complementary inputs.7. Sustainability-howwillthefundsbereplenished?Thisisacrucialquestionfordonor-financedfunds.Donors
canbuildthefinancingplatform,butthereneedstobeapermanentsourceoffinancingfortheFund,e.g.government revenues, payroll tax or annuity. The PNG case is instructive on establishing a trust fund for training
101 Skilling Uganda - BTVET Strategic Plan 2012/3-2021/2

ANNEX 9: TECHNICAL NOTES ON COSTS AND FINANCES
A-9.1: UnitCostsUsedforCostingA-9.2: ProjectedenrolmentgrowthinformalBTVETsectorandcostsforcapitationgrantsandrelateddelivery costsA-9.3: EstimatedgrowthinBTVETenrolmentandpercapitasubvention2011/12–2019/20underESSP-target Scenario(AlternativeScenario)A-9.4: DevelopmentofAnnualIntakeintoFormalBTVETA-9.5: TotalEnrolmentProjectionsA-9.6: SummarycostsofStrategicPlanin‘000000UGXand‘000USDbyObjectiveA-9.7: DetailedCostsbyStrategy
102Skilling Uganda - BTVET Strategic Plan 2012/3-2021/2

100
A-9.1: Unit Costs Used for the Costing
Exchange rate USD ‘000 000 UGX 1 0,0023
Cost Item
Unit Description
Unit Cost in USD
Unit Cost in ‘000 000 UGX
DEVELOPMENT Concepts, consultation and CB Survey/study one months study 50 000 115,00 TA national person month 10 000 23,00 TA international person month 25 000 57,50 Stakeholder WS, average person day 0,15 Training workshop 1 person week 350 0,81 Study tour 1 person week 9,50 Institutional Strengthening Construction/equipping technical institute
institute lump sum 2 500 000 5 750,00
Construction/equipping commercial institute
institute lump sum 2 000 000 4 600,00
Comprehensive institutional strengthening*
institute over 3 years 5 000 000 11 500,00
Curriculum development lumpsum over phase 5 000 000 11 500,00 Master trainers training overseas master trainer 25 000 57,50 Instructors upgrading instructor/programme 2,00 Other WAN establishment station 200 000 460,00 Website development website 10 000 23,00 ICT computer 1 500 3,45 RECURRENT Increase in staff establishment instructors
position/year
Increase in staff establishment professionals
position/year 8,50
Teachers salaries public system year 5,00 Unit cost formal training trainee/year see extra table linear increasing Unit cost non-formal training trainee/3-month 0,35 Unit cost BTVET instructors training trainee/year increasing from 0,84 to 3,0 Assessment DIT modular trainee/module (net) 0,05 Assessment DIT level trainee (net) 0,09 Assessment DIT instructor/manager assessment 0,65 SPECIFIC COSTS DEVELOPMENT Matching grants for BTVET institutions lumpsum 0,00 Investment incentives for private providers lumpsum/year 500 000 1 150,00 System development levy collection lumpsum 200 000 460,00
A-9.1: Unit Costs Used for the Costing
103 Skilling Uganda - BTVET Strategic Plan 2012/3-2021/2

101
Exchange rate USD ‘000 000 UGX 1 0,0023
Cost Item
Unit Description
Unit Cost in USD
Unit Cost in ‘000 000 UGX
System development SDA lumpsum 200 000 460,00 SDA Initial investment cost lumpsum 0,00 Management system SDF lumpsum 200 000 460,00 BTVET Investment Fond lumpsum PWD compatible equipment institution 10,00 ATP development ATP 36,00 Capacity building assessor assessor 0,65 Capacity building facilitator facilitator 4,50 Accreditation of assessment centers per centre 0,80 DIT staff development anual lump sum Software LMIS lump sum 0,00 Software MIS lump sum 40 000 92,00 Software/system accreditation lump sum 100 000 230,00 System development IQM lump sum 100 000 230,00 DIT staff development lump sum 65,00 DIT Test Item Bank development lumpsum 100 000 230,00 Support to local market assessment per institution 1 000 2,30 Office equipment for RSC per office 5 000 11,50 RECURRENT
Techncial Sector Committees annual lump sum/committee 20,00
ITC annual lump sum 150,00 DIT institutional overhead costs lump sum BTVET Department institutional overheads lump sum Running cost levy collection months Running cost SDF months Recurrent cost SDA Additional staff professional RSC person year 8,50 Additional staff assistant RSC person year 4,80 Additional staff driver RSC person year 4,80 Operational expenses RSC year/office 18 000 41,40 Network meetings year/office 10 000 23,00 Footnotes: * incl. Construction, equipment, material, staff training overseas, intl. TA over three years
104Skilling Uganda - BTVET Strategic Plan 2012/3-2021/2

10
2
A-9.
2: P
roje
cted
enr
olm
ent g
row
th in
form
al B
TVET
sec
tor a
nd c
osts
for c
apita
tion
gran
ts a
nd re
late
d de
liver
y co
sts
20
08
2009
20
10
2011
20
12
2013
20
14
2015
20
16
2017
20
18
2019
20
20
Enro
lmen
t and
cap
itatio
n gr
ant c
osts
For
mal
BTV
ET
Estim
ated
BTV
ET E
nrol
men
t (fo
rmal
sys
tem
) (lin
ear e
nrol
men
t gro
wth
of 1
0% a
ssum
ed)
Post
P.7
10
825
11
908
13
098
14
408
15
849
17
434
19
177
21
095
23
204
25
525
28
077
30
885
33
973
Po
st S
.4
10 7
77
11 8
55
13 0
40
14 3
44
15 7
79
17 3
56
19 0
92
21 0
01
23 1
01
25 4
12
27 9
53
30 7
48
33 8
23
Post
S.6
12
832
14
115
15
527
17
079
18
787
20
666
22
733
25
006
27
507
30
257
33
283
36
611
40
272
Av
erag
e en
rolm
ent p
er fi
scal
yea
r (fo
rmal
BTV
ET)
2011
/12
2012
/13
2013
/14
2014
/15
2015
/16
2016
/17
2017
/18
2018
/19
2019
/20
Po
st P
.7
15
128
16
641
18
305
20
136
22
150
24
365
26
801
29
481
32
429
Post
S.4
15 0
61
16 5
68
18 2
24
20 0
47
22 0
51
24 2
57
26 6
82
29 3
50
32 2
85
Po
st S
.6
17
933
19
727
21
699
23
869
26
256
28
882
31
770
34
947
38
442
Tota
l enr
olm
ent
48
123
52
936
58
229
64
052
70
457
77
503
85
253
93
779
10
3 15
6
Capi
tatio
n gr
ant (
linea
r inc
reas
ing
from
201
0 le
vel t
o co
st-re
cove
ry le
vel)
20
10/2
011
Po
st P
.7
600,
0 70
1,6
803,
2 90
4,7
1 00
6,3
1 10
7,9
1 20
9,5
1 31
1,0
1 41
2,6
1 51
4,2
Po
st S
.4
432,
0 62
8,4
824,
8 1
021,
2 1
217,
6 1
414,
0 1
610,
4 1
806,
8 2
003,
2 2
199,
6
Post
S.6
43
2,0
740,
2 1
048,
4 1
356,
6 1
664,
7 1
972,
9 2
281,
1 2
589,
3 2
897,
5 3
205,
7
Tota
l cap
itatio
n gr
ant (
40%
of e
nrol
men
t), ‘0
00 0
00 U
GX
Po
st P
.7
4
245,
5 5
346,
2 6
624,
6 8
105,
2 9
815,
7 11
787
,3
14 0
54,9
16
658
,3
19 6
41,7
Post
S.4
3 78
5,8
5 46
6,0
7 44
4,3
9 76
3,6
12 4
72,3
15
625
,1
19 2
83,7
23
517
,9
28 4
06,0
Post
S.6
5 30
9,6
8 27
2,4
11 7
74,6
15
894
,5
20 7
20,7
26
353
,2
32 9
05,0
40
503
,5
49 2
92,8
Tota
l spe
ndin
g fo
r cap
itatio
n gr
ants
/bur
sarie
s
13
341
,0
19 0
84,6
25
843
,5
33 7
63,3
43
008
,7
53 7
65,5
66
243
,6
80 6
79,7
97
340
,5
En
rolm
ent i
n no
n-fo
rmal
and
priv
ate
BTVE
T Pr
ivat
e pr
ovis
ion
As
sum
ed e
nrol
men
t gro
wth
10%
Base
line
2009
(est
imat
ed)
11
0 00
0 12
1 00
0, 0 13
3 10
0, 0 14
6 41
0, 0 16
1 05
1, 0 17
7 15
6, 1 19
4 87
1, 7 21
4 35
8, 9 23
5 79
4, 8 25
9 37
4, 2 28
5 31
1, 7
Non
-form
al B
TVET
(spo
nsor
ed
20 0
00
25 0
00
30 0
00
35 0
00
40 0
00
45 0
00
50 0
00
55 0
00
60 0
00
60 0
00
A-9.
2: P
roje
cted
enr
olm
ent g
row
th in
form
al B
TVET
sec
tor a
nd c
osts
for c
apita
tion
gran
ts a
nd re
late
d de
liver
y co
sts
105 Skilling Uganda - BTVET Strategic Plan 2012/3-2021/2

10
3
thro
ugh
publ
ic s
chol
arsh
ips)
As
sess
men
t cos
ts
Asse
ssm
ents
in fo
rmal
trai
ning
N
umbe
r of l
evel
ass
essm
ent (
1 tim
es/y
ear)
48 1
23
52 9
36
58 2
29
64 0
52
70 4
57
77 5
03
85 2
53
93 7
79
103
156
As
sess
men
t fro
m p
rivat
e an
d no
n-fo
rmal
BTV
ET
NFT
P m
odul
ar a
sses
smen
t
25 0
00
30 0
00
35 0
00
40 0
00
45 0
00
50 0
00
55 0
00
60 0
00
60 0
00
le
vel a
sses
smen
t: 40
% o
f priv
ate
enro
lmen
t
53
240
58
564
64
420
70
862
77
949
85
744
94
318
10
3 75
0 11
4 12
5
mod
ular
ass
essm
ent.
60%
of p
rivat
e en
rolm
ent
79 8
60
87 8
46
96 6
31
106
294
116
923
128
615
141
477
155
625
171
187
To
tal a
sses
smen
t to
be c
ondu
cted
M
odul
ar
10
4 86
0 11
7 84
6 13
1 63
1 14
6 29
4 16
1 92
3 17
8 61
5 19
6 47
7 21
5 62
5 23
1 18
7
leve
l-bas
ed
10
1 36
3 11
1 50
0 12
2 65
0 13
4 91
4 14
8 40
6 16
3 24
7 17
9 57
1 19
7 52
8 21
7 28
1
Cost
s
Mod
ular
Un
it co
st
0,05
5 24
3 5
892
6 58
2 7
315
8 09
6 8
931
9 82
4 10
781
11
559
leve
l-bas
ed
Unit
cost
0,
09
9
123
10 0
35
11 0
38
12 1
42
13 3
57
14 6
92
16 1
61
17 7
78
19 5
55
To
tal a
sses
smen
t cos
ts
14
366
15
927
17
620
19
457
21
453
23
623
25
985
28
559
31
115
Inst
ruct
ors
Dev
elop
men
t In
stru
ctor
s ne
eded
and
sal
ary
cost
s
Enro
lmen
t in
publ
ic in
stitu
tions
34
434
(200
9)
48 1
23
52 9
36
58 2
29
64 0
52
70 4
57
77 5
03
85 2
53
93 7
79
103
156
Te
ache
r nee
ded
in p
ublic
in
stitu
tions
Ra
te1/
15
3 20
8 3
529
3 88
2 4
270
4 69
7 5
167
5 68
4 6
252
6 87
7
Aver
age
sala
ry p
er te
ache
r (ye
ar)
5000
000
Publ
ic te
ache
rs p
ayro
ll ('0
00 0
00 U
GX)
16
041
17
645
19
410
21
351
23
486
25
834
28
418
31
260
34
385
Inst
ruct
ors
train
ing
Curr
ent c
apac
ity B
TVET
inst
ruct
ors
train
ing
49
5
10
% a
nnua
l inc
reas
e in
cap
aciti
es
545
599
659
725
797
877
965
1 06
1 1
167
1 28
4
20
10/1
1
Ca
pita
tion
gran
ts fo
r ins
truct
ors
train
ees
0,
84
1,08
1,
32
1,56
1,
8 2,
04
2,28
2,
52
2,76
3
To
tal g
rant
s to
inst
ruct
ors
stud
ents
(100
%)
647
870
1 13
1 1
435
1 78
9 2
199
2 67
4 3
221
3 85
2
106Skilling Uganda - BTVET Strategic Plan 2012/3-2021/2

Technical Notes on Enrolment Projections and Costs
10%annualincreaseofenrolmentinformalBTVETwasassumed.BaselinewereenrolmentfiguresprovidedbyEMISfortheyears2008and2009.
A linear increase of capitation grants was assumed, starting with actual capitation grant volumes in 2010/11 reaching cost-recovery levels in 2020. Cost recovery levels were based on estimates of the BTVET Department in MoES for different levels.
Thecostcalculationsforthecapitationgranttotalsassumethat40%oftheentirelearnerpopulationisreceivingacapitation grant.
107 Skilling Uganda - BTVET Strategic Plan 2012/3-2021/2

10
5
A-9
.3: E
stim
ated
gro
wth
in B
TVET
enr
olm
ent a
nd p
er c
apita
subv
entio
n 20
11/1
2 –
2019
/20
unde
r E
SSP-
targ
et S
cena
rio
(Alte
rnat
ive
Scen
ario
)
Expe
cted
enr
olm
ent i
n BT
VET
/ ES
SP ta
rget
s 20
11
2012
20
13
2014
20
15
2016
20
17
2018
20
19
2020
Po
st P
.7
Base
line
2009
10
825
Post
O'le
vel (
inst
itute
s)
41
000
46
900
53
200
55
200
54
700
52
600
52
800
55
400
58
600
61
500
Base
line
2009
10
777
Po
st A
'leve
l (co
llege
s)
14
8 00
0 15
4 40
0 16
0 30
0 18
2 20
0 21
8 10
0 25
4 90
0 29
7 00
0 31
2 60
0 29
5 70
0 28
6 30
0 Ba
selin
e 20
08
12 8
32
Terti
ary
enro
lmen
t est
imat
es
10
5 00
0 12
1 20
0 13
6 00
0 14
8 00
0 16
0 10
0 18
3 60
0 21
3 80
0 24
8 10
0 28
9 00
0 30
9 10
0 BT
VET
30%
of t
otal
terti
ary
31
500
36
360
40
800
44
400
48
030
55
080
64
140
74
430
86
700
92
730
Es
timat
ed e
nrol
men
t gro
wth
BTV
ET S
trate
gic
Plan
and
cap
itatio
n gr
ants
(Lin
ear g
row
th to
reac
h ES
SP ta
rget
s in
202
0)
Estim
ated
BTV
ET E
nrol
men
t
Post
P.7
15 8
93
20 9
60
26 0
28
31 0
95
36 1
63
41 2
30
46 2
98
51 3
65
56 4
33
61 5
00
Post
S.4
38 3
29
65 8
82
93 4
34
120
986
148
539
176
091
203
643
231
195
258
748
286
300
Post
S.6
20 8
22
28 8
12
36 8
01
44 7
91
52 7
81
60 7
71
68 7
61
76 7
50
84 7
40
92 7
30
Aver
age
enro
lmen
t per
fisc
al y
ear
2011
/12
2012
/13
2013
/14
2014
/15
2015
/16
2016
/17
2017
/18
2018
/19
2019
/20
Po
st P
.7
18
426
23
494
28
561
33
629
38
696
43
764
48
831
53
899
58
966
Post
S.4
52 1
05
79 6
58
107
210
134
762
162
315
189
867
217
419
244
972
272
524
Po
st S
.6
24
817
32
807
40
796
48
786
56
776
64
766
72
756
80
745
88
735
Tota
l enr
olm
ent
95
348
13
5 95
8 17
6 56
8 21
7 17
7 25
7 78
7 29
8 39
6 33
9 00
6 37
9 61
6 42
0 22
5
Capi
tatio
n gr
ant
2010
/201
1
Po
st P
.7
600,
0 70
1,6
803,
2 90
4,7
1 00
6,3
1 10
7,9
1 20
9,5
1 31
1,0
1 41
2,6
1 51
4,2
Po
st S
.4
432,
0 62
8,4
824,
8 1
021,
2 1
217,
6 1
414,
0 1
610,
4 1
806,
8 2
003,
2 2
199,
6
Post
S.6
43
2,0
740,
2 1
048,
4 1
356,
6 1
664,
7 1
972,
9 2
281,
1 2
589,
3 2
897,
5 3
205,
7
Tota
l cap
itatio
n gr
ant (
40%
of
enro
lmen
t) in
'000
000
Po
st P
.7
5
171,
0 7
547,
7 10
336
,1
13 5
36,4
17
148
,5
21 1
72,3
25
608
,0
30 4
55,4
35
714
,7
Po
st S
.4
13
097
,2
26 2
80,7
43
793
,2
65 6
34,7
91
805
,2
122
304,
7 15
7 13
3,2
196
290,
8 23
9 77
7,4
Po
st S
.6
7
347,
6 13
757
,4
22 1
37,1
32
486
,6
44 8
06,0
59
095
,3
75 3
54,5
93
583
,6
113
782,
5
A-9.
3: E
stim
ated
gro
wth
in B
TVET
enr
olm
ent a
nd p
er c
apita
sub
vent
ion
2011
/12
– 20
19/2
0 un
der E
SSP-
targ
et S
cena
rio (A
ltern
ativ
e Sc
enar
io)
108Skilling Uganda - BTVET Strategic Plan 2012/3-2021/2

Notes on enrolment estimates and cost estimates for capitation grants and other recurrent costEnrolmenttargetsforPost-P.7andpostS.4BTVETarederivedfromthe2010revisedESSP.TheESSPtargetsfor2020 was taken as the given 2020 target for the BTVET sub-sector, and a linear enrolment growth assumed to reachthetarget.BaselinewereavailableaggregateBTVETenrolmentfiguresforthetwolevelsfortheyears2009indicatedbyEMIS(seeTP5).
The ESSP does not indicate BTVET targets at tertiary level. The assumption employed here was that by 2020 the shareofBTVEToftotaltertiaryenrolmentis30%.Wethereforeset30%oftheestimatedtotaltertiaryenrolmentin2020 as the target BTVET enrolment, and assumed that there would be a linear growth from the current enrolment of around 13,000 to reach the target in 2020.
The cost calculations for the capitation grant assume that 40% of the entire learner population is receiving acapitation grant. The capitation grant amount is assumed to increase linear from the current level to the cost-recovery level calculated in 2010 by the BTVET Department in the MoES.
Note that this scenario was not used to do the Strategic Plan Costing
109
A-9.4: Development of Annual Intake into Formal BTVET
2011/12 2012/13 2013/14 2014/15 2015/16 2016/17 2017/18 2018/19 2019/20 Estimated enrolment development Enrolment post P.7 15 128 16 641 18 305 20 136 22 150 24 365 26 801 29 481 32 429 Enrolment post S.4 15 061 16 568 18 224 20 047 22 051 24 257 26 682 29 350 32 285 Enrolment post S.6 17 933 19 727 21 699 23 869 26 256 28 882 31 770 34 947 38 442 Total enrolment 67 373 74 110 81 521 89 673 98 640 108 504 119 355 131 290 144 419 Intake Development Share of learners under new programme structure (in%) P.7: Change from currently 3 years to 1 year 0 25 50 75 100 100 100 100 100 S.4: Change from 3 to 2 years 0 25 50 75 100 100 100 100 100 S.6: Change from 4 to 3 years (S.6) 0 25 50 75 100 100 100 100 100 New intake projections Post P.7 5 043 8 321 12 204 16 780 22 150 24 365 26 801 29 481 32 429 Post S.4 5 020 6 213 7 593 9 188 11 026 12 128 13 341 14 675 16 143 Post S.6 4 483 5 343 6 329 7 459 8 752 9 627 10 590 11 649 12 814 Total new intake 14 547 19 876 26 126 33 427 41 927 46 120 50 732 55 805 61 386
109 Skilling Uganda - BTVET Strategic Plan 2012/3-2021/2

11
0
A-9.
5: T
otal
Enr
olm
ent P
roje
ctio
ns
20
11/1
2 20
12/1
3 20
13/1
4 20
14/1
5 20
15/1
6 20
16/1
7 20
17/1
8 20
18/1
9 20
19/2
0 Fo
rmal
(pub
lic) B
TVET
48
123
52
936
58
229
64
052
70
457
77
503
85
253
93
779
10
3 15
6 N
on-fo
rmal
pro
gram
me
25 0
00
30 0
00
35 0
00
40 0
00
45 0
00
50 0
00
55 0
00
60 0
00
60 0
00
Priv
ate
prov
isio
n 13
3 10
0 14
6 41
0 16
1 05
1 17
7 15
6 19
4 87
2 21
4 35
9 23
5 79
5 25
9 37
4 28
5 31
2
To
tal e
nrol
men
t 20
6 22
3 22
9 34
6 25
4 28
0 28
1 20
8 31
0 32
9 34
1 86
2 37
6 04
8 41
3 15
3 44
8 46
8
110Skilling Uganda - BTVET Strategic Plan 2012/3-2021/2

11
1
A-9.
6: S
umm
ary
Cost
s of
Stra
tegi
c Pl
an24
in ‘0
00 0
00 U
GX
and
‘000
UD
S by
Obj
ectiv
es
Ph
ase
I Ph
ase
II
20
11-1
2
2012
-13
20
13-1
4
2014
-15
20
15-2
0
UG
X ( '0
0000
0)
USD
('0
00)
UGX
( '000
000)
US
D
('000
) UG
X ( '0
0000
0)
USD
('0
00)
UGX
( '000
000)
US
D
('000
) UG
X ( '0
0000
0)
USD
('00
0)
BTVE
T St
rate
gic
Plan
To
tal R
ecur
rent
58
558
25
460
72
202
31
392
85
882
37
340
10
0 31
0 43
613
78
1 35
9 33
9 72
1 To
tal D
evel
opm
ent
115
456
50 1
98
97 8
13
42 5
27
95 3
51
41 4
57
77 0
82
33 5
14
516
784
224
689
Gra
nd T
otal
17
4 01
4 75
658
17
0 01
5 73
919
18
1 23
2 78
797
17
7 39
2 77
127
1
298
143
564
410
Cont
rol
174
014
75 6
58
170
015
73 9
19
181
232
78 7
97
177
392
77 1
27
1 29
7 49
3 56
4 12
7
BTVE
T St
rate
gic
Plan
Re
curr
ent:
Obje
ctiv
e 1:
Rel
evan
ce
16 7
77
7 29
5 20
573
8
945
23 3
34
10 1
45
25 4
34
11 0
58
160
226
69 6
64
Obje
ctiv
e 2:
Qua
lity
5 79
9 2
521
6 68
3 2
906
7 49
3 3
258
8 40
9 3
656
58 7
00
25 5
22
Obje
ctiv
e 3:
Equ
itabl
e Ac
cess
35
922
15
618
44
886
19
515
54
995
23
911
66
408
28
873
56
0 79
3 24
3 82
3 Ob
ject
ive
4: M
anag
emen
t 60
26
60
26
60
26
60
26
1
640
713
Obje
ctiv
e 5:
Fin
anci
ng
Tota
l Rec
urre
nt
58 5
58
25 4
60
72 2
02
31 3
92
85 8
82
37 3
40
100
310
43 6
13
781
359
339
721
D
evel
opm
ent:
Ob
ject
ive
1: R
elev
ance
49
657
21
590
22
743
9
888
16 7
87
7 29
9 24
362
10
592
52
411
22
787
Ob
ject
ive
2: Q
ualit
y 40
348
17
543
43
725
19
011
46
861
20
374
47
151
20
501
44
9 88
4 19
5 60
2 Ob
ject
ive
3: E
quita
ble
Acce
ss
24 4
91
10 6
48
30 4
43
13 2
36
30 3
29
13 1
87
1 98
5 86
3 6
955
3 02
4 Ob
ject
ive
4: M
anag
emen
t 40
6 17
7 67
7 29
5 91
3 39
7 2
943
1 28
0 5
660
2 46
1 Ob
ject
ive
5: F
inan
cing
55
4 24
1 22
5 98
46
0 20
0 64
1 27
9 1
875
815
Tota
l Dev
elop
men
t 11
5 45
6 50
198
97
813
42
527
95
351
41
457
77
082
33
514
51
6 78
4 22
4 68
9
Gra
nd T
otal
17
4 01
4 75
658
17
0 01
5 73
919
18
1 23
2 78
797
17
7 39
2 77
127
1
298
143
564
410
24N
ote:
the
Gov
ernm
ent s
ubse
quen
tly d
ecid
ed th
at th
e Pl
an p
erio
d sh
ould
be
2012
/3 to
202
1/22
. Th
e da
tes
in th
e an
nexe
s ha
ve b
een
conv
erte
d ye
t to
this
new
sch
edul
e.
111 Skilling Uganda - BTVET Strategic Plan 2012/3-2021/2

11
2
Ph
ase
I Ph
ase
II
20
11-1
2
2012
-13
20
13-1
4
2014
-15
20
15-2
0
UG
X ( '0
0000
0)
USD
('0
00)
UGX
( '000
000)
US
D
('000
) UG
X ( '0
0000
0)
USD
('0
00)
UGX
( '000
000)
US
D
('000
) UG
X ( '0
0000
0)
USD
('00
0)
Obje
ctiv
e 1:
Mak
e BT
VET
mor
e re
leva
nt
Stra
tegy
1.1
: Stre
ngth
en ro
le o
f em
ploy
ers
79
34
137
59
67
29
92
40
535
233
Sub-
Stra
tegy
1.1
.1: P
lann
ing
and
deci
sion
-mak
ing
26
11
26
11
17
7 17
7
85
37
Sub-
Stra
tegy
1.1
.2: E
mpl
oyer
-bas
ed tr
aini
ng
54
23
111
48
50
22
75
33
450
196
Stra
tegy
1.2
: Exp
and/
deve
lop
UVQF
19
625
8
533
22 2
55
9 67
6 23
333
10
145
25
064
10
897
15
7 61
0 68
526
Su
b-St
rate
gy 1
.2.1
: Cla
rify
UVQF
fram
ewor
k/D
IT
stre
ngth
enin
g 2
144
932
1 53
5 66
7 1
082
470
815
354
4 07
3 1
771
Sub-
Stra
tegy
1.2
.2: A
TP d
evel
opm
ent a
nd a
sses
smen
t 17
482
7
601
20 7
20
9 00
9 22
251
9
674
24 2
49
10 5
43
153
537
66 7
55
Stra
tegy
1.3
: Fle
xibl
e an
d de
man
d-dr
iven
trai
ning
3
560
1 54
8 3
666
1 59
4 3
560
1 54
8 3
545
1 54
1 13
007
5
655
Stra
tegy
1.4
: Boo
st s
uppl
y in
crit
ical
occ
upat
ions
84
37
69
30
84
37
Stra
tegy
1.5
: Agr
icul
ture
trai
ning
42
473
18
467
15
853
6
893
9 01
4 3
919
17 2
22
7 48
8 24
047
10
455
Sub-
Stra
tegy
1.5
.1: T
rain
ing
faci
litie
s 42
223
18
358
15
167
6
594
7 72
3 3
358
15 9
31
6 92
7 17
534
7
623
Sub-
Stra
tegy
1.5
.2: S
treng
then
link
ages
22
6 98
83
1 36
1 83
1 36
1 4
155
1 80
7 Su
b-St
rate
gy 1
.5.3
: CBE
T in
agr
icul
ture
25
0 10
9 46
0 20
0 46
0 20
0 46
0 20
0 2
358
1 02
5 St
rate
gy 1
.6: S
kills
for p
rodu
ctiv
ity in
info
rmal
sec
tor
383
167
744
324
3 55
1 1
544
3 32
1 1
444
15 6
05
6 78
5 Su
b-St
rate
gy 1
.6.1
: Non
-form
al tr
aini
ng in
tegr
ated
into
BT
VET
syst
em
Sub-
Stra
tegy
1.6
.2: I
nfor
mat
ion,
coo
pera
tion,
coo
rdin
atio
n (R
SC)
119
52
104
45
890
387
660
287
3 30
0 1
435
Sub-
Stra
tegy
1.6
.3: H
uman
and
inst
itutio
nal c
apac
ities
26
5 11
5 44
2 19
2 36
1 15
7 36
1 15
7 80
5 35
0 Su
b-St
rate
gy 1
.6.4
: Inn
ovat
ion
Chal
leng
e Fu
nd
199
87
2 30
0 1
000
2 30
0 1
000
11 5
00
5 00
0 St
rate
gy 1
.7: L
MIS
23
0 10
0 59
3 25
8 51
2 22
3 55
1 24
0 1
834
797
To
tal O
bjec
tive
66 4
34
28 8
84
43 3
16
18 8
33
40 1
21
17 4
44
49 7
95
21 6
50
212
637
92 4
51
Ob
ject
ive
2: In
crea
se q
ualit
y
St
rate
gy 2
.1: S
treng
then
inst
itutio
nal c
apac
ities
30
483
13
253
33
070
14
378
35
823
15
575
35
823
15
575
41
6 87
5 18
1 25
0 St
rate
gy 2
.2: B
TVET
inst
ruct
ors/
tuto
rs
15 6
64
6 81
1 17
052
7
414
17 5
82
7 64
4 18
490
8
039
89 9
76
39 1
20
112Skilling Uganda - BTVET Strategic Plan 2012/3-2021/2

11
3
Ph
ase
I Ph
ase
II
20
11-1
2
2012
-13
20
13-1
4
2014
-15
20
15-2
0
UG
X ( '0
0000
0)
USD
('0
00)
UGX
( '000
000)
US
D
('000
) UG
X ( '0
0000
0)
USD
('0
00)
UGX
( '000
000)
US
D
('000
) UG
X ( '0
0000
0)
USD
('00
0)
Sub-
Stra
tegy
2.2
.1: I
nstit
utio
nal c
apac
ities
for
inst
ruct
ors/
tuto
rs tr
aini
ng
8 72
9 3
795
8 72
9 3
795
8 72
9 3
795
8 72
9 3
795
29 2
68
12 7
25
Sub-
Stra
tegy
2.2
.2: I
ncre
ase
avai
labi
lity
of B
TVET
in
stru
ctor
s/tu
tors
2
009
874
2 93
4 1
276
3 23
8 1
408
3 58
9 1
560
19 3
91
8 43
1 Su
b-St
rate
gy 2
.2.3
: Der
egul
ate
recr
uitm
ent a
nd
depl
oym
ent
4 92
7 2
142
5 39
0 2
343
5 61
6 2
442
6 17
3 2
684
41 3
17
17 9
64
Stra
tegy
2.3
: Qua
lity
assu
ranc
e
28
7 12
5 95
0 41
3 1
248
543
1 73
3 75
3 Su
b-St
rate
gy 2
.3.1
: Acc
redi
tatio
n sy
stem
28
7 12
5 36
8 16
0 46
9 20
4 15
8 68
Su
b-St
rate
gy 2
.3.2
: IQM
58
2 25
3 78
0 33
9 1
576
685
To
tal O
bjec
tive
2 46
147
20
064
50
408
21
917
54
354
23
632
55
560
24
157
50
8 58
4 22
1 12
3
Obje
ctiv
e 3:
Incr
ease
equ
itabl
e ac
cess
St
rate
gy 3
.1: A
cces
s to
form
al a
nd n
on-fo
rmal
BTV
ET
22 9
66
9 98
5 30
635
13
319
39
319
17
095
49
163
21
375
44
4 98
8 19
3 47
3 St
rate
gy 3
.2: E
xpan
d pr
ivat
e pr
ovis
ion
1 49
1 64
8 1
163
505
1 15
0 50
0 1
150
500
5 76
5 2
507
Stra
tegy
3.3
: Sup
port/
Expa
nsio
n pu
blic
BTV
ET s
uppl
y 35
956
15
633
43
001
18
696
44
426
19
316
17
244
7
497
115
805
50 3
50
Stra
tegy
3.4
: Aw
aren
ess
crea
tion
46
20
255
111
255
111
683
297
Stra
tegy
3.5
: Equ
al p
artic
ipat
ion
of d
isad
vant
aged
48
4 21
0 17
4 76
58
0 25
2 50
8 22
1 Su
b-St
rate
gy 3
.5.1
: Dis
adva
ntag
es g
roup
s
19
9 87
15
7
Sub-
Stra
tegy
3.5
.2: F
emal
e pa
rtici
patio
n
13
4 58
65
28
65
28
Su
b-St
rate
gy 3
.5.3
: PW
D
151
66
109
47
500
217
508
221
To
tal O
bjec
tive
3
60 4
13
26 2
67
75 3
28
32 7
51
85 3
24
37 0
97
68 3
93
29 7
36
567
748
246
847
Ob
ject
ive
4: In
crea
se m
anag
emen
t effe
ctiv
enes
s
St
rate
gy 4
.1: S
kills
Dev
elop
men
t Bod
y 17
6 77
19
9 87
37
5 16
3 28
0 12
2 2
463
1 07
1 St
rate
gy 4
.2: D
evol
ve a
utho
rity
/ in
crea
se a
ccou
ntab
ility
24
8 10
8 23
7 10
3 13
3 58
89
7 39
0 Su
b-St
rate
gy 4
.2.1
: dev
olve
aut
horit
y
72
32
11
0 48
95
42
87
4 38
0 Su
b-St
rate
gy 4
.2.2
: inc
reas
e ac
coun
tabi
lity
176
77
127
55
38
17
23
10
113 Skilling Uganda - BTVET Strategic Plan 2012/3-2021/2

11
4
Ph
ase
I Ph
ase
II
20
11-1
2
2012
-13
20
13-1
4
2014
-15
20
15-2
0
UG
X ( '0
0000
0)
USD
('0
00)
UGX
( '000
000)
US
D
('000
) UG
X ( '0
0000
0)
USD
('0
00)
UGX
( '000
000)
US
D
('000
) UG
X ( '0
0000
0)
USD
('00
0)
Stra
tegy
4.3
: MIS
/ M
&E
290
126
290
126
362
157
2 59
0 1
126
3 29
0 1
430
Tota
l Obj
ectiv
e 4
466
203
737
321
973
423
3 00
3 1
306
6 65
0 2
891
Ob
ject
ive
5: In
tern
al e
ffici
ency
and
fina
ncin
g
Stra
tegy
5.1
: tra
nsfe
r mec
hani
sms
183
80
88
38
Stra
tegy
5.2
: inc
reas
e re
sour
ces
353
153
136
59
181
79
425
185
1 33
2 57
9
Sub-
Stra
tegy
5.2
.1: I
GA
39
17
142
62
47
21
497
216
Sub-
Stra
tegy
5.2
.2: L
evy
353
153
97
42
39
17
378
164
835
363
Stra
tegy
5.3
: SD
F 20
2 88
89
39
96
42
12
9 56
54
3 23
6 To
tal O
bjec
tive
5 55
4 24
1 22
5 98
46
0 20
0 64
1 27
9 1
875
815
Gra
nd T
otal
17
4 01
4 75
658
17
0 01
5 73
919
18
1 23
2 78
797
17
7 39
2 77
127
1
297
493
564
127
Re
curr
ent o
nly
Ob
ject
ive
1: M
ake
BTVE
T m
ore
rele
vant
St
rate
gy 1
.1: S
treng
then
role
of e
mpl
oyer
s 17
7
17
7 17
7
17
7 85
37
Su
b-St
rate
gy 1
.1.1
: Pla
nnin
g an
d de
cisi
on-m
akin
g 17
7
17
7 17
7
17
7 85
37
Su
b-St
rate
gy 1
.1.2
: Em
ploy
er-b
ased
trai
ning
Stra
tegy
1.2
: Exp
and/
deve
lop
UVQF
16
487
7
168
20 0
11
8 70
0 21
760
9
461
23 8
60
10 3
74
152
047
66 1
07
Sub-
Stra
tegy
1.2
.1: C
larif
y UV
QF fr
amew
ork/
DIT
st
reng
then
ing
558
242
657
286
699
304
723
314
4 07
3 1
771
Sub-
Stra
tegy
1.2
.2: A
TP d
evel
opm
ent a
nd a
sses
smen
t 15
930
6
926
19 3
54
8 41
5 21
061
9
157
23 1
36
10 0
59
147
974
64 3
37
Stra
tegy
1.3
: Fle
xibl
e an
d de
man
d-dr
iven
trai
ning
St
rate
gy 1
.4: B
oost
sup
ply
in c
ritic
al o
ccup
atio
ns
Stra
tegy
1.5
: Agr
icul
ture
trai
ning
25
0 10
9 47
6 20
7 80
5 35
0 80
5 35
0 4
025
1 75
0 Su
b-St
rate
gy 1
.5.1
: Tra
inin
g fa
cilit
ies
114Skilling Uganda - BTVET Strategic Plan 2012/3-2021/2

11
5
Ph
ase
I Ph
ase
II
20
11-1
2
2012
-13
20
13-1
4
2014
-15
20
15-2
0
UG
X ( '0
0000
0)
USD
('0
00)
UGX
( '000
000)
US
D
('000
) UG
X ( '0
0000
0)
USD
('0
00)
UGX
( '000
000)
US
D
('000
) UG
X ( '0
0000
0)
USD
('00
0)
Sub-
Stra
tegy
1.5
.2: S
treng
then
link
ages
22
6 98
55
5 24
1 55
5 24
1 2
775
1 20
7 Su
b-St
rate
gy 1
.5.3
: CBE
T in
agr
icul
ture
25
0 10
9 25
0 10
9 25
0 10
9 25
0 10
9 1
250
543
Stra
tegy
1.6
: Ski
lls fo
r pro
duct
ivity
in in
form
al s
ecto
r
66
0 28
7 66
0 28
7 3
300
1 43
5 Su
b-St
rate
gy 1
.6.1
: Non
-form
al tr
aini
ng in
tegr
ated
into
BT
VET
syst
em
Sub-
Stra
tegy
1.6
.2: I
nfor
mat
ion,
coo
pera
tion,
coo
rdin
atio
n (R
SC)
660
287
660
287
3 30
0 1
435
Sub-
Stra
tegy
1.6
.3: H
uman
and
inst
itutio
nal c
apac
ities
Su
b-St
rate
gy 1
.6.4
: Inn
ovat
ion
Chal
leng
e Fu
nd
Stra
tegy
1.7
: LM
IS
23
10
69
30
92
40
92
40
769
334
Tota
l Obj
ectiv
e 1
16 7
77
7 29
5 20
573
8
945
23 3
34
10 1
45
25 4
34
11 0
58
160
226
69 6
64
Ob
ject
ive
2: In
crea
se q
ualit
y
St
rate
gy 2
.1: S
treng
then
inst
itutio
nal c
apac
ities
St
rate
gy 2
.2: B
TVET
inst
ruct
ors/
tuto
rs
5 79
9 2
521
6 68
3 2
906
7 49
3 3
258
8 40
1 3
652
58 6
57
25 5
03
Sub-
Stra
tegy
2.2
.1: I
nstit
utio
nal c
apac
ities
for
inst
ruct
ors/
tuto
rs tr
aini
ng
Sub-
Stra
tegy
2.2
.2: I
ncre
ase
avai
labi
lity
of B
TVET
in
stru
ctor
s/tu
tors
1
199
521
1 62
3 70
6 1
927
838
2 27
8 99
0 17
540
7
626
Sub-
Stra
tegy
2.2
.3: D
ereg
ulat
e re
crui
tmen
t and
de
ploy
men
t 4
600
2 00
0 5
060
2 20
0 5
566
2 42
0 6
123
2 66
2 41
117
17
877
St
rate
gy 2
.3: Q
ualit
y as
sura
nce
9 4
43
18
Sub-
Stra
tegy
2.3
.1: A
ccre
dita
tion
syst
em
9 4
43
18
Sub-
Stra
tegy
2.3
.2: I
QM
Tota
l Obj
ectiv
e 2
5 79
9 2
521
6 68
3 2
906
7 49
3 3
258
8 40
9 3
656
58 7
00
25 5
22
Ob
ject
ive
3:In
crea
se e
quita
ble
acce
ss
Stra
tegy
3.1
: Acc
ess
to fo
rmal
and
non
-form
al B
TVET
22
966
9
985
30 6
35
13 3
19
39 3
19
17 0
95
49 1
63
21 3
75
444
988
193
473
Stra
tegy
3.2
: Exp
and
priv
ate
prov
isio
n
St
rate
gy 3
.3: S
uppo
rt/Ex
pans
ion
publ
ic B
TVET
sup
ply
12 9
56
5 63
3 14
251
6
196
15 6
76
6 81
6 17
244
7
497
115
805
50 3
50
115 Skilling Uganda - BTVET Strategic Plan 2012/3-2021/2

11
6
Ph
ase
I Ph
ase
II
20
11-1
2
2012
-13
20
13-1
4
2014
-15
20
15-2
0
UG
X ( '0
0000
0)
USD
('0
00)
UGX
( '000
000)
US
D
('000
) UG
X ( '0
0000
0)
USD
('0
00)
UGX
( '000
000)
US
D
('000
) UG
X ( '0
0000
0)
USD
('00
0)
Stra
tegy
3.4
: Aw
aren
ess
crea
tion
Stra
tegy
3.5
: Equ
al p
artic
ipat
ion
of d
isad
vant
aged
Su
b-St
rate
gy 3
.5.1
: Dis
adva
ntag
es g
roup
s
Su
b-St
rate
gy 3
.5.2
: Fem
ale
parti
cipa
tion
Sub-
Stra
tegy
3.5
.3: P
WD
To
tal O
bjec
tive
3
35 9
22
15 6
18
44 8
86
19 5
15
54 9
95
23 9
11
66 4
08
28 8
73
560
793
243
823
Ob
ject
ive
4: In
crea
se m
anag
emen
t effe
ctiv
enes
s
St
rate
gy 4
.1: S
kills
Dev
elop
men
t bod
y
65
0 28
3 St
rate
gy 4
.2: D
evol
ve a
utho
rity
/ in
crea
se a
ccou
ntab
ility
Su
b-St
rate
gy 4
.2.1
: dev
olve
aut
horit
y
Su
b-St
rate
gy 4
.2.2
: inc
reas
e ac
coun
tabi
lity
Stra
tegy
4.3
: MIS
/ M
&E
60
26
60
26
60
26
60
26
990
430
Tota
l Obj
ectiv
e 4
60
26
60
26
60
26
60
26
1 64
0 71
3
Obje
ctiv
e 5:
Inte
rnal
effi
cien
cy a
nd fi
nanc
ing
Stra
tegy
5.1
: tra
nsfe
r mec
hani
sms
Stra
tegy
5.2
: inc
reas
e re
sour
ces
Sub-
Stra
tegy
5.2
.1: I
GA
Sub-
Stra
tegy
5.2
.2: L
evy
Stra
tegy
5.3
: SD
F
To
tal O
bjec
tive
5
Gra
nd T
otal
58
558
25
460
72
202
31
392
85
882
37
340
10
0 31
0 43
613
78
1 35
9 33
9 72
1
Dev
elop
men
t onl
y
Ob
ject
ive
1: M
ake
BTVE
T m
ore
rele
vant
116Skilling Uganda - BTVET Strategic Plan 2012/3-2021/2

11
7
Ph
ase
I Ph
ase
II
20
11-1
2
2012
-13
20
13-1
4
2014
-15
20
15-2
0
UG
X ( '0
0000
0)
USD
('0
00)
UGX
( '000
000)
US
D
('000
) UG
X ( '0
0000
0)
USD
('0
00)
UGX
( '000
000)
US
D
('000
) UG
X ( '0
0000
0)
USD
('00
0)
Stra
tegy
1.1
: Stre
ngth
en ro
le o
f em
ploy
ers
62
27
120
52
50
22
75
33
450
196
Sub-
Stra
tegy
1.1
.1: P
lann
ing
and
deci
sion
-mak
ing
9 4
9 4
Sub-
Stra
tegy
1.1
.2: E
mpl
oyer
-bas
ed tr
aini
ng
54
23
111
48
50
22
75
33
450
196
Stra
tegy
1.2
: Exp
and/
deve
lop
UVQF
3
138
1 36
4 2
244
976
1 57
3 68
4 1
205
524
5 56
3 2
418
Sub-
Stra
tegy
1.2
.1: C
larif
y UV
QF fr
amew
ork/
DIT
st
reng
then
ing
1 58
6 69
0 87
8 38
2 38
3 16
7 92
40
Su
b-St
rate
gy 1
.2.2
: ATP
dev
elop
men
t and
ass
essm
ent
1 55
2 67
5 1
366
594
1 19
0 51
7 1
113
484
5 56
3 2
418
Stra
tegy
1.3
: Fle
xibl
e an
d de
man
d-dr
iven
trai
ning
3
560
1 54
8 3
666
1 59
4 3
560
1 54
8 3
545
1 54
1 13
007
5
655
Stra
tegy
1.4
: Boo
st s
uppl
y in
crit
ical
occ
upat
ions
84
37
69
30
84
37
St
rate
gy 1
.5: A
gric
ultu
re tr
aini
ng
42 2
23
18 3
58
15 3
77
6 68
6 8
209
3 56
9 16
417
7
138
20 0
22
8 70
5 Su
b-St
rate
gy 1
.5.1
: Tra
inin
g fa
cilit
ies
42 2
23
18 3
58
15 1
67
6 59
4 7
723
3 35
8 15
931
6
927
17 5
34
7 62
3 Su
b-St
rate
gy 1
.5.2
: Stre
ngth
en li
nkag
es
276
120
276
120
1 38
0 60
0
Sub-
Stra
tegy
1.5
.3: C
BET
in a
gric
ultu
re
210
91
210
91
210
91
1 10
8 48
2 St
rate
gy 1
.6: S
kills
for p
rodu
ctiv
ity in
info
rmal
sec
tor
383
167
744
324
2 89
1 1
257
2 66
1 1
157
12 3
05
5 35
0 Su
b-St
rate
gy 1
.6.1
: Non
-form
al tr
aini
ng in
tegr
ated
into
BT
VET
syst
em
Sub-
Stra
tegy
1.6
.2: I
nfor
mat
ion,
coo
pera
tion,
coo
rdin
atio
n (R
SC)
119
52
104
45
230
100
Sub-
Stra
tegy
1.6
.3: H
uman
and
inst
itutio
nal c
apac
ities
26
5 11
5 44
2 19
2 36
1 15
7 36
1 15
7 80
5 35
0 Su
b-St
rate
gy 1
.6.4
: Inn
ovat
ion
Chal
leng
e Fu
nd
199
87
2 30
0 1
000
2 30
0 1
000
11 5
00
5 00
0 St
rate
gy 1
.7: L
MIS
20
7 90
52
4 22
8 42
0 18
3 45
9 20
0 1
065
463
Tota
l Obj
ectiv
e 1
49 6
57
21 5
90
22 7
43
9 88
8 16
787
7
299
24 3
62
10 5
92
52 4
11
22 7
87
Ob
ject
ive
2: In
crea
se q
ualit
y
St
rate
gy 2
.1: S
treng
then
inst
itutio
nal c
apac
ities
30
483
13
253
33
070
14
378
35
823
15
575
35
823
15
575
41
6 87
5 18
1 25
0 St
rate
gy 2
.2: B
TVET
inst
ruct
ors/
tuto
rs
9 86
6 4
289
10 3
69
4 50
8 10
089
4
387
10 0
89
4 38
7 31
319
13
617
Su
b-St
rate
gy 2
.2.1
: Ins
titut
iona
l cap
aciti
es fo
r in
stru
ctor
s/tu
tors
trai
ning
8
729
3 79
5 8
729
3 79
5 8
729
3 79
5 8
729
3 79
5 29
268
12
725
Su
b-St
rate
gy 2
.2.2
: Inc
reas
e av
aila
bilit
y of
BTV
ET
inst
ruct
ors/
tuto
rs
811
352
1 31
1 57
0 1
311
570
1 31
1 57
0 1
851
805
117 Skilling Uganda - BTVET Strategic Plan 2012/3-2021/2

11
8
Ph
ase
I Ph
ase
II
20
11-1
2
2012
-13
20
13-1
4
2014
-15
20
15-2
0
UG
X ( '0
0000
0)
USD
('0
00)
UGX
( '000
000)
US
D
('000
) UG
X ( '0
0000
0)
USD
('0
00)
UGX
( '000
000)
US
D
('000
) UG
X ( '0
0000
0)
USD
('00
0)
Sub-
Stra
tegy
2.2
.3: D
ereg
ulat
e re
crui
tmen
t and
de
ploy
men
t 32
7 14
2 33
0 14
3 50
22
50
22
20
0 87
St
rate
gy 2
.3: Q
ualit
y as
sura
nce
287
125
950
413
1 24
0 53
9 1
691
735
Sub-
Stra
tegy
2.3
.1: A
ccre
dita
tion
syst
em
287
125
368
160
460
200
115
50
Sub-
Stra
tegy
2.3
.2: I
QM
582
253
780
339
1 57
6 68
5 To
tal O
bjec
tive
2 40
348
17
543
43
725
19
011
46
861
20
374
47
151
20
501
44
9 88
4 19
5 60
2
Obje
ctiv
e 3:
Incr
ease
equ
itabl
e ac
cess
St
rate
gy 3
.1: A
cces
s to
form
al a
nd n
on-fo
rmal
BTV
ET
Stra
tegy
3.2
: Exp
and
priv
ate
prov
isio
n 1
491
648
1 16
3 50
5 1
150
500
1 15
0 50
0 5
765
2 50
7 St
rate
gy 3
.3: S
uppo
rt/Ex
pans
ion
publ
ic B
TVET
sup
ply
23 0
00
10 0
00
28 7
50
12 5
00
28 7
50
12 5
00
Stra
tegy
3.4
: Aw
aren
ess
crea
tion
46
20
255
111
255
111
683
297
Stra
tegy
3.5
: Equ
al p
artic
ipat
ion
of d
isad
vant
aged
48
4 21
0 17
4 76
58
0 25
2 50
8 22
1 Su
b-St
rate
gy 3
.5.1
: Dis
adva
ntag
es g
roup
s
19
9 87
15
7
Sub-
Stra
tegy
3.5
.2: F
emal
e pa
rtici
patio
n
13
4 58
65
28
65
28
Su
b-St
rate
gy 3
.5.3
: PW
D
15
1 66
10
9 47
50
0 21
7 50
8 22
1 To
tal O
bjec
tive
3
24 4
91
10 6
48
30 4
43
13 2
36
30 3
29
13 1
87
1 98
5 86
3 6
955
3 02
4
Obje
ctiv
e 4:
Incr
ease
man
agem
ent e
ffect
iven
ess
Stra
tegy
4.1
: Ski
lls D
evel
opm
ent b
ody
176
77
199
87
375
163
280
122
2 46
3 1
071
Stra
tegy
4.2
: Dev
olve
aut
horit
y /
incr
ease
acc
ount
abili
ty
248
108
237
103
133
58
897
390
Sub-
Stra
tegy
4.2
.1: d
evol
ve a
utho
rity
72
32
110
48
95
42
874
380
Sub-
Stra
tegy
4.2
.2: i
ncre
ase
acco
unta
bilit
y
17
6 77
12
7 55
38
17
23
10
St
rate
gy 4
.3: M
IS /
M&
E 23
0 10
0 23
0 10
0 30
2 13
1 2
530
1 10
0 2
300
1 00
0 To
tal O
bjec
tive
4 40
6 17
7 67
7 29
5 91
3 39
7 2
943
1 28
0 5
660
2 46
1
Obje
ctiv
e 5:
Inte
rnal
effi
cien
cy a
nd fi
nanc
ing
Stra
tegy
5.1
: tra
nsfe
r mec
hani
sms
183
80
88
38
118Skilling Uganda - BTVET Strategic Plan 2012/3-2021/2

11
9
Ph
ase
I Ph
ase
II
20
11-1
2
2012
-13
20
13-1
4
2014
-15
20
15-2
0
UG
X ( '0
0000
0)
USD
('0
00)
UGX
( '000
000)
US
D
('000
) UG
X ( '0
0000
0)
USD
('0
00)
UGX
( '000
000)
US
D
('000
) UG
X ( '0
0000
0)
USD
('00
0)
Stra
tegy
5.2
: inc
reas
e re
sour
ces
353
153
136
59
181
79
425
185
1 33
2 57
9 Su
b-St
rate
gy 5
.2.1
: IG
A
39
17
14
2 62
47
21
49
7 21
6 Su
b-St
rate
gy 5
.2.2
: Lev
y 35
3 15
3 97
42
39
17
37
8 16
4 83
5 36
3
Stra
tegy
5.3
: SD
F 20
2 88
89
39
96
42
12
9 56
54
3 23
6 To
tal O
bjec
tive
5 55
4 24
1 22
5 98
46
0 20
0 64
1 27
9 1
875
815
G
rand
Tot
al
115
456
50 1
98
97 8
13
42 5
27
95 3
51
41 4
57
77 0
82
33 5
14
516
784
224
689
119 Skilling Uganda - BTVET Strategic Plan 2012/3-2021/2

11
6
A-9.
7: D
etai
led
cost
s pe
r Stra
tegy
25 (i
n ‘0
00 0
00 U
GX)
Obje
ctiv
e 1:
Rel
evan
ce
Stra
tegy
1.1
: Stre
ngth
en ro
le o
f em
ploy
ers
Su
b-St
rate
gy 1
.1.1
: Pla
nnin
g an
d de
cisi
on-m
akin
g
Cost
item
Un
it Un
it co
st
Num
ber o
f uni
ts -
or lu
mp
sum
cos
ts
Tota
l cos
ts
of w
hich
recu
rren
t of
whi
ch d
evel
opm
ent
Ph
ase
I Ph
ase
II Ph
ase
I Ph
ase
II Ph
ase
I Ph
ase
II Ph
ase
I Ph
ase
II
11/1
2 12
/13
13/1
4 14
/15
15/2
0 11
/12
12/1
3 13
/14
14/1
5 15
/20
11/1
2 12
/13
13/1
4 14
/15
15/2
0 11
/12
12/1
3 13
/14
14/1
5 15
/20
TA n
atio
nal
pers
on m
onth
23
,00
TA in
tern
atio
nal
pers
on m
onth
57
,50
1 1
1
1
1
1
Stak
ehol
der W
S,
aver
age
pers
on d
ay
0,15
50
50
8 8
8 8
St
udy
tour
1
pers
on w
eek
9,50
10
Incr
ease
in s
taff
in B
A
posi
tion/
year
8,
50
2 2
2 2
10
17
17
17
17
85
17
17
17
17
85
Tota
l Cos
ts
26
26
17
17
85
17
17
17
17
85
9
9
Sub-
Stra
tegy
1.1
.2: E
mpl
oyer
-bas
ed tr
aini
ng
Cost
item
Un
it Un
it co
st
Num
ber o
f uni
ts -
or lu
mp
sum
cos
ts
Tota
l cos
ts
of w
hich
recu
rren
t of
whi
ch d
evel
opm
ent
Ph
ase
I Ph
ase
II Ph
ase
I Ph
ase
II Ph
ase
I Ph
ase
II Ph
ase
I Ph
ase
II
11
/12
12/1
3 13
/14
14/1
5 15
/20
11/1
2 12
/13
13/1
4 14
/15
15/2
0 11
/12
12/1
3 13
/14
14/1
5 15
/20
11/1
2 12
/13
13/1
4 14
/15
15/2
0 TA
nat
iona
l pe
rson
mon
th
23,0
0 2
2
46
46
46
46
TA
inte
rnat
iona
l pe
rson
mon
th
57,5
0
1
58
58
St
akeh
olde
r WS,
av
erag
e pe
rson
day
0,
15
50
50
8
8
8
8
Ince
ntiv
es fo
r in
tern
ship
s lu
mp
sum
Pilo
t pro
gram
me
coop
erat
ive
trai
ning
lu
mp
sum
50
75
45
0
50
75
45
0
50
75
450
Tota
l Cos
ts
54
11
1 50
75
45
0
54
111
50
75
450
Stra
tegy
1.2
: Exp
and/
deve
lop
UVQF
Su
b-St
rate
gy 1
.2.1
: Cla
rify
UVQF
fram
ewor
k/DI
T st
reng
then
ing
Cost
item
Un
it Un
it co
st
Num
ber o
f uni
ts -
or lu
mp
sum
cos
ts
Tota
l cos
ts
of w
hich
recu
rren
t of
whi
ch d
evel
opm
ent
Ph
ase
I Ph
ase
II Ph
ase
I Ph
ase
II Ph
ase
I Ph
ase
II Ph
ase
I Ph
ase
II
11
/12
12/1
3 13
/14
14/1
5 15
/20
11/1
2 12
/13
13/1
4 14
/15
15/2
0 11
/12
12/1
3 13
/14
14/1
5 15
/20
11/1
2 12
/13
13/1
4 14
/15
15/2
0 TA
nat
iona
l pe
rson
mon
th
23,0
0 6
6 6
4
138
138
138
92
138
138
138
92
TA
inte
rnat
iona
l pe
rson
mon
th
57,5
0 4
4 4
230
230
230
23
0 23
0 23
0
St
akeh
olde
r WS,
av
erag
e pe
rson
day
0,
15
100
100
100
15
15
15
15
15
15
DI
T re
curre
nt c
ost
lum
p su
m
base
line
+ 10
%/y
r 20
0 22
0 24
2 26
6 1
788
200
220
242
266
1 78
8 20
0 22
0 24
2 26
6 1
788
In
crea
se in
sta
ff es
tabl
ishm
ent
prof
essi
onal
s
posi
tion/
year
8,50
15
22
22
22
11
0 12
8 18
7 18
7 18
7 93
5 12
8 18
7 18
7 18
7 93
5
TSC
annu
al lu
mp
sum
/com
mitt
ee
20,0
0 4
5 6
6 30
80
10
0 12
0 12
0 60
0 80
10
0 12
0 12
0 60
0
25N
ote:
the
Gov
ernm
ent s
ubse
quen
tly d
ecid
ed th
at th
e Pl
an p
erio
d sh
ould
be
2012
/3 to
202
1/22
. Th
e da
tes i
n th
e an
nexe
s hav
e be
en c
onve
rted
yet t
o th
is n
ew sc
hedu
le.
25 N
ote:
the
Gov
ernm
ent s
ubse
quen
tly d
ecid
ed th
at th
e Pl
an p
erio
d sh
ould
be
2012
/3 to
202
1/22
. Th
e da
tes
in th
e an
nexe
s ha
ve b
een
conv
erte
d ye
t to
this
new
sch
edul
e.
120Skilling Uganda - BTVET Strategic Plan 2012/3-2021/2

11
7
ITC
annu
al lu
mp
sum
15
0,00
1
1 1
1 5
150
150
150
150
750
150
150
150
150
750
DIT
staf
f dev
elop
men
t lu
mp
sum
30
35
30
35
30
35
Web
site
Dev
elop
men
t lu
mp
sum
23
,00
1
23
23
WAN
lu
mp
sum
46
0,00
1
46
0
460
othe
r inv
estm
ent
lum
psum
1 15
0
1
150
1
150
Tota
l Cos
ts
2
144
1 53
5 1
082
815
4 07
3 55
8 65
7 69
9 72
3 4
073
1 58
6 87
8 38
3 92
Sub-
Stra
tegy
1.2
.2: A
TP d
evel
opm
ent a
nd a
sses
smen
t
Cost
item
Un
it Un
it co
st
Num
ber o
f uni
ts -
or lu
mp
sum
cos
ts
Tota
l cos
ts
of w
hich
recu
rren
t of
whi
ch d
evel
opm
ent
Ph
ase
I Ph
ase
II Ph
ase
I Ph
ase
II Ph
ase
I Ph
ase
II Ph
ase
I Ph
ase
II
11
/12
12/1
3 13
/14
14/1
5 15
/20
11/1
2 12
/13
13/1
4 14
/15
15/2
0 11
/12
12/1
3 13
/14
14/1
5 15
/20
11/1
2 12
/13
13/1
4 14
/15
15/2
0 AT
P de
velo
pmen
t AT
P 36
,00
30
30
30
30
150
1 08
0 1
080
1 08
0 1
080
5 40
0
1 08
0 1
080
1 08
0 1
080
5 40
0 As
sess
men
t DIT
m
odul
ar
train
ee/m
odul
e (n
et)
0,05
10
4 86
0 11
7 84
6 13
1 63
1 14
6 29
4 98
3 82
7 5
243
5 89
2 6
582
7 31
5 49
191
5
243
5 89
2 6
582
7 31
5 49
191
Asse
ssm
ent D
IT le
vel
train
ee (n
et)
0,09
10
1 36
3 11
1 50
0 12
2 65
0 13
4 91
4 90
6 03
3 8
616
9 47
8 10
425
11
468
77
013
8
616
9 47
8 10
425
11
468
77
013
Capa
city
bui
ldin
g fa
cilit
ator
fa
cilit
ator
4,
50
20
20
10
90
90
45
90
90
45
Ca
paci
ty b
uild
ing
asse
ssor
s as
sess
or
0,65
30
0 10
0 10
0 50
25
0 19
5 65
65
33
16
3
195
65
65
33
163
Test
item
ban
k de
velo
pmen
t lu
mp
sum
115
115
11
5 11
5
11
5 11
5
Accr
edita
tion
of
asse
ssm
ent c
ente
rs
0,
80
90
20
72
16
72
16
Dist
ribut
ion
of A
TPs
and
PR
lum
p su
m
80
90
10
0 10
0 50
0 80
90
10
0 10
0 50
0 80
90
10
0 10
0 50
0
UNM
EB
lum
p su
m (s
ee
UNM
EB p
lan)
1 99
1 3
894
3 95
4 4
254
21 2
70
1 99
1 3
894
3 95
4 4
254
21 2
70
1 99
1 3
894
3 95
4 4
254
21 2
70
Tota
l Cos
ts
17
482
20
720
22
251
24
249
15
3 53
7 15
930
19
354
21
061
23
136
14
7 97
4 1
552
1 36
6 1
190
1 11
3 5
563
11
6
A-9.
7: D
etai
led
cost
s pe
r Stra
tegy
25 (i
n ‘0
00 0
00 U
GX)
Obje
ctiv
e 1:
Rel
evan
ce
Stra
tegy
1.1
: Stre
ngth
en ro
le o
f em
ploy
ers
Su
b-St
rate
gy 1
.1.1
: Pla
nnin
g an
d de
cisi
on-m
akin
g
Cost
item
Un
it Un
it co
st
Num
ber o
f uni
ts -
or lu
mp
sum
cos
ts
Tota
l cos
ts
of w
hich
recu
rren
t of
whi
ch d
evel
opm
ent
Ph
ase
I Ph
ase
II Ph
ase
I Ph
ase
II Ph
ase
I Ph
ase
II Ph
ase
I Ph
ase
II
11/1
2 12
/13
13/1
4 14
/15
15/2
0 11
/12
12/1
3 13
/14
14/1
5 15
/20
11/1
2 12
/13
13/1
4 14
/15
15/2
0 11
/12
12/1
3 13
/14
14/1
5 15
/20
TA n
atio
nal
pers
on m
onth
23
,00
TA in
tern
atio
nal
pers
on m
onth
57
,50
1 1
1
1
1
1
Stak
ehol
der W
S,
aver
age
pers
on d
ay
0,15
50
50
8 8
8 8
St
udy
tour
1
pers
on w
eek
9,50
10
Incr
ease
in s
taff
in B
A
posi
tion/
year
8,
50
2 2
2 2
10
17
17
17
17
85
17
17
17
17
85
Tota
l Cos
ts
26
26
17
17
85
17
17
17
17
85
9
9
Sub-
Stra
tegy
1.1
.2: E
mpl
oyer
-bas
ed tr
aini
ng
Cost
item
Un
it Un
it co
st
Num
ber o
f uni
ts -
or lu
mp
sum
cos
ts
Tota
l cos
ts
of w
hich
recu
rren
t of
whi
ch d
evel
opm
ent
Ph
ase
I Ph
ase
II Ph
ase
I Ph
ase
II Ph
ase
I Ph
ase
II Ph
ase
I Ph
ase
II
11
/12
12/1
3 13
/14
14/1
5 15
/20
11/1
2 12
/13
13/1
4 14
/15
15/2
0 11
/12
12/1
3 13
/14
14/1
5 15
/20
11/1
2 12
/13
13/1
4 14
/15
15/2
0 TA
nat
iona
l pe
rson
mon
th
23,0
0 2
2
46
46
46
46
TA
inte
rnat
iona
l pe
rson
mon
th
57,5
0
1
58
58
St
akeh
olde
r WS,
av
erag
e pe
rson
day
0,
15
50
50
8
8
8
8
Ince
ntiv
es fo
r in
tern
ship
s lu
mp
sum
Pilo
t pro
gram
me
coop
erat
ive
trai
ning
lu
mp
sum
50
75
45
0
50
75
45
0
50
75
450
Tota
l Cos
ts
54
11
1 50
75
45
0
54
111
50
75
450
Stra
tegy
1.2
: Exp
and/
deve
lop
UVQF
Su
b-St
rate
gy 1
.2.1
: Cla
rify
UVQF
fram
ewor
k/DI
T st
reng
then
ing
Cost
item
Un
it Un
it co
st
Num
ber o
f uni
ts -
or lu
mp
sum
cos
ts
Tota
l cos
ts
of w
hich
recu
rren
t of
whi
ch d
evel
opm
ent
Ph
ase
I Ph
ase
II Ph
ase
I Ph
ase
II Ph
ase
I Ph
ase
II Ph
ase
I Ph
ase
II
11
/12
12/1
3 13
/14
14/1
5 15
/20
11/1
2 12
/13
13/1
4 14
/15
15/2
0 11
/12
12/1
3 13
/14
14/1
5 15
/20
11/1
2 12
/13
13/1
4 14
/15
15/2
0 TA
nat
iona
l pe
rson
mon
th
23,0
0 6
6 6
4
138
138
138
92
138
138
138
92
TA
inte
rnat
iona
l pe
rson
mon
th
57,5
0 4
4 4
230
230
230
23
0 23
0 23
0
St
akeh
olde
r WS,
av
erag
e pe
rson
day
0,
15
100
100
100
15
15
15
15
15
15
DI
T re
curre
nt c
ost
lum
p su
m
base
line
+ 10
%/y
r 20
0 22
0 24
2 26
6 1
788
200
220
242
266
1 78
8 20
0 22
0 24
2 26
6 1
788
In
crea
se in
sta
ff es
tabl
ishm
ent
prof
essi
onal
s
posi
tion/
year
8,50
15
22
22
22
11
0 12
8 18
7 18
7 18
7 93
5 12
8 18
7 18
7 18
7 93
5
TSC
annu
al lu
mp
sum
/com
mitt
ee
20,0
0 4
5 6
6 30
80
10
0 12
0 12
0 60
0 80
10
0 12
0 12
0 60
0
25N
ote:
the
Gov
ernm
ent s
ubse
quen
tly d
ecid
ed th
at th
e Pl
an p
erio
d sh
ould
be
2012
/3 to
202
1/22
. Th
e da
tes i
n th
e an
nexe
s hav
e be
en c
onve
rted
yet t
o th
is n
ew sc
hedu
le.
121 Skilling Uganda - BTVET Strategic Plan 2012/3-2021/2
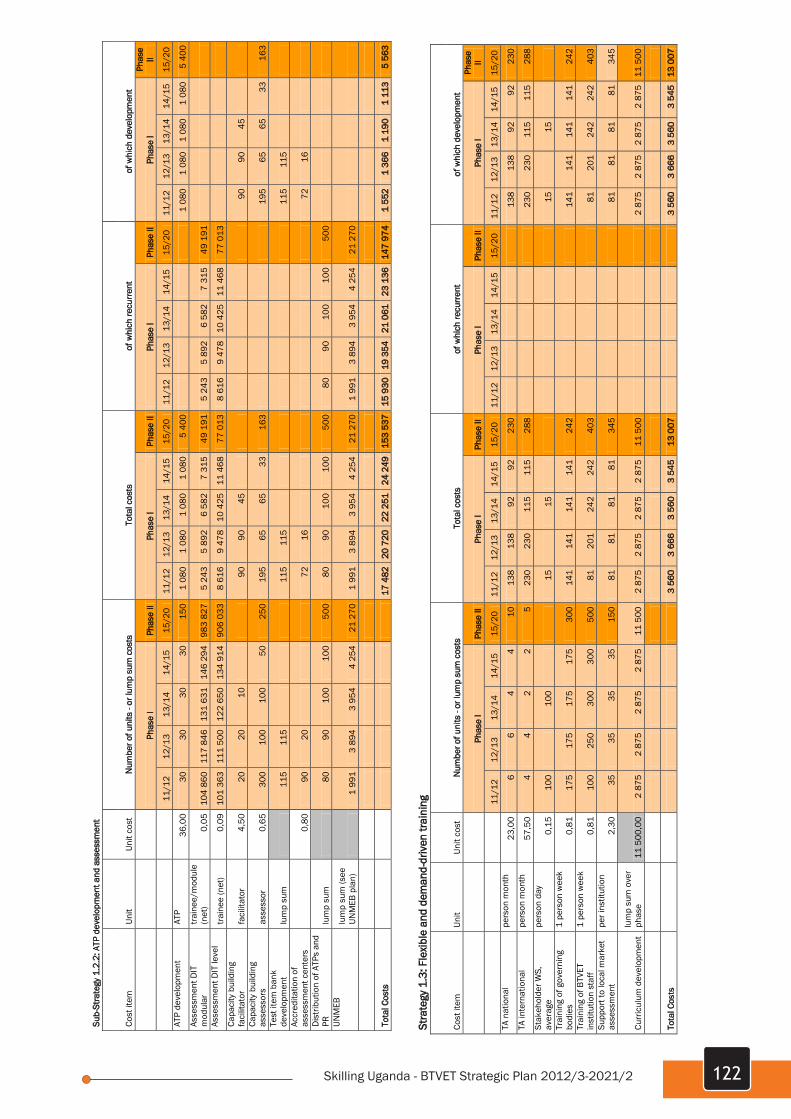
11
8
Stra
tegy
1.3
: Fle
xibl
e an
d de
man
d-dr
iven
trai
ning
Cost
item
Un
it Un
it co
st
Num
ber o
f uni
ts -
or lu
mp
sum
cos
ts
Tota
l cos
ts
of w
hich
recu
rren
t of
whi
ch d
evel
opm
ent
Ph
ase
I Ph
ase
II Ph
ase
I Ph
ase
II Ph
ase
I Ph
ase
II Ph
ase
I Ph
ase
II
11
/12
12/1
3 13
/14
14/1
5 15
/20
11/1
2 12
/13
13/1
4 14
/15
15/2
0 11
/12
12/1
3 13
/14
14/1
5 15
/20
11/1
2 12
/13
13/1
4 14
/15
15/2
0 TA
nat
iona
l pe
rson
mon
th
23,0
0 6
6 4
4 10
13
8 13
8 92
92
23
0
138
138
92
92
230
TA in
tern
atio
nal
pers
on m
onth
57
,50
4 4
2 2
5 23
0 23
0 11
5 11
5 28
8
230
230
115
115
288
Stak
ehol
der W
S,
aver
age
pers
on d
ay
0,15
10
0
100
15
15
15
15
Tr
aini
ng o
f gov
erni
ng
bodi
es
1 pe
rson
wee
k 0,
81
175
175
175
175
300
141
141
141
141
242
14
1 14
1 14
1 14
1 24
2 Tr
aini
ng o
f BTV
ET
inst
itutio
n st
aff
1 pe
rson
wee
k 0,
81
100
250
300
300
500
81
201
242
242
403
81
20
1 24
2 24
2 40
3 Su
ppor
t to
loca
l mar
ket
asse
ssm
ent
per i
nstit
utio
n 2,
30
35
35
35
35
150
81
81
81
81
345
81
81
81
81
34
5
Curr
icul
um d
evel
opm
ent
lum
p su
m o
ver
phas
e 11
500
,00
2 87
5 2
875
2 87
5 2
875
11 5
00
2 87
5 2
875
2 87
5 2
875
11 5
00
2
875
2 87
5 2
875
2 87
5 11
500
Tota
l Cos
ts
3
560
3 66
6 3
560
3 54
5 13
007
3 56
0 3
666
3 56
0 3
545
13 0
07
Stra
tegy
1.4
: Boo
st s
uppl
y in
crit
ical
occ
upat
ions
Cost
item
Un
it Un
it co
st
Num
ber o
f uni
ts -
or lu
mp
sum
cos
ts
Tota
l cos
ts
of w
hich
recu
rren
t of
whi
ch d
evel
opm
ent
Ph
ase
I Ph
ase
II Ph
ase
I Ph
ase
II Ph
ase
I Ph
ase
II Ph
ase
I Ph
ase
II
11
/12
12/1
3 13
/14
14/1
5 15
/20
11/1
2 12
/13
13/1
4 14
/15
15/2
0 11
/12
12/1
3 13
/14
14/1
5 15
/20
11/1
2 12
/13
13/1
4 14
/15
15/2
0 TA
nat
iona
l pe
rson
mon
th
23,0
0 3
3 3
69
69
69
69
69
69
TA
inte
rnat
iona
l pe
rson
mon
th
57,5
0
St
akeh
olde
r WS,
av
erag
e pe
rson
day
0,
15
100
10
0
15
15
15
15
ATP/
curr
icul
um
deve
lopm
ent/
TOT
in
othe
r stra
tegi
es
Tota
l Cos
ts
84
69
84
84
69
84
Stra
tegy
1.5
: Agr
icul
ture
trai
ning
Su
b-St
rate
gy 1
.5.1
: Tra
inin
g fa
cilit
ies
Cost
item
Un
it Un
it co
st
Num
ber o
f uni
ts -
or lu
mp
sum
cos
ts
Tota
l cos
ts
of w
hich
recu
rren
t of
whi
ch d
evel
opm
ent
Ph
ase
I Ph
ase
II Ph
ase
I Ph
ase
II Ph
ase
I Ph
ase
II Ph
ase
I Ph
ase
II
11
/12
12/1
3 13
/14
14/1
5 15
/20
11/1
2 12
/13
13/1
4 14
/15
15/2
0 11
/12
12/1
3 13
/14
14/1
5 15
/20
11/1
2 12
/13
13/1
4 14
/15
15/2
0 N
ew A
SDC
cent
re
8 20
8,00
1
8
208
8
208
Up
grad
e fa
rm s
choo
ls to
AS
DC
cent
re
5 09
1,00
1
1 1
1
5 09
1 5
091
5 09
1 5
091
5 09
1 5
091
5 09
1 5
091
Co
nver
t DAT
ICS
to A
SDC
DATI
C 6
696,
00
5
33
480
33 4
80
VET
Trai
ning
Inst
itute
ce
ntre
5
626,
00
1
5
626
5
626
Food
Sci
ence
, te
chno
logy
, Val
ue
Addi
tion
Dep
artm
ents
cent
re
1 56
5,00
4
6
260
6
260
Bu
kala
sa u
pgra
ding
lu
mp
sum
3
367
806
806
806
4 83
6
3 36
7 80
6 80
6 80
6 4
836
FTI u
pgra
ding
lu
mp
sum
1 31
1 1
049
1 04
9 6
295
1 31
1 1
049
1 04
9 6
295
Dpm
t Irr
igat
ion/
Wat
er
Mng
t in
ASDC
s ce
ntre
77
7,00
1 1
1 1
77
7 77
7 77
7 77
7
77
7 77
7 77
7 77
7 Te
achi
ng m
ater
ial
deve
lopm
ent
lum
p su
m
230
23
0
11
7
ITC
annu
al lu
mp
sum
15
0,00
1
1 1
1 5
150
150
150
150
750
150
150
150
150
750
DIT
staf
f dev
elop
men
t lu
mp
sum
30
35
30
35
30
35
Web
site
Dev
elop
men
t lu
mp
sum
23
,00
1
23
23
WAN
lu
mp
sum
46
0,00
1
46
0
460
othe
r inv
estm
ent
lum
psum
1 15
0
1
150
1
150
Tota
l Cos
ts
2
144
1 53
5 1
082
815
4 07
3 55
8 65
7 69
9 72
3 4
073
1 58
6 87
8 38
3 92
Sub-
Stra
tegy
1.2
.2: A
TP d
evel
opm
ent a
nd a
sses
smen
t
Cost
item
Un
it Un
it co
st
Num
ber o
f uni
ts -
or lu
mp
sum
cos
ts
Tota
l cos
ts
of w
hich
recu
rren
t of
whi
ch d
evel
opm
ent
Ph
ase
I Ph
ase
II Ph
ase
I Ph
ase
II Ph
ase
I Ph
ase
II Ph
ase
I Ph
ase
II
11
/12
12/1
3 13
/14
14/1
5 15
/20
11/1
2 12
/13
13/1
4 14
/15
15/2
0 11
/12
12/1
3 13
/14
14/1
5 15
/20
11/1
2 12
/13
13/1
4 14
/15
15/2
0 AT
P de
velo
pmen
t AT
P 36
,00
30
30
30
30
150
1 08
0 1
080
1 08
0 1
080
5 40
0
1 08
0 1
080
1 08
0 1
080
5 40
0 As
sess
men
t DIT
m
odul
ar
train
ee/m
odul
e (n
et)
0,05
10
4 86
0 11
7 84
6 13
1 63
1 14
6 29
4 98
3 82
7 5
243
5 89
2 6
582
7 31
5 49
191
5
243
5 89
2 6
582
7 31
5 49
191
Asse
ssm
ent D
IT le
vel
train
ee (n
et)
0,09
10
1 36
3 11
1 50
0 12
2 65
0 13
4 91
4 90
6 03
3 8
616
9 47
8 10
425
11
468
77
013
8
616
9 47
8 10
425
11
468
77
013
Capa
city
bui
ldin
g fa
cilit
ator
fa
cilit
ator
4,
50
20
20
10
90
90
45
90
90
45
Ca
paci
ty b
uild
ing
asse
ssor
s as
sess
or
0,65
30
0 10
0 10
0 50
25
0 19
5 65
65
33
16
3
195
65
65
33
163
Test
item
ban
k de
velo
pmen
t lu
mp
sum
115
115
11
5 11
5
11
5 11
5
Accr
edita
tion
of
asse
ssm
ent c
ente
rs
0,
80
90
20
72
16
72
16
Dist
ribut
ion
of A
TPs
and
PR
lum
p su
m
80
90
10
0 10
0 50
0 80
90
10
0 10
0 50
0 80
90
10
0 10
0 50
0
UNM
EB
lum
p su
m (s
ee
UNM
EB p
lan)
1 99
1 3
894
3 95
4 4
254
21 2
70
1 99
1 3
894
3 95
4 4
254
21 2
70
1 99
1 3
894
3 95
4 4
254
21 2
70
Tota
l Cos
ts
17
482
20
720
22
251
24
249
15
3 53
7 15
930
19
354
21
061
23
136
14
7 97
4 1
552
1 36
6 1
190
1 11
3 5
563
122Skilling Uganda - BTVET Strategic Plan 2012/3-2021/2

11
9
Curr
icul
um d
evel
opm
ent
lum
p su
m
55
922
55
922
N
ote:
Re
curr
ent t
rain
ing
cost
s in
clud
ed in
3.1
and
3.3
Tota
l Cos
ts
42
223
15
167
7
723
15 9
31
17 5
34
42
223
15
167
7
723
15 9
31
17 5
34
Sub-
Stra
tegy
1.5
.2: S
treng
then
link
ages
Cost
item
Un
it Un
it co
st
Num
ber o
f uni
ts -
or lu
mp
sum
cos
ts
Tota
l cos
ts
of w
hich
recu
rren
t of
whi
ch d
evel
opm
ent
Ph
ase
I Ph
ase
II Ph
ase
I Ph
ase
II Ph
ase
I Ph
ase
II Ph
ase
I Ph
ase
II
11
/12
12/1
3 13
/14
14/1
5 15
/20
11/1
2 12
/13
13/1
4 14
/15
15/2
0 11
/12
12/1
3 13
/14
14/1
5 15
/20
11/1
2 12
/13
13/1
4 14
/15
15/2
0
Coor
dina
tion
Offic
e M
AAIF
an
nual
in
crem
enta
l 36
,00
1
1 1
5
36
36
36
180
36
36
36
18
0
Regi
ster
s an
nual
in
crem
enta
l 19
0,00
1 1
1 5
19
0 19
0 19
0 95
0
190
190
190
950
Ac
com
mod
atio
n/tra
inin
g fa
cilit
ies
NAR
O fie
ld
stat
ions
st
atio
n 27
6,00
1
1 5
276
276
1 38
0
276
276
1 38
0 Li
aiso
n of
ficer
s at
NAR
O ce
nter
s an
nual
in
crem
enta
l 19
3,00
1
1 5
193
193
965
193
193
965
In
form
atio
n sh
arin
g/di
ssem
inat
ion
lum
p su
m
13
6 13
6 68
0
13
6 13
6 68
0
13
6 13
6 68
0
Tota
l Cos
ts
226
831
831
4 15
5
226
555
555
2 77
5
27
6 27
6 1
380
Sub-
Stra
tegy
1.5
.3: C
BET
in a
gric
ultu
re
Cost
item
Un
it Un
it co
st
Num
ber o
f uni
ts -
or lu
mp
sum
cos
ts
Tota
l cos
ts
of w
hich
recu
rren
t of
whi
ch d
evel
opm
ent
Ph
ase
I Ph
ase
II Ph
ase
I Ph
ase
II Ph
ase
I Ph
ase
II Ph
ase
I Ph
ase
II
11
/12
12/1
3 13
/14
14/1
5 15
/20
11/1
2 12
/13
13/1
4 14
/15
15/2
0 11
/12
12/1
3 13
/14
14/1
5 15
/20
11/1
2 12
/13
13/1
4 14
/15
15/2
0 AT
P de
velo
pmen
t in
clud
ed in
1.2
.2
Capa
city
bui
ldin
g in
stru
ctor
s in
stru
ctor
1,
15
10
0 10
0 10
0 55
0
115
115
115
633
115
115
115
633
Mis
cella
neou
s lu
mp
sum
95
95
95
47
5
95
95
95
475
95
95
95
475
Mon
itorin
g
lum
p su
m
25
0 25
0 25
0 25
0 1
250
250
250
250
250
1 25
0 25
0 25
0 25
0 25
0 1
250
Tota
l Cos
ts
25
0 46
0 46
0 46
0 2
358
250
250
250
250
1 25
0
210
210
210
1 10
8
Stra
tegy
1.6
: Ski
lls fo
r pro
duct
ivity
in in
form
al s
ecto
r Su
b-St
rate
gy 1
.6.1
: Non
-form
al tr
aini
ng in
tegr
ated
into
BTV
ET s
yste
m
Cost
item
Un
it Un
it co
st
Num
ber o
f uni
ts -
or lu
mp
sum
cos
ts
Tota
l cos
ts
of w
hich
recu
rren
t of
whi
ch d
evel
opm
ent
Ph
ase
I Ph
ase
II Ph
ase
I Ph
ase
II Ph
ase
I Ph
ase
II Ph
ase
I Ph
ase
II
11
8
Stra
tegy
1.3
: Fle
xibl
e an
d de
man
d-dr
iven
trai
ning
Cost
item
Un
it Un
it co
st
Num
ber o
f uni
ts -
or lu
mp
sum
cos
ts
Tota
l cos
ts
of w
hich
recu
rren
t of
whi
ch d
evel
opm
ent
Ph
ase
I Ph
ase
II Ph
ase
I Ph
ase
II Ph
ase
I Ph
ase
II Ph
ase
I Ph
ase
II
11
/12
12/1
3 13
/14
14/1
5 15
/20
11/1
2 12
/13
13/1
4 14
/15
15/2
0 11
/12
12/1
3 13
/14
14/1
5 15
/20
11/1
2 12
/13
13/1
4 14
/15
15/2
0 TA
nat
iona
l pe
rson
mon
th
23,0
0 6
6 4
4 10
13
8 13
8 92
92
23
0
138
138
92
92
230
TA in
tern
atio
nal
pers
on m
onth
57
,50
4 4
2 2
5 23
0 23
0 11
5 11
5 28
8
230
230
115
115
288
Stak
ehol
der W
S,
aver
age
pers
on d
ay
0,15
10
0
100
15
15
15
15
Tr
aini
ng o
f gov
erni
ng
bodi
es
1 pe
rson
wee
k 0,
81
175
175
175
175
300
141
141
141
141
242
14
1 14
1 14
1 14
1 24
2 Tr
aini
ng o
f BTV
ET
inst
itutio
n st
aff
1 pe
rson
wee
k 0,
81
100
250
300
300
500
81
201
242
242
403
81
20
1 24
2 24
2 40
3 Su
ppor
t to
loca
l mar
ket
asse
ssm
ent
per i
nstit
utio
n 2,
30
35
35
35
35
150
81
81
81
81
345
81
81
81
81
34
5
Curr
icul
um d
evel
opm
ent
lum
p su
m o
ver
phas
e 11
500
,00
2 87
5 2
875
2 87
5 2
875
11 5
00
2 87
5 2
875
2 87
5 2
875
11 5
00
2
875
2 87
5 2
875
2 87
5 11
500
Tota
l Cos
ts
3
560
3 66
6 3
560
3 54
5 13
007
3 56
0 3
666
3 56
0 3
545
13 0
07
Stra
tegy
1.4
: Boo
st s
uppl
y in
crit
ical
occ
upat
ions
Cost
item
Un
it Un
it co
st
Num
ber o
f uni
ts -
or lu
mp
sum
cos
ts
Tota
l cos
ts
of w
hich
recu
rren
t of
whi
ch d
evel
opm
ent
Ph
ase
I Ph
ase
II Ph
ase
I Ph
ase
II Ph
ase
I Ph
ase
II Ph
ase
I Ph
ase
II
11
/12
12/1
3 13
/14
14/1
5 15
/20
11/1
2 12
/13
13/1
4 14
/15
15/2
0 11
/12
12/1
3 13
/14
14/1
5 15
/20
11/1
2 12
/13
13/1
4 14
/15
15/2
0 TA
nat
iona
l pe
rson
mon
th
23,0
0 3
3 3
69
69
69
69
69
69
TA
inte
rnat
iona
l pe
rson
mon
th
57,5
0
St
akeh
olde
r WS,
av
erag
e pe
rson
day
0,
15
100
10
0
15
15
15
15
ATP/
curr
icul
um
deve
lopm
ent/
TOT
in
othe
r stra
tegi
es
Tota
l Cos
ts
84
69
84
84
69
84
Stra
tegy
1.5
: Agr
icul
ture
trai
ning
Su
b-St
rate
gy 1
.5.1
: Tra
inin
g fa
cilit
ies
Cost
item
Un
it Un
it co
st
Num
ber o
f uni
ts -
or lu
mp
sum
cos
ts
Tota
l cos
ts
of w
hich
recu
rren
t of
whi
ch d
evel
opm
ent
Ph
ase
I Ph
ase
II Ph
ase
I Ph
ase
II Ph
ase
I Ph
ase
II Ph
ase
I Ph
ase
II
11
/12
12/1
3 13
/14
14/1
5 15
/20
11/1
2 12
/13
13/1
4 14
/15
15/2
0 11
/12
12/1
3 13
/14
14/1
5 15
/20
11/1
2 12
/13
13/1
4 14
/15
15/2
0 N
ew A
SDC
cent
re
8 20
8,00
1
8
208
8
208
Up
grad
e fa
rm s
choo
ls to
AS
DC
cent
re
5 09
1,00
1
1 1
1
5 09
1 5
091
5 09
1 5
091
5 09
1 5
091
5 09
1 5
091
Co
nver
t DAT
ICS
to A
SDC
DATI
C 6
696,
00
5
33
480
33 4
80
VET
Trai
ning
Inst
itute
ce
ntre
5
626,
00
1
5
626
5
626
Food
Sci
ence
, te
chno
logy
, Val
ue
Addi
tion
Dep
artm
ents
cent
re
1 56
5,00
4
6
260
6
260
Bu
kala
sa u
pgra
ding
lu
mp
sum
3
367
806
806
806
4 83
6
3 36
7 80
6 80
6 80
6 4
836
FTI u
pgra
ding
lu
mp
sum
1 31
1 1
049
1 04
9 6
295
1 31
1 1
049
1 04
9 6
295
Dpm
t Irr
igat
ion/
Wat
er
Mng
t in
ASDC
s ce
ntre
77
7,00
1 1
1 1
77
7 77
7 77
7 77
7
77
7 77
7 77
7 77
7 Te
achi
ng m
ater
ial
deve
lopm
ent
lum
p su
m
230
23
0
123 Skilling Uganda - BTVET Strategic Plan 2012/3-2021/2

12
0
11
/12
12/1
3 13
/14
14/1
5 15
/20
11/1
2 12
/13
13/1
4 14
/15
15/2
0 11
/12
12/1
3 13
/14
14/1
5 15
/20
11/1
2 12
/13
13/1
4 14
/15
15/2
0 Co
st fo
r man
agem
ent o
f NFT
Pro
gram
me
incl
. des
k of
ficer
s to
be
born
e fro
m
man
agem
ent/
mon
itorin
g lu
mp
sum
in
Stra
tegy
2.1
Tota
l Cos
ts
Sub-
Stra
tegy
1.6
.2: I
nfor
mat
ion,
coo
pera
tion,
coo
rdin
atio
n (R
SC)
Cost
item
Un
it Un
it co
st
Num
ber o
f uni
ts -
or lu
mp
sum
cos
ts
Tota
l cos
ts
of w
hich
recu
rren
t of
whi
ch d
evel
opm
ent
Ph
ase
I Ph
ase
II Ph
ase
I Ph
ase
II Ph
ase
I Ph
ase
II Ph
ase
I Ph
ase
II
11
/12
12/1
3 13
/14
14/1
5 15
/20
11/1
2 12
/13
13/1
4 14
/15
15/2
0 11
/12
12/1
3 13
/14
14/1
5 15
/20
11/1
2 12
/13
13/1
4 14
/15
15/2
0 TA
nat
iona
l pe
rson
mon
th
23,0
0 2
2 2
46
46
46
46
46
46
TA
inte
rnat
iona
l pe
rson
mon
th
57,5
0 1
1
58
58
58
58
St
akeh
olde
r WS,
av
erag
e pe
rson
day
0,
15
100
15
15
Ad
ditio
nal s
taff
prof
essi
onal
pe
rson
yea
r 8,
50
8 8
40
68
68
340
68
68
340
Addi
tiona
l sta
ff as
sist
ant
pers
on y
ear
4,80
8
8 40
38
38
19
2
38
38
19
2
Addi
tiona
l sta
ff dr
iver
pe
rson
yea
r 4,
80
8 8
40
38
38
192
38
38
192
Of
fice
equi
pmen
t lu
mp
sum
11
,50
8
92
92
Oper
atio
nal e
xpen
ses
year
/offi
ce
41,4
0
8
8 40
33
1 33
1 1
656
331
331
1 65
6
Inve
ntor
ies
per s
tudy
11
,50
8
92
92
Net
wor
k m
eetin
gs
year
/offi
ce
23,0
0
8
8 40
18
4 18
4 92
0
18
4 18
4 92
0
Tota
l Cos
ts
11
9 10
4 89
0 66
0 3
300
660
660
3 30
0 11
9 10
4 23
0
Sub-
Stra
tegy
1.6
.3: H
uman
and
inst
itutio
nal c
apac
ities
Cost
item
Un
it Un
it co
st
Num
ber o
f uni
ts -
or lu
mp
sum
cos
ts
Tota
l cos
ts
of w
hich
recu
rren
t of
whi
ch d
evel
opm
ent
Ph
ase
I Ph
ase
II Ph
ase
I Ph
ase
II Ph
ase
I Ph
ase
II Ph
ase
I Ph
ase
II
11
/12
12/1
3 13
/14
14/1
5 15
/20
11/1
2 12
/13
13/1
4 14
/15
15/2
0 11
/12
12/1
3 13
/14
14/1
5 15
/20
11/1
2 12
/13
13/1
4 14
/15
15/2
0 TA
nat
iona
l pe
rson
mon
th
23,0
0 3
3 2
2
69
69
46
46
69
69
46
46
TA
inte
rnat
iona
l pe
rson
mon
th
57,5
0 2
2 1
1
115
115
58
58
115
115
58
58
St
akeh
olde
r WS,
av
erag
e pe
rson
day
0,
15
Faci
litat
ors
train
ing
1 pe
rson
wee
k 0,
81
20
16
16
Tr
aini
ng w
orks
hop
1 pe
rson
wee
k 0,
81
80
320
320
320
1 00
0 64
25
8 25
8 25
8 80
5
64
258
258
258
805
Tota
l Cos
ts
26
5 44
2 36
1 36
1 80
5
265
442
361
361
805
Sub-
Stra
tegy
1.6
.4: I
nnov
atio
n Ch
alle
nge
Fund
Cost
item
Un
it Un
it co
st
Num
ber o
f uni
ts -
or lu
mp
sum
cos
ts
Tota
l cos
ts
of w
hich
recu
rren
t of
whi
ch d
evel
opm
ent
Ph
ase
I Ph
ase
II Ph
ase
I Ph
ase
II Ph
ase
I Ph
ase
II Ph
ase
I Ph
ase
II
11
/12
12/1
3 13
/14
14/1
5 15
/20
11/1
2 12
/13
13/1
4 14
/15
15/2
0 11
/12
12/1
3 13
/14
14/1
5 15
/20
11/1
2 12
/13
13/1
4 14
/15
15/2
0 TA
nat
iona
l pe
rson
mon
th
23,0
0
3
69
69
TA
inte
rnat
iona
l pe
rson
mon
th
57,5
0
2
11
5
115
11
9
Curr
icul
um d
evel
opm
ent
lum
p su
m
55
922
55
922
N
ote:
Re
curr
ent t
rain
ing
cost
s in
clud
ed in
3.1
and
3.3
Tota
l Cos
ts
42
223
15
167
7
723
15 9
31
17 5
34
42
223
15
167
7
723
15 9
31
17 5
34
Sub-
Stra
tegy
1.5
.2: S
treng
then
link
ages
Cost
item
Un
it Un
it co
st
Num
ber o
f uni
ts -
or lu
mp
sum
cos
ts
Tota
l cos
ts
of w
hich
recu
rren
t of
whi
ch d
evel
opm
ent
Ph
ase
I Ph
ase
II Ph
ase
I Ph
ase
II Ph
ase
I Ph
ase
II Ph
ase
I Ph
ase
II
11
/12
12/1
3 13
/14
14/1
5 15
/20
11/1
2 12
/13
13/1
4 14
/15
15/2
0 11
/12
12/1
3 13
/14
14/1
5 15
/20
11/1
2 12
/13
13/1
4 14
/15
15/2
0
Coor
dina
tion
Offic
e M
AAIF
an
nual
in
crem
enta
l 36
,00
1
1 1
5
36
36
36
180
36
36
36
18
0
Regi
ster
s an
nual
in
crem
enta
l 19
0,00
1 1
1 5
19
0 19
0 19
0 95
0
190
190
190
950
Ac
com
mod
atio
n/tra
inin
g fa
cilit
ies
NAR
O fie
ld
stat
ions
st
atio
n 27
6,00
1
1 5
276
276
1 38
0
276
276
1 38
0 Li
aiso
n of
ficer
s at
NAR
O ce
nter
s an
nual
in
crem
enta
l 19
3,00
1
1 5
193
193
965
193
193
965
In
form
atio
n sh
arin
g/di
ssem
inat
ion
lum
p su
m
13
6 13
6 68
0
13
6 13
6 68
0
13
6 13
6 68
0
Tota
l Cos
ts
226
831
831
4 15
5
226
555
555
2 77
5
27
6 27
6 1
380
Sub-
Stra
tegy
1.5
.3: C
BET
in a
gric
ultu
re
Cost
item
Un
it Un
it co
st
Num
ber o
f uni
ts -
or lu
mp
sum
cos
ts
Tota
l cos
ts
of w
hich
recu
rren
t of
whi
ch d
evel
opm
ent
Ph
ase
I Ph
ase
II Ph
ase
I Ph
ase
II Ph
ase
I Ph
ase
II Ph
ase
I Ph
ase
II
11
/12
12/1
3 13
/14
14/1
5 15
/20
11/1
2 12
/13
13/1
4 14
/15
15/2
0 11
/12
12/1
3 13
/14
14/1
5 15
/20
11/1
2 12
/13
13/1
4 14
/15
15/2
0 AT
P de
velo
pmen
t in
clud
ed in
1.2
.2
Capa
city
bui
ldin
g in
stru
ctor
s in
stru
ctor
1,
15
10
0 10
0 10
0 55
0
115
115
115
633
115
115
115
633
Mis
cella
neou
s lu
mp
sum
95
95
95
47
5
95
95
95
475
95
95
95
475
Mon
itorin
g
lum
p su
m
25
0 25
0 25
0 25
0 1
250
250
250
250
250
1 25
0 25
0 25
0 25
0 25
0 1
250
Tota
l Cos
ts
25
0 46
0 46
0 46
0 2
358
250
250
250
250
1 25
0
210
210
210
1 10
8
Stra
tegy
1.6
: Ski
lls fo
r pro
duct
ivity
in in
form
al s
ecto
r Su
b-St
rate
gy 1
.6.1
: Non
-form
al tr
aini
ng in
tegr
ated
into
BTV
ET s
yste
m
Cost
item
Un
it Un
it co
st
Num
ber o
f uni
ts -
or lu
mp
sum
cos
ts
Tota
l cos
ts
of w
hich
recu
rren
t of
whi
ch d
evel
opm
ent
Ph
ase
I Ph
ase
II Ph
ase
I Ph
ase
II Ph
ase
I Ph
ase
II Ph
ase
I Ph
ase
II
124Skilling Uganda - BTVET Strategic Plan 2012/3-2021/2

12
0
11
/12
12/1
3 13
/14
14/1
5 15
/20
11/1
2 12
/13
13/1
4 14
/15
15/2
0 11
/12
12/1
3 13
/14
14/1
5 15
/20
11/1
2 12
/13
13/1
4 14
/15
15/2
0 Co
st fo
r man
agem
ent o
f NFT
Pro
gram
me
incl
. des
k of
ficer
s to
be
born
e fro
m
man
agem
ent/
mon
itorin
g lu
mp
sum
in
Stra
tegy
2.1
Tota
l Cos
ts
Sub-
Stra
tegy
1.6
.2: I
nfor
mat
ion,
coo
pera
tion,
coo
rdin
atio
n (R
SC)
Cost
item
Un
it Un
it co
st
Num
ber o
f uni
ts -
or lu
mp
sum
cos
ts
Tota
l cos
ts
of w
hich
recu
rren
t of
whi
ch d
evel
opm
ent
Ph
ase
I Ph
ase
II Ph
ase
I Ph
ase
II Ph
ase
I Ph
ase
II Ph
ase
I Ph
ase
II
11
/12
12/1
3 13
/14
14/1
5 15
/20
11/1
2 12
/13
13/1
4 14
/15
15/2
0 11
/12
12/1
3 13
/14
14/1
5 15
/20
11/1
2 12
/13
13/1
4 14
/15
15/2
0 TA
nat
iona
l pe
rson
mon
th
23,0
0 2
2 2
46
46
46
46
46
46
TA
inte
rnat
iona
l pe
rson
mon
th
57,5
0 1
1
58
58
58
58
St
akeh
olde
r WS,
av
erag
e pe
rson
day
0,
15
100
15
15
Ad
ditio
nal s
taff
prof
essi
onal
pe
rson
yea
r 8,
50
8 8
40
68
68
340
68
68
340
Addi
tiona
l sta
ff as
sist
ant
pers
on y
ear
4,80
8
8 40
38
38
19
2
38
38
19
2
Addi
tiona
l sta
ff dr
iver
pe
rson
yea
r 4,
80
8 8
40
38
38
192
38
38
192
Of
fice
equi
pmen
t lu
mp
sum
11
,50
8
92
92
Oper
atio
nal e
xpen
ses
year
/offi
ce
41,4
0
8
8 40
33
1 33
1 1
656
331
331
1 65
6
Inve
ntor
ies
per s
tudy
11
,50
8
92
92
Net
wor
k m
eetin
gs
year
/offi
ce
23,0
0
8
8 40
18
4 18
4 92
0
18
4 18
4 92
0
Tota
l Cos
ts
11
9 10
4 89
0 66
0 3
300
660
660
3 30
0 11
9 10
4 23
0
S ub-
Stra
tegy
1.6
.3: H
uman
and
inst
itutio
nal c
apac
ities
Cost
item
Un
it Un
it co
st
Num
ber o
f uni
ts -
or lu
mp
sum
cos
ts
Tota
l cos
ts
of w
hich
recu
rren
t of
whi
ch d
evel
opm
ent
Ph
ase
I Ph
ase
II Ph
ase
I Ph
ase
II Ph
ase
I Ph
ase
II Ph
ase
I Ph
ase
II
11
/12
12/1
3 13
/14
14/1
5 15
/20
11/1
2 12
/13
13/1
4 14
/15
15/2
0 11
/12
12/1
3 13
/14
14/1
5 15
/20
11/1
2 12
/13
13/1
4 14
/15
15/2
0 TA
nat
iona
l pe
rson
mon
th
23,0
0 3
3 2
2
69
69
46
46
69
69
46
46
TA
inte
rnat
iona
l pe
rson
mon
th
57,5
0 2
2 1
1
115
115
58
58
115
115
58
58
St
akeh
olde
r WS,
av
erag
e pe
rson
day
0,
15
Faci
litat
ors
train
ing
1 pe
rson
wee
k 0,
81
20
16
16
Tr
aini
ng w
orks
hop
1 pe
rson
wee
k 0,
81
80
320
320
320
1 00
0 64
25
8 25
8 25
8 80
5
64
258
258
258
805
Tota
l Cos
ts
26
5 44
2 36
1 36
1 80
5
265
442
361
361
805
Sub-
Stra
tegy
1.6
.4: I
nnov
atio
n Ch
alle
nge
Fund
Cost
item
Un
it Un
it co
st
Num
ber o
f uni
ts -
or lu
mp
sum
cos
ts
Tota
l cos
ts
of w
hich
recu
rren
t of
whi
ch d
evel
opm
ent
Ph
ase
I Ph
ase
II Ph
ase
I Ph
ase
II Ph
ase
I Ph
ase
II Ph
ase
I Ph
ase
II
11
/12
12/1
3 13
/14
14/1
5 15
/20
11/1
2 12
/13
13/1
4 14
/15
15/2
0 11
/12
12/1
3 13
/14
14/1
5 15
/20
11/1
2 12
/13
13/1
4 14
/15
15/2
0 TA
nat
iona
l pe
rson
mon
th
23,0
0
3
69
69
TA
inte
rnat
iona
l pe
rson
mon
th
57,5
0
2
11
5
115
125 Skilling Uganda - BTVET Strategic Plan 2012/3-2021/2

12
1
Stak
ehol
der W
S,
aver
age
pers
on d
ay
0,15
100
15
15
Inno
vatio
n Fu
nd
lum
p su
m
2
300
2 30
0 11
500
2
300
2 30
0 11
500
2 30
0 2
300
11 5
00
Tota
l Cos
ts
199
2 30
0 2
300
11 5
00
199
2 30
0 2
300
11 5
00
Stra
tegy
1.7
: LM
IS
Cost
item
Un
it Un
it co
st
Num
ber o
f uni
ts -
or lu
mp
sum
cos
ts
Tota
l cos
ts
of w
hich
recu
rren
t of
whi
ch d
evel
opm
ent
Ph
ase
I Ph
ase
II Ph
ase
I Ph
ase
II Ph
ase
I Ph
ase
II Ph
ase
I Ph
ase
II
11
/12
12/1
3 13
/14
14/1
5 15
/20
11/1
2 12
/13
13/1
4 14
/15
15/2
0 11
/12
12/1
3 13
/14
14/1
5 15
/20
11/1
2 12
/13
13/1
4 14
/15
15/2
0 TA
nat
iona
l pe
rson
mon
th
23,0
0 4
8 8
8 20
92
18
4 18
4 18
4 46
0
92
184
184
184
460
TA in
tern
atio
nal
pers
on m
onth
57
,50
2 4
4 4
10
115
230
230
230
575
11
5 23
0 23
0 23
0 57
5 St
akeh
olde
r WS,
av
erag
e pe
rson
day
0,
15
10
0 40
40
20
0
15
6 6
30
15
6 6
30
Stud
y to
ur
1 pe
rson
wee
k 9,
50
10
95
95
Softw
are
licen
ses
lum
p su
m
23
23
23
Trai
ning
wor
ksho
p 1
pers
on w
eek
0,81
20
16
16
Trac
er s
tudi
es
lum
psum
/yea
r 69
,00
1
1 1
5
69
69
69
345
69
69
69
34
5
Empl
oyer
sur
veys
lu
mps
um/y
ear
23,0
0 1
1
3
23
23
69
23
23
69
co
mm
unic
atio
n lu
mp
sum
23
11
5
23
115
23
11
5
Addi
tiona
l sta
ff pr
ofes
sion
al
pers
on/y
ear
24,0
0
10
24
0
24
0
Tota
l Cos
ts
23
0 59
3 51
2 55
1 1
834
23
69
92
92
769
207
524
420
459
1 06
5
126Skilling Uganda - BTVET Strategic Plan 2012/3-2021/2

12
2
Obje
ctiv
e 2
– Qu
ality
St
rate
gy 2
.1: S
treng
then
inst
itutio
nal c
apac
ities
Cost
item
Un
it Un
it co
st
Num
ber o
f uni
ts -
or lu
mp
sum
cos
ts
Tota
l cos
ts
of w
hich
recu
rren
t of
whi
ch d
evel
opm
ent
Ph
ase
I Ph
ase
II Ph
ase
I Ph
ase
II Ph
ase
I Ph
ase
II Ph
ase
I Ph
ase
II
11/1
2 12
/13
13/1
4 14
/15
15/2
0 11
/12
12/1
3 13
/14
14/1
5 15
/20
11/1
2 12
/13
13/1
4 14
/15
15/2
0 11
/12
12/1
3 13
/14
14/1
5 15
/20
Inst
itutio
nal
stre
ngth
enin
g in
stitu
tion
11 5
00
28 7
50
28 7
50
28 7
50
28 7
50
345
000
28 7
50
28 7
50
28 7
50
28 7
50
345
000
28
750
28
750
28
750
28
750
34
5 00
0 BT
VET
Inve
stm
ent
Fund
lu
mps
um
2
760
2 76
0 46
000
2
760
2 76
0 46
000
2 76
0 2
760
46 0
00
Stak
ehol
der W
S,
aver
age
pers
on d
ay
0,15
50
50
8 8
8 8
IC
T co
mpu
ter
3,45
50
0 1
250
1 25
0 1
250
7 50
0 1
725
4 31
3 4
313
4 31
3 25
875
1 72
5 4
313
4 31
3 4
313
25 8
75
Tota
l Cos
ts
30
483
33
070
35
823
35
823
41
6 87
5
30 4
83
33 0
70
35 8
23
35 8
23
416
875
Stra
tegy
2.2
: BTV
ET in
stru
ctor
s/tu
tors
Su
b-St
rate
gy 2
.2.1
: Ins
titut
iona
l cap
aciti
es fo
r ins
truct
ors/
tuto
rs tr
aini
ng
Cost
item
Un
it Un
it co
st
Num
ber o
f uni
ts -
or lu
mp
sum
cos
ts
Tota
l cos
ts
of w
hich
recu
rren
t of
whi
ch d
evel
opm
ent
Ph
ase
I Ph
ase
II Ph
ase
I Ph
ase
II Ph
ase
I Ph
ase
II Ph
ase
I Ph
ase
II
11
/12
12/1
3 13
/14
14/1
5 15
/20
11/1
2 12
/13
13/1
4 14
/15
15/2
0 11
/12
12/1
3 13
/14
14/1
5 15
/20
11/1
2 12
/13
13/1
4 14
/15
15/2
0 TA
nat
iona
l pe
rson
mon
th
23,0
0 2
2 2
2 10
46
46
46
46
23
0
46
46
46
46
230
TA in
tern
atio
nal
pers
on m
onth
57
,50
1 1
1 1
5 58
58
58
58
28
8
58
58
58
58
288
Com
preh
ensi
ve
inst
itutio
nal
stre
ngth
enin
g in
cl
curr
icul
um d
evel
op
and
mas
ter t
rain
ers
train
ing
inst
itutio
n
11 5
00,0
0 8
625
8 62
5 8
625
8 62
5 23
000
8
625
8 62
5 8
625
8 62
5 23
000
8 62
5 8
625
8 62
5 8
625
23 0
00
Trai
ning
of m
aste
r tra
iner
s ov
erse
as
mas
ter t
rain
er
57,5
0
10
0
5
750
5
750
Tota
l Cos
ts
8
729
8 72
9 8
729
8 72
9 29
268
8 72
9 8
729
8 72
9 8
729
29 2
68
Sub-
Stra
tegy
2.2
.2: I
ncre
ase
avai
labi
lity
of B
TVET
inst
ruct
ors/
tuto
rs
Cost
item
Un
it Un
it co
st
Num
ber o
f uni
ts -
or lu
mp
sum
cos
ts
Tota
l cos
ts
of w
hich
recu
rren
t of
whi
ch d
evel
opm
ent
Ph
ase
I Ph
ase
II Ph
ase
I Ph
ase
II Ph
ase
I Ph
ase
II Ph
ase
I Ph
ase
II
11
/12
12/1
3 13
/14
14/1
5 15
/20
11/1
2 12
/13
13/1
4 14
/15
15/2
0 11
/12
12/1
3 13
/14
14/1
5 15
/20
11/1
2 12
/13
13/1
4 14
/15
15/2
0 Cu
rric
ulum
de
velo
pmen
t par
t of
inst
itutio
nal
stre
ngth
enin
g
In
stru
ctor
s tr
aini
ng,
capi
tatio
n gr
ant
inst
ruct
or/y
ear
spec
ial
calc
ulat
ion
647
870
1 13
1 1
435
13 7
35
647
870
1 13
1 1
435
13 7
35
647
870
1 13
1 1
435
13 7
35
In-s
ervi
ce tr
aini
ng o
f in
stru
ctor
s in
stru
ctor
/ pr
ogra
mm
e 2,
00
250
500
500
500
500
500
1 00
0 1
000
1 00
0 1
000
50
0 1
000
1 00
0 1
000
1 00
0 As
sess
men
t of
inst
ruct
ors
asse
ssm
ent
0,65
84
9 1
159
1 22
5 1
297
5 85
4 55
2 75
3 79
6 84
3 3
805
552
753
796
843
3 80
5
Base
-fund
ing
(sal
arie
s) IT
Is
TA n
atio
nal
pers
on m
onth
23
,00
6 6
6 6
12
138
138
138
138
276
13
8 13
8 13
8 13
8 27
6 TA
inte
rnat
iona
l pe
rson
mon
th
57,5
0 3
3 3
3 10
17
3 17
3 17
3 17
3 57
5
173
173
173
173
575
Tota
l Cos
ts
2
009
2 93
4 3
238
3 58
9 19
391
1
199
1 62
3 1
927
2 27
8 17
540
81
1 1
311
1 31
1 1
311
1 85
1
Sub-
Stra
tegy
2.2
.3: D
ereg
ulat
e re
crui
tmen
t and
dep
loym
ent
Cost
item
Un
it Un
it co
st
Num
ber o
f uni
ts -
or lu
mp
sum
cos
ts
Tota
l cos
ts
of w
hich
recu
rren
t of
whi
ch d
evel
opm
ent
127 Skilling Uganda - BTVET Strategic Plan 2012/3-2021/2

12
2
Obje
ctiv
e 2
– Qu
ality
St
rate
gy 2
.1: S
treng
then
inst
itutio
nal c
apac
ities
Cost
item
Un
it Un
it co
st
Num
ber o
f uni
ts -
or lu
mp
sum
cos
ts
Tota
l cos
ts
of w
hich
recu
rren
t of
whi
ch d
evel
opm
ent
Ph
ase
I Ph
ase
II Ph
ase
I Ph
ase
II Ph
ase
I Ph
ase
II Ph
ase
I Ph
ase
II
11/1
2 12
/13
13/1
4 14
/15
15/2
0 11
/12
12/1
3 13
/14
14/1
5 15
/20
11/1
2 12
/13
13/1
4 14
/15
15/2
0 11
/12
12/1
3 13
/14
14/1
5 15
/20
Inst
itutio
nal
stre
ngth
enin
g in
stitu
tion
11 5
00
28 7
50
28 7
50
28 7
50
28 7
50
345
000
28 7
50
28 7
50
28 7
50
28 7
50
345
000
28
750
28
750
28
750
28
750
34
5 00
0 BT
VET
Inve
stm
ent
Fund
lu
mps
um
2
760
2 76
0 46
000
2
760
2 76
0 46
000
2 76
0 2
760
46 0
00
Stak
ehol
der W
S,
aver
age
pers
on d
ay
0,15
50
50
8 8
8 8
IC
T co
mpu
ter
3,45
50
0 1
250
1 25
0 1
250
7 50
0 1
725
4 31
3 4
313
4 31
3 25
875
1 72
5 4
313
4 31
3 4
313
25 8
75
Tota
l Cos
ts
30
483
33
070
35
823
35
823
41
6 87
5
30 4
83
33 0
70
35 8
23
35 8
23
416
875
Stra
tegy
2.2
: BTV
ET in
stru
ctor
s/tu
tors
Su
b-St
rate
gy 2
.2.1
: Ins
titut
iona
l cap
aciti
es fo
r ins
truct
ors/
tuto
rs tr
aini
ng
Cost
item
Un
it Un
it co
st
Num
ber o
f uni
ts -
or lu
mp
sum
cos
ts
Tota
l cos
ts
of w
hich
recu
rren
t of
whi
ch d
evel
opm
ent
Ph
ase
I Ph
ase
II Ph
ase
I Ph
ase
II Ph
ase
I Ph
ase
II Ph
ase
I Ph
ase
II
11
/12
12/1
3 13
/14
14/1
5 15
/20
11/1
2 12
/13
13/1
4 14
/15
15/2
0 11
/12
12/1
3 13
/14
14/1
5 15
/20
11/1
2 12
/13
13/1
4 14
/15
15/2
0 TA
nat
iona
l pe
rson
mon
th
23,0
0 2
2 2
2 10
46
46
46
46
23
0
46
46
46
46
230
TA in
tern
atio
nal
pers
on m
onth
57
,50
1 1
1 1
5 58
58
58
58
28
8
58
58
58
58
288
Com
preh
ensi
ve
inst
itutio
nal
stre
ngth
enin
g in
cl
curr
icul
um d
evel
op
and
mas
ter t
rain
ers
train
ing
inst
itutio
n
11 5
00,0
0 8
625
8 62
5 8
625
8 62
5 23
000
8
625
8 62
5 8
625
8 62
5 23
000
8 62
5 8
625
8 62
5 8
625
23 0
00
Trai
ning
of m
aste
r tra
iner
s ov
erse
as
mas
ter t
rain
er
57,5
0
10
0
5
750
5
750
Tota
l Cos
ts
8
729
8 72
9 8
729
8 72
9 29
268
8 72
9 8
729
8 72
9 8
729
29 2
68
Sub-
Stra
tegy
2.2
.2: I
ncre
ase
avai
labi
lity
of B
TVET
inst
ruct
ors/
tuto
rs
Cost
item
Un
it Un
it co
st
Num
ber o
f uni
ts -
or lu
mp
sum
cos
ts
Tota
l cos
ts
of w
hich
recu
rren
t of
whi
ch d
evel
opm
ent
Ph
ase
I Ph
ase
II Ph
ase
I Ph
ase
II Ph
ase
I Ph
ase
II Ph
ase
I Ph
ase
II
11
/12
12/1
3 13
/14
14/1
5 15
/20
11/1
2 12
/13
13/1
4 14
/15
15/2
0 11
/12
12/1
3 13
/14
14/1
5 15
/20
11/1
2 12
/13
13/1
4 14
/15
15/2
0 Cu
rric
ulum
de
velo
pmen
t par
t of
inst
itutio
nal
stre
ngth
enin
g
In
stru
ctor
s tr
aini
ng,
capi
tatio
n gr
ant
inst
ruct
or/y
ear
spec
ial
calc
ulat
ion
647
870
1 13
1 1
435
13 7
35
647
870
1 13
1 1
435
13 7
35
647
870
1 13
1 1
435
13 7
35
In-s
ervi
ce tr
aini
ng o
f in
stru
ctor
s in
stru
ctor
/ pr
ogra
mm
e 2,
00
250
500
500
500
500
500
1 00
0 1
000
1 00
0 1
000
50
0 1
000
1 00
0 1
000
1 00
0 As
sess
men
t of
inst
ruct
ors
asse
ssm
ent
0,65
84
9 1
159
1 22
5 1
297
5 85
4 55
2 75
3 79
6 84
3 3
805
552
753
796
843
3 80
5
Base
-fund
ing
(sal
arie
s) IT
Is
TA n
atio
nal
pers
on m
onth
23
,00
6 6
6 6
12
138
138
138
138
276
13
8 13
8 13
8 13
8 27
6 TA
inte
rnat
iona
l pe
rson
mon
th
57,5
0 3
3 3
3 10
17
3 17
3 17
3 17
3 57
5
173
173
173
173
575
Tota
l Cos
ts
2
009
2 93
4 3
238
3 58
9 19
391
1
199
1 62
3 1
927
2 27
8 17
540
81
1 1
311
1 31
1 1
311
1 85
1
Sub-
Stra
tegy
2.2
.3: D
ereg
ulat
e re
crui
tmen
t and
dep
loym
ent
Cost
item
Un
it Un
it co
st
Num
ber o
f uni
ts -
or lu
mp
sum
cos
ts
Tota
l cos
ts
of w
hich
recu
rren
t of
whi
ch d
evel
opm
ent
12
3
Ph
ase
I Ph
ase
II Ph
ase
I Ph
ase
II Ph
ase
I Ph
ase
II Ph
ase
I Ph
ase
II
11
/12
12/1
3 13
/14
14/1
5 15
/20
11/1
2 12
/13
13/1
4 14
/15
15/2
0 11
/12
12/1
3 13
/14
14/1
5 15
/20
11/1
2 12
/13
13/1
4 14
/15
15/2
0 TA
nat
iona
l pe
rson
mon
th
23,0
0 4
4
92
92
92
92
TA
inte
rnat
iona
l pe
rson
mon
th
57,5
0 3
3
173
173
173
173
St
akeh
olde
r WS,
av
erag
e pe
rson
day
0,
15
80
100
12
15
12
15
Com
mun
icat
ion
lum
p su
m
50
50
50
50
20
0 50
50
50
50
20
0
50
50
50
50
200
Ince
ntiv
e sc
hem
e fo
r in
dust
ry
lum
p su
m
In
cent
ives
for B
TVET
in
stru
ctor
s lu
mp
sum
4 60
0 5
060
5 56
6 6
123
41 1
17
4 60
0 5
060
5 56
6 6
123
41 1
17
4 60
0 5
060
5 56
6 6
123
41 1
17
Tota
l Cos
ts
4
927
5 39
0 5
616
6 17
3 41
317
4
600
5 06
0 5
566
6 12
3 41
117
32
7 33
0 50
50
20
0
Stra
tegy
2.3
: Qua
lity
assu
ranc
e Su
b-St
rate
gy 2
.3.1
: Acc
redi
tatio
n sy
stem
Cost
item
Un
it Un
it co
st
Num
ber o
f uni
ts -
or lu
mp
sum
cos
ts
Tota
l cos
ts
of w
hich
recu
rren
t of
whi
ch d
evel
opm
ent
Ph
ase
I Ph
ase
II Ph
ase
I Ph
ase
II Ph
ase
I Ph
ase
II Ph
ase
I Ph
ase
II
11
/12
12/1
3 13
/14
14/1
5 15
/20
11/1
2 12
/13
13/1
4 14
/15
15/2
0 11
/12
12/1
3 13
/14
14/1
5 15
/20
11/1
2 12
/13
13/1
4 14
/15
15/2
0 TA
nat
iona
l pe
rson
mon
th
23,0
0
3 5
5 5
69
11
5 11
5 11
5
69
11
5 11
5 11
5 TA
inte
rnat
iona
l pe
rson
mon
th
57,5
0
2 4
2
11
5 23
0 11
5
115
230
115
St
akeh
olde
r WS,
av
erag
e pe
rson
day
0,
15
50
8
8
St
udy
tour
1
pers
on w
eek
9,50
10
95
95
Web
site
dev
elop
men
t w
ebsi
te
23,0
0
1
23
23
In
crea
se in
sta
ff es
tabl
. pro
fess
iona
l po
sitio
n/ye
ar
8,50
1 5
9
43
9
43
So
ftwar
e/sy
stem
ac
cred
itatio
n lu
mp
sum
23
0
23
0
230
Tota
l Cos
ts
287
368
469
158
9
43
28
7 36
8 46
0 11
5
Sub-
Stra
tegy
2.3
.2: I
QM
Cost
item
Un
it Un
it co
st
Num
ber o
f uni
ts -
or lu
mp
sum
cos
ts
Tota
l cos
ts
of w
hich
recu
rren
t of
whi
ch d
evel
opm
ent
Ph
ase
I Ph
ase
II Ph
ase
I Ph
ase
II Ph
ase
I Ph
ase
II Ph
ase
I Ph
ase
II
11
/12
12/1
3 13
/14
14/1
5 15
/20
11/1
2 12
/13
13/1
4 14
/15
15/2
0 11
/12
12/1
3 13
/14
14/1
5 15
/20
11/1
2 12
/13
13/1
4 14
/15
15/2
0 TA
nat
iona
l pe
rson
mon
th
23,0
0
8
10
40
184
230
920
18
4 23
0 92
0 TA
inte
rnat
iona
l pe
rson
mon
th
57,5
0
5
5 10
28
8 28
8 57
5
288
288
575
Stak
ehol
der W
S,
aver
age
pers
on d
ay
0,15
10
0
15
15
Stud
y to
ur
1 pe
rson
wee
k 9,
50
10
95
95
Sy
stem
dev
elop
men
t IQ
M
lum
p su
m
230
230
23
0
Trai
ning
wor
ksho
p 1
pers
on w
eek
0,81
40
100
32
81
32
81
Tota
l Cos
ts
58
2 78
0 1
576
58
2 78
0 1
576
Obje
ctiv
e 3
Stra
tegy
3.1
: Acc
ess
to fo
rmal
and
non
-form
al B
TVET
Cost
item
Un
it Un
it co
st
Num
ber o
f uni
ts -
or lu
mp
sum
cos
ts
Tota
l cos
ts
of w
hich
recu
rren
t of
whi
ch d
evel
opm
ent
128Skilling Uganda - BTVET Strategic Plan 2012/3-2021/2

12
3
Ph
ase
I Ph
ase
II Ph
ase
I Ph
ase
II Ph
ase
I Ph
ase
II Ph
ase
I Ph
ase
II
11
/12
12/1
3 13
/14
14/1
5 15
/20
11/1
2 12
/13
13/1
4 14
/15
15/2
0 11
/12
12/1
3 13
/14
14/1
5 15
/20
11/1
2 12
/13
13/1
4 14
/15
15/2
0 TA
nat
iona
l pe
rson
mon
th
23,0
0 4
4
92
92
92
92
TA
inte
rnat
iona
l pe
rson
mon
th
57,5
0 3
3
173
173
173
173
St
akeh
olde
r WS,
av
erag
e pe
rson
day
0,
15
80
100
12
15
12
15
Com
mun
icat
ion
lum
p su
m
50
50
50
50
20
0 50
50
50
50
20
0
50
50
50
50
200
Ince
ntiv
e sc
hem
e fo
r in
dust
ry
lum
p su
m
In
cent
ives
for B
TVET
in
stru
ctor
s lu
mp
sum
4 60
0 5
060
5 56
6 6
123
41 1
17
4 60
0 5
060
5 56
6 6
123
41 1
17
4 60
0 5
060
5 56
6 6
123
41 1
17
Tota
l Cos
ts
4
927
5 39
0 5
616
6 17
3 41
317
4
600
5 06
0 5
566
6 12
3 41
117
32
7 33
0 50
50
20
0
Stra
tegy
2.3
: Qua
lity
assu
ranc
e Su
b-St
rate
gy 2
.3.1
: Acc
redi
tatio
n sy
stem
Cost
item
Un
it Un
it co
st
Num
ber o
f uni
ts -
or lu
mp
sum
cos
ts
Tota
l cos
ts
of w
hich
recu
rren
t of
whi
ch d
evel
opm
ent
Ph
ase
I Ph
ase
II Ph
ase
I Ph
ase
II Ph
ase
I Ph
ase
II Ph
ase
I Ph
ase
II
11
/12
12/1
3 13
/14
14/1
5 15
/20
11/1
2 12
/13
13/1
4 14
/15
15/2
0 11
/12
12/1
3 13
/14
14/1
5 15
/20
11/1
2 12
/13
13/1
4 14
/15
15/2
0 TA
nat
iona
l pe
rson
mon
th
23,0
0
3 5
5 5
69
11
5 11
5 11
5
69
11
5 11
5 11
5 TA
inte
rnat
iona
l pe
rson
mon
th
57,5
0
2 4
2
11
5 23
0 11
5
115
230
115
St
akeh
olde
r WS,
av
erag
e pe
rson
day
0,
15
50
8
8
St
udy
tour
1
pers
on w
eek
9,50
10
95
95
Web
site
dev
elop
men
t w
ebsi
te
23,0
0
1
23
23
In
crea
se in
sta
ff es
tabl
. pro
fess
iona
l po
sitio
n/ye
ar
8,50
1 5
9
43
9
43
So
ftwar
e/sy
stem
ac
cred
itatio
n lu
mp
sum
23
0
23
0
230
Tota
l Cos
ts
287
368
469
158
9
43
28
7 36
8 46
0 11
5
Sub-
Stra
tegy
2.3
.2: I
QM
Cost
item
Un
it Un
it co
st
Num
ber o
f uni
ts -
or lu
mp
sum
cos
ts
Tota
l cos
ts
of w
hich
recu
rren
t of
whi
ch d
evel
opm
ent
Ph
ase
I Ph
ase
II Ph
ase
I Ph
ase
II Ph
ase
I Ph
ase
II Ph
ase
I Ph
ase
II
11
/12
12/1
3 13
/14
14/1
5 15
/20
11/1
2 12
/13
13/1
4 14
/15
15/2
0 11
/12
12/1
3 13
/14
14/1
5 15
/20
11/1
2 12
/13
13/1
4 14
/15
15/2
0 TA
nat
iona
l pe
rson
mon
th
23,0
0
8
10
40
184
230
920
18
4 23
0 92
0 TA
inte
rnat
iona
l pe
rson
mon
th
57,5
0
5
5 10
28
8 28
8 57
5
288
288
575
Stak
ehol
der W
S,
aver
age
pers
on d
ay
0,15
10
0
15
15
Stud
y to
ur
1 pe
rson
wee
k 9,
50
10
95
95
Sy
stem
dev
elop
men
t IQ
M
lum
p su
m
230
230
23
0
Trai
ning
wor
ksho
p 1
pers
on w
eek
0,81
40
100
32
81
32
81
Tota
l Cos
ts
58
2 78
0 1
576
58
2 78
0 1
576
Obje
ctiv
e 3
Stra
tegy
3.1
: Acc
ess
to fo
rmal
and
non
-form
al B
TVET
Cost
item
Un
it Un
it co
st
Num
ber o
f uni
ts -
or lu
mp
sum
cos
ts
Tota
l cos
ts
of w
hich
recu
rren
t of
whi
ch d
evel
opm
ent
12
4
Ph
ase
I Ph
ase
II Ph
ase
I Ph
ase
II Ph
ase
I Ph
ase
II Ph
ase
I Ph
ase
II
11/1
2 12
/13
13/1
4 14
/15
15/2
0 11
/12
12/1
3 13
/14
14/1
5 15
/20
11/1
2 12
/13
13/1
4 14
/15
15/2
0 11
/12
12/1
3 13
/14
14/1
5 15
/20
Capi
tatio
n gr
ants
/bur
sarie
s fo
rmal
tra
inin
g
extra
cal
cula
tion
13
341
19
085
25
844
33
763
34
1 03
8 13
341
19
085
25
844
33
763
34
1 03
8 13
341
19
085
25
844
33
763
34
1 03
8
Gran
ts n
on-fo
rmal
BTV
ET
prog
ram
me
train
ee/3
-m
onth
0,
35
25 0
00
30 0
00
35 0
00
40 0
00
270
000
8 75
0 10
500
12
250
14
000
94
500
8
750
10 5
00
12 2
50
14 0
00
94 5
00
M
anag
emen
t/M
onito
ring
NFT
lu
mp
sum
10
% o
f co
sts
875
1 05
0 1
225
1 40
0 9
450
875
1 05
0 1
225
1 40
0 9
450
875
1 05
0 1
225
1 40
0 9
450
Tota
l Cos
ts
22
966
30
635
39
319
49
163
44
4 98
8 22
966
30
635
39
319
49
163
44
4 98
8
Stra
tegy
3.2
: Exp
and
priv
ate
prov
isio
n
Cost
item
Un
it Un
it co
st
Num
ber o
f uni
ts -
or lu
mp
sum
cos
ts
Tota
l cos
ts
of w
hich
recu
rren
t of
whi
ch d
evel
opm
ent
Ph
ase
I Ph
ase
II Ph
ase
I Ph
ase
II Ph
ase
I Ph
ase
II Ph
ase
I Ph
ase
II
11
/12
12/1
3 13
/14
14/1
5 15
/20
11/1
2 12
/13
13/1
4 14
/15
15/2
0 11
/12
12/1
3 13
/14
14/1
5 15
/20
11/1
2 12
/13
13/1
4 14
/15
15/2
0 TA
nat
iona
l pe
rson
mon
th
23,0
0 2
2
46
4
46
4
TA
inte
rnat
iona
l pe
rson
mon
th
57,5
0 1
1
58
1
58
1
Surv
ey/s
tudy
st
udy
mon
ths
115,
00
2
23
0
230
Stak
ehol
der W
S,
aver
age
pers
on d
ay
0,15
50
50
10
0 8
8
15
8 8
15
Inve
stm
ent i
ncen
tives
fo
r PTP
lu
mps
um/p
hase
1 15
0 1
150
1 15
0 1
150
5 75
0 1
150
1 15
0 1
150
1 15
0 5
750
1
150
1 15
0 1
150
1 15
0 5
750
Tota
l Cos
ts
1
491
1 16
3 1
150
1 15
0 5
765
1
491
1 16
3 1
150
1 15
0 5
765
Stra
tegy
3.3
: Sup
port/
Expa
nsio
n pu
blic
BTV
ET s
uppl
y
Cost
item
Un
it Un
it co
st
Num
ber o
f uni
ts -
or lu
mp
sum
cos
ts
Tota
l cos
ts
of w
hich
recu
rren
t of
whi
ch d
evel
opm
ent
Ph
ase
I Ph
ase
II Ph
ase
I Ph
ase
II Ph
ase
I Ph
ase
II Ph
ase
I Ph
ase
II
11
/12
12/1
3 13
/14
14/1
5 15
/20
11/1
2 12
/13
13/1
4 14
/15
15/2
0 11
/12
12/1
3 13
/14
14/1
5 15
/20
11/1
2 12
/13
13/1
4 14
/15
15/2
0 Co
nstru
ctio
n/eq
uipp
ing
tech
nica
l ins
titut
e in
stitu
te lu
mp
sum
5
750,
00
4 5
5
23
000
28
750
28
750
23 0
00
28 7
50
28 7
50
Teac
hers
sal
arie
s pu
blic
sy
stem
ye
ar
exra
ca
lcul
atio
n 12
626
13
888
15
277
16
805
11
2 85
5 12
626
13
888
15
277
16
805
11
2 85
5 12
626
13
888
15
277
16
805
11
2 85
5
BTVE
T De
p. in
stitu
tiona
l ov
erhe
ads
lum
p su
m
Base
line
+ 10
%
330
363
399
439
2 95
0 33
0 36
3 39
9 43
9 2
950
330
363
399
439
2 95
0
Tota
l Cos
ts
35
956
43
001
44
426
17
244
11
5 80
5 12
956
14
251
15
676
17
244
11
5 80
5 23
000
28
750
28
750
Stra
tegy
3.4
: Aw
aren
ess
crea
tion
Cost
item
Un
it Un
it co
st
Num
ber o
f uni
ts -
or lu
mp
sum
cos
ts
Tota
l cos
ts
of w
hich
recu
rren
t of
whi
ch d
evel
opm
ent
Ph
ase
I Ph
ase
II Ph
ase
I Ph
ase
II Ph
ase
I Ph
ase
II Ph
ase
I Ph
ase
II
11
/12
12/1
3 13
/14
14/1
5 15
/20
11/1
2 12
/13
13/1
4 14
/15
15/2
0 11
/12
12/1
3 13
/14
14/1
5 15
/20
11/1
2 12
/13
13/1
4 14
/15
15/2
0 TA
nat
iona
l pe
rson
mon
th
23,0
0
2 4
4
46
92
92
46
92
92
St
akeh
olde
r WS,
av
erag
e pe
rson
day
0,
15
50
50
200
8 8
30
8
8 30
Co
mm
unic
atio
n lu
mp
sum
75
75
250
75
75
250
75
75
25
0 Tr
aini
ng w
orks
hop
1 pe
rson
wee
k 0,
81
100
100
500
81
81
403
81
81
40
3
129 Skilling Uganda - BTVET Strategic Plan 2012/3-2021/2

12
5
Tota
l Cos
ts
46
255
255
683
46
255
255
683
Stra
tegy
3.5
: Equ
al p
artic
ipat
ion
of d
isad
vant
aged
Su
b-St
rate
gy 3
.5.1
: Dis
adva
ntag
es g
roup
s
Cost
item
Un
it Un
it co
st
Num
ber o
f uni
ts -
or lu
mp
sum
cos
ts
Tota
l cos
ts
of w
hich
recu
rren
t of
whi
ch d
evel
opm
ent
Ph
ase
I Ph
ase
II Ph
ase
I Ph
ase
II Ph
ase
I Ph
ase
II Ph
ase
I Ph
ase
II
11
/12
12/1
3 13
/14
14/1
5 15
/20
11/1
2 12
/13
13/1
4 14
/15
15/2
0 11
/12
12/1
3 13
/14
14/1
5 15
/20
11/1
2 12
/13
13/1
4 14
/15
15/2
0 TA
nat
iona
l pe
rson
mon
th
23,0
0
3
69
69
TA
inte
rnat
iona
l pe
rson
mon
th
57,5
0
2
11
5
115
St
akeh
olde
r WS,
av
erag
e pe
rson
day
0,
15
10
0
100
15
15
15
15
Tota
l Cos
ts
199
15
199
15
Sub-
Stra
tegy
3.5
.2: F
emal
e pa
rtici
patio
n
Cost
item
Un
it Un
it co
st
Num
ber o
f uni
ts -
or lu
mp
sum
cos
ts
Tota
l cos
ts
of w
hich
recu
rren
t of
whi
ch d
evel
opm
ent
Ph
ase
I Ph
ase
II Ph
ase
I Ph
ase
II Ph
ase
I Ph
ase
II Ph
ase
I Ph
ase
II
11
/12
12/1
3 13
/14
14/1
5 15
/20
11/1
2 12
/13
13/1
4 14
/15
15/2
0 11
/12
12/1
3 13
/14
14/1
5 15
/20
11/1
2 12
/13
13/1
4 14
/15
15/2
0 TA
nat
iona
l pe
rson
mon
th
23,0
0
3
69
69
St
akeh
olde
r WS,
av
erag
e pe
rson
day
0,
15
10
0 10
0 10
0
15
15
15
15
15
15
Co
mm
unic
atio
n lu
mp
sum
50
50
50
50
50
50
50
50
50
In
vest
men
ts fi
nanc
ed
thro
ugh
2.1
Tota
l Cos
ts
134
65
65
13
4 65
65
Sub-
Stra
tegy
3.5
.3: P
WD
Cost
item
Un
it Un
it co
st
Num
ber o
f uni
ts -
or lu
mp
sum
cos
ts
Tota
l cos
ts
of w
hich
recu
rren
t of
whi
ch d
evel
opm
ent
Ph
ase
I Ph
ase
II Ph
ase
I Ph
ase
II Ph
ase
I Ph
ase
II Ph
ase
I Ph
ase
II
11
/12
12/1
3 13
/14
14/1
5 15
/20
11/1
2 12
/13
13/1
4 14
/15
15/2
0 11
/12
12/1
3 13
/14
14/1
5 15
/20
11/1
2 12
/13
13/1
4 14
/15
15/2
0 TA
nat
iona
l pe
rson
mon
th
23,0
0
2 3
46
69
46
69
TA
inte
rnat
iona
l pe
rson
mon
th
57,5
0
1
58
58
St
akeh
olde
r WS,
av
erag
e pe
rson
day
0,
15
50
50
8
8
8
8
12
4
Ph
ase
I Ph
ase
II Ph
ase
I Ph
ase
II Ph
ase
I Ph
ase
II Ph
ase
I Ph
ase
II
11/1
2 12
/13
13/1
4 14
/15
15/2
0 11
/12
12/1
3 13
/14
14/1
5 15
/20
11/1
2 12
/13
13/1
4 14
/15
15/2
0 11
/12
12/1
3 13
/14
14/1
5 15
/20
Capi
tatio
n gr
ants
/bur
sarie
s fo
rmal
tra
inin
g
extra
cal
cula
tion
13
341
19
085
25
844
33
763
34
1 03
8 13
341
19
085
25
844
33
763
34
1 03
8 13
341
19
085
25
844
33
763
34
1 03
8
Gran
ts n
on-fo
rmal
BTV
ET
prog
ram
me
train
ee/3
-m
onth
0,
35
25 0
00
30 0
00
35 0
00
40 0
00
270
000
8 75
0 10
500
12
250
14
000
94
500
8
750
10 5
00
12 2
50
14 0
00
94 5
00
M
anag
emen
t/M
onito
ring
NFT
lu
mp
sum
10
% o
f co
sts
875
1 05
0 1
225
1 40
0 9
450
875
1 05
0 1
225
1 40
0 9
450
875
1 05
0 1
225
1 40
0 9
450
Tota
l Cos
ts
22
966
30
635
39
319
49
163
44
4 98
8 22
966
30
635
39
319
49
163
44
4 98
8
Stra
tegy
3.2
: Exp
and
priv
ate
prov
isio
n
Cost
item
Un
it Un
it co
st
Num
ber o
f uni
ts -
or lu
mp
sum
cos
ts
Tota
l cos
ts
of w
hich
recu
rren
t of
whi
ch d
evel
opm
ent
Ph
ase
I Ph
ase
II Ph
ase
I Ph
ase
II Ph
ase
I Ph
ase
II Ph
ase
I Ph
ase
II
11
/12
12/1
3 13
/14
14/1
5 15
/20
11/1
2 12
/13
13/1
4 14
/15
15/2
0 11
/12
12/1
3 13
/14
14/1
5 15
/20
11/1
2 12
/13
13/1
4 14
/15
15/2
0 TA
nat
iona
l pe
rson
mon
th
23,0
0 2
2
46
4
46
4
TA
inte
rnat
iona
l pe
rson
mon
th
57,5
0 1
1
58
1
58
1
Surv
ey/s
tudy
st
udy
mon
ths
115,
00
2
23
0
230
Stak
ehol
der W
S,
aver
age
pers
on d
ay
0,15
50
50
10
0 8
8
15
8 8
15
Inve
stm
ent i
ncen
tives
fo
r PTP
lu
mps
um/p
hase
1 15
0 1
150
1 15
0 1
150
5 75
0 1
150
1 15
0 1
150
1 15
0 5
750
1
150
1 15
0 1
150
1 15
0 5
750
Tota
l Cos
ts
1
491
1 16
3 1
150
1 15
0 5
765
1
491
1 16
3 1
150
1 15
0 5
765
Stra
tegy
3.3
: Sup
port/
Expa
nsio
n pu
blic
BTV
ET s
uppl
y
Cost
item
Un
it Un
it co
st
Num
ber o
f uni
ts -
or lu
mp
sum
cos
ts
Tota
l cos
ts
of w
hich
recu
rren
t of
whi
ch d
evel
opm
ent
Ph
ase
I Ph
ase
II Ph
ase
I Ph
ase
II Ph
ase
I Ph
ase
II Ph
ase
I Ph
ase
II
11
/12
12/1
3 13
/14
14/1
5 15
/20
11/1
2 12
/13
13/1
4 14
/15
15/2
0 11
/12
12/1
3 13
/14
14/1
5 15
/20
11/1
2 12
/13
13/1
4 14
/15
15/2
0 Co
nstru
ctio
n/eq
uipp
ing
tech
nica
l ins
titut
e in
stitu
te lu
mp
sum
5
750,
00
4 5
5
23
000
28
750
28
750
23 0
00
28 7
50
28 7
50
Teac
hers
sal
arie
s pu
blic
sy
stem
ye
ar
exra
ca
lcul
atio
n 12
626
13
888
15
277
16
805
11
2 85
5 12
626
13
888
15
277
16
805
11
2 85
5 12
626
13
888
15
277
16
805
11
2 85
5
BTVE
T De
p. in
stitu
tiona
l ov
erhe
ads
lum
p su
m
Base
line
+ 10
%
330
363
399
439
2 95
0 33
0 36
3 39
9 43
9 2
950
330
363
399
439
2 95
0
Tota
l Cos
ts
35
956
43
001
44
426
17
244
11
5 80
5 12
956
14
251
15
676
17
244
11
5 80
5 23
000
28
750
28
750
Stra
tegy
3.4
: Aw
aren
ess
crea
tion
Cost
item
Un
it Un
it co
st
Num
ber o
f uni
ts -
or lu
mp
sum
cos
ts
Tota
l cos
ts
of w
hich
recu
rren
t of
whi
ch d
evel
opm
ent
Ph
ase
I Ph
ase
II Ph
ase
I Ph
ase
II Ph
ase
I Ph
ase
II Ph
ase
I Ph
ase
II
11
/12
12/1
3 13
/14
14/1
5 15
/20
11/1
2 12
/13
13/1
4 14
/15
15/2
0 11
/12
12/1
3 13
/14
14/1
5 15
/20
11/1
2 12
/13
13/1
4 14
/15
15/2
0 TA
nat
iona
l pe
rson
mon
th
23,0
0
2 4
4
46
92
92
46
92
92
St
akeh
olde
r WS,
av
erag
e pe
rson
day
0,
15
50
50
200
8 8
30
8
8 30
Co
mm
unic
atio
n lu
mp
sum
75
75
250
75
75
250
75
75
25
0 Tr
aini
ng w
orks
hop
1 pe
rson
wee
k 0,
81
100
100
500
81
81
403
81
81
40
3
130Skilling Uganda - BTVET Strategic Plan 2012/3-2021/2

12
5
Tota
l Cos
ts
46
255
255
683
46
255
255
683
Stra
tegy
3.5
: Equ
al p
artic
ipat
ion
of d
isad
vant
aged
Su
b-St
rate
gy 3
.5.1
: Dis
adva
ntag
es g
roup
s
Cost
item
Un
it Un
it co
st
Num
ber o
f uni
ts -
or lu
mp
sum
cos
ts
Tota
l cos
ts
of w
hich
recu
rren
t of
whi
ch d
evel
opm
ent
Ph
ase
I Ph
ase
II Ph
ase
I Ph
ase
II Ph
ase
I Ph
ase
II Ph
ase
I Ph
ase
II
11
/12
12/1
3 13
/14
14/1
5 15
/20
11/1
2 12
/13
13/1
4 14
/15
15/2
0 11
/12
12/1
3 13
/14
14/1
5 15
/20
11/1
2 12
/13
13/1
4 14
/15
15/2
0 TA
nat
iona
l pe
rson
mon
th
23,0
0
3
69
69
TA
inte
rnat
iona
l pe
rson
mon
th
57,5
0
2
11
5
115
St
akeh
olde
r WS,
av
erag
e pe
rson
day
0,
15
10
0
100
15
15
15
15
Tota
l Cos
ts
199
15
199
15
Sub-
Stra
tegy
3.5
.2: F
emal
e pa
rtici
patio
n
Cost
item
Un
it Un
it co
st
Num
ber o
f uni
ts -
or lu
mp
sum
cos
ts
Tota
l cos
ts
of w
hich
recu
rren
t of
whi
ch d
evel
opm
ent
Ph
ase
I Ph
ase
II Ph
ase
I Ph
ase
II Ph
ase
I Ph
ase
II Ph
ase
I Ph
ase
II
11
/12
12/1
3 13
/14
14/1
5 15
/20
11/1
2 12
/13
13/1
4 14
/15
15/2
0 11
/12
12/1
3 13
/14
14/1
5 15
/20
11/1
2 12
/13
13/1
4 14
/15
15/2
0 TA
nat
iona
l pe
rson
mon
th
23,0
0
3
69
69
St
akeh
olde
r WS,
av
erag
e pe
rson
day
0,
15
10
0 10
0 10
0
15
15
15
15
15
15
Co
mm
unic
atio
n lu
mp
sum
50
50
50
50
50
50
50
50
50
In
vest
men
ts fi
nanc
ed
thro
ugh
2.1
Tota
l Cos
ts
134
65
65
13
4 65
65
Sub-
Stra
tegy
3.5
.3: P
WD
Cost
item
Un
it Un
it co
st
Num
ber o
f uni
ts -
or lu
mp
sum
cos
ts
Tota
l cos
ts
of w
hich
recu
rren
t of
whi
ch d
evel
opm
ent
Ph
ase
I Ph
ase
II Ph
ase
I Ph
ase
II Ph
ase
I Ph
ase
II Ph
ase
I Ph
ase
II
11
/12
12/1
3 13
/14
14/1
5 15
/20
11/1
2 12
/13
13/1
4 14
/15
15/2
0 11
/12
12/1
3 13
/14
14/1
5 15
/20
11/1
2 12
/13
13/1
4 14
/15
15/2
0 TA
nat
iona
l pe
rson
mon
th
23,0
0
2 3
46
69
46
69
TA
inte
rnat
iona
l pe
rson
mon
th
57,5
0
1
58
58
St
akeh
olde
r WS,
av
erag
e pe
rson
day
0,
15
50
50
8
8
8
8
12
5
Tota
l Cos
ts
46
255
255
683
46
255
255
683
Stra
tegy
3.5
: Equ
al p
artic
ipat
ion
of d
isad
vant
aged
Su
b-St
rate
gy 3
.5.1
: Dis
adva
ntag
es g
roup
s
Cost
item
Un
it Un
it co
st
Num
ber o
f uni
ts -
or lu
mp
sum
cos
ts
Tota
l cos
ts
of w
hich
recu
rren
t of
whi
ch d
evel
opm
ent
Ph
ase
I Ph
ase
II Ph
ase
I Ph
ase
II Ph
ase
I Ph
ase
II Ph
ase
I Ph
ase
II
11
/12
12/1
3 13
/14
14/1
5 15
/20
11/1
2 12
/13
13/1
4 14
/15
15/2
0 11
/12
12/1
3 13
/14
14/1
5 15
/20
11/1
2 12
/13
13/1
4 14
/15
15/2
0 TA
nat
iona
l pe
rson
mon
th
23,0
0
3
69
69
TA
inte
rnat
iona
l pe
rson
mon
th
57,5
0
2
11
5
115
St
akeh
olde
r WS,
av
erag
e pe
rson
day
0,
15
10
0
100
15
15
15
15
Tota
l Cos
ts
199
15
199
15
Sub-
Stra
tegy
3.5
.2: F
emal
e pa
rtici
patio
n
Cost
item
Un
it Un
it co
st
Num
ber o
f uni
ts -
or lu
mp
sum
cos
ts
Tota
l cos
ts
of w
hich
recu
rren
t of
whi
ch d
evel
opm
ent
Ph
ase
I Ph
ase
II Ph
ase
I Ph
ase
II Ph
ase
I Ph
ase
II Ph
ase
I Ph
ase
II
11
/12
12/1
3 13
/14
14/1
5 15
/20
11/1
2 12
/13
13/1
4 14
/15
15/2
0 11
/12
12/1
3 13
/14
14/1
5 15
/20
11/1
2 12
/13
13/1
4 14
/15
15/2
0 TA
nat
iona
l pe
rson
mon
th
23,0
0
3
69
69
St
akeh
olde
r WS,
av
erag
e pe
rson
day
0,
15
10
0 10
0 10
0
15
15
15
15
15
15
Co
mm
unic
atio
n lu
mp
sum
50
50
50
50
50
50
50
50
50
In
vest
men
ts fi
nanc
ed
thro
ugh
2.1
Tota
l Cos
ts
134
65
65
13
4 65
65
Sub-
Stra
tegy
3.5
.3: P
WD
Cost
item
Un
it Un
it co
st
Num
ber o
f uni
ts -
or lu
mp
sum
cos
ts
Tota
l cos
ts
of w
hich
recu
rren
t of
whi
ch d
evel
opm
ent
Ph
ase
I Ph
ase
II Ph
ase
I Ph
ase
II Ph
ase
I Ph
ase
II Ph
ase
I Ph
ase
II
11
/12
12/1
3 13
/14
14/1
5 15
/20
11/1
2 12
/13
13/1
4 14
/15
15/2
0 11
/12
12/1
3 13
/14
14/1
5 15
/20
11/1
2 12
/13
13/1
4 14
/15
15/2
0 TA
nat
iona
l pe
rson
mon
th
23,0
0
2 3
46
69
46
69
TA
inte
rnat
iona
l pe
rson
mon
th
57,5
0
1
58
58
St
akeh
olde
r WS,
av
erag
e pe
rson
day
0,
15
50
50
8
8
8
8
12
6
Com
mun
icat
ion
lum
p su
m
40
40
40
40
40
40
PW
D co
mpa
tible
eq
uipm
ent
inst
itutio
n 10
,00
50
50
500
500
500
500
Trai
ning
pro
gram
mes
fin
ance
d th
roug
h 1.
6.4
and
3.1
Tota
l Cos
ts
151
109
500
508
151
109
500
508
Obje
ctiv
e 4
St
rate
gy 4
.1: S
kills
Dev
elop
men
t Bod
y
Cost
item
Un
it Un
it co
st
Num
ber o
f uni
ts -
or lu
mp
sum
cos
ts
Tota
l cos
ts
of w
hich
recu
rren
t of
whi
ch d
evel
opm
ent
Ph
ase
I Ph
ase
II Ph
ase
I Ph
ase
II Ph
ase
I Ph
ase
II Ph
ase
I Ph
ase
II
11/1
2 12
/13
13/1
4 14
/15
15/2
0 11
/12
12/1
3 13
/14
14/1
5 15
/20
11/1
2 12
/13
13/1
4 14
/15
15/2
0 11
/12
12/1
3 13
/14
14/1
5 15
/20
TA n
atio
nal
pers
on
mon
th
23,0
0 2
3 4
4 25
46
69
92
92
57
5
46
69
92
92
575
TA in
tern
atio
nal
pers
on
mon
th
57,5
0 2
2 3
3 10
11
5 11
5 17
3 17
3 57
5
115
115
173
173
575
Stak
ehol
der W
S, a
vera
ge
pers
on d
ay
0,15
10
0 10
0 10
0 10
0 40
0 15
15
15
15
60
15
15
15
15
60
Stud
y to
ur
1 pe
rson
w
eek
9,50
10
15
95
14
3
95
14
3 Sy
stem
dev
elop
men
t SDB
lu
mps
um
46
0
46
0
460
Esta
blis
hmen
t / in
ital
inve
stm
ent
lum
psum
650
650
650
650
Recu
rren
t cos
t SDB
m
onth
s
60
Tota
l Cos
ts
17
6 19
9 37
5 28
0 2
463
650
176
199
375
280
2 46
3
Stra
tegy
4.2
: Dev
olve
aut
horit
y /
incr
ease
acc
ount
abili
ty
Sub-
Stra
tegy
4.2
.1: d
evol
ve a
utho
rity
Cost
item
Un
it Un
it co
st
Num
ber o
f uni
ts -
or lu
mp
sum
cos
ts
Tota
l cos
ts
of w
hich
recu
rren
t of
whi
ch d
evel
opm
ent
Ph
ase
I Ph
ase
II Ph
ase
I Ph
ase
II Ph
ase
I Ph
ase
II Ph
ase
I Ph
ase
II
11
/12
12/1
3 13
/14
14/1
5 15
/20
11/1
2 12
/13
13/1
4 14
/15
15/2
0 11
/12
12/1
3 13
/14
14/1
5 15
/20
11/1
2 12
/13
13/1
4 14
/15
15/2
0 TA
nat
iona
l pe
rson
m
onth
23
,00
3
3 3
12
276
27
6 TA
inte
rnat
iona
l pe
rson
m
onth
57
,50
5
28
8
288
Stak
ehol
der W
S, a
vera
ge
pers
on d
ay
0,15
10
0
15
15
capa
city
bui
ldin
g (tr
aini
ng)
wor
ksho
p 1
pers
on
wee
k 0,
81
90
90
90
30
0
72
72
72
242
72
72
72
242
Mon
itorin
g lu
mp
sum
23
23
69
23
23
69
23
23
69
Tota
l Cos
ts
72
110
95
874
72
110
95
874
Su
b-St
rate
gy 4
.2.2
: inc
reas
e ac
coun
tabi
lity
Cost
item
Un
it Un
it co
st
Num
ber o
f uni
ts -
or lu
mp
sum
cos
ts
Tota
l cos
ts
of w
hich
recu
rren
t of
whi
ch d
evel
opm
ent
Ph
ase
I Ph
ase
II Ph
ase
I Ph
ase
II Ph
ase
I Ph
ase
II Ph
ase
I Ph
ase
II
11
/12
12/1
3 13
/14
14/1
5 15
/20
11/1
2 12
/13
13/1
4 14
/15
15/2
0 11
/12
12/1
3 13
/14
14/1
5 15
/20
11/1
2 12
/13
13/1
4 14
/15
15/2
0 TA
nat
iona
l pe
rson
m
onth
23
,00
2
2
46
46
46
46
TA in
tern
atio
nal
pers
on
mon
th
57,5
0
2 1
11
5 58
11
5 58
St
akeh
olde
r WS,
ave
rage
pe
rson
day
0,
15
10
0
100
15
15
15
15
131 Skilling Uganda - BTVET Strategic Plan 2012/3-2021/2

12
6
Com
mun
icat
ion
lum
p su
m
40
40
40
40
40
40
PW
D co
mpa
tible
eq
uipm
ent
inst
itutio
n 10
,00
50
50
500
500
500
500
Trai
ning
pro
gram
mes
fin
ance
d th
roug
h 1.
6.4
and
3.1
Tota
l Cos
ts
151
109
500
508
151
109
500
508
Obje
ctiv
e 4
St
rate
gy 4
.1: S
kills
Dev
elop
men
t Bod
y
Cost
item
Un
it Un
it co
st
Num
ber o
f uni
ts -
or lu
mp
sum
cos
ts
Tota
l cos
ts
of w
hich
recu
rren
t of
whi
ch d
evel
opm
ent
Ph
ase
I Ph
ase
II Ph
ase
I Ph
ase
II Ph
ase
I Ph
ase
II Ph
ase
I Ph
ase
II
11/1
2 12
/13
13/1
4 14
/15
15/2
0 11
/12
12/1
3 13
/14
14/1
5 15
/20
11/1
2 12
/13
13/1
4 14
/15
15/2
0 11
/12
12/1
3 13
/14
14/1
5 15
/20
TA n
atio
nal
pers
on
mon
th
23,0
0 2
3 4
4 25
46
69
92
92
57
5
46
69
92
92
575
TA in
tern
atio
nal
pers
on
mon
th
57,5
0 2
2 3
3 10
11
5 11
5 17
3 17
3 57
5
115
115
173
173
575
Stak
ehol
der W
S, a
vera
ge
pers
on d
ay
0,15
10
0 10
0 10
0 10
0 40
0 15
15
15
15
60
15
15
15
15
60
Stud
y to
ur
1 pe
rson
w
eek
9,50
10
15
95
14
3
95
14
3 Sy
stem
dev
elop
men
t SDB
lu
mps
um
46
0
46
0
460
Esta
blis
hmen
t / in
ital
inve
stm
ent
lum
psum
650
650
650
650
Recu
rren
t cos
t SDB
m
onth
s
60
Tota
l Cos
ts
17
6 19
9 37
5 28
0 2
463
650
176
199
375
280
2 46
3
Stra
tegy
4.2
: Dev
olve
aut
horit
y /
incr
ease
acc
ount
abili
ty
Sub-
Stra
tegy
4.2
.1: d
evol
ve a
utho
rity
Cost
item
Un
it Un
it co
st
Num
ber o
f uni
ts -
or lu
mp
sum
cos
ts
Tota
l cos
ts
of w
hich
recu
rren
t of
whi
ch d
evel
opm
ent
Ph
ase
I Ph
ase
II Ph
ase
I Ph
ase
II Ph
ase
I Ph
ase
II Ph
ase
I Ph
ase
II
11
/12
12/1
3 13
/14
14/1
5 15
/20
11/1
2 12
/13
13/1
4 14
/15
15/2
0 11
/12
12/1
3 13
/14
14/1
5 15
/20
11/1
2 12
/13
13/1
4 14
/15
15/2
0 TA
nat
iona
l pe
rson
m
onth
23
,00
3
3 3
12
276
27
6 TA
inte
rnat
iona
l pe
rson
m
onth
57
,50
5
28
8
288
Stak
ehol
der W
S, a
vera
ge
pers
on d
ay
0,15
10
0
15
15
capa
city
bui
ldin
g (tr
aini
ng)
wor
ksho
p 1
pers
on
wee
k 0,
81
90
90
90
30
0
72
72
72
242
72
72
72
242
Mon
itorin
g lu
mp
sum
23
23
69
23
23
69
23
23
69
Tota
l Cos
ts
72
110
95
874
72
110
95
874
Su
b-St
rate
gy 4
.2.2
: inc
reas
e ac
coun
tabi
lity
Cost
item
Un
it Un
it co
st
Num
ber o
f uni
ts -
or lu
mp
sum
cos
ts
Tota
l cos
ts
of w
hich
recu
rren
t of
whi
ch d
evel
opm
ent
Ph
ase
I Ph
ase
II Ph
ase
I Ph
ase
II Ph
ase
I Ph
ase
II Ph
ase
I Ph
ase
II
11
/12
12/1
3 13
/14
14/1
5 15
/20
11/1
2 12
/13
13/1
4 14
/15
15/2
0 11
/12
12/1
3 13
/14
14/1
5 15
/20
11/1
2 12
/13
13/1
4 14
/15
15/2
0 TA
nat
iona
l pe
rson
m
onth
23
,00
2
2
46
46
46
46
TA in
tern
atio
nal
pers
on
mon
th
57,5
0
2 1
11
5 58
11
5 58
St
akeh
olde
r WS,
ave
rage
pe
rson
day
0,
15
10
0
100
15
15
15
15
12
7
Mon
itorin
g lu
mp
sum
23
23
23
23
23
23
23
23
23
Tota
l Cos
ts
176
127
38
23
176
127
38
23
Stra
tegy
4.3
: MIS
/ M
&E
Cost
item
Un
it Un
it co
st
Num
ber o
f uni
ts -
or lu
mp
sum
cos
ts
Tota
l cos
ts
of w
hich
recu
rren
t of
whi
ch d
evel
opm
ent
Ph
ase
I Ph
ase
II Ph
ase
I Ph
ase
II Ph
ase
I Ph
ase
II Ph
ase
I Ph
ase
II
11
/12
12/1
3 13
/14
14/1
5 15
/20
11/1
2 12
/13
13/1
4 14
/15
15/2
0 11
/12
12/1
3 13
/14
14/1
5 15
/20
11/1
2 12
/13
13/1
4 14
/15
15/2
0 TA
nat
iona
l pe
rson
m
onth
23
,00
5 5
5 5
15
115
115
115
115
345
11
5 11
5 11
5 11
5 34
5 TA
inte
rnat
iona
l pe
rson
m
onth
57
,50
2 2
2 2
4 11
5 11
5 11
5 11
5 23
0
115
115
115
115
230
Stak
ehol
der W
S, a
vera
ge
pers
on d
ay
0,15
10
0
200
15
30
30
15
St
udy
tour
1
pers
on
wee
k 9,
50
6
57
57
Com
mun
icat
ion
lum
p su
m
57
5
57
5
57
5
WAN
est
ablis
hmen
t st
atio
n 46
0,00
1
46
0
460
W
ebsi
te d
evel
opm
ent
web
site
23
,00
1
23
23
ICT
co
mpu
ter
3,45
500
500
1
725
1 72
5
1
725
1 72
5 In
crea
se in
sta
ff es
tabl
ishm
ent
prof
essi
onal
s po
sitio
n/ye
ar
8,50
10
85
85
Data
col
lect
ion
M&
E lu
mp
sum
60
60
60
60
300
60
60
60
60
300
60
60
60
60
300
Softw
are
MIS
lu
mp
sum
92
92
92
Tota
l Cos
ts
29
0 29
0 36
2 2
590
3 29
0 60
60
60
60
99
0 23
0 23
0 30
2 2
530
2 30
0
132Skilling Uganda - BTVET Strategic Plan 2012/3-2021/2

12
8
Obje
ctiv
e 5:
Fin
anci
ng
St
rate
gy 5
.1: t
rans
fer m
echa
nism
s
Cost
item
Un
it Un
it co
st
Num
ber o
f uni
ts -
or lu
mp
sum
cos
ts
Tota
l cos
ts
of w
hich
recu
rren
t of
whi
ch d
evel
opm
ent
Ph
ase
I Ph
ase
II Ph
ase
I Ph
ase
II Ph
ase
I Ph
ase
II Ph
ase
I Ph
ase
II
11/1
2 12
/13
13/1
4 14
/15
15/2
0 11
/12
12/1
3 13
/14
14/1
5 15
/20
11/1
2 12
/13
13/1
4 14
/15
15/2
0 11
/12
12/1
3 13
/14
14/1
5 15
/20
TA n
atio
nal
pers
on
mon
th
23,0
0
1
1
23
23
TA
inte
rnat
iona
l pe
rson
m
onth
57
,50
1 1
57
,5
57,5
Stak
ehol
der W
S, a
vera
ge
pers
on
day
0,15
50
50
7,5
7,5
St
udy
tour
1 pe
rson
w
eek
9,50
10
95
Tota
l Cos
ts
18
3 88
18
3 88
Stra
tegy
5.2
: inc
reas
e re
sour
ces
Sub-
Stra
tegy
5.2
.1: I
GA
Cost
item
Un
it Un
it co
st
Num
ber o
f uni
ts -
or lu
mp
sum
cos
ts
Tota
l cos
ts
of w
hich
recu
rren
t of
whi
ch d
evel
opm
ent
Ph
ase
I Ph
ase
II Ph
ase
I Ph
ase
II Ph
ase
I Ph
ase
II Ph
ase
I Ph
ase
II
11
/12
12/1
3 13
/14
14/1
5 15
/20
11/1
2 12
/13
13/1
4 14
/15
15/2
0 11
/12
12/1
3 13
/14
14/1
5 15
/20
11/1
2 12
/13
13/1
4 14
/15
15/2
0 TA
nat
iona
l pe
rson
m
onth
23
,00
1
1 1
TA in
tern
atio
nal
pers
on
mon
th
57,5
0
1
St
akeh
olde
r WS,
ave
rage
pe
rson
da
y 0,
15
10
0 10
0 10
0 10
0
15
15
15
15
capa
city
bui
ldin
g (tr
aini
ng)
wor
ksho
p 1 pe
rson
w
eek
0,81
30
40
40
40
24
,15
32,2
32
,2
32,2
St
udy
tour
1 pe
rson
w
eek
9,50
10
95
M
atch
ing
Gran
ts fo
r BTV
ET
inst
itutio
ns
lum
p su
m
45
0
45
0
Tota
l Cos
ts
39,1
5 14
2,2
47,2
49
7,2
39,1
5 14
2,2
47,2
49
7,2
Su
b-St
rate
gy 5
.2.2
: Lev
y
Cost
item
Un
it Un
it co
st
Num
ber o
f uni
ts -
or lu
mp
sum
cos
ts
Tota
l cos
ts
of w
hich
recu
rren
t of
whi
ch d
evel
opm
ent
Ph
ase
I Ph
ase
II Ph
ase
I Ph
ase
II Ph
ase
I Ph
ase
II Ph
ase
I Ph
ase
II
11
/12
12/1
3 13
/14
14/1
5 15
/20
11/1
2 12
/13
13/1
4 14
/15
15/2
0 11
/12
12/1
3 13
/14
14/1
5 15
/20
11/1
2 12
/13
13/1
4 14
/15
15/2
0 TA
nat
iona
l pe
rson
m
onth
23
,00
3 1
1 3
10
69
23
23
69
230
69
23
23
69
23
0 TA
inte
rnat
iona
l pe
rson
m
onth
57
,50
3 1
3
10
172,
5 57
,5
17
2,5
575
17
2,5
57,5
172,
5 57
5 St
akeh
olde
r WS,
ave
rage
pe
rson
da
y 0,
15
100
100
100
100
200
15
15
15
15
30
15
15
15
15
30
St
udy
tour
1 pe
rson
w
eek
9,50
10
95
95
Com
mun
icat
ion
lum
p su
m
1
1 1
1
1 1
1 1
1 1
1 1
Sy
stem
dev
elop
men
t lev
y co
llect
ion
lum
p su
m
120
120
12
0
Runn
ing
cost
levy
col
lect
ion
mon
th
60
133 Skilling Uganda - BTVET Strategic Plan 2012/3-2021/2

12
9
Tota
l Cos
ts
35
2,5
96,5
39
37
7,5
835
35
2,5
96,5
39
37
7,5
835
Stra
tegy
5.3
: SD
F
Cost
item
Un
it Un
it co
st
Num
ber o
f uni
ts -
or lu
mp
sum
cos
ts
Tota
l cos
ts
of w
hich
recu
rren
t of
whi
ch d
evel
opm
ent
Ph
ase
I Ph
ase
II Ph
ase
I Ph
ase
II Ph
ase
I Ph
ase
II Ph
ase
I Ph
ase
II
Conc
epts
, con
sulta
tion
and
CB
11/1
2 12
/13
13/1
4 14
/15
15/2
0 11
/12
12/1
3 13
/14
14/1
5 15
/20
11/1
2 12
/13
13/1
4 14
/15
15/2
0 11
/12
12/1
3 13
/14
14/1
5 15
/20
TA n
atio
nal
pers
on
mon
th
23,0
0 1
1
6
23
23
138
23
23
13
8 TA
inte
rnat
iona
l pe
rson
m
onth
57
,50
1 1
6 57
,5
57,5
34
5
57,5
57
,5
345
Stak
ehol
der W
S, a
vera
ge
pers
on
day
0,15
50
50
40
0
7,5
7,
5 60
7,
5
7,5
60
Stud
y to
ur
1 pers
on
wee
k 9,
50
10
95
95
Co
mm
unic
atio
n lu
mp
sum
1 1
1 1
1
1 1
1
1
1 1
1
Man
agem
ent s
yste
m S
DF
lum
p su
m
120
12
0
12
0
12
0
12
0
Runn
ing
Cost
SDF
m
onth
60
Tota
l Cos
ts
20
1,5
89
96
128,
5 54
3
201,
5 89
96
12
8,5
543
12
9
Tota
l Cos
ts
35
2,5
96,5
39
37
7,5
835
35
2,5
96,5
39
37
7,5
835
Stra
tegy
5.3
: SD
F
Cost
item
Un
it Un
it co
st
Num
ber o
f uni
ts -
or lu
mp
sum
cos
ts
Tota
l cos
ts
of w
hich
recu
rren
t of
whi
ch d
evel
opm
ent
Ph
ase
I Ph
ase
II Ph
ase
I Ph
ase
II Ph
ase
I Ph
ase
II Ph
ase
I Ph
ase
II
Conc
epts
, con
sulta
tion
and
CB
11/1
2 12
/13
13/1
4 14
/15
15/2
0 11
/12
12/1
3 13
/14
14/1
5 15
/20
11/1
2 12
/13
13/1
4 14
/15
15/2
0 11
/12
12/1
3 13
/14
14/1
5 15
/20
TA n
atio
nal
pers
on
mon
th
23,0
0 1
1
6
23
23
138
23
23
13
8 TA
inte
rnat
iona
l pe
rson
m
onth
57
,50
1 1
6 57
,5
57,5
34
5
57,5
57
,5
345
Stak
ehol
der W
S, a
vera
ge
pers
on
day
0,15
50
50
40
0
7,5
7,
5 60
7,
5
7,5
60
Stud
y to
ur
1 pers
on
wee
k 9,
50
10
95
95
Co
mm
unic
atio
n lu
mp
sum
1 1
1 1
1
1 1
1
1
1 1
1
Man
agem
ent s
yste
m S
DF
lum
p su
m
120
12
0
12
0
12
0
12
0
Runn
ing
Cost
SD
F m
onth
60
Tota
l Cos
ts
20
1,5
89
96
128,
5 54
3
201,
5 89
96
12
8,5
543
12
8
Obje
ctiv
e 5:
Fin
anci
ng
St
rate
gy 5
.1: t
rans
fer m
echa
nism
s
Cost
item
Un
it Un
it co
st
Num
ber o
f uni
ts -
or lu
mp
sum
cos
ts
Tota
l cos
ts
of w
hich
recu
rren
t of
whi
ch d
evel
opm
ent
Ph
ase
I Ph
ase
II Ph
ase
I Ph
ase
II Ph
ase
I Ph
ase
II Ph
ase
I Ph
ase
II
11/1
2 12
/13
13/1
4 14
/15
15/2
0 11
/12
12/1
3 13
/14
14/1
5 15
/20
11/1
2 12
/13
13/1
4 14
/15
15/2
0 11
/12
12/1
3 13
/14
14/1
5 15
/20
TA n
atio
nal
pers
on
mon
th
23,0
0
1
1
23
23
TA
inte
rnat
iona
l pe
rson
m
onth
57
,50
1 1
57
,5
57,5
Stak
ehol
der W
S, a
vera
ge
pers
on
day
0,15
50
50
7,5
7,5
St
udy
tour
1 pe
rson
w
eek
9,50
10
95
Tota
l Cos
ts
18
3 88
18
3 88
Stra
tegy
5.2
: inc
reas
e re
sour
ces
Sub-
Stra
tegy
5.2
.1: I
GA
Cost
item
Un
it Un
it co
st
Num
ber o
f uni
ts -
or lu
mp
sum
cos
ts
Tota
l cos
ts
of w
hich
recu
rren
t of
whi
ch d
evel
opm
ent
Ph
ase
I Ph
ase
II Ph
ase
I Ph
ase
II Ph
ase
I Ph
ase
II Ph
ase
I Ph
ase
II
11
/12
12/1
3 13
/14
14/1
5 15
/20
11/1
2 12
/13
13/1
4 14
/15
15/2
0 11
/12
12/1
3 13
/14
14/1
5 15
/20
11/1
2 12
/13
13/1
4 14
/15
15/2
0 TA
nat
iona
l pe
rson
m
onth
23
,00
1
1 1
TA in
tern
atio
nal
pers
on
mon
th
57,5
0
1
St
akeh
olde
r WS,
ave
rage
pe
rson
da
y 0,
15
10
0 10
0 10
0 10
0
15
15
15
15
capa
city
bui
ldin
g (tr
aini
ng)
wor
ksho
p 1 pe
rson
w
eek
0,81
30
40
40
40
24
,15
32,2
32
,2
32,2
St
udy
tour
1 pe
rson
w
eek
9,50
10
95
M
atch
ing
Gra
nts
for B
TVET
in
stitu
tions
lu
mp
sum
450
450
Tota
l Cos
ts
39,1
5 14
2,2
47,2
49
7,2
39,1
5 14
2,2
47,2
49
7,2
Su
b-St
rate
gy 5
.2.2
: Lev
y
Cost
item
Un
it Un
it co
st
Num
ber o
f uni
ts -
or lu
mp
sum
cos
ts
Tota
l cos
ts
of w
hich
recu
rren
t of
whi
ch d
evel
opm
ent
Ph
ase
I Ph
ase
II Ph
ase
I Ph
ase
II Ph
ase
I Ph
ase
II Ph
ase
I Ph
ase
II
11
/12
12/1
3 13
/14
14/1
5 15
/20
11/1
2 12
/13
13/1
4 14
/15
15/2
0 11
/12
12/1
3 13
/14
14/1
5 15
/20
11/1
2 12
/13
13/1
4 14
/15
15/2
0 TA
nat
iona
l pe
rson
m
onth
23
,00
3 1
1 3
10
69
23
23
69
230
69
23
23
69
23
0 TA
inte
rnat
iona
l pe
rson
m
onth
57
,50
3 1
3
10
172,
5 57
,5
17
2,5
575
17
2,5
57,5
172,
5 57
5 St
akeh
olde
r WS,
ave
rage
pe
rson
da
y 0,
15
100
100
100
100
200
15
15
15
15
30
15
15
15
15
30
St
udy
tour
1 pe
rson
w
eek
9,50
10
95
95
Com
mun
icat
ion
lum
p su
m
1
1 1
1
1 1
1 1
1 1
1 1
Sy
stem
dev
elop
men
t lev
y co
llect
ion
lum
p su
m
120
120
12
0
Runn
ing
cost
levy
col
lect
ion
mon
th
60
134Skilling Uganda - BTVET Strategic Plan 2012/3-2021/2

13
0
Refo
rm T
ask
Forc
e26
Cost
item
Un
it Un
it co
st
Num
ber o
f uni
ts -
or lu
mp
sum
cos
ts
Tota
l cos
ts
Ph
ase
I Ph
ase
I
11
/12
12/1
3 13
/14
14/1
5 11
/12
12/1
3 13
/14
14/1
5
Task
For
ce
lum
p su
m
150,
00
1 1
1 1
150
150
150
150
TA n
atio
nal
pers
on m
onth
12
,00
24
24
24
24
288
288
288
288
TA in
tern
atio
nal
pers
on m
onth
57
,50
8 8
8 8
460
460
460
460
Oper
atio
nal c
ost
lum
psum
45
45
45
45
45
45
45
45
Vehi
cle
vehi
cle
80,0
0 1
80
0
0 0
Com
mun
icat
ion
lu
mps
um
3
3 3
3 3
3 3
3
Tota
l Cos
ts
1 02
6 94
6 94
6 94
6
26N
ote:
the
Gov
ernm
ent s
ubse
quen
tly d
ecid
ed th
at th
e Pl
an p
erio
d sh
ould
be
2012
/3 to
202
1/22
. Th
e da
tes i
n th
e an
nexe
s hav
e be
en c
onve
rted
yet t
o th
is n
ew sc
hedu
le.
26 N
ote:
the
Gov
ernm
ent s
ubse
quen
tly d
ecid
ed th
at th
e Pl
an p
erio
d sh
ould
be
2012
/3 to
202
1/22
. Th
e da
tes
in th
e an
nexe
s ha
ve b
een
conv
erte
d ye
t to
this
new
sch
edul
e.
135 Skilling Uganda - BTVET Strategic Plan 2012/3-2021/2