sky analyzer for asterix user manual
TRANSCRIPT

Sky Analyzer for ASTERIX User Manual
Sky Analyzer for ASTERIX User Manual1. Introduction
1.1 Overview1.2 Features
1.2.1 Categories1.2.2 User Application Profile1.2.3 File Formats1.2.4 Comm-B Data Selector1.2.5 Data Inspection1.2.6 Data Analyze1.2.7 Data Export1.2.8 Support Tools
1.3 Manual Structure1.4 Copyrights
2 Getting Started2.1 User Interface2.2 ASTERIX Step by Step
2.2.1 STEP 1. Prepare file with ASTERIX data2.2.2 STEP 2. Open and load file2.2.3 STEP 3. Decode data2.2.4 STEP 4. Inspect data2.2.5 STEP 5. Find data with filter2.2.6 STEP 6. Export data
3 User Interface3.1 Introduction
3.1.1 Title Bar3.1.2 Menu Bar3.1.3 Tool Bar3.1.4 Status Bar3.1.5 Main View
3.2 Message View3.2.1 Packet List3.2.2 ASTERIX Tree3.2.3 Raw Data Display3.2.4 Detail Display
3.3 Target List View4 Filter
4.1 Introduction4.2 Simple Filter
4.2.1 Syntax4.3 Lua Filter
4.3.1 Syntax5 File Converter
5.1 Introduction5.2 Usage
5.2.1 Input5.2.2 Output5.2.3 Information
6 Export to Google Earth KML6.1 Introduction6.2 OperationResult

7 Radar Coverage Analyze7.1 Introduction7.2 Preparation7.3 Main Window
7.3.1 Actions7.3.2 Statistics
7.4 Configuration Window8 Radar North Marker & Sector Missing Analyze
8.1 Introduction8.2 Preparation8.3 User Interface
9 Message Transmission Delay Analyze9.1 Introduction9.2 Preparation9.3 User Interface
1. Introduction
1.1 Overview
Sky Analyzer for ASTERIX is a powerful tool to open, decode, analyze and inspect surveillancedata in Eurocontrol All Purpose STructured Eurocontrol SuRveillance Information EXchange(ASTERIX) format.
Sky Analyzer for ASTERIX allows you not only read ASTERIX data, but also make further analyzeron it.
It can also work with other tools, and give you a full capability from data recording, inspection,analyzing to modification, generation and simulation.
1.2 Features
1.2.1 Categories

Category Title Version
CAT001 Monoradar Target Reports 1.0
CAT002 Monoradar Service Messages 1.0
CAT004 Safety Net Messages 1.1
CAT008 Transmission of Monoradar Derived Weather Information 1.0
CAT010 Transmission of Monosensor Surface Movement Data 1.1
CAT019 Multilateration System Status Messages 1.2
CAT020 MLT Messages 1.7, 1.8
CAT021 ADS-B Messages 0.23, 0.26, 2.1
CAT023 CNS/ATM Ground Station and Service Status Reports 1.2
CAT034 Transmission of Monoradar Service Messages 1.27
CAT048 Transmission of Monoradar Target Reports 1.15
CAT062 SDPS Track Messages 1.7
The ASTERIX format defines different category for different type of surveillance.
Sky Analyzer for ASTERIX supports all commonly used ASTERIX categories, and different versionsof some category. It will continue expand its capability to support more categories in future.
The supported categories and versions are:
Note: Most categories are backward compatible, which means if the version of your data islower or equal to the version listed in the table above, it can be correctly decoded. CAT021is one exception of this backward compatibility.
1.2.2 User Application Profile
The ASTERIX standard defines all possible data items, but the existence and order of these dataitems are defined by User Application Profile (UAP).
Sky Analyzer for ASTERIX supports all standard UAP, and some widely used property UAPsdefined by major ATC vendors.
The supported UAPs are:
Standard UAPProprietary UAP of Raytheon radarProprietary UAP of Thales ADS-B
Further more, Sky Analyzer for ASTERIX is able to analyze the data and automatically select aproper UAP to decode it. Normally user don't need to worry about UAP selection.
1.2.3 File Formats
Sky Analyzer for ASTERIX supports a various of different file formats, including both open andproperty format. It can read and analyze data from all supported file format, there is also one FileConvertor tool to make conversion between these formats.

The supported file formats are:
XML Recording File (.rex)Compressed XML Recording File (.rez .rex.xz)Binary Recording File Version 2 (.reb)Recording Index File (.rei)tcpdump/Wireshark Capture File (.pcap)Raw ASTERIX Data Stream (.ast .bin)Indra ATM System Recording FileThales ATM System Recording FileSiATM ATM System Log FileAirNet ATM System Log FileIndra Radar Recording File
Note: Some formats listed above may not appear in your application, it depends on yourlicense type.
Note: Some more proprietary formats are not listed here and supported only incustomized/OEM version. Please contact us if you are interested in supporting proprietaryfile format.
1.2.4 Comm-B Data Selector
Sky Analyzer for ASTERIX is capable to decode Comm-B Data Selector (BDS) data embeded insome data items. It is useful as some important data (e.g. FMS selected altitude) is not defined byASTERIX and the only way to retrieve it is from BDS.
The supported BDS are:
BDS 1,0 - Data Link Capability ReportBDS 2,0 - Aircraft IdentificationBDS 3,0 - TCAS/ACAS Active Resolution AdvisoryBDS 4,0 - Selected Vertical IntentionBDS 5,0 - Track and Turn ReportBDS 6,0 - Heading and Speed Report
1.2.5 Data Inspection
Sky Analyzer for ASTERIX has friendly HMI and allows you read, decode and inspect data.
It supports different types of data sources, including
Recording fileLANSynchronous serial line
And it supports different types of data frame, including
Raw data without frameHDLCUDPProprietary frame type
And there are two views to visually display data
Message view, to display data frame/block/record/item in a tree structureTarget list view, to display data record in a table structure

Also there is a powerful scriptable function allows you find and show only data you areinterested.
1.2.6 Data Analyze
Apart from viewing the data, Sky Analyzer for ASTERIX has a set of tools to make further analyzeon surveillance data.
Radar north marker & sector missing Analyze tool, allows you to analyze the continuity ofradar rotation reports;Radar coverage analyze tool, allows you to generate radar coverage map by using realhistory data;ADS-B receiver coverage analyze tool, allows you to generate ADS-B receiver coverage mapfor a single ground station by using real history data;ADS-B network coverage analyze tool, allows you to generate ADS-B coverage map for aADS-B ground station network by using real history data;Message transmission delay analyze tool, allows you to detect transmission delay problem.
1.2.7 Data Export
Data and analyze result can be exported into different formats, including
C/C++ structMicrosoft Excel CSVGoogle Earth KMLHTMLAdobe PDF
1.2.8 Support Tools
There is also a set of tools to expand the capability of Sky Analyzer for ASTERIX, including
File Convertor, to make conversion between different data file formats;Sky Recorder, a generic purpose tool to record and replay data;Sky Playback, a multi channel data playback tool, specially designed to reply ASTERIX data;Sky Simulator, an ASTERIX data simulation tool;Sky Converter, a radar front-end processor tool to filter, modify and convert live radar data;Sky Display, an ATC surveillance data display terminal.
Note: Some of above tools are not free and need to be purchased separately.
1.3 Manual Structure
This manual is divided into several sections.
Part 1. Data Inspection
Chapter 1 IntroductionChapter 2 Getting StartedChapter 3 User InterfaceChapter 4 Filter
Part 2. Data Manipulation
Chapter 5 File ConverterChapter 6 Export to Google Earth KML
Part 3. Data Analyze

Chapter 7 Radar Coverage AnalyzeChapter 8 Radar North Marker & Sector Missing AnalyzeChapter 9 Message Transmission Delay Analyze
1.4 Copyrights
Sky Analyzer for ASTERIX is a product of Aerosys Corporation, please contact [email protected] formore information.
2 Getting Started
2.1 User Interface
Sky Analyzer for ASTERIX has a modern and easy to use user interface. The main windowcomposes of menu bar, tool bars, status bar and main view.
All functions can be accessed through main menu, and major functions can be accessed throughtool bar.
Detailed information of user interface can be accessed at chapter "User Interface".
2.2 ASTERIX Step by Step
A typical way of using Sky Analyzer for ASTERIX is to open and analyze data in recorded file.Below is an example to show how to do it step by step.
2.2.1 STEP 1. Prepare file with ASTERIX data
Sky Analyzer for ASTERIX supports different \ref sec_feature_file.
You can use the Data Recording and Playback tool to record and generate recording files. You canalso use common tools like Wireshark or tcpdump to generate recording tiles.
Here, assuming we already have a data file named "radar.rex".
2.2.2 STEP 2. Open and load file

Launch the Sky Analyzer for ASTERIX application, select File -> Open File..., a standard Open FileDialog will appear.
Browse and select our data file "radar.rex".
In the left panel in main window, many data packets contained in the data file will be shown. Asequence number, time stamp, and size of data packet will be displayed.
In the title bar, the file name will be displayed.
If you don't need to load all packets contained in the data file, you can select File -> StopProcessing to stop the file loading process at any time.
2.2.3 STEP 3. Decode data
If the data packet contained in data file use default frame type (no frame) and default UAP(ASTERIX standard UAP), you can simply select one data packet, and the data block/record/itemwill be shown in the middle panel. Also the radar data of this packet will be shown in hex formatin the top-right panel.

If you select any data record or data item in middle panel, the detail of this data record/item willshown in the bottom-right panel.
Also please note the data of selected data record/item will be highlighted.
On the other hand, if data packet is not in default frame type and UAP, it can not be correctllydecoded before you select correct one.
You can select View -> Frame to select frame type, and select View -> UAP to select UAP.

For UAP, if Auto UAP is selected, Sky Analyzer for ASTERIX will try to guess what is the correct UAPand try to decode data with it, but sometimes it may fail and select a wrong UAP, in this case youshould manually select a proper UAP and force the system to decode data with selected UAP.
2.2.4 STEP 4. Inspect data
Once data is correctly decoded, you can use tree view and list view to inspect the detail ofASTERIX data.
2.2.5 STEP 5. Find data with filter
Normally, you will receive a plenty of data packets from a sensor even in a short time.
And a typical task to analyze ASTERIX is to find flights match some specific conditions. Forexample, flights with hijack alert. You can do this in an easy way by using the Filter function.
Here we try to trace flight "KTK2422". Type "callsign = KTK2422" in the filter toolbar, and pressApply, packets contain flight "KTK2422" will be shown in the UI.

For advanced use of Filter function, please refer to chapter "Filter".
2.2.6 STEP 6. Export data
Once you had find some data you are interested, you can then export and save it in otherformats. Here we export the historical data of flight "KTK2422.
Select File -> Export Track List as CSV..., a standard File Save Dialog will appear, you can browse andsave track list as a CSV file.
Later, you can use Microsoft Excel or other compatible application to open and edit this file.
Similarly, you can export datil ASTERIX fields to Adobe PDF format, and view/print it with "AdobeReader* or other compatible application.
3 User Interface
3.1 Introduction

Sky Analyzer for ASTERIX has a modern and easy to use user interface. The main windowcomposes of menu bar, tool bars, status bar and main view. All functions can be accessedthrough main menu, and major functions can be accessed through tool bar.
3.1.1 Title Bar
Title bar is on top of main window.
If a file is loaded, file name will be shown in title bar; if live UDP multicast is enabled, IP addressand port number will be shown in title bar.
3.1.2 Menu Bar
Menu bar is below title bar. All functions can be accessed through cascade menu.

Menu/Submenu Menuitem Description Note
File Open File...Open data file andload data packets
Close File Close data file
Capture ...Capture live datafrom network
Stop CaptureStop capturing livedata from file ornetwork
Data captured before willbe kept
Save Data asXTML...
Export displayeddata into XML formatfile
Save Data asC/C++Struct...
Export selected datainto C struct
Below is a list of menu/submenu of Sky Analyzer for ASTERIX with description of each menuitems.

Menu/Submenu Menuitem Description Note
Export TrackList as CSV...
Export displayed listin track view into CSVformat file
Compatible with MicrosoftExcel
ExportTracks toGoogle EarthKML...
Export displayedtracks into GoogleEarth KML format file
See detail in relativesection
Save DetailDescriptionas HTML...
Export displayedASTERIX detail intoHTML format file
Save DetailDescriptionas PDF...
Export displayedASTERIX detail intoPDF format file
ExitExit Analyzerapplication
ViewMessageView
Switch main UI tomessage view
See detail in relativesection
Target ListView
Switch main UI totarget list view
See detail in relativesection
FrameSelect frame type todecode data
UAPSelect UAP to decodedata
Apply Filter Apply current filter
Clear Filter Cancel current filter
View/Frame None
No frame, meansASTERIX data isdirectly included indata packet
This is the default value
HDLC HDLC frameThis is typical frame whendata is read fromsynchronous serial line
UDP MAC + UDP frameThis is typical frame whendata is captured from LAN
View/UAP AutoAutomatically selectproper UAP
This is the default value.User should manuallyselect correct UAP if the itis wrong

Menu/Submenu Menuitem Description Note
StandardStandard UAPdefined in ASTERIXstandard
ADS-B v0.23UAP defined inASTERIX Cat021version 0.23
ADS-B v0.26UAP defined inASTERIX Cat021version 0.26
ADS-B v0.23Thales
UAP used by ThalesADS-B ground station
Radar PlotUAP defined for plotsin ASTERIX Cat001
RadarRaytheon
UAP used byRaytheon radar
AnalyzeRadarCoverage
Open radar coverageanalyze tool
See detail in relativesection
Radar NorthMarker &SectorMissing
Open radar northmarker and sectormessage missinganalyze tool
See detail in relativesection
MessageTransmissionDelay
Open radar messagetransmission delayanalyze tool
See detail in relativesection
ToolFileConverter...
Open file formatconversion tool
See detail in relativesection
DataRecorder...
Launch DataRecording andPlayback application
ASTERIXPlayback...
Launch ASTERIXPlayback application
ASTERIXSimulator
Launch ASTERIXSimulator application
Options... Open Options Window
Help Contents Show help
OpenSamples
Open and loadsample data
InstallLicense...
Install license file forregistered user

Menu/Submenu Menuitem Description Note
Website
Open default webbrowser and openASTERIX Toolkitwebsite
About Show About Window
Note: Some menu items listed above may not appear in your application, or not applicablein your application, it depends on your license type.
3.1.3 Tool Bar
There are several tool bars.
Main toolbar contains commonly used function tool buttons, the function is exactly the samewith corresponding menu item.
Filter toolbar is used for filter function.
3.1.4 Status Bar
Status bar is at the bottom of main window, it shows status information and applicationmessage.
3.1.5 Main View
In the middle of main window, it is the main view. There are different types of view, message viewand target list view.
3.2 Message View
Message view is the default view after Sky Analyzer for ASTERIX starts up. In this view, ASTERIXdata is shown in a tree style hierarchy.
The message view composes of four parts:

Data packet listData block/record/item treeRaw hex dataData record/item detail
3.2.1 Packet List
Packet list is on left of tree view, loaded data packets are shown in this list. A sequence number,timestamp and size is displayed for each data packet.
The timestamp here is the receiving UTC time, if data is loaded from file, it means the time whenpacket is saved into the file.
Note: For some file formats, timestamp is not available, the timestamp field will bedisplayed as "N/A".
Note: For some file formats, timestamp has only valid time, and no valid date, thetimestamp field will be displayed with only time.
When one packet is selected, its content will be displayed in the raw hex data panel.
When one packet is selected, system will try to decode it with selected frame and UAP. If it can besuccessfully decoded, the structure of this data packet will be display in the data block panel.
3.2.2 ASTERIX Tree
ASTERIX tree is in the middle of tree view, it shows standard ASTERIX data struct in a tree stylehierarchy, which are:
Data BlockData RecordData Item
The concept of these terms are defined in Eurocontrol ASTERIX documents.
The encoding policy supported by Sky Analyzer for ASTERIX is:
One data packet can include one or more data blocksOne data block can include up to 32 data recordsOne data record can include up to 32 data items
When one data block or data record or data item is selected, the corresponding data will behighlighted in raw data display panel.
When one data record or data item is selected, the decoded ASTERIX fields will be displayed indetail in detail panel.
3.2.3 Raw Data Display
Raw data display is on top-right of tree view. Data of data packet will be shown in hexadecimalformat in it. If one data block/record/item is selected, the corresponding data will highlighted.
3.2.4 Detail Display
Detail display panel is on bottom-right of tree view. It is a standard web browser, when a datarecord/item is selected, a HTML page will be generated and displayed in detail display panel.
The content in this panel depends on the selected data.
3.3 Target List View

Column Description Note
CountryCountry of the aircraft, accordingto its ICAO address
If some ICAO address can't berecognized, airdb should beupdated
SAC/SIC SAC/SIC of sensorThis is useful when data comes frommultiple sensors
Time Stamp Time stamp of data transmission
Type Plot, Track & ADS-B
TrackNumber
Track number Valid only when type is "Track"
Mode 3/AMode 3/A code, suffix 'S' means"smoothed", 'G' means "garbled"
Flight Level Mode C code
Callsign Mode-S callsign
ICAOAddress
ICAO 24-bit address of aircraft
PolarCoordinates
Range and azimuth Valid only for radar
WGS84Coordinates
Latitude and longitudeValid for ADS-B, Mlat and systemtrack
Speed Ground speed
Heading Heading
Target list view is used to display important properties of aircraft in a table.
The columns in this table are:

When system reads one qualified data record, it will extract properties included in the datarecord, and generate a row. If any property is not applicable to the data record, thecorresponding column will be displayed as blank.
4 Filter
4.1 Introduction
The filter function allows you to show only the data you are interesting, it is useful when you wantto
Trace one or several specific aircraft(s), by track number, callsign or Mode-S address;Find data with special characteristic, e.g. SSR is 7500;Analyze data from a specific sensor;Etc.
When a filter is applied
System will check all loaded data, and shows only data which can match the filter;System will check new incoming data (read from file, or received from network), and showsonly data which can match the filter;Unmatched data will not be shown, but still kept in memory.
There are two types of filter, simple filter and Lua filter.
4.2 Simple Filter
A simple filter, as explained by its name, is simple and easy to use. It's useful when you just needto filter data with one condition, e.g. callsign is KAR2681.
In main window, there is a filter toolbar, by default it is in simple filter mode. You can simply typea filter command, and press "Enter" key or click on "Apply" button, the filter will be applied.
When click on "Clear" button, the filter will be cancelled.
Warning: If a large number of messages have been loaded, system need to reload all data whenyou cancel a filter, this process could take a while and cause UI no response for a short time. Itwill recover when all data is reloaded.
4.2.1 Syntax
The syntax of simple filter is:
The rules for simple filter are:
KEYWORD = VALUE1

Keyword Abbreviation Description Example Note
callsign cs, acid, targetid Callsign callsign=KAL937
squawkssr, mode3a, mode-3a
Squawk squawk=3562Range 0000-7777
tracknumtrackid, track_num,track_id
Track number tracknum=65
level modec, mode-c Flight level level=310Unit is 100feet
sacsic idSensor SACand SIC
sacsic=126031MeansSAC=126,SIC=31
icaoaddr addr24-bit ICAOAddress
icaoaddr=7F1E00
Keyword must be known by system;Only one keyword can be used;Both keyword and value are case insensitive;All spaces will be ignored.
A typical simple filter looks like:
It means, show data with callsign field and its callsign is "KAL937".
To make it's easier to write, this filter is equivalent to:
Here "cs" is the abbreviation of "callsign", and "kal" is the same with "KAL" or "Kal".
Below is a list of keywords supported by simple filter.
callsign = KAL9371
cs=kal9371

4.3 Lua Filter
Lua filter, is based on Lua script language. You can use Lua script to write a complex filter, andmatch specific data you are interesting.
For example, with Lua filter, you can match data which is
from aircrafts belong to Lufthansa (DLH), registered in Germany, with flight level betweenF290 to F320, and are in emergency status.
To use lua filter, first you need to click on the "Lua" button in filter toolbar, to switch the filterfrom simple filter mode to Lua filter mode, and a new button "Edit" will appear.
Then, after clicking "Edit" button, a "Lua Script Filter" window will appear.
In this window, you can type any valid Lua script. A syntax highlight mechanism similar with anycode editor has been integrated into this window, so you can detect potential errors in scriptwhen you type them.
Please be aware of the green color comments in this window, those are preset data which can beused to test your script. When you finish your filter script, you can click on "Test" button, andsystem will try to use you script to match data in comments, and show matching result in the"Result" text field. The result can be:
True, your script match test data and return true .False, your script doesn't match test data and return false .Error, there is error when interpreting your script, an error message will be shown in"Result" text field.

When your script is ready to use, you can click "Apply" button to apply the filter, or click "Close"button to close this window without applying the filter.
When click on "Clear" button in filter toolbar, the filter will be cancelled.

Field Description Example
category ASTERIX category number 34
sac Sensor SAC 12
sic Sensor SIC 252
msgtype Message type, can be north, sector, plot, track "track"
tracknum Track number 798
squawk SSR code 3065
callsign Callsign "SAI1401"
icaoaddr ICAO 24-bit address 18932
flightlevel Mode-C level in feet 31000
4.3.1 Syntax
The syntax of Lua script language can be found at Lua website. The Lua version used by Lua filteris 5.3.
Every time, when system need to check if one data record can match the filter or not, it will usethe data to construct a Lua table name record . The following fields are included in the recordtable:
If any field is not applicable, it will be set to nil .
The filter script should check if the data contained in record can match its purpose or not. Ifmatch, the script must return true , and the record will be kept in result; if not match, the scriptmust return false , and the record will be ignored.
Example:
This script means, if the callsign in record starts with "DLH" and squawk is 7500 (hijack), the datawill match the filter and be kept in result, all others will be ignored.
5 File Converter
5.1 Introduction
File Converter is a tool which can make conversion between different recording formats.
It reads data packet from input file, extract payload data from frame, and save data into anotherfile format.
if (string.sub(record.callsign, 1, 3) == "DLH" and record.squawk == 7500)
then
return true;
else
return false
end
1
2
3
4
5
6

5.2 Usage
5.2.1 Input
File Name, the input file path. File must be readable.
File Type, the input file formats. Different with other functions, File Converter will notautomatically detect file format, it will try to read file according to the file format selected here.

Note: Depending on your license type, different file formats will be listed here.
Frame Type, the frame type of data packets contained in input file.

Note: File Converter will extract payload data according to selected frame type, and save itinto output file. So if you want to keep the original frame in output file, you should select"No Frame" here.
5.2.2 Output
File Name, the output file path. File must be writable.
File Type, the output file formats. File Converter will save output file into selected format regardingless the file name suffix.

5.2.3 Information
When you press Convert button, File Converter will starts to make conversion and loggingmessages will be displayed in info panel. Error messages will be shown when error occurs duringthe conversion.

6 Export to Google Earth KML
6.1 Introduction
Sky Analyzer for ASTERIX provides a tool to export tracks into KML format, and later it's possibleto visualize the tracks in Google Earth application.
To generate KML file, the ASTERIX data record must contain the following information:
Valid track number or ICAO 24-bit addressValid position in WGS-84 coordinates
For CAT062
I062/040 - Track NumberI062/105 - Calculated Track Position (WGS-84)I062/380 - Aircraft Derived Data, subfield #1
6.2 Operation
The Google Earth KML export dialog is as below.
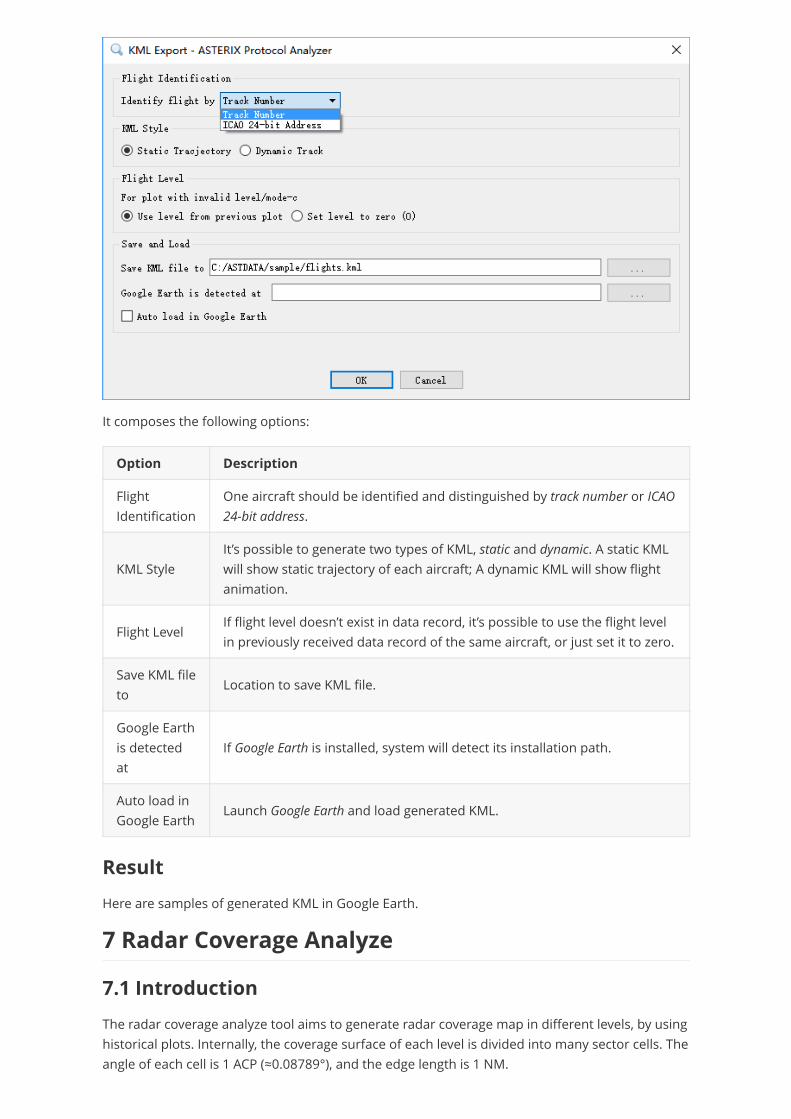
Option Description
FlightIdentification
One aircraft should be identified and distinguished by track number or ICAO24-bit address.
KML StyleIt’s possible to generate two types of KML, static and dynamic. A static KMLwill show static trajectory of each aircraft; A dynamic KML will show flightanimation.
Flight LevelIf flight level doesn’t exist in data record, it’s possible to use the flight levelin previously received data record of the same aircraft, or just set it to zero.
Save KML fileto
Location to save KML file.
Google Earthis detectedat
If Google Earth is installed, system will detect its installation path.
Auto load inGoogle Earth
Launch Google Earth and load generated KML.
It composes the following options:
Result
Here are samples of generated KML in Google Earth.
7 Radar Coverage Analyze
7.1 Introduction
The radar coverage analyze tool aims to generate radar coverage map in different levels, by usinghistorical plots. Internally, the coverage surface of each level is divided into many sector cells. Theangle of each cell is 1 ACP (≈0.08789°), and the edge length is 1 NM.

When more than 3 plots are detected in one cell, this cell will be marked as "covered". And withenough plots of different azimuth and distance from radar site, it’s able to determine thecoverage of every cell and finally get the coverage map of the whole surface. Considering mostcivil flights operate in limited predefined routes, to get a full coverage map it may need a longperiod (more than one month) of recorded plots.
7.2 Preparation
To generate an useful coverage map, you need to prepare recorded radar plots in ASTERIXCAT001 or CAT048 formats. And the following data items shall exist. To generate an usefulcoverage map, you need to prepare recorded radar plots in ASTERIX CAT001 or CAT048 formats.And the following data items shall exist.
For CAT001
I001/010 - Data Source IdentifierI001/040 - Measured Position in Polar CoordinatesI001/090 - Mode-C Code in Binary Representation
For CAT048
I048/010 - Data Source IdentifierI048/040 - Measured Position in Slant Polar CoordinatesI048/090 - Flight Level in Binary Representation

Plots are preferred as they are not filtered by radar tracker software. However tracks areaccepted and measured as they are not smoothed by radar tracker.
Recording shall be stored in XML recording file format (.rex files). The File Converter can be usedto convert files in other formats into REX format.
7.3 Main Window
The main window of radar coverage analyze tool is as below.
It composes of the following parts:
Actions
Menu and tool bars, including select-able menu items and tool buttons for different actions.
Messages
On bottom of the window, messages and logs are shown here.
Information Panel
On left of the window, displays important configuration and statistic information.
Coverage Chart
On right of the window, the coverage map of selected level will be displayed here.
7.3.1 Actions

Actions Description
New Create a new analyze
Open Open and load analyze from an existing SQLite database file
Save Save current analyze to a SQLite database file
Save As Save current analyze to a new SQLite database file
Settings Open configuration window
Process Start or continue processing
StopStop processing. The process will exit when current file is finished. It could takequite a while if current file is big. This is to avoid plots in current files areprocessed twice if you continue processing later.
Close Close the radar coverage analyze window
Layer Select one layer to display its coverage chart
LiveUpdate
Update chart display during process. Display it could slightly increaseprocessing speed if there is a big amount of data
SaveChart
Save current coverage chart to a SVG image file
7.3.2 Statistics

Name Description
Data Packets -Total
All data packets that have been read and processed from recordingfiles
Data Packets -Good
Data packets that can be correctly decoded. If this value is too low,check if frame type is correct.
Data Blocks -CAT001
Data Blocks of CAT001
Data Blocks -CAT002
Data Blocks of CAT002
Data Blocks -CAT034
Data Blocks of CAT034
Data Blocks -CAT048
Data Blocks of CAT048
Data Records -Total
All data records extracted from data blocks
Data Records -Qualified
Data records with plot or track that can be used to update radarcoverage map
Data Records -Filtered bySAC/SIC
Data records ignored due to its SAC/SIC doesn't match configuration
Data Records -Filtered by Level
Data records ignored due to its level is lower than minimal level, or itslevel is greater than maximum level, or its level is not valid
Data Records -Filtered by Range
Data records ignored due to its distance is greater than radarmaximum coverage, or its range is not valid
7.4 Configuration Window
The configuration window is as below.

Parameter Description Constraint
RadarName
The name of radar for analyze.Any literal
text
SAC System Area Code, used to filter data from other sensors 0~255
SICSystem Identification Code, used to filter data from othersensors
0~255
Format Data format for Mode-S radar or conventional radar
MaximumCoverage
Radar maximum coverage, any plots far from this value willbe ignored.
0~300 NM
FrameType
The frame type of data in recording file
VerifySAC/SIC
Turn on/off the filter of SAC/SIC. When selected, only plotswith matching SAC/SIC are processed
MinimalLevel
Plots under this level will be ignored 0~420 FL
MaximumLevel
Plots above this level will be ignored 0~420 FL
Level perLayer
The levels between two coverage surfaces. Plots will beassigned to a layer closest to its actual level
0~100 FL
Feed DirDirectory to read radar plots recording files. All files underthis directory with ".rex " suffix will be processed.
It contains parameters used for generating radar coverage map.
If any field contains an error, a warning message will be displayed.
8 Radar North Marker & Sector Missing Analyze

8.1 Introduction
The radar north marker and sector message missing analyze tool is used to detect any missingnorth marker message and sector message received from a specific radar.
For north marker message, system will calculate time interval of two north marker messages. Ifthe interval is greater than radar rotation period plus a tolerance value, system will assume onenorth marker message is missing, and a warning message will be printed.
For sector message, system will check if the sector number in a sequence of messages iscontinue. If not, system will assume one or more sector messages are missing, and warningmessage(s) will be printed.
8.2 Preparation
To make a correct analyze on north marker and sector messages, it requires:
A valid time is included in north marker messageA valid sector is included in sector message
It means, the following dataitems must be included in received ASTERIX message.
Category 002
I002/000 - Message TypeI002/030 - Time of DayI002/020 - Sector Number
Category 034
I034/000 - Message TypeI034/030 - Time of DayI034/020 - Sector Number
8.3 User Interface
The main window of radar north marker & sector missing analyze tool is as below.

Before starting analyze, it's necessary to open the configuration window by clicking on Settingsbutton.
The meaning of each parameter is listed below.

Parameter Description
SAC/SIC SAC and SIC of radar
RotationPeriod
Radar antenna rotation period
SectorNumber
Number of sectors a radar will report in one antenna rotation
UAP UAP of radar data
FrameType
Frame type of radar data
VerifySAC/SIC
If selected, only data match SAC and SIC will be processed. If not selected, alldata will be processed.
NorthMarkerMissing
If selected, system will analyze radar north marker message missing
DelayTolerance
Tolerance on north marker message delay, in a north marker is receivedmore than antenna rotation period + tolerance, system will assume onenorth marker message is missing in the middle
SectorMissing
If selected, system will analyze sector message missing
RecordingFile
Recording file for analyze, support rex and rei file
When all parameters are set, analyze can be started by clicking on Start button; and process canbe interrupted by clicking on Stop button.
During the process, if any north marker or sector message missing is detected, a log message willbe printed.
When analyze finish, statistic information will be printed.

9 Message Transmission Delay Analyze
9.1 Introduction
The message transmission delay analyze tool is used to calculate delay time during transmissionfrom surveillance sensor to receiver.
System will compare the timestamp encoded in ASTERIX message, which is the sensortransmission time (Tx), and the timestamp encoded in data packet, which is the receiving time(Rx). The difference between Rx and Tx is considered as transmission delay.
When the calculated is greater than a warning level, a message will be shown in log.

When the calculated is greater than a discard level, or is less than zero, it will not be used forfurther statistic, and a message will be shown in log.
9.2 Preparation
To generate a correct delay time, it requires:
A valid Rx time is included in data packetA valid Tx time is included in ASTERIX dataBoth Rx and Tx time must be UTC time, or in a same time zoneBoth Rx and Tx clock must be synchronized with a common time source, normally GPS
The timestamp in the following dataitems will be used as Tx time:
I002/030 - Time of DayI034/030 - Time of Day
9.3 User Interface
The main window of message transmission delay analyze tool is as below.
Before starting analyze, it's necessary to open the configuration window by clicking on Settingsbutton.

Parameter Description
SAC/SIC SAC and SIC of sensor
UAP UAP of sensor data
Frame Type Frame of sensor data
Verify SAC/SICIf selected, only data match SAC and SIC will be processed. If not selected,all data will be processed.
Warningthread hold
If calculated delay is greater than this value, a log message will be printed
Maximumallowed delay
If calculated delay is greater than this value, a log message will be printed,and this delay will not be used in statistic
Recording File Recording file for analyze, support rex and rei file
The meaning of each parameter is listed below.
When all parameters are set, analyze can be started by clicking on Start button; and process canbe interrupted by clicking on Stop button.
During the process, if any message match the warning or disgard thredhold, a log message willbe printed.
When analyze finish, statistic information will be printed, and a delay chart will be shown in theChart table.

