sleepwalking through school: new evidence on sleep and
TRANSCRIPT

Forschungsinstitut zur Zukunft der ArbeitInstitute for the Study of Labor
DI
SC
US
SI
ON
P
AP
ER
S
ER
IE
S
Sleepwalking through School:New Evidence on Sleep and Academic Performance
IZA DP No. 9829
March 2016
Kurt WangJoseph J. SabiaResul Cesur

Sleepwalking through School: New Evidence on Sleep and
Academic Performance
Kurt Wang San Diego State University
Joseph J. Sabia
University of New Hampshire, San Diego State University and IZA
Resul Cesur
University of Connecticut
Discussion Paper No. 9829 March 2016
IZA
P.O. Box 7240 53072 Bonn
Germany
Phone: +49-228-3894-0 Fax: +49-228-3894-180
E-mail: [email protected]
Any opinions expressed here are those of the author(s) and not those of IZA. Research published in this series may include views on policy, but the institute itself takes no institutional policy positions. The IZA research network is committed to the IZA Guiding Principles of Research Integrity. The Institute for the Study of Labor (IZA) in Bonn is a local and virtual international research center and a place of communication between science, politics and business. IZA is an independent nonprofit organization supported by Deutsche Post Foundation. The center is associated with the University of Bonn and offers a stimulating research environment through its international network, workshops and conferences, data service, project support, research visits and doctoral program. IZA engages in (i) original and internationally competitive research in all fields of labor economics, (ii) development of policy concepts, and (iii) dissemination of research results and concepts to the interested public. IZA Discussion Papers often represent preliminary work and are circulated to encourage discussion. Citation of such a paper should account for its provisional character. A revised version may be available directly from the author.
IZA Discussion Paper No. 9829 March 2016
ABSTRACT
Sleepwalking through School: New Evidence on Sleep and Academic Performance*
Policymakers advocating for later school starting times argue that increased sleep duration may generate important schooling benefits. Using data from the National Longitudinal Study of Adolescent Health, this study examines the relationship between sleep duration and academic performance, while carefully controlling for difficult-to-measure characteristics at the family- and individual-levels. We find that increased sleep time is associated with improvements in classroom concentration as well as increased educational attainment. However, we also find evidence of diminishing returns to increased sleep. We estimate an “academic optimum” number of sleep hours of, on average, 8.5 hours per night. Turning to sleep quality, we find that the onset of insomnia-like symptoms is associated with diminished contemporaneous academic concentration, but little change in longer-run educational attainment. JEL Classification: I12 Keywords: sleep, insomnia, schooling, human capital Corresponding author: Joseph J. Sabia Department of Economics San Diego State University 5500 Campanile Drive San Diego, CA 92182-4485 USA E-mail: [email protected]
* This research uses data from Add Health, a program project designed by J. Richard Udry, Peter S. Bearman, and Kathleen Mullan Harris, and funded by a grant P01-HD31921 from the National Institute of Child Health and Human Development, with cooperative funding from 17 other agencies. Special acknowledgment is due Ronald R. Rindfuss and Barbara Entwisle for assistance in the original design. Persons interested in obtaining data files from Add Health should contact Add Health, Carolina Population Center, 123 W. Franklin Street, Chapel Hill, NC 27516-2524 (http://www.cpc.unc.edu/addhealth/contract.html).
1
"Over time, sleep deprivation leads to serious consequences for academic achievement, social behavior, and the health and safety of our nation's youth. … We must encourage schools to push back their start times to at least 8:30 a.m. — a schedule more in tune with adolescents' biological sleep and wake patterns and more closely resembling the adult work day."
- Zoe Lofgren (D-CA 19th District), Member of the U.S. House of Representatives.
"Early to bed, early to rise makes a man healthy, wealthy and wise,"
-Benjamin Franklin, Founding Father of the U.S.
I. Introduction
Policymakers advocating for later school starting times argue that such a policy
will increase average sleep times for students, which will generate important schooling
benefits. Increases in sleep duration among children and adolescents have, in fact, been
linked to enhanced memory and improved concentration (Sadeh 2007; Dijk 2009), while
sleep deprivation has been found to be associated with diminished cognitive functioning
(Kopasz, et al. 2010; Dewald et al. 2010), increased psychological stress (Schraml et al.,
2012), and reduced energy (St-Onge, 2013).
Opponents of later school starting times argue that while later school starting
times may induce greater sleep, the effects of more sleep may not always improve
educational performance. For instance, “excess sleep” has been linked to decreased
memory function (Devore et al., 2014) as well as a wide set of health problems (Grandner
and Drummond 2007), each of which may decrease academic performance. In addition to
the potential adverse academic consequences of excess sleep, later school starting times
often lead to later school ending times, which may diminish human capital acquisition
2
(Hinrichs 2011) as well as impose additional costs on school districts and parents
(Shapiro 2015).1
This study explores the relationship between sleep and adolescent academic
performance. Using data from the National Longitudinal Study of Adolescent Health and
a fixed effects empirical strategy, we find that an increase in sleep hours is associated
with modest improvements in the ability to concentrate in class and complete homework
on time, as well as an increased probability of high school graduation and college
attendance. We find that improved classroom concentration and increased likelihood of
homework completion may be important channels through which youth sleep duration is
positively related longer-run educational attainment. However, our finding of academic
benefits of additional sleep is only true for those who sleep less than, on average, 8.5
hours per night. For longer sleepers, additional sleep time generates academic costs.
Turning to sleep quality, we find that insomnia is associated with diminished
contemporaneous academic concentration, but has little effect on longer-run human
capital acquisition.
Together, our results suggest that longer sleep times induced by later school
starting times may generate schooling benefits for those who sleep less than 8.5 hours per
night. We conclude that the net academic benefits generated by later school starting
times will depend upon the (i) initial distribution of sleep duration among the student
population, and (ii) marginal students affected by later school starting time policies.
1 For instance, later school starting times generally requires ending school later in the day, which may reduce students’ time spent on homework and in extracurricular activities, resulting in diminished educational performance (Hinrichs, 2011). Additionally, because later school starting times usually conflict with parents’ work schedules and significantly increase the cost of busing, as school districts rely on a limited number of buses, some parents and school administrators prefer earlier school start times (Shapiro, 2015).

3
II. Background
Economists have recently begun to explore the important role of child health in
human capital development (Currie 2009). A growing number of studies have examined
the academic effects of adolescent health, including diabetes (Fletcher and Richards
2012), obesity (Grossman and Kaestner 2008), migraine headache (Rees and Sabia 2011),
depression (Fletcher 2010), and risky sex (Sabia and Rees 2012). However, relatively
little work has been done on the schooling effects of sleep deprivation, a potentially
important health-related ailment that has received substantial attention from educational
policymakers (Wahlstrom 2002; Hinrichs 2011).
During adolescence, the circadian rhythm of an individual exhibits a significant
phase shift (Carskadon et al., 1998), which increases teenagers’ difficulty in falling asleep
before midnight even if they routinely wake up early in the morning. Proponents of later
school starting times argue that the scheduling of early morning classes leads to sleep
deprivation-induced academic costs.
Most of the studies exploring the relationship between sleep and adolescent
academic achievement have been cross-sectional in nature. A number of studies, usually
based on smaller convenience samples, have uncovered evidence that sleep problems are
associated with lower grade point average (see Wolfson and Carskadon (2003) for a
review). The most comprehensive study to date (Eide and Showalter 2012), uses data
from the Child Development Supplement of the Panel Study of Income Dynamics, and
finds that that children’s standardized test scores are maximized at, on average, 7 to 7.5

4
hours of sleep per night. DeSimone and Schumacher (2013) find a similar result in a
recent working paper using data drawn from the National Youth Risk Behavior Survey.2
As many of the above authors note, isolating the causal effect of sleep duration on
educational performance is empirically challenging. Sleep problems have been linked to a
number of health ailments, including Attention Deficit Hyperactivity Disorder, obesity,
diabetes, allergies, and severe headache (Khan, 2004), many of which have been linked
to diminished school performance (Suhrcke and de Paz Nieves, 2011). In addition, many
difficult-to-measure environmental and personal triggers of sleep problems—such as
noise pollution, lighting, and personality—are also correlated with school performance.
Finally, reverse causality may exist wherein poor academic performance may cause
changes in sleep patterns.
To generate exogenous variation in sleep duration—as well as explore a policy-
relevant sleep-related policy—a handful of studies have examined the effects of school
starting times on academic achievement relying on both cross- and within-school
variation in policies (Edwards, 2012; Hinrichs 2011; Wahlstrom 2002). However, (i)
individuals’ ability to change their schedules (and courses), and (ii) endogenous policy
selection may lead to biased estimates of the effects of school starting times on academic
performance.
Carrell, Maghakian, and West (2011) provide arguably the best school starting
time study by exploiting two plausibly exogenous policy changes at the US Air Force
Academy (USAFA) that randomized freshmen to different class starting times, courses,
2 There is also evidence that both college class performance (Dills and Hernandez 2008) and adolescent IQ test scores (Goldstein et al. 2007) are better during the afternoon than morning hours, consistent with the hypothesis that tiredness adversely affects school performance.

5
and instructors.3 Their results suggest that a 50-minute delay in school starting times
improves math and science grades; the magnitude of the increase is comparable to a one
standard deviation increase in teacher quality.
While the USAFA study provides convincing evidence on the causal effects of
plausibly exogenous shocks to sleep time, it is unclear that the effects of sleep
deprivation on military populations would be similar to the effects on civilians.4
Moreover, the USAFA study does not estimate the “first-stage” effect of school starting
times on sleep duration nor does it explore the longer-run educational effects of
adolescent sleep duration or sleep problems.
Finally, it is possible that school starting times could affect academic achievement
through pathways other than through sleep duration or sleep quality. For instance,
students who start the school day earlier may be more likely to skip breakfast as well as
be tardy or absent. In addition, time students allocate for homework completion,
television watching, and playing sports may be impacted by school start times, all of
which could impact school performance (Edwards 2012; Shapiro 2015). Because the
school starting time studies mentioned above all use reduced form estimation strategies, it
is unclear whether they have isolated the schooling effects of sleep duration.
The current study contributes to the literature in several ways. Our study is the
first to use nationally representative longitudinal data on civilians to estimate the effect of
sleep duration on short-run academic performance and longer-run educational attainment.
3 The randomization was conditional on student performance on placement exams in mathematics, chemistry, and foreign language. 4 For instance, the effects of sleep problems on schooling could be larger for cadets due to the physical, mental, and academic demands of a service academy (Brand et al. 2010). On the other hand, research also suggests that first-year cadets have a stronger social and academic support system than civilian undergraduates (Myers and Bechtel 2004), which may mitigate the adverse academic consequences of sleep problems for cadets.

6
While this study does not offer clean identification in the spirit of Carrell, Maghakian,
and West (2011), our data do allow us to control for difficult-to-measure heterogeneity at
the family or individual levels. In addition, this study is the first to empirically explore
the effects of both sleep quantity (time spent typically sleeping) and sleep quality
(difficulty falling or staying asleep). This will allow us to explore whether the quantity
and quality of sleep accumulated have independent academic effects.
III. Data and Methods
Data. Our analysis uses data from the National Longitudinal Study of Adolescent
Health (Add Health). The Add Health is a school-based survey that began during the
1994-1995 academic school year and is designed to be representative of students
attending middle schools and high schools (7th through 12th grades). Following the
baseline in-home interview (Wave I), the first follow-up interview (Wave II) was
conducted in the subsequent academic year (1996); the second follow-up survey (Wave
III) was conducted in 2001, when respondents were ages 18 to 26; and the third follow-up
survey (Wave IV) was conducted in 2008 when respondents were young adults ages 24 to
34. At baseline and in subsequent surveys, respondents were asked questions about their
sleep patterns, general health, health behaviors, and educational performance. In addition
to surveying the adolescents, Add Health interviewers also administered an in-home
parental questionnaire survey, in which parents provided information on family
background characteristics, such as household income, maternal marital status, parental
education, and parental health.
7
Our full Wave I analysis sample consists of 20,267 participants who provide non-
missing information on sleep duration and contemporaneous academic performance. The
corresponding sibling sample at Wave I is comprised of 3,667 respondents. Our longitudinal
sample (using Waves I and II) is comprised of 27,794 person-wave observations (13,897
unique individuals) that provide non-missing information on sleep and academic
performance. For our educational attainment, our sample consists of 15,543 individuals
(one observation per person) who provide non-missing information on sleep at the
baseline or first follow-up survey, and on educational attainment measured at the third
follow-up survey (Wave IV). The associated siblings sample includes 3,150 individuals.
Sleep Measures. We measure adolescent sleep duration using information
collected at the baseline and first follow-up surveys. In each survey, respondents are
asked, “How many hours of sleep do you usually get?” The average number of hours of
sleep (Sleep Hours) in the main sample is 7.72.
In addition to sleep quantity, we also are able to measure the respondent’s sleep
quality, measured by insomnia problems. Respondents to the Add Health at Waves I and
II are asked, “How often do you have trouble falling or staying asleep?” Possible
answers to this questionnaire item include “never,” “just a few times,” “about once a
week,” “almost every day,” and “every day.” Insomnia is coded as 1 if a respondent has
trouble falling or staying asleep at least once a week and are coded equal to 0 if they have
trouble falling or staying asleep “just a few times” or “never.” In Panel A of Table 1, we
show that 24 percent of our sample reported insomnia at Wave I, which is comparable to
estimates obtained in other population-based studies.5
5 Our definition of Insomnia is consistent with the medical literature. For a comprehensive review of the definition of insomnia in medical literature see Roth (2007). In unreported specifications, we also

8
Contemporaneous Academic Performance Measures. Our data include three
measures of academic performance, measured at Waves I and II. First, respondents are
asked: “How often did you have trouble paying attention in school?” Possible responses
to this questionnaire item include “never,” “just a few times,” “about once a week,”
“almost every day,” and “every day.” From these answers, we generate the dichotomous
variable Pay Attention. Following Rees and Sabia (2011), Pay Attention is coded equal
to 1 for respondents who reported trouble paying attention in school more “about once a
week” or more and is coded equal to 0 for those who “never” reported difficulty paying
attention in school or had difficulty “just a few times.” As displayed in Panel A of Table
1, 30 percent of individuals reported difficulty paying attention in class at least once per
week at Wave I.
Second, respondents are asked, “How often did you have trouble completing your
homework?” Analogous to the above and consistent with Rees and Sabia (2011), we set
the dichotomous variable Homework equal to 1 if the respondent reports difficulty
completing homework at least once per week and 0 otherwise. At Wave I, 31 percent of
respondents reported difficulty completing homework at least once per week.
Our final measure of academic performance is the respondent’s grade point
average GPA. Respondents are asked, “What is your grade in [Math / English / History /
Social Studies / Science] during the last grading period?” Possible answers to this
subject-specific questionnaire item included “A,” “B,” “C,” or “D or F.” Following
Balsa et al. (2011) and Gordon et al. (2013), respondents who responded with A were
coded as 4.0; those who responded with “B” were coded as 3.0; those who responded
experiment with allowing the full distribution of sleep problem frequency to affect education. These results, which are similar to the estimates presented here, are available upon request.
9
with “C” were coded with 2.0; and those who responded with “D or F” were coded as
0.5. An overall GPA was calculated using the average of non-missing class-specific
grades.6 The average GPA at Wave I is 2.72.
We note that there are a number of important limitations of our short-run
academic performance measures. Pay Attention and Homework are imperfect measures
of classroom concentration and assignment completion. Additionally, GPA may capture
student effort in addition to (or even opposed to) human capital acquisition. Moreover,
due to differences across classes and schools in grading standards and course curricula,
GPA may capture different things across students and schools, rendering comparisons
across pupils imperfect. Therefore, caution must be exhibited in interpreting results using
our GPA measure.
Educational Attainment Measures. We measure educational attainment at the
third follow-up survey, when respondents were ages 24 to 34, using responses to the
following questionnaire item, “What is the highest level of education that you have
completed?” We construct two dichotomous measured of educational attainment using
responses to this questionnaire item. If the respondent reports receiving a high school
diploma, High School Grad is coded equal to 1; it is coded equal to 0 if the respondent
reports dropping out of high school or obtaining a GED. If the respondent reports that he
or she has attended college, College Attend is coded as 1; College Attend is coded as 0 if
the respondent did not go to college. As shown in Panel B of Table 1, 85 percent of
young adults reported receipt of a high school diploma and 66 percent reported college
attendance.
6 In our GPA regressions discussed below, we also include a set of controls for each combination of courses taken to account for differences in GPA that might arise via course selection.
10
Methods. We begin by descriptively benchmarking results from the Add Health
Wave I dataset against the prior cross-sectional literature using the following
specification:
Ei = α + β1(Sleep Hours)i + β2(Sleep Hours2)i + β3Xi + εi (1)
where Ei is one of our six measures of academic achievement, Sleep Hours and its square are
included to allow a nonlinear relationship between sleep duration and schooling (Eide and
Showalter 2012), and Xi includes controls for age, race/ethnicity, parental income, parental
educational attainment, parental marital status, urbanicity, and indicators for overweight and
obese, diabetes, migraine headache, and allergies (or asthma).7 The means of these controls are
found in Appendix Table 1.
To control for unmeasured heterogeneity at the family-level, we next restrict the sample
to Wave I biological siblings and estimate a family fixed effects model:
Eij = α + β1(Sleep Hours)i + β2(Sleep Hours2)i + β3Xi + θj + εij (2)
where j indexes the family and θj is a vector of family fixed effects. While this approach
will eliminate bias in the estimate of β1 and β2 due to unobservables at the family-level
such as family stressors related to both sleep duration and education, it also has a number
of well-known limitations. The identifying variation comes from siblings in the sample
7 Note that these comorbidities are potentially endogenous covariates because they may be related both to sleep-related problems and to educational performance. Estimating our specifications with and without controlling for these comorbidities produced results, which are to nearly identical to the ones presented in the paper.
11
with discordant hours of sleep reports. There are 1,296 sibling pairs with discordant
reports of sleep hours per night and 590 sibling pairs with discordant reports of problems
falling asleep. Although we a have relatively large number of discordant sibling pairs, the
reduced identifying variation (relative to OLS models) may result in limited statistical
power. Second, if there is measurement error in sleep, then the addition of fixed effects
may exacerbate attenuation bias. It is also possible that the effects of sleep quantity for
one sibling could spillover to the other. In addition, a family fixed effects approach will
not eliminate any bias due to individual heterogeneity.
Finally, for the short-run academic performance outcomes under study (Pay
Attention, Homework and GPA), we address the role of individual heterogeneity that is
fixed over time by pooling data from Waves I and II and estimating:
Eit = α + β1(Sleep Hours)i + β2(Sleep Hours2)i + β3Xit + πi + τt + εit (3)
where πi is a vector of time-invariant individual fixed effects and τt is a vector of time
effects common across individuals. Identification of β1 and β2 will come from
individuals whose sleep duration changes between the baseline survey and Wave II. In
our sample, 38 percent of respondents reported identical sleep quantity at Wave I and II,
35 percent reported shorter sleep duration at Wave I relative to Wave II; the remaining 27
percent reported an increase in sleep time between Waves I and II.
The approach outlined in equation (3) has the advantage of controlling for fixed
personal characteristics such as personality, discount rates, or innate stress-tolerance.
However, the addition of fixed effects as controls could exacerbate attenuation bias

12
caused by measurement error. The estimates of β1 and β2 could also be biased if there are
time-varying unobservables correlated with sleep duration and schooling, such as the
onset or diminishing of family disruptions, which might upwardly bias the favorable
academic consequences of sleep hours. Reverse causality could also be a concern if, for
example, the stress-related consequences of poor academic performance induces sleep
problems. Respondents might also choose fewer hours of sleep when taking courses of
less difficulty (which could understate the adverse consequences of reduced sleep hours).
Finally, we estimate equations (2) and (3) where we replace Sleep Hours with
Insomnia or add Insomnia as an additional right-hand side variable. This will allow us to
estimate the effect of sleep quality on schooling. In our tables below, we show estimated
associations between Sleep Hours (or Insomnia) and academic performance. Estimated
parameters on control variables are shown in Appendix Table 2.8
IV. Results
Contemporaneous Academic Performance. In Table 2, we show estimates of the
relationship between sleep duration and contemporaneous academic performance. We
show estimates of β1 and β2 from equation (1) for the full Wave I sample (column 1) and
for the sample of biological siblings (column 2).9 OLS estimates on both Wave I samples
show that sleep hours are negatively related to the probability of difficulty paying
attention in class (Panel A) and completing homework (Panel B), and positively related to
grade point average (Panel C), consistent with the prior literature. However, the
8 For the academic performance outcomes, we use pooled data from the baseline and first follow-up surveys and correct standard errors for clustering on the individual. For the educational attainment outcomes measured at the third follow-up survey, we use only one observation person in our analysis sample and cluster standard errors on the school to control for the Add Health survey design. 9 Standard errors in column (1) are corrected for clustering at the school level.

13
beneficial academic effect of increased sleep hours diminishes as the number of sleep
hours creases. Our estimates show that academic performance is maximized at 8.0 (for
GPA) to 9.5 (for Homework) hours of sleep. Across our three outcomes, we estimate an
average “academic optimal” of around 8.5 hours of sleep. At Wave I, 76 percent of the
individuals reported sleeping less than 8.5 hours per night, suggesting that the majority
could potentially academically benefit from additional sleep. Our estimate of the optimal
hours of sleep is somewhat larger than that obtained by Eide and Showalter (2012), who
examined a sample including younger individuals and using standardized test scores as
the schooling outcome of interest.
In column (3), we present estimates from equation (2) that control for family fixed
effects. The magnitude of the academic benefits of additional sleep hours for homework
completion falls by 12 percent, but is still statistically distinguishable from zero at
conventional levels. For Pay Attention (Panel A) and GPA (Panel C), however, the
estimated associations fall by 42 to 67 percent and are statistically indistinguishable from
zero. This could suggest that family-level unobserved heterogeneity is an important
source of bias; however, it may also be that limited identifying variation does not allow
us to detect significant sleep effects.
Our preferred estimates from equation (3) are shown in column (5), with OLS
estimates on the same sample shown in column (4) for comparison. Individual fixed
effects estimates continue to show that sleep hours are negatively related to the
probability of difficulty paying attention in class and difficulty completing homework,
consistent with the hypothesis that there are concentration-related benefits to more sleep
time. However, after approximately 9 hours of sleep, these academic benefits decline.

14
Individual fixed effects estimates provide little evidence that the concentration-
and homework-related benefits of increased sleep extend to GPA. These findings could
suggest that difficult-to-measure heterogeneity at the individual-level led to upwardly
biased estimates of sleep in cross-sectional models. However, it is also possible that the
inclusion of individual fixed effects may have enhanced attenuation bias, or that reverse
causality may be at work.
Educational Attainment. In Table 3, we examine the relationship between sleep
hours and educational attainment, measured by high school graduation (Panel A) and
college attendance (Panel B). Of course, because our measure of attainment is
cumulative in nature, we can only control for fixed effects at the family-level. Our
findings in Table 3 provide some support for the hypothesis that adolescent sleep
duration is positively related to educational attainment. Controlling for family fixed
effects (column 3), we find that the number of sleep hours that maximizes the probability
of high school completion is 8.6 and the number of hours that maximizes college
attendance is 7.4. These new findings provide support for the hypothesis that later school
starting times that increase sleep (for those sleeping, on average, less than about 8 hours
of sleep) may generate longer-run human capital benefits for adolescents. More than half
of all students in this sample reported typical sleep hours that are fewer than this implied
academic optimal.
Sleep Quality. One of the unique advantages of the Add Health data is that they
allow us to independently explore the effects of sleep quantity and sleep quality on
academic performance. While trouble falling and staying asleep, commonly called
insomnia (Roth 2007), may shorten sleep duration, insomnia may also displace the timing

15
of sleep (e.g. by pushing it further into the morning) or produce lower quality, interrupted
sleep. At Wave I, those who report difficulties falling or staying asleep report sleeping
7.4 hours, 0.4 hours less than who do not report Insomnia. Therefore, we examine the
effect difficulty falling or staying asleep on academic achievement and explore whether
the impact of sleep quality operates entirely through hours of sleep.
Table 4 presents family fixed effects (columns 1 and 2) and individual fixed
effects (columns 3 and 4) estimates of the relationship between insomnia and
contemporaneous academic performance. In models that exclude controls for sleep
duration (columns 1 and 3), we find that insomnia is associated with an 8.3 to 15.5
percentage point increase in the probability of difficulty paying attention in class (Panel
A) and a 5.1 to 14.8 percentage point increase in the probability of difficulty completing
homework (Panel B). Evidence for GPA-related costs of insomnia (Panel C) is much
weaker.
Interestingly, for school concentration and homework completion, there is some
evidence that sleep quality and quantity may have independent human capital effects.
That is, jointly estimated marginal effects of Insomnia and Sleep Hours (column 4 of
Table 4) are similar to the separately estimated impact of quality (column 3 of Table 4)
and duration of sleep (column 5 of Table 2).
In Table 5, we examine the relationship between insomnia and longer-run
educational attainment. The results provide little support for the hypothesis that
adolescent insomnia is associated with diminished educational attainment in models
without (column 1) or with (column 2) controls for sleep duration.

16
Mediators for Educational Attainment. Finally, in Table 6, we descriptively
explore the extent to which sleep-induced improvements in concentration and homework
completion (our short-run academic outcomes) mediate the relationship between sleep
duration and educational attainment (our longer-run outcome). The results suggest that
improved classroom concentration and increased likelihood of homework completion
may help to explain relationship between sleep duration during adolescence and
educational attainment. Column (1) of Table 6 presents family fixed effects estimates of
the relationship between Sleep Hours and educational attainment; column (2) adds
controls for Pay Attention and Homework (measured at Waves I and II) to the right-hand
side of the estimating equation. We find that controlling for Pay Attention and
Homework leads to a 35 to 42 percent decline in the estimated association between sleep
duration and educational attainment.10
V. Conclusions
Policymakers advocating later school starting times emphasize that there may be
important human capital benefits associated with enhanced sleep. We use nationally
representative longitudinal data to examine the relationship between sleep duration and
(i) academic performance, and (ii) educational attainment.
Our findings provide some evidence that increased sleep duration—up to 8.5 to
9.0 hours per night—is associated with improvements in contemporaneous academic
concentration and homework completion. Moreover, increased sleep duration—up to 8.5
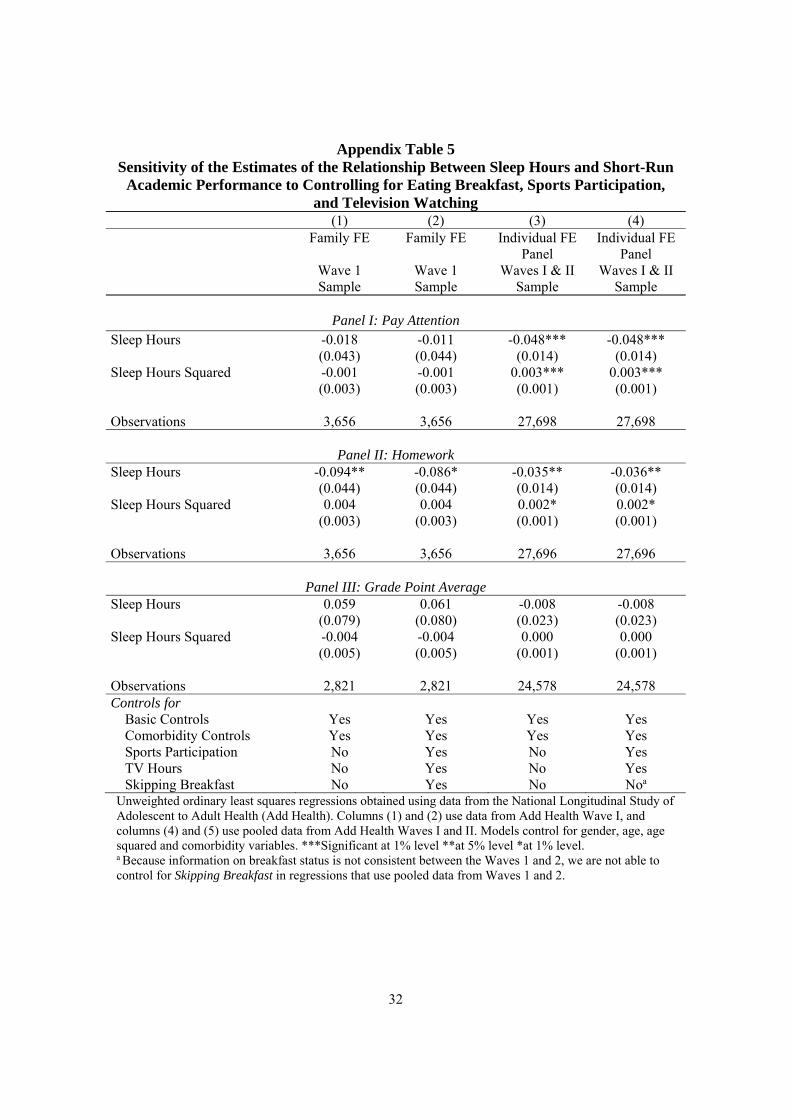
10 In addition, as noted above, the effect of sleep duration on academic achievement may operate through sports participation, likelihood of skipping breakfast, and hours of television watching. In Appendix Tables 5 and 6, we estimate the sensitivity of the estimated impact of sleep duration on short-run academic achievement measurement and longer-run educational attainment, respectively. However, these controls appear to be relatively unimportant mediators.

17
hours per night—is associated with an increase in the probability high school diploma
receipt and college attendance. These results are robust to the inclusion of controls for
family- and individual-level unmeasured heterogeneity. Following the “academic
optimum” number of hours of sleep documented above, increases in sleep duration are
associated with a decline in academic achievement. We also find some evidence that
insomnia is associated with diminished short-run, but not longer-run, educational
performance. Finally, we find that the educational attainment benefits of increased sleep
time can be explained, in part, by concentration-related improvements.
From a policy perspective, it may be tempting to conclude from our findings that
implementing later school starting times will increase longer-run education attainment.
But several important caveats to our results are deserving of note. Our chief
identification strategies—family and individual fixed effects approaches—generally
eliminate variation in school starting times as a source of identification. Moreover, the
Add Health survey does not provide information on school starting times. Therefore, it is
unclear whether the marginal effects we estimate are comparable to the local average
treatment effects one might obtain using civilian school starting times as a source of
identification. Nevertheless, findings from our study suggest that if later school starting
times are effective in increasing sleep duration among the vast majority of students who
sleep less than 8.5 hours per night, such a policy change may generate potentially
important human capital benefits.
While we acknowledge the methodological limitations to our study, these findings
constitute useful input policy discussions on school start times—in particular, the
potentially important academic benefits to additional sleep. However, these findings also

18
invite closer attention to the impact of later school start times on those at the right tail of
the sleep distribution. Moreover, the academic benefits and costs of later school starting
times are just one set of parameters necessary for a full social welfare analysis. Changes
school starting times may also affect parental work schedules, child care costs, and
school administrative costs, other critical factors necessary in determining the school
starting time that optimizes social welfare.

19
References
Balsa, A. I., Giuliano, L. M., & French, M. T. (2011). The effects of alcohol use on academic achievement in high school. Economics of Education Review, 30(1), 1-15.
Brand, S., Gerber, M., Beck, J., Hatzinger, M., Pühse, U., & Holsboer-Trachsler, E. (2010). High exercise levels are related to favorable sleep patterns and psychological functioning in adolescents: a comparison of athletes and controls. Journal of Adolescent Health, 46(2), 133-141.
Carrell, S. E., Maghakian, T., & West, J. E. (2011). A’s from Zzzz’s? The causal effect of school start time on the academic achievement of adolescents. American Economic Journal: Economic Policy, 3(3), 62-81.
Carskadon, M. A., Wolfson, A., Acebo, C., Tzischinsky, O., & Seifer, R. (1998). Adolescent Sleep Patterns, Circadian Timing, and Sleepiness at a Transition to Early School Days. Sleep, 21(8), 871-881.
Currie, J. (2009). Healthy, Wealthy, and Wise: Socioeconomic Status, Poor Health in Childhood, and Human Capital Development. Journal of Economic Literature, 47(1), 87-122.
DeSimone, Jeffrey and Edward Schumacher. (2013). Sleep and academic performance in high school. Working Paper, Trinity University.
Dewald, J. F., Meijer, A. M., Oort, F. J., Kerkhof, G. A., & Bogels, S. M. (2010). The influence of sleep quality, sleep duration and sleepiness on school performance in children and adolescents: A meta-analytic review. Sleep Medicine Reviews, 14, 179-189.
Devore, Elizabeth E., Francine Grodstein, Jeanne F. Duffy, Meir J. Stampfer, Charles A. Czeisler, and Eva S. Schernhammer. "Sleep duration in midlife and later life in relation to cognition." Journal of the American Geriatrics Society 62, no. 6 (2014): 1073-1081.
Dijk, D.-J. (2009). Regulation and Functional Correlates of Slow Wave Sleep. Journal of Clinical Sleep Medicine, 5(2 Suppl.), S6-S15.
Dills, A. K., & Hernández-Julián, R. (2008). Course scheduling and academic performance. Economics of Education Review, 27(6), 646-654.
Edwards, F. (2012). Early to rise? The effect of daily start times on academic performance. Economics of Education Review, 31(6), 970-983.
Eide, E. R., & Showalter, M. H. (2012). Sleep and Student Achievement. Eastern Economic Journal, 38, 1-13.
Felfe, A. C., Lechner, M., & Steinmayr, A. (2011). Sports and child development.
Fletcher, J. M. (2010). Adolescent depression and educational attainment: results using sibling fixed effects. Health Economics, 19(7), 855-871.
20
Fletcher, J. M., & Richards, M. R. (2012). Diabetes Health Shock to Schooling and Earnings: Increased Dropout Rates and Lower Wages and Employment in Young Adults. Health Affairs, 31(1), 27-34.
Goldstein, D., Hahn, C. S., Hasher, L., Wiprzycka, U. J., & Zelazo, P. D. (2007). Time of day, intellectual performance, and behavioral problems in Morning versus Evening type adolescents: Is there a synchrony effect? Personality and Individual Differences, 42(3), 431-440.
Gordon, R. A., Crosnoe, R., & Wang, X. (2013). Physical attractiveness and the accumulation of social and human capital in adolescence and young adulthood: assets and distractions. Wiley.
Kaestner, Robert & Grossman, Michael. (2009) "Effects of weight on children's educational achievement," Economics of Education Review, Elsevier, vol. 28(6), pages 651-661, December.
Gupta, R., Bhatia, M. S., Dahiya, D., Sharma, S., Sapra, R., Semalti, K., et al. (2008). Impact of primary headaches on subjective sleep parameters among adolescents. Annals of Indian Academy of Neurology, 11(3), 164-169.
Hinrichs, P. (2011). When the Bell Tolls: The Effect of School Starting Times on Academic Achievement. Education Finance and Policy, 6(4), 486-507.
Kaneita, Y., Ohida, T., Osaki, Y., Tanihata, T., Minowa, M., Suzuki, K., et al. (2006). Insomnia Among Japanese Adolescents: A Nationwide Representative Survey. SLEEP, 29(12), 1543-1550.
Kopasz, M., Loessl, B., Hornyak, M., Riemann, D., Nissen, C., Piosczyk, H., et al. (2010). Sleep and memory in healthy children and adolescents - A critical revew. Sleep Medicine Reviews, 14(3), 167-177.
Myers, J.E. & Bechtel, A. (2004). Stress, wellness, and mattering among cadets at West Point-factors affecting a fit and healthy force. Military Medicine, 169(6), 475-482.
Rees, D. I., & Sabia, J. J. (2011). The Effect of Migraine Headache on Educational Attainment. Journal of Human Resources, 46(2), 317-332.
Roth, T. (2007). Insomnia: definition, prevalence, etiology, and consequences. Journal of clinical sleep medicine: JCSM: official publication of the American Academy of Sleep Medicine, 3(5 Suppl), S7.
Sabia, J. J., & Rees, D. I. (2010). Sports Participation and Academic Performance: Evidence from the National Longitudinal Study of Adolescent Health. Economics of Education Review, 29(5), 751-759.
Sadeh, A. (2007). Consequences of Sleep Loss or Sleep Disruption in Children. Sleep Medicine Clinics, 2(3), 513-520.
Schraml, K., Perski, A., Grossi, G., & Makower, I. (2012). Chronic Stress and Its Consequences on Subsequent Academics. Journal of Educational and Developmental Psychology, 2(1), 69-79.
Shapiro, T. M. (2015). The educational effects of school start times. IZA World of Labor.

21
Suhrcke, M., & de Paz Nieves, C. (2011). The impact of health and health behaviours on educational outcomes in high-income countries: a review of the evidence. Copenhagen: WHO Regional Office for Europe.
St-Onge, M. P. (2013). The role of sleep duration in the regulation of energy balance: effects on energy intakes and expenditure. Journal of clinical sleep medicine: JCSM: official publication of the American Academy of Sleep Medicine, 9(1), 73.
Wahlstrom, K. (2002). Changing Times: Findings From the First Longitudinal Study of Later High School Start Times. NASSP Bulletin, 86(633).
Wolfson, A. R., & Carskadon, M. A. (2003). Understanding adolescent sleep patterns and school performance: a critical appraisal. Sleep Medicine Review, 7(6), 491-506.

22
Table 1 Summary Statistics for Sleep Measures and Academic Achievement
(1) (2) Full Sample Sibling Sample Panel A: Academic Performance and Sleep MeasuresSleep Hours 7.72 7.69 (1.43) (1.41) Insomnia 0.24 0.23 (0.42) (0.42)Pay Attention 0.30 0.30 (0.46) (0.46)Homework 0.31 0.30 (0.46) (0.46)GPA 2.72 2.81 (0.85) (0.83)Observations [20,267] [3,667] Panel B: Educational Attainment High School Grad 0.85 0.86 (0.36) (0.35)College Attend 0.66 0.66 (0.47) (0.47)Observations [15,543] [3,150]Notes: Unweighted means are generated using data from the National Longitudinal Study of Adolescent to Adult Health Wave I (Panel A) and Wave IV (Panel B). Standard deviations are in parentheses and sample sizes are in brackets.

23
Table 2 OLS, Family, and Individual Fixed Effects Estimates of the Relationship Between
Sleep Hours and Short-Run Academic Performance (1) (2) (3) (4) (5) VARIABLES
OLS – Wave I Sample
OLS – Sibling Wave I Sample
Family FE Sibling Wave I Sample
OLS – Panel
Waves I & II Sample
Individual FE Panel
Waves I & II Sample
Panel I: Pay Attention
Sleep Hours -0.159*** -0.147*** -0.014 -0.124*** -0.049** (0.015) (0.034) (0.043) (0.017) (0.022) Sleep Hours Squared 0.008*** 0.007*** -0.001 0.006*** 0.003** (0.001) (0.002) (0.003) (0.001) (0.001) Observations 20,267 3,667 3,667 27,794 27,794
Panel II: Homework Sleep Hours -0.151*** -0.153*** -0.092** -0.123*** -0.038*** (0.015) (0.035) (0.044) (0.017) (0.014) Sleep Hours Squared 0.008*** 0.008*** 0.004 0.006*** 0.002* (0.001) (0.002) (0.003) (0.001) (0.001) Observations 20,267 3,667 3,667 27,793 27,793
Panel III: Grade Point Average Sleep Hours 0.207*** 0.240*** 0.080 0.156*** -0.010 (0.027) (0.072) (0.081) (0.033) (0.023) Sleep Hours Squared -0.013*** -0.015*** -0.005 -0.009*** 0.000 (0.002) (0.004) (0.005) (0.002) (0.001) Observations 15,369 2,829 2,829 24,662 24,662
Unweighted ordinary least squares regressions obtained using data from the National Longitudinal Study of Adolescent to Adult Health (Add Health). Columns (1) to (3) use data from Add Health Wave I, and columns (4) and (5) use pooled data from Add Health Waves I and II. OLS models include controls for gender, age, age squared, race, parental income, maternal education, parental marital status, urbanacity, and comorbidity variables (i.e., indicators for overweight, diabetes, migraine, and asthma). Family and individual fixed effects estimates include controls for gender, age, age squared and comorbidity variables. ***Significant at 1% level **at 5% level *at 1% level. Standard errors are clustered on the school, family, and individual in columns (1), (2), and (4), respectively.

24
Table 3 Family Fixed Effects Estimates of the Relationship Between Sleep Hours and
Longer-Run Educational Attainment (1) (2) (3) VARIABLES OLS – Full
Sample OLS – Sibling Sample
Family FE Sibling Sample
Panel I: High School Graduation
Sleep Hours 0.133*** 0.171*** 0.086* (0.023) (0.035) (0.045) Sleep Hours Squared -0.009*** -0.011*** -0.005* (0.001) (0.002) (0.003) Observations 15,542 3,150 3,150
Panel II: College Attendance Sleep Hours 0.096*** 0.140*** 0.134**
(0.020) (0.047) (0.062) Sleep Hours Squared -0.007*** -0.010*** -0.009** (0.001) (0.003) (0.004) Observations 15,543 3,150 3,150 Notes: Unweighted ordinary least squares regressions obtained using the National Longitudinal Study of Adolescent to Adult Health. Dependent variables (i.e., High School Graduation and College Attendance) and comorbidity variables (i.e., overweight, diabetes, migraine, and asthma) are measured at Wave IV. All other covariates including Sleep Hours are measured at Waves I and II. OLS models include controls for gender, age, age squared, race, parental income, maternal education, parental marital status, urbanacity, and comorbidity variables (i.e., indicators for overweight, diabetes, migraine, and asthma). Family fixed effects estimates include controls for gender, age, age squared and comorbidity variables. ***Significant at 1% level **at 5% level *at 1% level. Standard errors are clustered on the school and family in columns (1) and (2), respectively.

25
Table 4 Sensitivity of the Estimates of the Relationship Between Sleep Hours and Short-Run
Academic Performance to Use of Insomnia Measure (1) (2) (3) (4) Family FE
Wave 1 Sample
Family FE
Wave 1 Sample
Individual FE Panel
Waves I & II Sample
Individual FE Panel
Waves I & II Sample
Panel I: Pay Attention
Insomnia 0.162*** 0.155*** 0.085*** 0.083*** (0.024) (0.025) (0.009) (0.009) Sleep Hours 0.008 -0.041*** (0.043) (0.014) Sleep Hours Squared -0.002 0.002*** (0.003) (0.001) Observations 3,667 3,667 27,793 27,793
Panel II: Homework Insomnia 0.158*** 0.148*** 0.054*** 0.051*** (0.025) (0.025) (0.009) (0.009) Sleep Hours -0.071 -0.033** (0.044) (0.014) Sleep Hours Squared 0.003 0.001 (0.003) (0.001) Observations 3,667 3,667 27,792 27,792
Panel III: Grade Point Average Insomnia -0.041 -0.038 -0.032** -0.032** (0.046) (0.047) (0.014) (0.014) Sleep Hours 0.075 -0.013 (0.081) (0.023) Sleep Hours Squared -0.005 0.001 (0.005) (0.001) Observations 2,829 2,829 24,661 24,661
Unweighted ordinary least squares regressions obtained using data from the National Longitudinal Study of Adolescent to Adult Health (Add Health). Columns (1) and (2) use data from Add Health Wave I, and columns (4) and (5) use pooled data from Add Health Waves I and II. Models control for gender, age, age squared and comorbidity variables. ***Significant at 1% level **at 5% level *at 1% level.

26
Table 5 Sensitivity of the Estimates of the Relationship Between Sleep Hours and Longer-
Run Educational Attainment to Use of Insomnia Measure (1) (2) Family FE
Sibling Sample
Family FE Sibling Sample
Panel I: High School Grad
Insomnia 0.000 0.004 (0.016) (0.016) Sleep Hours 0.087* (0.045) Sleep Hours Squared -0.005* (0.003) Observations 3,148 3,148
Panel II: College Attend Insomnia -0.021 -0.019 (0.022) (0.022) Sleep Hours 0.131** (0.062) Sleep Hours Squared -0.009** (0.004) Observations 3,148 3,148 Notes: Unweighted ordinary least squares regressions obtained using the National Longitudinal Study of Adolescent to Adult Health. Dependent variables (i.e., High School Graduation and College Attendance) and comorbidity variables (i.e., overweight, diabetes, migraine, and asthma) are measured at Wave IV. Models control for gender, age, age squared and comorbidity variables. ***Significant at 1% level **at 5% level *at 1% level.

27
Table 6 Sensitivity of the Estimates of the Relationship Between Sleep Hours and Longer-
Run Educational Attainment to Controlling for Difficulty Paying Attention in Class and Difficulty Completing Homework During High School
(1) (2) Family FE
Sibling Sample
Family FE Sibling Sample
Panel I: High School Grad
Sleep Hours 0.086* 0.063 (0.045) (0.045) Sleep Hours Squared -0.005* -0.004 (0.003) (0.003) Pay Attention Wave I -0.034* (0.019) Pay Attention Wave II 0.003 (0.020) Homework Wave I -0.004 (0.019) Homework Wave II -0.023 (0.020) Observations 3,150 3,150
Panel II: College Attend Sleep Hours 0.134** 0.113* (0.062) (0.062) Sleep Hours Squared -0.009** -0.008* (0.004) (0.004) Pay Attention Wave I 0.011 (0.026) Pay Attention Wave II -0.038 (0.028) Homework Wave I -0.005 (0.026) Homework Wave II 0.037 (0.028) Observations 3,150 3,150 Notes: Unweighted ordinary least squares regressions obtained using the National Longitudinal Study of Adolescent to Adult Health. Dependent variables (i.e., High School Graduation and College Attendance) and binary indicators for comorbid conditions (i.e., overweight, diabetes, migraine, and asthma) are measured at Wave IV. All other covariates including Sleep Hours, Difficulty Completing Homework and Difficulty Paying Attention in Class are measured at Waves I and II. Models control for gender dummy, age, age squared and binary indicators for comorbidities. ***Significant at 1% level **at 5% level *at 1% level

28
Appendix Table 1 Means of the Control Variables
Full Sample Sibling Sample
Male 0.50 0.50 (0.50) (0.50) Age 15.62 15.60 (1.76) (1.67) Black 0.23 0.21 (0.42) (0.40) Other ethnicity 0.16 0.16 (0.37) (0.37) Hispanic 0.17 0.15 (0.37) (0.36) Log parental income 2.61 2.73 (1.71) (1.67) Mother's education: high school 0.34 0.34 (0.47) (0.47) Mother's education: some college 0.19 0.18 (0.39) (0.39) Mother's education: college 0.25 0.26 (0.44) (0.44) Parents are married 0.60 0.64 (0.49) (0.48) Parents are divorced/separated 0.20 0.19 (0.40) (0.39) Urban residence 0.57 0.51 (0.50) (0.50) Overweight or obese 0.15 0.13 (0.35) (0.34) Diabetes 0.00 0.00 (0.06) (0.06) Migraine 0.10 0.10 (0.30) (0.29) Allergies 0.34 0.31 (0.47) (0.46) Observations [20,267] [3,667]
Notes: Unweighted means are generated using data drawn from the Wave I of the National Longitudinal Study of Adolescent to Adult Health. Standard deviations are in parentheses.

29
Appendix Table 2 OLS Estimates of Control Variables in Short-Run Academic Performance and
Longer-Run Educational Attainment Regressions (1) (2) (3) (4) (5) VARIABLES Pay
Attention Homework GPA High School
Grad College Attend
Sleep Hours -0.159*** -0.151*** 0.207*** 0.133*** 0.096*** (0.014) (0.014) (0.027) (0.023) (0.020) Sleep Hours Squared 0.008*** 0.008*** -0.013*** -0.009*** -0.007*** (0.001) (0.001) (0.002) (0.001) (0.001) Male 0.070*** 0.104*** -0.251*** -0.057*** -0.099*** (0.006) (0.006) (0.013) (0.007) (0.008) Age 0.173*** 0.170*** -0.544*** -0.177*** 0.103 (0.029) (0.029) (0.060) (0.060) (0.075) Age squared -0.005*** -0.005*** 0.017*** 0.003*** -0.002 (0.001) (0.001) (0.002) (0.001) (0.001) Black -0.105*** -0.078*** -0.180*** 0.009 -0.023 (0.008) (0.008) (0.016) (0.010) (0.016) Other ethnicity -0.055*** -0.022** 0.122*** 0.031*** 0.020 (0.010) (0.010) (0.021) (0.012) (0.021) Hispanic -0.041*** -0.008 -0.192*** 0.006 0.003 (0.010) (0.010) (0.022) (0.015) (0.021) Log parental income 0.015*** 0.019*** 0.080*** 0.048*** 0.075*** (0.005) (0.005) (0.010) (0.007) (0.010) Mother's education: high school 0.008 0.009 0.111*** 0.106*** 0.108*** (0.010) (0.010) (0.021) (0.017) (0.016) Mother's education: some college 0.034*** 0.013 0.242*** 0.146*** 0.245*** (0.011) (0.011) (0.024) (0.019) (0.018) Mother's education: college 0.033*** 0.003 0.420*** 0.192*** 0.335*** (0.011) (0.011) (0.023) (0.020) (0.019) Parents are married -0.008 -0.010 0.115*** 0.094*** 0.047** (0.015) (0.015) (0.031) (0.016) (0.019) Parents are divorced/separated 0.031** 0.046*** -0.020 0.038** 0.020 (0.015) (0.016) (0.032) (0.018) (0.021) Urban residence -0.001 0.018*** -0.057*** -0.010 0.028* (0.007) (0.007) (0.014) (0.010) (0.016) Overweight or obese -0.007 -0.006 -0.110*** 0.006 -0.027*** (0.009) (0.009) (0.019) (0.008) (0.010) Diabetes -0.010 -0.097** -0.111 -0.015 -0.049** (0.053) (0.049) (0.129) (0.017) (0.025) Migraine 0.028** 0.020* -0.052** -0.046*** -0.027** (0.011) (0.011) (0.022) (0.009) (0.011) Allergies 0.004 -0.001 0.043*** -0.026*** 0.004 (0.007) (0.007) (0.014) (0.008) (0.010) Observations 20,267 20,267 15,369 15,542 15,543 Notes: Unweighted ordinary least squares regressions obtained using the National Longitudinal Study of Adolescent to Adult Health. In columns (4) and (5) High School Graduation, College Attendance, Overweight or obese, Diabetes, Migraine, and Allergies are measured at Wave IV. All other covariates are measured at Wave I. ***Significant at 1% level **at 5% level *at 1% level. Standard errors are clustered on the school.
30
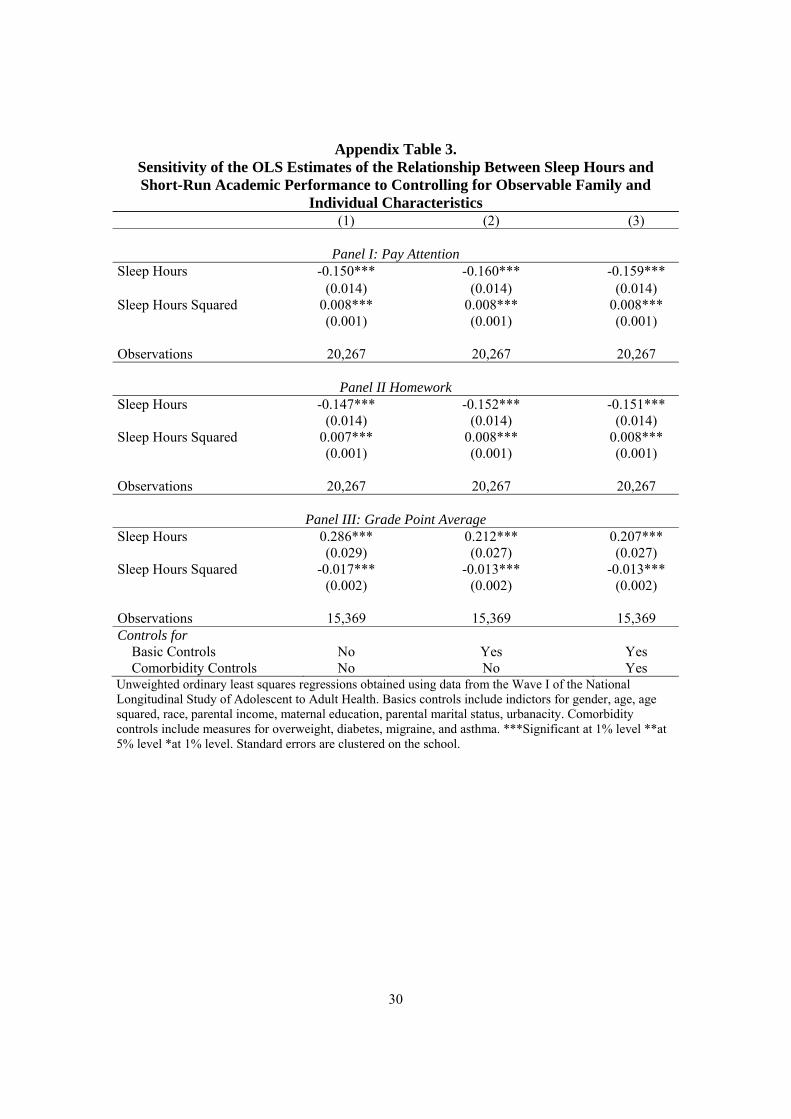
Appendix Table 3. Sensitivity of the OLS Estimates of the Relationship Between Sleep Hours and Short-Run Academic Performance to Controlling for Observable Family and
Individual Characteristics (1) (2) (3)
Panel I: Pay Attention Sleep Hours -0.150*** -0.160*** -0.159*** (0.014) (0.014) (0.014) Sleep Hours Squared 0.008*** 0.008*** 0.008*** (0.001) (0.001) (0.001) Observations 20,267 20,267 20,267
Panel II Homework Sleep Hours -0.147*** -0.152*** -0.151*** (0.014) (0.014) (0.014) Sleep Hours Squared 0.007*** 0.008*** 0.008*** (0.001) (0.001) (0.001) Observations 20,267 20,267 20,267
Panel III: Grade Point Average Sleep Hours 0.286*** 0.212*** 0.207*** (0.029) (0.027) (0.027) Sleep Hours Squared -0.017*** -0.013*** -0.013*** (0.002) (0.002) (0.002) Observations 15,369 15,369 15,369 Controls for Basic Controls No Yes Yes Comorbidity Controls No No Yes Unweighted ordinary least squares regressions obtained using data from the Wave I of the National Longitudinal Study of Adolescent to Adult Health. Basics controls include indictors for gender, age, age squared, race, parental income, maternal education, parental marital status, urbanacity. Comorbidity controls include measures for overweight, diabetes, migraine, and asthma. ***Significant at 1% level **at 5% level *at 1% level. Standard errors are clustered on the school.

31
Appendix Table 4 Sensitivity of the OLS Estimates of the Relationship Between Sleep Hours and
Longer-Run Educational Attainment to Controlling for Observable Family and Individual Characteristics
(1) (2) (3)
Panel I: High School Grad Sleep Hours 0.157*** 0.137*** 0.133*** (0.027) (0.023) (0.023) Sleep Hours Squared -0.011*** -0.009*** -0.009*** (0.002) (0.001) (0.001) Observations 15,680 15,542 15,542
Panel II: College Attend Sleep Hours 0.140*** 0.098*** 0.096*** (0.026) (0.020) (0.020) Sleep Hours Squared -0.010*** -0.007*** -0.007*** (0.002) (0.001) (0.001) Observations 15,681 15,543 15,543 Controls for Basic Controls No Yes Yes Comorbidity Controls No No Yes Unweighted ordinary least squares regressions obtained using the National Longitudinal Study of Adolescent to Adult Health. Dependent variables (i.e., High School Graduation and College Attendance) and comorbidity controls are measured at Wave IV. Sleep hours are measured at Waves 1 and II. Basics controls include indictors for gender, age, age squared, race, parental income, maternal education, parental marital status, urbanacity. Comorbidity controls include measures for overweight, diabetes, migraine, and asthma. ***Significant at 1% level **at 5% level *at 1% level. Standard errors are clustered on the school.
32
Appendix Table 5 Sensitivity of the Estimates of the Relationship Between Sleep Hours and Short-Run
Academic Performance to Controlling for Eating Breakfast, Sports Participation, and Television Watching
(1) (2) (3) (4) Family FE
Wave 1 Sample
Family FE
Wave 1 Sample
Individual FE Panel
Waves I & II Sample
Individual FE Panel
Waves I & II Sample
Panel I: Pay Attention
Sleep Hours -0.018 -0.011 -0.048*** -0.048*** (0.043) (0.044) (0.014) (0.014) Sleep Hours Squared -0.001 -0.001 0.003*** 0.003*** (0.003) (0.003) (0.001) (0.001) Observations 3,656 3,656 27,698 27,698
Panel II: Homework Sleep Hours -0.094** -0.086* -0.035** -0.036** (0.044) (0.044) (0.014) (0.014) Sleep Hours Squared 0.004 0.004 0.002* 0.002* (0.003) (0.003) (0.001) (0.001) Observations 3,656 3,656 27,696 27,696
Panel III: Grade Point Average Sleep Hours 0.059 0.061 -0.008 -0.008 (0.079) (0.080) (0.023) (0.023) Sleep Hours Squared -0.004 -0.004 0.000 0.000 (0.005) (0.005) (0.001) (0.001) Observations 2,821 2,821 24,578 24,578 Controls for Basic Controls Yes Yes Yes Yes Comorbidity Controls Yes Yes Yes Yes Sports Participation No Yes No Yes TV Hours No Yes No Yes Skipping Breakfast No Yes No Noa
Unweighted ordinary least squares regressions obtained using data from the National Longitudinal Study of Adolescent to Adult Health (Add Health). Columns (1) and (2) use data from Add Health Wave I, and columns (4) and (5) use pooled data from Add Health Waves I and II. Models control for gender, age, age squared and comorbidity variables. ***Significant at 1% level **at 5% level *at 1% level. a Because information on breakfast status is not consistent between the Waves 1 and 2, we are not able to control for Skipping Breakfast in regressions that use pooled data from Waves 1 and 2.

33
Appendix Table 6 Sensitivity of the Estimates of the Relationship Between Sleep Hours and Longer-
Run Educational Attainment to Controlling for Eating Breakfast, Sports Participation, and Television Watching
-- Family FE Sibling Sample -- (1) (2)
Panel I: High School Graduation Sleep Hours 0.086* 0.079* (0.045) (0.046) Sleep Hours Squared -0.005* -0.005 (0.003) (0.003) Observations 3,150 3,150
Panel II: College Attendance Sleep Hours 0.134** 0.127** (0.062) (0.063) Sleep Hours Squared -0.009** -0.009** (0.004) (0.004) Observations 3,150 3,150 Controls for Basic Controls Yes Yes Comorbidity Controls Yes Yes Sports Participation No Yes TV Hours No Yes Skipping Breakfast No Yes Notes: Unweighted ordinary least squares regressions obtained using the National Longitudinal Study of Adolescent to Adult Health. Dependent variables (i.e., High School Graduation and College Attendance) and comorbidity variables (i.e., overweight, diabetes, migraine, and asthma) are measured at Wave IV. Models control for gender, age, age squared and comorbidity variables. ***Significant at 1% level **at 5% level *at 1% level.