slide 1 of 45 worked examples follow:. slide 2 of 45
Post on 18-Dec-2015
213 views
TRANSCRIPT

Slide 1 of 45
Worked Examples Follow:

Slide 2 of 45

Slide 3 of 45

Slide 4 of 45

Slide 5 of 45
Slide 6 of 45

Slide 7 of 45

Slide 8 of 45

Slide 9 of 45
Slide 10 of 45
CRS Questions Follow:

Slide 11 of 45
volume of titrant / ml
pH
equivalence point
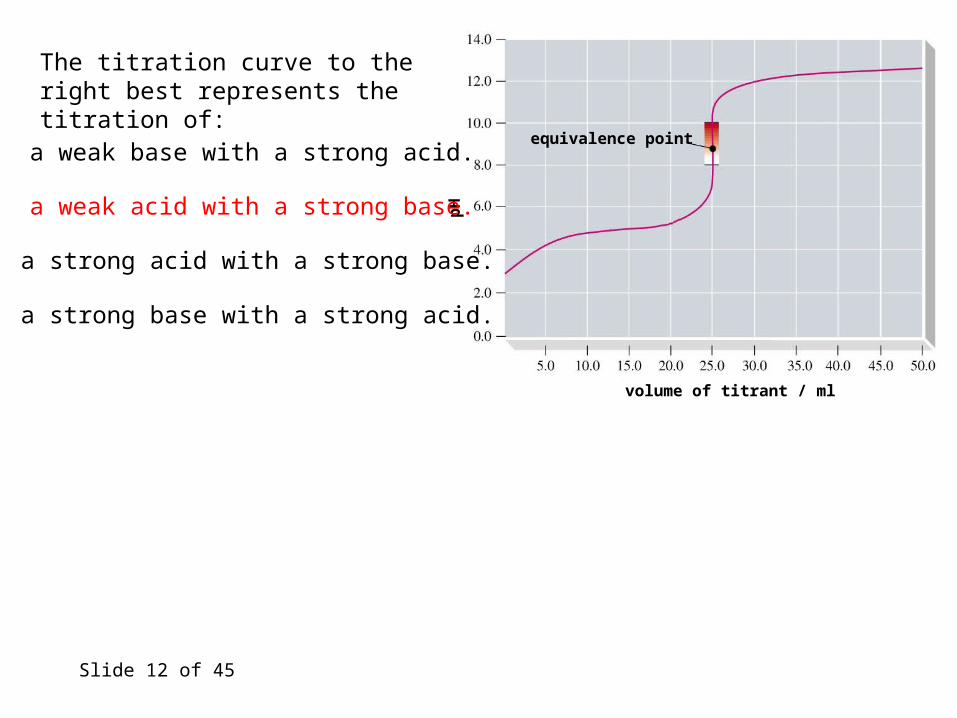
The titration curve to the right best represents the titration of :
1. a weak base with a strong acid.
2. a weak acid with a strong base.
3. a strong acid with a strong base.
4. a strong base with a strong acid.
Slide 12 of 45
volume of titrant / ml
pH
equivalence point
The titration curve to the right best represents the titration of:
1. a weak base with a strong acid.
2. a weak acid with a strong base.
3. a strong acid with a strong base.
4. a strong base with a strong acid.

Slide 13 of 45
volume of titrant / ml10 20 30 40 50
pH
0
7
14
volume of titrant / ml10 20 30 40 50
pH0
7
14
volume of titrant / ml10 20 30 40 50
pH
0
7
14
Which of the following titration curves best represents the titration of 15.0 mL of 0.010 M NaOH with 0.0060 M HCl?
1. 2. 3.

Slide 14 of 45
volume of titrant / ml10 20 30 40 50
pH
0
7
14
volume of titrant / ml10 20 30 40 50
pH0
7
14
volume of titrant / ml10 20 30 40 50
pH
0
7
14
Which of the following titration curves best represents the titration of 15.0 mL of 0.010 M NaOH with 0.0060 M HCl?
1. 2. 3.

Slide 15 of 45
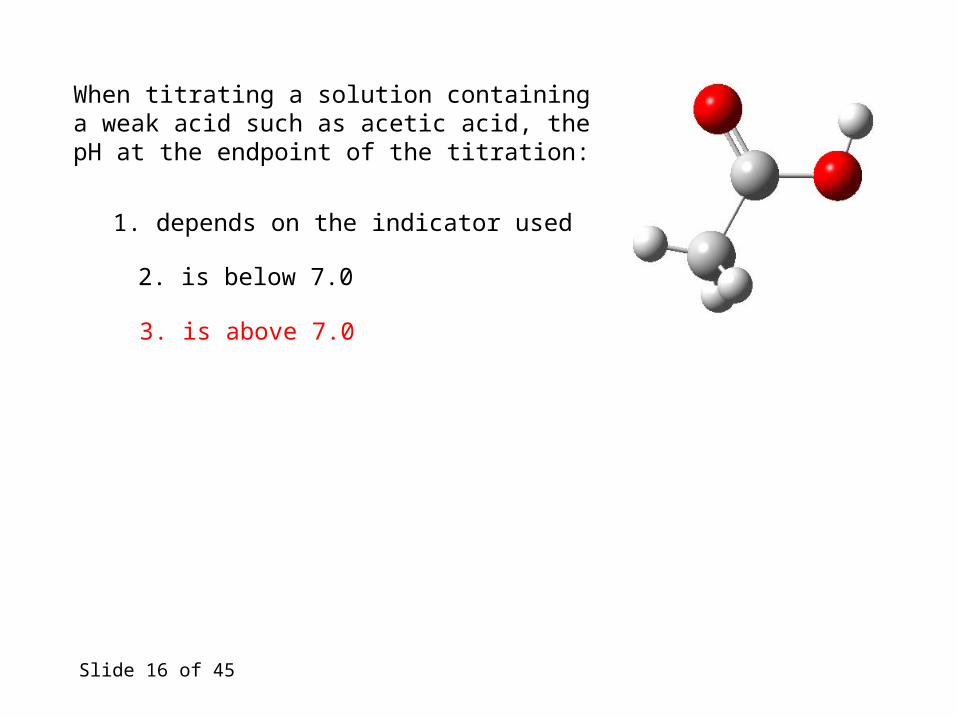
When titrating a solution containing a weak acid such as acetic acid, the pH at the endpoint of the titration:
1. depends on the indicator used
2. is below 7.0
3. is above 7.0
Slide 16 of 45
When titrating a solution containing a weak acid such as acetic acid, the pH at the endpoint of the titration:
1. depends on the indicator used
2. is below 7.0
3. is above 7.0
Slide 17 of 45
Try end of chapter questions beginning on page 737:
# 1, 7, 9, 23, 39, 41, 97, 98, 99, 100