slide 1 plan−do−study−act! using the pdsa cycle to improve your performance improvement...
TRANSCRIPT
Slide 1
Plan−Do−Study−Act!Plan−Do−Study−Act!Using the PDSA Cycle to Improve Your Using the PDSA Cycle to Improve Your
Performance Improvement ProjectsPerformance Improvement Projects
March 18, 2014
Presenter:
Christi Melendez, RN, CPHQAssociate Director, Performance Improvement ProjectsHealth Services Advisory Group, Inc.
Slide 2
Performance Improvement Principle
• Your current systems and improvement strategies have resulted in your current outcomes.
• What you’re doing is getting you the results you have.
• To GET different results, you have to DO something different.
Slide 3
Selecting Changes
While all changes do not lead to improvement, all improvement requires change.
What changes can you make that will
result in improvement?

Slide 4
PDSA Cycle
Slide 5
Identifying Barriers
• Conduct an initial barrier analysis to identify possible barriers.
– Brainstorming and the “Five Whys”
– Fishbone Diagram
– Key Driver Diagram
Slide 6
Prioritizing Barriers
• Request data related to identified barriers.
• Evaluate whether data support barriers’ relevance.
• Rank barriers—from highest to lowest priority.

Slide 7
Plan Interventions
Development of Interventions
Avoid “Passive” Interventions•Mailers
•Reminder letters
•Newsletter articles
•Postcards, flyers, and brochures
•Updating Web site/portals
•Robot calls
Slide 8
Plan Interventions (cont.)
Develop “Active” intervention(s) that directly address prioritized barriers and will impact indicator outcomes.•Face-to-face education efforts (enrollee and provider)•Outreach events—“boots on the ground”•Policy/process changes•Performance report cards•Incentive programs (enrollee and provider)
Slide 9
PDSA Cycle
• Develop a strategy to implement the interventions.
• Develop a plan to test the intervention (Who? What? When? Where? What data need to be collected?)
Slide 10
PDSA Cycle (cont.)
• Try the intervention on a small scale.
• Carry out the intervention as designed.
It’s better to do a few interventions well!

Slide 11
PDSA Cycle (cont.)
• Evaluate the effectiveness of the intervention.
• Analyze your results.
• What did you learn?
• What were the results compared to your prediction?
Slide 12
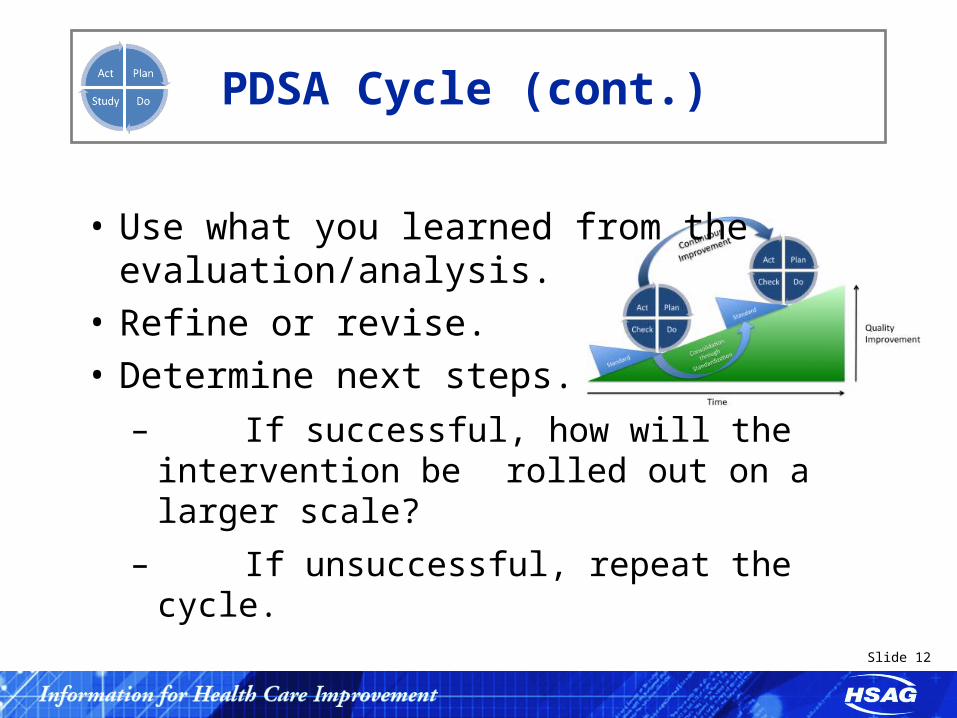
PDSA Cycle (cont.)
• Use what you learned from the evaluation/analysis.
• Refine or revise.
• Determine next steps.
– If successful, how will the intervention be rolled out on a larger scale?
– If unsuccessful, repeat the cycle.

Slide 13
What It Takes to Get Improvement
Improvement will not happen without these components:
WillIdeasExecution

Slide 14
Setting Goals
What are you trying to accomplish?
The goal should be “S-M-A-R-T”.
Specific
Measurable
Attainable
Relevant
Time-bound

Slide 15
Managed Medical Assistance (MMA) Statewide PIPs
There are two statewide PIPs:1.Preventive Dental Services for Children
2.Improving Prenatal Care and Well-Child Visits in the First Fifteen Months of Life—Six or More Visits
Slide 16
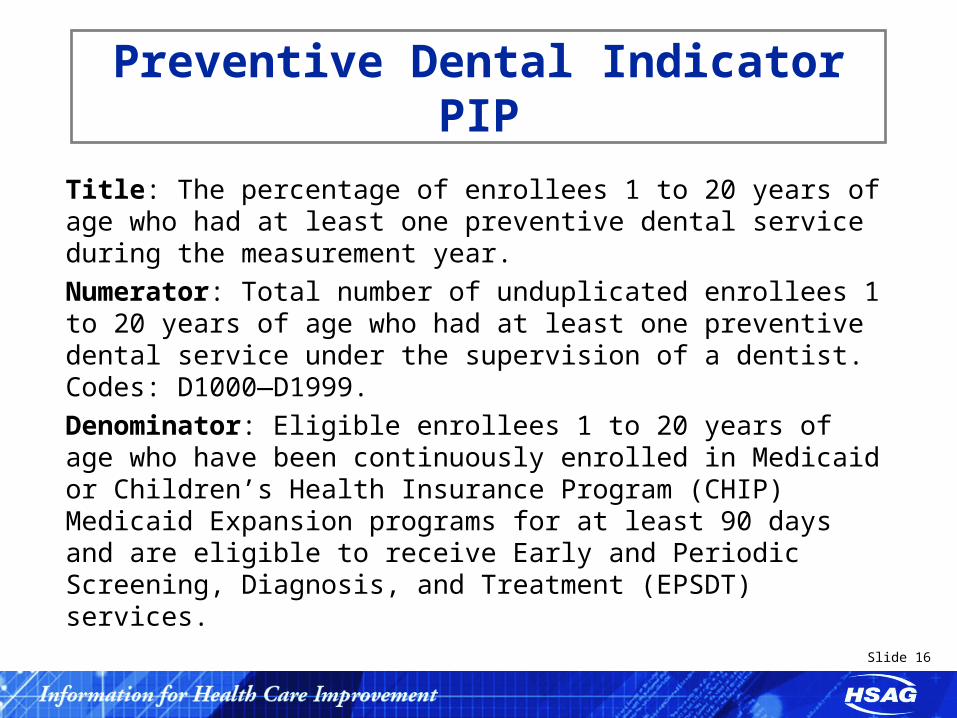
Preventive Dental Indicator PIP
Title: The percentage of enrollees 1 to 20 years of age who had at least one preventive dental service during the measurement year.
Numerator: Total number of unduplicated enrollees 1 to 20 years of age who had at least one preventive dental service under the supervision of a dentist. Codes: D1000—D1999.
Denominator: Eligible enrollees 1 to 20 years of age who have been continuously enrolled in Medicaid or Children’s Health Insurance Program (CHIP) Medicaid Expansion programs for at least 90 days and are eligible to receive Early and Periodic Screening, Diagnosis, and Treatment (EPSDT) services.

Slide 17
Prenatal/WCV PIP
Four Potential Study IndicatorsPotential Study Indicator #1Title: The percentage of women who had a live birth and received a prenatal care visit as an enrollee of the MMA plan in the first trimester or within 42 days of enrollment in the health plan.Numerator: Total number of women who had a live birth and received a prenatal visit in the first trimester or within 42 days of enrollment.Denominator: Eligible women who delivered a live birth on or between November 6 of the year prior to the measurement year and November 5 of the measurement year.

Slide 18
Prenatal/WCV PIP (cont.)
Potential Study Indicator #2Title: The percentage of women who had a live birth and received greater than or equal to 81 percent of expected prenatal visits.Numerator: Total number of women who had an unduplicated count of greater than or equal to 81 percent of the number of expected prenatal visits (adjusted for the month of pregnancy at time of enrollment and gestational age).Denominator: Eligible women who delivered a live birth on or between November 6 of the year prior to the measurement year and November 5 of the measurement year.
Slide 19
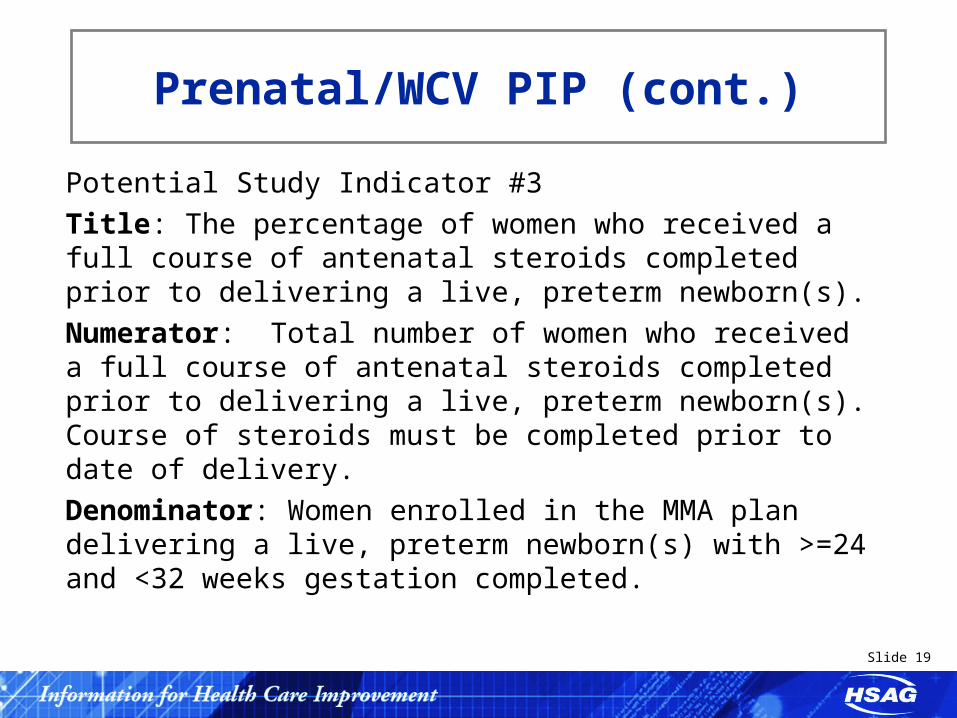
Prenatal/WCV PIP (cont.)
Potential Study Indicator #3
Title: The percentage of women who received a full course of antenatal steroids completed prior to delivering a live, preterm newborn(s).
Numerator: Total number of women who received a full course of antenatal steroids completed prior to delivering a live, preterm newborn(s). Course of steroids must be completed prior to date of delivery.
Denominator: Women enrolled in the MMA plan delivering a live, preterm newborn(s) with >=24 and <32 weeks gestation completed.
Slide 20
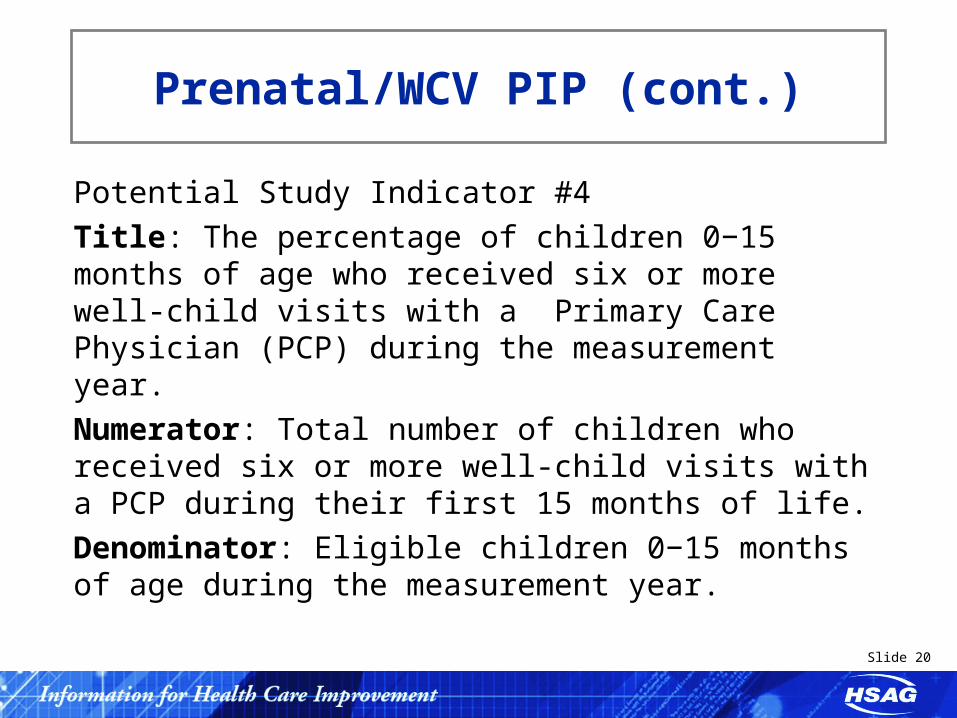
Prenatal/WCV PIP (cont.)
Potential Study Indicator #4
Title: The percentage of children 0−15 months of age who received six or more well-child visits with a Primary Care Physician (PCP) during the measurement year.
Numerator: Total number of children who received six or more well-child visits with a PCP during their first 15 months of life.
Denominator: Eligible children 0−15 months of age during the measurement year.
Slide 21
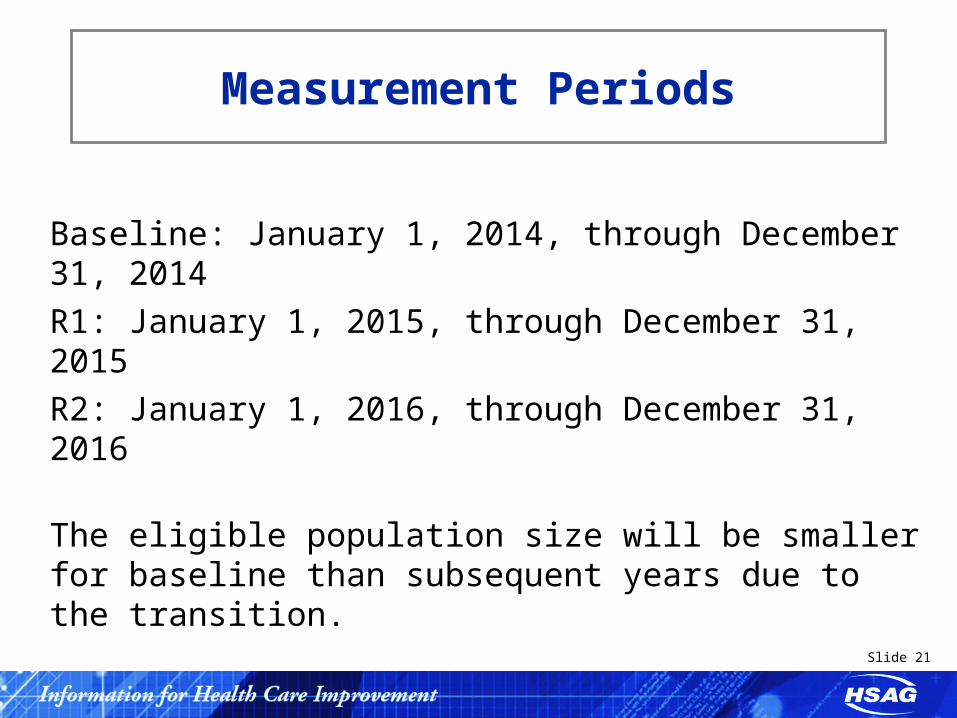
Measurement Periods
Baseline: January 1, 2014, through December 31, 2014
R1: January 1, 2015, through December 31, 2015
R2: January 1, 2016, through December 31, 2016
The eligible population size will be smaller for baseline than subsequent years due to the transition.
Slide 22
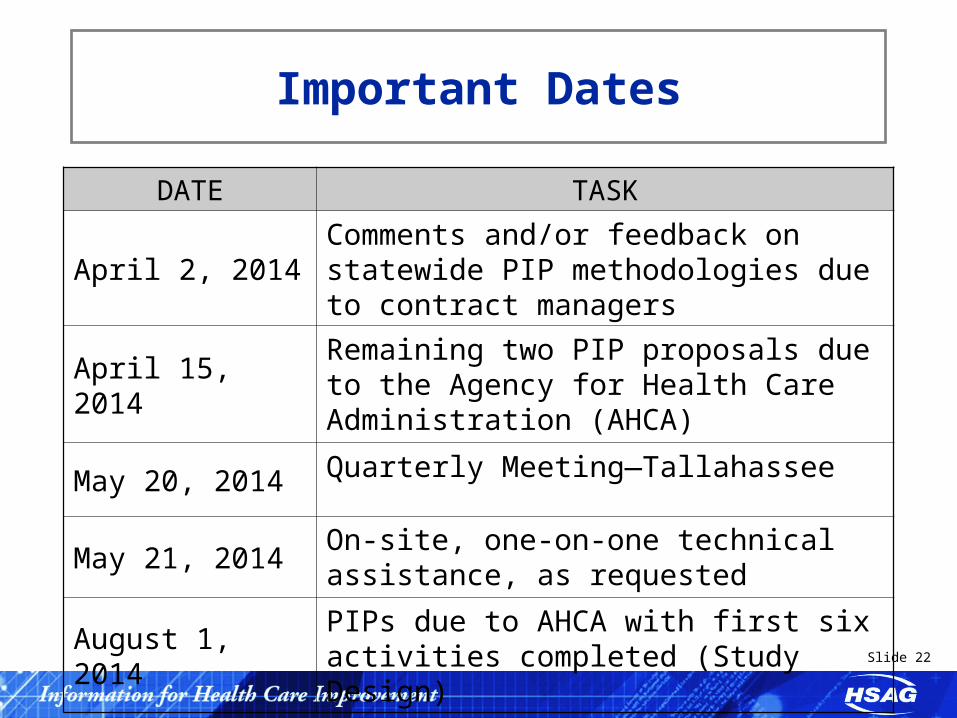
Important Dates
DATE TASK
April 2, 2014Comments and/or feedback on statewide PIP methodologies due to contract managers
April 15, 2014Remaining two PIP proposals due to the Agency for Health Care Administration (AHCA)
May 20, 2014 Quarterly Meeting—Tallahassee
May 21, 2014On-site, one-on-one technical assistance, as requested
August 1, 2014PIPs due to AHCA with first six activities completed (Study Design)
Slide 23
Questions