slide 1 recovery oriented computing dave patterson university of california at berkeley...
TRANSCRIPT

Slide 1
Recovery Oriented Computing
Dave PattersonUniversity of California at Berkeley
http://roc.CS.Berkeley.EDU/
September 2001
Slide 2
Outline• What have we been doing • Motivation for a new Challenge:
making things work (including endorsements)
• What have we learned
• New Challenge: Recovery-Oriented Computer
• Examples: benchmarks, prototypes

Slide 3
Goals,Assumptions of last 15 years
• Goal #1: Improve performance• Goal #2: Improve performance• Goal #3: Improve cost-performance• Assumptions
– Humans are perfect (they don’t make mistakes during installation, wiring, upgrade, maintenance or repair)
– Software will eventually be bug free (good programmers write bug-free code)
– Hardware MTBF is already very large (~100 years between failures), and will continue to increase

Slide 4
After 15 year improving Performance
• Availability is now a vital metric for servers!– near-100% availability is becoming mandatory
» for e-commerce, enterprise apps, online services, ISPs
– but, service outages are frequent» 65% of IT managers report that their websites were
unavailable to customers over a 6-month period•25%: 3 or more outages
– outage costs are high» social effects: negative press, loss of customers
who “click over” to competitor
Source: InternetWeek 4/3/2000

Slide 5
Downtime Costs (per Hour)• Brokerage operations $6,450,000• Credit card authorization $2,600,000• Ebay (1 outage 22 hours) $225,000• Amazon.com $180,000• Package shipping services $150,000• Home shopping channel $113,000• Catalog sales center $90,000• Airline reservation center $89,000• Cellular service activation $41,000• On-line network fees $25,000• ATM service fees $14,000
Source: InternetWeek 4/3/2000 + Fibre Channel: A Comprehensive Introduction, R. Kembel 2000, p.8. ”...based on a survey done by Contingency Planning Research."

Slide 6
Jim Gray: Trouble-Free Systems
• Manager – Sets goals– Sets policy– Sets budget– System does the rest.
• Everyone is a CIO (Chief Information Officer)
• Build a system – used by millions of people each day– Administered and managed by a ½ time person.
» On hardware fault, order replacement part» On overload, order additional equipment» Upgrade hardware and software automatically.
“What Next? A dozen remaining IT problems”
Turing Award Lecture, FCRC,
May 1999Jim GrayMicrosoft

Slide 7
Lampson: Systems Challenges• Systems that work
– Meeting their specs– Always available– Adapting to changing environment– Evolving while they run– Made from unreliable components– Growing without practical limit
• Credible simulations or analysis• Writing good specs• Testing• Performance
– Understanding when it doesn’t matter
“Computer Systems Research-Past and Future”
Keynote address, 17th SOSP,
Dec. 1999Butler Lampson
Microsoft

Slide 8
Hennessy: What Should the “New World” Focus Be?• Availability
– Both appliance & service• Maintainability
– Two functions:» Enhancing availability by preventing failure» Ease of SW and HW upgrades
• Scalability– Especially of service
• Cost– per device and per service transaction
• Performance– Remains important, but its not SPECint
“Back to the Future: Time to Return to Longstanding
Problems in Computer Systems?” Keynote address,
FCRC, May 1999
John HennessyStanford

Slide 9
The real scalability problems: AME
• Availability– systems should continue to meet quality of service
goals despite hardware and software failures
• Maintainability– systems should require only minimal ongoing human
administration, regardless of scale or complexity: Today, cost of maintenance = 10X cost of purchase
• Evolutionary Growth– systems should evolve gracefully in terms of
performance, maintainability, and availability as they are grown/upgraded/expanded
• These are problems at today’s scales, and will only get worse as systems grow

Slide 10
Total Cost of Ownership (IBM)
HW
management
3%
Environmental
14%
Downtime
20%
Purchase
20%
Administration
13%
Backup
Restore
30%
•Administration: all people time•Backup Restore: devices, media, and people time•Environmental: floor space, power, air conditioning

Slide 11
Lessons learned from Past Projects for which might help
AME• Know how to improve performance (and cost)
– Run system against workload, measure, innovate, repeat– Benchmarks standardize workloads, lead to competition,
evaluate alternatives; turns debates into numbers• Major improvements in Hardware Reliability
– 1990 Disks 50,000 hour MTBF to 1,200,000 in 2000– PC motherboards from 100,000 to 1,000,000 hours
• Yet Everything has an error rate– Well designed and manufactured HW: >1% fail/year– Well designed and tested SW: > 1 bug / 1000 lines– Well trained people doing routine tasks: 1%-2%– Well run collocation site (e.g., Exodus):
1 power failure per year, 1 network outage per year

Slide 12
Lessons learned from Past Projects for AME
• Maintenance of machines (with state) expensive– ~5X to 10X cost of HW– Stateless machines can be trivial to maintain (Hotmail)
• System admin primarily keeps system available– System + clever human working during failure =
uptime– Also plan for growth, software upgrades, configuration,
fix performance bugs, do backup
• Software upgrades necessary, dangerous– SW bugs fixed, new features added, but stability?– Admins try to skip upgrades, be the last to use one

Slide 13
Lessons learned from Internet• Realities of Internet service
environment:– hardware and software failures are inevitable
» hardware reliability still imperfect» software reliability thwarted by rapid evolution» Internet system scale exposes second-order failure
modes
– system failure modes cannot be modeled or predicted
» commodity components do not fail cleanly» black-box system design thwarts models» unanticipated failures are normal
– human operators are imperfect» human error accounts for ~50% of all system failures
Sources: Gray86, Hamilton99, Menn99, Murphy95, Perrow99, Pope86
cheap building blkscheap building blks

Slide 14
Cause of System Crashes
20%10%
5%
50%
18%
5%
15%
53%
69%
15% 18% 21%
0%
20%
40%
60%
80%
100%
1985 1993 2001
Other: app, power, network failure
System management: actions + N/problem
Operating Systemfailure
Hardware failure
(est.)
Lessons learned from Past Projects for AME
• Failures due to people up, hard to measure– VAX crashes ‘85, ‘93 [Murp95]; extrap. to ‘01– HW/OS 70% in ‘85 to 28% in ‘93. In ‘01, 10%?– How get administrator to admit mistake? (Heisenberg?)

Slide 15
Lessons learned from Past Projects for AME
• “Sources of Failure in the Public Switched Telephone Network,” Kuhn– FCC Records 1992-1994; IEEE Computer, 30:4 (Apr
97)– Overload (not sufficient switching to lower costs)
another 6% outages, 44% minutes
Number of Outages
Human-company
Human-external
HW failures
Act of Nature
SW failure
Vandalism
Minutes of Failure

Slide 16
Learning from other fields: PSTN
• FCC-collected data on outages in the US public-switched telephone network
– metric: breakdown of customer calls blocked by system outages (excluding natural disasters). Jan-June 2001
9%
47%
17%
5%
22%
Human-co.
Human-ext.
Hardware Failure
Software Failure
Overload
Vandalism
Human error accounts for 56%56% of all blocked calls
– comparison with 1992-4 data shows that human error is the only factor that is not improving over time

Slide 17
Lessons learned from Past Projects for AME
• Components fail slowly– Disks, Memory, Software give indications before fail
(Interfaces don’t pass along this information)
• Component performance varies– Disk inner track vs. outer track: 1.8X Bandwidth– Refresh of DRAM– Daemon processes in nodes of cluster– Error correction, retry on some storage accesses– Maintenance events in switches
(Interfaces don’t pass along this information)

Slide 18
Lessons Learned from Other Fields
Common threads in accidents ~3 Mile Island1.More multiple failures than you believe
possible, in part because accumulate2. Operators cannot fully understand system
because errors in implementation, measurement system, warning systems. Also complex, hard to predict interactions
3.Tendency to blame operators afterwards (60-80%), but they must operate with missing, wrong information
4.The systems are never all working fully properly: bad warning lights, sensors out, things in repair
5.Systems that kick in when trouble often flawed. At 3 Mile Island problem 2 valves left in the wrong position-they were symmetric parts of a redundant system used only in an emergency. The fact that the facility runs under normal operation masks errors in error handling
Charles Perrow, Normal Accidents: Living with High Risk Technologies, Perseus Books, 1990

Slide 19
Lessons Learned from Other Fields
• 1800s: 1/4 iron truss railroad bridges failed!• Techniques invented since:
– Learn from failures vs. successes – Redundancy to survive some failures– Margin of safety 3X-6X vs. calculated load
• 1 sentence definition of safety– “A safe structure will be one whose
weakest link is never overloaded by the greatest force to which the structure is subjected.”
• Safety is part of Civil Engineering DNA– “Structural engineering is the science and art of
designing and making, with economy and elegance, buildings, bridges, frameworks, and similar structures so that they can safely resist the forces to which they may be subjected”

Slide 20
Lessons Learned from Other Fields
• Human errors of 2 types– Slips/Lapses: error in execution/memory– Mistakes: error in plan
Unintentional
Intentional
• Model of cognitive actions and thus errors: Generic Error Modeling System Skill Based: stored patterns determines response;
before a problem occurs; ~ 60% of errors Rule Based: if-then production rules learned by
experience; post problem; stored in a hierarchy, with most general at top, exceptions at the bottom; ~ 30%
•Knowledge Based: when if-then rules don’t solve, then must do new solution in real time. After problem occurs; only option is trial and error; ~ 10%

Slide 21
Human Error• Cognitive Strain leads people to use least
effort to solve problem, particularly when under stress of a disaster, people will naturally try shortcuts SB < RB < KB– Humans: both fast parallel searching (SB/RB), and
slow, serial searching that they don’t like to do (KB)
– When conditions are appropriate, select the rules that are most frequently used (“frequency gambling”)
– “In short, humans are furious pattern matchers.”
• Human error detection rates ~3/4 (SB: 86%; R 73%; KB 70%)

Slide 22
Human Error: Automation irony
• “Automation irony” Designers try to reduce reliance on humans,
leaving system vulnerable to designer errors What they can’t automate, they leave to humans
• Humans terrible at this; easy stuff handled, do everything at KB level, often under time pressure– “Even if its possible to build up skills of operators
via game playing and simulation, there is no guarantee that this situation would be relevant, except in some very general sense, to an upcoming event.”
• “Active” errors (by operator) are inevitable• “Latent” errors (designer, managers, not
immediate operator errors) accumulate

Slide 23
Other Fields• How to minimize error affordances:
» Design for consistency between designer, system, user models; good conceptual model
» Simplify model so matches human limits: working memory, problem solving
» Make visible what the options are, and what are the consequences of actions
» Exploit natural mappings between intentions and possible actions, actual state and what is perceived, …
» Use constraints (natural, artificial) to guide user» Design for errors. Assume their occurrence. Plan
for error recovery. Make it easy to reverse action and make hard to perform irreversible ones.
» When all else fails, standardize: ease of use more important, only standardize as last resort

Slide 24
Lessons Learned from Other Cultures
• Code of Hammurabi, 1795-1750 BC, Babylon– 282 Laws on 8-foot stone monolith
229. If a builder build a house for some one, and does not construct it properly, and the house which he built fall in and kill its owner, then that builder shall be put to death.
230. If it kill the son of the owner the son of that builder shall be put to death.
232. If it ruin goods, he shall make compensation for all that has been ruined, and inasmuch as he did not construct properly this house which he built and it fell, he shall re-erect the house from his own means.
• Do we need Babylonian quality standards?

Slide 25
Outline• What have we been doing • Motivation for a new Challenge: making
things work (including endorsements)
• What have we learned
• New Challenge: Recovery-Oriented Computer
• Examples: benchmarks, prototypes

Slide 26
Recovery-Oriented Computing Hypothesis
“If a problem has no solution, it may not be a problem, but a fact, not to be solved, but to be coped with over time”
— Shimon Peres
• Failures are a fact, and recovery/repair is how we cope with them
• Improving recovery/repair improves availability– UnAvailability = MTTR
MTTF– 1/10th MTTR just as valuable as 10X MTBF
• Since major Sys Admin job is recovery after failure, ROC also helps with maintenance
(assuming MTTR much less MTTF)

Slide 27
Tentative ROC Principles: #1 Isolation and Redundancy
• System is Partitionable– To isolate faults– To enable online repair/recovery– To enable online HW growth/SW upgrade– To enable operator training/expand experience on
portions of real system– Techniques: Geographically replicated sites, Shared
nothing cluster, Separate address space inside CPU
• System is Redundant– Sufficient HW redundancy/Data replication => part of
system down but satisfactory service still available– Enough to survive 2nd failure during recovery– Techniques: RAID-6, N-copies of data

Slide 28
Tentative ROC Principles #2 Online verification
• System enables input insertion, output check of all modules (including fault insertion)– To check module sanity to find failures faster– To test corrections of recovery mechanisms
» insert (random) faults and known-incorrect inputs» also enables availability benchmarks
– To expose & remove latent errors from each system– To operator train/expand experience of operator
» Periodic reports to management on skills
– To discover if warning system is broken– Techniques: Global invariants; Topology discovery;
Program Checking (SW ECC)

Slide 29
Tentative ROC Principles #3 Undo support
• ROC system should offer Undo – To recover from operator errors
» People detect 3 of 4 errors, so why not undo?
– To recover from inevitable SW errors» Restore entire system state to pre-error version
– To simplify maintenance by supporting trial and error» Create a forgiving/reversible environment
– To recover from operator training after fault insertion– To replace traditional backup and restore– Techniques: Checkpointing, Logging; time travel (log
structured) file system; Virtual machines; “Go Back” file protection

Slide 30
Tentative ROC Principles #4 Diagnosis Support
• System assists human in diagnosing problems– Root-cause analysis to suggest possible failure points
» Track resource dependencies of all requests» Correlate symptomatic requests with component
dependency model to isolate culprit components
– “health” reporting to detect failed/failing components» Failure information, self-test results propagated
upwards
– Discovery of network, power topology» Don’t rely on things connected according to plans
– Techniques: Stamp data blocks with modules used; Log faults, errors, failures and recovery methods

Slide 31
Overview towards AME via ROC
• New foundation to reduce MTTR– Cope with fact that people, SW, HW fail (Peres’s Law)– Transactions/snapshots to undo failures, bad repairs– Recovery benchmarks to evaluate MTTR innovations– Interfaces to allow fault insertion, input insertion,
report module errors, report module performance– Module I/O error checking and module isolation– Log errors and solutions for root cause analysis, give
ranking to potential solutions to problem problem
• Significantly reducing MTTR (HW/SW/LW) => Significantly increased availability + Significantly improved maintenance costs

Slide 32
Rest of Talk• Are we already at 99.999% availability?• How does ROC compare to traditional
High Availability/Fault Tolerant Computing solutions?
• What are examples of Availability, Maintainabilty Benchmarks?
• What might a ROC HW prototype look like?
• What is a ROC application?• Conclusions

Slide 33
What about claims of 5 9s?• 99.999% availability from telephone company?
– AT&T switches < 2 hours of failure in 40 years
• Cisco, HP, Microsoft, Sun … claim 99.999% availability claims (5 minutes down / year) in marketing/advertising– HP-9000 server HW and HP-UX OS can deliver
99.999% availability guarantee “in certain pre-defined, pre-tested customer environments”
– Environmental? Application? Operator?
99 999 5 9s from Jim Gray’s talk: “Dependability
in the Internet Era”

Slide 34
“Microsoft fingers technicians for crippling site outages”
By Robert Lemos and Melanie Austria Farmer, ZDNet News, January 25, 2001 • Microsoft blamed its own technicians for a
crucial error that crippled the software giant's connection to the Internet, almost completely blocking access to its major Web sites for nearly 24 hours… a "router configuration error" had caused requests for access to the company’s Web sites to go unanswered…
• "This was an operational error and not the result of any issue with Microsoft or third-party products, nor with the security of our networks," a Microsoft spokesman said.
• (5 9s possible if site stays up 300 years!)99

Slide 35
What is uptime of HP.com?
• Average reboot is about 30.8 days; if 10 minutes per reboot => 99.9% uptime– See uptime.netcraft.com/up/graph?site=www.hp.com

Slide 36
Traditional HA vs. Internet reality
• Traditional HA env’t– stable
» functionality» software» workload and scale
– high-quality infrastructure designed for high availability
» robust hardware: fail-fast, duplication, error checking
» custom, well-tested, single-app software
» single-vendor systems
– certified maintenance» phone-home reporting» trained vendor
technicians
• Internet service env’t– dynamic and evolving
» weekly functionality changes
» rapid software development
» unpredictable workload and fast growth
– commodity infrastructure coerced into high availability
» cheap hardware lacking extensive error-checking
» poorly-tested software cobbled together from off-the-shelf and custom code
» multi-vendor systems– ad-hoc maintenance
» by local or co-lo. techs

Slide 37
How does ROC differ from Fault Tolerant Computing
(FTC)?• Systems like Tandem, IBM mainframes concentrate on Hardware Failures– Mirrored disks, Redundant cross-checked CPUs, …– Designed to handle 1 failure until repaired
• Also some work on Software failures: Tandem’s process pairs, transactions, …– Rather than embracing failure, goal is SW
perfection
• No attention to human failures• FTC works on improving reliability vs.
recovery• Generally ROC is synergistic with FTC
Slide 38
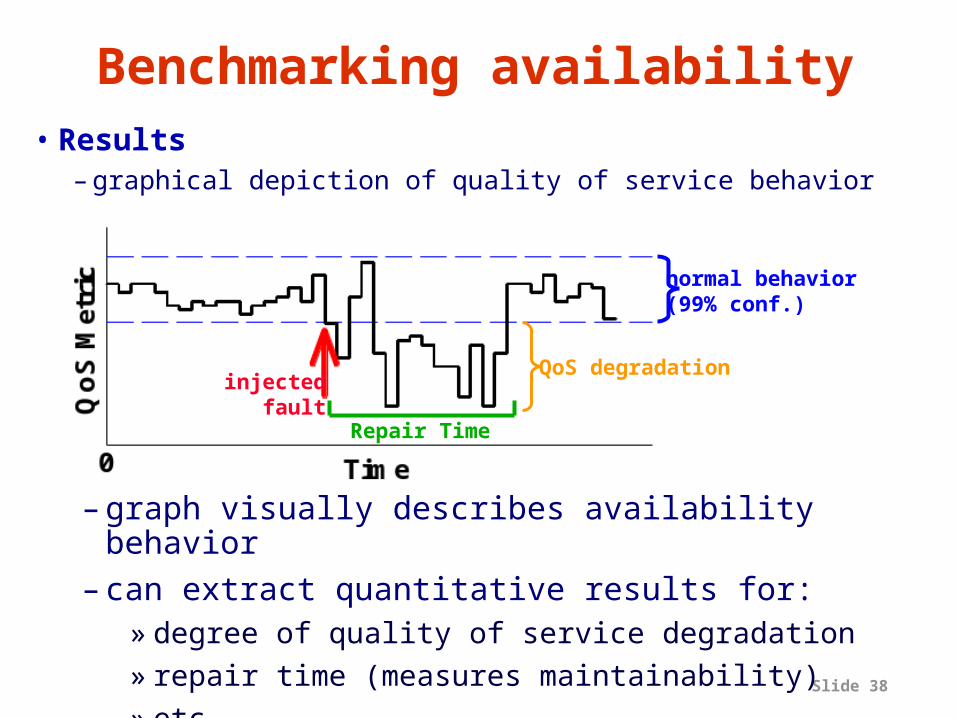
Benchmarking availability• Results
– graphical depiction of quality of service behavior
– graph visually describes availability behavior– can extract quantitative results for:
» degree of quality of service degradation» repair time (measures maintainability)» etc.
Repair Time
QoS degradationinjected
fault
normal behavior(99% conf.)

Slide 39
Time (minutes)0 10 20 30 40 50 60 70 80 90 100 110
80
100
120
140
160
0
1
2
Hits/sec# failures tolerated
0 10 20 30 40 50 60 70 80 90 100 110
Hit
s p
er s
eco
nd
190
195
200
205
210
215
220
#fai
lure
s t
ole
rate
d
0
1
2
Reconstruction
Reconstruction
Example: single-fault in SW RAID
• Compares Linux and Solaris reconstruction– Linux: minimal performance impact but longer window
of vulnerability to second fault– Solaris: large perf. impact but restores redundancy fast– Windows: does not auto-reconstruct!
Linux
Solaris

Slide 40
Software RAID: QoS behavior• Response to transient errors
– Linux is paranoid with respect to transients» stops using affected disk (and reconstructs) on any
error, transient or not– Solaris and Windows are more forgiving
» both ignore most benign/transient faults– neither policy is ideal!
» need a hybrid that detects streams of transients
SolarisLinux

Slide 41
Software RAID: QoS behavior• Response to double-fault scenario
– a double fault results in unrecoverable loss of data on the RAID volume
– Linux: blocked access to volume– Windows: blocked access to volume– Solaris: silently continued using volume,
delivering fabricated data to application!» clear violation of RAID availability semantics» resulted in corrupted file system and garbage data
at the application level» this undocumented policy has serious availability
implications for applications

Slide 42
Software RAID: maintainability
• Human error rates– subjects attempt to repair RAID disk failures
» by replacing broken disk and reconstructing data
– each subject repeated task several times– data aggregated across 5 subjects
Error type Windows
Solaris Linux
Fatal Data Loss
Unsuccessful Repair
System ignored fatal input
User Error – Intervention Required
User Error – User Recovered Total number of trials 35 33 31

Slide 43
Initial Applications• Future: services over WWW• Initial ROC-I apps targets are services
– Internet email service» Continuously train operator via isolation and fault
insertion» Undo of SW upgrade, disk replacement» Run Repair Benchmarks
• ROC-I + Internet Email application is a first example, not the final solution

Slide 44
Conclusion• We should congratulate ourselves for 1000X
performance improvement in just 15 years• In a new century we need a new agenda,
and performance is not the biggest problem• We need to embrace failure of HW, SW,
people, and still build systems that work• Have we been building the computing
equivalent of the 19th Century iron-truss bridges?– What is computer equivalent of the margin of safety
that is the foundation of next century bridges?
• One approach: Recovery-Oriented Computing

Slide 45
“If it’s important, how can you say if it’s impossible if you don’t try?”
Jean Morreau, a founder of European Union
Questions about ROC? Contact us if interested:email: [email protected]
http://istore.cs.berkeley.edu/

Slide 46
An Approach to Recovery-Oriented Computers (ROC)
• 4 Parts to Time to Recovery: 1) Time to detect error, 2) Time to pinpoint error
(“root cause analysis”), 3) Time to chose try several possible solutions fixes error, and 4) Time to fix error
• Result is Principles of Recovery Oriented Computers (ROC)

Slide 47
An Approach to ROC
1) Time to Detect errors• Include interfaces that report
faults/errors from components– May allow application/system to
predict/identify failures; prediction really lowers MTTR
• Periodic insertion of test inputs into system with known results vs. wait for failure reports– Reduce time to detect– Better than simple pulse check

Slide 48
An Approach to ROC2) Time to Pinpoint error • Error checking at edges of each
component– Program checking analogy: if computation is O(nx),
(x >1) and if check is O(n), little impact to check– E.g., check if list is sorted before return a sort
• Design each component to allow isolation and insert test inputs to see if performs
• Keep history of failure symptoms/reasons and recent behavior (“root cause analysis”)– Stamp each datum with all the modules it touched?
Slide 49
An Approach to ROC
• 3) Time to try possible solutions: • History of errors/solutions• Undo of any repair to allow trial of
possible solutions– Support of snapshots, transactions/logging
fundamental in system– Since disk capacity, bandwidth is fastest
growing technology, use it to improve repair?– Caching at many levels of systems provides
redundancy that may be used for transactions?
– SW errors corrected by undo? – Human Errors corrected by undo?

Slide 50
An Approach to ROC4) Time to fix error: • Find failure workload, use repair
benchmarks – Competition leads to improved MTTR
• Include interfaces that allow Repair events to be systematically tested– Predictable fault insertion allows debugging of
repair as well as benchmarking MTTR• Since people make mistakes during
repair, “undo” for any maintenance event– Replace wrong disk in RAID system on a failure;
undo and replace bad disk without losing info– Recovery oriented => accommodate
HW/SW/human errors during repair

Slide 51
ISTORE-1 Brick• Webster’s Dictionary:
“brick: a handy-sized unit of building or paving material typically being rectangular and about 2 1/4 x 3 3/4 x 8 inches”
• ISTORE-1 Brick: 2 x 4 x 11 inches (1.3x)– Single physical form factor, fixed cooling required,
compatible network interface to simplify physical maintenance, scaling over time
– Contents should evolve over time: contains most cost effective MPU, DRAM, disk, compatible NI
– If useful, could have special bricks (e.g., DRAM rich, disk poor)
– Suggests network that will last, evolve: Ethernet
Slide 52
Cost of Bandwidth, Safety• Network bandwidth cost is significant
– 1000 Mbit/sec/month => $6,000,000/year
• Security will increase in importance for storage service providers
• XML => server format conversion for gadgets
=> Storage systems of future need greater computing ability– Compress to reduce cost of network bandwidth 3X;
save $4M/year?– Encrypt to protect information in transit for B2B
=> Increasing processing/disk for future storage apps

Slide 53
Disk Limit: Bus HierarchyCPU Memory
bus
Memory
External I/O bus
(SCSI)
(PCI)
Internal I/O bus
• Data rate vs. Disk rate– SCSI: Ultra3 (80 MHz),
Wide (16 bit): 160 MByte/s– FC-AL: 1 Gbit/s = 125 MByte/s
Use only 50% of a busCommand overhead (~ 20%)Queuing Theory (< 70%)
(15 disks/bus)
Storage Area Network
(FC-AL)
Server
DiskArray
Mem
RAID bus

Slide 54
Clusters and TPC Software 8/’00
• TPC-C: 6 of Top 10 performance are clusters, including all of Top 5; 4 SMPs
• TPC-H: SMPs and NUMAs– 100 GB All SMPs (4-8 CPUs)– 300 GB All NUMAs (IBM/Compaq/HP 32-64 CPUs)
• TPC-R: All are clusters – 1000 GB :NCR World Mark 5200
• TPC-W: All web servers are clusters (IBM)

Slide 55
Clusters and TPC-C BenchmarkTop 10 TPC-C Performance (Aug. 2000) Ktpm1. Netfinity 8500R c/s Cluster4412. ProLiant X700-96P Cluster2623. ProLiant X550-96P Cluster2304. ProLiant X700-64P Cluster1805. ProLiant X550-64P Cluster1626. AS/400e 840-2420 SMP 1527. Fujitsu GP7000F Model 2000SMP 1398. RISC S/6000 Ent. S80 SMP 1399. Bull Escala EPC 2400 c/s SMP 13610. Enterprise 6500 Cluster Cluster
135
Slide 56
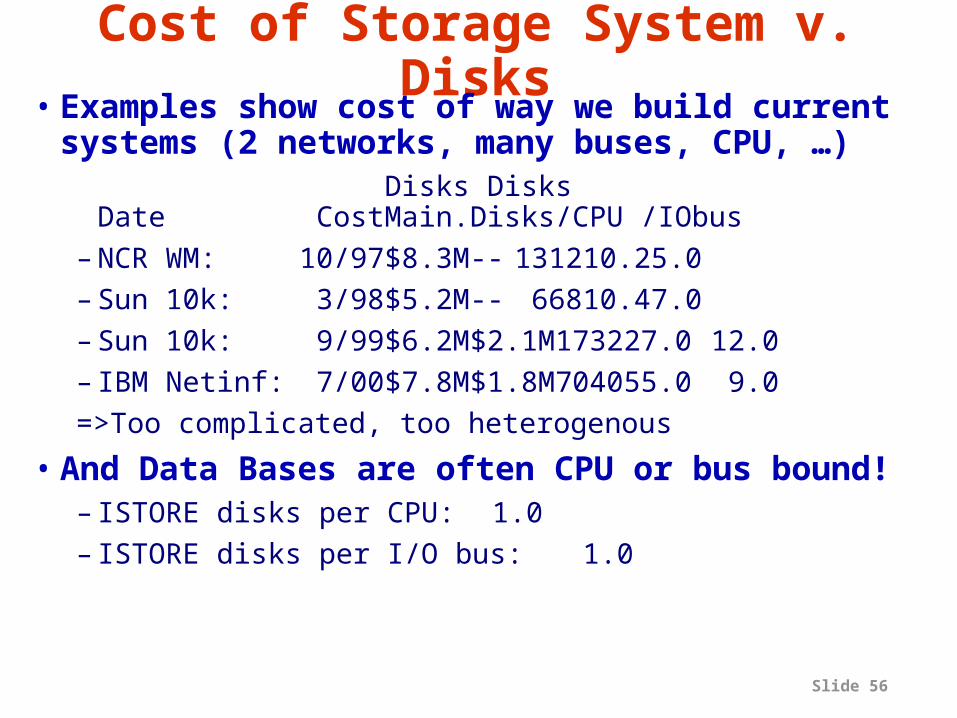
Cost of Storage System v. Disks
• Examples show cost of way we build current systems (2 networks, many buses, CPU, …)
Disks DisksDate Cost Main. Disks /CPU /IObus
– NCR WM: 10/97 $8.3M -- 1312 10.2 5.0– Sun 10k: 3/98 $5.2M -- 668 10.4 7.0– Sun 10k: 9/99 $6.2M$2.1M 1732 27.0 12.0– IBM Netinf: 7/00 $7.8M$1.8M 7040 55.0 9.0=>Too complicated, too heterogenous
• And Data Bases are often CPU or bus bound! – ISTORE disks per CPU: 1.0– ISTORE disks per I/O bus: 1.0

Slide 57
SCSI v. IDE $/GB
• Prices from PC Magazine, 1995-2000
$-
$150
$300
$450
Price
per
gig
abyt
e
-
0.50
1.00
1.50
2.00
2.50
3.00
Price
rat
io p
er gig
abye: SC
SI v
. ID
E
SCSI
IDE
Ratio SCSI/IDE

Slide 58
Availability benchmark methodology• Goal: quantify variation in QoS metrics as
events occur that affect system availability• Leverage existing performance benchmarks
– to generate fair workloads– to measure & trace quality of service metrics
• Use fault injection to compromise system– hardware faults (disk, memory, network, power)– software faults (corrupt input, driver error returns)– maintenance events (repairs, SW/HW upgrades)
• Examine single-fault and multi-fault workloads– the availability analogues of performance micro- and
macro-benchmarks
Slide 59
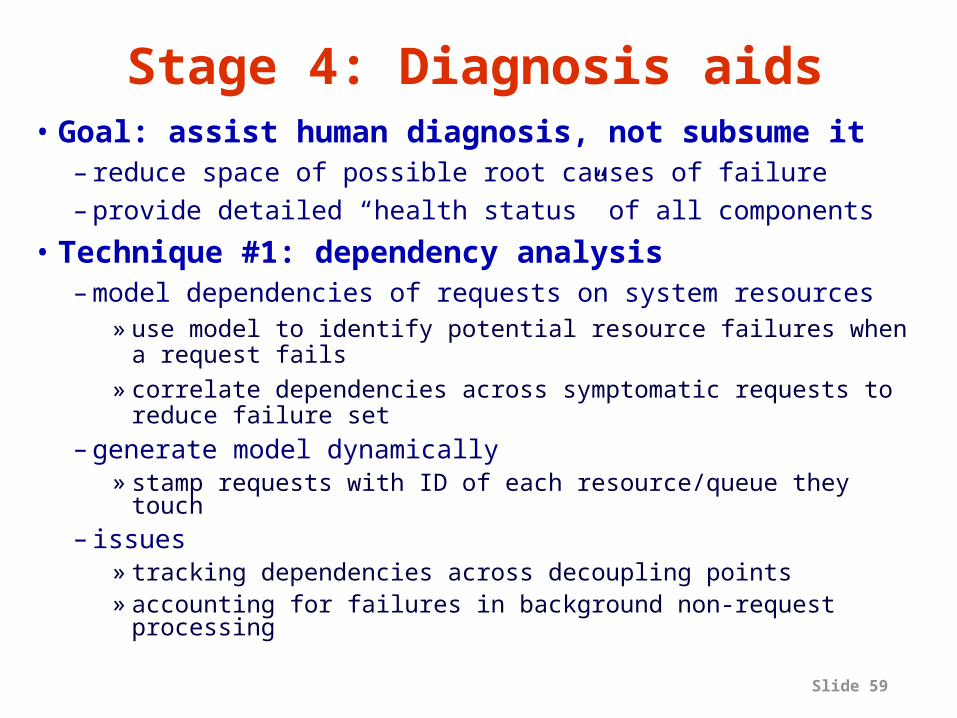
Stage 4: Diagnosis aids• Goal: assist human diagnosis, not subsume it
– reduce space of possible root causes of failure– provide detailed “health status” of all components
• Technique #1: dependency analysis– model dependencies of requests on system resources
» use model to identify potential resource failures when a request fails
» correlate dependencies across symptomatic requests to reduce failure set
– generate model dynamically» stamp requests with ID of each resource/queue they touch
– issues» tracking dependencies across decoupling points» accounting for failures in background non-request
processing

Slide 60
Diagnosis aids• Technique #2: propagating fault
information– explicitly propagate component failure and
recovery information upward» provide “health status” of all components» can attempt to mask symptoms, but still inform
upper layers» rely on online verification infrastructure for
detection
– issues» devising a general representation for health
information» using health information to let application
participate in repair
Slide 61
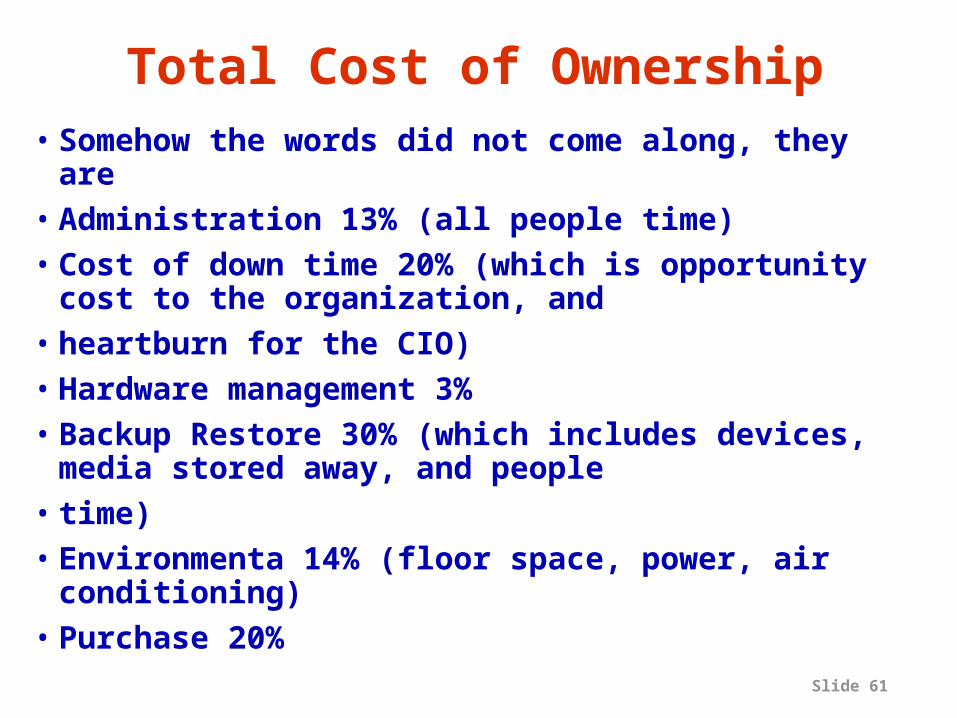
Total Cost of Ownership• Somehow the words did not come along, they
are• Administration 13% (all people time)• Cost of down time 20% (which is opportunity
cost to the organization, and• heartburn for the CIO)• Hardware management 3%• Backup Restore 30% (which includes devices,
media stored away, and people• time)• Environmenta 14% (floor space, power, air
conditioning)• Purchase 20%