slide 1 research in internet scale systems katherine yelick u.c. berkeley, eecs with jim beck,...
TRANSCRIPT

Slide 1
Research in Internet Scale Systems
Katherine Yelick U.C. Berkeley, EECS
http://iram.cs.berkeley.edu/istore
With Jim Beck, Aaron Brown, Daniel Hettena, David Oppenheimer, Randi Thomas, Noah
Treuhaft, David Patterson, John Kubiatowicz
http://www.cs.berkeley.edu/project/titanium
With Greg Balls, Dan Bonachea, David Gay, Ben Liblit, Chang-Sun Lin, Peter McQuorquodale, Carleton Miyamoto, Geoff Pike, Alex Aiken,
Phil Colella, Susan Graham, Paul Hilfinger

Slide 2
Ubiquitous Computing
• Computing everywhere:– Desktop, Laptop, Palmtop, Cars, Cellphones
• Input devices everywhere:– Sensors, cameras, microphones
• Connectivity everywhere:– Rapid growth of bandwidth in the interior of the net– Broadband to the home and office– Wireless technologies such as CMDA, Satelite, laser
• Rise of the thin-client metaphor:– Services provided by interior of network– Incredibly thin clients on the leaves
» MEMs devices -- sensors+CPU+wireless net in 1mm3

Slide 3
The problem space: big data
• Big demand for enormous amounts of data– today: enterprise and internet applications
» online applications: e-commerce, mail, web, archives» enterprise decision-support, data mining databases
– future: richer data and more of it» computational & storage back-ends for mobile devices» more multimedia content» more use of historical data to provide better services
• Two key application domains:– storage: public, private, and institutional data– search: building static indexes, dynamic
discovery• Today’s SMP server designs can’t easily scale
– Bigger scaling problems than performance!
Slide 4
The Real Scalability Problems: AME
• Availability– systems should continue to meet quality of
service goals despite hardware and software failures and extreme load
• Maintainability– systems should require only minimal ongoing
human administration, regardless of scale or complexity
• Evolutionary Growth– systems should evolve gracefully in terms of
performance, maintainability, and availability as they are grown/upgraded/expanded
• These are problems at today’s scales, and will only get worse as systems grow
Slide 5
Research Principles
• Redundancy everywhere, no single point of failure• Performance secondary to AME
– Performance robustness over peak performance– Dedicate resources to AME
» biological systems use > 50% of resources on maintenance
– Optimizations viewed as AME-enablers » e.g., use of (slower) safe languages like Java with static
and dynamic optimizations
• Introspection– reactive techniques to detect and adapt to
failures, workload variations, and system evolution
– proactive techniques to anticipate and avert problems before they happen
Slide 6
Outline• Motivation• Hardware Techniques
– general techniques– ISTORE projects
• Software Techniques• Availability Benchmarks• Conclusions

Slide 7
Hardware techniques
• Fully shared-nothing cluster organization– truly scalable architecture, automatic
redundancy– tolerates partial hardware failure
• No Central Processor Unit: distribute processing with storage– Most storage servers limited by speed of CPUs;
why does this make sense?– Amortize sheet metal, power, cooling
infrastructure for disk to add processor, memory, and network
• On-demand network partitioning/isolation– Applications must tolerate these anyway – Allows testing, repair of online system

Slide 8
Hardware techniques
• Heavily instrumented hardware– sensors for temp, vibration, humidity, power
• Independent diagnostic processor on each node– remote control of power, console, boot code– collects, stores, processes environmental
data – connected via independent network
• Built-in fault injection capabilities– Used for proactive hardware introspection
» automated detection of flaky components» controlled testing of error-recovery mechanisms
– Important for AME benchmarking

Slide 9
ISTORE-1 Hardware Platform
• 80-node x86-based cluster, 1.4TB storage– cluster nodes are plug-and-play, intelligent, network-
attached storage “bricks”» a single field-replaceable unit to simplify maintenance
– each node is a full x86 PC w/256MB DRAM, 18GB disk– 2-node system running now; full system in next quarter
ISTORE Chassis80 nodes, 8 per tray2 levels of switches•20 100 Mbit/s•2 1 Gbit/sEnvironment Monitoring:UPS, redundant PS,fans, heat and vibration sensors...
Intelligent Disk “Brick”Portable PC CPU: Pentium II/266 + DRAM
Redundant NICs (4 100 Mb/s links)Diagnostic Processor
Disk
Half-height canister
Slide 10
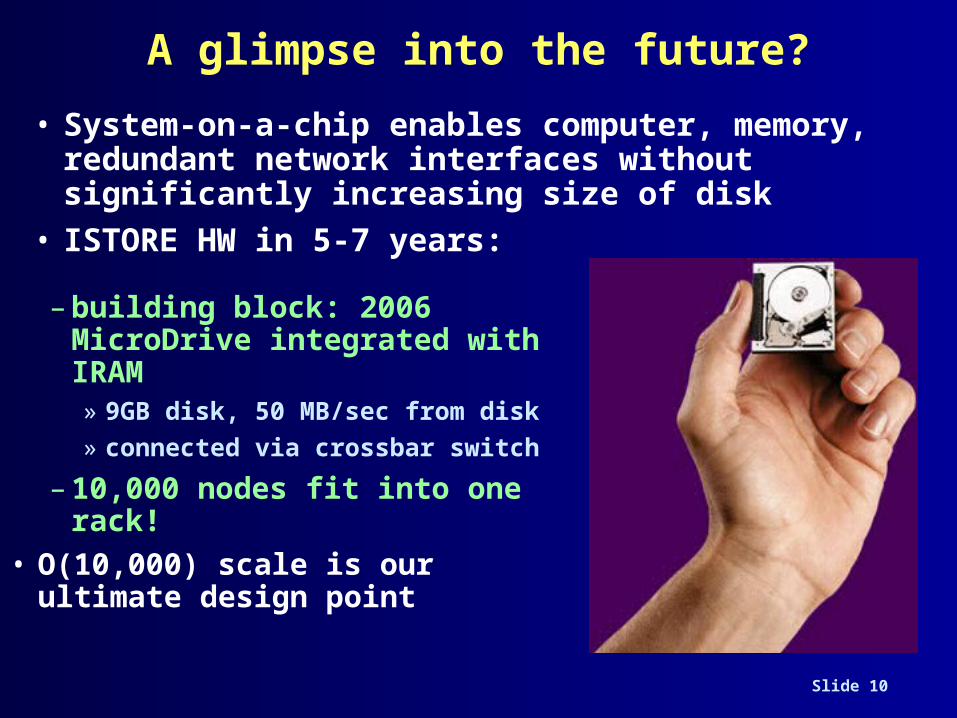
A glimpse into the future?
• System-on-a-chip enables computer, memory, redundant network interfaces without significantly increasing size of disk
• ISTORE HW in 5-7 years:
– building block: 2006 MicroDrive integrated with IRAM » 9GB disk, 50 MB/sec from disk» connected via crossbar switch
– 10,000 nodes fit into one rack!
• O(10,000) scale is our ultimate design point
Slide 11
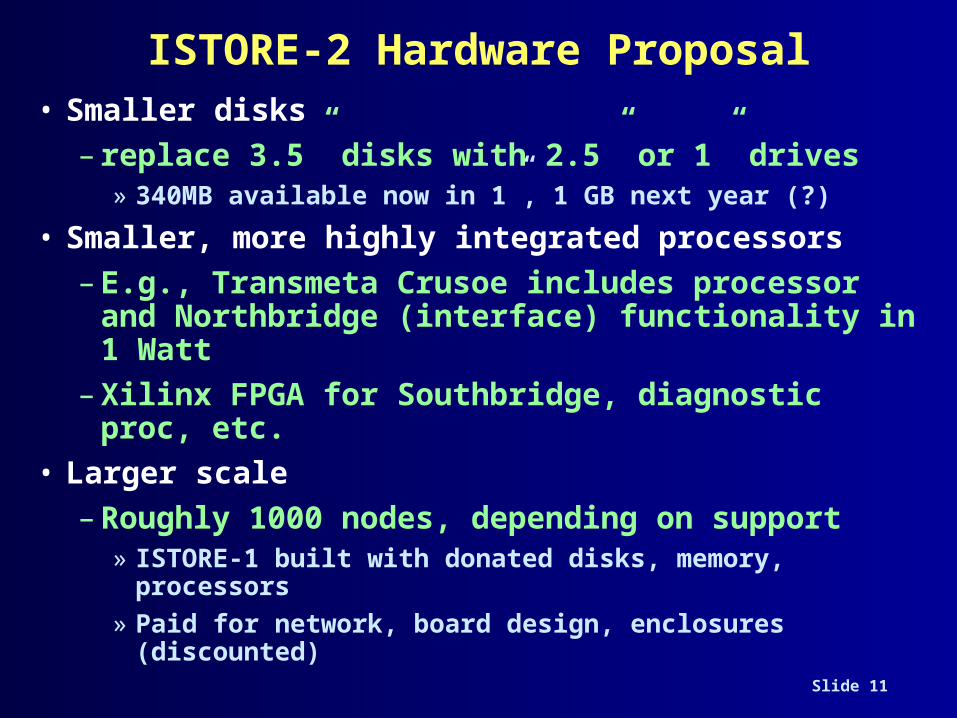
ISTORE-2 Hardware Proposal• Smaller disks
– replace 3.5” disks with 2.5” or 1” drives» 340MB available now in 1”, 1 GB next year (?)
• Smaller, more highly integrated processors– E.g., Transmeta Crusoe includes processor
and Northbridge (interface) functionality in 1 Watt
– Xilinx FPGA for Southbridge, diagnostic proc, etc.
• Larger scale– Roughly 1000 nodes, depending on support
» ISTORE-1 built with donated disks, memory, processors
» Paid for network, board design, enclosures (discounted)
Slide 12
Outline• Motivation• Hardware Techniques• Software Techniques
– general techniques– Titanium: a high performance Java dialect– Sparsity: using dynamic information– Virtual streams: performance robustness
• Availability Benchmarks • Conclusions
Slide 13
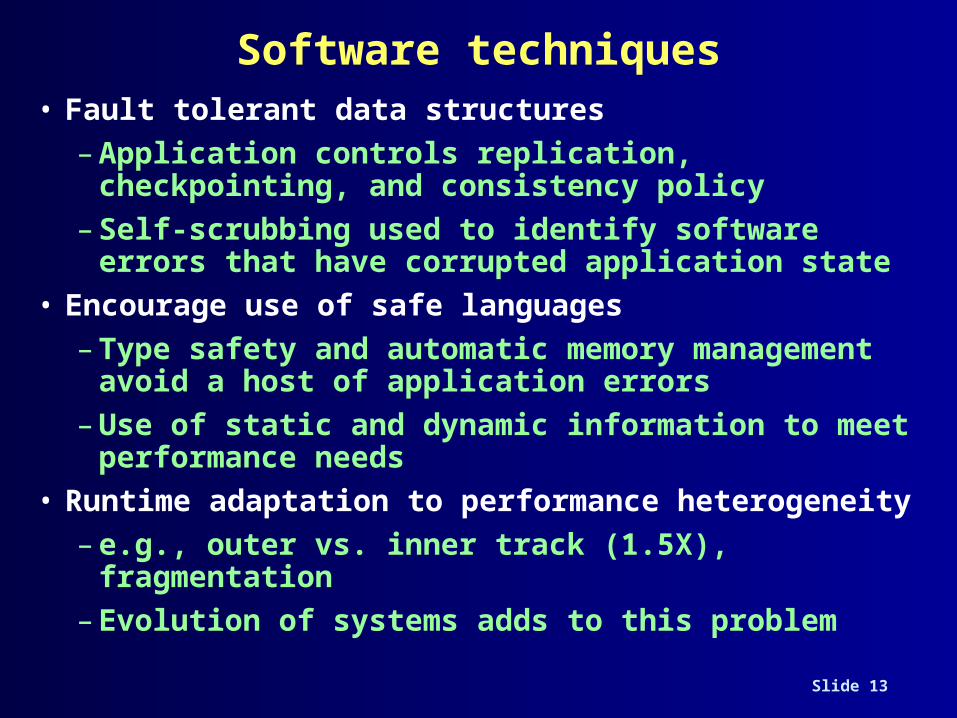
Software techniques• Fault tolerant data structures
– Application controls replication, checkpointing, and consistency policy
– Self-scrubbing used to identify software errors that have corrupted application state
• Encourage use of safe languages– Type safety and automatic memory
management avoid a host of application errors– Use of static and dynamic information to meet
performance needs• Runtime adaptation to performance
heterogeneity– e.g., outer vs. inner track (1.5X),
fragmentation– Evolution of systems adds to this problem
Slide 14
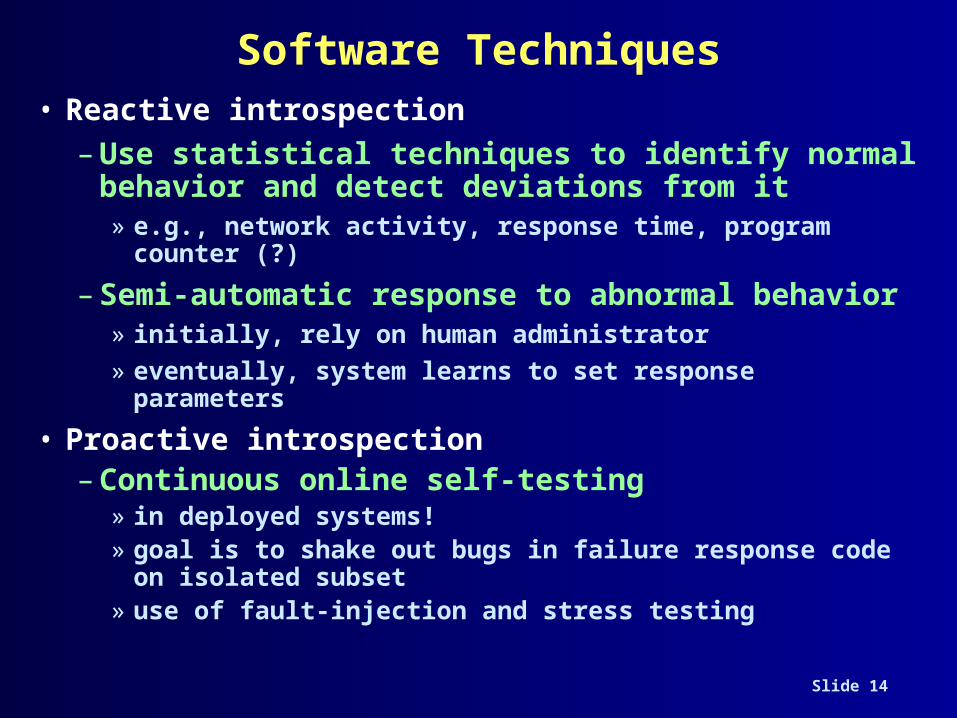
Software Techniques• Reactive introspection
– Use statistical techniques to identify normal behavior and detect deviations from it» e.g., network activity, response time, program
counter (?)
– Semi-automatic response to abnormal behavior » initially, rely on human administrator » eventually, system learns to set response
parameters
• Proactive introspection– Continuous online self-testing
» in deployed systems!» goal is to shake out bugs in failure response code
on isolated subset» use of fault-injection and stress testing
Slide 15
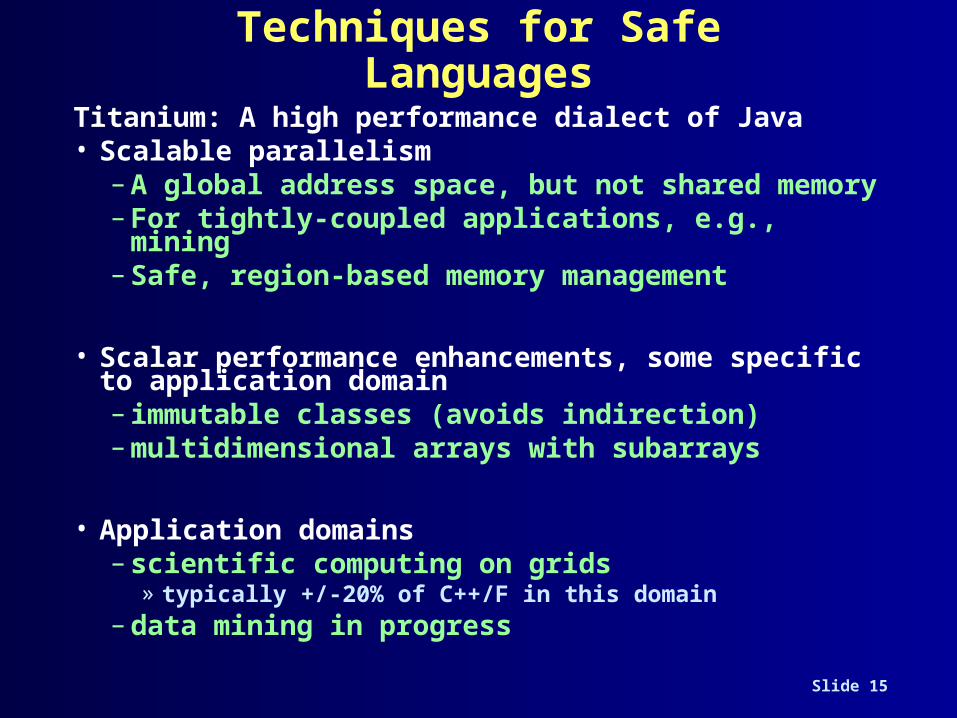
Techniques for Safe Languages
Titanium: A high performance dialect of Java• Scalable parallelism
– A global address space, but not shared memory
– For tightly-coupled applications, e.g., mining– Safe, region-based memory management
• Scalar performance enhancements, some specific to application domain – immutable classes (avoids indirection)– multidimensional arrays with subarrays
• Application domains– scientific computing on grids
» typically +/-20% of C++/F in this domain– data mining in progress
Slide 16
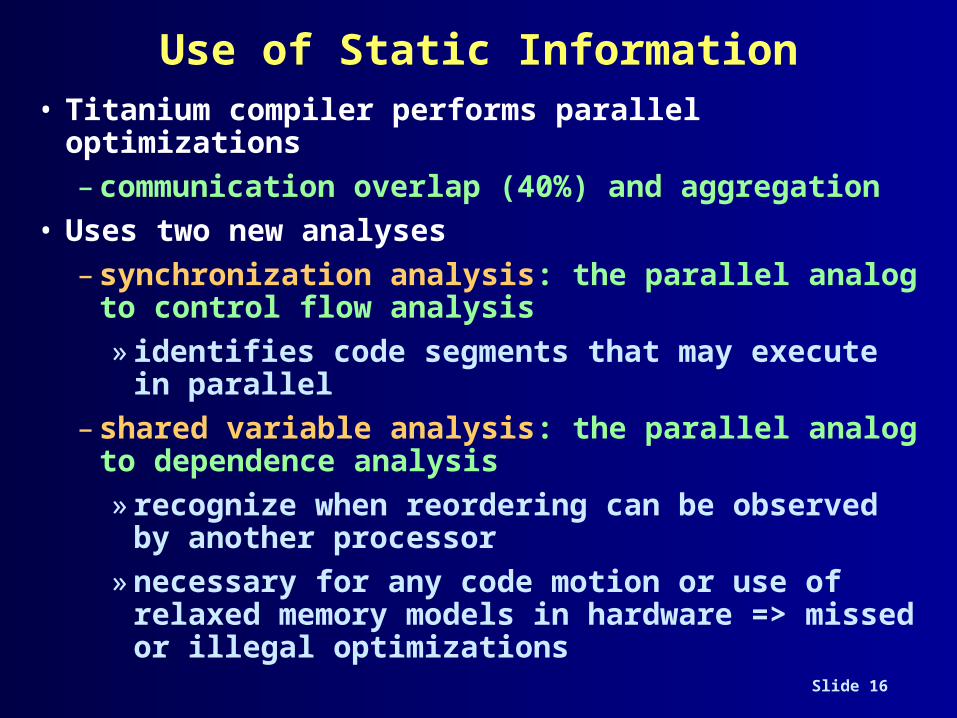
Use of Static Information• Titanium compiler performs parallel
optimizations– communication overlap (40%) and aggregation
• Uses two new analyses– synchronization analysis: the parallel analog
to control flow analysis » identifies code segments that may execute
in parallel– shared variable analysis: the parallel analog to
dependence analysis»recognize when reordering can be observed
by another processor»necessary for any code motion or use of
relaxed memory models in hardware => missed or illegal optimizations
Slide 17
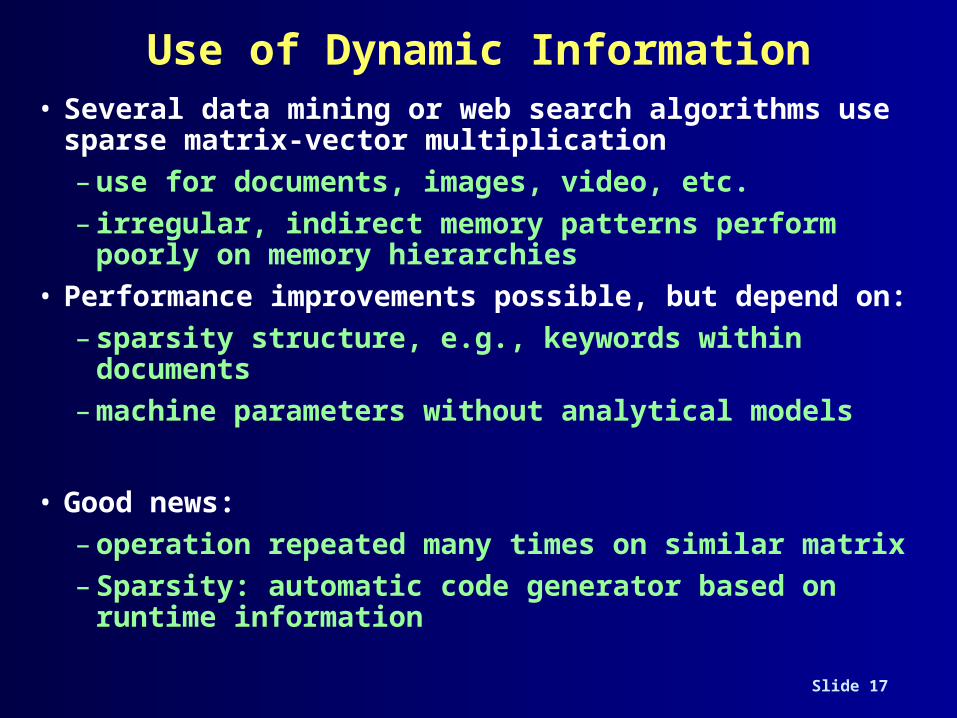
Use of Dynamic Information• Several data mining or web search algorithms use
sparse matrix-vector multiplication– use for documents, images, video, etc.– irregular, indirect memory patterns perform
poorly on memory hierarchies• Performance improvements possible, but depend
on: – sparsity structure, e.g., keywords within
documents– machine parameters without analytical models
• Good news:– operation repeated many times on similar matrix– Sparsity: automatic code generator based on
runtime information
Slide 18
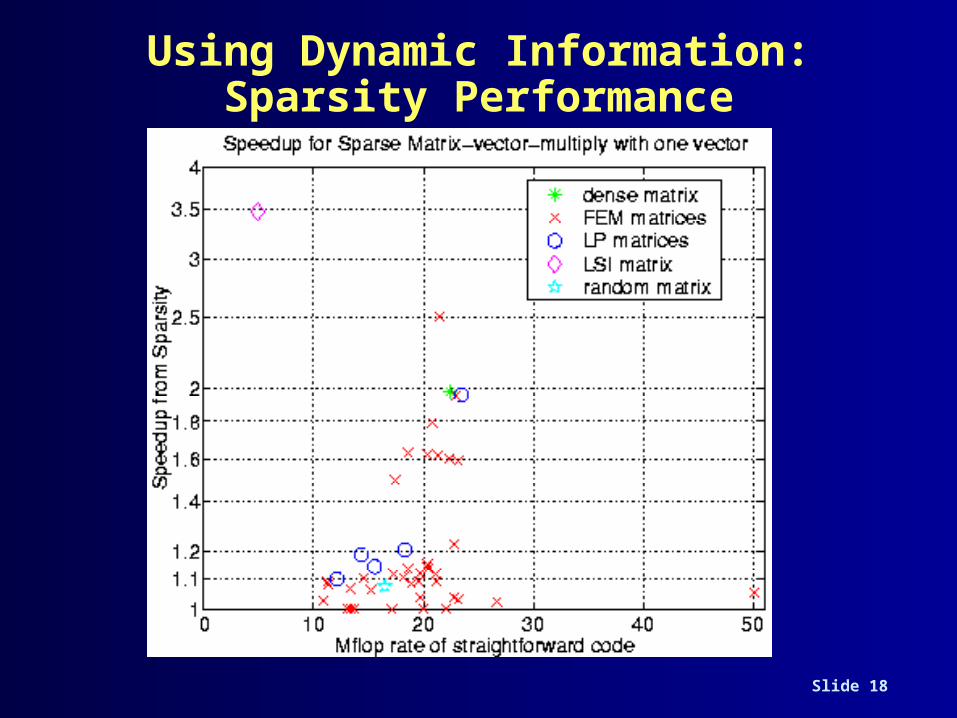
Using Dynamic Information: Sparsity Performance
Slide 19
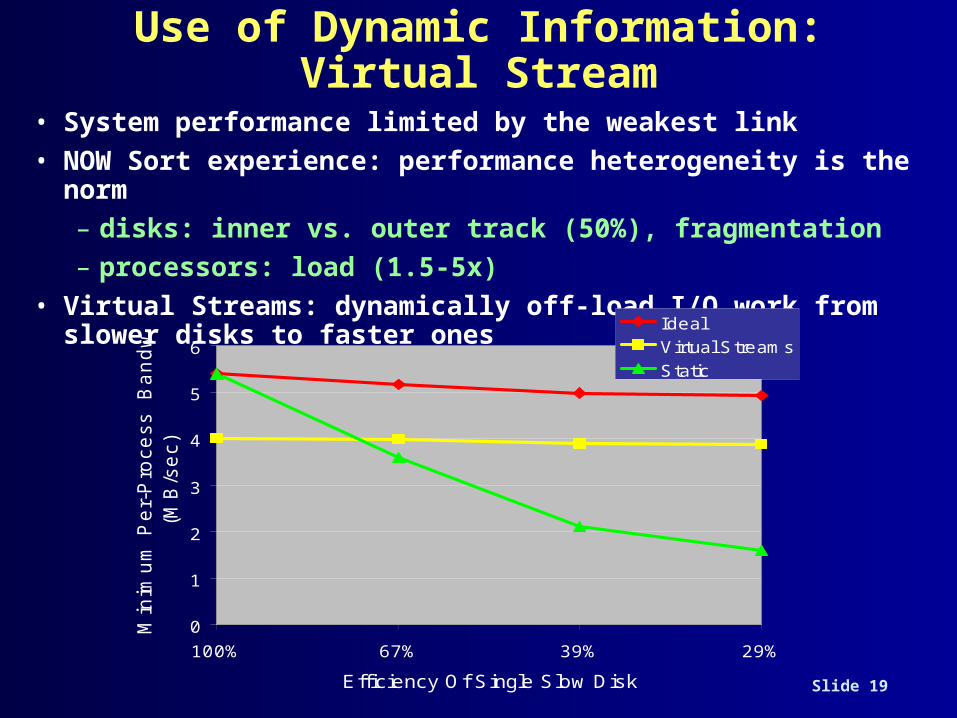
Use of Dynamic Information: Virtual Stream
• System performance limited by the weakest link• NOW Sort experience: performance heterogeneity is the
norm– disks: inner vs. outer track (50%), fragmentation– processors: load (1.5-5x)
• Virtual Streams: dynamically off-load I/O work from slower disks to faster ones
0
1
2
3
4
5
6
100% 67% 39% 29%
Efficiency Of Single Slow Disk
Min
imu
m P
er-
Pro
ce
ss
B
an
dw
idth
(MB
/se
c)
Ideal
Virtual Streams
Static

Slide 20
Applications
• ISTORE is not one super-system that demonstrates all these techniques!– Initially provide library to support AME goals
• Initial application targets– cluster web/email servers
» self-scrubbing data structures, online self-testing» statistical identification of normal behavior
– decision-support database query execution system» River-based storage, replica management
– information retrieval for multimedia data» self-scrubbing data structures, structuring
performance-robust distributed computation

Slide 21
Outline• Motivation• Hardware Techniques• Software Techniques• Availability Benchmarks
– methodology– example
• Conclusions
Slide 22
Availability Benchmark Methodology
• Goal: quantify variation in QoS metrics as events occur that affect system availability
• Leverage existing performance benchmarks– to generate fair workloads– to measure & trace quality of service metrics
• Use fault injection to compromise system– hardware faults (disk, memory, network,
power)– software faults (corrupt input, driver error
returns)– maintenance events (repairs, SW/HW upgrades)
• Examine single-fault and multi-fault workloads– the availability analogues of performance
micro- and macro-benchmarks
Slide 23
Time (2-minute intervals)0 5 10 15 20 25 30 35 40 45 50 55 60
Per
form
ance
160
170
180
190
200
210
}normal behavior(99% conf)
injecteddisk failure
reconstruction
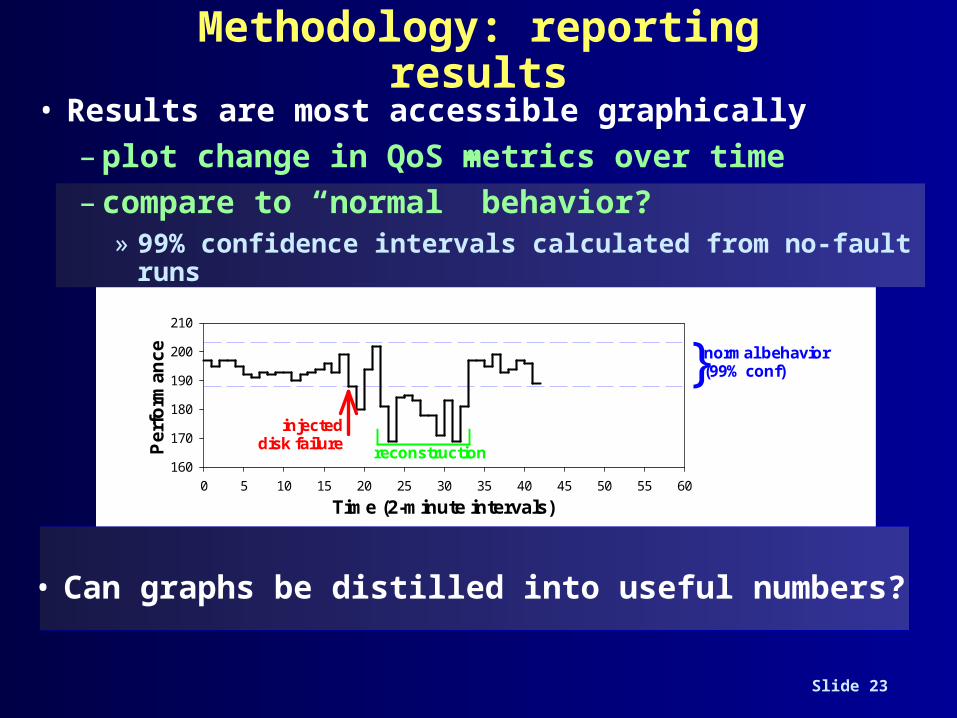
Methodology: reporting results
• Results are most accessible graphically– plot change in QoS metrics over time– compare to “normal” behavior?
» 99% confidence intervals calculated from no-fault runs
• Can graphs be distilled into useful numbers?
Slide 24
Example results: software RAID-5
• Test systems: Linux/Apache and Win2000/IIS– SpecWeb ’99 to measure hits/second as QoS
metric– fault injection at disks based on empirical fault
data» transient, correctable, uncorrectable, & timeout faults
• 15 single-fault workloads injected per system– only 4 distinct behaviors observed
(A) no effect (C) RAID enters degraded mode(B) system hangs (D) RAID enters degraded mode &
starts reconstruction– both systems hung (B) on simulated disk hangs– Linux exhibited (D) on all other errors– Windows exhibited (A) on transient errors and
(C) on uncorrectable, sticky errors
Slide 25
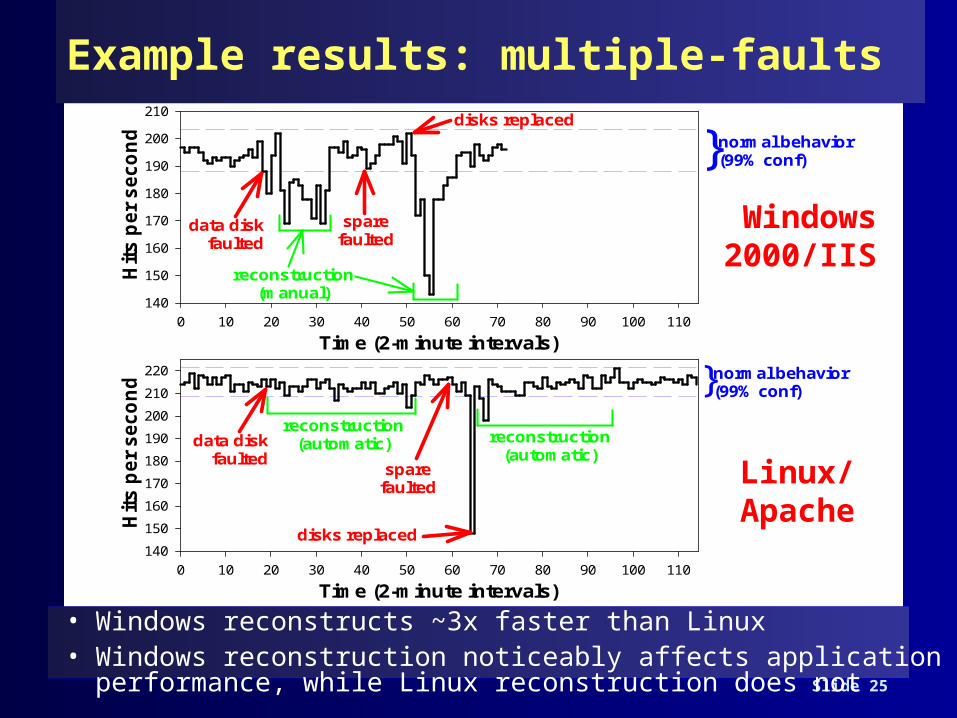
Time (2-minute intervals)0 10 20 30 40 50 60 70 80 90 100 110
Hit
s p
er
se
co
nd
140
150
160
170
180
190
200
210
data diskfaulted
reconstruction(manual)
sparefaulted
disks replaced
}normal behavior(99% conf)
Time (2-minute intervals)0 10 20 30 40 50 60 70 80 90 100 110
Hit
s p
er
se
co
nd
140
150
160
170
180
190
200
210
220
data diskfaulted
reconstruction(automatic)
sparefaulted
reconstruction(automatic)
}normal behavior(99% conf)
disks replaced
Example results: multiple-faults
Windows2000/IIS
Linux/Apache
• Windows reconstructs ~3x faster than Linux• Windows reconstruction noticeably affects application
performance, while Linux reconstruction does not
Slide 26
Availability Benchmark Summary
• Linux and Windows take opposite approaches to managing benign and transient faults– Linux is paranoid and stops using a disk on
any error– Windows ignores most benign/transient faults– Windows is more robust except when disk is
truly failing• Linux and Windows have different
reconstruction philosophies– Linux uses idle bandwidth for reconstruction– Windows steals app. bandwidth for
reconstruction– Windows rebuilds fault-tolerance more quickly
• Win2k favors fault-tolerance over performance; Linux favors performance over fault-tolerance

Slide 27
Conclusions• Two key applications domains
– Storage: loosely coupled– Search: tightly coupled, computation important
• Key challenges to future servers are:– Availability, Maintainability, and Evolutionary
growth
• Use of self-monitoring to satisfy AME goals– Proactive and reactive techniques
• Use of static techniques for high performance and reliable software– Titanium extension of Java
• Use of dynamic information for performance robustness– Sparsity and Virtual Streams
• Availability benchmarks a powerful tool?