slide 1labour market challenges and opportunities … · web viewthis graph is based on employer...
TRANSCRIPT

Slide 1 Labour market challenges and opportunities Windamere
This is a presentation given by Ivan Neville, Branch Manager Labour Market Research and Analysis Branch on 13 April 2015.

Slide 2 Windamere

Slide 3 Regional snapshot
Unemployment Rate Windamere 7.7%
Participation Rate Windamere (15 to 64 year olds) 70.5%
Total Employment Windamere 17,100
Employment in Mining (Central West) 5,700
- Annual change in Mining (Central West) -26%
Job Vacancies (Central West) -8%
Sources: Department of Employment, Small Area Labour Market, December 2014, ABS Census of Population and Housing, 2011, ABS, Labour Force Survey, February 2015, Department of Employment, IVI, February 2015

Slide 4 Young people leaving; ageing population
Source: ABS, Estimated Residential Population, 2013

Slide 5 Population profile
Adult Population
Growth in adult
population
15 to 24 year olds
(as % adult population)
65 years plus
(as % adult population)
Median age
Lithgow LGA 17,300 5% 15%(2,600)
23%(4,000) 42
Mid-Western Regional LGA (Mudgee)
20,200 7% 14%(2,900)
24%(4,800) 41
New South Wales 6,011,500 9% 16%
(971,200)19%
(1,124,100) 38
Source: ABS, Estimated Residential Population, 2013; ABS, Census of Population and Housing, 2011

Slide 6 Unemployment remains high…
Source: Department of Employment, Small Area Labour Market, December 2014; ABS, Labour Force Survey, February 2015

Slide 7 …and some regional variation
Region (SA2)Unemployment rate
December 2013 December 2014
Lithgow (township) 11.6% 10.2%
Lithgow Region 7.2% 7.3%
Mudgee (township) 6.2% 6.0%
Mudgee Region – East 10.1% 9.9%
Mudgee Region – West 6.4% 6.3%
New South Wales (February 2015 seasonally adjusted)
5.9% 6.0%
Source: Department of Employment, Small Area Labour Markets, December 2014; ABS; Labour Force Survey, February 2015 (seasonally adjusted)
Overall, the unemployment rate in Windamere is improving. In the past 12 months the rate has dropped by 1.4 percentage points in the Lithgow SA2 to now stand at 10.2%. This figure is still, however, higher than the seasonally adjusted NSW figure of 6.0% per cent.
There was also a increase in the unemployment rate in the Lithgow Regional SLA of 0.1 per cent.

Slide 8 Internet vacancies declining
Source: Department of Employment, Vacancy Report, December 2014 (three month moving average)
Slide 9 Where do people work?
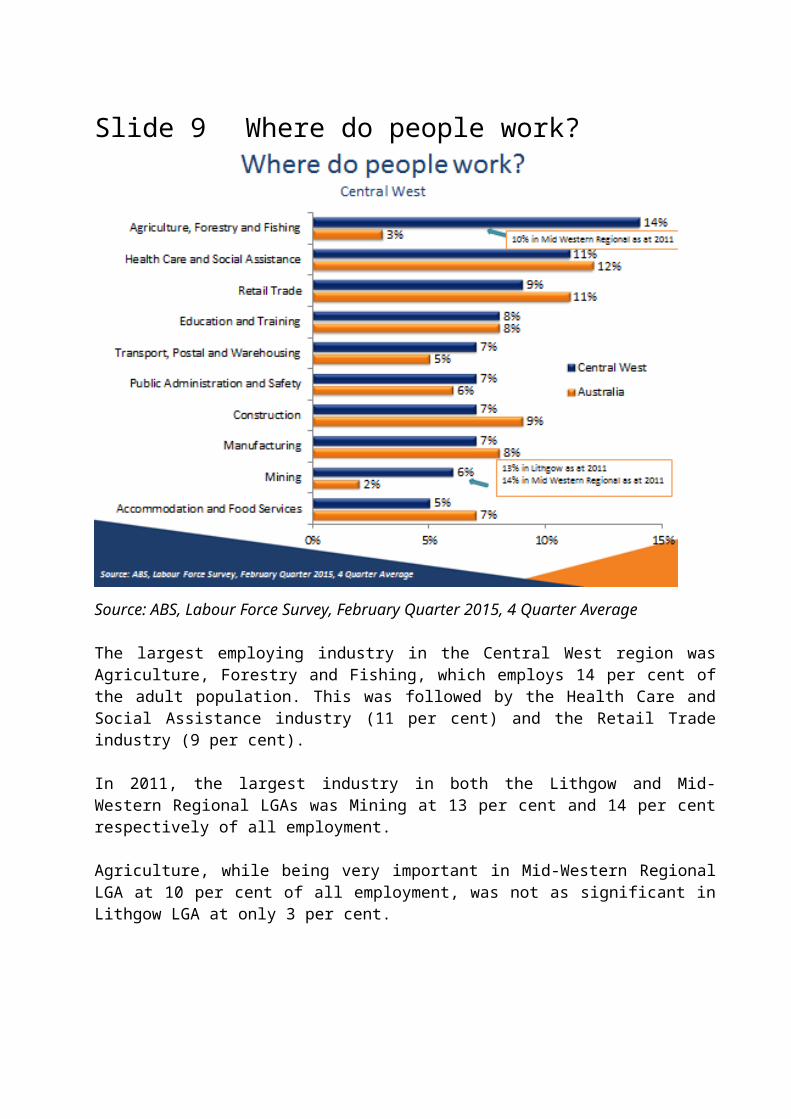
Source: ABS, Labour Force Survey, February Quarter 2015, 4 Quarter Average
The largest employing industry in the Central West region was Agriculture, Forestry and Fishing, which employs 14 per cent of the adult population. This was followed by the Health Care and Social Assistance industry (11 per cent) and the Retail Trade industry (9 per cent).
In 2011, the largest industry in both the Lithgow and Mid-Western Regional LGAs was Mining at 13 per cent and 14 per cent respectively of all employment.
Agriculture, while being very important in Mid-Western Regional LGA at 10 per cent of all employment, was not as significant in Lithgow LGA at only 3 per cent.

Slide 10 Employment declining in largest industries
Source: ABS, Labour Force Survey, February Quarter 2015, 4 Quarter Average
Employment in Transport, Postal and Warehousing increased by 2,000 in the 12 months to February 2015 , this was followed by Rental, Hiring and Real Estate Services (800) and Electricity, Gas, Water and Waste Services (500).
It should be noted that since February 2014 the Mining industry in the Central West SA4 now employs 2,000 fewer people.

Slide 11 Changing face of industry
Source: ABS, Labour Force Survey, February Quarter 2015, 4 Quarter Average

Slide 12 Most new jobs will be in the services sector; few opportunities in Mining
Source: Department of Employment, Projections to November 2018
The Health Care and Social Assistance industry is projected to create 1,800 jobs in the Central West Region in the next five years to November 2018. This is followed by Education and Training (1,200) and Accommodation and Food Services (1,000).
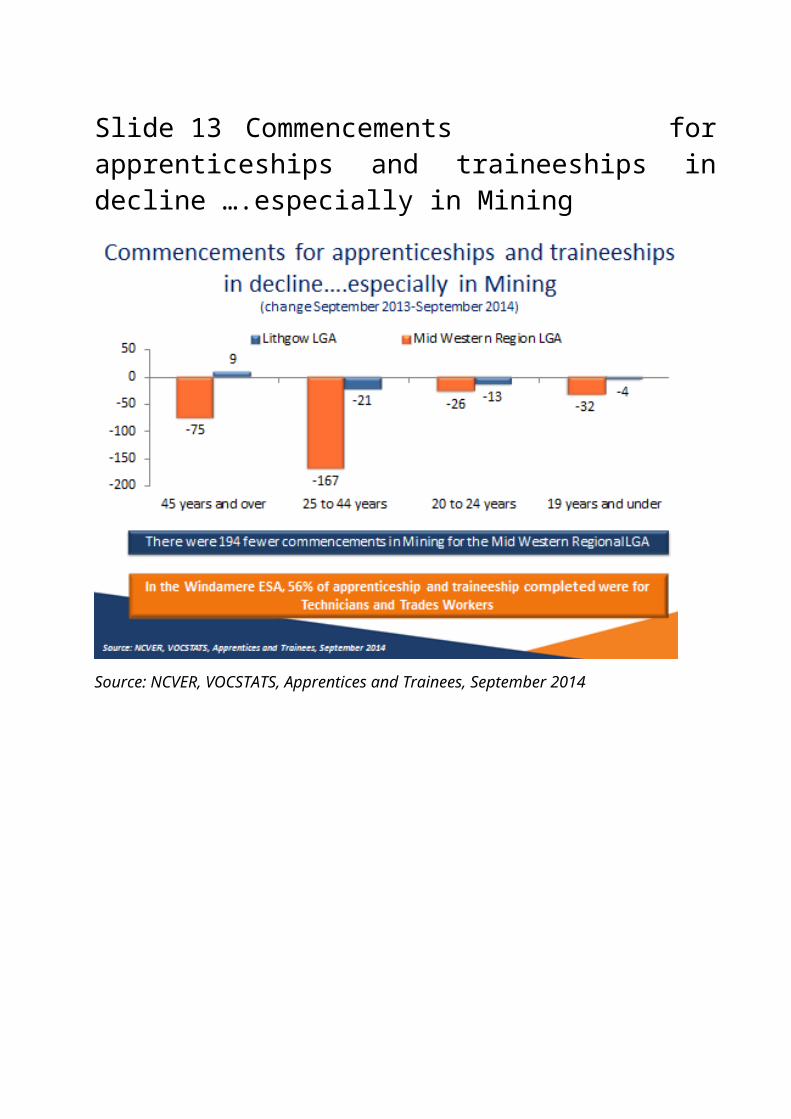
Slide 13 Commencements for apprenticeships and traineeships in decline ….especially in Mining
Source: NCVER, VOCSTATS, Apprentices and Trainees, September 2014

Slide 14 What are 18 to 24 year olds doing?
Source: ABS, Census of Population and Housing, 2011

Slide 15 High youth unemployment
Region
Youth unemployment(15-24 years)
Participation rate
PersonsYouth
unemployment rate
Central West 3,800 20.4% 73.3%
New South Wales 89,600 13.7% 66.5%
Source: ABS, Labour Force, February 2015 (3 month averages)
Due to their lack of skills and experience, young people can be particularly vulnerable during a labour market downturn.
The youth unemployment rate is the proportion of those aged 15 to 24 years, participating in the labour market, who are unemployed.
As at February 2015, the youth unemployment rate for the Central West SA4 was 20.4 per cent, which was lower than New South Wales, 13.7 per cent. The participation rate for Central West was 73.3 per cent, which is also higher than New South Wales (66.5 per cent).

Slide 16 Youth disengagement a concern
Source: ABS, Census of Population and Housing, 2011

Slide 17 Many children grow up in jobless families
Source: ABS, Census of Population and Housing, 2011
At the time of the 2011 Census: 20 per cent of families with children under the age of 15 (790 families) in the region
were jobless. (Lithgow 21% and Mid-Western Regional 18%) 53 per cent of one parent families with children under the age of 15 (560 families) in the
region were jobless. (Lithgow 56% and Mid-Western Regional 49%) There are around 1,530 children in jobless families. (Lithgow 750 and Mid-Western
Regional 780)

Slide 18 Levels of educational low (25 to 34 year olds)
Region Completed Year 12 (2011)
Highest non-school qualification
Advanced Diploma, Diploma or Certificate
III & IV
Attained Bachelor Degree or Higher
Lithgow LGA 45% 42% 12%
Mid-Western Regional LGA 56% 42% 17%
New South Wales 75% 29% 37%
Source: ABS, Census of Population and Housing, 2011
In the Lithgow LGA, less than half (45 per cent) of 25 to 34 year olds had completed year 12 or equivalent compared with the New South Wales (75 per cent). Similarly, a low proportion (12 per cent) of 25 to 34 year olds had attained a Bachelor Degree or higher compared with the New South Wales (37 per cent).
Job seekers who have not completed Year 12 and have limited experience in the workforce are likely to lack many basic employability skills that employers value and look for in applicants, particularly for lower skilled vacancies and entry level positions such as apprenticeships and traineeships.
The proportion of 25 to 34 year olds who had attained an Advanced Diploma, Diploma or Certificate level III or IV in the Lithgow LGA (42 per cent) was higher than the state average (29 per cent).

Slide 19 ...education and the right training is vital
Source: ABS, Census of Population and Housing, 2011
There is a strong relationship between educational attainment and employment outcomes. For those aged 25 to 34 years in the Lithgow region, there were high unemployment rates for those who had completed Certificate I & II but had not completed Year 12 (19.2 per cent) and those who had not completed Year 12 or a post school qualification (19.0 per cent).
Unemployment rates are considerably lower for those who have completed a tertiary education at the Bachelor Degree, Advanced Diploma and Diploma Level. It should also be noted that employment outcomes are better for those who have attained Certificate Levels III or IV. This emphasises the importance of the right post school education in gaining employment.

Slide 20 Indigenous labour market outcomes are poor
Region
% of Working Age Population
(WAP) Indigenous
Unemployment Rate (WAP) Participation Rate (WAP)
Indigenous Non-Indigenous Indigenous Non-
Indigenous
Lithgow LGA 4% 18.9% 7.0% 50.4% 69.9%
Mid-Western Regional LGA 4% 15.6% 5.5% 63.7% 72.5%
New South Wales 2% 17.0% 5.8% 56.4% 75.0%
Source: ABS, Census of Population and Housing, 2011
In 2011, the proportion of the working age population who identify as being Indigenous in both the Lithgow LGA and Mid-Western Regional LGA was 4 per cent, this is above the New South Wales average of 2 per cent. The Indigenous unemployment rate in Lithgow LGA is more than double the unemployment rate of the Non-Indigenous population in the area (18.9 per cent compared with 7.0 per cent). This figure is higher than that for New South Wales where the indigenous unemployment rate was 17.0%. Additionally, the Indigenous participation rate for Lithgow is 50.4 per cent which is lower than the non-indigenous portion of the population (69.9 per cent). This is also lower than the New South Wales figure of 56.4 per cent.

Slide 21 Higher reliance on income support for people aged 55 to 64 years
Source: Department of Employment administrative data, December 2014; ABS, Estimated Residential Population, 2013

Helping Job seekers transition between jobs
Slide 22 Re-entering the workforce can be difficult
Source: ABS, Labour Force Survey, February 2015

Slide 23 …because one in three of all unemployed people are out of work more than one year
Source: ABS, Labour Force Survey, February 2015 (12 month averages)
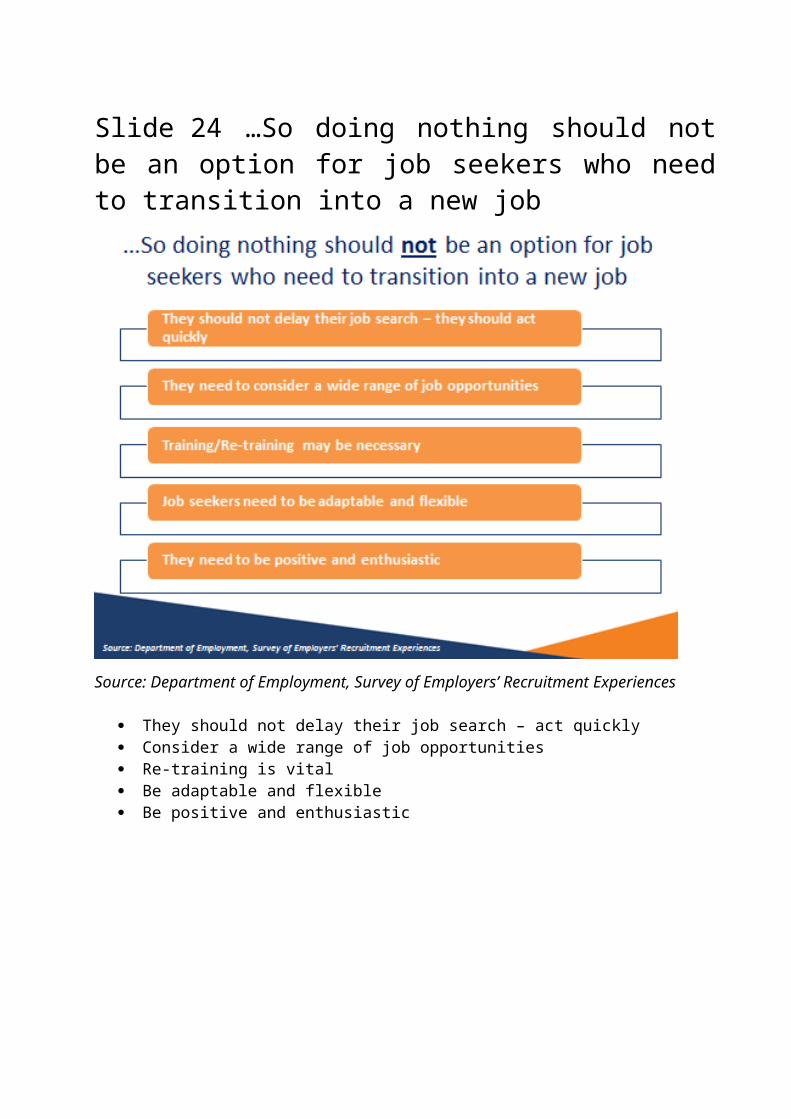
Slide 24 …So doing nothing should not be an option for job seekers who need to transition into a new job
Source: Department of Employment, Survey of Employers’ Recruitment Experiences
They should not delay their job search – act quickly Consider a wide range of job opportunities Re-training is vital Be adaptable and flexible Be positive and enthusiastic

Slide 25 Job seekers may need to think about jobs outside of their local area
Source: ABS, Census of Population and Housing, 2011
According to the 2011 Census, only 10 per cent of the people who live in Windamere travel outside the region for employment.
Residents of the Windamere ESA may need to consider opportunities in surrounding large labour markets. For example in the Bathurst Regional LGA (15,200 employed people) and Orange LGA (17,300 employed people).

Slide 26 There will be transitional challenges
Source: ABS, Census of Population and Housing, 2011

What are employers telling us?
Slide 27 Almost half of all jobs are not advertised so workers should think beyond the internet
Source: Department of Employment, Survey of Employers’ Recruitment Experiences, all regions surveyed 12 months to December 2014
Employers surveyed in the 12 months to December 2014 relied slightly more on formal methods of recruitment rather than informal.
The most commonly used formal method of recruitment was the internet and newspapers and the most commonly used informal method was word of mouth, being approached by job seekers, and internal recruitment.
Additionally, vacancies for which employers used informal recruitment methods attracted far less number of applicants (3 applicants) than when the employers used formal methods (17 applicants). This highlights the value of job seekers actively approaching employers when looking for work.

Slide 28 The recruitment process
Source: Department of Employment, Survey of Employers’ Recruitment Experiences, All surveys combined 12 months to June 2014
On average, employers in all regions surveyed received 11 (10.9) applicants per vacancy.
Of these applicants an average only 4 were interviewed.
Of these interviewed applicants only 2 (1.9) was suitable for the vacancy.
The reasons applicants did not get an interview were:₋ Lack of relevant experience₋ Insufficient qualifications or training₋ Poorly written/presented application₋ Basic employability skills

Slide 29 Many not getting an interview due to lack of experience
Source: Department of Employment, Survey of Employers’ Recruitment Experiences, All regions surveyed to December 2014
The most common reason given by employers as to why they didn’t give an applicant an interview was lack of relevant work experience (51 per cent). This was followed by insufficient qualifications or training (21 per cent).

Slide 30 Employability skills are essential
Source: Department of Employment, Survey of Employers’ Recruitment Experiences, all regions surveyed 12 months to December 2014
There were was range of general employability skills and personality traits that employers commonly viewed as essential for the position they recently recruited for.
Employability skills commonly considered essential included: Interpersonal Skills Communication Customer Skills Team Work
Personality traits commonly considered essential included: Reliability Attitude Work Ethics and Adaptability Presentation

Slide 31 Improving the employment prospects of young Australians – employers’ perspective
Source: Department of Employment, Survey of Employers’ Recruitment Experiences, various regions, October 2013 to April 2014
This graph is based on employer responses from the Gladstone, Bundaberg-Hervey Bay, Central Victoria, Port Augusta - Whyalla - Port Pirie, Sydney West and Blue Mountains, Illawarra, Caboolture-Sunshine Coast and Tasmania regions between October 2013 and April 2014.
Over half of employers (57 per cent) believed that improving employability and labour market engagement would improve youth labour market outcomes, most particularly:
Attitude/motivation Communication/teamwork Reliability Presentation
A substantial proportion of employers (30 per cent) believed that work experience and further education or training would improve youth labour market outcomes, in particular:
Work experience Education
Traineeships/ApprenticeshipsWhile a total of 3142 employers were surveyed, the percentages reported in this graph are based on the 69 per cent who provided a response. Some responses were coded to multiple categories.


Slide 32 ConclusionChallenges facing the region
Rising unemployment Length of time searching for work between jobs getting longer High reliance on mining for jobs – redundancies Youth disengagement Majority of young people not finishing Year 12 High reliance on income support especially in the 55 and over age group
Opportunities Projected jobs growth in industries with lower to medium skilled occupations Workers should not limit their job search to their local area
Job seekers need to consider… Is the Mining industry a long term option? Decreasing labour force and short careers Other industries as a career choice, such as Health as a strong growth industry Job seekers need to be job ready and engaged in the labour market Education, training, work experience and enhancing employability skills are a must Workers expecting to be retrenched need to prepare themselves early - retraining may
be necessary Use appropriate job search strategies
Ongoing collaboration amongst key stakeholders

Slide 33 Further questionsIf you have any questions about the presentation please contact the Employer Surveys Section or Recruitment Analysis Section on:
Tel: 1800 059 439 or Email: [email protected]