slide 2.1-2 chapter 1 test mean: 84 median: 89 breakdown: 22 a’s 12 b’s 4 c’s 4 d’s 3 f’s...
TRANSCRIPT

Slide 2.1-2
Chapter 1 Test
Mean: 84
Median: 89
Breakdown:
22 A’s
12 B’s
4 C’s
4 D’s
3 F’s
Copyright © 2009 Pearson Education, Inc.

Copyright © 2009 Pearson Education, Inc.
CHAPTER 2:More on Functions
2.1 Increasing, Decreasing, and Piecewise Functions; Applications2.2 The Algebra of Functions2.3 The Composition of Functions2.4 Symmetry and Transformations 2.5 Variation and Applications

Copyright © 2009 Pearson Education, Inc.
2.1 Increasing, Decreasing, and Piecewise
Functions; Applications
Graph functions, looking for intervals on which the function is increasing, decreasing, or constant, and estimate relative maxima and minima.
Given an application, find a function that models the application; find the domain of the function and function values, and then graph the function.
Graph functions defined piecewise.

Slide 2.1-5Copyright © 2009 Pearson Education, Inc.
Increasing, Decreasing, and Constant Functions
On a given interval, if the graph of a function rises from left to right, it is said to be increasing on that interval. If the graph drops from left to right, it is said to be decreasing.
If the function values stay the same from left to right, the function is said to be constant.
Slide 2.1-6Copyright © 2009 Pearson Education, Inc.
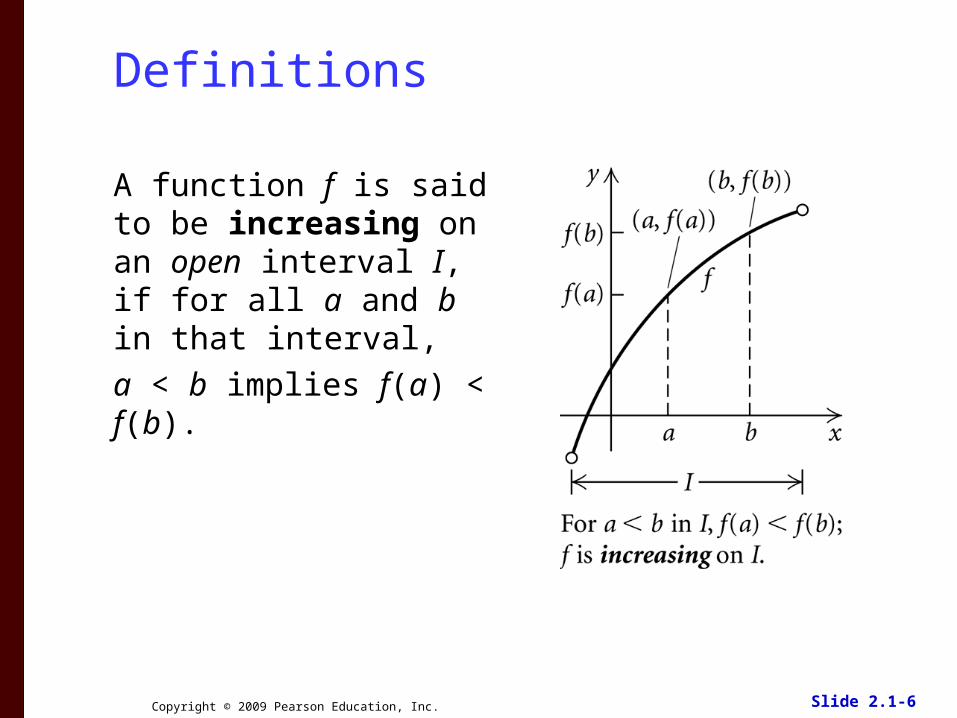
Definitions
A function f is said to be increasing on an open interval I, if for all a and b in that interval,
a < b implies f(a) < f(b).
Slide 2.1-7Copyright © 2009 Pearson Education, Inc.
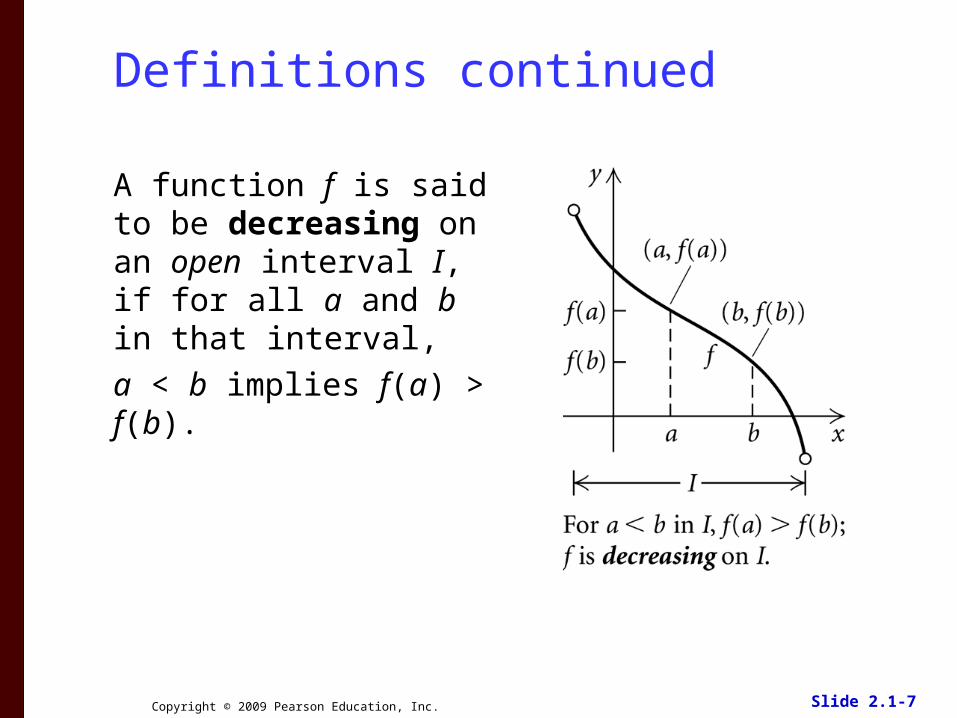
Definitions continued
A function f is said to be decreasing on an open interval I, if for all a and b in that interval,
a < b implies f(a) > f(b).

Slide 2.1-8Copyright © 2009 Pearson Education, Inc.
A function f is said to be
constant on an open interval I,
if for all a and b in that interval, f(a) = f(b).
Definitions continued

Slide 2.1-9Copyright © 2009 Pearson Education, Inc.
Relative Maximum and Minimum Values
Suppose that f is a function for which f(c) exists for some c in the domain of f. Then:
f(c) is a relative maximum if there exists an open interval I containing c such that f(c) > f(x), for all x in I where x c; and
f(c) is a relative minimum if there exists an open interval I containing c such that f(c) < f(x), for all x in I where x c.

Slide 2.1-10Copyright © 2009 Pearson Education, Inc.
Relative Maximum and Minimum Values
y
xc1 c2 c3
Relative minimum
Relative maximum f

Slide 2.1-11Copyright © 2009 Pearson Education, Inc.
Applications of Functions Many real-world situations can be modeled by functions.
ExampleA man plans to enclose a rectangular area using 80 yards of fencing. If the area is w yards wide, express the enclosed area as a function of w.
SolutionWe want area as a function of w. Since the area is rectangular, we have A = lw. We know that the perimeter, 2 lengths and 2 widths, is 80 yds, so we have 40 yds for one length and one width. If the width is w, then the length, l, can be given by l = 40 – w.
Now A(w) = (40 – w)w = 40w – w2.

Slide 2.1-12Copyright © 2009 Pearson Education, Inc.
Functions Defined Piecewise
For the function defined as:
find f (-3), f (1), and f (5).
2 , for 0,
( ) 4, for 0 2,
1, for 2,
x x
f x x
x x
Some functions are defined piecewise using different output formulas for different parts of the domain.
Since –3 0, use f (x) = x2: f (–3) = (–3)2 = 9.
Since 0 < 1 2, use f (x) = 4: f (1) = 4.
Since 5 > 2 use f (x) = x – 1: f (5) = 5 – 1 = 4.
Slide 2.1-13Copyright © 2009 Pearson Education, Inc.
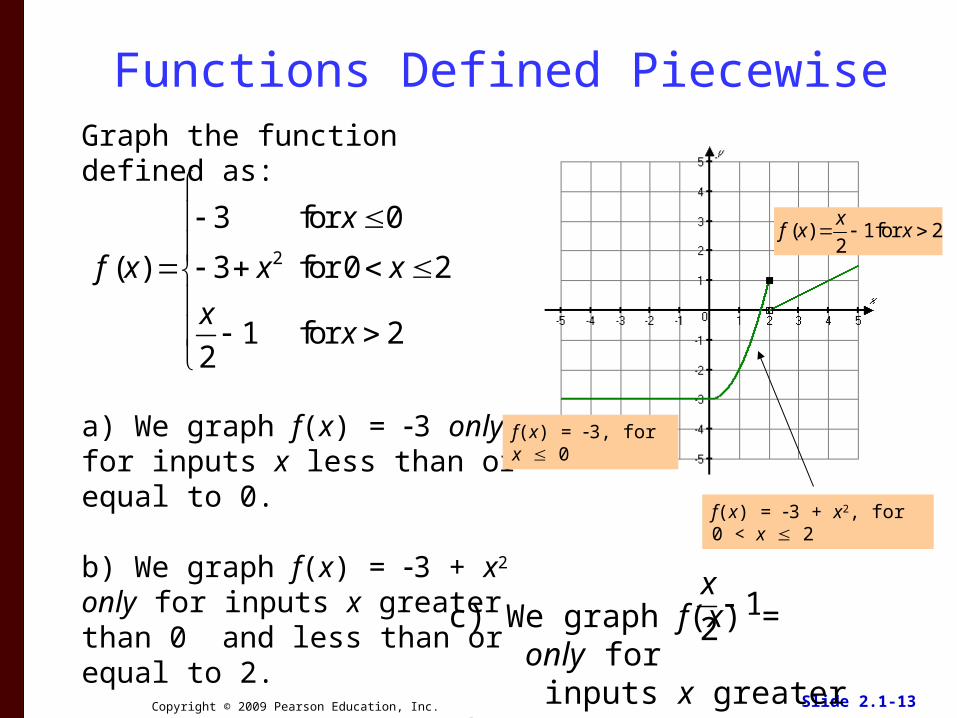
c) We graph f(x) = only for inputs x greater than 2.
Functions Defined PiecewiseGraph the function defined as:
a) We graph f(x) = 3 only for inputs x less than or equal to 0.
b) We graph f(x) = 3 + x2 only for inputs x greater than 0 and less than or equal to 2.
2
3 for 0
( ) 3 for 0 2
1 for 22
x
f x x x
xx
f(x) = 3, for x 0
f(x) = 3 + x2, for 0 < x 2
( ) 1for 22
xf x x
12
x
Slide 2.1-14Copyright © 2009 Pearson Education, Inc.
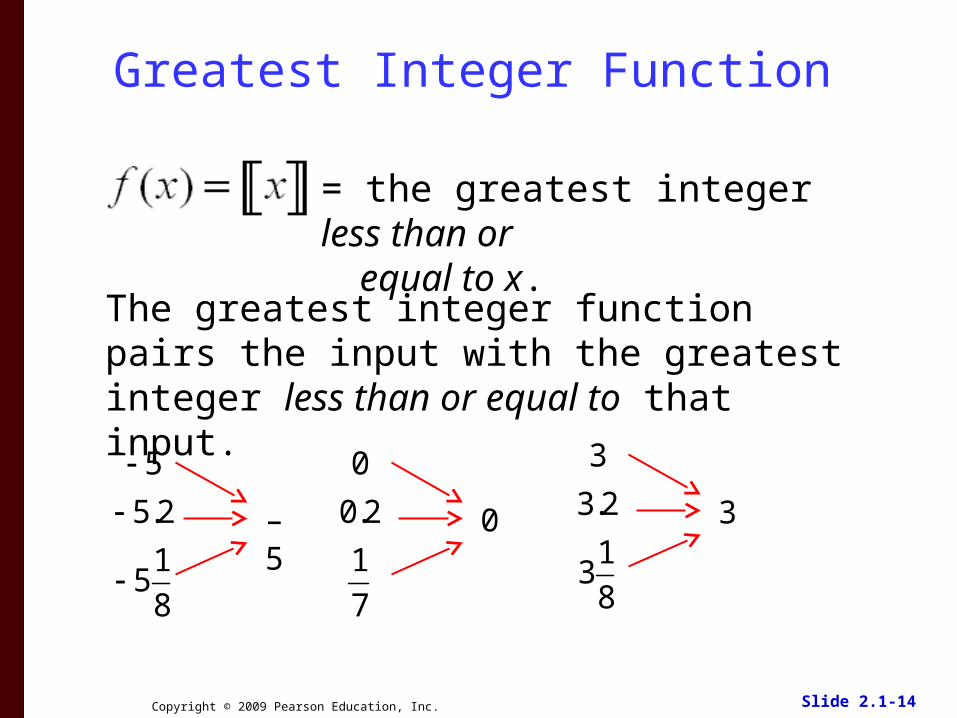
= the greatest integer less than or equal to x.
Greatest Integer Function
5
5.2
15
8
The greatest integer function pairs the input with the greatest integer less than or equal to that input.
–5
0
0.2
1
7
0
3
3.2
13
8
3

Slide 2.1-15
Determine the intervals on which the function is (a) increasing, (b) decreasing, and © constant
Copyright © 2009 Pearson Education, Inc.

Slide 2.1-16
Determine the domain and range of the function
Copyright © 2009 Pearson Education, Inc.

Slide 2.1-17
Determine any relative maxima or minima
Copyright © 2009 Pearson Education, Inc.

Slide 2.1-18
Determine the intervals on which the function is (a) increasing, (b) decreasing, and © constant
Copyright © 2009 Pearson Education, Inc.

Slide 2.1-19
Determine the domain and range of the function
Copyright © 2009 Pearson Education, Inc.
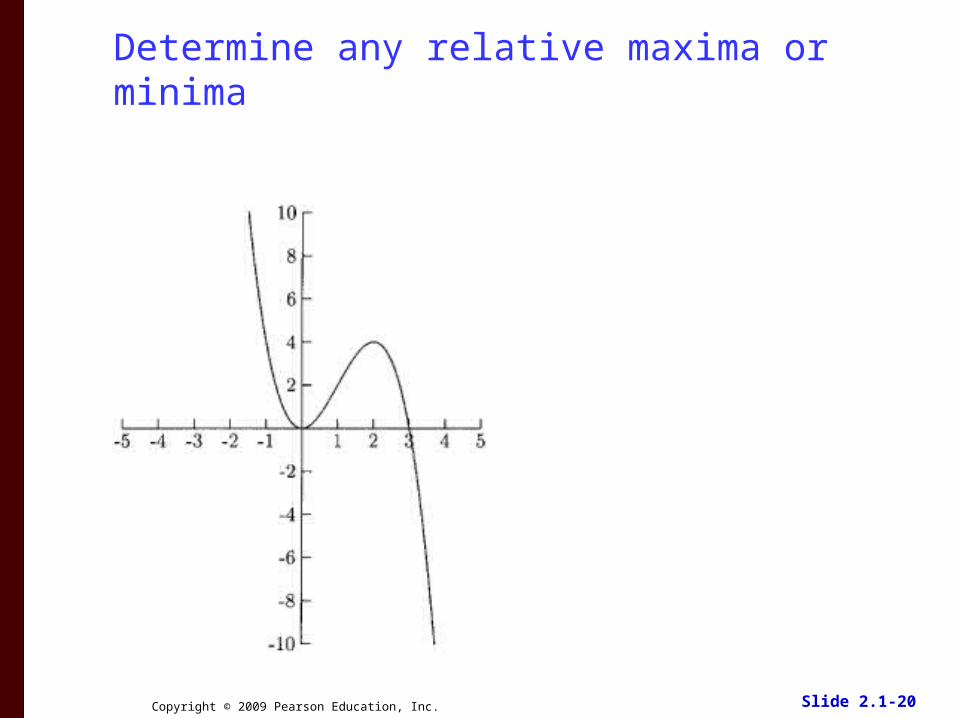
Slide 2.1-20
Determine any relative maxima or minima
Copyright © 2009 Pearson Education, Inc.

Slide 2.1-21
Graph the function. Estimate the intervals on which the function is increasing or decreasing and any relative maxima or minima
Copyright © 2009 Pearson Education, Inc.
53)( xxf

Slide 2.1-22
Graph the function using the given viewing window. Find the intervals on which the function is increasing or decreasing and find any relative maxima or minima.
Copyright © 2009 Pearson Education, Inc.
]15,20,7,3[
496)( 23
xxxxf

Slide 2.1-23
For each piecewise function, find the specified function values.
Copyright © 2009 Pearson Education, Inc.
)4(
)1(
)0(
)5(
1,2
15,1
5,183
)(
h
h
h
h
forxx
xfor
forxx
xh

Slide 2.1-24
http://www.education.com/study-help/article/pre-calculus-help-practice-functions/
Copyright © 2009 Pearson Education, Inc.