slide 7-1 copyright © 2004 pearson education, inc
TRANSCRIPT
Slide 7-1 Copyright © 2004 Pearson Education, Inc.

Slide 7-2 Copyright © 2004 Pearson Education, Inc.
Scatterplots, Association, and Correlation
Chapter 7
Created by Jackie Miller, The Ohio State University
Slide 7-3 Copyright © 2004 Pearson Education, Inc.
Scatterplots
• Scatterplots may be the most common and most effective display for data. – In a scatterplot, you can see patterns, trends,
relationships, and even the occasional extraordinary value sitting apart from the others.
• Scatterplots are the best way to start observing the relationship and the ideal way to picture associations between two quantitative variables.

Slide 7-4 Copyright © 2004 Pearson Education, Inc.
Looking at Scatterplots
• When looking at scatterplots, we will look for direction, form, and scatter.
• Direction:– A pattern that runs from the upper left to the
lower right is said to have a negative direction.
– A trend running the other way has a positive direction.
Slide 7-5 Copyright © 2004 Pearson Education, Inc.
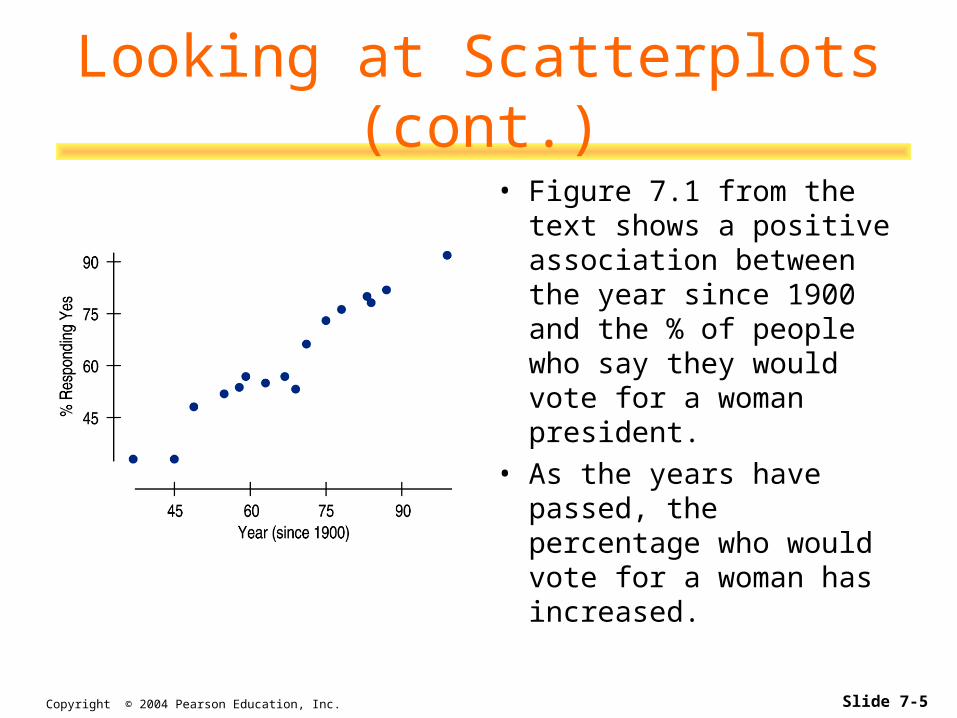
Looking at Scatterplots (cont.)
• Figure 7.1 from the text shows a positive association between the year since 1900 and the % of people who say they would vote for a woman president.
• As the years have passed, the percentage who would vote for a woman has increased.

Slide 7-6 Copyright © 2004 Pearson Education, Inc.
Looking at Scatterplots (cont.)
• Figure 7.2 from the text shows a negative association between peak period freeway speed and cost per person of traffic delays.
• As the peak period freeway speed increases, the cost per person of traffic delays decreases.
Slide 7-7 Copyright © 2004 Pearson Education, Inc.
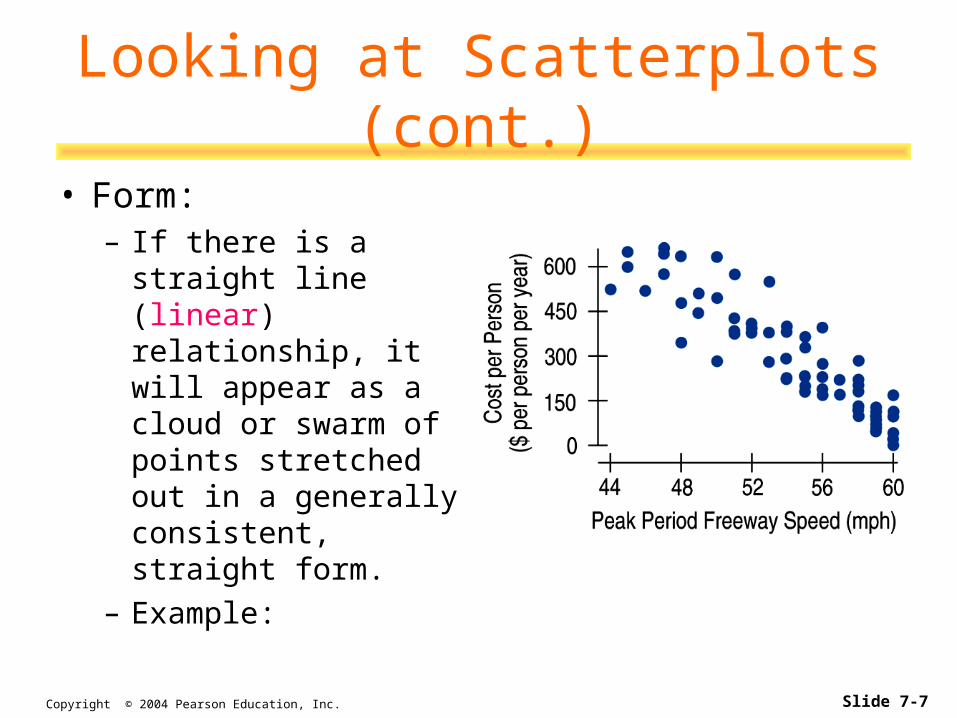
Looking at Scatterplots (cont.)
• Form:– If there is a straight
line (linear) relationship, it will appear as a cloud or swarm of points stretched out in a generally consistent, straight form.
– Example:
Slide 7-8 Copyright © 2004 Pearson Education, Inc.
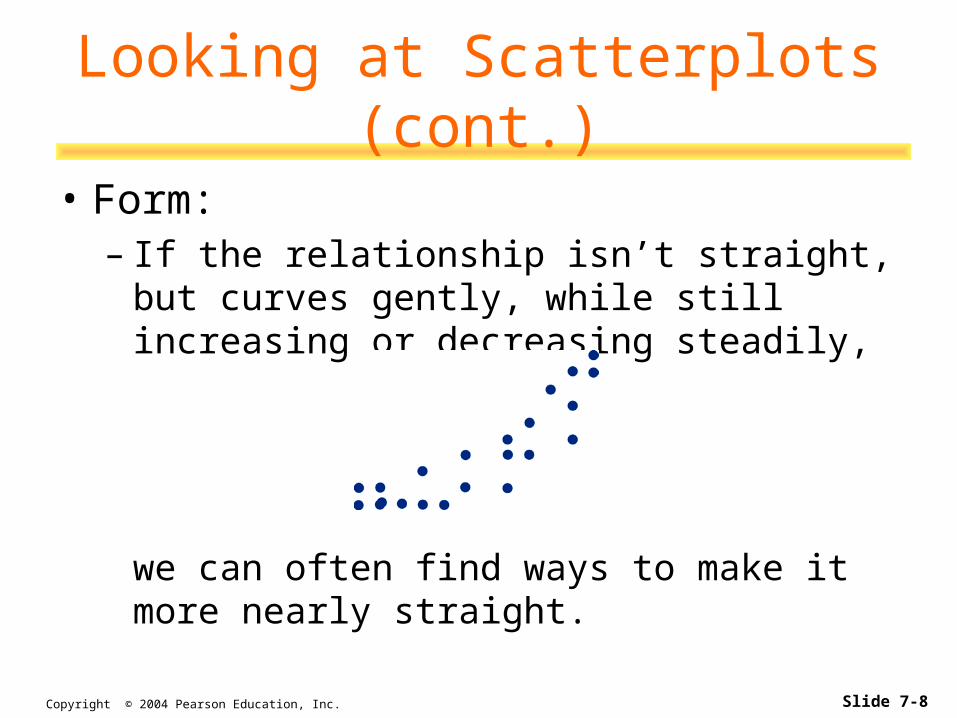
Looking at Scatterplots (cont.)
• Form:– If the relationship isn’t straight, but curves
gently, while still increasing or decreasing steadily,
we can often find ways to make it more nearly straight.
Slide 7-9 Copyright © 2004 Pearson Education, Inc.
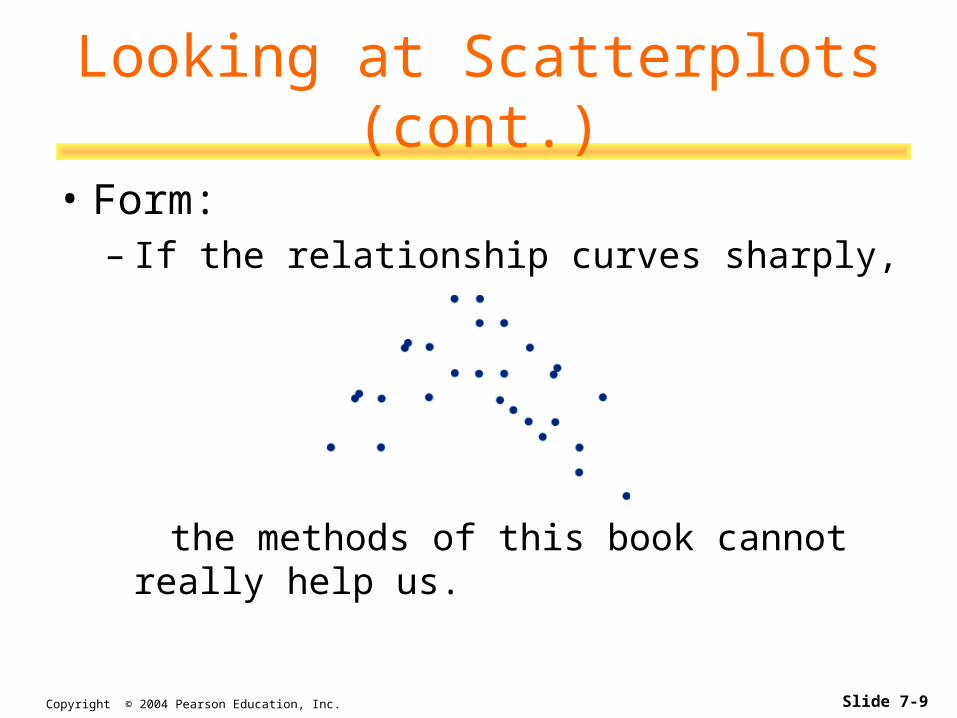
Looking at Scatterplots (cont.)
• Form:– If the relationship curves sharply,
the methods of this book cannot really help us.
Slide 7-10 Copyright © 2004 Pearson Education, Inc.
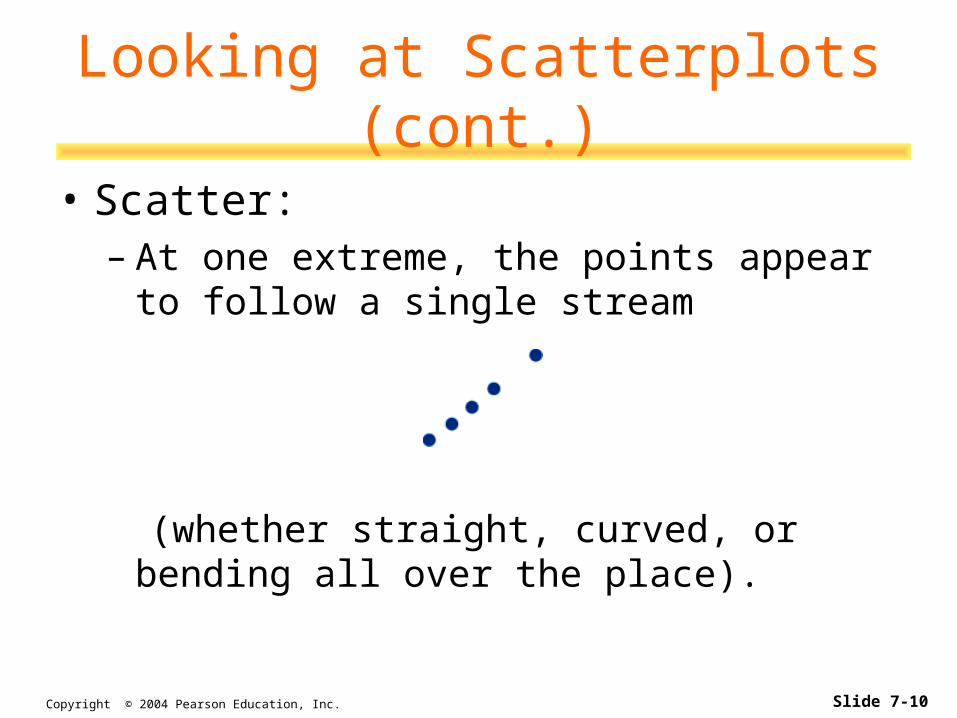
Looking at Scatterplots (cont.)
• Scatter:– At one extreme, the points appear to follow a
single stream
(whether straight, curved, or bending all over the place).
Slide 7-11 Copyright © 2004 Pearson Education, Inc.
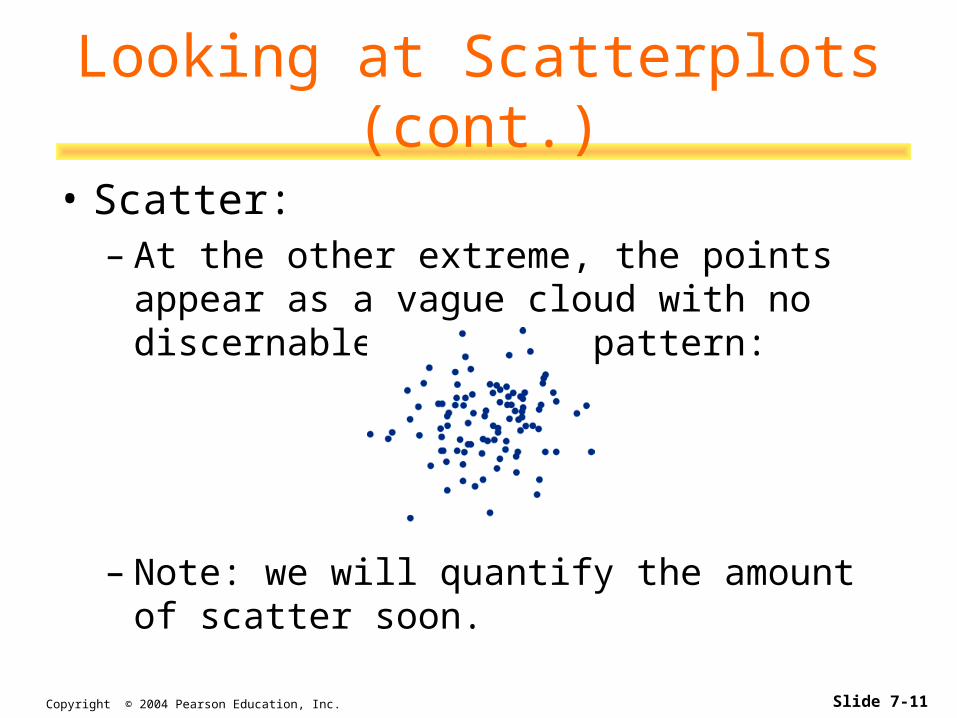
Looking at Scatterplots (cont.)
• Scatter:– At the other extreme, the points appear as a
vague cloud with no discernable trend or pattern:
– Note: we will quantify the amount of scatter soon.
Slide 7-12 Copyright © 2004 Pearson Education, Inc.
Looking at Scatterplots (cont.)
• Look for the unexpected—often the most interesting thing to see in a scatterplot is the thing you never thought to look for. One example of such a surprise is an outlier standing away from the overall pattern of the scatterplot.
Slide 7-13 Copyright © 2004 Pearson Education, Inc.
Roles for Variables
• It is important to determine which of the two quantitative variables goes on the x-axis and which on the y-axis. This determination is made based on the roles played by the variables.
• When the roles are clear, the explanatory or predictor variable goes on the x-axis, and the response variable goes on the y-axis.
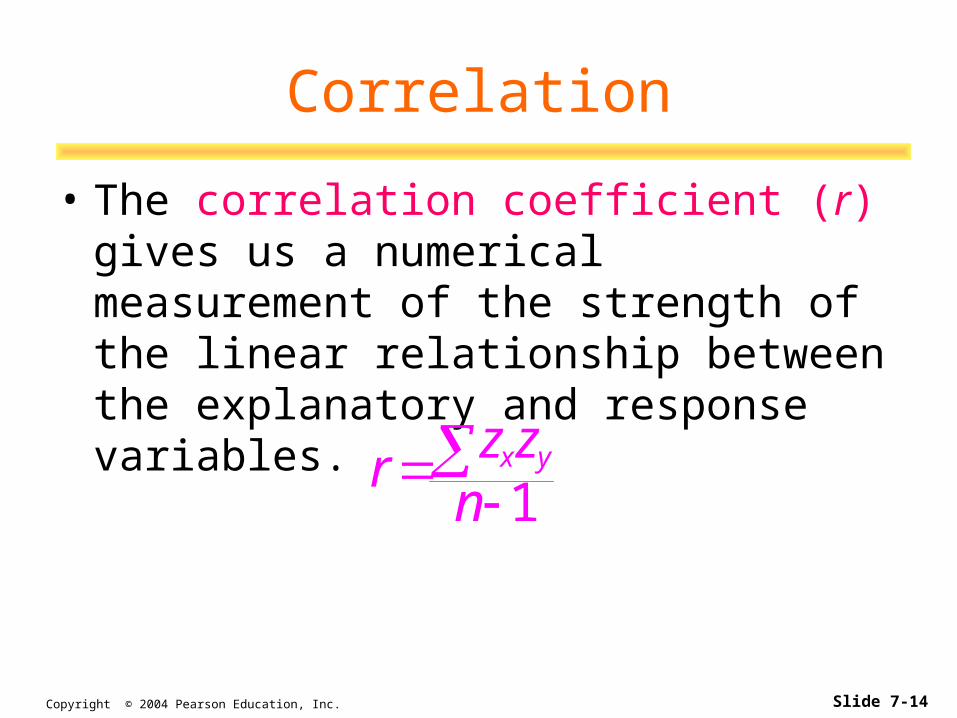
Slide 7-14 Copyright © 2004 Pearson Education, Inc.
Correlation
• The correlation coefficient (r) gives us a numerical measurement of the strength of the linear relationship between the explanatory and response variables.
1x yz zr
n
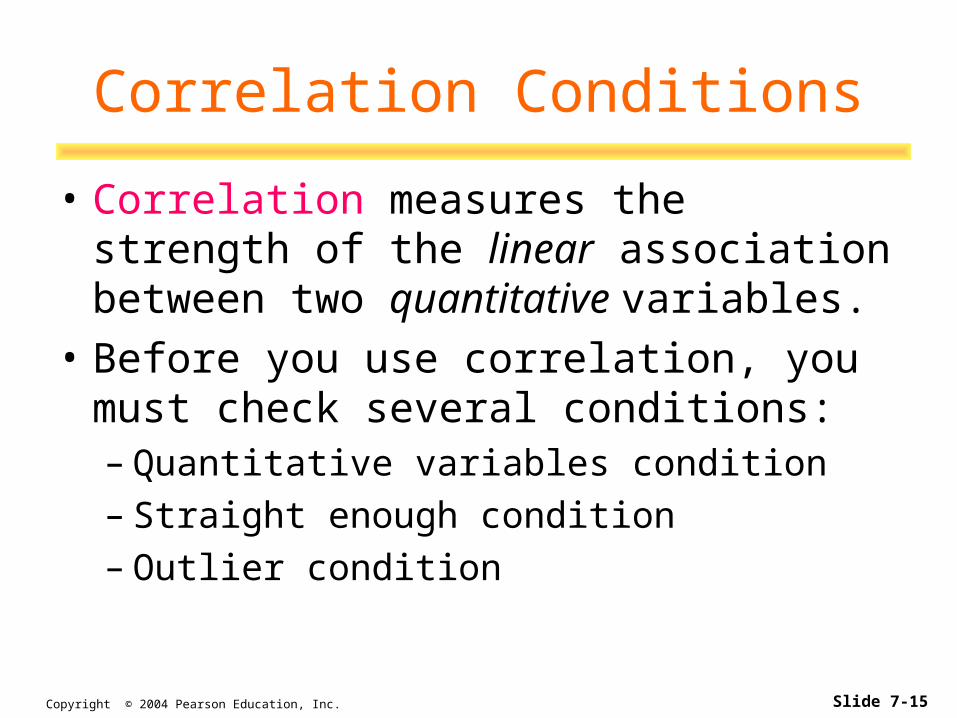
Slide 7-15 Copyright © 2004 Pearson Education, Inc.
Correlation Conditions
• Correlation measures the strength of the linear association between two quantitative variables.
• Before you use correlation, you must check several conditions:– Quantitative variables condition– Straight enough condition– Outlier condition

Slide 7-16 Copyright © 2004 Pearson Education, Inc.
Correlation Conditions (cont.)
• Quantitative variables condition:– Correlation applies only to quantitative
variables. – Don’t apply correlation to categorical data
masquerading as quantitative. – Check that you know the variables’ units and
what they measure.

Slide 7-17 Copyright © 2004 Pearson Education, Inc.
Correlation Conditions (cont.)
• Straight enough condition:– You can calculate a correlation coefficient for
any pair of variables. – But correlation measures the strength only of
the linear association, and will be misleading if the relationship is not linear.

Slide 7-18 Copyright © 2004 Pearson Education, Inc.
Correlation Conditions (cont.)
• Outlier condition:– Outliers can distort the correlation
dramatically. – An outlier can make an otherwise small
correlation look big or hide a large correlation. – It can even give an otherwise positive
association a negative correlation coefficient (and vice versa).
– When you see an outlier, it’s often a good idea to report the correlations with and without the point.
Slide 7-19 Copyright © 2004 Pearson Education, Inc.
Correlation Properties
• The sign of a correlation coefficient gives the direction of the association.
• Correlation is always between -1 and +1. – Correlation can be exactly equal to -1 or +1,
but these values are unusual in real data because they mean that all the data points fall exactly on a single straight line.
– A correlation near zero corresponds to a weak linear association.
Slide 7-20 Copyright © 2004 Pearson Education, Inc.
Correlation Properties (cont.)
• Correlation treats x and y symmetrically: – The correlation of x with y is the same as the
correlation of y with x.
• Correlation has no units.• Correlation is not affected by changes in
the center or scale of either variable. – Correlation depends only on the z-scores, and
they are unaffected by changes in center or scale.

Slide 7-21 Copyright © 2004 Pearson Education, Inc.
Correlation Properties (cont.)
• Correlation measures the strength of the linear association between the two variables. – Variables can have a strong association but
still have a small correlation if the association isn’t linear.
• Correlation is sensitive to outliers. A single outlying value can make a small correlation large or make a large one small.
Slide 7-22 Copyright © 2004 Pearson Education, Inc.
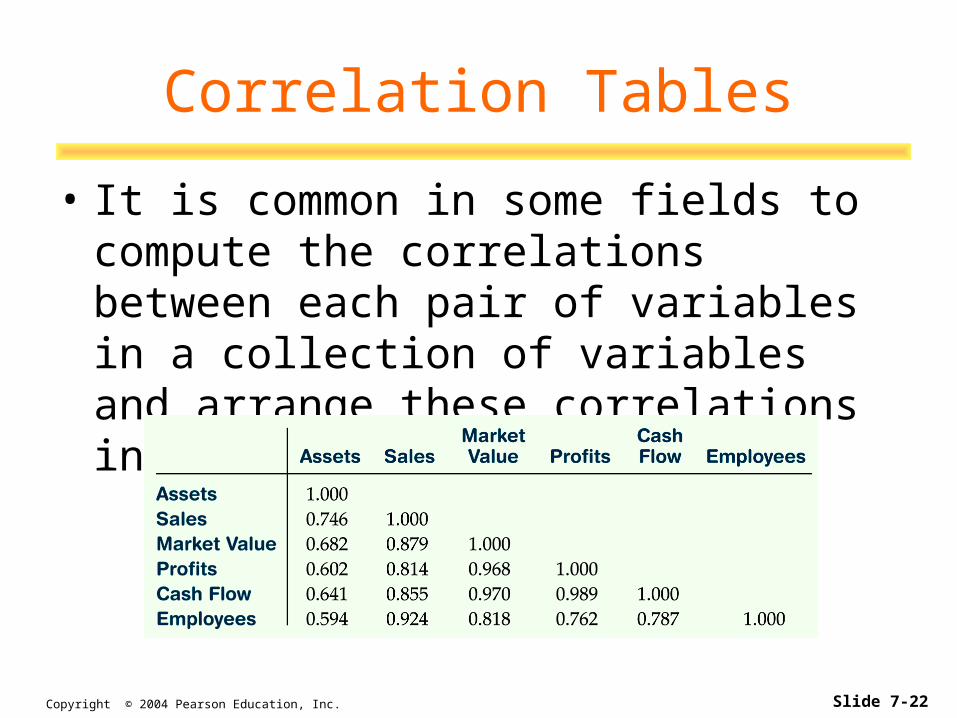
Correlation Tables
• It is common in some fields to compute the correlations between each pair of variables in a collection of variables and arrange these correlations in a table.

Slide 7-23 Copyright © 2004 Pearson Education, Inc.
*Straightening Scatterplots
• Straight line relationships are the ones that we can measure with correlation.
• When a scatterplot shows a bent from that consistently increases or decreases, we can often straighten the form of the plot by re-expressing one or both variables.

Slide 7-24 Copyright © 2004 Pearson Education, Inc.
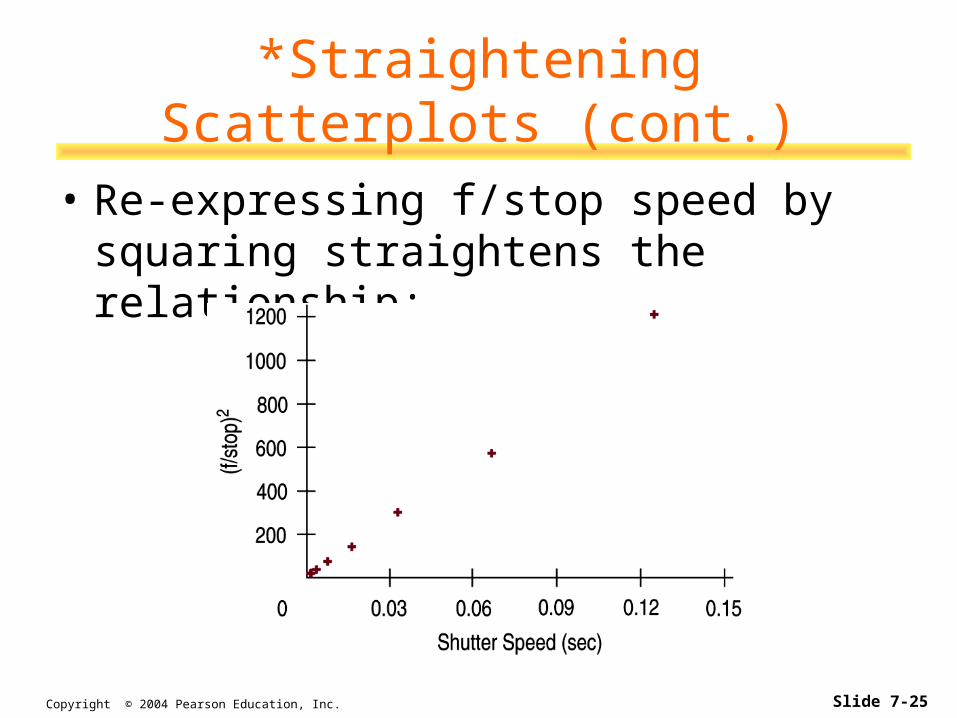
*Straightening Scatterplots (cont.)
• A scatterplot of f/stop vs. shutter speed shows a bent relationship:
Slide 7-25 Copyright © 2004 Pearson Education, Inc.
*Straightening Scatterplots (cont.)
• Re-expressing f/stop speed by squaring straightens the relationship:

Slide 7-26 Copyright © 2004 Pearson Education, Inc.
What Can Go Wrong?
• Check the conditions– Don’t correlate categorical variables.– Be sure the association is linear.– Beware of outliers.
• Don’t confuse correlation with causation– Once we have a strong correlation, it’s tempting to try
to explain it by imagining that the predictor variable caused the response to change.
• Watch out for lurking variables– A hidden variable that stands behind a relationship
and determines it by simultaneously affecting both variables is called a lurking variable.

Slide 7-27 Copyright © 2004 Pearson Education, Inc.
Key Concepts
• Scatterplots show us the relationship between two quantitative variables measured on the same cases. – We talk about direction, form, and scatter when
looking at scatterplots.
• In a scatterplot, the explanatory variable goes on the x-axis and the response variables goes on the y-axis.
• Correlation is a numerical measure of the direction and strength of a linear association.