slm final2008asfinvestorpresentation2108
DESCRIPTION
TRANSCRIPT
SLM Corporation
ABS Investor Presentation American Securitization Forum Conference
February 4-6, 2008
2
This presentation contains forward-looking statements and information that are based on management’s current expectations as of the date of this document. When used in this report, the words “anticipate,” “believe,” “estimate,” “intend” and “expect” and similar expressions are intended to identify forward-looking statements. These forward-looking statements are subject to risks, uncertainties, assumptions and other factors that may cause the actual results to be materially different from those reflected in such forward-looking statements. These factors include, among others, increased financing costs and more limited liquidity as a result of current conditions in the credit markets or otherwise; any adverse outcomes in any significant litigation to which we are a party; changes in the terms of student loans and the educational credit marketplace arising from the implementation of applicable laws and regulations and from changes in these laws and regulations, which may reduce the volume, average term and yields on student loans under the Federal Family Education Loan Program (“FFELP”) or result in loans being originated or refinanced under non-FFELP programs or may affect the terms upon which banks and others agree to sell FFELP loans to the Company. In addition, a larger than expected increase in third party consolidations of our FFELP loans could materially adversely affect our results of operations. The Company could also be affected by changes in the demand for educational financing or in financing preferences of lenders, educational institutions, students and their families; incorrect estimates or assumptions by management in connection with the preparation of our consolidated financial statements; changes in the composition of our Managed FFELP and Private Education Loanportfolios; changes in the general interest rate environment and in the securitization markets for education loans, which may increase the costs or limit the availability of financings necessary to initiate, purchase or carry education loans; changes in projections of losses from loan defaults; changes in general economic conditions; changes in prepayment rates and credit spreads; and changes in the demand for debt management services and new laws or changes in existing laws that govern debt management services. The Company does not undertake any obligation to update or revise these forward looking statements to conform the statement to actual results or changes in the Company’s expectations.
Forward Looking Statements
3
Non-GAAP Financial Measures - The following presentation includes non-GAAP performance measures. A presentation of the most comparable GAAP financial measures and a reconciliation of the non-GAAP performance measures to the most directly comparable GAAP financial measures are included in the our most recent quarterly earnings release, quarterly earnings report on Form 10-Q and annual report on Form 10-K, which are available on our website at (http://www.salliemae.com/about/investors/stockholderinfo/earningsinfo) and (http://www.salliemae.com/about/investors/stockholderinfo/secfilings) and on the SEC’s website (http://www.sec.gov).
U.S. Government Guaranteed Student Loans – The following presentation contains references to U.S. Government guaranteed student loans. All such references are to loans made in compliance with the Federal Family Education Loan Program (“FFELP”), under Title IV of the Higher Education Act, to finance educational costs. As more fully described in our most recent quarterly earnings release, quarterly earnings report on Form 10-Q and annual report on Form 10-K, available on our website at (http://www.salliemae.com/about/investors/stockholderinfo/earningsinfo) and (http://www.salliemae.com/about/investors/stockholderinfo) and on the SEC’s website (http://www.sec.gov), the federal guarantee of FFELP loans is conditioned on loans being originated, disbursed and serviced in accordance with ED regulations. In addition, unless a loan default results from the borrower’s death, disability or bankruptcy, the federal government guarantees only 97 percent of the principal balance (95 percent on loans disbursed after October 1, 2012) plus accrued interest and the holder of the loan generally must absorb the three percent (five percent after October 1, 2012) not guaranteed as a loss on the loan (“Risk Sharing”).
Additional Information - The following presentation contains certain information about the Company that management believes is important to investors, but should be read in conjunction with other material information about the Company, including, but not limited to, the operational, market and interest rate, political and regulatory, liquidity, credit, and consolidation loan refinancing risks that the Company faces. For a discussion of the risks described above as well as additional information about the Company you should refer to our most recent quarterly earnings release, quarterly report on Form 10-Q and annual report on Form 10-K, available on our website at (http://www.salliemae.com/about/investors/stockholderinfo/earningsinfo) and (http://www.salliemae.com/about/investors/stockholderinfo/secfilings) and on the SEC’s website (http://www.sec.gov). For a discussion of the specific characteristics of any specific security, you should refer to the pricing supplement, prospectus supplement and/or prospectus applicable to that security.
Disclosures
4
SLM Corporation Overview
5
Overview of SLM Corp.
#1 originator, servicer and collector of student loans in the U.S. education lending market
$164 billion managed student loan portfolio, 83% of which is U.S. government guaranteed1
Profitable since its founding in 1972, through various political, interest rate and economic cycles2
1 As of December 31, 20072 Based on annual “Core Earnings” Net Income
6
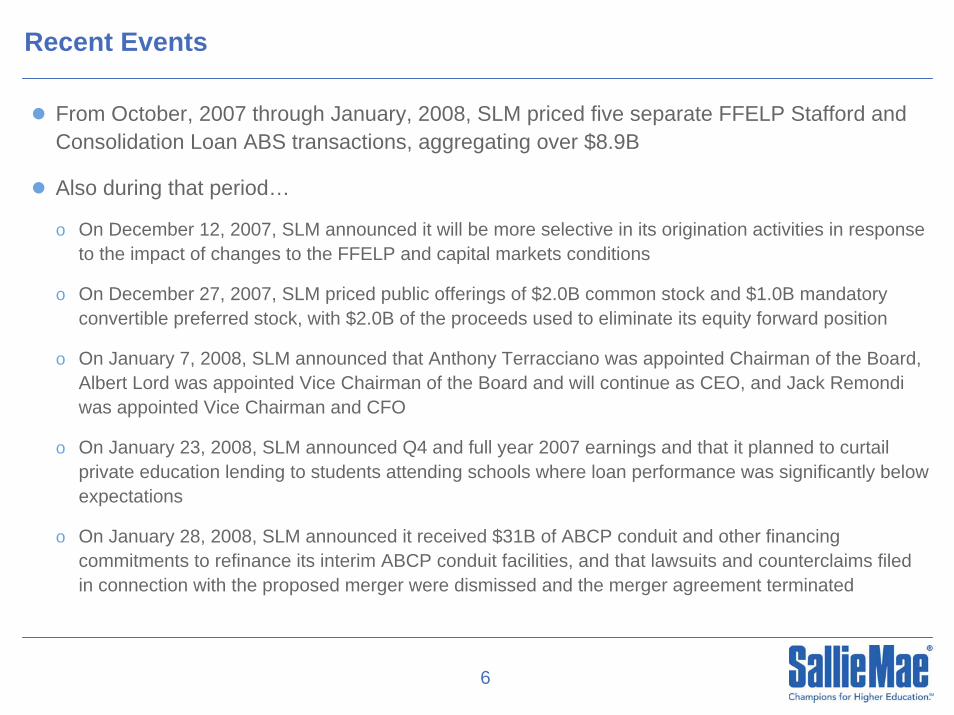
Recent Events
From October, 2007 through January, 2008, SLM priced five separate FFELP Stafford and Consolidation Loan ABS transactions, aggregating over $8.9B
Also during that period…
o On December 12, 2007, SLM announced it will be more selective in its origination activities in response to the impact of changes to the FFELP and capital markets conditions
o On December 27, 2007, SLM priced public offerings of $2.0B common stock and $1.0B mandatory convertible preferred stock, with $2.0B of the proceeds used to eliminate its equity forward position
o On January 7, 2008, SLM announced that Anthony Terracciano was appointed Chairman of the Board, Albert Lord was appointed Vice Chairman of the Board and will continue as CEO, and Jack Remondiwas appointed Vice Chairman and CFO
o On January 23, 2008, SLM announced Q4 and full year 2007 earnings and that it planned to curtail private education lending to students attending schools where loan performance was significantly below expectations
o On January 28, 2008, SLM announced it received $31B of ABCP conduit and other financing commitments to refinance its interim ABCP conduit facilities, and that lawsuits and counterclaims filed in connection with the proposed merger were dismissed and the merger agreement terminated
7
Anthony P. Terracciano, Chairman of the BoardTony was formerly President of First Union Corporation, Chairman and Chief Executive Officer of First Fidelity Bank Corporation, President and Chief Operating Officer of Mellon Bank, Vice Chairman of Chase Manhattan Bank, and non-executive Chairman of both The Dime Bank and Riggs National Corporation. Throughout his career, Tony has had a distinguished record creating value for shareholders.
John F. Remondi, Vice Chairman and Chief Financial Officer Jack will play an instrumental role in all business strategy and have responsibility for corporate finance, investor relations, accounting and reporting, financial planning, credit policy, and risk management. Jack joined Sallie Mae in 1999 as part of the company’s acquisition of Nellie Mae and was a key player in Sallie Mae’s transformation from a government sponsored entity to a fully private, retail-focused organization. Most recently, Jack was with PAR Capital Management, a Boston-based private investment management firm. Jack reports to Al Lord, Sallie Mae’s Chief Executive Officer.
New Management Biographies
8
SLM Business Fundamentals
9
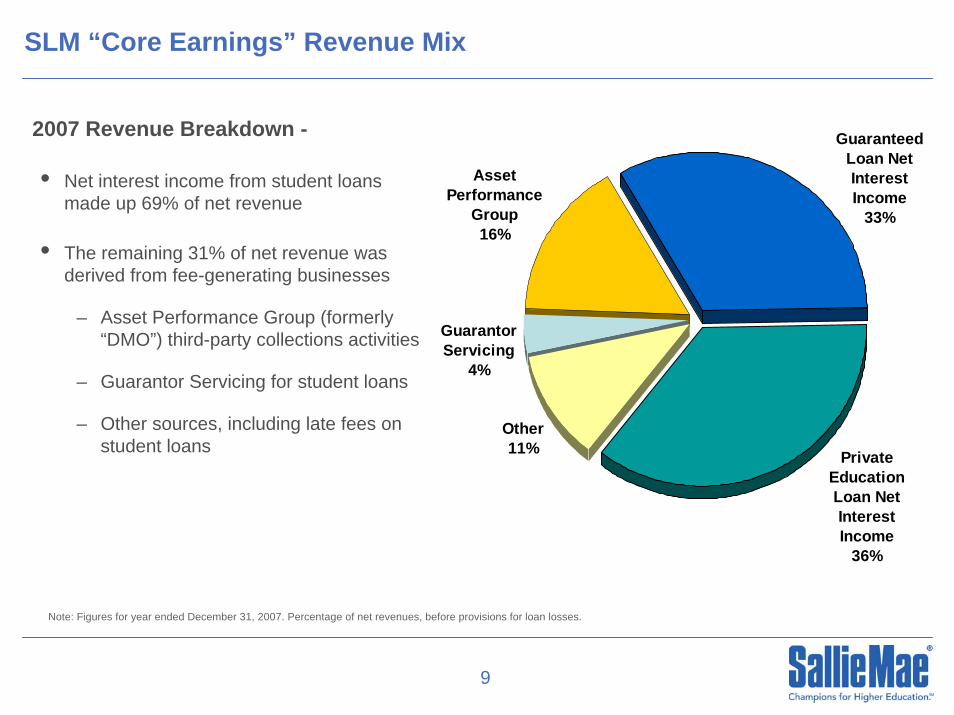
SLM “Core Earnings” Revenue Mix
• Net interest income from student loans made up 69% of net revenue
• The remaining 31% of net revenue was derived from fee-generating businesses
– Asset Performance Group (formerly “DMO”) third-party collections activities
– Guarantor Servicing for student loans
– Other sources, including late fees on student loans
Guaranteed Loan Net Interest Income
33%
Private Education Loan Net Interest Income
36%
Asset Performance
Group16%
Guarantor Servicing
4%
Other11%
Note: Figures for year ended December 31, 2007. Percentage of net revenues, before provisions for loan losses.
2007 Revenue Breakdown -

10
SLM Competitive Advantage and Market Position
Vertically IntegratedOrigination/
Servicing/Collections
Strong National andRegional Brands
Integrated,Web-Based Technology
Largest and MostExperiencedSales Team
Breadth ofProducts and
Services
$164 B managed loans10 million customers
Economies of Scale
SLM’s Competitive AdvantageSLM’s Competitive Advantage
Federal Student Loan Originations
Market Share
5 Bank of America 5% 5% 5% 2%
Note: Sallie Mae Brands 12% 7% 3% 0%
1
2
3
4 JPMorgan Chase 6% 13% 12% 10%
Lender 2006 2003 2000 1997
Sallie MaePreferred Channel¹ 27% 25% 17%
32%
6%
0%
Federal Government 21% 26% 34%
Citigroup 6% 7% 6%
Federal Student Loan Market ShareFederal Student Loan Market Share
Source: ED Top Originators of FFELP Loans. Federal fiscal year ended September 30.¹ Preferred Channel originations include loans originated under Sallie Mae brands,
plus loans originated and purchased under contract from Sallie Mae's strategic lending partners.
SingularFocus and
Scale

11
FFELP Stafford and PLUS
FFELP Stafford and PLUS
FFELP ConsolidationFFELP Consolidation
Private Credit LoansPrivate Credit Loans
Fee-Based BusinessesFee-Based Businesses
Originated primarily through schools’ financial aid officesMarketed under Sallie Mae brands plus those of strategic lender partnersLoans originated, serviced and collected by SLM’s servicing operations
Originated primarily through SLM’s nationwide school customer base, as well as direct-to-consumer channelsMarketed predominantly as Sallie Mae brand consolidation loansLoans originated, serviced and collected by SLM’s servicing operations
Originated through both school and direct-to-consumer channelsPredominantly Sallie Mae branded, coupled with FFELP loans when possibleLoans originated, serviced and collected by SLM’s servicing operations
Asset Performance Group (formerly “DMO”) and other fee businesses represent nearly one third of net revenueGrowing fee business diversifies SLM’s earnings
Fundamentals of SLM Business Model Remain Unchanged

12
Losses are Highly Concentrated among Non-Traditional Borrowers
0%
3%
6%
9%
12%
15%
18%
1Q06 2Q06 3Q06 4Q06 1Q07 2Q07 3Q07 4Q07
Non-Traditional Traditional Total
Delinquencies and defaults are concentrated among a small set of non-traditional schools and borrowersLimited number of schools accounted for > 50% of all charge-offs
Failure to complete program is major driver of defaultsMore than 65% of borrowers with loans that charged off withdrew from programs or were less than ½ time statusHigh concentration of withdrawals in non-traditional schools
Non-traditional loans represented approximately 6% of SLM’s private credit term ABS student loan collateral at 12/31/08
90 Days Delinquent as % of Repay90 Days Delinquent as % of Repay
0%
3%
6%
9%
12%
15%
18%
1Q06 2Q06 3Q06 4Q06 1Q07 2Q07 3Q07 4Q07
Non-Traditional Traditional Total
Gross Charge-Offs as % of Average RepayGross Charge-Offs as % of Average Repay

13
Grow both Private and FFELP market share at traditional schoolsSignificantly lower delinquencies and charge-offsExpect 10% growth in FFELP originationsExpect 15+% growth in Private Education originations
Curtail unprofitable originations with little strategic valueHigh default rate non-traditional schools and borrowersLower tier credit borrowersWholesale FFELP Consolidation Loan acquisitions
Adjust pricing of private credit loan products to reflect market conditions
Utilize custom scorecards and revamped collections practices to improve private credit performance
Reduce Borrower Benefits and operating expenses to generate acceptable returns under new FFELP economics
Improve profitability of fee income businesses Increase operating efficiencyShed low risk return adjusted businesses
Business Strategy Refocused on Most Profitable Businesses

14
The U.S. Student Loan Market

15
15161718192021
2000 2001 2002 2003 2004 2005 2006 2007 2008 2009 2010 2011 2012 2013 2014 2015 2016
mm
Enrollment ProjectionsDegree Granting Institutions
Strong Industry Trends Continue
Annual Cost of Education($ thousands)
$8.1 $9.0 $9.7$13.6
$21.5 $22.2 $23.9 $24.9 $26.1 $27.5 $28.7 $30.4 $32.3
$10.6 $11.4 $12.1 $12.8$8.4
2000 2001 2002 2003 2004 2005 2006 2007 2008
Public PrivatePublic CAGR: 6.8% Private CAGR: 5.1%
Source: College BoardNote: Academic years, average published tuition, fees, room and board charges at four-year institutions; enrollment-weighted
Source: National Center for Education StatisticsNote: Total enrollment in all degree-granting institutions; middle alternative projections for 2006 onward

16
Source: President’s 2008 Budget. Gross commitments by fiscal yearNote: Excludes consolidation volume
$39.8$45.3
$52.2$59.3
$64.3$69.1
$76.1$82.5
$87.4$92.7
$98.2$104.3
$110.8
$0
$20
$40
$60
$80
$100
$120
2001 2002 2003 2004 2005 2006 2007 2008 2009 2010 2011 2012 2013
$bn
’01–’07 CAGR: 11.4% ’07–’13 CAGR: 6.5%
Federal Student Loan Origination Volume

17
Higher Education Return on Investment
Income and employment are strongly correlated to educational attainment
$0
$20
$40
$60
$80
$100
$120
Less thanH.S.
High School SomeCollege
Associate Bachelor's Master's Doctorate Professional
$000
0%
2%
4%
6%
8%
Earnings Unemployment Rate
Source: U.S. Census Bureau, Current Population Survey, 2006 Annual Social and Economic Supplement. Represents median earnings for a full time, year-round worker over age 25. Unemployment data as of 2006. Represents unemployment for civilian noninstitutional population over age 25

18
$141,496
$75,198
$28,568
$73,428
PrivateCollege
PublicCollege
PrivateCollege
PublicCollege
Source: College Board. Cost of college includes tuition, fees, room and board, transportation and other expenses for four year degree granting institutions for academic years ended June 30, 1997 and 2007.
(1) FFELP loan limit for four consecutive years of college. Limits increased onJuly 1, 2007 from $17,125 to $19,000 for dependent students.
Private Education Loan Market Growth
Students and parents have increasingly turned to private credit loans to fund the gap between student aid, federal loans and the rising cost of education
Cost of College vs. FFELP Loan LimitsAcademic Years 1997 vs. 2007
FFELP Limit(1)
Federal loan shortfall
AY1997 AY2007
Source: College Board, Trends in Higher Education Series (2007).
Federal loan shortfall
Private Education Loan MarketGrowth in Non-Federal Student Loan Originations
$4.5$5.6
$7.6
$10.1
$13.8
$17.0$18.5
$0
$2
$4
$6
$8
$10
$12
$14
$16
$18
$20
2001 2002 2003 2004 2005 2006 2007
$bn

19
Liquidity and Capital Markets Access

20
Liquidity
• At December 31, 2007, SLM maintained a primary liquidity position of $26.7B
Sources of Primary Liquidity: Dec 31, 2007
$6.5B CP and Bank Lines 6.5B
Stand-by Liquidity:
Unrestricted Cash & Investments $10.3B
$6.0B Asset-Backed CP Program 5.9B
$30.0B Interim Asset-Backed CP Program (1) 4.0B
Total Sources of Primary Liquidity $26.7B
Unencumbered FFELP Loans 18.7B
Total Primary and Stand-by Liquidity $45.4B
(1) $30.0 billion Interim ABCP facility effectively terminates on April 24, 2008, with new borrowings unavailable after February 15, 2008, unless extended.

21
2008 Funding Plan
• Close new, 364-day ABCP conduit facilities to replace the Company’s existing ABCP conduit facilities
• $25B(+) of term FFELP ABS issuance
• $3B(+) of Private Credit Student Loan ABS issuance
• Additional unsecured debt issuance, market conditions permitting
Funding Plan –

22
Federal Student Loan Legislation

23
College Cost Reduction and Access Act
• Reduced lender yields on Stafford and Consolidation loans in repayment to CP+1.79% and CP+ 2.09% (CP+1.94% and CP+2.24% for not-for-profit lenders)
• Reduced lender yields on PLUS loans to CP+1.79% (CP+1.94% for not-for-profit lenders)
• The new legislation also –
– Eliminated the Exceptional Performer designation, effectively reducing the guarantee level for former EPs such as SLM from 99% to 97% (1)
– Increased origination fees paid by lenders from 0.5% to 1.0%
– Reduced default collections retained by guaranty agencies from 23% to 16%
– Required ED to develop a pilot auction program for Parent PLUS loans
– Provided loan forgiveness after 120 monthly payments to FDLP borrowers engaged in selected public service occupations
For federal student loans disbursed after October 1, 2007, the new legislation…
(1) Depending on the date of disbursement

24
FFELP Spread Pro Forma Table
Stafford Loan in Repay Pre-10/1
Stafford Loan in Repay Post-10/1
Repay SAP Spread 2.34% 1.79%Funding Costs 0.55% 0.55%Lender Origination Fees 0.10% 0.20%
Borrower Benefits Up-front Fees (2.00% - AY08-09) 0.40% 0.40% Repayment Benefits 0.09% 0.09% Total Borrower Benefit Costs 0.49% 0.49%
Net Loan Spread 1.20% 0.55%
Risk Sharing 0.02% 0.06%Origination and Servicing Costs 0.41% 0.41%
Pre-tax Yield 0.77% 0.08%

25
Industry Impact
Outlook -
• New CCRA economics expected to cause many industry participants to exit, both large and small
• Major student lenders have cut borrower benefits to varying degrees
• SLM ultimately expects to gain FFELP market share as players exit and pricing rationalizes

26
SLM’s ABS Program

27
SLM ABS Issue Characteristics
• U.S. Government guaranteed collateral (1)
• Historical Issue size of $1.5B to $5.0(+)B
• Tranches denominated in US$ or Euros
• ‘Aaa/AAA/AAA’ rated senior tranches make up 97% of issue structure
• 20% risk based capital weighting on senior securities in most countries
• Floating rate tied to 3 mo. LIBOR, with occasional fixed rate issuance
• Amortizing tranches, with 1 to 15(+) year average lives
• Serviced by Sallie Mae, Inc.
(1) (1) Principal and accrued interest on underlying FFELP loan collateral carry a guarantee of either 98% or 97%. Guarantee is dependent on meeting the servicing requirements of the U.S. Department of Education.
Typical SLM FFELP ABS Transaction FeaturesTypical SLM FFELP ABS Transaction Features Typical SLM Private Credit ABS Transaction FeaturesTypical SLM Private Credit ABS Transaction Features
• Historical Issue size of $1.0B to $2.5(+)B
• US$ denominated
• Student loan collateral not guaranteed by the U.S. Government
• ‘Aaa/AAA/AAA’ rated class A senior tranches, ‘Aa2/AA-/AA’ rated Class B and ‘A2/A/A’ rated class C subordinate tranches
• Floating rate tied to 3 mo. LIBOR
• Typically amortizing tranches, with 1 to 15 year average lives
• Serviced by Sallie Mae, Inc.

28
Unique Characteristics of FFELP Loan ABS
FFELP Student Loan ABS is Unique -
• Explicit U.S. government guarantee of underlying collateral
• Formerly 20% risk-weighted, now <10% risk-weighted under Basel II’s IRB methodology
• Eligible as collateral at the Fed discount window

29
SLM ABS Issuance Volume and Portfolio
1 Excludes outstandings under SLM’s asset-backed commercial paper program. Totals may not add due to rounding2 Outstandings for total managed portfolio, after deducting loan loss allowance and unamortized discount3 Based on pricing date
• SLM is the largest issuer of FFELP and private education loan ABS, and issued$26.3B of student loan ABS in 2007
Issuance ($billion) 1Issuance ($billion) 1
Managed Portfolio ($billion) 2Managed Portfolio ($billion) 2
2004 2005 2006 2007
FFELP Stafford/PLUS $10.1 $6.6 $5.1 $9.1
FFELP Consolidation 17.4 17.1 22.9 15.0
Private Credit 2.8 3.4 5.7 2.2
Total ABS Issuance $30.3 $27.0 $33.7 $26.3
2004 2005 2006 2007
FFELP Stafford/PLUS $46.8 $40.7 $39.9 $45.2
FFELP Consolidation 49.2 65.4 79.6 90.1
Private Credit 11.5 16.4 22.6 28.3
Total Portfolio $107.4 $122.5 $142.1 $163.6

30
SLM 2007 Total Managed ABS Issuance by Currency, Investor Geography and Issue Type
• SLM’s ABS investor base is diversified and global
ABS Funding Diversity
USD 97%
Euro3%
Private Credit
8%
Stafford/Plus34%
FFELP Consolid-
ation58%
Other3%
Asia2%
Europe41%
US54%
ByCurrency
By InvestorGeography
By Issue Type
Note: Estimates based on information provided by various investment dealers. Totals may not add due to rounding.

31
SLM ABS Structures
1 Estimated based on a variety of assumptions concerning loan repayment behavior, as more fully described in the related prospectus, which may be obtained at http://www2.salliemae.com/investors/debtasset/slmsltrusts/. Actual average life may vary significantly from estimates.
2 ARS denotes Auction Rate Security
Recent SLM New Issue ABS StructuresRecent SLM New Issue ABS Structures
Issue:Pricing Date:Collateral:
Initial Pricing CPR1:
Amt AL1 Pricing Amt AL1 Pricing Amt AL1 PricingTranching: A1 Aaa $371 1.0 L+25 A1 Aaa $259 2.0 L+23 A1 Aaa $626 3 L+3
A2 Aaa $517 3.0 L+35 A2 Aaa $234 5.0 L+33 A2 Aaa $566 6.8 L+12A3 Aaa $190 5.0 L+50 A3 Aaa $135 7.0 L+38 A3 Aaa $219 10 L+17A4 Aaa $410 7.4 L+65 A4 Aaa $430 10.0 L+47 A4 Aaa $654 14 L+24B Aa1 $46 8.5 L+115 A5 Aaa $453 16.0 L+55 B Aa2 $73 10.9 L+30
B1 Aa1 $47 12.6 L+100 C-1 A2 $35 9.7 L+43C-2 A2 $66 9.7 ARS2
Non-Consolidation FFELP Consolidation FFELP Private Education Loans$1.5B SLM Trust 2008-1 $1.6B SLM Trust 2007-8 $2.2B SLM Trust 2007-A
January 10, 2008 November 30, 2008 March 22, 2007US Govt. Guaranteed FFELP Stafford and
Plus LoansUS Govt. Guaranteed FFELP
Consolidation LoansNon-Guaranteed Private Education
Loans
12% CLR Ramp (0%-8%) over 10 years 6%
Moody's Moody's Moody's

32
Note: Totals may not add due to rounding.Source: Credit Suisse
2007 ABS Issuer Rankings
RANK ISSUER PROCEEDSMARKET SHARE RANK ISSUER PROCEEDS
MARKET SHARE
1 Citigroup $39.5 7% 1 SLM Corp $26.3 49%2 General Motors $32.7 6% 2 First Marblehead $5.2 10%3 SLM Corp $26.3 4% 3 Nelnet $3.9 7%4 JPMorgan $25.7 4% 4 Student Loan Corp $3.1 6%5 Countrywide $25.4 4% 5 College Loan Corp $3.0 6%6 Morgan Stanley $22.7 4% 6 CIT $3.0 6%7 Bank of America $21.1 4% 7 EdSouth $1.6 3%8 Lehman $17.8 3% 8 GCO $1.5 3%9 Merrill Lynch $16.7 3% 9 ALG $1.3 2%10 Santander $12.8 2% 10 Chase Education $1.2 2%
Top 10 Total $240.7 41% Top 10 Total $50.3 94%
ABS Industry Total $590.7 100% Student Loan ABS Total $53.3 100%
2007 US$ ABS Issuance by Issuer 2007 Student Loan ABS by Issuer(in equivalent US$ billions) (in equivalent US$ billions)

33
Private Credit Student Loan ABS Program

34
Sallie Mae’s Private Credit Student Loan Program
(1) With a Co-Signer, maximum aggregate loan indebtedness is permitted to be up to the cost of education less any other aid.(2) Minimum FICO score for the standard program. Prior to July 1, 2001, minimum FICO score for Sallie Mae branded loans was 630. Custom programs have been negotiated with
certain schools in which the FICO cut-off may be lower. In certain cases there is school recourse for these loans. Loans originated by Sallie Mae prior to the initiation of FICO-based underwriting standards in May 1998 represent < 1% of the pool outstandings.
(3) Pursuant to its agreement with the American Association of Medical Colleges, Sallie Mae underwrites certain Medical loans on a judgmental basis, without reliance on the FICO score of the borrower.
Current Private Credit Loan Program Criteria
Loan Programs Description
Maximum Aggregate Loan Indebtedness
Without Co-Signer(1)
Current Minimum FICO Score(2)
Undergrad and Graduate Undergraduate students $100,000 640
Graduate students $150,000 640
LAW Law school and graduates
studying for the bar $150,000 640
MBA Graduate business school $175,000 640
MEDLOANS Medical students and graduates in residency $250,000 N/A(3)
Private Credit Consolidation Undergraduate and
graduate students who have graduated
$275,000 640
Direct-to-Consumer – Tuition Answer
Undergraduate and graduate students $130,000 640

35
SLM Private Credit Cumulative ABS Issuance(1)
SLM Managed Private Credit Loans Outstanding(1)
(1) Gross outstandings for total managed portfolio, before deducting loan loss allowance and unamortized discount.
SLM Private Credit Student Loan ABS Issuance
$30.4
$4.4 $6.6$8.7
$12.1
$17.2
$23.7
$0.0
$5.0
$10.0
$15.0
$20.0
$25.0
$30.0
$35.0
2001 2002 2003 2004 2005 2006 2007
$ B
illio
ns
Higher Education Career Training
$18.6
$0.7
$4.5
$7.3
$10.7
$16.4
$0.0$2.0$4.0$6.0$8.0
$10.0$12.0$14.0$16.0$18.0$20.0
2001 2002 2003 2004 2005 2006 2007$
Bill
ions
• SLM issued $2.2B of private credit loan ABS during 2007, bringing total issuance to date to $19B

36
SLM Private Credit ABS Relative Value
Historical 3 Year Triple-A Rated ABS Secondary Spreads
-3-2-10123456789
101112
Mar
-03
Jun-
03Se
p-03
Dec
-03
Mar
-04
Jun-
04Se
p-04
Dec
-04
Mar
-05
Jun-
05Se
p-05
Dec
-05
Mar
-06
Jun-
06Se
p-06
Dec
-06
Mar
-07
Jun-
07
Spre
ad (b
ps)
Private Cards
Historical 7 Year Triple-A Rated ABS Secondary Spreads
05
101520253035404550
Mar
-03
Jun-
03Se
p-03
Dec
-03
Mar
-04
Jun-
04Se
p-04
Dec
-04
Mar
-05
Jun-
05Se
p-05
Dec
-05
Mar
-06
Jun-
06Se
p-06
Dec
-06
Mar
-07
Jun-
07
Spre
ad (b
ps)
Private Cards
• Prior to the ABS market disruption, spreads on SLM Private Credit ABS were trading somewhat wider than comparable credit card ABS
Source: Merrill Lynch Research.

37
Upgrades of SLM Private Credit Student Loan ABS
Due to better-than-anticipated performance of the underlying collateral…
• In September 2007, Fitch upgraded the ratings of subordinate tranches of SLM’s 2002-A Private Credit ABS issue to ‘AA+’ and ‘A+’ from their original ratings of ‘A’ and ‘BBB’
• At the same time, Fitch upgraded the ratings of all of the subordinate tranches of SLM Private Credit ABS issues 2003-A thru 2004-B to ‘AA’ and ‘A’ from their original ratings of ‘A+’ and ‘BBB+’
• Beginning in 2006, S&P began upgrading the ratings on the two subordinate tranches of SLM’s new issue Private Credit ABS from ‘A’ and ‘BBB’, ultimately to the ‘AA’ and ‘A’ ratings assigned the subordinate tranches of SLM’s 2007-A Private Credit ABS

38
Historical Static Pool PerformanceSLM Private Credit ABS Trusts thru November 2007

39
SLM Private Credit ABS Trusts61- 90 and 90+ Day Delinquent Loans
61-90 Day Delinquencies
90+ Day Delinquencies
0.00%
0.50%
1.00%
1.50%
2.00%
2.50%
3.00%
3.50%
4.00%
4.50%
5.00%
Feb-03 M ay-03 Aug-03 Nov-03 Feb-04 M ay-04 Aug-04 Nov-04 Feb-05 M ay-05 Aug-05 Nov-05 Feb-06 M ay-06 Aug-06 Nov-06 Feb-07 M ay-07 Aug-07 Nov-07
% o
f Rep
aym
ent Bal
ance
2002-A 2003-A 2003-B 2003-C 2004-A 2004-B 2005-A 2005-B 2006-A 2006-B 2006-C 2007-A
0.00%
0.50%
1.00%
1.50%
2.00%
2.50%
3.00%
3.50%
4.00%
4.50%
5.00%
Feb-03 May-03 Aug-03 Nov-03 Feb-04 May-04 Aug-04 Nov-04 Feb-05 May-05 Aug-05 Nov-05 Feb-06 May-06 Aug-06 Nov-06 Feb-07 May-07 Aug-07 Nov-07
% o
f Rep
aym
ent
Bal
ance
2002-A 2003-A 2003-B 2003-C 2004-A 2004-B 2005-A 2005-B 2006-A 2006-B 2006-C 2007-A

40
SLM Private Credit ABS TrustsHistorical Cumulative Gross Charge-Off Experience (1)
(1) For SLM Private Credit Student Loan ABS issued prior to 2005-B, the servicer has the option, but not the obligation, to repurchase loans that become 180+ days delinquent. To date, the servicer has exercised this option and actual charge offs in these Trusts equal zero. Data above represents charge-offs outside these Trusts of 180+ day delinquent loans purchased by the servicer.
Note: Data current as of Nov 30th, 2007.
0.00%
1.00%
2.00%
3.00%
4.00%
5.00%
6.00%
7.00%
8.00%
9.00%
10.00%
Feb-03
May-03
Aug-03
Nov-03
Feb-04
May-04
Aug-04
Nov-04
Feb-05
May-05
Aug-05
Nov-05
Feb-06
May-06
Aug-06
Nov-06
Feb-07
May-07
Aug-07
Nov-07
Cum
ulat
ive
Cha
rge-
offs
as
a %
of O
rigi
nal P
ool B
alan
ce
2002-A 2003-A 2003-B 2003-C 2004-A 2004-B 2005-A 2005-B 2006-A 2006-B 2006-C 2007-A

41
SLM Private Credit ABS Prepayment Analysis
0.0%
1.0%
2.0%
3.0%
4.0%
5.0%
6.0%
7.0%
1 2 3 4 5 6 7 8 9 10 11 12 13 14 15 16 17 18 19 20 21
Quarters from Pricing
Hist
oric
al L
ife to
Dat
e C
PR
2002-A 2003-A 2003-B 2003-C 2004-A 2004-B 2005-A 2005-B 2006-A 2006-B 2006-C 2007-A
Historical SLM Private Credit ABS CPRs

42
SLM 2007-A Private Credit Student Loan ABS

43
ClassPrincipal
Balance ($)Principal
Balance (%)Expected
Ratings (M/S/F) Index
WA Lifeto Call
(6%CPR)(1)Expected Maturity
PrincipalWindow
Legal FinalMaturity
A-1 627,000,000$ 28.00% Aaa/AAA/AAA 3mL 3.00 12/15/2011 6/07-12/11 9/15/2022A-2 564,000,000$ 25.19% Aaa/AAA/AAA 3mL 6.75 3/15/2016 12/11-3/16 9/15/2025A-3 221,000,000$ 9.87% Aaa/AAA/AAA 3mL 10.00 3/15/2018 3/16-3/18 12/15/2026A-4 652,891,000$ 29.16% Aaa/AAA/AAA 3mL 14.01 3/15/2023 3/18-3/23 12/16/2041B 73,142,000$ 3.27% Aa2/AA/AA 3mL 10.93 3/15/2022 3/13-3/22 12/16/2041
C-1 35,273,000$ 1.58% A2/A/A 3mL 9.73 12/15/2020 6/13-12/20 12/16/2041C-2 66,000,000$ 2.95% A2/A/A Auction 9.73 12/15/2020 6/13-12/20 12/16/2041
Total 2,239,306,000$ 100.0% 8.41
SLM Private Credit Student Loan Trust 2007-A
The structure of SLM 2007-A is similar to prior Sallie Mae Private Credit ABS issues
(1) Estimated based on a variety of assumptions concerning loan repayment behavior. Actual average life and repayment characteristics may vary significantly from estimates.(2) Approximate percent of Initial Asset Balance plus reserve account. (3) Approximate percent of Current Asset Balance.(4) Approximate percent of Initial Asset Balance.
Credit Enhancement Initial(2) Target(3) Components of SubordinationClass A 8.50% 15.00% Class B, Class C, O/CClass B 5.25% 10.125% Class C, O/CClass C 0.75% 3.00% O/C
Overcollateralization (O/C) Builds from 0.50% to 2.00% of Initial Asset Balance
Reserve Account 0.25% of Initial Pool Balance (non-declining)
Other Enhancement Prime/LIBOR Swap (15-year)11.2% Cash Capitalization Account for liquidity (steps down over time)(4)

44
SLM 2007-A Initial Summary Pool Characteristics
Loan Programs % Co-Borrower as Obligor Borrower Payment Status
Pool Weighted Original Average FICO Score 718
Pool Weighted Current Average FICO Score 710
Average Borrower Indebtedness $13,020
Weighted Average Remaining Term 214 months
Co-Borrower
58.1%
No Co-Borrower
41.9%
MBA Loans0.8%
Law Loans3.5%
Consolidation Loans9.8%
Direct-to-Consumer
9.4%
Medical Loans1.4%
Undergraduate /Graduate
75.2%
In School71.1% Deferment
1.1%
Grace8.0%
Repayment17.3%
Forbearance2.4%

45
SLM 2007-A FICO Distribution at Loan Origination(1)
(1) If there is a co-borrower, FICO score represents higher of borrower and co-borrower score.(2) Loans with FICO scores greater than zero and less than 630 is less than 0.2% of the portfolio.(3) Approximately 0.5% of the trust consists of student loans where no FICO scores were currently available or which were underwritten
without relying upon FICO scores.
6.3%
8.8%10.2%10.6%
11.0%12.1%12.3%
14.4%
11.4%
2.3%
0.2%0%
2%
4%
6%
8%
10%
12%
14%
16%
<630 630-639 640-659 660-679 680-699 700-719 720-739 740-759 760-779 780-799 800+
% o
f Poo
l
FICO Score at Origination
(2)
(3)

46
Additional Information

47
Explicit Federal Guarantee
• Excerpt from the High Education Act – 20 U.S.C. 1082(0). “Consequences of guaranty agency insolvency. In the event that the Secretary has determined that a guaranty agency is unable to meet its insurance obligations under this part, the holder of loans insured by the guaranty agency may submit insurance claims directly to the Secretary and the Secretary shall pay to the holder the full insurance obligation of the guaranty agency, in accordance with Insurance requirements no more stringent than those of the guaranty agency. Such arrangements shall continue until the Secretary is satisfied that the insurance obligations have been transferred to another guarantor who can meet those obligations or a successor will assume the outstanding insurance obligations.”
• Excerpt from the Federal Budget – “The higher Education Amendments of 1998 clarified that reserve funds held by public and non-profit guaranty agencies participating in the Federal Family Education Loan (FFEL) program are Federal Property. These reserves are used to pay default claims from FFEL lenders and fees to support agency efforts to avert defaults. The Federal Government reimburses these reserves for default claim payments.”

48
SLM Corporate Debt Ratings
• As of December 31, 2007, SLM Corporation’s senior unsecured credit ratings were as follows:
Short-term unsecured debt………………… A-2(1)
P-2(1)
F3(1)
Long- term senior unsecured debt…………BBB+(1)
Baa1(1)
BBB(1)
S&P Moody’s Fitch
(1) Each of the rating agencies has the Company’s current ratings on review for potential downgrade.

49
2007 Earnings Summary
($ millions) 2007 2006%
Increase
“Core Earnings” Net Income (1) $560 $1,253 - 55%
Stafford/PLUS Originations ($B) $17.6 $16.0 10%
Internal FFELP Consolidations ($B) $8.9 $14.5 - 37%
Managed FFELP Loans Outstanding ($B) $135.3 $119.5 13%
Managed Pvt Ed Loans Outstanding ($B) $28.3 $22.6 25%
Mgd Pvt Ed Loan % of Total Mgd Student Loans 17% 16% --
“Core Earnings” Loan Loss Provision $1,394 $303 --
“Core Earnings” Fee and Other Income $1,173 $1,100 7%
Tangible Capital Ratio 2.01% 1.84% --
(1) GAAP Net Loss for 2007 was $896 million compared to GAAP Net Income of $1,157 in 2007.(2)) “Core Earnings” 2007 Net Student Loan Spread is before the impact of Interim ABCP Facility Fees and the effect of Wholesale Consolidation Loans.
“Core Earnings” Operating Expenses $1,440 $1,253 15%
Stockholders’ Equity (GAAP) $5,224 $4,360 20%
Private Education Loan Originations ($B) $7.9 $7.4 7%
Managed Student Loan Portfolio ($B) $163.6 $142.1 15%
“Core Earnings” Private Loan NCOs as a % of Repayment
3.07% 1.62% --
“Core Earnings” Net Student Loan Spread (2) 1.77% 1.84% --

50
“Core Earnings” Presentation
• Used by SLM’s management in developing financial plans, tracking results, establishing corporate performance targets and determining incentive compensation
• Used by equity investors, credit rating agencies and debt capital providers to measure the company’s business performance
• Treat securitizations as long-term financings and recognize the economic effect of hedges; specifically exclude (i) gains on sales from securitizations and subsequent Retained Interest revenue (ii) derivative unrealized mark-to-market adjustments, (iii) unhedged floor income, and (iv) goodwill and intangible impairment and the amortization of acquired intangibles
• Reflect only current period adjustments to GAAP earnings and are not a substitute for reported results under GAAP
• May not be comparable to similarly titled measures reported by other companies
Note: Both a description of SLM’s "Core Earnings" treatment and a full reconciliation to the GAAP income statement is contained in the supplemental earnings disclosure to the company’s quarterly earnings releases and most recent Form 10-Q.
“Core Earnings” Performance Measures –

51
GAAP to Core Earnings EPS Reconciliation
Dollars Diluted EPS
GAAP Net Loss (896,394)$ (2.26)$
Adjustment from GAAP to "Core Earnings" Net impact of securitization accounting (246,817) Net impact of derivative accounting 1,340,792 Net impact of Floor Income 168,501 Net impact of acquired intangibles 112,397 Total "Core Earnings" adjustments before income taxesand minority interest in net earnings ofsubsidiaries 1,374,873
Net tax effect 81,845 Total "Core Earnings" adjustments 1,456,718 "Core Earnings" net income 560,324 1.23$
"Core Earning" net income adjusted for non-recurring itemsCosts related to the recent legislative changes in the FFELP Risk Sharing percentage 27,726 0.07$ Costs associated with the Company's previously announced Merger 74,364 0.17$ Costs related to severance compensation 14,178 0.03$ Total after-tax non-recurring items 116,268 0.27$
"Core Earnings" net income adjusted for non-recurring items 676,592$ 1.50$
(In thousands, except per share amounts)

52
Additional Information Available at www.salliemae.com

53
Debt Investor Relations Contact Information
Guido van der VenSenior Vice President, Corporate FinanceSallie Mae, Inc.36 Leitch AvenueSkaneateles, NY [email protected]
Leo SublerVice President, Corporate FinanceSallie Mae, Inc.12061 Bluemont WayReston, VA [email protected]