sloan wp # 4018 april, 1998 - massachusetts institute of...
TRANSCRIPT

On the Connections Among Activity-BasedCosting, Mathematical Programming
Models for Analyzing Strategic Decisions,And the Resource Based View of the Firm
Jeremy F. ShapiroSloan School of Management
Massachusetts Institute of Technology
Sloan WP # 4018 April, 1998
© Copyright 1998, Jeremy F. Shapiro

ON THE CONNECTIONS AMONGACTIVITY-BASED COSTING,
MATHEMATICAL PROGRAMMING MODELSFOR ANALYZING STRATEGIC DECISIONS,
AND THE RESOURCE-BASED VIEW OF THE FIRM*
Jeremy F. ShapiroDecember, 1997
Abstract
This paper examines connections between data-driven models for analyzing a firm'sstrategic plans, which use activity-based costing and mathematical programming, and theresource-based view of the firm. After brief reviews of the three disciplines, extensions ofactivity-based costing methods to mathematical programming models for strategicresource planning are discussed. Applications of these models to supply chain planning ina multi-national food manufacturer, a specialty chemicals company, and awholesaling/retailing company are presented. The paper concludes by using conceptsfrom the resource-based view of the firm to interpret optimal solutions from mathematicalprogramming models. Extensions to strategic planning under uncertainty using stochasticprogramming are also discussed briefly.
Keywords: Strategic planning, activity-based costing, mathematical programming,resource-based view of the firm.
*To appear in the Special Issue of European Journal of Operational Research on"Competitive Analysis and Strategy"
© Copyright, Jeremy F. Shapiro, 1998

ON THE CONNECTIONS AMONGACTIVITY-BASED COSTING,
MATHEMATICAL PROGRAMMING MODELSFOR ANALYZING STRATEGIC DECISIONS,
AND THE RESOURCE-BASED VIEW OF THE FIRM
Jeremy F. ShapiroDecember, 1997
1. Introduction
The purpose of this paper is to discuss connections among three disciplinesconcerned with strategic resource planning in the firm, activity-based costing (ABC)(Tumey, 1992, Atkinson et al, 1997), mathematical programming (MP) (Schrage,1991, Winston, 1995), and the resource-based view of the firm (RBV) (Mahoney andPandian, 1992, Peteraf, 1993). Judging from the literature, these disciplines do notoverlap. Nevertheless, we believe there are important synergies worth exploring. ABCand MP are approaches for creating data-driven models to analyze decisions aboutacquiring, adjusting, allocating and divesting the firm's resources. RBV is an abstractdiscipline for studying how the firm can create and maintain resources that will provide itwith a sustained competitive advantage. In particular, RBV suggests that firms realizingsuperior profits possess and exploit heterogeneous resources, which cannot be imitatedor transferred, and for which there are no substitutes.
We shall argue that ABC analysis of the firm's general ledger defines resourcesthat the firm uses to compete in its markets, and their costs. To optimize its resourcedecisions, this information must be imbedded in an MP model for evaluating the firm'sstrategic options. The MP model also serves as a template for cost and resource data tobe extracted by ABC methods. Moreover, economic interpretation of an optimal solutionto the MP model provides insights about the firm's heterogeneous resources. Conversely,RBV concepts, when translated into model constructs, can help the practitioner to expandthe scope of the MP model.
An underlying theme of this paper is to call attention to the tension that existsbetween data-driven models based on ABC and MP, which tend to be cautious andlimited in scope, and abstract theories of competition based on RBV, which tend to beaudacious and vast in scope. Modeling practitioners and managers for whom models aredeveloped can benefit by challenging themselves to devise quantitative descriptionsactualizing abstract concepts about strategy and incorporating these descriptions in data-driven models. Conversely, the theorist of corporate strategy can profit from "realitychecks" that such models can provide, and by refinements and extensions to the theorythat will undoubtedly result.
1

In order to focus our discussion, we will restrict ourselves to strategic issuesarising in supply chain management. A company's supply chain is comprised ofgeographically distributed facilities such as plants, distribution centers, supplierwarehouses, or retail outlets, and transportation links carrying products betweenfacilities. The facilities may include physical entities operated by the company'ssuppliers and the company's customers as well as those operated by the company itself.
Thus, we will limit our attention to firms that manufacture and/or distributephysical products. The ideas presented below are also applicable to service companies.Indeed, a large and increasing proportion of the total activity within a manufacturing ordistribution company is concerned with servicing external and internal customers.
In the next section, we address a taxonomy of resources pertinent to strategicplanning. In the three sections after that, we review concepts from ABC, MP modelingand RBV that are appropriate to synthesizing the three disciplines. In the followingsection, we discuss extensions of ABC to MP models. Applications of ABC and MP inthree specific firms are reviewed in the section after that. Then, we discuss connectionsbetween data driven models based on ABC and MP and RBV. The final section of thepaper is devoted mainly to areas of future research.
2. Taxonomy of Resources
In reviewing a firm's resource profile, Barney, 1991 and Mahoney and Pandian,1992, suggest several categories, which we adapt here as:
1. Physical resources (e.g., plants, distribution centers, inventories)2. Human resources (e.g., machine operators, production managers, scientists)3. Financial resources (e.g., cash flow, debt capacity, equity availability)4. Information technology resources (e.g., inventory management system,
communication network, supply chain modeling system)5. Marketing resources (e.g., market share, brand recognition, goodwill)6. Organizational resources (e.g., training systems, corporate culture, supplier
relationships)7. Legal resources (e.g., patents, copyrights, contracts)
Except for legal resources, these categories underlie much of the RBV literature, includingbooks and papers written before the discipline was founded.
Clearly, some resources, such as plants, machine operators, or cash flow, aretangible and possess measurable characteristics. Other resources, such as scientists orcorporate culture, are intangible with characteristics that are difficult to measure, at leastdirectly. A challenge for the modeling practitioner is to devise descriptive approaches formeasuring the impact of intangible resources on the firm's strategy. For example, theconstruction of a decision tree describing an R&D scientist's assessment of the likelyoutcomes of his/her research.
2

Understanding and evaluating the role of information technology (IT) resources incorporate strategy formation has proven difficult and ambiguous (see Powell and Dent-Micallef, 1997, 376 - 378, for a literature review). Recent analysis using RBV principles,however, suggests that IT resources are necessary, but not sufficient, elements of a firm'scompetitive advantage (Kettinger et al, 1994, Mata, Fuerst and Barney, 1995, Powell andDent-Micallef, 1997). IT resources are different than other types of resources becausethey serve only to manage other resources and have no intrinsic value per se.
The RBV literature has apparently ignored legal resources as a distinct category.We included it in the above list because the existence of patents or contracts protectingthe firm's valuable resources can have a large impact on its competitive position,especially in an era of rapid technological change. The value of these legal resources maybe an explanation, if not a justification, of the litigious nature of doing business in recentyears in the United States.
3. Activity-Based Costing
The information revolution has facilitated advances in management accounting,which is defined by Atkinson et al, 1997, 3, as "the process of identifying, measuring,reporting, and analyzing information about the economic events of the (firm)" for thepurposes of internal planning and control. Its focus is significantly different thanfinancial accounting, which is concerned with reporting historical results to externalaudiences. ABC is a new approach of management accounting for determining accurateproduct and customer costs.
ABC methodology is comprised of three stages as shown in Figure 1 (Cooper andKaplan, 1991, Tumey, 1992). For the sake of simplicity, we assume ABC is being carriedout for a single facility in the company's supply chain. Moreover, we assume theplanning horizon is one year. Similar analyses can be carried out for other companyactivities such as marketing and sales, or customer service (Atkinson et al, 1997).
In the first stage, detailed indirect costs in the general ledger, or in next year'sbudget, are aggregated into homogeneous pools of indirect costs, such as supervisorylabor or utility costs. Direct costs from the general ledger or budget are aggregated directlyinto activity cost pools without this intermediate step. Although the indirect cost poolsare called resources by ABC practitioners, they are not the resources we seek to definefor our MP models and RBV analysis. Instead, as we discuss in Section 6, such resourcesare derived from the second and third stages of ABC analysis, which consist of anallocation of the indirect cost pools to activity cost pools, otherwise called activities, andan attribution of these activities to cost objects (e.g., product and customer costs). Thethird stage mapping is carried out by cost drivers that determine how the variousactivities contribute to the total cost of the cost objects. Table 1 lists typical activitiesand activity cost drivers in a manufacturing plant. See Ellram et al, 1994, for similaranalysis at a distribution center.
3

4

0~,c,)
o'4-'
4-'
ci
ci) ci -DCdb0 ~-~
0
00O
*-©
vP
5
4-'
O~a)0 .I .. Cu au)

Most of the cost drivers in Table 1 are directly related to volume (productionhours), but the cost driver for production scheduling depends on the number of batches tobe scheduled over the planning horizon. An important principle of ABC is that the costdriver for an activity including its unit of measure be selected to reflect the underlyingnature of the activity. Moreover, ABC distinguishes between indirect costs related toproducts and those related to the facility as a whole. Thus, a complete categorization ofactivities and their cost drivers entails four levels: Unit-related activities, batch-relatedactivities, product-sustaining activities, and facility-sustaining activities (Cooper andKaplan, 1991). As we shall see, this categorization is similar to the categorization used inMP supply chain models.
ActivityDirect Labor:
CastingMachiningAssemblyPacking
Direct materials:CastingAssemblyPacking
Supervision:CastingMachiningAssemblyPacking
Depreciation:CastingMachiningAssemblyPacking
Machine maintenanceMachine setupProduction schedulingProduction engineeringEnergyGeneral and administrative
Cost Drivers
Direct labor hoursDirect labor hoursDirect labor hoursDirect labor hours
PoundsUnitsUnits
Casting setup hoursMachining setup hoursAssembly setup hoursPacking setup hours
Machine hoursMachine hoursMachine hoursMachine hoursTotal machine hoursTotal setup hoursNumber of batchesEngineering change ordersTotal machine hoursTotal machine hours
Activities and Cost DriversMedical Equipment Manufacturing Plant
Table 1
Source: Atkinson et al., 1997, 265
For the purpose of optimizing strategic supply chain decisions, extrapolation ofhistorical cost figures requires the development of cost relationships describing how
6

costs will vary as a function of the cost drivers. Since ABC often represents costs aslinear functions of the cost drivers, additional analysis is needed to estimate costrelationships that are non-linear with discontinuities. Such relationships characterizecomplex manufacturing and distribution operations.
4. Mathematical Programming Models
In this paper, we address three types of MP models that provide formal systemsfor analyzing managerial decisions:
* linear programming models, which identify efficient resource allocation schemes;
mixed integer programming models, which extend linear programming models tocapture fixed (lumpy) investment and resource costs, locational decisions,economies of scale and non-numeric policy constraints; and
stochastic programming models, which extend both linear and mixed integerprogramming in explicitly addressing uncertainties associated with the future toidentify optimal contingency plans and hedging strategies for the firm (e.g., seeBienstock and Shapiro, 1988, Birge and Louveaux, 1997).
Linear programming is the cornerstone of mathematical programming because linearprogramming models can be easily optimized and because linear programmingapproximations are used to optimize more complex models. Economic interpretations oflinear programming also provide qualitative insights into resource allocation processes inthe firm that are relevant to RBV.
The premises underlying linear programming models, such as assumptions that allcost and resource utilization relationships are linear and infinitely divisible, are toosimplistic. Mixed integer programming extensions provide a much more realisticdescription of supply chain management problems. Such models use zero-one integervariables to describe more accurate cost and resource relationships, and to capturelocational decisions. A typical supply chain network optimization model is depicted inFigure 2. The squares represent facility sub-models based on ABC and mixed integerprogramming that we will discuss in Section 6.
The added realism of mixed integer programming is achieved at a cost because suchmodels must be optimized as a series of linear programming approximations. Despitetheir computational complexity, mixed integer programming models are a practical andpowerful method for evaluating supply chains (e.g., see Shapiro, Singhal and Wagner,1993, Arntzen et al, 1995). Comprehensive mixed integer programming models can berapidly and reliably optimized on today's platforms.
7

Suppliers
Stochastic programming models combine probabilistic decision trees with linearand mixed integer programming models in creating an approach that explicitly evaluatesresource planning in the face of uncertainty. They offer an enticing paradigm for strategyanalysis in the firm that is beyond, but not too far beyond, the state-of-the-art of MPmodeling. Our aim in discussing them here is to promote their application and to relatethem to RBV.
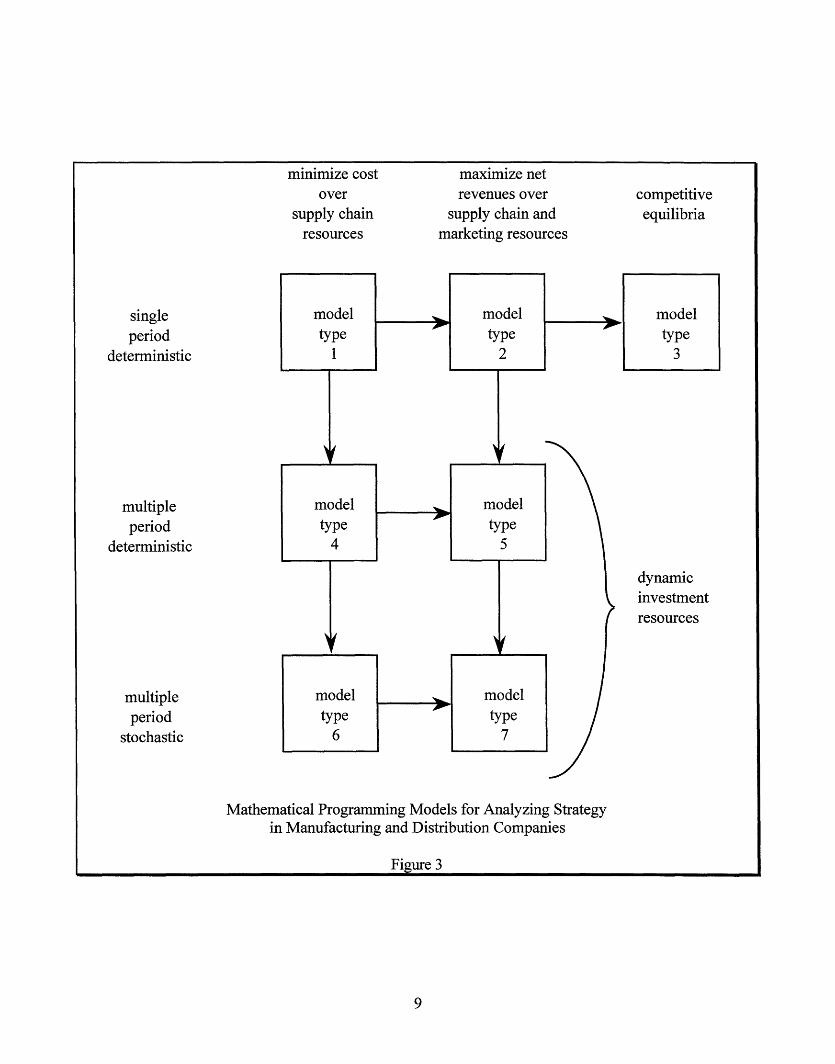
Figure 3 depicts extensions of current MP models to strategic decision-making inmanufacturing and distribution companies. The state-of-the-art is represented by modeltype 1 (single-period, deterministic minimization of the total supply chain cost ofmeeting given demand) depicted in Figure 2. The arrows in the diagram reflect naturalextensions of the models of a given type to those that are more ambitious.
For example, the immediate extensions of model type 1 to model type 2 representmanagement's interest in varying product mix, probably in a cautious manner, to themaximization of net revenues. By cautious, we mean the model allows small deviations inproduct mix that involve little or no change in unit price. An example of such an analysisapplied at International Paper is given in IBM Application Brief, 1981. Alternatively,extensions of model type 1 to model type 4 represent management's interest in the timingand phasing of capital investments in supply chain resources over multiple time periods,while still minimizing the total discounted costs of managing the supply chain (Goreuxand Manne, 1973).
8
Plants
DistributionCenters
Markets
Supply Chain Network Optimization Model - Snapshot ViewFigure 2
minimize costover
supply chainresources
maximize netrevenues over
supply chain andmarketing resources
competitiveequilibria
singleperiod
deterministic
multipleperiod
deterministic
multipleperiod
stochastic
Mathematical Programming Models for Analyzing Strategyin Manufacturing and Distribution Companies
Figure 3
9
Extensions of model type 2 to model type 3 are ambitious exercises aimed atidentifying company strategies that maximize net revenue in a competitive environment(Miller, Friesz and Tobin, 1996). MP theory, especially decomposition methods, can beadapted to the computation of such equilibria (Mehring, Sarkar and Shapiro, 1983,Murphy, Sherali and Soyster, 1982), but it has not yet been widely applied.Nevertheless, we report that such analysis was performed by a forest products companyto identify geographical markets where their products are price competitive. Of course,model type 3 could also be extended to multiple period and stochastic versions. We haveomitted such extensions in the Figure since they would be stretching the state-of-the artbeyond the bounds of likely implementation over the foreseeable future.
Extensions of model type 2 or 4 to model type 5 (multiple-period, deterministicmaximization of discounted net revenues) are also ambitious. They require thedevelopment of models relating marketing strategies for new and existing products, whichare multiple-period in nature, and their integration with supply chain models. In otherwords, these models address product mix changes that are more audacious than those ofmodel type 2. Such constructions are discussed from the marketing viewpoint inEliashberg and Steinberg, 1993.
Finally, we consider extensions of the deterministic model types 4 and 5 to thestochastic model types 6 and 7. A cautious approach to effecting the extensions to modeltype is to create a stochastic programming model by merging a small number ofdeterministic models of different scenarios. A willingness to pursue this approach is inthe air. During the past year, we have discussed stochastic programming modelingprojects with analysts in two large firms, one a computer manufacturer, the other apharmaceutical company. In both cases, the firms were seeking production strategies formaking major components of finished products that optimally hedge against uncertaindemand for these products.
5. Resource-based View of the Firm
RBV is a recently articulated theory that is still under development. Its origindates to the seminal paper by Wemerfelt, 1984, although earlier publications anticipatedsome of the later work. Our review is based mainly on Mahoney and Pandian, 1992, andPeteraf, 1993, who provide extensive bibliographies. The connections between RBV andclosely related disciplines, such as organization economics or the theory of industrialorganizations, are well developed by Conner, 1991, and Mahoney and Panadian, 1992.Our particular interest in RBV is due to its explicit treatment of the role of resources instrategy formation.
According to RBV, a firm's sustainable competitive advantage depends heavily onits resources and how they are used. In particular, the theory assumes that superior firmspossess heterogenous resources that differentiate it from other firms and allow it to earnrents; that is, the average and even marginal costs of their products are below, perhaps
10
significantly below, the market prices they receive. The rents may be converted tosustainable profits if forces exist which limit competition for critical resources, once theindustry has recognized their value.
Two factors limiting competition are imperfect imitability and imperfectsubstitutability of heterogenous resources. Such factors exist when there are barriers dueto patents, contracts, learning effects, or market preferences that make imitation andsubstitution by other firms difficult or impossible. Moreover, critical resources of thesuperior firm will be perfectly immobile, which means they are idiosyncratic and haveno use in other firms, or imperfectly mobile, which means they can be traded but havehigher value within the firm. Finally, the theory states that a firm can establishheterogenous new resources only if there are limits to competition prior to efforts on thepart of the firm to create them. Otherwise, the rents that the superior firm can realize willbe dissipated by excessive costs of initial competition.
In reviewing connections between RBV and other research on strategy, Mahoneyand Pandian, 1992, discuss four types of rents accruing to the superior firm. Ownershipof scarce resources such as valuable land, production facilities near markets, or patentslead to Ricardian rents. As the result of collusion or government protection, the firmmay achieve monopoly rents. Firms that undertake risky and entrepreneurial ventures inan environment characterized by significant uncertainty or complexity may realizeSchumpeterian, or entrepreneurial, rents. Firms with idiosyncratic resources that arescarce, but less scarce and less sustainable than Ricardian resources, may receive quasi-rents.
Dierickx and Cool, 1989, address the issue of sustainability, which they suggest islinked to characteristics of the stock asset (heterogeneous resource) accumulation process.They identify six phenomena affecting the efficacy of such processes. Inefficienciesassociated with attempting to too quickly create and exploit heterogeneous resources arecalled time compression diseconomies. The phenomena of"success breeding success"in competitive endeavors leads to asset mass efficiencies; they are akin to barriers toentry for late entrants in a market. When creation of a valuable asset does not necessarilylead to competitive advantage because complementary assets are absent, the firm hasfailed to recognize the interconnectedness of stock assets. A loss of competitiveadvantage through deterioration of heterogeneous resources is called asset erosion.Finally, causal ambiguity refers to the uncertainties and discontinuities associated with asuccessful effort in creating a heterogeneous resource. If the causes of initial success aredifficult to identify, the firm may be hard pressed to sustain the ensuing advantage, or torepeat the success.
The concept of a firm's core competencies is an important idea linked to RBV(Prahalad and Hamel, 1990). Core competencies refer to those heterogeneous resourcesthat provide the superior firm with sustainable competitive advantage. Often, seniormanagers in a firm do not clearly understand the precise nature of its core competencies,how they should be protected, and how new ones should be created. One of theobjectives of this paper is to suggest that research into quantitative methods for
11
identifying and measuring core competencies, based in part on ABC and MP models,should be pursued.
6. Extending ABC to MP Models
ABC has been extolled as a valuable tool for determining product and customercosts, and, in general, for support of managerial decision-making. In fact, it is a descriptiverather than a normative methodology. For example, it cannot address fundamentalquestions such as:
* What are optimal levels of the firm's resources at each of its facilities over mediumand long term planning horizons?
* How should resources be allocated to production activities at each facility so as tominimize total supply chain cost?
* Which products should be manufactured and which production transformationactivities should be employed at each facility to minimize total supply chain cost?
· Which facilities should optimally source each market for each product family?
An MP model is needed to answer these and other questions. Moreover, accurateproduct and customer costs can only be extracted from an optimal solution to the MPmodel. In other words, the logic of Figure 1 needs to be altered by interposing an MPmodel between the Activity Cost Pools and the Cost Objects.
Thus, ABC can and must be extended in natural ways to MP models. Weillustrate this by discussing how to model individual facilities (plants, distributioncenters) in the supply chain network of Figure 2. Similar ABC and MP constructionsmay be developed for other areas of strategic supply chain decision-making, such as long-term supply contracts or the re-location of capital equipment, but space prevents us fromfurther elaboration.
We also discuss how facility sub-models can be linked to strategic investmentdecisions, which we assume for the sake of simplicity are limited for each facility todecisions about whether the facility should be open (built) or closed (not built or shut-down) in the single period considered by the model. The objective function driving theglobal network analysis is to minimize total supply chain investment and operating costsof meeting fixed and given demand. Thus, we consider model type 1 of Figure 3.
Implicit in our construction of an MP model for strategic planning is the need tointegrate details of future facility operations, suitably aggregated, with details describinginvestment costs and constraints. Such integration is critical to studying how investmentswill impact operations. ABC has the responsibility of extrapolating historical costs and
12
cost relationships to ones that are appropriate to the planning horizon of the strategicanalysis.
Optimization of the MP model may suggest new resource acquisition options thatwere previously unrecognized. Such options may include new facilities, newtransformation processes, or expansion of existing resources beyond levels that werepreviously thought to be sufficient. Again, ABC methodologies will be applied to developmuch of the necessary cost data.
The critical step in extending ABC to MP models is the use of ABC in developingforecasts of how costs will vary as functions of the cost drivers. In developing suchfunctions, we distinguish between those for which the cost driver is a resource that maybe scarce and therefore may constrain an optimal strategy, and those for which the costdriver is merely an accounting device and not a resource that will constrain the strategy.We refer to the former functions as cost/resource functions, and to the latter ascost/accounting functions. Resources in the former category will be called sustainingresources while resources in the latter category will be called accounting resources.
Referring to the activities and costs in Table 1, casting depreciation with machinehours as the cost driver and machining supervision with machining setup hours as the costdriver might be sustaining resources. This is because casting machine hours and machiningsupervision are potentially scarce resources that the company may be forced to allocateto production. By contrast, energy with total machine hours as the cost driver andpacking supervision with packing setup hours as the cost driver might be accountingresources. This is because energy and packing supervision are commodities that may beacquired in any quantity at a homogeneous cost.
Figure 4 depicts a typical cost/resource function for a given period of operations(e.g., one year). For example, it might refer to machine hours as a cost driver onequipment used in making several products. In this case, machine hours would be treatedas a process sustaining resource.
The parameters describing the cost/resource function are:
· A fixed cost Fl associated with using the resource at any level;
* A shut-down cost S associated with a zero level of resource utilization;
* A conditional minimum level m of resource utilization above which it must be if it isnot zero;
* A break point of b above which the variable cost measured in dollars per hourdecreases (c2 < c 1);
* A maximal level of resource utilization of M1 possible during the period if additionalresource is not acquired;
13

* A fixed cost F2 associated with acquiring additional resources for use during theperiod;
* A variable cost in dollars per hour of c3 (c3 > c ) for using the new resource up to atotal maximal level of M2 possible during the period.
f (r) =sustaining cost
/ c2
/
I Ilastyear M
r =cost driver
sustaining[2 resource
Cost/Resource FunctionFigure 4
14
A
S
FI
/
//
/
m
· 1 ·I I II
M1

Figure 4 is only representative of the many cost/resource functions we mightdevelop to analyze a firm's supply chain decisions. For example, the number of changes inunit cost as well as the number of increments of resource addition with fixed costs can bearbitrary. Mixed integer programming modeling constructs can be used to capture thenonlinearities and discontinuities.
Note that we have also displayed last year's resource level and the traditionalaccounting rate of c dollars per hour based on it. The dotted line in the figure clearlyshows that the projected sustaining cost will be inaccurate, even when the cost driver isan appropriate one.
The partition of cost drivers into sustaining resources and accounting resources isa judgment made by the modeling practitioner based on his/her knowledge of the firm.Although it would be safe to treat all cost drivers as potentially scarce resources, moreparsimonious models will result if cost drivers that almost certainly will never beconstrained by physical, human, or financial resources be treated as accounting resources.For example, the number of orders taken in a year by telephone salespeople may be ameaningful cost driver for describing sales department costs, but unless the firm's volumeof business doubles, which we consider to be highly unlikely, this number will not beconstrained by physical limitations. Moreover, assuming a significant number ofadditional sales people can be hired at a constant cost rate, the firm will not encounterhuman constraints on its order taking and other sales activities.
The major step in extending ABC relationships to an optimization model is todescribe the interactions of transformation activities at facilities with cost/resource andcost/accounting functions, and with other relationships describing the constraints andstrategy options of the firm. We illustrate such a construction with an example of afacility sub-model. We assume the planning horizon of the snapshot model is one year.Moreover, the facility may be open or closed (either shut-down or sold) during that year.
First, we must define indices, parameters and functions and decision variables:
Indices
s S: suppliers of raw materials
i I: raw materials
j E J: transformation activities
k E K1: accounting resources
k E K 2: sustaining resources
15

k E K3: fixed resources
k K4: design and policy constraints
p E P: output products
Parameters and Functions
aiu = rate at which activity j consumes raw material i
akj = rate at which activity j consumes resource k
a pj = rate at which activity j produces output product p
r k = fixed level of resource k (k E K 3)
bk = design or policy parameter k (k E K 4)
Li = upper bound on activity j
R = facility throughput capacity
Cj = product sustaining unit cost
Uk process and facility resource accounting unit cost
fk (rk)
(k K1)
function describing the cost of the sustaining resource rk (k E K2 )
F = annualized facility replacement cost
S = annualized facility shutdown cost
Decision Variables
w,i = quantity of raw material i to be acquired by facility from supplier s
rk = utilization of resource k
Xi = level of activity j
16

Ypm = quantity of output of product p to be shipped from facility to market m
1 if facility open during planning horizon
0 if facility closed during planning horizon
The above parameters, functions and variables are used to construct the following:
Facility Sub-Model
Ia. x -wsi =O, i i s
Xakjxj -rk = O, k E K
akxj -r<0, k E K
I jxj < r, kE K
;aa k < kE K3
i
+ XYpm = 0, Pm~M
xj <Lj, j J
Ypm - R < 0
I raw material balance equations
accounting resource balances
sustaining resource constraints
fixed resource constraints
design and policy constraints
E P output product balance equations
production bounds
facility throughput constraint
Objective Function Costs to be Minimized
Icixi product sustaining costsJ
+ U, ukrk accounting resource costskeK l
17
z
(1)
(2)
(3)
(4)
- api Xji
(5)
pEP mM
(6)
(7)
(8)
(9)
(10)
Ypm
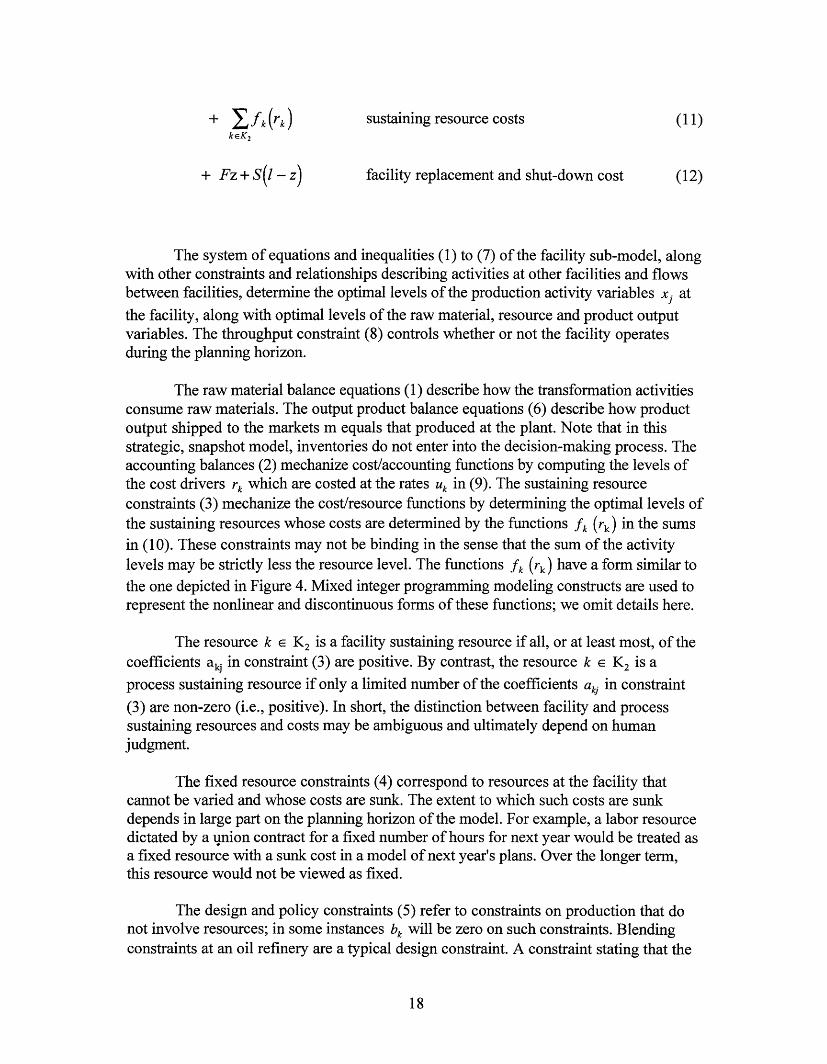
+ fk (rk) sustaining resource costs (11)kEK 2
+ Fz + S(l- z) facility replacement and shut-down cost (12)
The system of equations and inequalities (1) to (7) of the facility sub-model, alongwith other constraints and relationships describing activities at other facilities and flowsbetween facilities, determine the optimal levels of the production activity variables xj at
the facility, along with optimal levels of the raw material, resource and product outputvariables. The throughput constraint (8) controls whether or not the facility operatesduring the planning horizon.
The raw material balance equations (1) describe how the transformation activitiesconsume raw materials. The output product balance equations (6) describe how productoutput shipped to the markets m equals that produced at the plant. Note that in thisstrategic, snapshot model, inventories do not enter into the decision-making process. Theaccounting balances (2) mechanize cost/accounting functions by computing the levels ofthe cost drivers rk which are costed at the rates Uk in (9). The sustaining resourceconstraints (3) mechanize the cost/resource functions by determining the optimal levels ofthe sustaining resources whose costs are determined by the functions fk (rk) in the sumsin (10). These constraints may not be binding in the sense that the sum of the activitylevels may be strictly less the resource level. The functions fk (rk) have a form similar tothe one depicted in Figure 4. Mixed integer programming modeling constructs are used torepresent the nonlinear and discontinuous forms of these functions; we omit details here.
The resource k K2 is a facility sustaining resource if all, or at least most, of thecoefficients akj in constraint (3) are positive. By contrast, the resource k K2 is aprocess sustaining resource if only a limited number of the coefficients akj in constraint
(3) are non-zero (i.e., positive). In short, the distinction between facility and processsustaining resources and costs may be ambiguous and ultimately depend on humanjudgment.
The fixed resource constraints (4) correspond to resources at the facility thatcannot be varied and whose costs are sunk. The extent to which such costs are sunkdepends in large part on the planning horizon of the model. For example, a labor resourcedictated by a union contract for a fixed number of hours for next year would be treated asa fixed resource with a sunk cost in a model of next year's plans. Over the longer term,this resource would not be viewed as fixed.
The design and policy constraints (5) refer to constraints on production that donot involve resources; in some instances bk will be zero on such constraints. Blendingconstraints at an oil refinery are a typical design constraint. A constraint stating that the
18

facility must product at least as much as one product group as it does of a second productgroup is an example of a policy constraint.
7. Applications in Specific Firms
In this section, we review recent implementations and applications of ABC andMP models to the strategic analysis of supply chains in three companies:
* A multi-national food manufacturer* A specialty chemicals company* A wholesaling/retailing company
Multi-national food manufacturer
This company has more than 15 plants in the US, Canada and Mexico. Followingpassage of NAFTA, senior management engaged a team of external consultants toimplement an MP model for studying consolidation of their sourcing, manufacturing anddistribution supply chain. Two major reasons for performing the study were:
· For some time, the company had been operating under conditions of excess capacityamong their manufacturing facilities;
* Passage of NAFTA eliminated or greatly reduced tariffs and import/exportrestrictions between countries thereby making it economically feasible to manufacturemost products in fewer locations and, where appropriate, ship them across nationalboundaries.
The most difficult task of the project was the development of compatible cost andresource descriptions of the company's plants. As shown in Figure 4, each of the plantshad its own, locally developed general ledger of accounts which required translation intoproduct, process and facility sustaining cost/resource functions of the type discussed inthe previous section. The ABC analysis served to homogenize the disparate accountingschemes at the various plants in constructing cost/resource functions that could becompared across plants. In the final analysis, the consulting team was successful indeveloping general procedures and programs, the template T, for mapping any plant'sgeneral ledger into its cost/resource functions.
ABC models were useful in providing metrics contrasting facility, process andproduct sustaining costs among the plants. The integrating MP model played a criticalrole, however, in deciding on optimal resource levels for each plant and the quantities ofindividual products to be manufactured there. The objective driving the evaluation was tominimize the total delivered cost of all products to meet projected demand in the studyyears. In other words, metrics about production costs at individual plants could notdetermine an optimal supply chain strategy because they could not decide optimal
19

T
Facility sustaining costsand resources
Process sustaining costsand resources
Product sustaining costsplant 1
0
.
0
T
Otherdata
I --
ABC Models Feed Supply Chain Optimization ModelFigure 5
20
GeneralLedgerPlant 1
0
0
0
.
Integratingsupplychain
optimizationmodel
Facility sustaining costsand resources
Process sustaining costsand resources
Product sustaining costsplant N
· ·
· ·
I_

resource levels, and could not account for plant locations relative to geographicallydispersed markets.
The supply chain optimization model was successfully validated and then rununder a number of scenarios to assess potential consolidation strategies. Cost savings ofmore than 10% on avoidable costs exceeding $100 Million were identified. The companyintends to continue using the ABC and supply chain optimization models after the studyhas been completed. Their strategic plans will require frequent adjustment in response toexternal factors.
Specialty chemicals company
This company supplies a range of specialty chemicals products to worldwidemarkets. It also has manufacturing facilities around the world, with movement ofintermediate products among plants as well as movement of finished products to themarkets. Capital investments in process manufacturing equipment and manufacturingoperating costs, are high and represent a large percentage of the total cost of the products.
Given the complexity of their operations and the growth of markets for newproducts, senior management engaged a consulting team to implement an MP modelingsystem to assist in evaluating their strategic plans. The models address
* Sourcing costs and constraints* In-bound transportation costs and constraints on links between sources and plants* Product, process and facility sustaining costs and resources at manufacturing plants* Multi-stage processes and transformation recipes at the plants* Inter-facility product transfers* Out-bound transportation costs and capacities on links between plants and markets
The models may be optimized so as to minimize total supply chain costs or to maximizetotal supply chain net revenues. They are being used to evaluate global asset utilization,raw material sourcing strategies, and global production/distribution strategies.
For the purposes of our discussion here, an important aspect of the project was,and continues to be, an accurate mapping of manufacturing costs into product, processand facility sustaining cost/resource functions. Formal application of ABC methods tothis task is new to the company and was stimulated by the model development project.ABC representations that accurately reflect economies of scale in manufacturing,particularly as they relate to specific processes, are crucial in determining effectivestrategies via the optimization model.
In addition, the company developed cost and resource utilization data forpotential new products to assess their profitabilities from a global supply chainviewpoint. Unlike traditional ABC analyses that draw on historical data, the data for newproducts require extrapolation of data about relevant existing products. Moreover,
21

learning associated with the manufacture of new products needs to be quantified andincorporated in the models.
Wholesaling/retailing company
This wholesaling company buys and distributes consumer products toapproximately 500 franchised, retailing outlets throughout Canada. Originally, it had 7distribution centers (DC's) of various sizes, locations, and missions. The number ofdifferent SKU's sold in a year exceeds 50,000.
Although profits remained healthy, senior management decided in the early 1990'sto re-engineer the wholesaling company, largely because they could see increasingcompetition in many of their markets just over the horizon. The goals of re-engineeringwere
* To improve the cost effectiveness of transportation, warehousing and inventorymanagement practices;
* Working with the retailers, to develop more effective purchasing and productreplenishment processes;
* To implement new operational procedures exploiting point of sales information,electronic data interchange arrangements with suppliers, and other informationtechnology advances.
To address the first goal, the company acquired off-the-shelf software for supply chainmodeling, and assembled a team of internal consultants to develop the decision data basefrom which the models would be constructed.
Although the wholesaling company is not involved in manufacturing products,there is a form of "production" at the DC's. Products arriving there from many suppliersare received, sorted, sometimes stored, sometimes assembled, and then dispatched. Theinternal consultants used ABC methods to identify product, process sustaining andfacility sustaining costs, cost drivers and resource functions based on these "production"activities. They also developed new information to forecast the costs and resourcerequirements of potential new operating procedures to be evaluated by the supply chainmodel.
For example, the product line was divided into fast moving goods (FMG) andslow moving goods (SMG). As shown in Figure 6, the model was used to study theeconomics of using flow-through equipment to handle FMG while centralizing the storageof SMG in a single DC. With this scheme, suppliers package FMG with bar codesindicating their final store destinations. Equipment at the flow-through DC reads thecodes and automatically sorts the FMG into full truckload shipments to individual stores.
22

If managed properly, this type of operation can achieve considerable cost savings byeliminating handling and inventories of FMG. In addition, SMG are stored in a single DC,thereby reducing their inventory holding costs by a significant amount. Store initiatedorders for SMG are handled by the SMG DC as a flow-through supplier.
The company has used the optimization modeling system to great advantage inidentifying more effective supply chain configurations and in simulating the impact ofnew procedures on their operations before committing to the time and expense ofimplementing them. The models sometimes indicated supply chain strategies that, at first,seemed counter intuitive, but upon further study, proved themselves to be meritorious.
23
Suppliers
Flow Through
DC's
(no inventory)
Retailers
Inventory Management of Fast vs. Slow Moving GoodsFigure 6
8. Connections Between Data Driven Modelsand the Resource Based View of the Firm
The data driven models for analyzing supply chain strategies that we justdiscussed focused heavily on resource planning. Since the central premise of RBV is thatthe firm's competitive advantage stems in large part from its ownership and utilization ofheterogeneous resources, we are naturally drawn to ask:
What information can data driven models of a firm's supply chain provide aboutthe heterogeneity of the firm's resources?
Wernerfelt [1994] confirms that measurement methods such as these that map the spaceof resources are needed to make RBV more useful.
To answer this question, we exploit marginal cost information provided byoptimization algorithms that solve the supply chain models. Specifically, by fixing allzero-one variables in a mixed integer programming model of the firm's supply chain attheir optimal values and solving the residual linear programming model, we can computeoptimal shadow prices on all resource constraints. To keep our discussion simple, weassume that the model being optimized is of type 1 or 2 as shown in Figure 3. Dependingon the objective function driving the model, these shadow prices measure the decrease inminimal cost, or increase in maximal net revenues, that would occur if another unit ofresource were available. They need not be unique, but we can treat this ambiguity as ofsecondary importance.
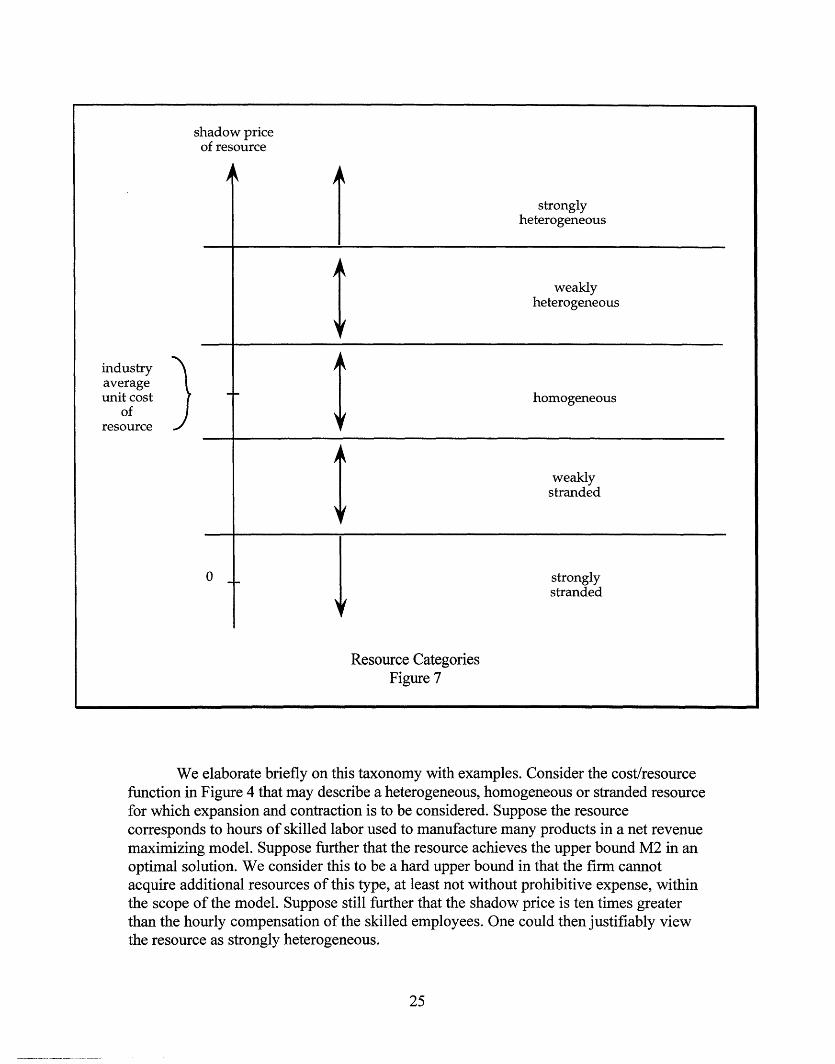
As shown in Figure 7, relative to an optimal supply chain strategy and industryaverage unit costs for a resource, we have posited five categories into which the resourcemay fall:
· strongly heterogeneous* weakly heterogeneous* homogeneous* weakly stranded* strongly stranded
If the resource is unique to the firm and no meaningful industry average unit cost exists,then the Figure simplifies to two ranges: Heterogeneous if the shadow price is positiveand stranded if the price is non-positive. Moreover, a cost/accounting function,corresponds only to a homogeneous resource for which perfect markets allow expansionor contraction, virtually without limit, at approximately the industry average unit cost ofthe resource.
24
shadow priceof resource
industryaverageunit cost
ofresource
0
k~~~~~~
stronglyheterogeneous
weaklyheterogeneous
homogeneous
weaklystranded
stronglystranded
Resource CategoriesFigure 7
We elaborate briefly on this taxonomy with examples. Consider the cost/resourcefunction in Figure 4 that may describe a heterogeneous, homogeneous or stranded resourcefor which expansion and contraction is to be considered. Suppose the resourcecorresponds to hours of skilled labor used to manufacture many products in a net revenuemaximizing model. Suppose further that the resource achieves the upper bound M2 in anoptimal solution. We consider this to be a hard upper bound in that the firm cannotacquire additional resources of this type, at least not without prohibitive expense, withinthe scope of the model. Suppose still further that the shadow price is ten times greaterthan the hourly compensation of the skilled employees. One could then justifiably viewthe resource as strongly heterogeneous.
25
_

An option for stretching strongly heterogeneous resources is for the firm tooutsource the manufacture of components or parts using these resources. This will freeup the firm's use of the resources in other value adding activities. Such make-or-buydecisions can be evaluated by supply chain models (see Shapiro [1994] for an example).
On the other hand, if the resource lies strictly between m and M1 or M1 and M2in an optimal solution, mathematical analysis shows that the shadow price will always liebetween c2 and c3 (recall that c2 < cl < c3). Assuming this range is small and straddlesthe industry average, the resource can be considered homogeneous. If future conditionsshould change, such as an increase in raw materials without an increase in product salesprice for products using the resource, the firm might find it wishes to reduce the quantityit makes of these products and thereby reduce its use of this resource.
Finally,'if the optimal resource level equals the conditional minimum m, thisresource might well have a shadow price significantly below the industry average,including the possibility that it is negative, which indicates that the resource is weakly orstrongly stranded. The need for the firm to decrease or eliminate its holdings of strandedresources has been largely ignored by RBV researchers despite the importance of excesscapacity as a competitive factor influencing many industries (Prahalad and Hamel, 1994).
The sustainability of heterogeneous resources identified by the model depends oninter-temporal dynamics of the firm and its industry. This point is discussed brieflybelow. We point out here that MP modeling and duality theory underlying thecomputation of shadow prices can address issues of sustainability discussed in Section 5.Asset mass efficiencies refer to fixed costs and economies of scale that can be captured bymixed integer programming models, if these costs can be accurately measured by ABCmethods. Interconnectedness of stock assets is explicitly captured by the constraints andactivities of MP models. Causal ambiguities may be identified by analyzing primal anddual LP sub-models to explain why unusually high shadow prices were computed forsome resources.
As we discussed in Section 7, the multi-national food manufacturer was motivatedto implement a model for strategic supply chain analysis because senior managementrecognized that total North American manufacturing capacity was in excess. The modeldetermined, in effect, which plants had stranded product and facility sustaining resources.In this case, management's interest was to decide on which facility or facilities to close.There was no effort made to investigate how some product markets might be expanded,thereby causing the stranded resources to be more profitably employed. Since thecompanies product lines are quite mature, the decision to ignore options on the marketingand sales side of the business was probably well founded. The model also demonstratedthe low marginal value of opening a new plant, a pet project of the management team inthe country where the plant was to be located.
The wholesaling/retailing company developed and used a supply chain model toevaluate new designs of their distribution network. Since they took a "greenfield
26

approach" to the location and sizing of new facilities, the supply chain model, in effect,sought to establish facilities with only heterogeneous and homogeneous resources.In studying the supply chain of the specialty chemicals company, the model consistentlyidentified optimal strategies under a range of scenarios for which certain processsustaining resources reached their upper bounds and represented significantlyheterogeneous resources. The company is investigating investment alternatives forexpanding them, as well as acquisitions and joint ventures to add capacities in thesecategories in new locations. The firm's supply chain model will be used to study theeconomics of these alternatives.
The extent to which the firm's resources are heterogeneous, homogeneous, orstranded depends on the activities using them. The intersection of activities withresources was discussed in an earlier section. The schema discussed there is not intendedto convey the idea that a firm can make existing activities more profitable, or createprofitable new activities, in a mechanistic manner. Rather, the firm's activities reflectorganizational realities within the firm and between the firm and its suppliers andcustomers.
For example, the new flow-through activities being investigated by thewholesaling/retailing company can be implemented only for products from suppliers whohave the capability and willingness to organize and bar code their shipments by final storedestination. Similarly, when considering manufacturing products in Mexico for the US andvice versa, the multinational food company must determine if plants in the respectivecompanies can efficiently execute different product recipes for the two countries. Toevaluate the introduction of a new product, the specialty chemicals company considersactivities only at those production sites that have personnel with expertise in starting upnew processes for products that have not previously been manufactured in large volumes.
The resource categories of Figure 7 are based on shadow prices of the resources.Since they are marginal prices, further analysis is needed to compute the range of resourceincrease (decrease) in which the category of the resource remains unchanged. The range isalso limited by the fixed values of the zero-one variables in the model that determinewhich facilities are open and closed and impose upper and lower bounds on operatinglevels for resources with economies of scale. Moreover, the modeling practitioner and thedecision-makers might wish to expand the resource acquisition and divestment optionsconsidered by the model in order to extend the acquisition and divesting of resourcesidentified as strongly heterogeneous and strongly stranded.
Dynamic and stochastic MP model types 4, 5, 6, 7, from Figure 3 would providea deeper analysis of the firm's strategic resources. For the purposes of discussion, wehave depicted in Figure 8 a simple stochastic programming model spanning three yearswith binary random events at the ends of years 1 and 2. The boxes in Figure 8 are MPsub-models, which correspond to states in the tree, and the circles are chance nodes. Theprobability of occurrence of each state is shown to the right of each box. The optimalshadow price associated with a resource under investigation is shown on top of the box.
27
The values of the shadow prices across time and scenarios indicate the sustainablenature of the resource. For example, the resource might be strongly heterogeneous in allyears and all scenarios. Such a result would strongly indicate that the resource providesthe firm with sustainable competitive advantage. By contrast, the resource might bestrongly heterogeneous in year 1, but both heterogeneous and homogeneous, depending onthe scenario, in years 2 and 3. To an extent depending on the probabilities of the variousscenarios, the resource is in this case less important to the firm's sustainable competitiveadvantage.
A single measure of the resource is the discounted expected value of the shadowprice given by
'r1 + 21P 2 1 + 7r22 + r31P3 1 + r32P 32 + r33P33 + 734P34
In writing out this formula, we assume the objective function is either to minimizeexpected discounted cost or maximize expected discounted net revenue. Therefore, theshadow prices implicitly include discount factors. In assessing its category, this valueshould be compared to the expected discounted industry cost of the resource.
The process of constructing the decision tree and its scenarios is a critical step inthe implementation of a stochastic programming modeling for strategic planning. Thisconstruction must be based on managerial judgment about the firm's major areas ofstrategic initiative and the uncertainties associated with them. The model practitioner andthe decision-makers should base their thinking in large part on the concepts of RBV.Factors affecting the imitation and mobility of and substitution for heterogeneousresources over time must be quantified. Similarly, complex interactions among resourceacquisition decisions must be also captured (Black and Boal, 1994). The construction ofstochastic programming models should also draw on ideas from the emerging discipline ofscenario planning (e.g., see Georgantzas and Acar, 1995). Unfortunately, we must leavefurther discussion of these issues to another paper.
28

29

30

References
Amtzen, B.C., Brown, G.G., Harrison, T. P., Trafton, L.L., 1995, "Global supply chainmanagement at the Digital Equipment Corporation," Interfaces, 25, 69-93.
Atkinson, A. A., Banker, R. D., Kaplan, R. S., Young, S. M., 1997, ManagementAccounting, Second Edition, Prentice-Hall.
Barney, J., 1991, "Firm resources and sustained competitive advantage," Journal ofManagement, 17, 99-120.
Banker, R. D., Johnson, H. H. 1991, "An empirical study of cost drivers in the U.S.airline industry," The Accounting Review, 68, 563-575.
Black, J. A., Boal, K. B., 1994, "Strategic resources: Traits, configurations and paths tosustainable competitive advantage," Strategic Management Journal, 15, 131-148.
Bienstock, D., Shapiro, J. F., 1988, "Optimizing resource acquisition decisions bystochastic programming," Management Science, 34, 215-229.
Birge, J. R., Louveaux, F., 1997, Introduction to Stochastic Programming, Springer-Verlag.
Conner, K. R., 1991, "A historical comparison of resource-based theory and five schoolsof thought within industrial organization economics: do we have a new theory of thefirm?," Journal of Management, 17, 121-154.
Cooper, R., Kaplan, R. S., 1991, The Design of Cost Management Systems: Text Casesand Readings, Prentice-Hall.
Dierickx, I, Cool, K., 1989, "Asset stock accumulation and sustainability of competitiveadvantage," Management Science, 35, 1504-1511.
Eliashberg, J., Steinberg, R., 1993, "Marketing-production joint decision-making,"Chapter 18 in Handbooks in OR & MS, Volume 5: Marketing, edited by J. Eliashberg andG. Lillien, Elsevier Science.
Ellram, L., Kwolek, M. J., La Londe, B. J., Siferd, S. P., Pohlen, T. L., Waller, D. G.,Wood, W.R., 1994, "Understanding the implications of activity-based costing for logisticsmanagement," Journal of Business Logistics, 11-25.
Foster, G., Gupta, M., 1990, "Manufacturing overhead cost driver analysis," J. ofAccounting and Economics, 12, 309-337.
Georgantzas, N. C., Acar, W., 1995, Scenario-driven Planning: Learning to ManageStrategic Uncertainty, Quorum Books.
31
�_1_1______�_1_______
Goreux, L. M., Manne, A. S., 1973, Multi-level Planning: Case Studies in Mexico, North-Holland
IBM Application Brief, 1981, "Logistics modeling system using IBM's MPSX/370 atInternational paper," Application Brief GK20 1341-0.
Kettinger, W. J., Grover, V., Guha, S., Segars, A. H., 1994, "Strategic informationsystems revisited: A study in sustainability and performance," MIS Quarterly, 18, 31-58.
Mahoney, J. T., Pandian, J. R., 1992, "The resource-based view within the conversationof strategic management," Strategic Management Journal, 13, 363-380.
Mata, F. J., Fuerst, W. L., Barney, J. B., 1995, 'Information technology and sustainedcompetitive advantage: A resource-based analysis," MIS Quarterly, 19, 487-505.
Mehring, J.S., Sarkar, D. Shapiro, J.F., 1983, "Decomposition methods and thecomputation of spatial equilibria: An application to coal supply and demand markets," inEnergy Models and Studies, edited by B. Lev, North- Holland, 221-233.
Miller, T. C., Firesz, T. L. Tobin, R. L., 1996, Equilibrium Facility Location onNetworks, Springer-Verlag.
Murphy F. H., Sherali, H. D., Soyster,A. L., 1982, "A mathematical programmingapproach for determinining oligopolistic market equilibrium," Mathematical Programming,24, 92-106.
Powell, T. C., Dent-Metcallef. A., 1997, "Information technology as competitiveadvantage: The role of human, business and technology resources," Strategic ManagementJournal, 18, 375-405.
Prahalad, C. K., Hamel, G., 1990, "The core competence of the corporation," HarvardBusiness Review, May-June, 79-91.
Prahalad, C. K., Hamel, G., 1994, "Strategy as a field of study: Why search for a newparadigm?," Strategic Management Journal, 14, 179-191.
Peteraf, M. A., 1993, "The cornerstones of competitive advantage: A resource-basedview," Strategic Management Journal, 14, 179-191.
Schrage, L., LINDO: An Optimization Modeling System, Fourth Edition, The ScientificPress.
Shapiro, J. F., 1992, "Integrated logistics management, total cost analysis, andoptimization models," Asia Pacific International Journal of Business Logistics.
32

Shapiro, J.F., Singhal, V. M., Wagner, S. N., 1993, "Optimizing the value chain,"Interfaces, 23, 102-117.
Shapiro, J. F., 1994, "On the connections between activity based costing models andoptimization models for decision support," MIT Sloan School of Management WorkingPaper # 3648-94.
Turney, P. B. B., 1992, Common Cents: The ABC Performance Breakthrough, CostTechnology, Portland, Oregon.
Wernerfelt, B. 1984, "A resource based view of the firm," Strategic Management Journal,5, 171-180.
Winston, W. L., 1995, Introduction to Mathematical Programming, Second Edition,Duxbury Press.
33
_�1_______�1_______�____