slope paper 111
TRANSCRIPT

Proceedings, Slope Stability 2011: International Symposium on Rock Slope Stability in Open Pit Mining and Civil Engineering, Vancouver, Canada (September 18-21, 2011)
A Correlation of Slope Velocity and Factor of Safety at Mt Owen Mine
W. Bartlett Thiess Pty Ltd, Mt Owen Mine, Australia
Abstract As a general principal we are guided by a derived factor of safety for slope stability. When the factor of safety of a slope is too low it will generally begin to yield. In 2005 Mt Owen Mine had one of the largest lowwall failures in Australia, when 15 million cubic metres of spoil on a lowwall raft failed.
Material properties were gleaned and refined as a result of the 2005 failure. When the lowwall began moving again in 2007, an area almost twice the size and incorporating the 2005 failure had mobilised. A buttress was designed and constructed. The construction of the buttress reduced the velocity of the lowwall but it continued to move down slope for 16 months until mining of the adjacent block was finished and a substantial buttress was constructed.
During the period the lowwall was moving a large amount of data was measured by surveyor, an automated prism monitoring system and a slope stability radar. After the initial acceleration, movement rates were in excess of 20mm per day. Once the buttress was constructed the velocity was reduced to approximately 10mm per day.
Stability analyses were carried out regularly throughout the 16 months of movement to assess dumping strategies. Correlations can be drawn from rain fall, dump construction and the velocity of lowwall.
This paper presents a relationship between the calculated factor of safety and velocity of the lowwall. The findings are not necessarily new and they are considered every day in slope design and stability analysis.
1 Introduction Lowwall stability at Mt Owen Mine has been considered a major hazard since the mine begun operating in 1995. A weak seam within the lowwall has been the cause of several lowwall failures, the most notable was the 2005 failure when 15 million cubic meters of material failed.
In 2008 a larger area began to mobilise. An extensive network of monitoring was carried out to assess the deformation of the lowwall. This paper presents a correlation of the monitoring data and Factor of Safety (FOS) of the 2008 B6 Lowwall movement (B6 Movement).
2 Geological and geotechnical setting The Mt Owen Mine reserve consists of 15 coal seam groups from the Foybrook Formation within Wittingham Coal Measures in the Singleton Subgroup (Figure 1). Each seam group comprises multiple plies of varying thicknesses totalling up to 69 minable coal plies.
The Mt Owen Mine is situated between two large regional thrust faults, namely the Hunter Thrust to the east and the Hebden Thrust to the southwest (Figure 2). Coal seam dip varies between horizontal to vertical with an average dip of 22 degrees. The deposit is dissected by several large folds and fault splays causing significant localised folding of the strata (Figure 2).
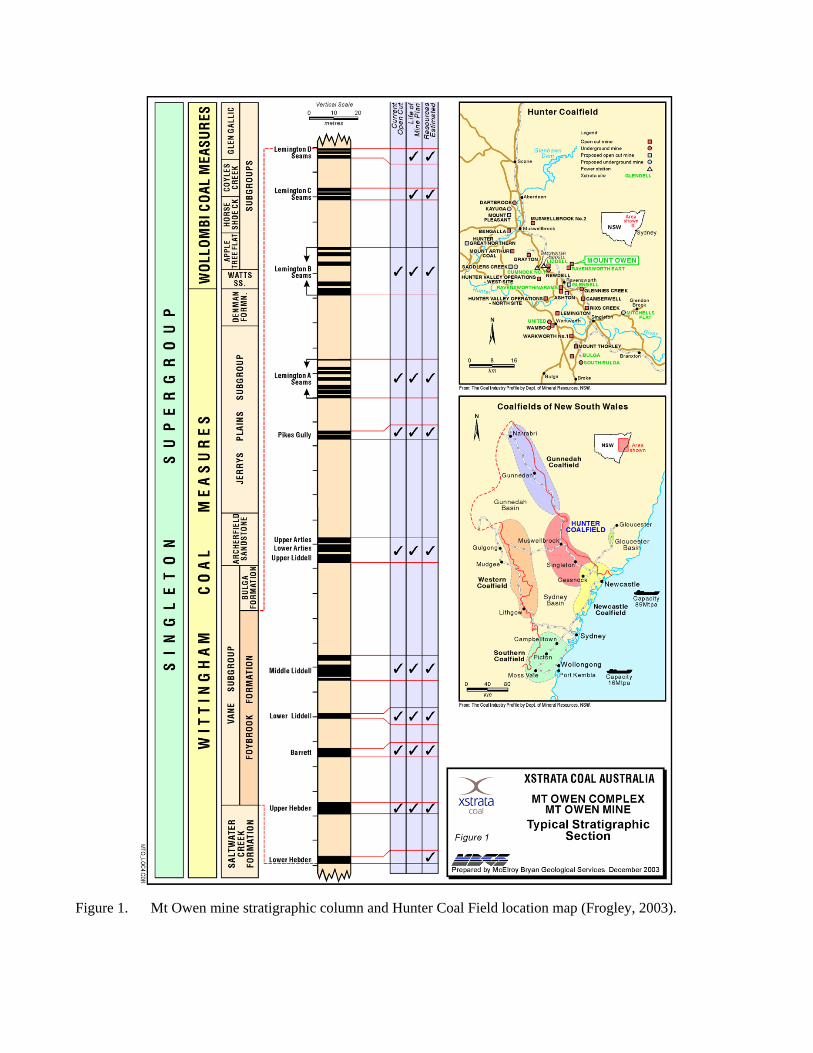
Figure 1. Mt Owen mine stratigraphic column and Hunter Coal Field location map (Frogley, 2003).
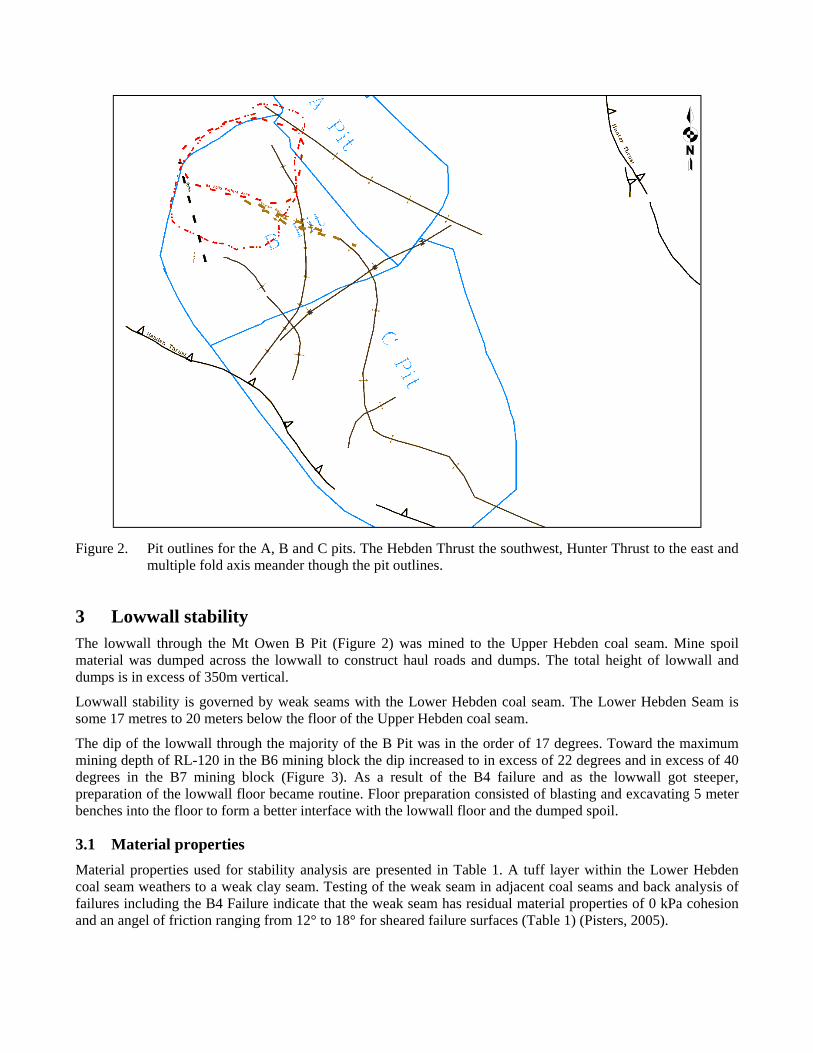
Figure 2. Pit outlines for the A, B and C pits. The Hebden Thrust the southwest, Hunter Thrust to the east and multiple fold axis meander though the pit outlines.
3 Lowwall stability The lowwall through the Mt Owen B Pit (Figure 2) was mined to the Upper Hebden coal seam. Mine spoil material was dumped across the lowwall to construct haul roads and dumps. The total height of lowwall and dumps is in excess of 350m vertical.
Lowwall stability is governed by weak seams with the Lower Hebden coal seam. The Lower Hebden Seam is some 17 metres to 20 meters below the floor of the Upper Hebden coal seam.
The dip of the lowwall through the majority of the B Pit was in the order of 17 degrees. Toward the maximum mining depth of RL-120 in the B6 mining block the dip increased to in excess of 22 degrees and in excess of 40 degrees in the B7 mining block (Figure 3). As a result of the B4 failure and as the lowwall got steeper, preparation of the lowwall floor became routine. Floor preparation consisted of blasting and excavating 5 meter benches into the floor to form a better interface with the lowwall floor and the dumped spoil.
3.1 Material properties
Material properties used for stability analysis are presented in Table 1. A tuff layer within the Lower Hebden coal seam weathers to a weak clay seam. Testing of the weak seam in adjacent coal seams and back analysis of failures including the B4 Failure indicate that the weak seam has residual material properties of 0 kPa cohesion and an angel of friction ranging from 12° to 18° for sheared failure surfaces (Table 1) (Pisters, 2005).

Figure 3. B Pit Lowwall 20m contours and coloured for angle of dip. Locations of mining blocks are labelled.
Table 1. Material properties.
Geological Units Density (kg/m3)
Cohesion (MPa)
Friction Angle (deg)
Category 2 Unsaturated Spoil 1800 30 28
Category 2 Saturated Spoil 2000 15 23
Fresh Rock Interburden 2400 450 42
Weak Clay Seam 2400 0 12
The 17 to 20 meters interburden material between the Upper Hebden floor, the lowwall of the pit and the Lower Hebden Coal seam consists of fresh interbeded sandstone and mudstone. Under normal conditions it is considered that the fresh rock has material properties of 450KPa cohesion with an angle of friction of 42 degrees.
Spoil material consisted of competent sandstones and siltstones cobbles and boulders in a weathered matrix of stiff to medium dense clayey, silty, Sand consistent with a Category 2 Spoil (Simmons & McManus, 2004). The material properties of the spoil are considered to be 30KPa cohesion and an angle of friction of 28 degrees. It is anticipated that the spoil has a saturated layer at the base of the spoil. The nominal material properties of the saturated spoil are considered to have a cohesion 15KPa and an angle of friction of 23 degrees.
B7
B6
B5
B4
3.2 Previous B4 2005 lowwall failure
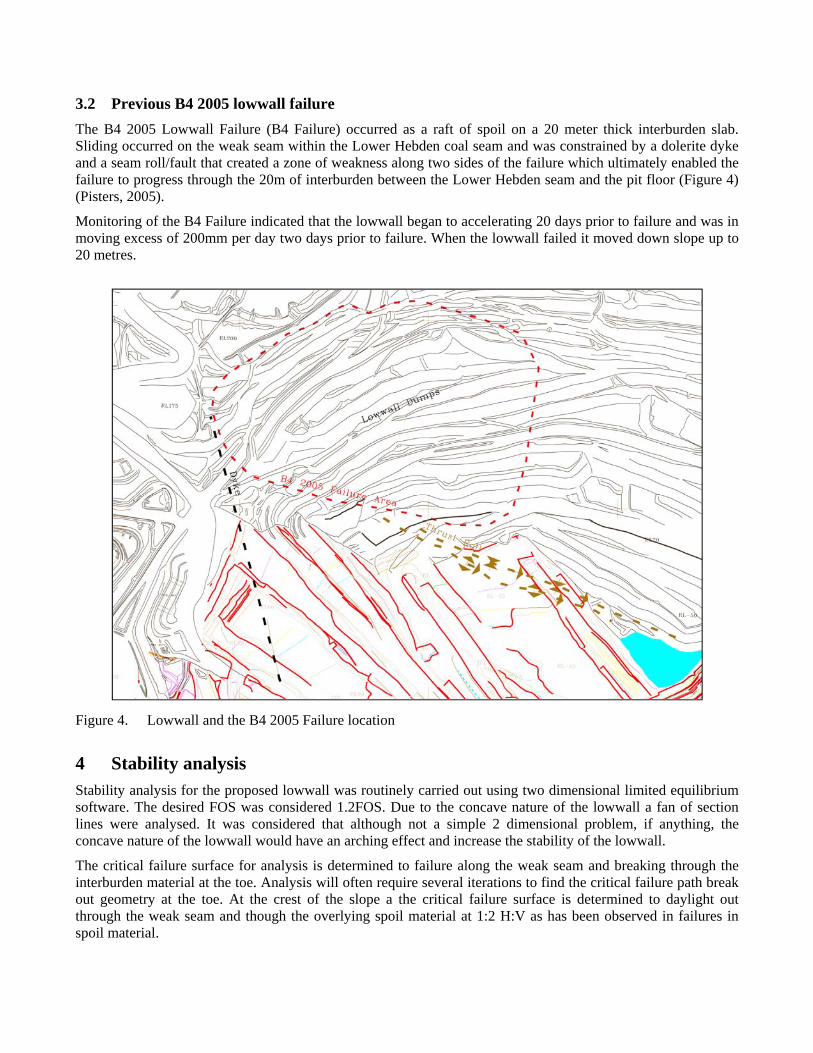
The B4 2005 Lowwall Failure (B4 Failure) occurred as a raft of spoil on a 20 meter thick interburden slab. Sliding occurred on the weak seam within the Lower Hebden coal seam and was constrained by a dolerite dyke and a seam roll/fault that created a zone of weakness along two sides of the failure which ultimately enabled the failure to progress through the 20m of interburden between the Lower Hebden seam and the pit floor (Figure 4) (Pisters, 2005).
Monitoring of the B4 Failure indicated that the lowwall began to accelerating 20 days prior to failure and was in moving excess of 200mm per day two days prior to failure. When the lowwall failed it moved down slope up to 20 metres.
Figure 4. Lowwall and the B4 2005 Failure location
4 Stability analysis Stability analysis for the proposed lowwall was routinely carried out using two dimensional limited equilibrium software. The desired FOS was considered 1.2FOS. Due to the concave nature of the lowwall a fan of section lines were analysed. It was considered that although not a simple 2 dimensional problem, if anything, the concave nature of the lowwall would have an arching effect and increase the stability of the lowwall.
The critical failure surface for analysis is determined to failure along the weak seam and breaking through the interburden material at the toe. Analysis will often require several iterations to find the critical failure path break out geometry at the toe. At the crest of the slope a the critical failure surface is determined to daylight out through the weak seam and though the overlying spoil material at 1:2 H:V as has been observed in failures in spoil material.

5 Hazard management plan To manage geotechnical hazards across the mine, Trigger Action Response Plans (TARP) have been implemented. A lowwall TARP was used to set controls and responsibilities for personnel on site based on observations and monitoring trigger levels. Monitoring trigger levels have been set by historic monitoring data and are regularly re assessed. All personnel are trained in geotechnical awareness, the use of the TARPs system and are regularly updated on the TARP levels and assigned controls.
6 B6 2008 lowwall movement Monitoring of the lowwall indicated an increase in velocity from 25th December 2007, cracks were noted at the crest of the slope on 1st January 2008 and by early February the velocity of the lowwall was up to 2mm/hr or 48mm/day.
At this stage the decision was made to change the mining plan and step-out from the Upper Hebden to the Barrett coal seam. This was to provide support and space to construct a buttress. The buttress design was critical, it needed to be constructed on several levels on the step-out area. If the buttress was too large there was potential to destabilise the step-out block.
By late February the initial buttress had been constructed and the velocity had decreased and remained at a constant velocity of between 9mm/day to 15mm/day. During this period correlation could be made with heavy rain events and velocity of the slope. Any changes to the slope profile of the moving area would affect the velocity of the slope.
As a result of monitoring a No Dump Zone was implemented across the moving area. The No Dump Zone was in place until a sufficient the buttress could be constructed to increase and maintain the stability of the slope. Stability analysis was carried out to assess the implications of any proposed dumps and buttress construction.
6.1 Comparison of lowwall movement
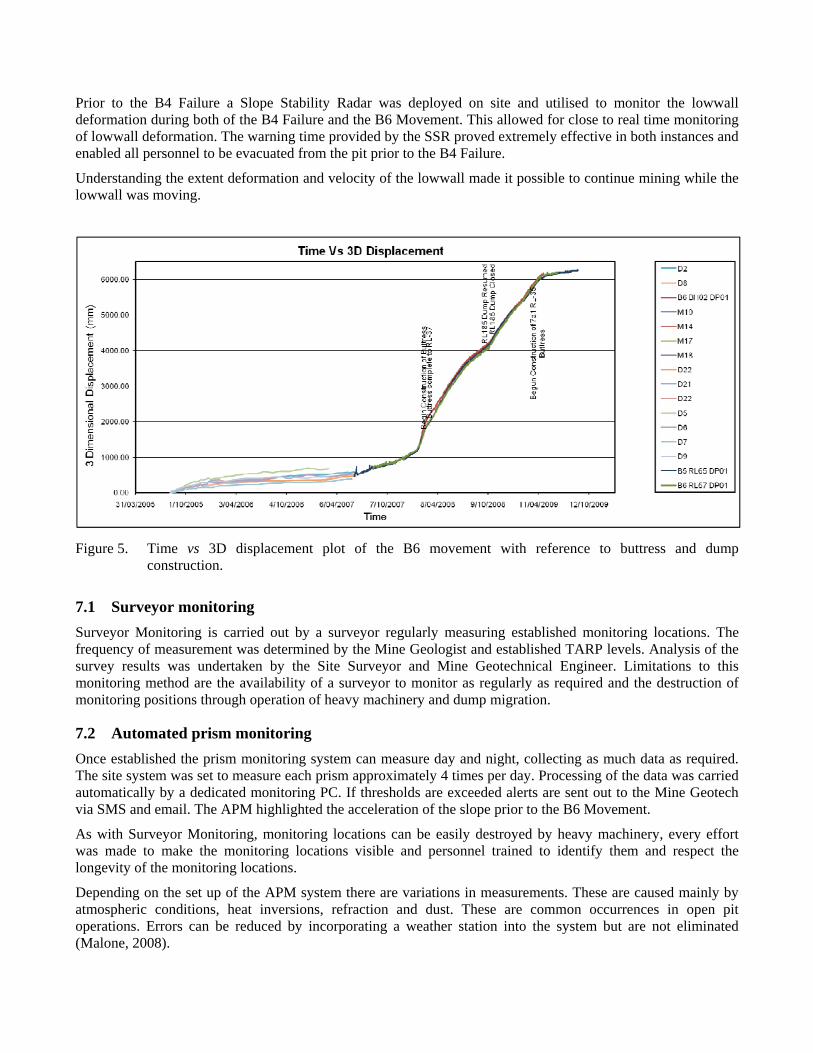
It is considered that, although there was significant acceleration of the lowwall, the lowwall did not catastrophically fail. The lowwall moved in excess of 6 meters over 4 years with the majority of the movement occurring over a one year period (Figure 5). The moving area exhibited opening of cracks across the crest of the slope. Haul roads that crossed the crest of the failure required continual maintenance. The maximum velocity the B6 Movement was up 48mm per day before decelerating, while the B4 Failure exceeded 200mm per day prior to failure.
There was no evidence of any longitudinal cracks or displacement on either side of the movement and no floor heave occurred. It is considered that the B4 Failure had significant weakening of the toe from localised folding and faulting and this allowed the lowwall raft to break through and the failure to occur. This was not the case with the B6 Movement, however, it would not be possible to determine if such a weakness was present to cause failure until a failure occurred.
7 Slope deformation monitoring An array of monitoring locations has been established across the lowwall. As the lowwall has had spoil material dumped across the slope monitoring locations are on a layer of spoil material. The spoil material is dumped from a tip head generally up to 30 meters in height. Movement of survey location includes and compaction, consolidation and down slope creep of up to 70 metres thickness of spoil material.
Prior to 2007 monitoring of lowwall was carried out by surveyor monitoring. During 2007 an Automated Prism Monitoring (APM) system was commissioned.
Prior to the B4 Failure a Slope Stability Radar was deployed on site and utilised to monitor the lowwall deformation during both of the B4 Failure and the B6 Movement. This allowed for close to real time monitoring of lowwall deformation. The warning time provided by the SSR proved extremely effective in both instances and enabled all personnel to be evacuated from the pit prior to the B4 Failure.
Understanding the extent deformation and velocity of the lowwall made it possible to continue mining while the lowwall was moving.
Figure 5. Time vs 3D displacement plot of the B6 movement with reference to buttress and dump construction.
7.1 Surveyor monitoring
Surveyor Monitoring is carried out by a surveyor regularly measuring established monitoring locations. The frequency of measurement was determined by the Mine Geologist and established TARP levels. Analysis of the survey results was undertaken by the Site Surveyor and Mine Geotechnical Engineer. Limitations to this monitoring method are the availability of a surveyor to monitor as regularly as required and the destruction of monitoring positions through operation of heavy machinery and dump migration.
7.2 Automated prism monitoring
Once established the prism monitoring system can measure day and night, collecting as much data as required. The site system was set to measure each prism approximately 4 times per day. Processing of the data was carried automatically by a dedicated monitoring PC. If thresholds are exceeded alerts are sent out to the Mine Geotech via SMS and email. The APM highlighted the acceleration of the slope prior to the B6 Movement.
As with Surveyor Monitoring, monitoring locations can be easily destroyed by heavy machinery, every effort was made to make the monitoring locations visible and personnel trained to identify them and respect the longevity of the monitoring locations.
Depending on the set up of the APM system there are variations in measurements. These are caused mainly by atmospheric conditions, heat inversions, refraction and dust. These are common occurrences in open pit operations. Errors can be reduced by incorporating a weather station into the system but are not eliminated (Malone, 2008).

The APM measurement variations can exceed the thresholds required to set as triggers. The APM will give good trend of movement over time but the variation of measurements make it difficult to set alerts as soon as movement thresholds are exceeded. This would mean false alarms for untrained personnel and unnecessary delays to production. If trends indicate that threshold exceedence is imminent a Slope Stability Radar (SSR) is required to better monitor slope deformation.
7.3 Slope Stability Radar
Once lowwall movement exceeded practical thresholds for Surveyor Monitoring and APM a Slope Stability Radar (SSR) was deployed to monitor slope movement. The SSR enabled close to real time monitoring of slope deformation. An alarm system was setup to inform the personnel on site when thresholds were exceeded. The SSR can record sub millimetre deformation of a slope. Time between measurements varies depending on the scan area. While scanning the lowwall time between scans was approximately 8 minutes. With appropriate trigger levels an SSR will give adequate warning of lowwall movement.
8 Correlation of slope velocity and factor of safety Figure 6 maps the location of the selected lowwall monitoring points in relation to the sections analysed for stability, the B4 Failure and the B6 Movement areas. The monitoring locations in this review were selected based on location within the moving area and longevity of monitoring location.
During the time the B6 Movement occurred deformation analysis was carried out using time verse 3D displacement plots (Figure 5). The velocity calculated from 3D movement amplifies the variation or noise in the data and requires smoothing of the data. Changes in the velocity of the slope could be assessed from the time verse 3D displacement plots.
The velocity of selected monitoring locations for the B6 Movement is presented in Figure 7. Prior to June 2007 surveyor monitoring data was collected as required according to the TARPs, post June 2007 measurements were made by the APM system. Variation in APM velocity data has been smoothed to reduce the effect of measurement variation.
Figure 5 indicates a constant background down slope displacement between early 2006 and mid 2007 it is considered that this is a combination of compaction, consolidation and down slope creep. This same period in Figure 7 indicates velocity up to 5mm per day while the FOS is 1.2FOS. Cobble size mudstone and siltstone clasts of spoil material have been observed to breakdown to soil size particles within a year. It is considered that with a maximum vertical thickness of spoil material across the lowwall in excess of 60m and overall slope height of 300m the total displacement due to a combination of compaction, consolidation and down slope creep is up to 5mm per day as shown on Figure 7. Analysis of the magnitude of the background slope movement was not carried out during this study.
In early 2007 as the B6 mining block approached the bottom of the pit at RL-120 it was measured that the actual dip of the lowwall became locally steeper than originally modelled. This revised model decreased the FOS from previous stability analyses. The revised FOS of the lowwall dipped to 1.05FOS. Monitoring of the lowwall indicated the velocity of the lowwall increased from the background velocity of 5mm per day up to 20mm per day. As a result of the acceleration and to prevent failure of the lowwall, mining stepped-out from the Upper Hebden to the Barrett coal seam and the preliminary buttress was constructed. As soon as the buttress was constructed a marked decrease in velocity was noted.

Figure 6. Blue stars indicate monitoring locations, sections 3 and 4 analysed for stability.
It is arguable that when the lowwall accelerated and the FOS was greater than 1.0FOS the material properties may have needed recalibrated by further back analysis. Back analysis had originally been carried out as a result to the B4 Failure. The B4 Failure was moving in excess of 200mm per day prior to failure. It is considered that the B6 Movement was in the early stages of failure. Monitoring of the slope and the response to buttressing indicated that the material properties were acceptable. Recalibration of the material properties would reduce the FOS of the entire Lowwall and a far more conservative approach to mining would be required. With adequate monitoring, slope movements were manageable and controls were implemented in accordance with the Lowwall TARP.
While the FOS was below 1.2FOS changes to the velocity of the lowwall can be seen in response to heavy rain. Figure 8 plots the recorded daily rain fall for the same period as the B6 Movement. Correlation can be made between heavy rainfall events in excess of approximately 40mm over a 48 hour period and the velocity of the lowwall dumps. Acceleration of the lowwall could be measured during heavy rainfall events and a steady deceleration could be seen over several days after the heavy rain. Examples of this behaviour include events illustrated and labelled on Figure 8 and listed in Table 2. It is considered that the 1 in 30 year storm event in June 2007 may have contributed to an increase in velocity of the lowwall from June until late December 2007.

Figure 7. Correlation of prism velocity and FOS. Pre May 2007 monitoring was carried out using survey monitoring then APM was utilised. APM data has been smoothed. Increase in velocity correlates to a decrease in FOS.
Figure 8. 3D Displacement and daily Rainfall (mm/day) over time. Increase in rate of displacement as a result of labelled heavy rain events.
In the late stages of the B6 Movement it was considered that the velocity of the lowwall had decreased as a result of placing a significant buttress at the toe of the slope. The velocity had reduced to approximately 5mm per day, similar to the velocity prior to the accelerated movement. It was decided that it would be possible to place what was considered a small amount of material at RL185 toward the crest of the slope to join an unfinished ramp. This was with the area defined as a No Dump Zone. Shortly after material was placed at the RL185 dump the velocity increased from 5mm per day to 10mm/day. Dumping at RL185 was discontinued immediately in accordance with the Lowwall TARP.

Table 2. Rainfall events showing acceleration during event.
Rain Event Total Rain
(mm)
Period
(Hours)
Velocity Prior
(mm per Day)
Velocity Post
(mm per Day)
24 April 2008 61 24 12 18
7 October 2008 42 24 5 7
16 February 2009 130 72 11 14
9 Conclusions A weak seam within the floor of the lowwall reduced the stability of the lowwall to less than 1.2FOS. It is considered that the FOS of 1.2FOS is a realistic value for managing stable slopes at Mt Owen. Any reduction in FOS below this level correlated to an acceleration of the lowwall. Monitoring of the lowwall made it possible to assess the response to any dump and buttress construction across the lowwall.
Implicit monitoring of the slope illustrated the sensitivity of the velocity to heavy rainfall. During heavy rain the slope velocity increased and could be seen to decrease over several days after the heavy rain event.
Without a robust Hazard Management Plan that incorporates the monitoring of slopes and other lowwall conditions, safe mining at Mt Owen Mine may not be possible. Due to a previous failure of the lowwall movement trigger levels have been determined and revised. It has been shown that monitoring of the lowwall is integral to safe mining operations at Mt Owen. Monitoring the lowwall has enabled the mine to implement a Hazard Management Plan to ensure safe working practices.
10 References Frogley, S. (2003). Geological Review Mount Owen. McElroy Bryan Geological Services, Report #189/8/2. HVCC
Technical Library. Malone, B. (2008). Prism monitoring. In ACG Geotechnical Engineering for Open Pit Mines and Pit Slope Instrumentation
and Monitoring Techniques Workshop. Pisters, D. (2005). Development of generic guidelines for low wall instability management utilising the Slope Stability
Radar – case studies from the Hunter Valley and Bowen Basin. In Bowen Basin Symposium 2005. Simmons, J., McManus, D. (2004). Shear strength framework for design of dumped spoil slopes for open pit coal mines. In
Jardine et al. (eds.), Proceedings Advances in Geotechnical Engineering the Skempton Conference, London. Thomas Telford Limited, vol. 2, pp. 981-991.