slope safety preparedness in southeast asia for effects … · slope safety preparedness in...
TRANSCRIPT

JTC-1 TR3 Forum
Presented by
Harianto Rahardjo
Slope Safety Preparedness in
Southeast Asia for Effects of
Climate Change
School of Civil and Environmental Engineering
Nanyang Technological University
Singapore
Joint Technical Committee JTC-1
17-18 November 2015
• Singapore : Dr. Alfrendo Satyanaga (NTU); Dr. Aaron Sham
Wai Lun, Er. Ong Chang Leng, Kelvin Hoon (BCA)
• Malaysia : Prof. Bujang Bin Kim Huat, Mohammad Hamed
Fasihnikoutalab, Dr. Afshin Asadi (UPM)
• Indonesia : Prof. Paulus Rahardjo (UNPAR)
• Thailand : Prof. Apiniti Jotisankasa (Kasetart University,
Thailand)
• Vietnam : Prof. Trinh Minh Thu, Tran The Viet (Water
Resources University)
Co-Authors

• Intergovernmental Panel on Climate Change (IPCC, 1990,
1995, 2001, 2007, 2013) report
• Kyoto Protocol (Oberthur and Ott, 1999)
• Doha amendment to the Kyoto Protocol (Doha, 2012)
• United Nation Framework Convention on Climate Change
(UNFCCC) report (United Nation, 1993)
90 % human activities cause the increase in CO2, CH4,
NO2, O3 and halocarbons
Reports on Climate Change
• Growing sign of the global climate changes
• If carbon emissions from human activities continue to grow,
climate change will accelerate
• Singapore’s vision following IPCC report:
“Singapore is expected to be a climate resilient global
city that is well positioned for green growth and remains a
vibrant and livable nation for our future generations” – DPM
Teo Chee Hean
Intergovernmental Panel on Climate
Change (IPCC) Report

• Global Platform for Disaster Risk Reduction(Second Session, Geneva, Switzerland, 16-19 June 2009)
Global Climate Change
Ban Ki-moon addressed that
we face a more threatening future
from natural hazards … First by
more extreme weather…
Risk reduction is an investment, it
is our first line of defense in
adapting to climate change.
Climate change could lead to more severe fluctuations in weather patterns, resulting in geo-disaster that are thought to be water-related disasters
Committees and Workgroup (National
Climate Change Secretariat, 2012)

Adaptation for Climate Change Impacts
• 4-fold approach (NCCS, 2012)
Reduce carbon emissions in
all sectors
Be ready to adapt to climate
change
Harness green growth
opportunities
Forge partnerships
Climate Change Studies in Singapore


Effect of Climate Change on Slope Stability
Landslide at Bukit Antarabangsa, Kuala Lumpur,
Malaysia on 6 December 2008

Effect of Climate Change on Slope Stability
Landslide in Padae-Tak, Thailand
Effect of Climate Change on Slope Stability
Landslide along
Kuala Lumpur-
Karak highway on
4 November 2015

Effect of Climate Change on Slope Stability
Landslide in Kennon Road, Mankayan,
Philippine on 22 August 2015
Effect of Climate Change on Slope Stability
More than 20 slope failures
occurred on 26 February 1995
in NTU campus, Singapore

Effect of Climate Change on Slope Stability
Slope failure in Bukit Batok, Singapore (2006)
Effects of Climate Change on Unsaturated
Soil Behavior
Negative pore-water
pressures (total suction = matric
suction + osmotic
suction)
Positive pore-water
pressures
Potential evaporation (air temperature, wind
speed, relative humidity, vapor pressure)
Precipitation
Water table
Upward flux (pore-water
pressures less than hydrostatic)
Downward flux (pore-
water pressures greater than hydrostatic)
Hydrostatic
Pressure
equal to zero
Ground temperature
Air vapor pressure
Soil temperature
Soil vapor pressure
Capillary fringe
Unsaturated
zone
Saturated
zone

Mechanism of Rainfall-induced Slope
Failure
Saturated zone
Unsaturated zone
Tension cracks
Wetting front
Transpiration
Infiltration
Ground water table
Rise in water table
Slip surface
Rainfall Rainfall
Potential evaporation = f (air temperature, relative humidity, solar radiation, wind speed)
Actual evaporation = f(potential evaporation, soil temperature, soil suction)
How do we adapt to climate change?
• Investigate main influencing parameters
• Perform a field monitoring and numerical analysis
• Establish preventive measure
Reduction of high risk and/or high impact

Main influencing parameters
• Flux boundary
- Rainfall/runoff
- Ground water level
- Evaporation
• Soil properties
• Slope geometry
Climate change-related parameters
Location of Site Investigation in Singapore (Research Collaboration between NTU and HDB)
26

Location of Instrumented Residual Soil Slope in Singapore (Research Collaboration between HDB and
NTU
Yishun
NTU-CSE,
NTU-ANX
Mandai
Marsiling
Havelock
Ang Mo Kio
Telok
Blangah
Bedok
Tampines
Sedimentary
Jurong Formation
Bukit Timah
Granite
Old
Alluvium
Kallang Alluvial
FormationJalan Kukoh
Pasir RisLorong
Halus
27
Field Instrumentation to Study the Effect of
Climate Change on Slope Stability
P1
P2
P3
Rain
gauge
Tensiometer
Soil moisture
sensor
Temperature
sensor
A B C D
Runoff
boundary
Flume
Weather
station
Rain gauge
Piezometer
Time-domain
Reflectometry
Tensiometer
Weather
station
Data logger
Solar panel
Temperature sensor
Solar panelData logger
Notes:
P = piezometer
A, B, C, D = tensiometer
and soil moisture sensor
at different depth
Instrumented slope
(Rahadjo et al., 2014)
Jurong Formation
Bukit Timah Granite
Old Alluvium
Instrumented slope
(Rahadjo et al., 2003a)

Instrumented Slope
Cut-away view
Slope Responses: Runoff Generation and
Infiltration

Field Installation of a Flume with Water Depth
Probe for Runoff Measurement
31
(1) Rainfall / runoff
Rainfall amount (mm)
0 50 100 150 200 250
Infi
ltra
tio
n (
%)(
as
pe
rce
nta
ge
of
rain
fall
)
0
20
40
60
80
100
120Natural rainfall (Rahardjo et al., 2005)
Simulated rainfall (Rahardjo et al., 2005)
Trend Line (Rahardjo et al., 2005)
Natural rainfall at Jalan Kukoh (5 October 2008
Natural rainfall at Jalan Kukoh (7 October 2008
Field Monitoring
Recorded on 12 Dec 1998
at residual soil slope from
sedimentary Jurong
Formation
Relationship between
infiltration and rainfall
amount (Rahardjo et al.,
2013)

Instruments for Measurement of
Positive Pressures
Piezometer
Porous Stone Piezometer Tips connected to 25 mm Diameter PVC Standpipes

Jet-Fill Tensiometer for Measuring Positive and Negative Pore-water Pressure
Type of Tensiometer used in Residual Soil Slope in Singapore
Jet-fill
tensiometer
manufactured by
Soilmoisture
ICT tensiometer
transducer

(2) Ground water level
Field Monitoring
Residual soil slope from
sedimentary Jurong
Formation (Rahardjo et
al., 2010)
Residual soil slope from
Bukit Timah Granite
(Rahardjo et al., 2010)
Weather Station

Evaporation Pan
(3) Evaporation (air & soil temperature)
Date
16-Oct-98 30-Oct-98 13-Nov-98 27-Nov-98 11-Dec-98 25-Dec-98
Te
mp
era
ture
(o
C)
22
24
26
28
30
32
34
36
38
Air temperature
Temperature of soil (midnight)
Temperature of soil (noon)
Date
0:00:00 4:00:00 8:00:00 12:00:00 16:00:00 20:00:00 0:00:00
Ts -
Ta (
oC
)
0
1
2
3
4
Noon (12:00 pm)
Night (12:00 am) Night (12:00 am)
Field Monitoring
Variations of air and soil
temperature for residual
soil slope from Bukit
Timah Granite (Rahardjo
et al., 2013)
Typical variation of
differences between air
and soil temperature for
residual soil slope from
Bukit Timah Granite
(Rahardjo et al., 2013)

Numerical Model
(Seepage Analysis)
t
h
g
m
y
h
y
k
x
h
x
k
y
hk
x
hk
w
wyx
yx
r
2
2
2
2
2
=+++
Seepage governing equation (two-dimensional)
0
20
40
60
80
100
120
140
160
Rai
nfa
ll in
ten
sity
(mm
/h)
Time, t (hours)0 1 2 3 4
No flow
Total head
No flow
0
Total head
No flow
Jln. Kukoh - Row C (26 September 2008)
Pore Water Pressure (kPa)-30 -20 -10 0 10 20 30 40 50 60
Ele
va
tion
, z (
m)
102
104
106
108
t = 0 (Numerical)
t = 2.5h (Numerical)
t = 5h (Numerical)
t = 0h (Field Data)
t = 5h (Field Data)
0.64 m depth
1.31 m depth
1.66 m depth2.08 m depth
Pore Water Pressure (kPa)
Ele
vati
on
(m)
Rainfall
Legend for Variables in Figures 11 and 12 kx = water coefficient permeability in the x-direction ky = water coefficient permeability in the y-direction ∂hw/∂x = hydraulic head gradient in the x-direction ∂hw/∂y = hydraulic head gradient in the y-direction m2w = coefficient of water volume change with respect to a change in matric suction
rw = density of water g = gravitational acceleration t = time c’ = effective cohesion W = the total weight of the slice of width “b” and height “h” b = the width of a slice uw = pore-water pressure
’ = effective friction angle
= the angle between the tangent to the center of the base of each slice and the horizontal FoS = factor of safety
Numerical Model
(Slope Stability Analysis)
FoS
mα
bW
m
'w
ub
Wc'
FoS
tansincos;
sin
tan
+=
+
=
Janlan Kukoh slope (Jurong Formation)(rainfall event 26 September 2008)Marsiling Road slope (Bukit Timah Granite)(rainfall event 11 March 2008)
, F
oS

43
• Uniform temperature and pressure, high
humidity and abundant rainfalls.
• Maximum rainfall in one year is usually observed
between December and January.
• The driest month in one year is usually in June.
• On 19 December 2006, Singapore experienced
the third highest amount of rainfall for one day
(366 mm) in 75 years.
Climatic Condition in Singapore
Prediction of Maximum Annual Rainfall in
Singapore (based on Historical Rainfall
Data from 1985 to 2014)
Jurong Pier
Choa Chu Kang (West)
Kranji Reservoir
Mandai
Macritchie Reservoir
Kampong Bahru
Tanjong Katong
Buangkok
Changi
9 weather stations are selected in this study
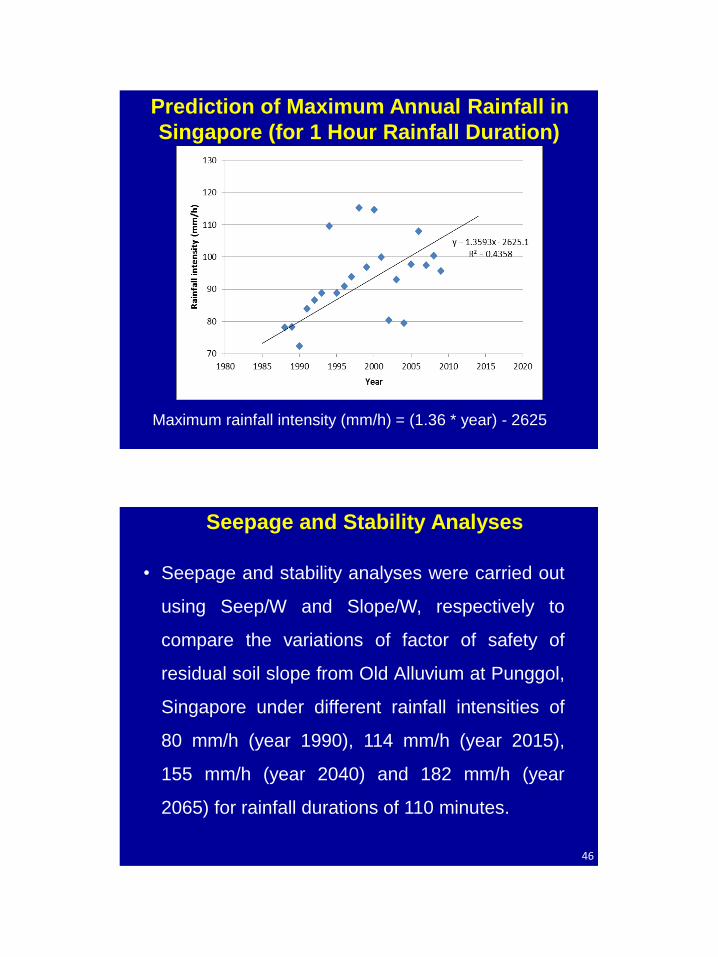
Prediction of Maximum Annual Rainfall in
Singapore (for 1 Hour Rainfall Duration)
Maximum rainfall intensity (mm/h) = (1.36 * year) - 2625
46
• Seepage and stability analyses were carried out
using Seep/W and Slope/W, respectively to
compare the variations of factor of safety of
residual soil slope from Old Alluvium at Punggol,
Singapore under different rainfall intensities of
80 mm/h (year 1990), 114 mm/h (year 2015),
155 mm/h (year 2040) and 182 mm/h (year
2065) for rainfall durations of 110 minutes.
Seepage and Stability Analyses

Numerical Model of Residual Soil Slope
from Old Alluvium at Punggol
= 20 kN/m3; c’ = 10 kPa; ’ = 30o; b = 15o
SWCC of Residual Soil from Old Alluvium
at Punggol
Matric suction, ua-uw (kPa)
10-2 10-1 100 101 102 103
Vo
lum
etr
ic w
ate
r co
nte
nt,
w
0.00
0.05
0.10
0.15
0.20
0.25
0.30
0.35
0.40
Air-entry value = 70 kPaFredlund and Xing (1994) fitting parameters:a = 48 kPan = 1.36m = 4.64

Permeability Function of Residual Soil from
Old Alluvium at Punggol
Matric suction, ua-u
w (kPa)
10-2 10-1 100 101 102 103
Co
efi
cie
nt
of
perm
eab
ilit
y,
kw
(m
/s)
1e-4
1e-5
1e-6
1e-7
1e-8
1e-9
1e-10
1e-11
1e-12
ks = 7.9e-6 m/s
Leong &Rahardjo (1997) fitting parameters:a = 19 kPab = 1.11c = 2.67p = 4.10
Variations of Factor of Safety with Year for
Residual Soil Slope from Old Alluvium at
Punggol in Singapore

Current Intensity-Duration-Rainfall (IDF)
Curve of Singapore
Current Intensity-Duration-Rainfall (IDF)
Curve of Singapore
Proposed equation for
best fitting IDF curve of
Singapore
Duration, td (min)
1 10 100 1000
Inte
ns
ity,
I T(m
m/h
)
10
100
1000
Return Period, Tr (years)
2
5
10
25
50
100
d
c
d
trT
b
t
II
+
=
expln

Review of IDF Curve of Singapore (based
on Historical Rainfall Data from 1990 to
2010)
Sedimentary Jurong Formation
Bukit Timah Granite
Old Alluvium
Legend:
1
2
3
4
56
7
8
9
10
11
12
13 14
15
Note: 1 = Kranji Reservoir; 2 = Tengah; 3 = Choa Chu Kang; 4 = Jurong West;
5 = Jurong Pier; 6 = Jurong East; 7 = Bukit Panjang; 8 = Sembawang;
9 = Macritchie Reservoir; 10 = Queenstown; 11 = Tanjong Pagar; 12 = Seletar;
13 = Serangoon; 14 = Paya Lebar; 15 = Changi
Prediction of Modified Intensity-Duration-
Rainfall (IDF) Curve of Singapore
Frequency distribution function (Gumbel, 1958):
SKPP TaveT +=
Amount of rainfall for certain rainfall duration, PT (mm):
Pave = the average of annual maximum rainfall for certain
rainfall duration (mm)
S = standard deviation of annual maximum rainfall for
certain rainfall duration (mm)

Prediction of Modified Intensity-Duration-
Rainfall (IDF) Curve of Singapore
Frequency distribution function (Gumbel, 1958):
+=
1lnln5772.0
6
r
rT
T
TK
Gumbel frequency factor, KT :
d
TT
t
PI =
Rainfall intensity, IT (mm/h):
td = rainfall duration (h)
Modified Intensity-Duration-Rainfall (IDF)
Curve of Singapore
Duration, td (min)
1 10 100 1000
Inte
ns
ity,
I T(m
m/h
)
10
100
1000 Best fitting
2
10
50
Return Period, Tr (years)

Modified Intensity-Duration-Rainfall (IDF)
Curve of Singapore
Duration, td (min)
1 10 100 1000
10
100
1000
Return Period, Tr (years)
5
25
100
Best fitting
58
• Seepage and stability analyses were carried out
using Seep/W and Slope/W, respectively to
compare the variations of factor of safety of
typical residual soil slope from Bukit Timah
Granite, Singapore under different rainfall
intensities of 22 mm/h (original IDF curve) and
36 mm/h (modified IDF curve) for rainfall
durations of 10 hours.
Seepage and Stability Analyses

No flow (Q=0)
Total head (H)
No flow (Q=0)
Total head (H)
Slope angle = 27o
Rainfall (q)
Numerical Model of Residual Soil Slope
from Bukit Timah Granite
= 20 kN/m3; c’ = 16.5 kPa; ’ = 26o; b = 13o
SWCC of Residual Soil Slope from Bukit
Timah Granite
Matric suction, ua-uw (kPa)
10-2 10-1 100 101 102 103 104 105 106
Vo
lum
etr
ic w
ate
r co
nte
nt,
w
0.0
0.1
0.2
0.3
0.4
0.5
0.6
Residual soil from Bukit Timah GraniteAir-entry value = 1 kPa

Permeability Function of Residual Soil
Slope from Bukit Timah Granite
Matric suction, ua
-uw
(kPa)10-1 100 101 102 103 104 105 106
Co
efi
cie
nt
of
pe
rme
ab
ilit
y,
kw
(m
/s)
1e-4
1e-5
1e-6
1e-7
1e-8
1e-9
1e-10
1e-11
1e-12
1e-13
Residual soil from Bukit Timah Granite
ks = 7e-5 m/s
Variations of Factor of Safety with Year for
Residual Soil Slope from Bukit Timah
Granite in Singapore
Time (Minutes)
0 5 10 15 20 25
Fa
cto
r o
f S
afe
ty,
Fo
S
1.0
1.1
1.2
1.3
1.4
22 mm/h for 10 hours (Original IDF curve)
36 mm/h for 10 hours (Modified IDF curve)
Rain stopped
Time (Hours)

Preventive measures
• Horizontal drain
• Vegetation or green technology
• Capillary barrier system
Preventive Measures to Maintain
Unsaturated Zone in Slope
64

Effect of Vegetation on Slope Stability at
Tampines, Singapore
Tensiometers
TE4TB4TA4
TE5TB5TA5
Notes:
TE4, TE5 =Tensiometers with 0.3 m depth
TA4, TA5 = Tensiometers with 0.6 m depth
TB4, TB5 = Tensiometers with 1.2 m depth
Rain GaugeSolar Panel
Data Acquisition
System (DAS)Green Technology
using Shrub
(Orange Jasmine) Green
Technology
using Grass
(Vetiver)
Vetiver
characteristics
It has massive fine
structured root system
which can grow very fast.
In some cases the root
system can grow up to 2-4
meter in depth.

Factor of Safety Variations for Slope with
and without Vegetative Cover (Rahardjo et
al., 2014)F
ac
to
r o
f S
afe
ty, F
oS
1.0
1.5
2.0
2.5
3.01
Au
g 1
0
8 A
ug
10
15
Au
g 1
0
22
Au
g 1
0
29
Au
g 1
0
5 S
ep
10
12
Sep
10
19
Sep
10
26
Sep
10
3 O
ct 1
0
10
Oc
t 1
0
17
Oc
t 1
0
24
Oc
t 1
0
31
Oc
t 1
0
7 N
ov 1
0
14
No
v 1
0
21
No
v 1
0
28
No
v 1
0
5 D
ec
10
12
De
c 1
0
19
De
c 1
0
26
De
c 1
0
2 J
an
11
Date
Ra
infa
ll In
te
ns
ity, m
m/h
0
50
100
150
200
Original Slope without vegetation
Slope with Vetiver grassSlope with Orange Jasmine
Capillary Barrier System (CBS) for
Minimizing Rainwater Infiltration

Construction of Coarse-grained Layer
69
Construction of Fine-Grained Layer

Constructed Capillary Barrier for Slope
Repair
Tensiometers for Studying the
Effectiveness of Capillary Barrier in the
Field

CBS with recycled
concrete aggregate
for coarse grained
layer
CBS with
geodrain for
coarse
grained layer
Green Technology
using Shrub
(Orange Jasmine)
Green
Technology
using Grass
(Vetiver)
Depth of Tensiometers:
TA1 = 0.63 m TA2 = 0.61 m TA3 = 0.67 m
TB1 = 1.18 m TB2 = 1.23 m TB3 = 1.29 m
TC1 = 1.48 m
TD1 = 1.76 m TD2 = 1.81 m TD3 = 1.84 m
TA1 TB1 TC1 TD1 TA2 TB2 TD2
Tensiometers
Capillary Barrier System at Tampines
TA3 TD3TB3
Original slope
Factor of Safety Variations for Slope with
and without Capillary Barrier System
Fa
cto
r o
f S
afe
ty,
Fo
S
1.0
1.5
2.0
2.5
3.0
3.5
Slope with capillary barrier system
Original slope without capillary barrier system
1 J
un
10
8 J
un
10
15
Ju
n 1
0
22
Ju
n 1
0
29
Ju
n 1
0
6 J
ul 1
0
13
Ju
l 1
0
20
Ju
l 1
0
27
Ju
l 1
0
3 A
ug
10
10
Au
g 1
0
17
Au
g 1
0
24
Au
g 1
0
31
Au
g 1
0
7 S
ep
10
14
Se
p 1
0
21
Se
p 1
0
28
Se
p 1
0
5 O
ct
10
12
Oct
10
19
Oct
10
26
Oct
10
2 N
ov 1
0
9 N
ov 1
0
16
No
v 1
0
23
No
v 1
0
30
No
v 1
0
7 D
ec 1
0
14
De
c 1
0
21
De
c 1
0
28
De
c 1
0
4 J
an
11
Date
Ra
infa
ll In
te
ns
ity, m
m/h
0
50
100
150
200

Slope Safety Preparedness in Singapore
Singapore Land Authority (SLA)
• SHARES – Slope Hazard Analysis & Repository System
Combination of geospatial tools and analytical Hierarchy
Process (AHP)

Capturing of data from past
slope failures
Displaying captured past slope
failure
Resultant map classified into
different categoriesProximity-impact analysis
SHARES
Development of Landslides Susceptibility
Model for Singapore

Rainfall Triggered Slope Failure
Zone 2 Zone 3
Zone 4
Building and Construction Authority (BCA)
• Building Control Regulation

• 3-stage slope management system
Building and Construction Authority (BCA)
Pro-active initiatives:
1. The mandatory periodic structural inspection (PSI) regime is one that is proactive and unique to Singapore.
2. BCA conducts public seminars to communicate with the public highlighting regular inspection and maintenance are critical as the slope stability
Building and Construction Authority (BCA)

• Response to dangerous slope incident
Building and Construction Authority (BCA)
Summary for Singapore
Slope failures occurred during or after rainfall
Singapore government uses a combination of geospatial
tools and analytical hierarchy process (AHP) to create a
slope hazard analysis and repository system (SHARES)
Vision of SHARES: identification of susceptible locations,
and implementation of slope protection and crucial
preventive measures
Development of Landslide Susceptibility Model for
Singapore

Slope Safety Preparedness in Thailand
Landslide at Padae Tak, Northern Thailand
Landslide occurred after 3 continuous days of rainfall (total
amount of rainfall = 300 mm)

Landslides and rainfall history
Padae Tak, Northern Thailand Natum, Surathani, Southern Thailand
Relationship between Rainfall Pattern and
Landslides in Thailand

Departments of Highways, Water Resources, Mineral
Resources and Petroleum are active in mitigation of
landslide risks including use of bio-engineering technique.
Kasetsart University has been active in understanding the
hydro-mechanical properties of unsaturated residual soils
and interaction between climate and slope stability.
Monitoring Granitic Fill Slope (covered with
Vetiver and local grasses) at Doi-intanon,
Chiangmai using tensiometers
2.606.80
7.70
10.80
-0.500.80
4.90
2.50
2.501.40
5.40
-1.40
0.00
Plot A-
Pore water pressure contour, kPa
27-02-11
-7.70
-5.40
0.30
-11.70
-10.50
-12.80
-9.20
-9.10
0.00
0.30
3.80
-1.40-0.30
27-02-11
15-09-11
10 m
Shallow failure occurred at Maximum daily rainfall of 100 mm with 3-day antecedent rainfall of 180 mm

Field Instrumentation at a Reinforced Slope
in Mae-Lana, Thailand
Pore-water Pressure Distributions within 10
m Depth of Soil at a Reinforced Slope in
Mae-Lana, Thailand

Adaptive measure
• Soil bio-engineering (use of vegetation)
Bamboo Slope grating with vetiver grass
Installation (14/Dec/12) 5/Apr/13 (4 months) 3/Aug/13 (8 months) 16/Dec/13 (1 year)
Vetiver grass :
- very dense fine vertical root system
- making it very effective for slope stabilization
- reduction of runoff erosive energy and sediment trap
Technology for landslide warning system
Simple cylinder raingauge Telemetry weather station
Several attempts have been made to develop hazard map, low-
cost landslide warning box.
However, most local communities still rely on daily rainfall as
measured by raingauge based on rainfall envelope concept.

Summary for Thailand
Rainfall is the key triggerring factor of landslide in Thailand
Characterization of unsaturated soil properties were carried
out to understand the effect of rainfall on slope stability
Slopes were instrumented to monitor the changes in pore-
water pressures within residual soil slope during and after
rainfall as well to provide landslide warning system
Bio-engineering (i.e. vetiver grass) was used as slope
preventive measure
Slope Safety Preparedness in Vietnam

Climate change & Sea level rise in Vietnam
• Temperature (1951-2000)
- Annual temperature has increased by 0.7°C
- Overall temperature in 2100 is likely to increase by 2.1 -
3.6°C in the high emission scenario. (Nguyen, 2009)
• Rainfall (1911-2000)
-The most common amount of rainfall recorded is about 1400
to 2400mm.
- The precipitation will increase, generally around 2% - 10%.
• Sea level riseScenario Time
2020 2030 2040 2050 1060 2070 2080 2090 2100High (cm) 12 17 24 33 44 57 71 86 100
Medium (cm) 12 17 23 39 37 46 54 64 74
Rainfall-induced landslides
Number Time Location of Landslide Rainfall Intensity
1 11 – 1964 Que Son, Quang Nam 300 – 1000 mm
2 10 – 1969 Quan Cay, Thai Nguyen 600 – 700 mm
3 12 – 1986 Son Tra, Quang Ngai 500 – 1227 mm
4 08 – 1996 Muong Lay, Lai Chau 300 – 400 mm
5 11 – 1999 Phu Loc, Thua Thien Hue Approximately 1000 mm
6 09 – 2002 Huong Son, Ha Tinh 500 – 700 mm
7 09 – 2005 Van Chan, Yen Bai Approximately 300 mm
Sliding along the national highway (8/2005) Lanslide in Bat Xat – Lao Cai in 27/09/2005

Rainfall-induced landslides
• It is expected that climate change will bring more rainfalls to
Vietnam with higher intensity and longer duration.
• Vietnam has 75% of the land in mountainous areas
• Analysis of slope along highway at Tam Ky – Tien Phuoc
considering the saturation of the initially unsaturated zone during
rainfall.
Rainfall-induced Dykes Problem
Hai Hau sea dyke broke due to
Storm (27 Sep 2005)Effect of overtopping at Haiphong
dyke after Typhoon (2005)
If the sea level rises by 0.2 and 0.6 meters, 100 – 200 thousandhectares of Vietnamese plains are predicted to be submerged.
A one meter rise of sea level would result in 0.3 – 0.5 million hectaresof the Red River Delta will be under water and 90% of the MekongDelta will be flooded.

Adaption to sea level rise
• Vietnamese government approved a program to upgrade sea
dykes.
• The 13 provinces involved have reinforced 272km of sea
dykes, renovated or built 42 sluices and planted more than
130 ha of wave blocking trees.
• In Ha Tinh province alone, 100 km of sea dykes have been
improved.
• Vietnamese government is planning on constructing 6
embankments and commencing 13 projects on constructions
of sea dykes.
Summary for Vietnam
• Significant impact due to climate change: significant
rise in sea level and heavy rainfall
• Rainfall is the main factor affecting landslides
• Safety preparedness: construction of sea dyke,
numerical analyses to observe the variations of
factor of safety during and after rainfall

Slope Safety Preparedness in Malaysia
Mean Annual Maximum Temperature Trend
in Malaysia (oC / 10 years)

Key Features of Landslides in Malaysia
• Landslides are a big problem in Malaysia
• Increased rainfall has also affected water level, resulting in serious problem in slope stability
• Annual rainfall intensity: over 2500mm
• Shallow failures: less than 4 m deep
Landslides in Malaysia
• 80 landslides occurred along the road from the main
highway to Genting Sampah since 1993 (some of
them were observed after continuous rain for more
than 72 hours on 30th June 1995)
• 21 Landslides in Hulu Kelang between 1990 and
2011
• Major landslides in Bukit Gasing and Paya Terubong
in 2013

Landslides in Paya Terubong, Malaysia
(2013)
Adaptive Measure using Live Pole
Live pole technique Trial steps for live pole

The influences of Ht/Ds roots on the slope FS increased from 0.93 to 1.11 (20%) (Mafian, 2009)
Adaptive Measure using Hibiscus Tiliaceus
(Ht) and Dillenia Suffruticosa (Ds)
Bending strength of Ds and Ht Live pole treated slope in 2014
Summary for Malaysia
• The significant effect of climate change is in the
increase in rainfall intensity and groundwater table
• Rainfall is the most important factor triggering
landslides
• Slope safety preparedness: vegetative cover (i.e.
live pole)

Slope Safety Preparedness in Indonesia
Climatic Condition in Indonesia
Trend of precipitation in West Java
Indonesia is analyzing the historical data in order to predict the rainfall intensity in the future.

Climatic Condition in Indonesia
Climate change prediction from AR4
2080
The annual change of average temperature in 2080 will be about 2.49°C and the increase of precipitation will be about 5.1%
Key features of Landslide in Indonesia
• Java is composed of clayshale and expansive soils
Distribution of landslides in Java area and its geomorphology
More than 250 landslides occurred in Indonesia (2003-2007).
More than 56% were in West Java.

Statistics of Landslides in Indonesia
between 2003 and 2007 (LIPI-Geoteknologi)
West Java15856%Central Java
6021%
East Java145%
North Sumatera124%
West Sumatera124%
North Sulawesi 8
3%
West Sulawesi 3
1%
Central Sulawesi3
1%
NTT9
3%
East Kalimantan3
0%
Papua2
1%
Aceh1
0%
South Sulawesi1
0%
KEJADIAN GERAKAN TANAH DI BEBERAPA PROVINSI DI INDONESIA
2003 - 2007
Reactivation of old landslides
Volcanic breccia was deposited on top of clayshale very long time
ago as lahar flows after volcano eruption.
Clayshale is material that is degrading fast due to exposure.
The inclination of clayshale boundary with the breaccia enable
creep or even sliding of the breccia over clayshale.
Clayshale and severe rainfall can cause foundation movement.

Summary for Indonesia
• Significant effects of climate change is the increase in
temperature and rainfall
• Rainfall is the main factor causing landslides
• 56 % Landslides occur in West Java since this area
consists mostly of clayshales and expansive soils
• Reactivation of old landslides is commonly occurring
• It is likely that land use change and human activity will
have a greater impact on landslide frequency than
climate change over the next 80 years
Conclusions
1. Climate change results in the increase in rainfall intensity in
Southeast Asia.
2. Many slope failed during or several days after rainfall in
Singapore, Indonesia, Vietnam, Malaysia and Thailand.
3. Characterization of climatic data (rainfall, wind speed,
temperature, relative humidity) is necessary for
assessment the effect of climate change on slope stability.
4. Characterization of unsaturated soil zone, which is in direct
contact with the environment, is required for understanding
the effect of climate change (infiltration and evaporation) on
the dynamic factor of safety of slope.

Conclusions
5. Appropriate characterization of unsaturated soil properties
(soil-water characteristic curve, permeability function) is
necessary for accurate seepage and stability analyses.
6. Singapore is developing landslide susceptibility map
(SHARES) to address the effect of climate change on slope
stability.
7. Thailand is developing early warning system and landslide
hazard mapping for adaptation and preparedness against
the effect of climate change on slope stability
Conclusions
8. Vietnam is developing a software that can predict slope
failure due to climate change. In addition, they are also
constructing dykes to address the problem on the sea level
rising due to climate change.
9. Malaysia is adopting green solution (vegetation) to address
the problem on rainfall-induced slope failures due to
climate change.
10. Indonesia is analyzing the historical data in order to predict
the rainfall intensity in the future.

Thank you
Comparison between Predicted and
Measured Rainfall Intensity at Penggaron
Bridge, West Java, Indonesia
Rain
fall
in
ten
sit
y (
mm
)
800
700
600
500
400
300
200
100
0
Actual
Predicted
Oct Nov Dec Jan Feb Mar Apr May Jun Jul Aug Sep Oct Nov Dec Jan Feb
2011
2012
2013

• Intergovernmental
Panel of Climate
Change (IPCC,
1990, 2013)
Global Climate Change
• Kyoto Protocol (Oberthur and Ott, 1999)
Global Climate Change

• Kyoto Protocol (Schiermeier, 2012)
Global Climate Change
• The impact of climate across nations and sectors: food,
increase in groundwater table , ice melting, extreme weather
(high rainfall, high temperature, strong winds & floods) –
Stern (2007)
• High rainfall intensity in: United States (Kunkel, 2003);
Australia (Groisman et al., 2005); South Africa (Mason et al.,
1999); United Kingdom (Osborn et al., 2000); Europe
(Forland et al., 1998); China (Zhai et al., 2005); Japan
(Fujibe, 2008)
Studies on Climate Change

• Modification of IDF curve is necessary for future climate
scenario (Mirhosseini et al. 2013)
• Development rainfall model using spatial and temporal
variability in West Africa (El-Hadji & Singh, 2002); United
Arab Emirates (Sherif et al., 2011)
• Analyses of changes in rainfall pattern to define the design
parameters of water sensitive urban design in Australia
(Chowdhury & Beecham, 2010)
Studies on Climate Change
Effect of Climate Change on Slope Stability
• Majority of slope failures occurred during rainfall
Slope failures in Naples (Evangelista et al.,
2008; Papa et al., 2008)
Hong Kong (Brand, 1992)
Malaysia (Liew et al., 2004)
Singapore (Pitts, 1985; Tan et al., 1987;
Chatterjea, 1989; Lim et al., 1996; Toll et al.,
1999; Rahardjo et al., 2001)

Effect of Climate Change on Slope Stability
• In UK, Glendinning et al. (2009) set up the BIONICS
project (biological and engineering impacts of climate
change on slopes).
Vegetation contributed to the sustainability of slope
infrastructure.
Climate changes are followed by changes in weather
patterns.
Longer dry season and higher intensity of rainfall
during wet season.
Effect of Climate Change on Slope Stability
• In Switzerland, Springman and Teysserie (2001) and
Springman et al. (2003) instrumented several slopes to
study the effect of climate change on slope stability.
Rainfall and snowmelt were the most important
triggering factors for slope failures in Switzerland.
Majority of slope failures are deep seated failures.

Effect of Climate Change on Slope Stability
Landslide in Seoul, South Korea
Effect of Climate Change on Slope Stability
Landslide in Taiwan on 26 April 2010

Effect of Climate Change on Slope Stability
Landslide near Daning River, Wushan
county, Chongqing, China on 24 June 2015
Field Monitoring
P1
P2
P3
Rain
gauge
Tensiometer
Soil moisture
sensor
Temperature
sensor
A B C D
Runoff
boundary
Flume
Weather
station
Rain gauge
Piezometer
Time-domain
Reflectometry
Tensiometer
Weather
station
Data logger
Solar panel
Temperature sensor
Solar panelData logger
Notes:
P = piezometer
A, B, C, D = tensiometer
and soil moisture sensor
at different depth
Instrumented slope
(Rahadjo et al., 2014)
Jurong Formation
Bukit Timah Granite
Old Alluvium
Instrumented slope
(Rahadjo et al., 2003a)
• To clarify and investigate the effects of flux boundary

Effect of Climate Change on Slope Stability
Slope failure in NTU campus, Singapore (2012)