slovakiarep epra nav per share - aere.com co ppt fy13 post imf- apr... · georgianet ltv: turkey...
TRANSCRIPT


GEORGIA
TURKEY
BULGARIA
ROMANIA HUNGARY
SLOVAKIA CZECH
REP
• LATVIA
• The only listed property player focused 100% on Central and Eastern European (incl. Russian) retail markets
• Investment grade credit rating by S&P and Fitch
• 153 income producing properties with a market value of €2.4bn (1.3m sqm GLA)
• Focus on shopping centres, primarily supermarket anchored
• 12M13 GRI: €203.5m, growth of +5.2%
• 12M13 NRI: €190.8m, growth of +5.3%
• Adjusted EPRA EPS: €0.335, growth of +3.4%
• Development and land portfolio: €583.6m
• Cash: €305.6m
• EPRA NAV per share: € 6.43
• Gross LTV: 27.3%
• Net LTV: 16.9%
Key events 2013 – YTD:
• April 2013 – first unsecured corporate bond placed (€350m)
• August 2013 – acquisition of Galeria Dominikanska in Wroclaw, Poland (€151.7m)
• Completion and opening of Atrium Felicity in Lublin
• Launch of Atrium Copernicus extension in Torun
All numbers as reported in the 12M 2013 results to 31 December 2013 unless explicitly stated otherwise 2
Research coverage by HSBC, Kempen & Co, Wood & Co and Baader
0.24 0.250.28
0.32 0.34
0.03
0.12 0.140.17
0.21
0.00
0.05
0.10
0.15
0.20
0.25
0.30
0.35
0.40
2009 2010 2011 2012 2013
Adjusted EPRA earnings per share Dividend per share p.a.
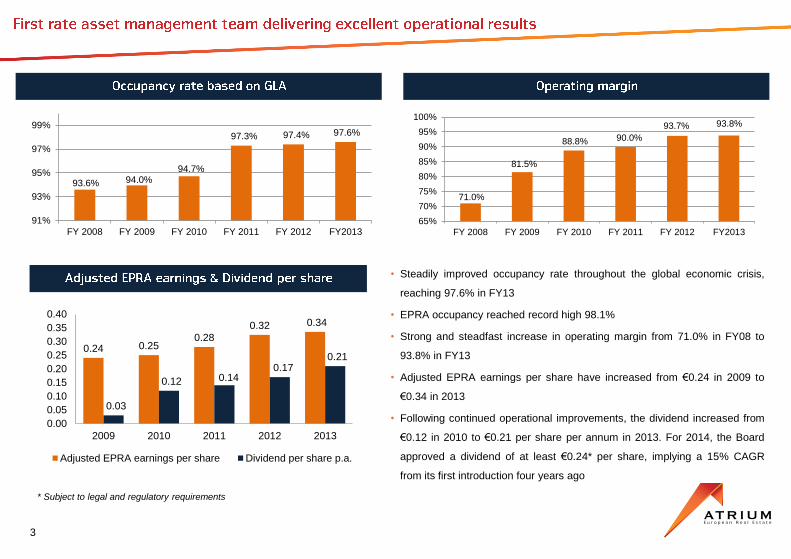
• Steadily improved occupancy rate throughout the global economic crisis,
reaching 97.6% in FY13
• EPRA occupancy reached record high 98.1%
• Strong and steadfast increase in operating margin from 71.0% in FY08 to
93.8% in FY13
• Adjusted EPRA earnings per share have increased from €0.24 in 2009 to
€0.34 in 2013
• Following continued operational improvements, the dividend increased from
€0.12 in 2010 to €0.21 per share per annum in 2013. For 2014, the Board
approved a dividend of at least €0.24* per share, implying a 15% CAGR
from its first introduction four years ago
* Subject to legal and regulatory requirements
3
93.6% 94.0%94.7%
97.3% 97.4% 97.6%
91%
93%
95%
97%
99%
FY 2008 FY 2009 FY 2010 FY 2011 FY 2012 FY2013
71.0%
81.5%
88.8% 90.0%
93.7% 93.8%
65%
70%
75%
80%
85%
90%
95%
100%
FY 2008 FY 2009 FY 2010 FY 2011 FY 2012 FY2013

ROMANIA HUNGARY
SLOVAKIA CZECH REP
LATVIA
• 100% focus on Central and Eastern Europe (CEE) including Russia
• 97% /96% of income producing portfolio by value / income is located in investment grade rated countries by Fitch ratings
• 78% of the total 12M 2013 GRI is denominated in Euros, 10% in Czech Korunas, 5% Polish Zlotys, 4% in USD and 3% in other currencies
Atrium distinguishes its markets between three types of regions based on several considerations:
Central CEE Countries (75% by MV or €1,765m; 65% by NRI or €124m in 12M13): Poland, Czech Republic and Slovakia.
All three countries are rated A- and above by the leading credit rating agencies. They are expected to enjoy the strongest growth in the region
Southern-Eastern CEE Countries (6% by MV or €136m; 7% by NRI or €13m in 12M13): Hungary and Romania.
The countries’ risk profile is considered medium in the long term. Their outlook is becoming more positive despite possible political uncertainties
Eastern CEE Countries (19% by MV or €455m; 28% by NRI or €54m in 12M13): Russia and Latvia.
Considered emerging CEE markets due to the different risk profile (operational, legal, financial)
Atrium’s SI portfolio exposure by country type
by MV by NRI
74%7%
19%
Exposure of SIs by MV (YE-12)
Central CEE countries
Southern-Eastern CEE countries
Eastern CEE countries4
75%
6%
19%
Exposure of SIs by MV (30.09.13)
Central CEE countries
Southern-Eastern CEE countries
Eastern CEE countries
65%7%
28%
Exposure of SIs by NRI (9M 2013)
Central CEE countries
Southern-Eastern CEE countries
Eastern CEE countries

Central CEE countries
Poland is one of the best performing countries within CEE and ranks high in ease of doing business/ transparency
The country has become an established CEE destination for both real estate investors and global retailers
In 2013, the Polish GDP grew by +1.6% y-o-y and retail sales increased every month (Dec: +6.7% y-o-y)
The Czech economy has exited its recession in 2013 and is currently expected to return to steady growth
2013 GDP contracted by -0.9% y-o-y as domestic demand was weak but is strengthening as the outlook is better
Slovakia’s prospects for 2013 are of positive growth; also, the market is investor-friendly and relatively transparent
In 2013, the Slovak GDP grew by +0.9% y-o-y, driven by a broad-based recovery, but retail sales remain volatile
All three countries are perceived as relatively stable with an investor-friendly, mature business environment
Southern-Eastern CEE countries
Hungary is expected to perform better in 2014 as the economy is showing signs of stabilization/ improvement
In 2013, the Hungarian GDP recorded positive growth of +1.1% y-o-y as consumer spending started to recover
Romania maintains positive growth but more reforms are necessary business- and transparency- wise
In 2013, the Romanian GDP grew by a surprisingly high +3.5%, but retail sales remain volatile as credit is tight
Both countries are perceived as having strong long term potential but face various macro and/ or political issues
Eastern countries
Russia has had a strong performance over the past years and is expected to continue growing, albeit more slowly
In 2013, Russian GDP once again grew by +1.3% y-o-y and retail sales rose every month (Dec: +3.9% y-o-y)
Central CEE countries
Southern- Eastern CEE countries
Eastern countries
SC - Shopping Centre(s); f - forecast;. “Doing business” rankings include 189 countries; the JLL transparency index ranks 97 countries.
Sources: IMF, Capital Economics, Cushman & Wakefield, JLL, Fitch Ratings, World Bank
The internal classification of the countries largely follows the factors underlying the basic fundamentals of
credit rating agencies approach, comprising a wide spectrum of aspects:
Economic – economic structure and growth prospects;
Political – institutional effectiveness and political risks;
Legislative – rule of law, property rights and doing business;
External – external liquidity and international investment position.
5
Indicator PolandCzech
RepublicSlovakia
Fitch country rating A-/ Stable A+/Stable A+/Stable
2013 GDP growth (%) 1.6% -0.9% 0.9%
2014f GDP growth (%) 3.1% 1.9% 2.3%
2014f inflation (%) 2.1% 1.2% 1.6%
2014f unemployment (%) 10.2% 6.7% 13.9%
2014 ease of doing business 45 75 49
2012 JLL transparency rank 19 24 36
SC yield, gross (%), 4Q13 5.75% 5.50% 7.25%
Indicator Hungary Romania
Fitch country rating BB+/Stable BBB-/Stable
2013 GDP growth (%) 1.1% 3.5%
2014f GDP growth (%) 2.0% 2.2%
2014f inflation (%) 2.9% 3.5%
2014f unemployment (%) 9.4% 7.2%
2014 ease of doing business 54 73
2012 JLL transparency rank 26 40
SC yield, gross (%), 4Q13 7.25% 8.50%
Indicator Russia
Fitch country rating BBB/Negative
2013 GDP growth (%) 1.3%
2014f GDP growth (%) 1.3%
2014f inflation (%) 5.3%
2014f unemployment (%) 6.2%
2014 ease of doing business 92
2012 JLL transparency rank 37
SC yield, gross (%), 4Q13 9.00%

• On a like-for-like basis Atrium achieved
growth in both GRI and NRI, with increases
of 3.3% to €197m and 3.7% to €185m,
respectively. This was predominantly driven
by the strong like-for-like performance in
Poland and Russia
• Like-for-like rental growth in Russia was
driven by indexation, higher turnover rents
and GML, as well as increased occupancy.
These were driven, among others, by the
significant restructuring undergone by
several assets in the past three years
NRI L-F-L change, €m, (%)
GRI L-F-L change, €m, (%)
6.2 (3.3%)
5.8 (11.3%)
0.9 (1.2%)
0.3 (31.2%)
0.1 (1.0%)
0.0 (0.1%)
-0.1 (-0.3%)
-0.8 (-9.3%)
-1.0 1.0 3.0 5.0 7.0
Group Total
Russia
Poland
Latvia
Romania
Slovakia
Czech Republic
Hungary
EPRA like-for-like GRI change, €m, (%)
6.6 (3.7%)
5.5 (12.0%)
1.9 (2.6%)
0.3 (71.7%)
0.0 (0.2%)
-0.1 (-0.5%)
-0.4 (-1.0%)
-0.7 (-9.7%)
-1.0 1.0 3.0 5.0 7.0
Group Total
Russia
Poland
Latvia
Romania
Slovakia
Czech Republic
Hungary
EPRA like-for-like NRI change, €m, (%)
6
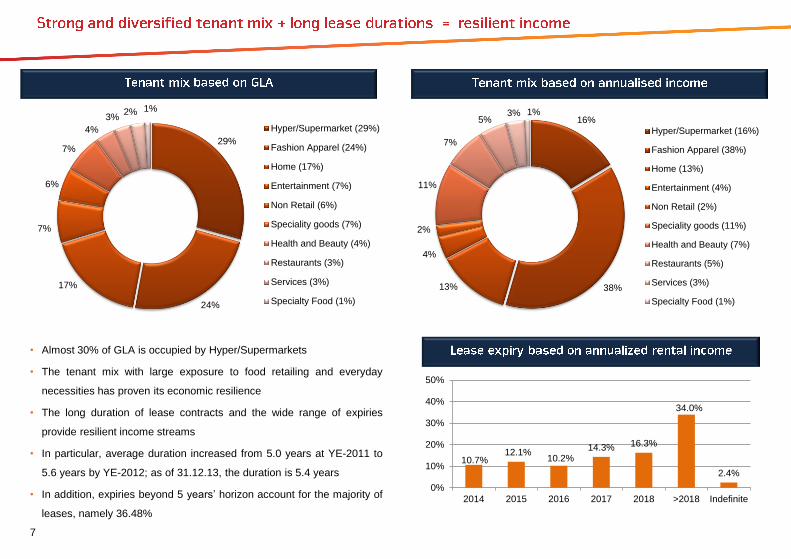
• Almost 30% of GLA is occupied by Hyper/Supermarkets
• The tenant mix with large exposure to food retailing and everyday
necessities has proven its economic resilience
• The long duration of lease contracts and the wide range of expiries
provide resilient income streams
• In particular, average duration increased from 5.0 years at YE-2011 to
5.6 years by YE-2012; as of 31.12.13, the duration is 5.4 years
• In addition, expiries beyond 5 years’ horizon account for the majority of
leases, namely 36.48%
7
10.7%12.1%
10.2%14.3% 16.3%
34.0%
2.4%
0%
10%
20%
30%
40%
50%
2014 2015 2016 2017 2018 >2018 Indefinite
16%
38%13%
4%
2%
11%
7%
5%3% 1%
Hyper/Supermarket (16%)
Fashion Apparel (38%)
Home (13%)
Entertainment (4%)
Non Retail (2%)
Speciality goods (11%)
Health and Beauty (7%)
Restaurants (5%)
Services (3%)
Specialty Food (1%)
29%
24%
17%
7%
6%
7%
4%
3%2% 1%
Hyper/Supermarket (29%)
Fashion Apparel (24%)
Home (17%)
Entertainment (7%)
Non Retail (6%)
Speciality goods (7%)
Health and Beauty (4%)
Restaurants (3%)
Services (3%)
Specialty Food (1%)

• The top 10 tenants are represented mainly by international retail companies and generate 25% of annualised rental income:
8
* Annualised rental income as of 31.12.2013
** In 2012, Metro Group sold its CEE Real operations to Auchan. The takeover has been approved in Russia, Ukraine, Romania and was conditionally approved in Poland (pending).
Real Poland is presented as part of Metro Group
Group name Brands DescriptionPublic/
Private
Brands in
Atrium's portfolio% of ARI*
No of
outlets,
worldwide
Sales 2012
€ Bn,
worldwide
Regions of
operations
S&P credit
rating
ASPIAG International food retail chain Private Spar, Interspar 4.6% 12,329 32.035 countries (Europe,
Africa and Asia)Not rated
Metro Group
One of the world’s largest
retailers; operates food retailer
Real** & electronics retailers
MediaMarkt and Saturn
Public Real, MediaMarkt 4.2% 2,221 66.729 countries (Europe,
Africa and Asia)BBB-/ Stable
AholdInternational group of
supermarket companiesPublic Albert, Hypernova 3.4% 3,131 32.8
5 countries (Europe and
USA)BBB/ Stable
LPP
Fashion retailer in CEE (owns
several brands: Reserved,
CROPP TOWN, Home&You,
Mohito, Esotiq)
Public
Reserved, Cropp
Town, House,
Home&You, Mohito,
Re-Kids
3.3% 1,320 0.813 countires (CEE and
Middle East)Not rated
AFM
Association de la Famille Mulliez
(AFM), owns Auchan, has
majority stakes in sports goods
retailer Decathlon and DIY
retailer Leroy Merlin
PrivateAuchan, Decathlon,
Leroy Merlin1.9% 1,495 46.9
13 countries (Europe
and Asia)A/ Negative
Hennes & Mauritz"Value for money" international
fashion retailerPublic H&M 1.7% 3,132 16.2
53 countries (Asia,
Europe, North America,
Middle East and Africa)
Not rated
Tengelmann
Group
OBI is one of the leading
European DIY brands. Kik is a
fashion and apparel discounter
Private OBI, Kik 1.6% 4,346 11.118 countries (Western
Europe and CEE)Not rated
InditexThe largest clothing and apparel
fashion retailerPublic
Zara, Bershka, Pull
& Bear1.6% 6,249 15.9
86 countries (Asia,
Europe, North America,
Middle East and Africa)
Not rated
KingfisherHome improvement (DIY) retail
groupPrivate Castorama 1.4% 1,080 13.0
9 countries (Europe and
Asia)BBB-/ Stable
EMFMultimedia, fashion & children's
products retail groupPublic Empik, Smyk 1.3% 631 0.8
7 countries (Europe and
Asia)Not rated
9
**
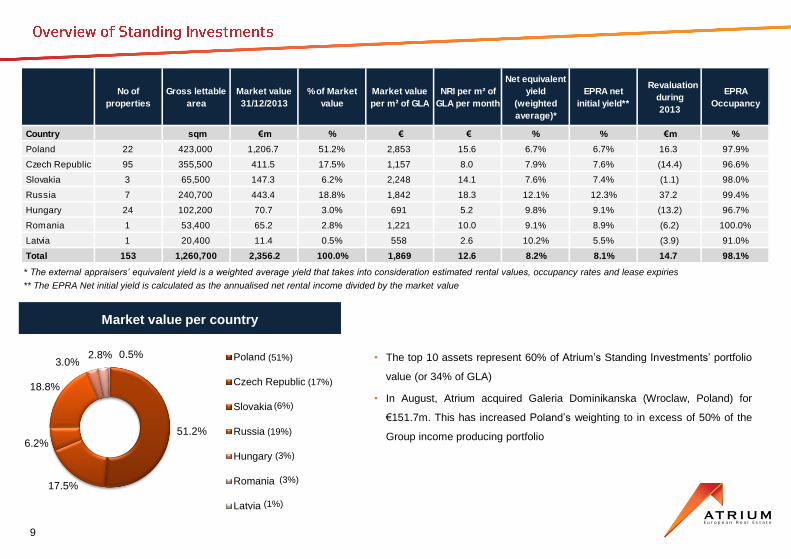
Market value per country
* The external appraisers’ equivalent yield is a weighted average yield that takes into consideration estimated rental values, occupancy rates and lease expiries
** The EPRA Net initial yield is calculated as the annualised net rental income divided by the market value
Poland
Czech Republic
Slovakia
Russia
Hungary
Romania
Latvia
(51%)
(17%)
(6%)
(19%)
(3%)
(3%)
(1%)
• The top 10 assets represent 60% of Atrium’s Standing Investments’ portfolio
value (or 34% of GLA)
• In August, Atrium acquired Galeria Dominikanska (Wroclaw, Poland) for
€151.7m. This has increased Poland’s weighting to in excess of 50% of the
Group income producing portfolio
No of
properties
Gross lettable
area
Market value
31/12/2013
% of Market
value
Market value
per m² of GLA
NRI per m² of
GLA per month
Net equivalent
yield
(weighted
average)*
EPRA net
initial yield**
Revaluation
during
2013
EPRA
Occupancy
Country sqm €m % € € % % €m %
Poland 22 423,000 1,206.7 51.2% 2,853 15.6 6.7% 6.7% 16.3 97.9%
Czech Republic 95 355,500 411.5 17.5% 1,157 8.0 7.9% 7.6% (14.4) 96.6%
Slovakia 3 65,500 147.3 6.2% 2,248 14.1 7.6% 7.4% (1.1) 98.0%
Russia 7 240,700 443.4 18.8% 1,842 18.3 12.1% 12.3% 37.2 99.4%
Hungary 24 102,200 70.7 3.0% 691 5.2 9.8% 9.1% (13.2) 96.7%
Romania 1 53,400 65.2 2.8% 1,221 10.0 9.1% 8.9% (6.2) 100.0%
Latvia 1 20,400 11.4 0.5% 558 2.6 10.2% 5.5% (3.9) 91.0%
Total 153 1,260,700 2,356.2 100.0% 1,869 12.6 8.2% 8.1% 14.7 98.1%
51.2%
17.5%
6.2%
18.8%
3.0%2.8% 0.5%
Poland
Czech Republic
Slovakia
Russia
Hungary
Romania
Latvia
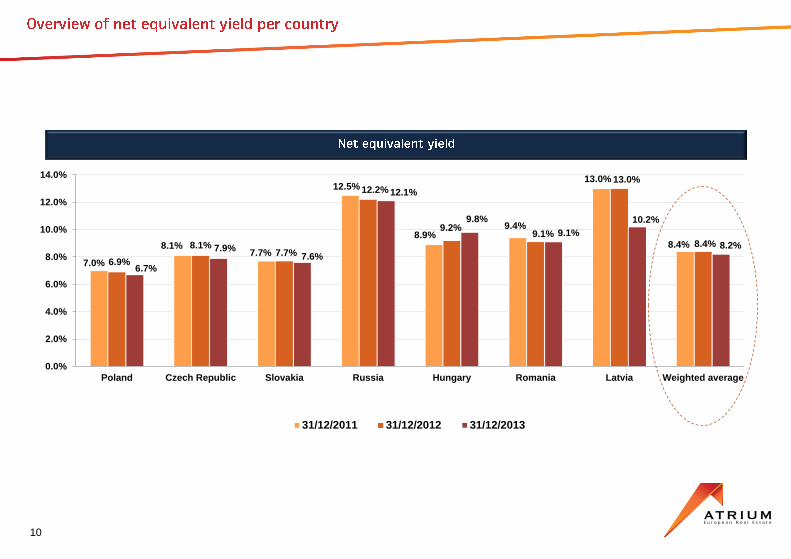
7.0%
8.1%7.7%
12.5%
8.9%9.4%
13.0%
8.4%
6.9%
8.1%7.7%
12.2%
9.2%9.1%
13.0%
8.4%
6.7%
7.9%7.6%
12.1%
9.8%
9.1%
10.2%
8.2%
0.0%
2.0%
4.0%
6.0%
8.0%
10.0%
12.0%
14.0%
Poland Czech Republic Slovakia Russia Hungary Romania Latvia Weighted average
31/12/2011 31/12/2012 31/12/2013
10

7.0%
7.9% 7.8%
12.5%
8.2%
9.0%
2.0%
8.3%
7.0%7.8% 7.5%
12.6%
8.8% 8.8%
2.4%
8.3%
6.7%7.6% 7.4%
12.3%
9.1%8.9%
5.5%
8.1%
0.0%
2.0%
4.0%
6.0%
8.0%
10.0%
12.0%
14.0%
Poland Czech Republic Slovakia Russia Hungary Romania Latvia Weighted average
31/12/2011 31/12/2012 31/12/2013
11
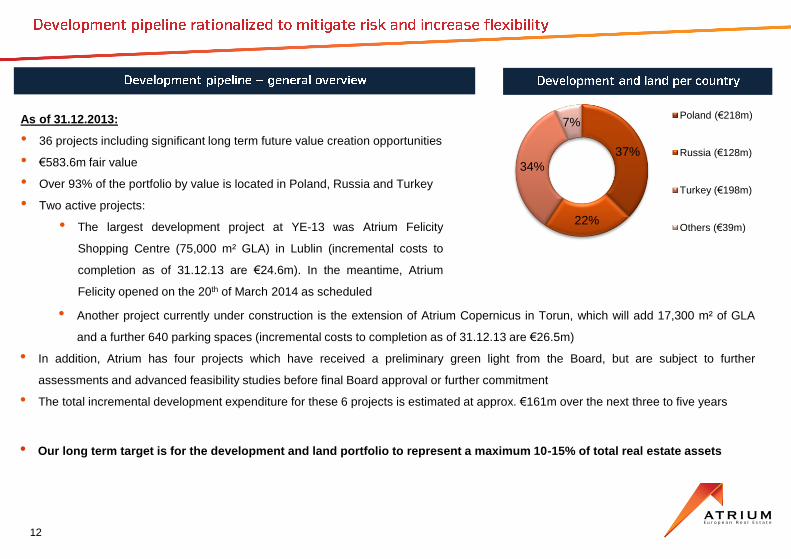
As of 31.12.2013:
• 36 projects including significant long term future value creation opportunities
• €583.6m fair value
• Over 93% of the portfolio by value is located in Poland, Russia and Turkey
• Two active projects:
• The largest development project at YE-13 was Atrium Felicity
Shopping Centre (75,000 m² GLA) in Lublin (incremental costs to
completion as of 31.12.13 are €24.6m). In the meantime, Atrium
Felicity opened on the 20th of March 2014 as scheduled
12
• Another project currently under construction is the extension of Atrium Copernicus in Torun, which will add 17,300 m² of GLA
and a further 640 parking spaces (incremental costs to completion as of 31.12.13 are €26.5m)
• In addition, Atrium has four projects which have received a preliminary green light from the Board, but are subject to further
assessments and advanced feasibility studies before final Board approval or further commitment
• The total incremental development expenditure for these 6 projects is estimated at approx. €161m over the next three to five years
• Our long term target is for the development and land portfolio to represent a maximum 10-15% of total real estate assets
37%
22%
34%
7%Poland (€218m)
Russia (€128m)
Turkey (€198m)
Others (€39m)

On the 20th of March 2014, Atrium successfully opened its largest greenfield project, Atrium Felicity Shopping Centre in Lublin, Poland
Felicity’s catchment area of c. 470,000 people extends to Lublin and nearby cities (e.g. Chelm, Zamosc)
Key figures:
GLA of 75,000 m² , over 120 new shops, a comprehensive leisure offering (15 cafes & restaurants), and free wi-fi
Anchors: a 20,000 m² Auchan hypermarket, a 12,600 m² Leroy Merlin DIY superstore, a 3,500 m² Saturn electronics store
Felicity will also host a 9-screen Cinema City, the 1st in Lublin and the 2nd in Poland to offer the new 4D experience
Extensive fashion offer/ strong globall brands – H&M, Inditex (Zara, Bershka, Stradivarius, Pull & Bear, Massimo Dutti), C&A, LPP
(Reserved, Mohito, Sinsay, Cropp, House, Home&You). Felicity also chosen as 1st Lublin location by, i.a., Tommy Hilfiger & New Yorker
Parking spaces – c. 3,100 cars
Design and construction in line with latest standards of efficiency and sustainability; application for a BREEAM rating submitted
13

14
• S&P Rating BBB-/stable
• Fitch Rating BBB-/stable
• Atrium has a strong Balance Sheet with
€306m of cash, gross LTV of 27.3% and
net LTV of 16.9%
• The weighted average duration to
maturity is 5.1 years
* Based on the variable rate as of 31.12.2013
** Maturing amounts include scheduled amortisation
** Maturing
Amount
Current Avg
Interest rate
Maturing
Amount**
Current Avg
Interest rate
Maturing
Amount
Current Avg
Interest rate
€m % €m % €m %
2014 - - 5.5 3.5% 5.5 3.5%
2015 69.6 3.3% 6.1 3.5% 75.7 3.3%
2016 - - 103.3 4.7% 103.3 4.7%
2017 83.3 4.0% 81.9 3.0% 165.2 3.5%
2018 - - 1.7 4.1% 1.7 4.1%
2019 & on 346.2 4.0% 106.0 4.1% 452.2 4.0%
Total 499.1 3.9% 304.5 4.0% 803.6 3.9%
Fixed rate 386.5 4.0% 262.7 4.1% 649.3 4.1%
Variable rate * 112.5 3.4% 41.7 2.7% 154.3 3.2%
Total 499.1 3.9% 304.5 4.0% 803.6 3.9%
Year
Bonds Bank Loans Total
-
69.6
-
83.3
-
346.2
5.5 6.1
103.3 81.9
1.7
106.0
€0m
€80m
€160m
€240m
€320m
€400m
2014 2015 2016 2017 2018 2019 & on
Bonds Bank loans
33% 38% 30% 31%
32%
31%38% 36% 34%
43% 51% 54% 45%
27%60%62%
64% 64%
62%
42%
56% 62%
35%
42%
40% 39%
39%
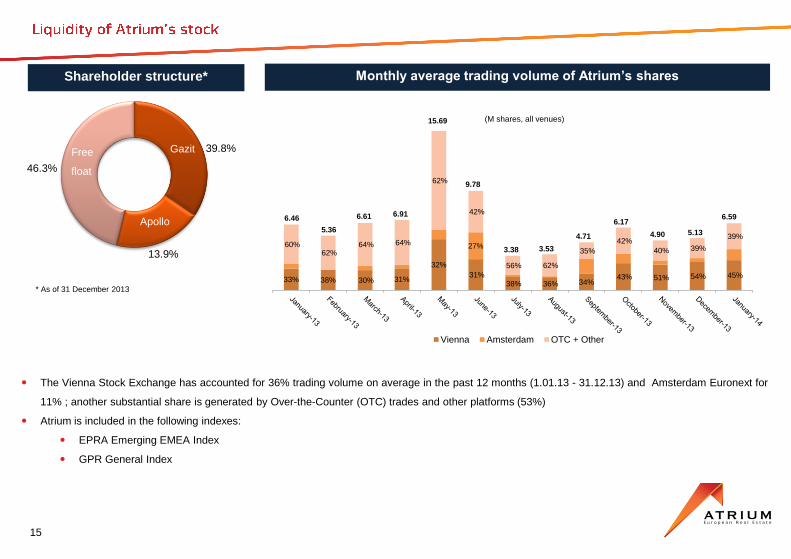
(M shares, all venues)
Vienna Amsterdam OTC + Other
6.46
5.36
6.61 6.91
15.69
9.78
3.38 3.53
4.71
6.17
4.90 5.13
6.59
The Vienna Stock Exchange has accounted for 36% trading volume on average in the past 12 months (1.01.13 - 31.12.13) and Amsterdam Euronext for
11% ; another substantial share is generated by Over-the-Counter (OTC) trades and other platforms (53%)
Atrium is included in the following indexes:
EPRA Emerging EMEA Index
GPR General Index
Shareholder structure* Monthly average trading volume of Atrium’s shares
15
* As of 31 December 2013
Gazit
Apollo
Free
float
13.9%
39.8%
46.3%
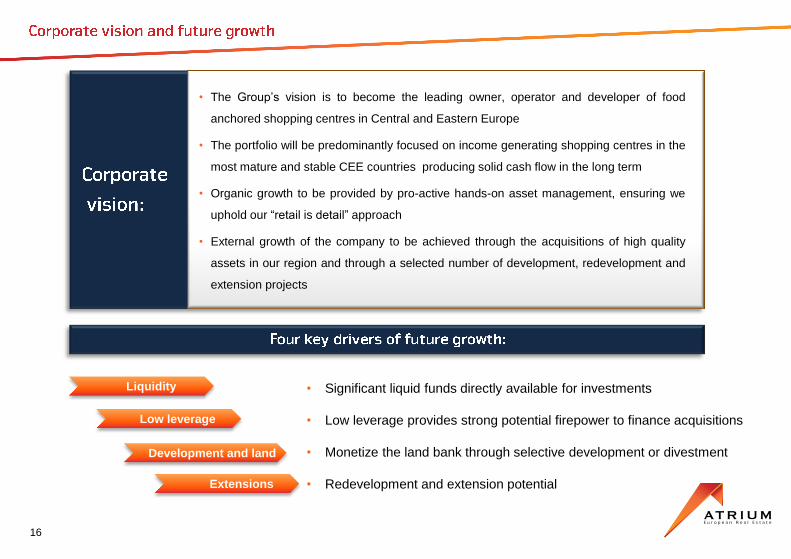
• Significant liquid funds directly available for investments
• Low leverage provides strong potential firepower to finance acquisitions
• Monetize the land bank through selective development or divestment
• Redevelopment and extension potential
• The Group’s vision is to become the leading owner, operator and developer of food
anchored shopping centres in Central and Eastern Europe
• The portfolio will be predominantly focused on income generating shopping centres in the
most mature and stable CEE countries producing solid cash flow in the long term
• Organic growth to be provided by pro-active hands-on asset management, ensuring we
uphold our “retail is detail” approach
• External growth of the company to be achieved through the acquisitions of high quality
assets in our region and through a selected number of development, redevelopment and
extension projects
Liquidity
Low leverage
Development and land
Extensions
16
• Continue to drive the financial and operational performance of our assets while constantly striving to
improve our offer for retailers and consumers
• Maintain our pursuit of appropriate investment opportunities in our core markets of Poland, the Czech
Republic and Slovakia
• Further improve the capital structure and efficiency of the Group’s balance sheet;
• Continue to establish the Atrium brand and strengthen our relationships with key clients while seeking
to work with new retailers as they expand into and across the region
• Long-term leverage target of net debt to real estate value of 30%-35%
• Reduce development and land bank to ~ 10% - 15% of total real estate assets
17

• Strong management team with a proven track record of delivering market leading growth and adding value
through operational performance
• Central and Eastern European focus with dominant presence in the most mature and stable countries
• Successfully navigated the global economic crisis through smart decision making and effective management
• Balance sheet is exceptionally robust
• Investment grade rating: BBB- with a “Stable” outlook (Fitch and S&P)
• Balance between solid income producing platform and opportunities for future growth
18


20
Year over year 12M 2013 12M 2012 Change Change
€m €m €m %
Gross rental income 203.5 193.5 10.0 5.2%
Service charge income 77.0 73.8 3.2 4.3%
Net property expenses (89.7) (86.0) (3.7) (4.3%)
Net rental income 190.8 181.3 9.5 5.3%
Operating margin 93.8% 93.7% 0.1% 0.1%
Net result on acquisitions and disp. 1.4 0.8 0.6 75.0%
Costs connected with development (5.1) (6.2) 1.1 17.7%
Revaluation of investment properties (21.3) (5.0) (16.3) (326.0%)
Other dep, amort, imp. (7.0) (1.8) (5.2) (288.9%)
Administrative expenses (25.3) (29.1) 3.8 13.1%
Net operating profit 133.5 140.0 (6.5) (4.6%)
Net financial expenses (42.9) (23.9) (19.0) (79.5%)
Profit before taxation 90.6 116.1 (25.5) (22.0%)
Corporate income tax (1.9) (2.9) 1.0 34.5%
Deferred tax (12.8) (17.0) 4.2 24.7%
Profit after taxation for the period 75.9 96.2 (20.3) (21.1%)
Attributable to:
Equity holders of the parent 75.9 98.7 (22.8) (23.1%)
Minority interest (0.1) (2.5) 2.4 96.0%
IFRS earnings per share (€cents) 20.3 26.4 (6.1) (23.1%)
Company adjusted EPRA earnings per share (€cents) 33.5 32.4 1.1 3.4%
21
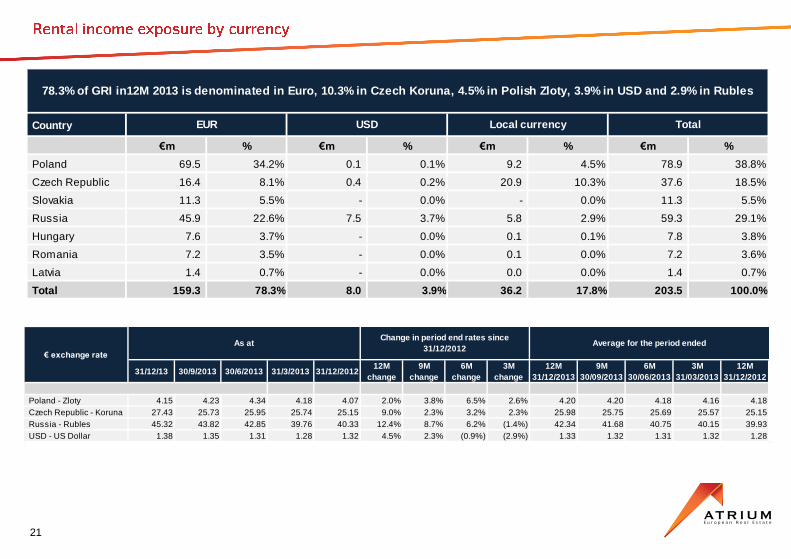
Country
€m % €m % €m % €m %
Poland 69.5 34.2% 0.1 0.1% 9.2 4.5% 78.9 38.8%
Czech Republic 16.4 8.1% 0.4 0.2% 20.9 10.3% 37.6 18.5%
Slovakia 11.3 5.5% - 0.0% - 0.0% 11.3 5.5%
Russia 45.9 22.6% 7.5 3.7% 5.8 2.9% 59.3 29.1%
Hungary 7.6 3.7% - 0.0% 0.1 0.1% 7.8 3.8%
Romania 7.2 3.5% - 0.0% 0.1 0.0% 7.2 3.6%
Latvia 1.4 0.7% - 0.0% 0.0 0.0% 1.4 0.7%
Total 159.3 78.3% 8.0 3.9% 36.2 17.8% 203.5 100.0%
Total
78.3% of GRI in12M 2013 is denominated in Euro, 10.3% in Czech Koruna, 4.5% in Polish Zloty, 3.9% in USD and 2.9% in Rubles
EUR USD Local currency
31/12/13 30/9/2013 30/6/2013 31/3/2013 31/12/201212M
change
9M
change
6M
change
3M
change
12M
31/12/2013
9M
30/09/2013
6M
30/06/2013
3M
31/03/2013
12M
31/12/2012
Poland - Zloty 4.15 4.23 4.34 4.18 4.07 2.0% 3.8% 6.5% 2.6% 4.20 4.20 4.18 4.16 4.18
Czech Republic - Koruna 27.43 25.73 25.95 25.74 25.15 9.0% 2.3% 3.2% 2.3% 25.98 25.75 25.69 25.57 25.15
Russia - Rubles 45.32 43.82 42.85 39.76 40.33 12.4% 8.7% 6.2% (1.4%) 42.34 41.68 40.75 40.15 39.93
USD - US Dollar 1.38 1.35 1.31 1.28 1.32 4.5% 2.3% (0.9%) (2.9%) 1.33 1.32 1.31 1.32 1.28
€ exchange rate
As atChange in period end rates since
31/12/2012Average for the period ended

22
Earnings 12M 2013 12M 2012 Change Change
€m €m €m %
Earnings attributed to equity holders of the parent 75.9 98.7 (22.8) (23.1%)
Revaluation of investment properties 21.3 5.0 16.3
Net result on acquisitions and disposals (1.4) (0.8) (0.6)
Goodwill impairment and amortisation of intangible assets 4.4 1.0 3.4
Deferred tax in respect of EPRA adjustments 3.2 11.5 (8.3)
Non-controlling interest in respect of the above adjustments - (2.3) 2.3
Close-out costs of financial instruments - 1.9 (1.9)
EPRA Earnings 103.5 115.0 (11.5) (10.0%)
EPRA earnings per share (€cents) 27.7 30.8 (3.1) (10.1%)
Company adjustments:
Legacy legal matters 3.3 3.3 0.0
Impairment of investment in associate 1.5 - 1.5
Foreign exchange differences 5.8 (7.9) 13.7
Changes in the value of financial instruments 1.8 5.0 (3.2)
Deferred tax not related to revaluations and NCI 9.6 5.5 4.1
Company adjusted EPRA earnings 125.4 120.9 4.5 3.7%
Company adjusted EPRA earnings per share (€cents) 33.5 32.4 1.1 3.4%
Dividend as a % of Company adjusted EPRA earnings 62.7% 52.4% 10.3% 10.3%

23
Balance sheet 31/12/2013 31/12/2012 Change Change
€m €m €m %
Assets
Non-current assets
Standing investments 2,356.2 2,185.3 170.9 7.8%
Developments and land 583.6 538.4 45.2 8.4%
Other non-current assets 55.3 93.4 (38.1) (40.8%)
2,995.1 2,817.1 178.0 6.3%
Current assets
Cash and cash equivalents 305.6 207.8 97.8 47.1%
Other current assets 43.5 40.6 2.9 7.1%
349.1 248.4 100.7 40.5%
Total assets 3,344.2 3,065.5 278.7 9.1%
Equity 2,267.3 2,281.4 (14.1) (0.6%)
Non-current liabilities
Long term borrowings 798.0 462.1 335.9 72.7%
Derivatives 11.8 17.8 (6.0) (33.7%)
Other non-current liabilities 181.7 166.8 14.9 8.9%
991.5 646.7 344.8 53.3%
Current liabilities
Short term borrowings 5.5 75.0 (69.5) (92.7%)
Other current liabilities 79.9 62.4 17.5 28.0%
85.4 137.4 (52.0) (37.8%)
Total equity and liabilities 3,344.2 3,065.5 278.7 9.1%
IFRS NAV per financial statements 2,268.0 2,284.4 (16.4) (0.7%)
IFRS NAV per share (in €) 6.05 6.12 (0.07) (1.1%)
EPRA NAV 2,455.2 2,435.0 20.2 0.8%
EPRA NAV per share (in €) 6.43 6.43 (0.00) (0.0%)

24
NAV 31/12/2013 31/12/2012 Change Change
€m €m €m %
Equity 2,267.3 2,281.4 (14.1) (0.6%)
Non-controlling interest 0.7 3.1 (2.4) (77.4%)
IFRS NAV per financial statements 2,268.0 2,284.4 (16.4) (0.7%)
IFRS NAV per share (in €) €6.05 €6.12 (€0.07) (1.1%)
Effect of exercise of options 27.3 15.3 12.0 78.4%
Diluted NAV, after the exercise of options 2,295.3 2,299.7 (4.4) (0.2%)
Fair value of financial instruments 11.8 17.8 (6.0) (33.7%)
Goodwill as a result of deferred tax (7.6) (11.0) 3.4 30.9%
Deferred tax 155.7 128.5 27.2 21.2%
EPRA NAV 2,455.2 2,435.0 20.2 0.8%
EPRA NAV per share (in €) €6.43 €6.43 - -
Number of outstanding shares (in millions) 374.9 373.4 1.5 0.4%
Number of outstanding shares and options (in millions) 381.7 378.5 3.2 0.8%

25
Cash movement 12M 2013 12M 2012 Change Change %
€m €m €m %
Net cash generated from operating activities 140.6 126.5 14.1 11.1%
Cash flows used in investing activities (217.4) (47.6) (169.8) (356.7%)
Cash flows from/(used in) financing activities 175.9 (105.6) 281.5 266.6%
Increase/(Decrease) in cash and cash equivalents 99.1 (26.7) 125.8 471.2%
Cash and cash equivalents at the beginning of the year 207.8 234.9 (27.1) (11.5%)
Effect of exchange rate fluctuations on cash held (1.4) (0.4) (1.0) (250.0%)
Cash and cash equivalents at the end of the year 305.6 207.8 97.8 47.1%

• Atrium’s main markets provide access to 230 million consumers with increasing purchasing power
• Forecasted GDP growth is positive in all of our markets except the Czech Republic, and is higher on average than in Western European economies:
e/f - Estimation/ Forecast
*Simple arithmetic average for comparison purposes
Sources: IMF (April 2014), Oxford Economics, Capital Economics
26
Macro Indicator PolandCzech
RepublicRussia Slovakia Hungary Romania Latvia
Total /
Average*France Germany
2013 Population (M people) 38.5 10.5 142.9 5.4 9.9 21.3 2.0 230.6 63.7 80.8
2013 GDP in PPP ($ Bn) 817.5 286.0 2,556.2 133.1 198.2 285.1 38.9 4,315.0 2,278.0 3,232.5
2013 GDP per capita PPP ($) 21,214 27,200 17,884 24,605 20,065 13,396 19,120 20,498 35,784 40,007
2014f GDP per capita PPP ($) 22,201 28,086 18,408 25,525 20,817 13,932 20,204 21,310 36,537 41,248
2015f GDP per capita PPP ($) 23,340 29,116 19,178 26,711 21,597 14,560 21,528 22,290 37,582 42,586
2019f GDP per capita PPP ($) 29,028 34,382 22,946 33,092 25,210 18,077 27,649 27,198 42,943 48,625
2013 real GDP growth (%) 1.6% -0.9% 1.3% 0.9% 1.1% 3.5% 4.1% 1.7% 0.3% 0.5%
2014f real GDP growth (%) 3.1% 1.9% 1.3% 2.3% 2.0% 2.2% 3.8% 2.4% 1.0% 1.7%
2015f real GDP growth (%) 3.3% 2.0% 2.3% 3.0% 1.7% 2.5% 4.4% 2.7% 1.5% 1.6%
2019f real GDP growth (%) 3.6% 2.4% 2.5% 3.6% 1.7% 3.5% 4.0% 3.0% 1.9% 1.3%
2013 retail sales growth (%) 4.8% -0.1% 3.6% 0.1% 0.7% 0.2% 4.8% 2.0% 1.3% 0.6%
2014f retail sales growth (%) 2.3% 0.7% 3.8% 1.4% 1.7% 2.3% 3.5% 2.2% 1.9% 1.1%
2015f retail sales growth (%) 3.1% 2.1% 3.8% 2.7% 1.4% 2.7% 4.5% 2.9% 1.4% 1.7%
2019f retail sales growth (%) 3.5% 3.4% 3.1% 2.7% 2.2% 3.6% 4.4% 3.3% 1.4% 1.3%
2013 Unemployment (%) 10.3% 7.0% 5.5% 14.2% 10.2% 7.3% 11.9% 9.5% 10.8% 5.3%
2014f Unemployment (%) 10.2% 6.7% 6.2% 13.9% 9.4% 7.2% 10.7% 9.2% 11.0% 5.2%
2015f Unemployment (%) 10.0% 6.3% 6.2% 13.6% 9.2% 7.0% 10.1% 8.9% 10.7% 5.2%
2019f Unemployment (%) 9.6% 5.2% 6.0% 11.5% 8.3% 6.5% 8.9% 8.0% 9.8% 5.3%
2013 Inflation (%) 0.7% 1.4% 6.5% 0.4% 0.4% 1.6% -0.4% 1.5% 0.0% 1.2%
2014f Inflation (%) 2.1% 1.2% 5.3% 1.6% 2.9% 3.5% 2.4% 2.7% 1.0% 1.4%
2015f Inflation (%) 2.5% 2.0% 5.3% 1.6% 3.0% 3.1% 2.5% 2.9% 1.2% 1.4%
2019f Inflation (%) 2.5% 2.0% 5.0% 2.2% 3.0% 2.7% 2.3% 2.8% 1.6% 1.7%
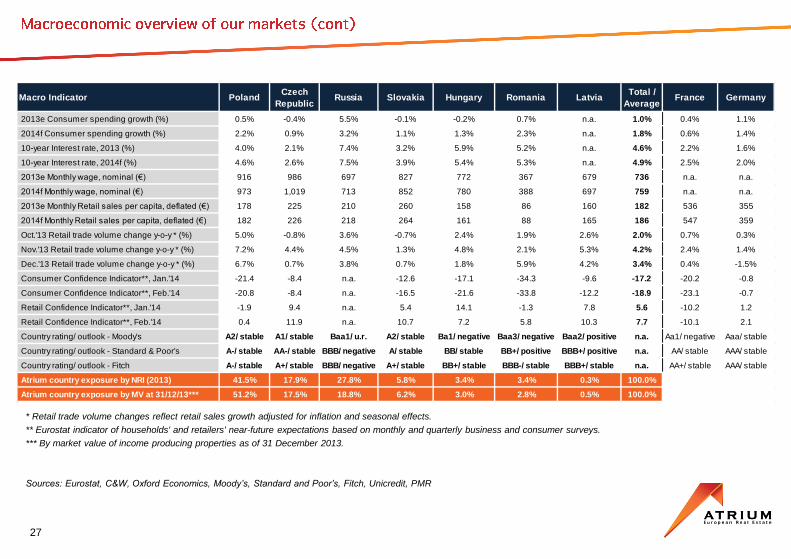
* Retail trade volume changes reflect retail sales growth adjusted for inflation and seasonal effects.
** Eurostat indicator of households' and retailers' near-future expectations based on monthly and quarterly business and consumer surveys.
*** By market value of income producing properties as of 31 December 2013.
Sources: Eurostat, C&W, Oxford Economics, Moody’s, Standard and Poor’s, Fitch, Unicredit, PMR
27
Macro Indicator PolandCzech
RepublicRussia Slovakia Hungary Romania Latvia
Total /
AverageFrance Germany
2013e Consumer spending growth (%) 0.5% -0.4% 5.5% -0.1% -0.2% 0.7% n.a. 1.0% 0.4% 1.1%
2014f Consumer spending growth (%) 2.2% 0.9% 3.2% 1.1% 1.3% 2.3% n.a. 1.8% 0.6% 1.4%
10-year Interest rate, 2013 (%) 4.0% 2.1% 7.4% 3.2% 5.9% 5.2% n.a. 4.6% 2.2% 1.6%
10-year Interest rate, 2014f (%) 4.6% 2.6% 7.5% 3.9% 5.4% 5.3% n.a. 4.9% 2.5% 2.0%
2013e Monthly wage, nominal (€) 916 986 697 827 772 367 679 736 n.a. n.a.
2014f Monthly wage, nominal (€) 973 1,019 713 852 780 388 697 759 n.a. n.a.
2013e Monthly Retail sales per capita, deflated (€) 178 225 210 260 158 86 160 182 536 355
2014f Monthly Retail sales per capita, deflated (€) 182 226 218 264 161 88 165 186 547 359
Oct.'13 Retail trade volume change y-o-y * (%) 5.0% -0.8% 3.6% -0.7% 2.4% 1.9% 2.6% 2.0% 0.7% 0.3%
Nov.'13 Retail trade volume change y-o-y * (%) 7.2% 4.4% 4.5% 1.3% 4.8% 2.1% 5.3% 4.2% 2.4% 1.4%
Dec.'13 Retail trade volume change y-o-y * (%) 6.7% 0.7% 3.8% 0.7% 1.8% 5.9% 4.2% 3.4% 0.4% -1.5%
Consumer Confidence Indicator**, Jan.'14 -21.4 -8.4 n.a. -12.6 -17.1 -34.3 -9.6 -17.2 -20.2 -0.8
Consumer Confidence Indicator**, Feb.'14 -20.8 -8.4 n.a. -16.5 -21.6 -33.8 -12.2 -18.9 -23.1 -0.7
Retail Confidence Indicator**, Jan.'14 -1.9 9.4 n.a. 5.4 14.1 -1.3 7.8 5.6 -10.2 1.2
Retail Confidence Indicator**, Feb.'14 0.4 11.9 n.a. 10.7 7.2 5.8 10.3 7.7 -10.1 2.1
Country rating/ outlook - Moody's A2/ stable A1/ stable Baa1/ u.r. A2/ stable Ba1/ negative Baa3/ negative Baa2/ positive n.a. Aa1/ negative Aaa/ stable
Country rating/ outlook - Standard & Poor's A-/ stable AA-/ stable BBB/ negative A/ stable BB/ stable BB+/ positive BBB+/ positive n.a. AA/ stable AAA/ stable
Country rating/ outlook - Fitch A-/ stable A+/ stable BBB/ negative A+/ stable BB+/ stable BBB-/ stable BBB+/ stable n.a. AA+/ stable AAA/ stable
Atrium country exposure by NRI (2013) 41.5% 17.9% 27.8% 5.8% 3.4% 3.4% 0.3% 100.0%
Atrium country exposure by MV at 31/12/13*** 51.2% 17.5% 18.8% 6.2% 3.0% 2.8% 0.5% 100.0%

Sources: Bloomberg, C&W
• Long term yields, based on 10-year government bonds, increased during 2008-2009 for most CEE countries
• After 2010, by May 2013 the government yields of most CEE countries compressed to pre-crisis levels, reflecting investors’ improved confidence
• May 2013 saw the beginning of a significant sell-off of emerging markets bonds as a result of the US Fed’s tapering, lower growth projections for
developing markets across the world and political tensions across many emerging countries
• Consequently, the yields across most CEE markets began to rise again although the pace of the increase differs per country
• Russia experienced some of the highest spikes; by contrast, the Czech and Slovak yields have compressed slightly
* C&W 4Q13 retail reports, all figures
are gross except Germany (net)
28
Prime
shopping
centre
gross
yield*
(4Q13)
10 year
govern.
yield,
local
currency
(Apr.’14)
Fitch
sovereign
ratings
Yields on government long-term (10 years) bonds in local currencies, Jan. 2011- Apr. 2014
Spread
POLAND 4.10% 5.75% 1.65% A-
RUSSIA 9.08% 9.00% -0.08% BBB
ROMANIA 5.12% 8.50% 3.38% BBB-
HUNGARY 5.57% 7.25% 1.68% BB+
SLOVAKIA 2.27% 7.25% 4.98% A+
CZECH R. 1.91% 5.50% 3.59% A+
GERMANY 1.50% 4.60% 3.10% AAA

This document has been prepared by Atrium (the “Company”). This document is not to be reproduced nor distributed, in whole or in part, by any person
other than the Company. The Company takes no responsibility for the use of these materials by any person.
The information contained in this document has not been subject to independent verification and no representation, warranty or undertaking, express or
implied, is made as to, and no reliance should be placed on, the fairness, accuracy, completeness or correctness of the information or opinions
contained herein. None of the Company, its shareholders, its advisors or representatives nor any other person shall have any liability whatsoever for
any loss arising from any use of this document or its contents or otherwise arising in connection with this document.
This document does not constitute an offer to sell or an invitation or solicitation of an offer to subscribe for or purchase any securities, and this shall not
form the basis for or be used for any such offer or invitation or other contract or engagement in any jurisdiction.
This document includes statements that are, or may be deemed to be, “forward looking statements”. These forward looking statements can be
identified by the use of forward looking terminology, including the terms “believes”, “estimates”, “anticipates”, “expects”, “intends”, “may”, “will” or
“should” or, in each case their negative or other variations or comparable terminology. These forward looking statements include all matters that are not
historical facts. They appear in a number of places throughout this document and include statements regarding the intentions, beliefs or current
expectations of the Company. By their nature, forward looking statements involve risks and uncertainties because they relate to events and depend on
circumstances that may or may not occur in the future. Forward looking statements are not guarantees of future performance. You should assume that
the information appearing in this document is up to date only as of the date of this document. The business, financial condition, results of operations
and prospects of the Company may change. Except as required by law, the Company does not undertake any obligation to update any forward looking
statements, even though the situation of the Company may change in the future.
All of the information presented in this document, and particularly the forward looking statements, are qualified by these cautionary statements. You
should read this document and the documents available for inspection completely and with the understanding that actual future results of the Company
may be materially different from what the Company expects.
Atrium European Real Estate Limited is regulated by the Jersey Financial Services Commission.
This presentation has been presented in Euros and million Euros. Certain totals and change movements are impacted by the effect of rounding.
29
