sm-2 block iva image-based 6-dof simulation incorporating ... · pdf filesm-2 block iva...
TRANSCRIPT

JOHNS HOPKINS APL TECHNICAL DIGEST, VOLUME 22, NUMBER 3 (2001) 333
SM-2 BLOCK IVA IMAGE-BASED 6-DOF SIMULATION
E
SM-2 Block IVA Image-Based 6-DOF Simulation Incorporating IR Seeker Flight Code and Online Image Rendering
Richard A. Steinberg, Rush W. Kester, Lawrence E. Klein, James S. Belle, and Robert A. Patterson
nabling a missile defense capability in Standard Missile-2 (SM-2) Block IVA has entailed, among other changes, incorporating an imaging infrared (IR) seeker into the mis-sile’s guidance system. A signal-to-noise (SNR) model was the first IR model implemented in the APL SM-2 six-degree-of-freedom (6-DOF) simulation, enabling statistical perfor-mance assessments under a wide range of engagement conditions. However, many applica-tions demand a higher level of fidelity than is obtainable with an SNR model. To serve this need, an image-based simulation incorporating components of the IR seeker flight code and online target image rendering has been fully integrated with the 6-DOF simulation. This article presents a survey of some of the development, validation, and application activities conducted in connection with the new image-based 6-DOF simulation.
INTRODUCTIONThe APL Standard Missile-2 (SM-2) Block IVA
six-degree-of-freedom (6-DOF) simulation models the SM-2 interceptor and associated Aegis Weapon Con-trol System components, environments, and targets.1,2 Figure 1 depicts an overview of the 6-DOF software architecture. Prior to the introduction of the high-fidel-ity infrared (IR) seeker simulation discussed in this article, the 6-DOF simulation comprised over 130,000 lines of code. Assessments of SM-2 performance against the full spectrum of threats and engagement conditions imposed by the weapon’s operational requirements are performed via Monte Carlo simulations over literally hundreds of thousands of simulated engagements. For
many such studies it is appropriate to represent the IR seeker guidance system component via a signal-to-noise (SNR) model. There are, however, a variety of appli-cations for which a more detailed treatment of the IR seeker operation is required. Such applications include, for example, preflight predictions performed immedi-ately prior to each flight test and postflight analyses intended to provide a complete and diagnostic picture of every element of seeker performance ascertainable from telemetry and auxiliary data sources.
This article presents a survey of development, vali-dation, and application activities conducted in connec-tion with the Block IVA IR seeker (BFAIRS) 6-DOF

334 JOHNS HOPKINS APL TECHNICAL DIGEST, VOLUME 22, NUMBER 3 (2001)
R. A. STEINBERG et al.
simulation. Discussions are provided in the following areas:
• A brief description of the IR seeker and its data pro-cessing components
• Non-image-based IR seeker modeling, entailing a number of sophisticated elements still required and brought over with few changes into the image-based simulation
• An overview of the new imaging IR seeker model• A new dome shading model and its validation with
bench test data• Target image signature calculation, focusing on con-
siderations relevant to the selection of a rendering engine
• Focal plane noise and Dynamic Range Manager (DRM) simulations
• Simulation validation against results of Raytheon hardware testing
• Historical and prospective applications of high-fidel-ity simulation in postflight endgame assessment
Note that Figure 1 applies to both the image-based and non-image-based versions of the 6-DOF simula-tion, since only the “IR sensor” element in the dia-gram is changed. (Figure 6 provides an expanded look into the IR sensor component of the image-based simulation.)
IR SEEKER AND DATA PROCESSINGThe APL 6-DOF simulation has been modified
to include a high-fidelity representation of BFAIRS, having components and processing operations described briefly here.
BFAIRS employs a staring IR focal plane array (FPA) and operates in a mid-IR waveband. The focal plane and telescope optics are mounted on a two-axis gimbal to provide line-of-sight (LOS) pointing and stabiliza-tion. The IR seeker is side-mounted on the SM-2 mis-sile and is protected from the high-speed airstream by a hemispherical sapphire window. The sapphire dome, in turn, is initially physically protected during most of the
Executive
Actuators Line-of-sightreconstruction
IR dome cooling Designation
(Semi-active receiver) (Kinematics) (Post-boost guidance) (IR seeker)
RF receiver
Radar dataprocessing
Propulsion andmass properties
Boost autopilotand guidance
Terminal guidance
Radome
IR sensor
IR platform
IR boresightdisplacement
Clutter
Inertial Measurement Unit/Inertial Reference Unit
Radio-frequencyseeker
White SandsMissile Range
Environment
Aerodynamics
Target signatures
Target executive
Fuze
Multipath clutter
SPY radar
Mid-course/terminal autopilot
Radio-frequencyadjunct sensor
Aegis WeaponControl System
Figure 1. Principal components of the SM-2 6-DOF simulation. Before the introduction of image-based simulation, the 6-DOF comprised about 130,000 lines of FORTRAN code.
JOHNS HOPKINS APL TECHNICAL DIGEST, VOLUME 22, NUMBER 3 (2001) 335
SM-2 BLOCK IVA IMAGE-BASED 6-DOF SIMULATION
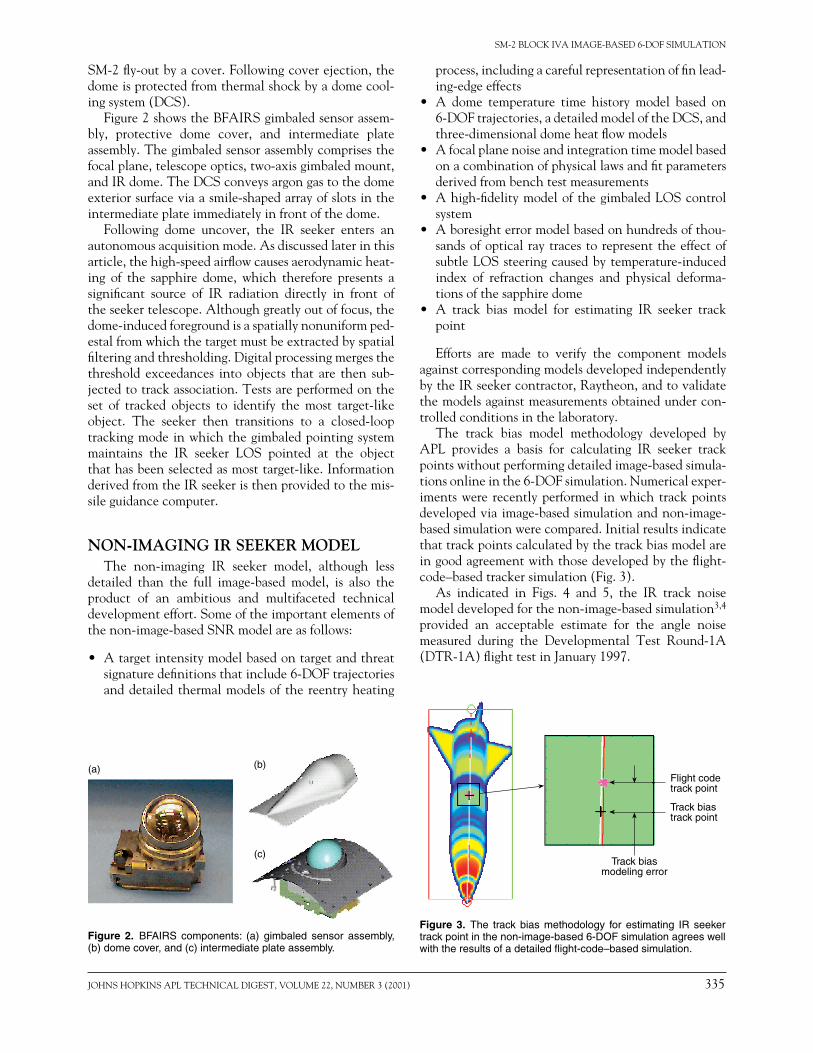
SM-2 fly-out by a cover. Following cover ejection, the dome is protected from thermal shock by a dome cool-ing system (DCS).
Figure 2 shows the BFAIRS gimbaled sensor assem-bly, protective dome cover, and intermediate plate assembly. The gimbaled sensor assembly comprises the focal plane, telescope optics, two-axis gimbaled mount, and IR dome. The DCS conveys argon gas to the dome exterior surface via a smile-shaped array of slots in the intermediate plate immediately in front of the dome.
Following dome uncover, the IR seeker enters an autonomous acquisition mode. As discussed later in this article, the high-speed airflow causes aerodynamic heat-ing of the sapphire dome, which therefore presents a significant source of IR radiation directly in front of the seeker telescope. Although greatly out of focus, the dome-induced foreground is a spatially nonuniform ped-estal from which the target must be extracted by spatial filtering and thresholding. Digital processing merges the threshold exceedances into objects that are then sub-jected to track association. Tests are performed on the set of tracked objects to identify the most target-like object. The seeker then transitions to a closed-loop tracking mode in which the gimbaled pointing system maintains the IR seeker LOS pointed at the object that has been selected as most target-like. Information derived from the IR seeker is then provided to the mis-sile guidance computer.
NON-IMAGING IR SEEKER MODELThe non-imaging IR seeker model, although less
detailed than the full image-based model, is also the product of an ambitious and multifaceted technical development effort. Some of the important elements of the non-image-based SNR model are as follows:
• A target intensity model based on target and threat signature definitions that include 6-DOF trajectories and detailed thermal models of the reentry heating
process, including a careful representation of fin lead-ing-edge effects
• A dome temperature time history model based on 6-DOF trajectories, a detailed model of the DCS, and three-dimensional dome heat flow models
• A focal plane noise and integration time model based on a combination of physical laws and fit parameters derived from bench test measurements
• A high-fidelity model of the gimbaled LOS control system
• A boresight error model based on hundreds of thou-sands of optical ray traces to represent the effect of subtle LOS steering caused by temperature-induced index of refraction changes and physical deforma-tions of the sapphire dome
• A track bias model for estimating IR seeker track point
Efforts are made to verify the component models against corresponding models developed independently by the IR seeker contractor, Raytheon, and to validate the models against measurements obtained under con-trolled conditions in the laboratory.
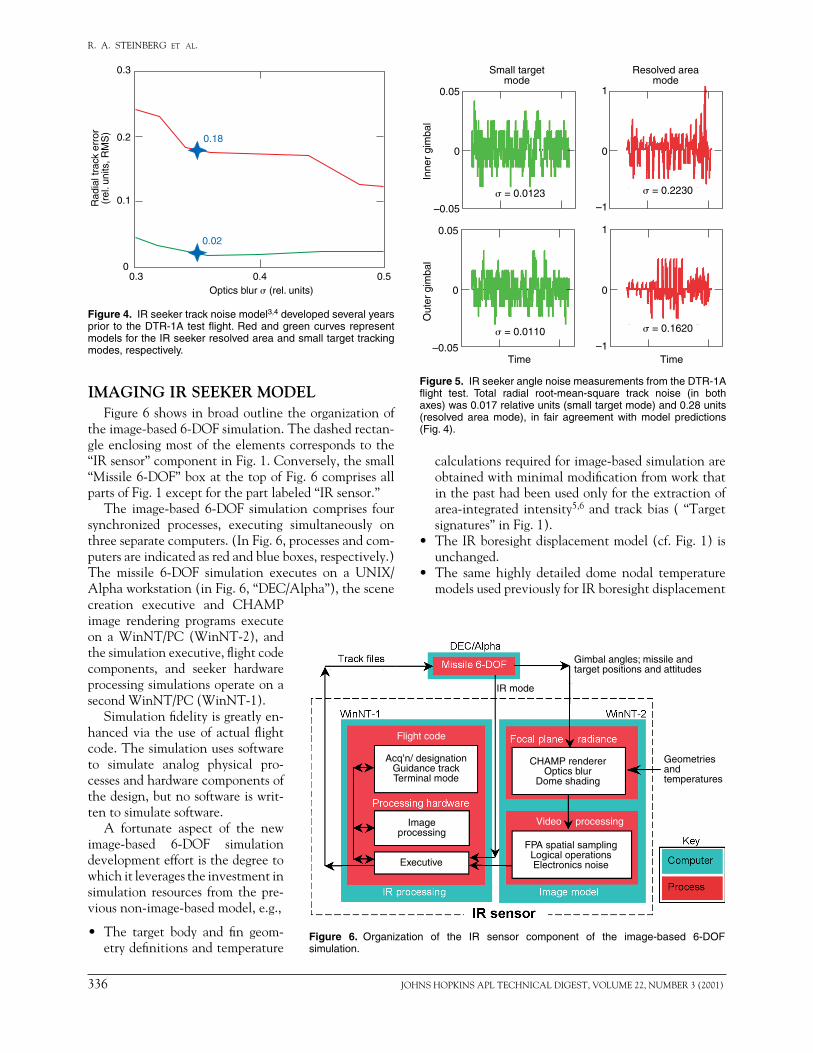
The track bias model methodology developed by APL provides a basis for calculating IR seeker track points without performing detailed image-based simula-tions online in the 6-DOF simulation. Numerical exper-iments were recently performed in which track points developed via image-based simulation and non-image-based simulation were compared. Initial results indicate that track points calculated by the track bias model are in good agreement with those developed by the flight-code–based tracker simulation (Fig. 3).
As indicated in Figs. 4 and 5, the IR track noise model developed for the non-image-based simulation3,4 provided an acceptable estimate for the angle noise measured during the Developmental Test Round-1A (DTR-1A) flight test in January 1997.
(a) (b)
(c)
Figure 2. BFAIRS components: (a) gimbaled sensor assembly, (b) dome cover, and (c) intermediate plate assembly.
Figure 3. The track bias methodology for estimating IR seeker track point in the non-image-based 6-DOF simulation agrees well with the results of a detailed flight-code–based simulation.
Track biasmodeling error
Flight codetrack point
Track biastrack point
336 JOHNS HOPKINS APL TECHNICAL DIGEST, VOLUME 22, NUMBER 3 (2001)
R. A. STEINBERG et al.
IMAGING IR SEEKER MODELFigure 6 shows in broad outline the organization of
the image-based 6-DOF simulation. The dashed rectan-gle enclosing most of the elements corresponds to the “IR sensor” component in Fig. 1. Conversely, the small “Missile 6-DOF” box at the top of Fig. 6 comprises all parts of Fig. 1 except for the part labeled “IR sensor.”
The image-based 6-DOF simulation comprises four synchronized processes, executing simultaneously on three separate computers. (In Fig. 6, processes and com-puters are indicated as red and blue boxes, respectively.) The missile 6-DOF simulation executes on a UNIX/Alpha workstation (in Fig. 6, “DEC/Alpha”), the scene
calculations required for image-based simulation are obtained with minimal modification from work that in the past had been used only for the extraction of area-integrated intensity5,6 and track bias ( “Target signatures” in Fig. 1).
• The IR boresight displacement model (cf. Fig. 1) is unchanged.
• The same highly detailed dome nodal temperature models used previously for IR boresight displacement
0.3
0.2
0.1
00.3 0.50.4
0.18
0.02
Optics blur (rel. units)
Rad
ial t
rack
err
or(r
el. u
nits
, RM
S)
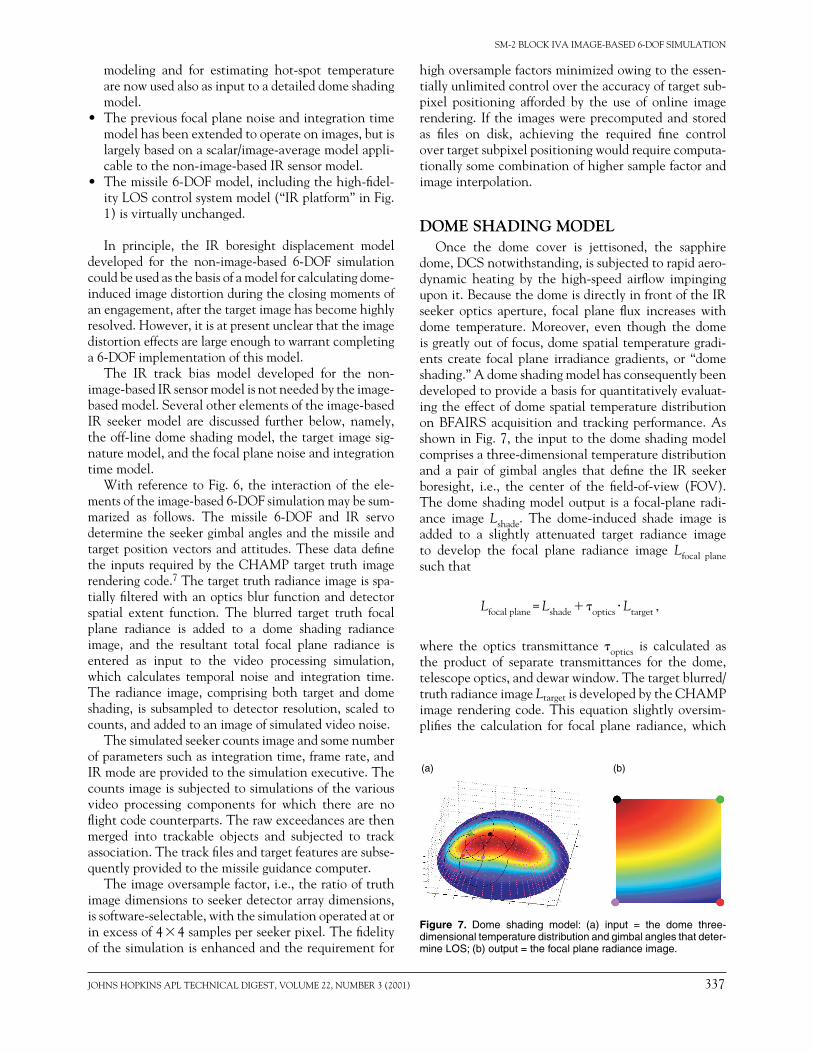
Figure 4. IR seeker track noise model3,4 developed several years prior to the DTR-1A test flight. Red and green curves represent models for the IR seeker resolved area and small target tracking modes, respectively.
0.05
0
–0.05
0.05
0
–0.05
1
0
–1
1
0
–1Time Time
Inne
r gi
mba
lO
uter
gim
bal
= 0.0123 = 0.2230
= 0.0110 = 0.1620
Small targetmode
Resolved areamode
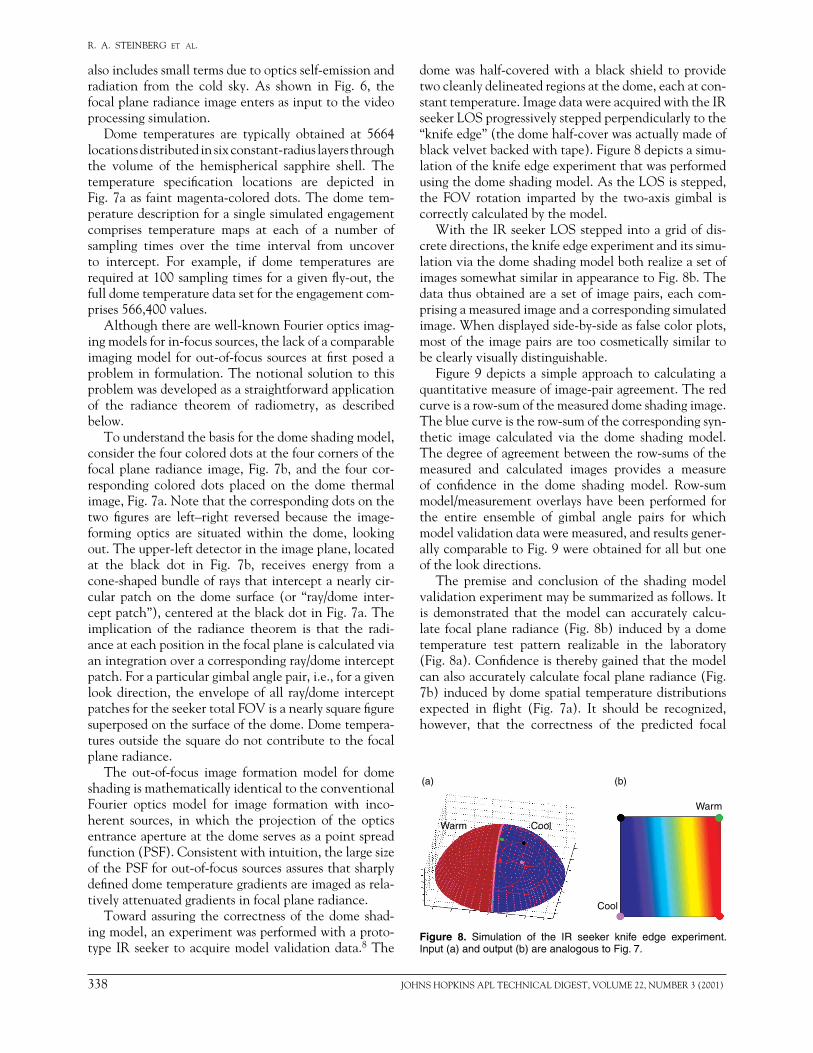
Figure 5. IR seeker angle noise measurements from the DTR-1A flight test. Total radial root-mean-square track noise (in both axes) was 0.017 relative units (small target mode) and 0.28 units (resolved area mode), in fair agreement with model predictions (Fig. 4).
IR mode
Gimbal angles; missile andtarget positions and attitudes
Flight code
Acq’n/ designationGuidance trackTerminal mode
Imageprocessing
Executive
CHAMP rendererOptics blur
Dome shading
FPA spatial samplingLogical operationsElectronics noise
Geometriesandtemperatures
Video processing
creation executive and CHAMP image rendering programs execute on a WinNT/PC (WinNT-2), and the simulation executive, flight code components, and seeker hardware processing simulations operate on a second WinNT/PC (WinNT-1).
Simulation fidelity is greatly en-hanced via the use of actual flight code. The simulation uses software to simulate analog physical pro-cesses and hardware components of the design, but no software is writ-ten to simulate software.
A fortunate aspect of the new image-based 6-DOF simulation development effort is the degree to which it leverages the investment in simulation resources from the pre-vious non-image-based model, e.g.,
• The target body and fin geom-etry definitions and temperature
Figure 6. Organization of the IR sensor component of the image-based 6-DOF simulation.
JOHNS HOPKINS APL TECHNICAL DIGEST, VOLUME 22, NUMBER 3 (2001) 337
SM-2 BLOCK IVA IMAGE-BASED 6-DOF SIMULATION
modeling and for estimating hot-spot temperature are now used also as input to a detailed dome shading model.
• The previous focal plane noise and integration time model has been extended to operate on images, but is largely based on a scalar/image-average model appli-cable to the non-image-based IR sensor model.
• The missile 6-DOF model, including the high-fidel-ity LOS control system model (“IR platform” in Fig. 1) is virtually unchanged.
In principle, the IR boresight displacement model developed for the non-image-based 6-DOF simulation could be used as the basis of a model for calculating dome-induced image distortion during the closing moments of an engagement, after the target image has become highly resolved. However, it is at present unclear that the image distortion effects are large enough to warrant completing a 6-DOF implementation of this model.
The IR track bias model developed for the non-image-based IR sensor model is not needed by the image-based model. Several other elements of the image-based IR seeker model are discussed further below, namely, the off-line dome shading model, the target image sig-nature model, and the focal plane noise and integration time model.
With reference to Fig. 6, the interaction of the ele-ments of the image-based 6-DOF simulation may be sum-marized as follows. The missile 6-DOF and IR servo determine the seeker gimbal angles and the missile and target position vectors and attitudes. These data define the inputs required by the CHAMP target truth image rendering code.7 The target truth radiance image is spa-tially filtered with an optics blur function and detector spatial extent function. The blurred target truth focal plane radiance is added to a dome shading radiance image, and the resultant total focal plane radiance is entered as input to the video processing simulation, which calculates temporal noise and integration time. The radiance image, comprising both target and dome shading, is subsampled to detector resolution, scaled to counts, and added to an image of simulated video noise.
The simulated seeker counts image and some number of parameters such as integration time, frame rate, and IR mode are provided to the simulation executive. The counts image is subjected to simulations of the various video processing components for which there are no flight code counterparts. The raw exceedances are then merged into trackable objects and subjected to track association. The track files and target features are subse-quently provided to the missile guidance computer.
The image oversample factor, i.e., the ratio of truth image dimensions to seeker detector array dimensions, is software-selectable, with the simulation operated at or in excess of 4 4 samples per seeker pixel. The fidelity of the simulation is enhanced and the requirement for
high oversample factors minimized owing to the essen-tially unlimited control over the accuracy of target sub-pixel positioning afforded by the use of online image rendering. If the images were precomputed and stored as files on disk, achieving the required fine control over target subpixel positioning would require computa-tionally some combination of higher sample factor and image interpolation.
DOME SHADING MODELOnce the dome cover is jettisoned, the sapphire
dome, DCS notwithstanding, is subjected to rapid aero-dynamic heating by the high-speed airflow impinging upon it. Because the dome is directly in front of the IR seeker optics aperture, focal plane flux increases with dome temperature. Moreover, even though the dome is greatly out of focus, dome spatial temperature gradi-ents create focal plane irradiance gradients, or “dome shading.” A dome shading model has consequently been developed to provide a basis for quantitatively evaluat-ing the effect of dome spatial temperature distribution on BFAIRS acquisition and tracking performance. As shown in Fig. 7, the input to the dome shading model comprises a three-dimensional temperature distribution and a pair of gimbal angles that define the IR seeker boresight, i.e., the center of the field-of-view (FOV). The dome shading model output is a focal-plane radi-ance image Lshade. The dome-induced shade image is added to a slightly attenuated target radiance image to develop the focal plane radiance image Lfocal plane such that
Lfocal plane = Lshade optics ⋅ Ltarget ,
where the optics transmittance optics is calculated as the product of separate transmittances for the dome, telescope optics, and dewar window. The target blurred/truth radiance image Ltarget is developed by the CHAMP image rendering code. This equation slightly oversim-plifies the calculation for focal plane radiance, which
(a) (b)
Figure 7. Dome shading model: (a) input = the dome three- dimensional temperature distribution and gimbal angles that deter-mine LOS; (b) output = the focal plane radiance image.
338 JOHNS HOPKINS APL TECHNICAL DIGEST, VOLUME 22, NUMBER 3 (2001)
R. A. STEINBERG et al.
also includes small terms due to optics self-emission and radiation from the cold sky. As shown in Fig. 6, the focal plane radiance image enters as input to the video processing simulation.
Dome temperatures are typically obtained at 5664 locations distributed in six constant-radius layers through the volume of the hemispherical sapphire shell. The temperature specification locations are depicted in Fig. 7a as faint magenta-colored dots. The dome tem-perature description for a single simulated engagement comprises temperature maps at each of a number of sampling times over the time interval from uncover to intercept. For example, if dome temperatures are required at 100 sampling times for a given fly-out, the full dome temperature data set for the engagement com-prises 566,400 values.
Although there are well-known Fourier optics imag-ing models for in-focus sources, the lack of a comparable imaging model for out-of-focus sources at first posed a problem in formulation. The notional solution to this problem was developed as a straightforward application of the radiance theorem of radiometry, as described below.
To understand the basis for the dome shading model, consider the four colored dots at the four corners of the focal plane radiance image, Fig. 7b, and the four cor-responding colored dots placed on the dome thermal image, Fig. 7a. Note that the corresponding dots on the two figures are left–right reversed because the image-forming optics are situated within the dome, looking out. The upper-left detector in the image plane, located at the black dot in Fig. 7b, receives energy from a cone-shaped bundle of rays that intercept a nearly cir-cular patch on the dome surface (or “ray/dome inter-cept patch”), centered at the black dot in Fig. 7a. The implication of the radiance theorem is that the radi-ance at each position in the focal plane is calculated via an integration over a corresponding ray/dome intercept patch. For a particular gimbal angle pair, i.e., for a given look direction, the envelope of all ray/dome intercept patches for the seeker total FOV is a nearly square figure superposed on the surface of the dome. Dome tempera-tures outside the square do not contribute to the focal plane radiance.
The out-of-focus image formation model for dome shading is mathematically identical to the conventional Fourier optics model for image formation with inco-herent sources, in which the projection of the optics entrance aperture at the dome serves as a point spread function (PSF). Consistent with intuition, the large size of the PSF for out-of-focus sources assures that sharply defined dome temperature gradients are imaged as rela-tively attenuated gradients in focal plane radiance.
Toward assuring the correctness of the dome shad-ing model, an experiment was performed with a proto-type IR seeker to acquire model validation data.8 The
dome was half-covered with a black shield to provide two cleanly delineated regions at the dome, each at con-stant temperature. Image data were acquired with the IR seeker LOS progressively stepped perpendicularly to the “knife edge” (the dome half-cover was actually made of black velvet backed with tape). Figure 8 depicts a simu-lation of the knife edge experiment that was performed using the dome shading model. As the LOS is stepped, the FOV rotation imparted by the two-axis gimbal is correctly calculated by the model.
With the IR seeker LOS stepped into a grid of dis-crete directions, the knife edge experiment and its simu-lation via the dome shading model both realize a set of images somewhat similar in appearance to Fig. 8b. The data thus obtained are a set of image pairs, each com-prising a measured image and a corresponding simulated image. When displayed side-by-side as false color plots, most of the image pairs are too cosmetically similar to be clearly visually distinguishable.
Figure 9 depicts a simple approach to calculating a quantitative measure of image-pair agreement. The red curve is a row-sum of the measured dome shading image. The blue curve is the row-sum of the corresponding syn-thetic image calculated via the dome shading model. The degree of agreement between the row-sums of the measured and calculated images provides a measure of confidence in the dome shading model. Row-sum model/measurement overlays have been performed for the entire ensemble of gimbal angle pairs for which model validation data were measured, and results gener-ally comparable to Fig. 9 were obtained for all but one of the look directions.
The premise and conclusion of the shading model validation experiment may be summarized as follows. It is demonstrated that the model can accurately calcu-late focal plane radiance (Fig. 8b) induced by a dome temperature test pattern realizable in the laboratory (Fig. 8a). Confidence is thereby gained that the model can also accurately calculate focal plane radiance (Fig. 7b) induced by dome spatial temperature distributions expected in flight (Fig. 7a). It should be recognized, however, that the correctness of the predicted focal
Warm Cool
Cool
Warm
(a) (b)
Figure 8. Simulation of the IR seeker knife edge experiment. Input (a) and output (b) are analogous to Fig. 7.

JOHNS HOPKINS APL TECHNICAL DIGEST, VOLUME 22, NUMBER 3 (2001) 339
SM-2 BLOCK IVA IMAGE-BASED 6-DOF SIMULATION
plane radiance images is limited ultimately by the pre-diction accuracy for dome temperature.
TARGET IMAGE SIGNATURE RENDERING
In addition to the dome, the other major contribu-tor to focal plane radiance is the target. The thermal analysis underlying the prediction of vehicle reentry heating is treated elsewhere (e.g., Ref. 5). This section discusses considerations relevant to the selection of the program or “rendering engine” used for operating on a three-dimensional representation of the vehicle geom-etry and surface temperatures to develop a raster image of apparent radiance.
Earlier work in SM-2 Block IVA image-based simu-lation9,10 was based on the use of the SceneGen image rendering program developed by Georgia Tech Research Institute. SceneGen has proved to be highly useful, as suggested, for example, by the visual comparison in Fig. 10 between a calculated SceneGen image and a telemetered IR seeker image from the DTR-1A flight test.
The previous usefulness of SceneGen notwithstand-ing, it was decided to perform image rendering in the image-based 6-DOF simulation with CHAMP. Some reasons for preferring CHAMP over SceneGen are as follows:
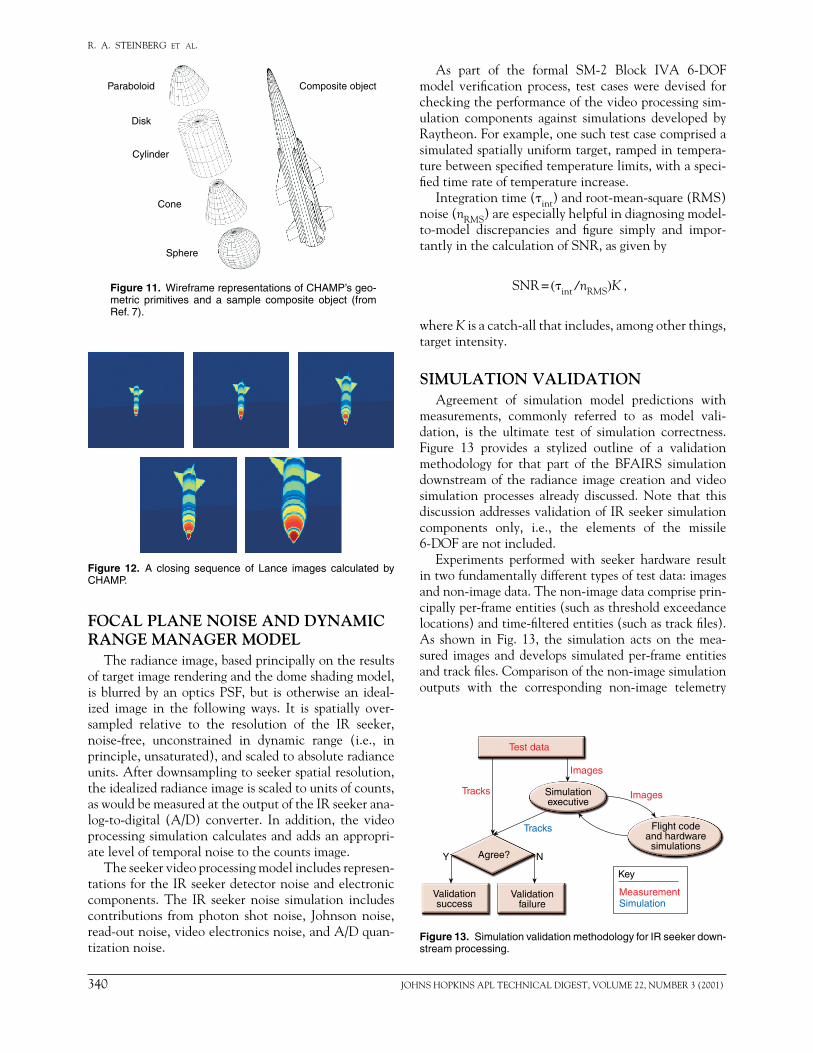
• CHAMP allows vehicle geometries to be constructed in a hierarchical fashion via translation and rotation operations applied to objects built from an assortment of common primitives (spheres, cylinders, cones, paraboloids, disks, and polygons). Thus, for example, once one fin is constructed, additional fins are cre-ated with a few succinct commands. SceneGen has provision for accepting only triangular facets.
• Provision is made for assigning an emissivity and bidirectional reflectance distribution function to each geometric primitive from a material database included with the CHAMP distribution; SceneGen makes no provision for specifying material proper-ties.
• CHAMP provides a wider variety of options for spec-ifying target viewing geometry.
• Provision is made in CHAMP for calculating solar reflections.
• CHAMP provides an interface to the MODTRAN atmospheric transmittance code.
• Provision is made in CHAMP for readily specifying scenes comprising multiple objects.
• The CHAMP developer is accessible via telephone and e-mail, while SceneGen appears to be no longer supported.
• SceneGen usage is encumbered by significant licens-ing costs and restrictions.
The CHAMP hierarchical facility for representing vehicle geometries offers a number of key advantages, e.g., the geometries are represented succinctly, the possibility of introducing geometry errors is mini-mized, and simple prototypes and test cases are easily constructed.
Figure 11, taken from the CHAMP user’s manual,7 depicts wireframe representations of CHAMP’s geomet-ric primitives and a sample composite object somewhat more complex than the typical vehicles rendered in the BFAIRS application. Figure 12 provides a closing sequence of Lance target IR images calculated with the CHAMP program.
Figure 9. Dome shading model validation. The red curve is the row-sum of a measured IR seeker image,8 and the blue curve is the row-sum of the corresponding image calculated via the dome shading model.
(a) (b)
Figure 10. Lance image signature: (a) SceneGen calculation and (b) telemetered image from DTR-1A flight test.
Outer gimbal angle
See
ker
coun
ts
340 JOHNS HOPKINS APL TECHNICAL DIGEST, VOLUME 22, NUMBER 3 (2001)
R. A. STEINBERG et al.
FOCAL PLANE NOISE AND DYNAMIC RANGE MANAGER MODEL
The radiance image, based principally on the results of target image rendering and the dome shading model, is blurred by an optics PSF, but is otherwise an ideal-ized image in the following ways. It is spatially over- sampled relative to the resolution of the IR seeker, noise-free, unconstrained in dynamic range (i.e., in principle, unsaturated), and scaled to absolute radiance units. After downsampling to seeker spatial resolution, the idealized radiance image is scaled to units of counts, as would be measured at the output of the IR seeker ana-log-to-digital (A/D) converter. In addition, the video processing simulation calculates and adds an appropri-ate level of temporal noise to the counts image.
The seeker video processing model includes represen-tations for the IR seeker detector noise and electronic components. The IR seeker noise simulation includes contributions from photon shot noise, Johnson noise, read-out noise, video electronics noise, and A/D quan-tization noise.
As part of the formal SM-2 Block IVA 6-DOF model verification process, test cases were devised for checking the performance of the video processing sim-ulation components against simulations developed by Raytheon. For example, one such test case comprised a simulated spatially uniform target, ramped in tempera-ture between specified temperature limits, with a speci-fied time rate of temperature increase.
Integration time (int) and root-mean-square (RMS) noise (nRMS) are especially helpful in diagnosing model-to-model discrepancies and figure simply and impor-tantly in the calculation of SNR, as given by
SNR = (int /nRMS)K ,
where K is a catch-all that includes, among other things, target intensity.
SIMULATION VALIDATIONAgreement of simulation model predictions with
measurements, commonly referred to as model vali-dation, is the ultimate test of simulation correctness. Figure 13 provides a stylized outline of a validation methodology for that part of the BFAIRS simulation downstream of the radiance image creation and video simulation processes already discussed. Note that this discussion addresses validation of IR seeker simulation components only, i.e., the elements of the missile 6-DOF are not included.
Experiments performed with seeker hardware result in two fundamentally different types of test data: images and non-image data. The non-image data comprise prin-cipally per-frame entities (such as threshold exceedance locations) and time-filtered entities (such as track files). As shown in Fig. 13, the simulation acts on the mea-sured images and develops simulated per-frame entities and track files. Comparison of the non-image simulation outputs with the corresponding non-image telemetry
Paraboloid
Cylinder
Cone
Sphere
Disk
Composite object
Figure 11. Wireframe representations of CHAMP’s geo-metric primitives and a sample composite object (from Ref. 7).
Figure 12. A closing sequence of Lance images calculated by CHAMP.
Test data
Validationfailure
Validationsuccess
Simulationexecutive
Flight codeand hardwaresimulations
Tracks
Images
Images
Tracks
Agree? NY
Key
MeasurementSimulation
Figure 13. Simulation validation methodology for IR seeker down-stream processing.

JOHNS HOPKINS APL TECHNICAL DIGEST, VOLUME 22, NUMBER 3 (2001) 341
SM-2 BLOCK IVA IMAGE-BASED 6-DOF SIMULATION
variables recorded in seeker testing provides the basis for assessing model validation.
Although our simulation methodology is based on the use of flight code, validation may fail for a wide vari-ety of reasons; e.g.,
• Software version differences may cause the flight soft-ware components used in the simulation to differ from the corresponding components used in the real-time environment.
• Test data may be corrupted by defective gray levels in the recorded pixel values, loss of time regis-tration between the image and non-image data, tele- meter bandwidth constraints that limit the data volume, etc.
• The simulation of hardware processing components may be imperfect.
• The simulation executive may order the processing operations differently than the real-time executive.
• Initialization of the large number of global data vari-ables generally found in real-time code may be per-formed improperly when the code is executed off-line in simulation.
A validation experiment was successfully accom-plished with an SM-2 Block IVA IR seeker.11 The IR images used for the validation experiment, obtained and provided to APL and Raytheon by the Navy,12 comprised a sequence of IR measurements of several 5″/54 artillery shells. A representative image from the data sequence is shown in Fig. 14, in which a reticle has been imposed over the 5″/54 shell. The images comprise mountainous terrain and sky in addition to the target. In the initial part of the image
sequence a gun flash appears at the bottom, following which the 5″/54 projectile is observed to rise nearly ver-tically until it leaves the top of the FOV.
The Navy images were used by Raytheon to pre-pare input for testing the IR seeker signal processing hardware in a test environment called the Raytheon Software Evaluation Station (SWES). Following com-pletion of these tests Raytheon provided the SWES input and output data to APL. The SWES test inputs and outputs appear in the context of Fig. 13 as “test data.”
Simulation input images were extracted from the Navy data sources and compared byte by byte with the Raytheon-provided SWES input images. Although this required an apparently unnecessary rectification of dif-ferent binary data formats, it conferred the benefit of ensuring traceability of the SWES input to the original Navy sources and also ensured that the simulation input and SWES input were identical. The need for thor-oughness was confirmed when several errors were found in the SWES test inputs, following which the SWES test was repeated and the image data verification step successfully accomplished.
Virtually exact agreement was found between many of the key simulation outputs and corresponding vari-ables in the seeker telemetry, such as the target cen-troid position, as well as the target intensity and area variables plotted in Fig. 15. Subtle differences were also revealed between one of the hardware processing ele-ments and the corresponding representation of the com-ponent in the simulation.
Figure 14. IR image from a gun-test sequence with reticle imposed over 5″/54 projectile.
Are
aIn
tens
ity
Time
Figure 15. A seeker simulation exactly reproduced many telemetry variables such as target intensity and area in a SWES test of seeker processor hardware against gun-test seeker images. Axes are in relative units.

342 JOHNS HOPKINS APL TECHNICAL DIGEST, VOLUME 22, NUMBER 3 (2001)
R. A. STEINBERG et al.
The simulation’s ability to correctly develop target centroid position estimates led to the solution of a small mystery of interpretation regarding the apparent slowly varying time modulation on the measured target inten-sity (the red curves in Fig. 16). It was found that all aspects of the target intensity fluctuation are explain-able in terms of the target blur spatial phasing in the focal plane.13 It was consequently possible to develop a simple, validated, predictive model applicable to future experiments of similar character to the gun test. With reference to Fig. 16a, the blue curve provides the result of adding the target contrast contributions of the target blur from all pixels in the target’s neighborhood in the image. Figure 16b provides the result of a simple blur/focal plane model driven by the target centroid posi-tions developed by the simulation.
ENDGAME ASSESSMENTFollowing the successful engagement of a Lance
target vehicle by a prototype SM-2 Block IVA missile at White Sands Missile Range on 24 January 1997, an endgame geometry reconstruction was applied to the telemetry and test range data to infer geometric miss distance and hit point.9 High-fidelity simulations played a key role in postflight assessment.
In the following discussion it should be borne in mind that, in SM-2 Block IVA, hitpoints are devel-oped as characterizations of endgame geometry. Thus, references to a hit point should not be construed as necessarily indicating the occurrence of a physical collision.
Considering the somewhat idealized planar endgame depicted in Fig. 17, the result of endgame geometry reconstruction comprises estimates for distance D and angle , effectively also determining the distance of closest approach between the vehicles (“miss distance”) and the point of initial skin-to-skin contact between the vehicles (“hitpoint”) if the circumstances of the end-game were to allow physical contact to occur. (Included among such circumstances is the performance of the fuze and warhead.)
(a)
Inte
nsity
(re
l. un
its)
(b)
Time after flash Time after flash
Figure 16. Gun-test target signature: (a) measurement and (b) analytical signature model driven by simulation track file data.
D
R
SM-2
Target
Figure 17. Endgame geometry for a planar engagement.
For simple planar engagements as in Fig. 17, hit-point can be calculated as a function of miss distance.9
The analytical relationship between hitpoint and miss distance leads to a relationship between the uncertain-ties associated with their calculation. It follows that an uncertainty ellipse projected to the target surface, per Fig. 18, can be calculated in terms of a scalar uncer-tainty in miss distance. In Fig. 18, h and h⊥ locate the center of the hitpoint ellipse on the target surface pro-file, while ∆h and ∆h⊥ are the hitpoint ellipse major and minor axis dimensions, respectively.
The analytically tractable planar endgame models briefly cited above are useful as tie points to intuition, and for confirmatory checks on more complex three-dimensional numerical models based on 6-DOF calcu-lations. Following the DTR-1A test flight, a 6-DOF–based three-dimensional geometry reconstruction was performed and the results embodied in a computer visu-alization. The image frame in Fig. 19 is intended to convey the level of detail provided by the visualization rather than DTR-1A flight test results, which may have been somewhat different than the notional endgame depicted in the illustration.
The full postflight reconstruction process was found to entail the use of a number of simulation tools. A three-dimensional target signature model provides the basis for high-accuracy passive ranging and target orien-tation estimation. Computer visualization provides the means to calculate hitpoints for geometrically complex nonplanar engagements. A tactical telemeter model is needed for endgame reconstruction with JPEG imag-ery.14 An image-based seeker simulation incorporating the flight code also proved to be a highly useful adjunct to the DTR-1A postflight analysis.
Targetcenterline
h
∆h ∆h h
Figure 18. The hitpoint uncertainty ellipse is elongated along the direction of the target centerline.9

JOHNS HOPKINS APL TECHNICAL DIGEST, VOLUME 22, NUMBER 3 (2001) 343
SM-2 BLOCK IVA IMAGE-BASED 6-DOF SIMULATION
Figure 19. Endgame reconstruction results are embodied in com-puter visualizations (figure is notional).
The geometry reconstruction process entails devel-oping estimates for range-to-target and LOS inertial rate as a function of time-to-go.9 Range-to-target is estab-lished via an image-based passive ranging process dis-cussed briefly below. LOS inertial rate is established via the use of servo-derived telemetry data. Because accu-rate miss distance calculation requires registration of the range-to-target and LOS inertial rate time histories, it follows that the image and non-image telemetry streams must also be registered in time. An unexpected result from the DTR-1A flight test was the loss of time reg-istration between the two telemetry streams. Recovery of time registration was also complicated by a small number of data dropouts that occurred at apparently random times in the non-image data stream.
The telemetered image data were processed postflight in the flight-code–based simulation and the simulated target centroids compared with the telemetered cen-troids. It was found that, with the compensation of sev-eral one-sample gaps apparently due to telemetry drop-outs and the proper time alignment of data segments between the dropouts, the simulated and telemetered centroids were in exact agreement. This provided high confidence in the inferred synchronization of image and non-image data telemetry sources.
One of the elements in endgame reconstruction is determination of range from telemetered images, explained at least notionally with reference to Fig. 20. The first step in the ranging process is to rotate the image in the data via two-dimensional interpolation until the centerline is parallel with the vertical image axis, per Fig. 20a. A vertical line, A, is drawn on the image to assist with the visual task of ensuring that the intended parallel alignment has been achieved.
Each row of gray-scale data from the rotated image provides a radiance cross-section perpendicular to the
target centerline. For example, row B in Fig. 20a pro-vides the radiance profile shown in Fig. 20b. The target width in pixels wpix is estimated as the distance between the half-peak-contrast shoulders of the radiance profile. An initial estimate for range-to-target is calculated as
R = wtgt/(IFOV ⋅ wpix) ,
where the numerator, wtgt = 0.56 m, is the nominal width of the Lance target, and IFOV is the instan-taneous FOV, or angular pixel size, of the IR seeker. Note that the denominator on the right-hand-side is the apparent target width in radians.
One limitation of the preceding process is that the value obtained for range-to-target varies depending on which row is selected from the rotated image (indicated as B in Fig. 20a). It is consequently recognized that the range formulation just discussed provides only an initial estimate. Refining the range estimate to maximize rang-ing accuracy, removing the calculational artifact asso-ciated with the arbitrary selection of a particular row in the image, and developing an estimate for ranging uncertainty simultaneous with the estimate for range entail, once again, the application of a fairly detailed model-based approach.9
Since the SM-2 Block IVA missile includes a frag-menting warhead, hit-to-kill is therefore not required for a successful engagement. The calculated hitpoints referred to in the preceding discussion are most appro-priately understood as characterizations of endgame geometry, regardless of whether a physical collision has occurred. Small miss distances and strategically placed hitpoints, in addition to not being essential for success-ful engagement, can not even be taken as certain guar-antors of successful engagement. Establishment of the engagement triangle depicted in Fig. 17, i.e., endgame geometry reconstruction, while sufficient for determi-nation of geometric miss distance and hitpoint, is not sufficient to determine the relative positions of the
(a) (b)A
B
x x
Cou
nts
wpix
Figure 20. Determination of target range from IR video telemetry: (a) telemetered image frame and (b) gray-scale data correspond-ing to row B in the image.
344 JOHNS HOPKINS APL TECHNICAL DIGEST, VOLUME 22, NUMBER 3 (2001)
R. A. STEINBERG et al.
vehicles at the time of warhead detonation. A process has consequently been developed for folding into the endgame analysis data obtained from Blast Initiation Detector and hit detector instrumentation on the target vehicles15 and an a priori warhead model. This estab-lishes the remaining elements of the endgame geometry (R and in Fig. 17) for warhead fragment first impact on target.10 Conceptually, the target is slid along the tra-jectory and stopped at the point indicated by analysis as the most likely position at which fragment contact will first occur. More precisely, the probability is calcu-lated that fragment contact first occurs over any given interval in range-to-target, Rj ≥ R ≥ Ri. A corresponding interval in impact incidence angle also is obtained.
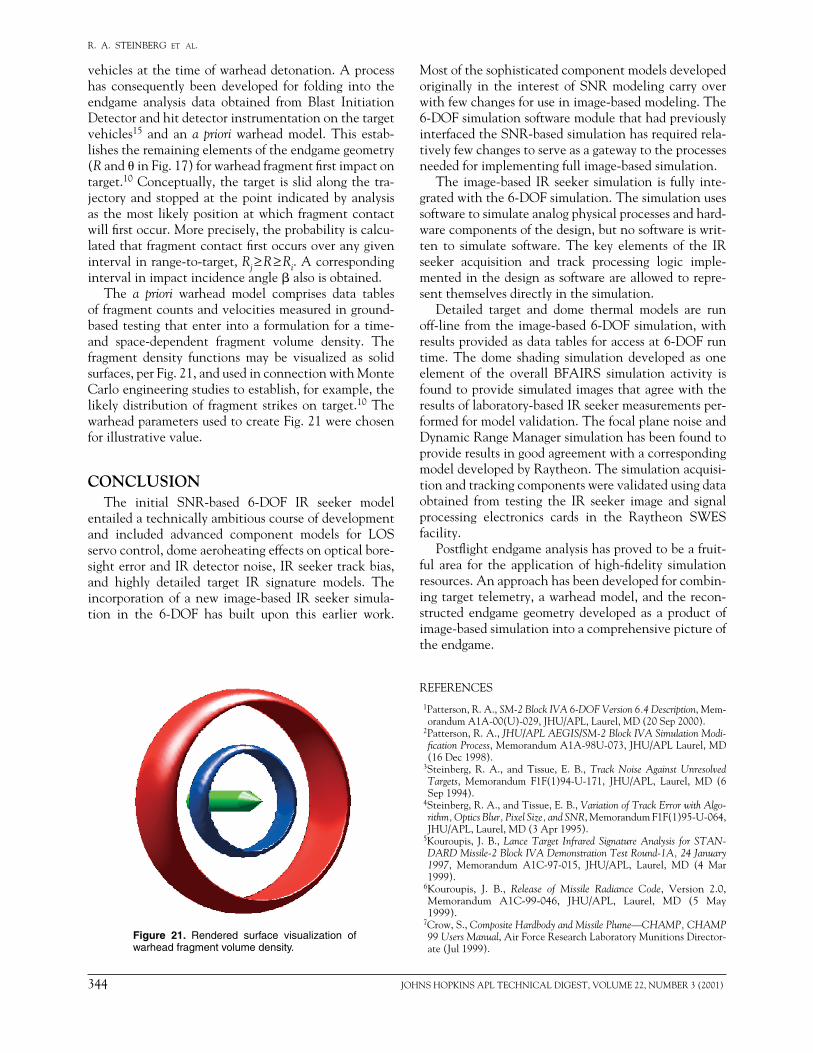
The a priori warhead model comprises data tables of fragment counts and velocities measured in ground-based testing that enter into a formulation for a time- and space-dependent fragment volume density. The fragment density functions may be visualized as solid surfaces, per Fig. 21, and used in connection with Monte Carlo engineering studies to establish, for example, the likely distribution of fragment strikes on target.10 The warhead parameters used to create Fig. 21 were chosen for illustrative value.
CONCLUSIONThe initial SNR-based 6-DOF IR seeker model
entailed a technically ambitious course of development and included advanced component models for LOS servo control, dome aeroheating effects on optical bore-sight error and IR detector noise, IR seeker track bias, and highly detailed target IR signature models. The incorporation of a new image-based IR seeker simula-tion in the 6-DOF has built upon this earlier work.
Figure 21. Rendered surface visualization of warhead fragment volume density.
Most of the sophisticated component models developed originally in the interest of SNR modeling carry over with few changes for use in image-based modeling. The 6-DOF simulation software module that had previously interfaced the SNR-based simulation has required rela-tively few changes to serve as a gateway to the processes needed for implementing full image-based simulation.
The image-based IR seeker simulation is fully inte-grated with the 6-DOF simulation. The simulation uses software to simulate analog physical processes and hard-ware components of the design, but no software is writ-ten to simulate software. The key elements of the IR seeker acquisition and track processing logic imple-mented in the design as software are allowed to repre-sent themselves directly in the simulation.
Detailed target and dome thermal models are run off-line from the image-based 6-DOF simulation, with results provided as data tables for access at 6-DOF run time. The dome shading simulation developed as one element of the overall BFAIRS simulation activity is found to provide simulated images that agree with the results of laboratory-based IR seeker measurements per-formed for model validation. The focal plane noise and Dynamic Range Manager simulation has been found to provide results in good agreement with a corresponding model developed by Raytheon. The simulation acquisi-tion and tracking components were validated using data obtained from testing the IR seeker image and signal processing electronics cards in the Raytheon SWES facility.
Postflight endgame analysis has proved to be a fruit-ful area for the application of high-fidelity simulation resources. An approach has been developed for combin-ing target telemetry, a warhead model, and the recon-structed endgame geometry developed as a product of image-based simulation into a comprehensive picture of the endgame.
REFERENCES 1Patterson, R. A., SM-2 Block IVA 6-DOF Version 6.4 Description, Mem-
orandum A1A-00(U)-029, JHU/APL, Laurel, MD (20 Sep 2000). 2Patterson, R. A., JHU/APL AEGIS/SM-2 Block IVA Simulation Modi-
fication Process, Memorandum A1A-98U-073, JHU/APL Laurel, MD (16 Dec 1998).
3Steinberg, R. A., and Tissue, E. B., Track Noise Against Unresolved Targets, Memorandum F1F(1)94-U-171, JHU/APL, Laurel, MD (6 Sep 1994).
4Steinberg, R. A., and Tissue, E. B., Variation of Track Error with Algo-rithm, Optics Blur, Pixel Size, and SNR, Memorandum F1F(1)95-U-064, JHU/APL, Laurel, MD (3 Apr 1995).
5Kouroupis, J. B., Lance Target Infrared Signature Analysis for STAN-DARD Missile-2 Block IVA Demonstration Test Round-1A, 24 January 1997, Memorandum A1C-97-015, JHU/APL, Laurel, MD (4 Mar 1999).
6Kouroupis, J. B., Release of Missile Radiance Code, Version 2.0, Memorandum A1C-99-046, JHU/APL, Laurel, MD (5 May 1999).
7Crow, S., Composite Hardbody and Missile Plume—CHAMP, CHAMP 99 Users Manual, Air Force Research Laboratory Munitions Director-ate (Jul 1999).

JOHNS HOPKINS APL TECHNICAL DIGEST, VOLUME 22, NUMBER 3 (2001) 345
SM-2 BLOCK IVA IMAGE-BASED 6-DOF SIMULATION
THE AUTHORS
RICHARD A. STEINBERG received a B.S.E.E. from Rutgers University in 1969 and an M.S.E.E. and Ph.D. from Columbia University in 1970 and 1975, respec-tively. He is a member of APL’s Principal Professional Staff and the Supervisor of the Electro-Optical Systems Group’s Information Processing Section. Dr. Steinberg worked at the Naval Research Laboratory before joining APL in 1985. Since then he has worked as IR package specialist for the SDIO Delta 180 and 181 space experi-ments and on the F-14 IR Search and Track System and Standard Missile Block IIIB and Block IVA IR seeker developments. His primary field of interest is simula-tion and modeling of IR acquisition and tracking systems. A recent special interest is in postflight analysis of tactical ballistic missile intercepts. His e-mail address is [email protected].
RUSH W. KESTER received a B.S. in information systems and computer science in 1973 and an M.B.A. in 1975 from the University of Maryland. He is a software systems engineer with flight code software and has been a resident subcontractor at APL since 1997. Before coming to the Laboratory, he worked on various aerospace and defense contracts for General Electric, GTE Government Systems, and Com-puter Sciences Corp. Mr. Kester has a long-standing interest in understanding and improving the software development process (especially in areas where the process can be automated or assisted by automation). He is currently President of the Bal-timore Chapter of ACM’s Special Interest Group on Ada and recently hosted the International SIGAda 2000 Conference held at APL. His e-mail address is [email protected]
8Irwin, B. J., Howser, L. M., and Prendergast, D. T., Data Analysis of SM-2 Block IVA Interim IR Seeker Dome Heating Non-Uniformity Test, Memorandum A1F(4)99-U-111, JHU/APL, Laurel, MD (14 Nov 1999).
9Steinberg, R. A., TBMD Endgame Reconstruction, Memorandum A1F(1)99-U-057, JHU/APL, Laurel, MD (21 Jun 1999).
10 Steinberg, R. A., Placing Warhead Detonation on the Endgame Time-line, Memorandum A1F(1)00-U-007, JHU/APL, Laurel, MD (3 Feb 2000).
11 Steinberg, R. A., and Kester, R. W., IR Seeker Simulation Validation for Acquisition Mode, Memorandum A1F(1)99-U-085, JHU/APL, Laurel, MD (30 Jul 1999).
12 Troyer, D., et al., Standard Missile-2 Block IVA, Forward Looking Fuze Demonstration 3: IR Target Signature Measurements, SMPO PUB 020499, NSWC/Dahlgren (May 1999).
13 Steinberg, R. A., Low Frequency Modulation of Measured IR Signa-tures, Memorandum A1F(1)99-U-072, JHU/APL, Laurel, MD (12 Jul 1999).
14 Mengel, E. E., Analysis of JPEG Conversion of SM-2 Block IVA IR Seeker Images, Memorandum SEA-99-0026, JHU/APL, Laurel, MD (4 Mar 1999).
15 Gauthier, L. R., and Klimek, J. M., Timing Latency Assessment for the Blast Initiation Detector on the HERA Target, Memorandum AATDL-2000-003, JHU/APL, Laurel, MD (3 Jan 2000).
ACKNOWLEDGMENTS: Target geometry and thermal models were provided for several years by Jim Kouroupis and currently by John O’Neil and Hasan Oguz. Dome temperature data were provided by David Bennett. Assistance with dome heating and DCS issues was provided by Steve Lutz and Kelly Frazer. The dome shading model validation experiment was performed by Linda Howser, Dan Pren-dergast, and Brian Irwin. Peter Schumaker assisted with missile 6-DOF–related work. The high-fidelity IR servo model was developed by Gregg Harrison. The IR boresight error ray trace model was developed initially by Mike Elko and com-pleted by Eric Rogala. The tactical telemeter simulation was developed by Ed Mengel. The RRFD version of the flight-code–based simulation was developed with assistance from Eric Tissue. Ed Ralston assisted with the DTR-1A visualiza-tion. Assistance with terminal mode and boresight error issues was provided by Paul Jackson. The sapphire emissivity model was provided by Mike Thomas and Bill Tropf. The idea for developing a track bias model came from Dan Fenner. Support for incorporating BID data into the endgame analysis came from Dick Cusick and John Coleman. Target instrumentation information was provided by Leo Gauthier. Warhead and fuze information was provided by Bruce Woodford and Dale Axenfeld. Management support for the image-based 6-DOF simulation was provided by Bruce Kuehne and Mark Mayr. Support for lethality-related anal-ysis was provided by Joel Miller. The gun-test analysis was based on an idea pro-vided by Terry Gundersen/PMS 422, and image data provided by Dave Troyer and Shawn McDonald of NSWC/Dahlgren. Assistance with the Raytheon-developed flight software was provided by Dawn Bridges, Leonard Hall, and Thomas Koziol of Raytheon. Assistance with IR seeker algorithms was provided by Cleo Katsolis, Ed Kitchen, Phil Marsh, and Richard Vanderplas of Raytheon. Special thanks are due to Terry Shearer of Raytheon for his continuing help in understanding the IR seeker and with model development and verification.
346 JOHNS HOPKINS APL TECHNICAL DIGEST, VOLUME 22, NUMBER 3 (2001)
R. A. STEINBERG et al.
JAMES S. BELLE received a B.S. in computer science from Hampton University in 1985. He is a member of APL’s Senior Professional Staff. Before coming to APL in 1990, he worked at CACI/Automated Sciences Group as a programmer for the Trident SLBM Program at NSWC/DD. He was then assigned to provide program-ming and database support for the National Highway Traffic Safety Administration and the Office of Crashworthiness. He began working for APL in 1990 as a sub-contractor, transferring SM-2 launch-to-intercept simulations from an IBM main-frame computer to a DEC workstation. He became an APL staff member in 1998. Mr. Belle is the librarian for the family of official SM-2 simulations residing in the Advanced Missile Simulation Evaluation Laboratory. His primary areas of interest are SM-2 modeling and simulation across multiple platforms, multiple compilers, and simulation interfaces with the High Level Architecture Run Time Infrastruc-ture. His e-mail address is [email protected].
ROBERT A. PATTERSON received a B.S. in electrical engineering from The Georgia Institute of Technology in 1989 and a M.S. in electrical engineering from The Johns Hopkins University in 1992. Mr. Patterson joined APL in 1989 and is the SM-2 Block IVA Chief Engineer and Supervisor of the System Simulation Sec-tion in the Air Defense Systems Department. He is the coordinator for the SM-2 Block IVA 6-DOF and End-to-End Aegis/SM-2 Block IVA simulations, TBMD flight test scenario lead at APL, and the simulation verification, validation, and accreditation effort lead for the Block IVA program. Mr. Patterson has presented papers and posters on weapon system performance at various symposia. His e-mail address is [email protected].
LAWRENCE E. KLEIN received a B.S.E.E. from Rochester Institute of Technology in 1965 and an M.S.E.E. from Worcester Polytechnic Institute in 1968. He holds an M.S.C.S. degree from The Johns Hopkins University (1982). He is a member of APL’s Senior Professional Staff in the Electro-Optical Systems Group’s Information Processing Section. He has been at APL since 1967, and was previously a member of the Guidance, Navigation, and Control Group. Mr. Klein’s interests include con-trol theory and control system design, system modeling and simulation, algorithms, and system analysis. In addition to the current image-based simulation effort he has developed a detailed digital simulation of the MA-31 target missile (modified Rus-sian AS-17). He has worked on analysis for the Navy High Energy Laser System at the White Sands Missile Range. His e-mail address is [email protected]