sm energy company (nyse: sm) catching companies before …
TRANSCRIPT

oilprice.com I 1
SM Energy Company (NYSE: SM)
Oil prices are starting to show some life in them, and the second quarter of 2015 is looking increasingly like a turning point. A full recovery will take some time, but the worst of the oil bust is likely over.
As oil prices start to rebound, the oil and gas sector will recover a lot of its luster. The very best upstream companies that emerge from the wreckage may see their share prices double or triple by the end of the year as investors become more confident and start moving a lot of money around.
The trick is to find the right companies at the right time – and that means getting in just before the rebound, when shares are still trading low.
And that is what we will help you do. Each month, you will receive an in-depth look at some phenomenal investment opportunities. In- cluded in this issue is a full briefing on one particular company that is on the verge of a major rally.
There will be a narrow window of opportunity for investors to snatch up bargain positions in strong companies before a major upswing in share prices takes effect. Not all oil and gas companies will recover.
I’ve been tracking these companies for more than a year, and have been talking to a lot of O&G CEOs and financial analysts to figure out exactly how prepared these companies are for ‘the rebound’. The companies I’ve been tracking all offer outstanding growth potential at a reasonable price. But it’s not just rock-bottom share prices that investors should be looking for. One crucial ingredient is an outstanding management team. From our experience, the right people making smart business deci-sions counts for more than anything.
Even the best acreage with the most promising assets will disappoint if there isn’t a stellar management team in place to execute the business plan. So from the pool of companies I’ve been tracking, I’ve weeded out those that fall short in terms of management, and those that remain.
In these reports you’ll receive a select few companies in which we have a high degree of confidence will capitalize on the oil price rebound. These are the type of companies that are perfect for big returns over the next year or two.
In this first report, I will be highlighting SM Energy (NYSE: SM)—a company I believe is a prime takeover target, currently trading at approximately half of
its net asset value. SM’s core areas in the Eagle Ford Shale in South Texas and the Bakken / Three Forks play in North Dakota provide it with low risk drilling locations and over a billion barrels equivalent of potentially recoverable oil, natural gas and natural gas liquids.
Again, this is only the first on the list of the companies I’ve been tracking for you, Stay tuned for more investment oppor-tunities – as well as updates on previous picks to keep you one step ahead of the market.
In this issue:
1. The Potential Oil Price Rebound: Our Take2. Oil & Gas Sector Update, Fears and Possible Realities3. Our First Stock Pick: SM Energy Company (NYSE: SM)4. Position Updates
1. Banking on the Rebound: Our Take on the Potential for an Oil Price Recovery
Before we dive into SM Energy, let’s put global oil markets in context – a quick overview of where oil & gas supply, demand and prices are heading will set the stage for why I think SM Energy will see a big bounce.
The world runs on oil, plain and simple. Crude oil is too important to our standard of living to remain below the cost of new supply for long. Billions of consumers around the world will continue to demand more and more oil, so prices will inevitably rise.
26th April 2015
Catching Companies BEFORE the Rebound
Our valuation of SM Energy’s common stock is $97.00/share
As of the date of this report, First Call’s 12-month price target is $62.83
Special Report By:
James StaffordPrivate Placements & Market Opportunities
Dan SteffensLead Analyst & Company Specialist
Annie SwankSector Specialist
Members Area Login:
http://oilprice.com/auth/login
Contact details:
T: 713-636-5658 or 469-250-5923
oilprice.com I 2
SM Energy Company (NYSE: SM)
Oil prices are starting to show some life in them, and the second quarter of 2015 is looking increasingly like a turning point. A full recovery will take some time, but the worst of the oil bust is likely over.
As oil prices start to rebound, the oil and gas sector will recover a lot of its luster. The very best upstream companies that emerge from the wreckage may see their share prices double or triple by the end of the year as investors become more confident and start moving a lot of money around.
The trick is to find the right companies at the right time – and that means getting in just before the rebound, when shares are still trading low.
And that is what we will help you do. Each month, you will receive an in-depth look at some phenomenal investment opportunities. In- cluded in this issue is a full briefing on one particular company that is on the verge of a major rally.
There will be a narrow window of opportunity for investors to snatch up bargain positions in strong companies before a major upswing in share prices takes effect. Not all oil and gas companies will recover.
I’ve been tracking these companies for more than a year, and have been talking to a lot of O&G CEOs and financial analysts to figure out exactly how prepared these companies are for ‘the rebound’. The companies I’ve been tracking all offer outstanding growth potential at a reasonable price. But it’s not just rock-bottom share prices that investors should be looking for. One crucial ingredient is an outstanding management team. From our experience, the right people making smart business deci-sions counts for more than anything.
Even the best acreage with the most promising assets will disappoint if there isn’t a stellar management team in place to execute the business plan. So from the pool of companies I’ve been tracking, I’ve weeded out those that fall short in terms of management, and those that remain.
In these reports you’ll receive a select few companies in which we have a high degree of confidence will capitalize on the oil price rebound. These are the type of companies that are perfect for big returns over the next year or two.
In this first report, I will be highlighting SM Energy (NYSE: SM)—a company I believe is a prime takeover target, currently trading at approximately half of
its net asset value. SM’s core areas in the Eagle Ford Shale in South Texas and the Bakken / Three Forks play in North Dakota provide it with low risk drilling locations and over a billion barrels equivalent of potentially recoverable oil, natural gas and natural gas liquids.
Again, this is only the first on the list of the companies I’ve been tracking for you, Stay tuned for more investment oppor-tunities – as well as updates on previous picks to keep you one step ahead of the market.
In this issue:
1. The Potential Oil Price Rebound: Our Take2. Oil & Gas Sector Update, Fears and Possible Realities3. Our First Stock Pick: SM Energy Company (NYSE: SM)4. Position Updates
1. Banking on the Rebound: Our Take on the Potential for an Oil Price Recovery
Before we dive into SM Energy, let’s put global oil markets in context – a quick overview of where oil & gas supply, demand and prices are heading will set the stage for why I think SM Energy will see a big bounce.
The world runs on oil, plain and simple. Crude oil is too important to our standard of living to remain below the cost of new supply for long. Billions of consumers around the world will continue to demand more and more oil, so prices will inevitably rise.
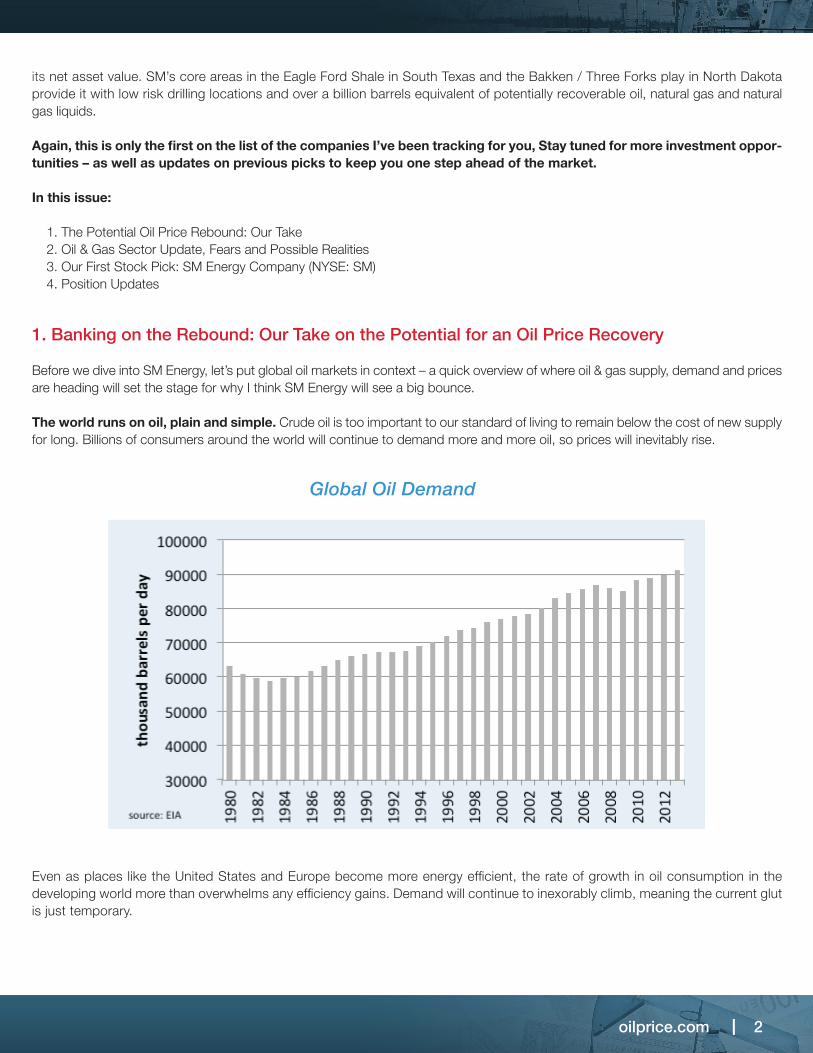
Even as places like the United States and Europe become more energy efficient, the rate of growth in oil consumption in the developing world more than overwhelms any efficiency gains. Demand will continue to inexorably climb, meaning the current glut is just temporary.
Global Oil Demand

oilprice.com I 3
Oil Price
The price of crude oil has been cut in half since June 2014. Several factors contributed to the decline, but the primary reason is that the global market was over-supplied by 1.5 to 2.0 million barrels per day. When OPEC refused to cut production in November 2014, the price of oil cratered.
Over the last five years, approximately 80% of new oil supplies have come from North America’s shale plays. But outside of the very best acreage, upstream companies need at least $65/bbl for their oil to justify drilling new wells. As a result, the number of rigs drilling for oil has been cut in half. Inevitably, prices will need to go back up in order for drilling to continue. The low prices we see today are just simply unsustainable.
Rebound is here
In short, I feel that the price of crude oil is about half way through a 4-5 month bottoming period and will begin a march back to the long-term trend line by the end of the second quarter of 2015.
It may take 12-18 months to fully recover, but investors will begin investing a lot of money into upstream companies once they are confident prices are moving back up. If this is anything like the rebound we saw in 2009, a lot of our favorite exploration & production companies are going to double or triple in price by year-end.
Now let’s take a deeper dive into the current state of oil markets.
2. What’s Going on in the Oil & Gas Sector?
Supply will take a hit
It takes time, but supply and demand fundamentals have responded to lower prices and the oil market is starting to balance itself out. This is the most important takeaway message I have to give you today, and it is the basis for why I am confident there is a massive opportunity for investors.
Drilling is slowing down and production in the U.S. is flat lining. The Energy Information Administration (EIA) reported on 1 April that U.S. oil production had fallen by 36,000 barrels per day to approximately 9.39 million barrels per day.
In May, the U.S. is expected to experience a 57,000 barrel-per-day decline in production. This is just the beginning – as the impact of drastic upstream budget cuts take effect, less and less new oil will come online.
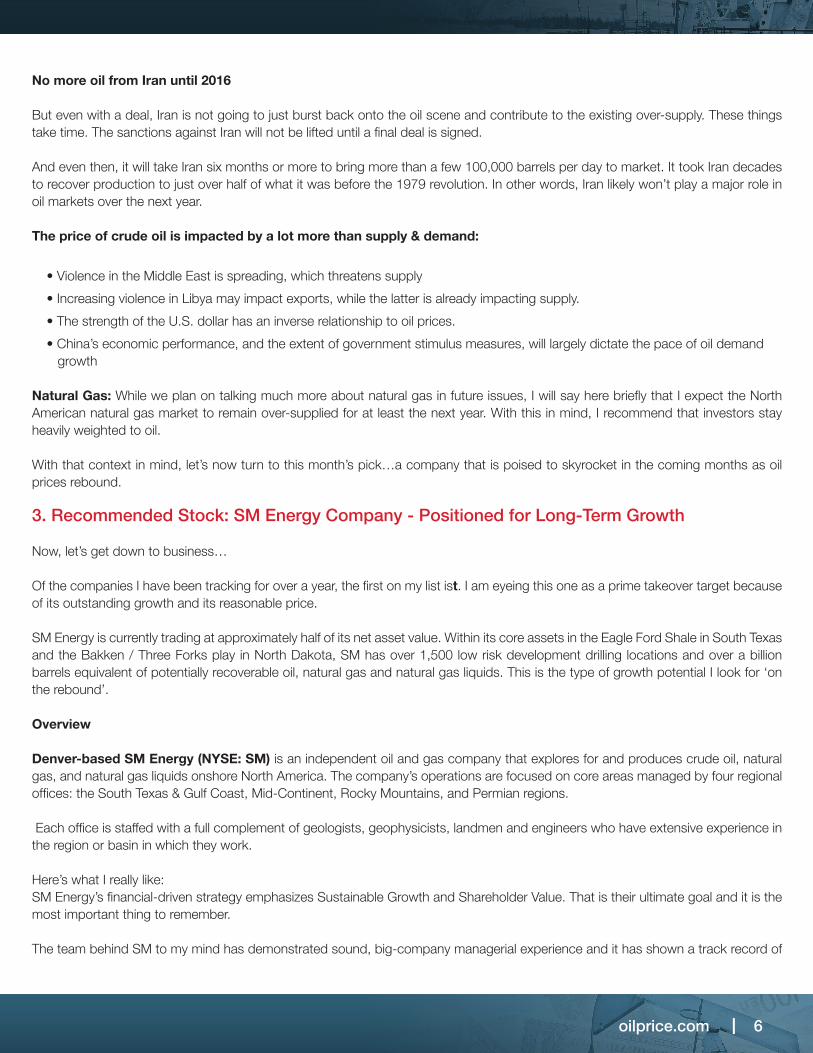
In January, the EIA forecast that U.S. oil production would begin to decline in the 3rd quarter. However, the agency did not accurately predict the stunning decline in the active rig count. As of 24 April, the U.S. active rig count has plunged to 932, significantly below the level that the EIA used to make its original prediction (see chart). With rig counts continuing to get slammed, oil production will start falling much quicker than anyone anticipated.
There is no way that U.S. oil production can continue to grow with the active rig count cut in half since last October. That means that the rate of production decline will only accelerate in the coming months. By the 3rd quarter, U.S. oil production will be falling rapidly.
I am confident that over the next six months, the U.S. will experience a significant decline in oil production.
Recent History of Oil PricesIf History Repeats, WTI should be back near the trend line by early 2016
West Texas Intermediate Crude Oil Price 2006 - 2015ytd
2008: WTI took 7 months to hit bottom
4 months to ‘Bottom’
12 months to get back on trend

oilprice.com I 4
Oil Price
The price of crude oil has been cut in half since June 2014. Several factors contributed to the decline, but the primary reason is that the global market was over-supplied by 1.5 to 2.0 million barrels per day. When OPEC refused to cut production in November 2014, the price of oil cratered.
Over the last five years, approximately 80% of new oil supplies have come from North America’s shale plays. But outside of the very best acreage, upstream companies need at least $65/bbl for their oil to justify drilling new wells. As a result, the number of rigs drilling for oil has been cut in half. Inevitably, prices will need to go back up in order for drilling to continue. The low prices we see today are just simply unsustainable.
Rebound is here
In short, I feel that the price of crude oil is about half way through a 4-5 month bottoming period and will begin a march back to the long-term trend line by the end of the second quarter of 2015.
It may take 12-18 months to fully recover, but investors will begin investing a lot of money into upstream companies once they are confident prices are moving back up. If this is anything like the rebound we saw in 2009, a lot of our favorite exploration & production companies are going to double or triple in price by year-end.
Now let’s take a deeper dive into the current state of oil markets.
2. What’s Going on in the Oil & Gas Sector?
Supply will take a hit
It takes time, but supply and demand fundamentals have responded to lower prices and the oil market is starting to balance itself out. This is the most important takeaway message I have to give you today, and it is the basis for why I am confident there is a massive opportunity for investors.
Drilling is slowing down and production in the U.S. is flat lining. The Energy Information Administration (EIA) reported on 1 April that U.S. oil production had fallen by 36,000 barrels per day to approximately 9.39 million barrels per day.
In May, the U.S. is expected to experience a 57,000 barrel-per-day decline in production. This is just the beginning – as the impact of drastic upstream budget cuts take effect, less and less new oil will come online.
In January, the EIA forecast that U.S. oil production would begin to decline in the 3rd quarter. However, the agency did not accurately predict the stunning decline in the active rig count. As of 24 April, the U.S. active rig count has plunged to 932, significantly below the level that the EIA used to make its original prediction (see chart). With rig counts continuing to get slammed, oil production will start falling much quicker than anyone anticipated.
There is no way that U.S. oil production can continue to grow with the active rig count cut in half since last October. That means that the rate of production decline will only accelerate in the coming months. By the 3rd quarter, U.S. oil production will be falling rapidly.
I am confident that over the next six months, the U.S. will experience a significant decline in oil production.
Source: U.S. Energy Information Administration, January Short-Term Energy Outlook
Note: Graph does not include production from Alaska and the Federal Gulf of Mexico.
Lower 48 oil production outlook stable despite expected near-term reduction in rig count
Onshore rig countexpected to fall to 1,300
Production ondecline by Q3

oilprice.com I 5
The EIA was too optimistic about the resilience of oil production amid falling prices. But, as Econ101 teaches us, a sharp drop in supply will only plant the seeds for a major price rebound.
Demand is responding
Just as oil production begins contracting, demand is picking up. The EIA and the International Energy Agency (IEA) are both forecast-ing a spike in global demand for refined products this summer. American drivers are hitting the roads in earnest, taking advantage of lower fuel prices. Lower fuel costs result in more demand—always and especially in the US where drivers are relentless watchers of the pump.
Refineries are also stepping up to the plate. Refining companies turn crude oil into gasoline and jet fuel, and they are processing at a much higher rate than is normal for this time of year. That is because demand is strong and they know that oil prices won’t stay low forever. Interestingly, however, more refining activity only adds more demand to the market for crude, which will also contribute to a price rise in the coming months.
The U.S. consumes over 19 million barrels per day of refined products and still imports over 7 million barrels per day of crude oil. More demand equals higher prices. A Black Swan event?
Unfortunately investors cannot always rely on simple supply and demand figures. Sometimes unexpected geopolitical events alter the course of oil markets. One scenario that some investors are concerned about is the possibility that the sanctions against Iran are lifted under a nuclear deal with the West. How this will play out in the final round is anyone’s guess.
There are complex dynamics that will influence what happens with Iran over the next few months: hardliners in Iran may not be willing to make concessions, Republicans in the U.S. Congress may not be willing to sign off on a deal, the brewing war in Yemen could spiral out of control and derail talks, or another unforeseen development could influence the end game.
No more oil from Iran until 2016
But even with a deal, Iran is not going to just burst back onto the oil scene and contribute to the existing over-supply. These things take time. The sanctions against Iran will not be lifted until a final deal is signed.
And even then, it will take Iran six months or more to bring more than a few 100,000 barrels per day to market. It took Iran decades to recover production to just over half of what it was before the 1979 revolution. In other words, Iran likely won’t play a major role in oil markets over the next year.
The price of crude oil is impacted by a lot more than supply & demand:
• Violence in the Middle East is spreading, which threatens supply
• Increasing violence in Libya may impact exports, while the latter is already impacting supply.
• The strength of the U.S. dollar has an inverse relationship to oil prices.
• China’s economic performance, and the extent of government stimulus measures, will largely dictate the pace of oil demand growth
Natural Gas: While we plan on talking much more about natural gas in future issues, I will say here briefly that I expect the North American natural gas market to remain over-supplied for at least the next year. With this in mind, I recommend that investors stay heavily weighted to oil.
With that context in mind, let’s now turn to this month’s pick…a company that is poised to skyrocket in the coming months as oil prices rebound.
3. Recommended Stock: SM Energy Company - Positioned for Long-Term Growth
Now, let’s get down to business…
Of the companies I have been tracking for over a year, the first on my list ist. I am eyeing this one as a prime takeover target because of its outstanding growth and its reasonable price.
SM Energy is currently trading at approximately half of its net asset value. Within its core assets in the Eagle Ford Shale in South Texas and the Bakken / Three Forks play in North Dakota, SM has over 1,500 low risk development drilling locations and over a billion barrels equivalent of potentially recoverable oil, natural gas and natural gas liquids. This is the type of growth potential I look for ‘on the rebound’.
Overview
Denver-based SM Energy (NYSE: SM) is an independent oil and gas company that explores for and produces crude oil, natural gas, and natural gas liquids onshore North America. The company’s operations are focused on core areas managed by four regional offices: the South Texas & Gulf Coast, Mid-Continent, Rocky Mountains, and Permian regions.
Each office is staffed with a full complement of geologists, geophysicists, landmen and engineers who have extensive experience in the region or basin in which they work.
Here’s what I really like:SM Energy’s financial-driven strategy emphasizes Sustainable Growth and Shareholder Value. That is their ultimate goal and it is the most important thing to remember. The team behind SM to my mind has demonstrated sound, big-company managerial experience and it has shown a track record of
steady growth. The management team consists of alumni of Anadarko and ARCO—two wildly successful companies that tell me a lot about where SM Energy could be going.
The management team is comparably young (they are all in their 50s – still young in my book) and bring a strong sense of entrepre-neurship into the corporate culture. This value fits well into the genes of this rapidly growing energy company. By setting up regional offices, the company ensures that it captures the best suitable growth opportunities in each area.
When I talked with them I was immediately struck by their poise and their vision for growth. These guys know what they are doing.
2014 Performance
So how has SM really been performing?
For 2014, the company reported outstanding results, and they are well-positioned to build on this performance with increased production and reserve growth—even in a depressed oil price environment.
Here are some key performance aspects that have caught my eye:
SM Energy posted net income for the fourth quarter of 2014 of $331.7 million, or $4.91 per diluted share, compared to net income of $7.0 million, or $0.10 per diluted share, for the same period of 2013. That’s right, a massive increase in net income for a quarter that saw oil prices crash! SM Energy had average daily production of 176,000 barrels of oil equivalent (“BOE”) per day during the fourth quarter of 2014. That is 13% above what they had projected.
On April 16, 2015 SM Energy reported that first quarter production increased to 186,600 BOE per day, significantly higher than my forecast.
The production mix for the 4th quarter was 32% crude oil, 45% natural gas, and 23% NGLs. I’d like to see more crude oil in the mix, but this is still a pretty good balance.
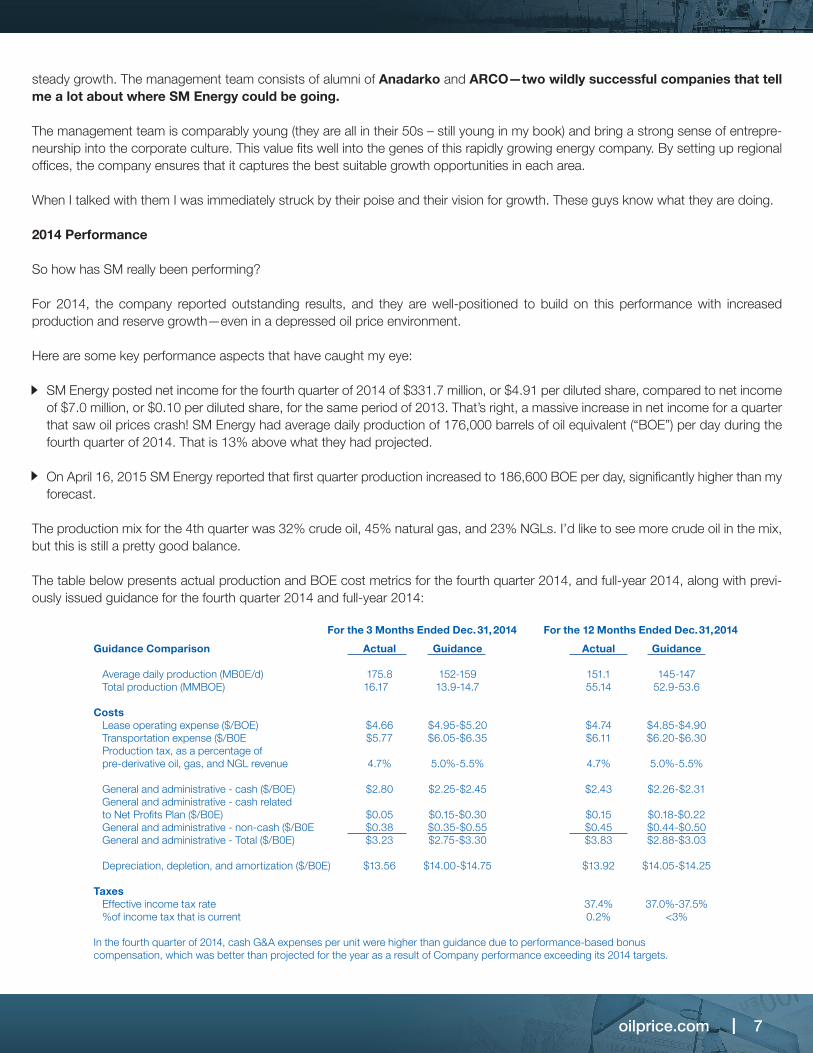
The table below presents actual production and BOE cost metrics for the fourth quarter 2014, and full-year 2014, along with previ-ously issued guidance for the fourth quarter 2014 and full-year 2014:
A couple of other attractive aspects from SM Energy’s profile
As of 31 December 2014, SM Energy had estimated proved reserves of 547.7 million BOE, which is an increase of 28% from 428.7 million BOE at the end of 2013. These reserves are comprised of 169.7 million barrels of oil/condensate, 1,466.5 billion cubic feet of natural gas, and 133.5 million barrels of natural gas liquids (“NGLs”). The table below shows the company’s proved reserves by region.
Keep in mind that ‘proved’ or ‘proven’ reserves, or P1 reserves, is a metric that refers to the amount of resources that can actually be recovered from a deposit with a reasonable level of certainty. So SM is sitting on a ton of resources that will deliver a lot of value to shareholders.
IEA: Oil Market ReportWorld Oil Demand
April 15, 2015
95 MMBOPDby end of 2015
BIG SPIKE in demand forrefined products is coming in the 3rd quarter.
oilprice.com I 6
Refineries are also stepping up to the plate. Refining companies turn crude oil into gasoline and jet fuel, and they are processing at a much higher rate than is normal for this time of year. That is because demand is strong and they know that oil prices won’t stay low forever. Interestingly, however, more refining activity only adds more demand to the market for crude, which will also contribute to a price rise in the coming months.
The U.S. consumes over 19 million barrels per day of refined products and still imports over 7 million barrels per day of crude oil. More demand equals higher prices. A Black Swan event?
Unfortunately investors cannot always rely on simple supply and demand figures. Sometimes unexpected geopolitical events alter the course of oil markets. One scenario that some investors are concerned about is the possibility that the sanctions against Iran are lifted under a nuclear deal with the West. How this will play out in the final round is anyone’s guess.
There are complex dynamics that will influence what happens with Iran over the next few months: hardliners in Iran may not be willing to make concessions, Republicans in the U.S. Congress may not be willing to sign off on a deal, the brewing war in Yemen could spiral out of control and derail talks, or another unforeseen development could influence the end game.
No more oil from Iran until 2016
But even with a deal, Iran is not going to just burst back onto the oil scene and contribute to the existing over-supply. These things take time. The sanctions against Iran will not be lifted until a final deal is signed.
And even then, it will take Iran six months or more to bring more than a few 100,000 barrels per day to market. It took Iran decades to recover production to just over half of what it was before the 1979 revolution. In other words, Iran likely won’t play a major role in oil markets over the next year.
The price of crude oil is impacted by a lot more than supply & demand:
• Violence in the Middle East is spreading, which threatens supply
• Increasing violence in Libya may impact exports, while the latter is already impacting supply.
• The strength of the U.S. dollar has an inverse relationship to oil prices.
• China’s economic performance, and the extent of government stimulus measures, will largely dictate the pace of oil demand growth
Natural Gas: While we plan on talking much more about natural gas in future issues, I will say here briefly that I expect the North American natural gas market to remain over-supplied for at least the next year. With this in mind, I recommend that investors stay heavily weighted to oil.
With that context in mind, let’s now turn to this month’s pick…a company that is poised to skyrocket in the coming months as oil prices rebound.
3. Recommended Stock: SM Energy Company - Positioned for Long-Term Growth
Now, let’s get down to business…
Of the companies I have been tracking for over a year, the first on my list ist. I am eyeing this one as a prime takeover target because of its outstanding growth and its reasonable price.
SM Energy is currently trading at approximately half of its net asset value. Within its core assets in the Eagle Ford Shale in South Texas and the Bakken / Three Forks play in North Dakota, SM has over 1,500 low risk development drilling locations and over a billion barrels equivalent of potentially recoverable oil, natural gas and natural gas liquids. This is the type of growth potential I look for ‘on the rebound’.
Overview
Denver-based SM Energy (NYSE: SM) is an independent oil and gas company that explores for and produces crude oil, natural gas, and natural gas liquids onshore North America. The company’s operations are focused on core areas managed by four regional offices: the South Texas & Gulf Coast, Mid-Continent, Rocky Mountains, and Permian regions.
Each office is staffed with a full complement of geologists, geophysicists, landmen and engineers who have extensive experience in the region or basin in which they work.
Here’s what I really like:SM Energy’s financial-driven strategy emphasizes Sustainable Growth and Shareholder Value. That is their ultimate goal and it is the most important thing to remember. The team behind SM to my mind has demonstrated sound, big-company managerial experience and it has shown a track record of
steady growth. The management team consists of alumni of Anadarko and ARCO—two wildly successful companies that tell me a lot about where SM Energy could be going.
The management team is comparably young (they are all in their 50s – still young in my book) and bring a strong sense of entrepre-neurship into the corporate culture. This value fits well into the genes of this rapidly growing energy company. By setting up regional offices, the company ensures that it captures the best suitable growth opportunities in each area.
When I talked with them I was immediately struck by their poise and their vision for growth. These guys know what they are doing.
2014 Performance
So how has SM really been performing?
For 2014, the company reported outstanding results, and they are well-positioned to build on this performance with increased production and reserve growth—even in a depressed oil price environment.
Here are some key performance aspects that have caught my eye:
SM Energy posted net income for the fourth quarter of 2014 of $331.7 million, or $4.91 per diluted share, compared to net income of $7.0 million, or $0.10 per diluted share, for the same period of 2013. That’s right, a massive increase in net income for a quarter that saw oil prices crash! SM Energy had average daily production of 176,000 barrels of oil equivalent (“BOE”) per day during the fourth quarter of 2014. That is 13% above what they had projected.
On April 16, 2015 SM Energy reported that first quarter production increased to 186,600 BOE per day, significantly higher than my forecast.
The production mix for the 4th quarter was 32% crude oil, 45% natural gas, and 23% NGLs. I’d like to see more crude oil in the mix, but this is still a pretty good balance.
The table below presents actual production and BOE cost metrics for the fourth quarter 2014, and full-year 2014, along with previ-ously issued guidance for the fourth quarter 2014 and full-year 2014:
A couple of other attractive aspects from SM Energy’s profile
As of 31 December 2014, SM Energy had estimated proved reserves of 547.7 million BOE, which is an increase of 28% from 428.7 million BOE at the end of 2013. These reserves are comprised of 169.7 million barrels of oil/condensate, 1,466.5 billion cubic feet of natural gas, and 133.5 million barrels of natural gas liquids (“NGLs”). The table below shows the company’s proved reserves by region.
Keep in mind that ‘proved’ or ‘proven’ reserves, or P1 reserves, is a metric that refers to the amount of resources that can actually be recovered from a deposit with a reasonable level of certainty. So SM is sitting on a ton of resources that will deliver a lot of value to shareholders.
oilprice.com I 7
Refineries are also stepping up to the plate. Refining companies turn crude oil into gasoline and jet fuel, and they are processing at a much higher rate than is normal for this time of year. That is because demand is strong and they know that oil prices won’t stay low forever. Interestingly, however, more refining activity only adds more demand to the market for crude, which will also contribute to a price rise in the coming months.
The U.S. consumes over 19 million barrels per day of refined products and still imports over 7 million barrels per day of crude oil. More demand equals higher prices. A Black Swan event?
Unfortunately investors cannot always rely on simple supply and demand figures. Sometimes unexpected geopolitical events alter the course of oil markets. One scenario that some investors are concerned about is the possibility that the sanctions against Iran are lifted under a nuclear deal with the West. How this will play out in the final round is anyone’s guess.
There are complex dynamics that will influence what happens with Iran over the next few months: hardliners in Iran may not be willing to make concessions, Republicans in the U.S. Congress may not be willing to sign off on a deal, the brewing war in Yemen could spiral out of control and derail talks, or another unforeseen development could influence the end game.
No more oil from Iran until 2016
But even with a deal, Iran is not going to just burst back onto the oil scene and contribute to the existing over-supply. These things take time. The sanctions against Iran will not be lifted until a final deal is signed.
And even then, it will take Iran six months or more to bring more than a few 100,000 barrels per day to market. It took Iran decades to recover production to just over half of what it was before the 1979 revolution. In other words, Iran likely won’t play a major role in oil markets over the next year.
The price of crude oil is impacted by a lot more than supply & demand:
• Violence in the Middle East is spreading, which threatens supply
• Increasing violence in Libya may impact exports, while the latter is already impacting supply.
• The strength of the U.S. dollar has an inverse relationship to oil prices.
• China’s economic performance, and the extent of government stimulus measures, will largely dictate the pace of oil demand growth
Natural Gas: While we plan on talking much more about natural gas in future issues, I will say here briefly that I expect the North American natural gas market to remain over-supplied for at least the next year. With this in mind, I recommend that investors stay heavily weighted to oil.
With that context in mind, let’s now turn to this month’s pick…a company that is poised to skyrocket in the coming months as oil prices rebound.
3. Recommended Stock: SM Energy Company - Positioned for Long-Term Growth
Now, let’s get down to business…
Of the companies I have been tracking for over a year, the first on my list ist. I am eyeing this one as a prime takeover target because of its outstanding growth and its reasonable price.
SM Energy is currently trading at approximately half of its net asset value. Within its core assets in the Eagle Ford Shale in South Texas and the Bakken / Three Forks play in North Dakota, SM has over 1,500 low risk development drilling locations and over a billion barrels equivalent of potentially recoverable oil, natural gas and natural gas liquids. This is the type of growth potential I look for ‘on the rebound’.
Overview
Denver-based SM Energy (NYSE: SM) is an independent oil and gas company that explores for and produces crude oil, natural gas, and natural gas liquids onshore North America. The company’s operations are focused on core areas managed by four regional offices: the South Texas & Gulf Coast, Mid-Continent, Rocky Mountains, and Permian regions.
Each office is staffed with a full complement of geologists, geophysicists, landmen and engineers who have extensive experience in the region or basin in which they work.
Here’s what I really like:SM Energy’s financial-driven strategy emphasizes Sustainable Growth and Shareholder Value. That is their ultimate goal and it is the most important thing to remember. The team behind SM to my mind has demonstrated sound, big-company managerial experience and it has shown a track record of
steady growth. The management team consists of alumni of Anadarko and ARCO—two wildly successful companies that tell me a lot about where SM Energy could be going.
The management team is comparably young (they are all in their 50s – still young in my book) and bring a strong sense of entrepre-neurship into the corporate culture. This value fits well into the genes of this rapidly growing energy company. By setting up regional offices, the company ensures that it captures the best suitable growth opportunities in each area.
When I talked with them I was immediately struck by their poise and their vision for growth. These guys know what they are doing.
2014 Performance
So how has SM really been performing?
For 2014, the company reported outstanding results, and they are well-positioned to build on this performance with increased production and reserve growth—even in a depressed oil price environment.
Here are some key performance aspects that have caught my eye:
SM Energy posted net income for the fourth quarter of 2014 of $331.7 million, or $4.91 per diluted share, compared to net income of $7.0 million, or $0.10 per diluted share, for the same period of 2013. That’s right, a massive increase in net income for a quarter that saw oil prices crash! SM Energy had average daily production of 176,000 barrels of oil equivalent (“BOE”) per day during the fourth quarter of 2014. That is 13% above what they had projected.
On April 16, 2015 SM Energy reported that first quarter production increased to 186,600 BOE per day, significantly higher than my forecast.
The production mix for the 4th quarter was 32% crude oil, 45% natural gas, and 23% NGLs. I’d like to see more crude oil in the mix, but this is still a pretty good balance.
The table below presents actual production and BOE cost metrics for the fourth quarter 2014, and full-year 2014, along with previ-ously issued guidance for the fourth quarter 2014 and full-year 2014:
A couple of other attractive aspects from SM Energy’s profile
As of 31 December 2014, SM Energy had estimated proved reserves of 547.7 million BOE, which is an increase of 28% from 428.7 million BOE at the end of 2013. These reserves are comprised of 169.7 million barrels of oil/condensate, 1,466.5 billion cubic feet of natural gas, and 133.5 million barrels of natural gas liquids (“NGLs”). The table below shows the company’s proved reserves by region.
Keep in mind that ‘proved’ or ‘proven’ reserves, or P1 reserves, is a metric that refers to the amount of resources that can actually be recovered from a deposit with a reasonable level of certainty. So SM is sitting on a ton of resources that will deliver a lot of value to shareholders.
Guidance Comparison
Average daily production (MB0E/d) Total production (MMBOE)
Costs Lease operating expense ($/BOE) Transportation expense ($/B0E Production tax, as a percentage of pre-derivative oil, gas, and NGL revenue
General and administrative - cash ($/B0E) General and administrative - cash related to Net Profits Plan ($/B0E) General and administrative - non-cash ($/B0E General and administrative - Total ($/B0E)
Depreciation, depletion, and amortization ($/B0E)
Taxes Effective income tax rate %of income tax that is current In the fourth quarter of 2014, cash G&A expenses per unit were higher than guidance due to performance-based bonus compensation, which was better than projected for the year as a result of Company performance exceeding its 2014 targets.
Actual
175.816.17
$4.66$5.77
4.7%
$2.80
$0.05$0.38$3.23
$13.56
Guidance
152-15913.9-14.7
$4.95-$5.20$6.05-$6.35
5.0%-5.5%
$2.25-$2.45
$0.15-$0.30$0.35-$0.55$2.75-$3.30
$14.00-$14.75
Actual
151.155.14
$4.74$6.11
4.7%
$2.43
$0.15$0.45$3.83
$13.92
37.4%0.2%
Guidance
145-14752.9-53.6
$4.85-$4.90$6.20-$6.30
5.0%-5.5%
$2.26-$2.31
$0.18-$0.22$0.44-$0.50$2.88-$3.03
$14.05-$14.25
37.0%-37.5%<3%
For the 3 Months Ended Dec. 31, 2014 For the 12 Months Ended Dec. 31, 2014

oilprice.com I 8
Refineries are also stepping up to the plate. Refining companies turn crude oil into gasoline and jet fuel, and they are processing at a much higher rate than is normal for this time of year. That is because demand is strong and they know that oil prices won’t stay low forever. Interestingly, however, more refining activity only adds more demand to the market for crude, which will also contribute to a price rise in the coming months.
The U.S. consumes over 19 million barrels per day of refined products and still imports over 7 million barrels per day of crude oil. More demand equals higher prices. A Black Swan event?
Unfortunately investors cannot always rely on simple supply and demand figures. Sometimes unexpected geopolitical events alter the course of oil markets. One scenario that some investors are concerned about is the possibility that the sanctions against Iran are lifted under a nuclear deal with the West. How this will play out in the final round is anyone’s guess.
There are complex dynamics that will influence what happens with Iran over the next few months: hardliners in Iran may not be willing to make concessions, Republicans in the U.S. Congress may not be willing to sign off on a deal, the brewing war in Yemen could spiral out of control and derail talks, or another unforeseen development could influence the end game.
No more oil from Iran until 2016
But even with a deal, Iran is not going to just burst back onto the oil scene and contribute to the existing over-supply. These things take time. The sanctions against Iran will not be lifted until a final deal is signed.
And even then, it will take Iran six months or more to bring more than a few 100,000 barrels per day to market. It took Iran decades to recover production to just over half of what it was before the 1979 revolution. In other words, Iran likely won’t play a major role in oil markets over the next year.
The price of crude oil is impacted by a lot more than supply & demand:
• Violence in the Middle East is spreading, which threatens supply
• Increasing violence in Libya may impact exports, while the latter is already impacting supply.
• The strength of the U.S. dollar has an inverse relationship to oil prices.
• China’s economic performance, and the extent of government stimulus measures, will largely dictate the pace of oil demand growth
Natural Gas: While we plan on talking much more about natural gas in future issues, I will say here briefly that I expect the North American natural gas market to remain over-supplied for at least the next year. With this in mind, I recommend that investors stay heavily weighted to oil.
With that context in mind, let’s now turn to this month’s pick…a company that is poised to skyrocket in the coming months as oil prices rebound.
3. Recommended Stock: SM Energy Company - Positioned for Long-Term Growth
Now, let’s get down to business…
Of the companies I have been tracking for over a year, the first on my list ist. I am eyeing this one as a prime takeover target because of its outstanding growth and its reasonable price.
SM Energy is currently trading at approximately half of its net asset value. Within its core assets in the Eagle Ford Shale in South Texas and the Bakken / Three Forks play in North Dakota, SM has over 1,500 low risk development drilling locations and over a billion barrels equivalent of potentially recoverable oil, natural gas and natural gas liquids. This is the type of growth potential I look for ‘on the rebound’.
Overview
Denver-based SM Energy (NYSE: SM) is an independent oil and gas company that explores for and produces crude oil, natural gas, and natural gas liquids onshore North America. The company’s operations are focused on core areas managed by four regional offices: the South Texas & Gulf Coast, Mid-Continent, Rocky Mountains, and Permian regions.
Each office is staffed with a full complement of geologists, geophysicists, landmen and engineers who have extensive experience in the region or basin in which they work.
Here’s what I really like:SM Energy’s financial-driven strategy emphasizes Sustainable Growth and Shareholder Value. That is their ultimate goal and it is the most important thing to remember. The team behind SM to my mind has demonstrated sound, big-company managerial experience and it has shown a track record of
steady growth. The management team consists of alumni of Anadarko and ARCO—two wildly successful companies that tell me a lot about where SM Energy could be going.
The management team is comparably young (they are all in their 50s – still young in my book) and bring a strong sense of entrepre-neurship into the corporate culture. This value fits well into the genes of this rapidly growing energy company. By setting up regional offices, the company ensures that it captures the best suitable growth opportunities in each area.
When I talked with them I was immediately struck by their poise and their vision for growth. These guys know what they are doing.
2014 Performance
So how has SM really been performing?
For 2014, the company reported outstanding results, and they are well-positioned to build on this performance with increased production and reserve growth—even in a depressed oil price environment.
Here are some key performance aspects that have caught my eye:
SM Energy posted net income for the fourth quarter of 2014 of $331.7 million, or $4.91 per diluted share, compared to net income of $7.0 million, or $0.10 per diluted share, for the same period of 2013. That’s right, a massive increase in net income for a quarter that saw oil prices crash! SM Energy had average daily production of 176,000 barrels of oil equivalent (“BOE”) per day during the fourth quarter of 2014. That is 13% above what they had projected.
On April 16, 2015 SM Energy reported that first quarter production increased to 186,600 BOE per day, significantly higher than my forecast.
The production mix for the 4th quarter was 32% crude oil, 45% natural gas, and 23% NGLs. I’d like to see more crude oil in the mix, but this is still a pretty good balance.
The table below presents actual production and BOE cost metrics for the fourth quarter 2014, and full-year 2014, along with previ-ously issued guidance for the fourth quarter 2014 and full-year 2014:
A couple of other attractive aspects from SM Energy’s profile
As of 31 December 2014, SM Energy had estimated proved reserves of 547.7 million BOE, which is an increase of 28% from 428.7 million BOE at the end of 2013. These reserves are comprised of 169.7 million barrels of oil/condensate, 1,466.5 billion cubic feet of natural gas, and 133.5 million barrels of natural gas liquids (“NGLs”). The table below shows the company’s proved reserves by region.
Keep in mind that ‘proved’ or ‘proven’ reserves, or P1 reserves, is a metric that refers to the amount of resources that can actually be recovered from a deposit with a reasonable level of certainty. So SM is sitting on a ton of resources that will deliver a lot of value to shareholders.
In addition to steadily growing production and a strong base of proven reserves, SM Energy has a very strong balance sheet with more than enough liquidity to carry out its growth plan. It doesn’t have debt due until 2019. In other words, it can actually afford to do what it plans to do—it’s not going to get stuck on paper.
Regional proved oil and gas reserve quantities:
Year-end 2014 proved reserves Oil (MMBbI) Gas (Bcf) NGL ( MM Bbl)Total (MMBOE)% Proved developed
Year-end 2013 proved reserves Oil (MMBbI) Gas(Bcf) NGL (MMBblTotal (MMBOE)% Proved developed
*Totals may not sum due to rounding.
South Texas &Gulf Coast
64.51,193.3131.2394.648%
50.6947.3102.7311.242%
RockyMountain
91.589.62.0
108.456%
64.072.1
-76.058%
Permian
13.538.9
-20.076%
11.826.9
-16.321%
MidContinent
0.2144.80.424.783%
0.2142.91.2
25.278%
Total
169.71,466.5
133.5547.752%
126.61,189.3
103.9428.749%
Regional proved oil and gas reserve quantities:
Total proved reservesBegeinning of yearRevisions of previous estimatesDiscoveries and extensionsInfillSales of reservesPurchases of minerals in placeProductionCanversionsEnd of year
PV-10 (in millions)
Proved developed reservesBeginning of yearEnd of year
*Totals may not sum due to rounding.
Oil or Condensate
(MMBbl)
126.6(5.1)15.032.0(19)19.8(16.7)
-169.7
70.289.3
Gas(Bcf)
1,189.346.0103.5270.8(1.1)10.9
(152.9)-
1,466.5
569.2784.6
NGLs
(MMBbl)
103.97.8
10.524.1
-0.2
(13.0)-
133.5
43.866.7
Equivalents(MMBOE)
428.710.442.7101.2(2.1)21.9(55.1)
-547.7
$7,616.9
208.9286.8
ProvedDeveloped(MMBOE)
208.98.114.716.2(2.1)7.9
(55.1)88.2286.8
$5,253.0
ProvedUndeveloped
(MMBOE)
219.92.3
28.085.0
-13.9
-(88.2)260.9
$2,363.9
For the Year ended Dec 31, 2014

oilprice.com I 9
2015 Guidance
On 24 February 2015, during the company’s earnings call, SM Energy President and CEO Jay Ottoson, remarked:
“SM Energy had a strong finish to 2014 as we continued to deliver on improvements in the productivity of our core development assets. We entered 2015 with a strong balance sheet and ample liquidity. Our entire focus now is to translate these competitive advantages into differential returns for our shareholders in what we believe will be a period of dramatic transition in our industry. We intend to accomplish this by rapidly reducing our activity level and positioning ourselves to generate strong, peer leading returns after costs adjust to the lower oil price environment.”
Again, everything they’ve shown us points to boosting shareholder value. Instead of growth at all costs, shareholders will benefit from the prudent, value-based approach.
Here is how:
In 2015, SM Energy plans to invest approximately $1.0 billion in drilling and completion (“D&C”) capital, a near 44% reduction from 2014.
SM Energy will slash rig counts from 17 down to 7 in order to reduce costs.
SM Energy expects D&C cost reductions of 15% to 20% by year-end, depending on the basin.
In other words, SM Energy plans on reducing costs in line with a healthy balance sheet, and focus on core assets. But here’s the twist: the oil patch is seeing dramatic cost declines across the board. As oil prices fall, so do the costs of everything from rigs, to equipment, to well completions. I believe that D&C costs in the South Texas Eagle Ford play will drop by more than 30%, which will significantly improve the economics of SM Energy’s capital program.
$0
$500
$1,000
$1,500
$2,000
$2,500
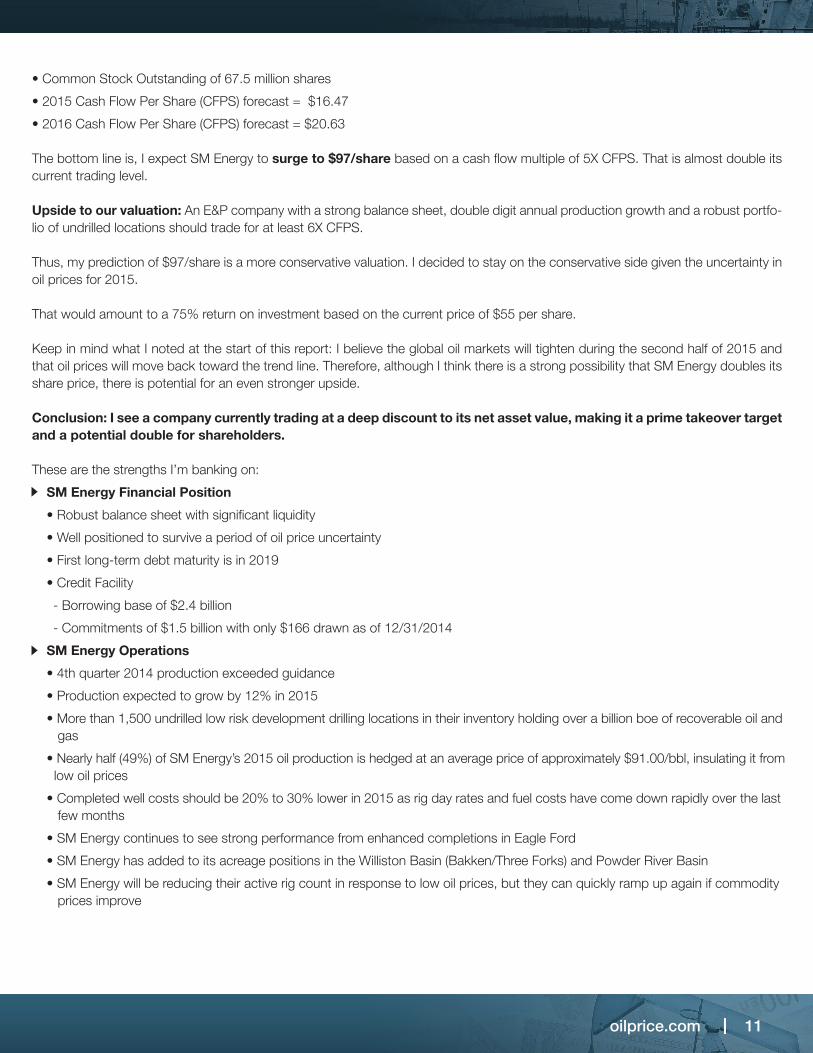
DEBT MATURITIES AS OF December 31, 2014
(in millions)
Borrowing Base -$2.4 billion
Commitment -$1.5 billion
$166 million drawn
Revolving Credit FacilitySenior Notes due 2019Senior Notes due 2021
Strong balance sheet with significant liquidity.
First debt maturity is in 2019.
Credit Facility: Matures in 2019 Borrowing base of $2.4
billion Commitments of $1.5
billionSenior Notes due 2022Senior Notes due 2023Senior Notes due 2024
Financial Position

oilprice.com I 10
In the operated Eagle Ford shale program, 90 completions were made during 2014, 23 of which occurred in the fourth quarter. At year-end 2014, SM Energy had 334 producing wells. SM Energy is also becoming more efficient with each well that it drills. The most recent wells have longer laterals and larger sand loadings, which ultimately boost the recovery of oil and gas.
So I’m looking right now at a company whose estimated ultimate recovery (“EUR”) per location in the Eagle Ford is very likely to increase. In turn, this will significantly increase SM Energy’s proven reserve base and net asset value (“NAV”) per share. That’s money in the bank for me. Based on the capital budget and program discussed above, SM Energy anticipates full-year 2015 production to range from 60.4 to 63.5 MMBOE (165-174 MBOE/d). The midpoint of this guidance represents annual production growth of approximately 12% year over year.
2015 Net Income and Cash Flow Forecast
Ok, now we will get a bit more in the weeds, so bear with me. Below are some of my financial projections for SM Energy.
My 2015 Net Income and Cash Flow Forecast for SM Energy is based on an average oil price of $63.75/bbl; natural gas at $3.50/mcf; and natural gas liquids averaging $25.80/bbl for the year. Prices used in this model take into consideration the company’s hedges in place at December 31, 2014 and regional price differentials:
• Revenues forecast $2.223 billion - including realized gains (losses) on hedges
• Operating Expenses forecast $1.859 billion – including non-cash expenses (primarily DD&A) of $869 million
• Operating Cash Flows forecast $1.112 billion – based on 2015 estimated capital budget of $1.2 billion
• Common Stock Outstanding of 67.5 million shares
• 2015 Cash Flow Per Share (CFPS) forecast = $16.47
• 2016 Cash Flow Per Share (CFPS) forecast = $20.63
The bottom line is, I expect SM Energy to surge to $97/share based on a cash flow multiple of 5X CFPS. That is almost double its current trading level.
Upside to our valuation: An E&P company with a strong balance sheet, double digit annual production growth and a robust portfo-lio of undrilled locations should trade for at least 6X CFPS.
Thus, my prediction of $97/share is a more conservative valuation. I decided to stay on the conservative side given the uncertainty in oil prices for 2015.
That would amount to a 75% return on investment based on the current price of $55 per share. Keep in mind what I noted at the start of this report: I believe the global oil markets will tighten during the second half of 2015 and that oil prices will move back toward the trend line. Therefore, although I think there is a strong possibility that SM Energy doubles its share price, there is potential for an even stronger upside.
Conclusion: I see a company currently trading at a deep discount to its net asset value, making it a prime takeover target and a potential double for shareholders.
These are the strengths I’m banking on:
SM Energy Financial Position
• Robust balance sheet with significant liquidity
• Well positioned to survive a period of oil price uncertainty
• First long-term debt maturity is in 2019
• Credit Facility
- Borrowing base of $2.4 billion
- Commitments of $1.5 billion with only $166 drawn as of 12/31/2014
SM Energy Operations
• 4th quarter 2014 production exceeded guidance
• Production expected to grow by 12% in 2015
• More than 1,500 undrilled low risk development drilling locations in their inventory holding over a billion boe of recoverable oil and gas
• Nearly half (49%) of SM Energy’s 2015 oil production is hedged at an average price of approximately $91.00/bbl, insulating it from low oil prices
• Completed well costs should be 20% to 30% lower in 2015 as rig day rates and fuel costs have come down rapidly over the last few months
• SM Energy continues to see strong performance from enhanced completions in Eagle Ford
• SM Energy has added to its acreage positions in the Williston Basin (Bakken/Three Forks) and Powder River Basin
• SM Energy will be reducing their active rig count in response to low oil prices, but they can quickly ramp up again if commodity prices improve
Key Points to Remember:
• SM Energy has the combination of strong production growth and very low development costs (under $15 per boe for 2015) that should have this stock trading at a much higher multiple of cash flow per share
• SM Energy has more than enough cash flow and access to capital to fund their aggressive growth program
• Low cost environment presents opportunities to add new positions
• As of March 31, 2015, First Call 12-month price target is $60.72
• Our Fair Value Estimate for SM Energy common stock is $97.00/share
That does it for this month’s report. This is just the tip of the iceberg. Next month, I’ll bring you another great opportunity on the rebound to keep you ahead of this dynamic game.
Company website: www.sm-energy.com
4. Position Updates
Below is my first pick, where I recommend a trailing stop approach in order to limit losses and protect unrealized gains. Each month I will add new picks, and I’ll also include updates on our previous picks.
Thanks for reading, and we’ll see you next month.
Production and cost guidance for full-year 2015 is provided in the table below
Production (MMBOE)Average daily production (NIPOE/d)
LOE ($/B0E)Ad Valorem ($/BOE) Transportation ($/BOE)Production Taxes (% of pre-derivative O&G revenue) G&A - cash ($/B0E)G&A - non-cash ($/130E)G&A Total ($/BOE)
DD&A ($/B0E)
Effective income tax rate range % of income tax that is current General and administrative - cash for 2015 includes approximately $12.5 million, or $0.20/B0E, of non-recurring costs related to the expected mid-year closure of the Company's office in Tulsa, Oklahoma.
2015 Capital Guidance(in millions)
Program Eagle Ford Bakken/Three Forks OtherDrilling and Completion Subtotal
Non-drilling & New Ventures
Total
Operated$ 470 195 170$ 835
Non-operated$ 135 60 15$ 210
Total$ 605 255 185
$ 1,045
185
$ 1,230
FY 201560.4 - 63.5165 - 174
$4.40 - $4.65$0.50 - $0.55$6.25 - $6.554.5%- 5.0%
$2.50 - $2.80$0.30 - $0.40$2.80 - $3.20
$13.00 - $13.80
36.3%- 37.5%<3%
oilprice.com I 11
2015 Net Income and Cash Flow Forecast
Ok, now we will get a bit more in the weeds, so bear with me. Below are some of my financial projections for SM Energy.
My 2015 Net Income and Cash Flow Forecast for SM Energy is based on an average oil price of $63.75/bbl; natural gas at $3.50/mcf; and natural gas liquids averaging $25.80/bbl for the year. Prices used in this model take into consideration the company’s hedges in place at December 31, 2014 and regional price differentials:
• Revenues forecast $2.223 billion - including realized gains (losses) on hedges
• Operating Expenses forecast $1.859 billion – including non-cash expenses (primarily DD&A) of $869 million
• Operating Cash Flows forecast $1.112 billion – based on 2015 estimated capital budget of $1.2 billion
• Common Stock Outstanding of 67.5 million shares
• 2015 Cash Flow Per Share (CFPS) forecast = $16.47
• 2016 Cash Flow Per Share (CFPS) forecast = $20.63
The bottom line is, I expect SM Energy to surge to $97/share based on a cash flow multiple of 5X CFPS. That is almost double its current trading level.
Upside to our valuation: An E&P company with a strong balance sheet, double digit annual production growth and a robust portfo-lio of undrilled locations should trade for at least 6X CFPS.
Thus, my prediction of $97/share is a more conservative valuation. I decided to stay on the conservative side given the uncertainty in oil prices for 2015.
That would amount to a 75% return on investment based on the current price of $55 per share. Keep in mind what I noted at the start of this report: I believe the global oil markets will tighten during the second half of 2015 and that oil prices will move back toward the trend line. Therefore, although I think there is a strong possibility that SM Energy doubles its share price, there is potential for an even stronger upside.
Conclusion: I see a company currently trading at a deep discount to its net asset value, making it a prime takeover target and a potential double for shareholders.
These are the strengths I’m banking on:
SM Energy Financial Position
• Robust balance sheet with significant liquidity
• Well positioned to survive a period of oil price uncertainty
• First long-term debt maturity is in 2019
• Credit Facility
- Borrowing base of $2.4 billion
- Commitments of $1.5 billion with only $166 drawn as of 12/31/2014
SM Energy Operations
• 4th quarter 2014 production exceeded guidance
• Production expected to grow by 12% in 2015
• More than 1,500 undrilled low risk development drilling locations in their inventory holding over a billion boe of recoverable oil and gas
• Nearly half (49%) of SM Energy’s 2015 oil production is hedged at an average price of approximately $91.00/bbl, insulating it from low oil prices
• Completed well costs should be 20% to 30% lower in 2015 as rig day rates and fuel costs have come down rapidly over the last few months
• SM Energy continues to see strong performance from enhanced completions in Eagle Ford
• SM Energy has added to its acreage positions in the Williston Basin (Bakken/Three Forks) and Powder River Basin
• SM Energy will be reducing their active rig count in response to low oil prices, but they can quickly ramp up again if commodity prices improve
Key Points to Remember:
• SM Energy has the combination of strong production growth and very low development costs (under $15 per boe for 2015) that should have this stock trading at a much higher multiple of cash flow per share
• SM Energy has more than enough cash flow and access to capital to fund their aggressive growth program
• Low cost environment presents opportunities to add new positions
• As of March 31, 2015, First Call 12-month price target is $60.72
• Our Fair Value Estimate for SM Energy common stock is $97.00/share
That does it for this month’s report. This is just the tip of the iceberg. Next month, I’ll bring you another great opportunity on the rebound to keep you ahead of this dynamic game.
Company website: www.sm-energy.com
4. Position Updates
Below is my first pick, where I recommend a trailing stop approach in order to limit losses and protect unrealized gains. Each month I will add new picks, and I’ll also include updates on our previous picks.
Thanks for reading, and we’ll see you next month.
Name Symbol Buy Date Buy Price Stop Price Comments
SM Energy SM 4/26 $55 $41 Buy. Initiate 15% or 25% trailing stop to protect gains, depending on your risk appetite