small area pro ciency estimation - educational testing … of the piaac population modeling for...
TRANSCRIPT

Extension of the PIAAC Population Modeling for Pro!ciency Estimation without Direct Assessment
Kentaro Yamamoto, ETS
Small Area Pro!ciency Estimation

Outline of Presentation• What is Small Area Estimation and Why It is Important?
• Distinguishing Individual Testing and Large Scale Assessments
• Use of Population Modeling in PIAAC
• Extension of Population Modeling to Small Area Estimation
• Future Applications

Why Small Area Estimation (SAE)?• PIAAC provides extensive data useful for
researchers and policy makers on hundreds of cognitive tasks and background questions from large national samples.
• PIAAC requires effort, money and time in order to develop instruments, conduct survey and reporting making it difficult to conduct frequently.
- Policy makers are interested:to know the pro!ciency distribution of those who did not participate in PIAACto know the pro!ciency distribution of some population in the future
• SAE methodology provides policy makers with information they seek while reducing burden on time, money and effort.

Previous Efforts on Small Area Estimation• Longford, N. T. (1999, 2005)
• Mislevy, R. J. (1985)
• Mohadjer, L., Kalton, G., Krenzke, T., Liu, B.,Van de Kerchove, W., Li, L., Sherman, D., Dillman, J., Rao, J., and White, S. (2009)
• Rao, J. N. K. (1999) • Reder, S. (1994) • Sarndal, C. E. (1984)

Moving from Individual Testing to Small Area Estimation
• Skill accuracy for each respondent
• Large Cognitive Data
• Accuracy of skill distributions of groups of respondents
• Responses are on a sample of items drawn from a pool of items representing construct
• Responses to extensive background questions
• Accuracy of skill distributions of groups of respondents
• Population Model parametersStatistics of population characteristics
Individual Testing Population Assessment Small Area Estimation

Accurate Estimation of Individual Skill• Accurately evaluating the
pro!ciency of an individual for diagnosis, selection or placement by administering many cognitive items that represent the domain of testing as completely as possible.
Responses to cognitive itemsResponses to BQ
Exam
inee
Identify examinee
Individual skill estimate
P(x|θ,β,α)

Population Assessment is to Estimate Distributions of Subpopulations• Accurately evaluating pro!ciency
distributions of sampled respondents to provide empirically grounded interpretations to inform policy decisions by administering sampled cognitive items and background questions concerning skill development, social outcomes, and demographic characteristics. Sa
mpl
ed N
atio
nal
popu
latio
n
Subpopulation skill distribution
P(x|θ,β,α)
Responses to cognitive items

Reducing Cognitive Items Increases Measurement Errors
•Reduced information results in increased measurement errors.
Reduced Responses to cognitive items
Sam
pled
Nat
iona
l po
pula
tion
Subpopulation skill distribution
P(x|θ,β,α)
• Sampled items instead of all items that represent assessment construct are administered to each respondent.

Incorporation of Background Information and Cognitive Responsesto Represent Pro!ciencies
Population Modeling:

Incorporating BQ Restores Accuracy of Distribution Estimates• BQ data augment the
reduced to cognitive data to increase the accuracy of estimating the subpopulation distributions.
Reduced responses to cognitive itemsResponses to BQ
Sam
pled
Nat
iona
l po
pula
tion
Subpopulation skill distribution
P(x|θ,β,α) N (yΓ, ∑)
P(θ|x,y, Γ, Σ)

PIAAC Analysis is Based on Cognitive Data and BQ Responses to cognitive
itemsResponses to BQ
Nat
iona
l pop
ulat
ion
Subpopulation skill distributions

Completed PIAAC Database for Analyses• Accurately evaluating
pro!ciency distributions of sampled respondents to provide empirically grounded interpretations to inform policy decisions by administering sampled cognitive items and background questions concerning skill development, social outcomes, and demographic characteristics.
Reduced responses to cognitive itemsResponses to BQ
Sam
pled
Nat
iona
l po
pula
tion
Subpopulation skill distribution

Evaluating Small Area Estimation Feasibility in Steps:1
1.Based on the most strongly related BQ variables and item responses produce population model.
Reduced responses to cognitive itemsResponses to BQ
Sam
pled
Nat
iona
l po
pula
tion
Subpopulation skill distribution
Strongly related to skillP(x|θ,β,α) N (yΓ, ∑)
P(θ|x,y, Γ, Σ)

Evaluating Small Area Estimation FeasibilityNo responses to cognitive itemsResponses to BQ
Sam
pled
Nat
iona
l po
pula
tion
Subpopulation skill distribution1. Based on the most strongly
related BQ variables and item responses produce population model.
2. Eliminate cognitive responses3. Estimate subpopulation skill
distribution
Strongly related to skill
N (yΓ, ∑)
P(θ|y, Γ, Σ)

Evaluating Small Area Estimation FeasibilityNo responses to cognitive items
Population model parameters from survey
Projected Subpopulation skill distribution1. Based on the most strongly
related BQ variables and item responses produce population model parameters (Γ, ∑).
• Incorporate external data on common background variables
• Still no cognitive responsesStrongly related to skill
Statistics on selected common variables
(Γ, ∑)
P(θ|y, Γ, Σ)
y

Data for Population Assessment: Reality of DataResponses to cognitive itemsResponses to BQ
Sam
pled
Nat
iona
l po
pula
tion
Strongly related to skillLess related to skill
Skill distribution
>5 cognitive response
<5 cognitive responses

Why Canadian English Data?•Canada collected over 27000 samples
•Over 21000 cases in English alone
•Accuracy of small area estimation for the subset of samples under reduced data can be evaluated against actually observed data
•7 background questions were selected for consideration, Gender, Age, Education, Native/non-Native, Employment Status, Province, and PIAAC routing.
Background variables
Cognitive items
Population statistics
1) Reported Full 1Population Model All All Canada-E
2) 7BQ/IR 7BQ All Canada-E
3) 7BQ/no IR 7BQ NO Canada-E
4) Full BQ/IR Ontario All All Ontario
5) 7BQ/IR Ontario 7BQ All Ontario
6) 7BQ/no IR Ontario 7BQ NO Ontario
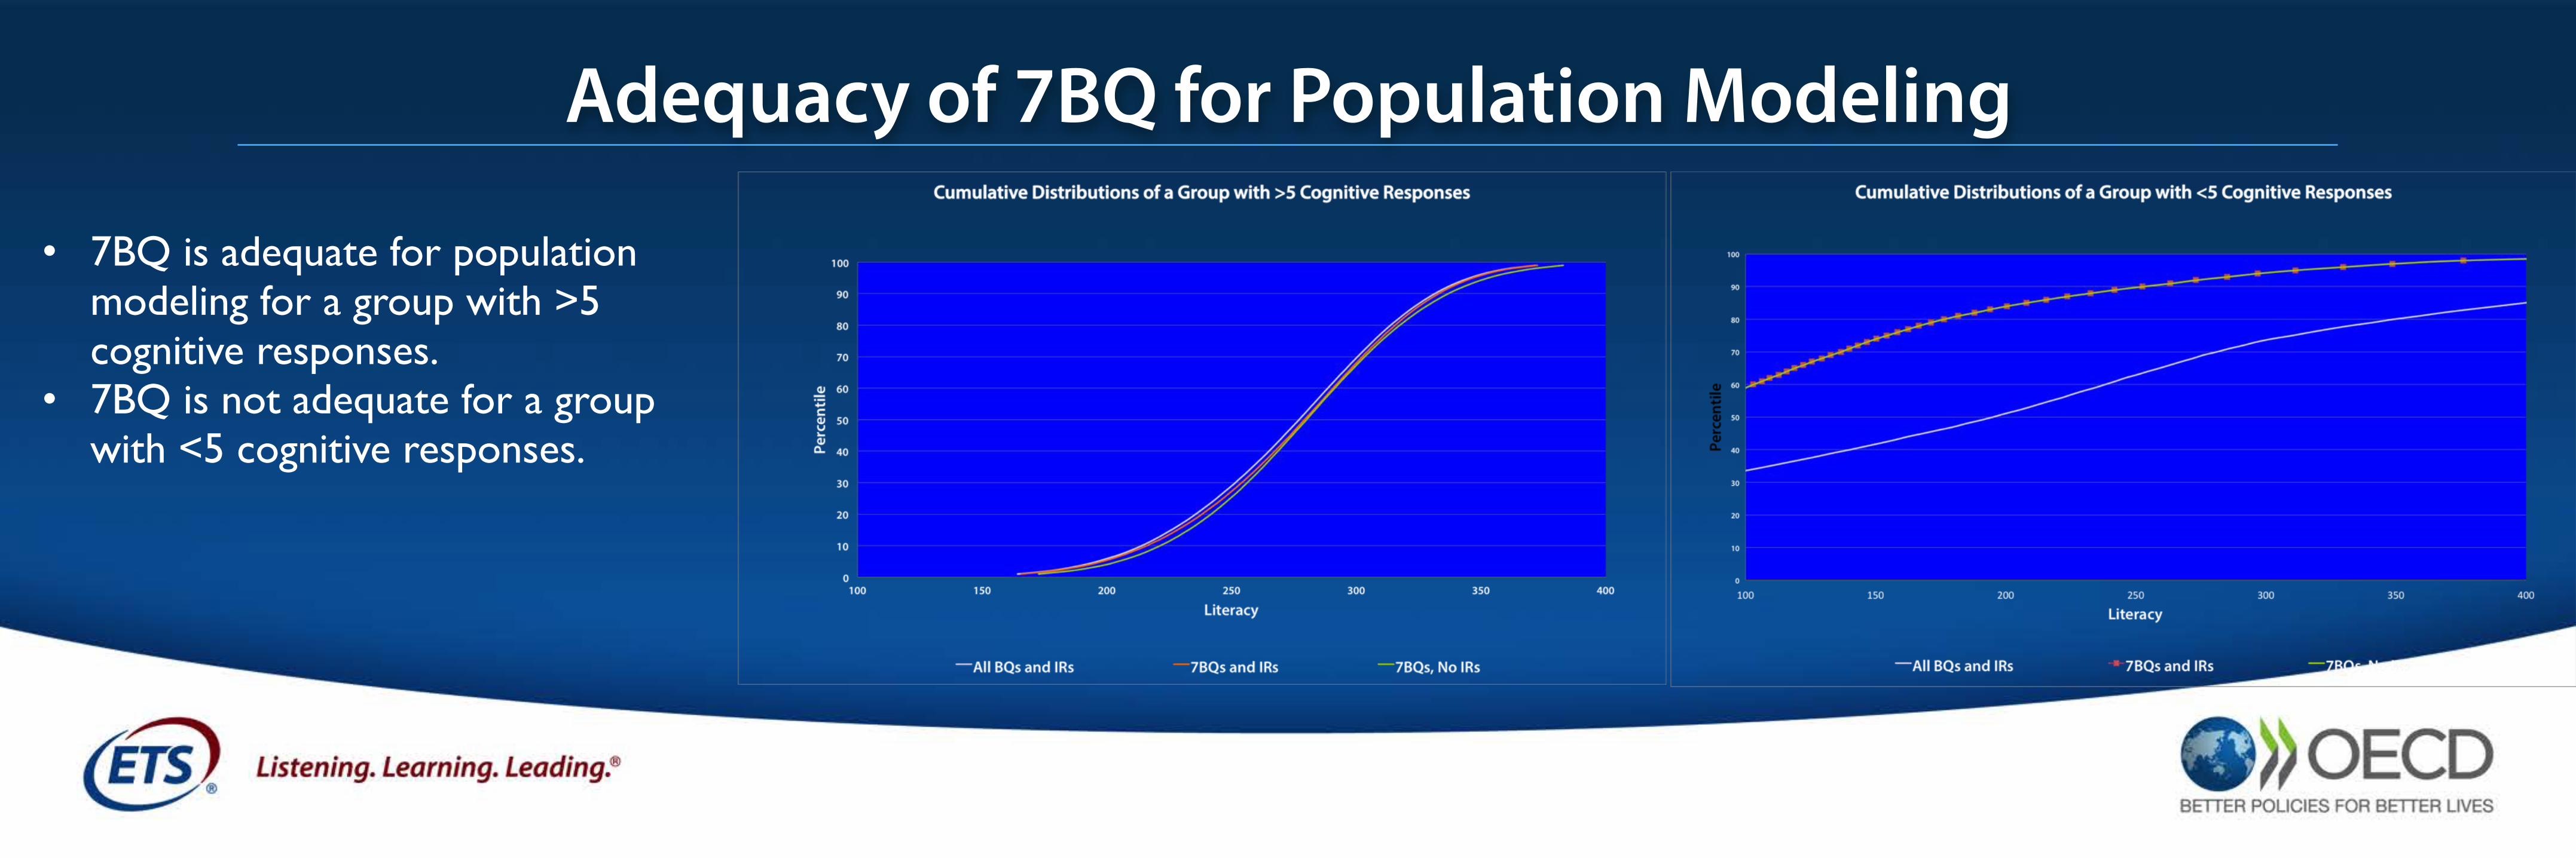
• 7BQ is adequate for population modeling for a group with >5 cognitive responses.
• 7BQ is not adequate for a group with <5 cognitive responses.
Adequacy of 7BQ for Population Modeling

Evaluation of the Methodology on Canada-E Data•7BQ without item responses reproduced the best estimates with all BQ and all cognitive responses for national Canadian English samples.
Background variables
Cognitive items
Population statistics
1) Reported Full Population Model All All Canada-E
2) 7BQ/IR 7BQ All Canada-E
3) 7BQ/no IR 7BQ NO Canada-E
4) Full BQ/IR Ontario All All Ontario
5) 7BQ/IR Ontario 7BQ All Ontario
6) 7BQ/no IR Ontario 7BQ NO Ontario

Evaluation of the Methodology on Canada-E Data
• 7BQ without item responses reproduced the best estimates with all BQ and all cognitive responses for national Canadian English samples.

Evaluation of the Methodology on Ontario-E Data
• 7BQ without item responses reproduced the best estimates with all BQ and all cognitive responses for Ontario even though the population model was based on the national Canadian English data.

Observations of Estimation Errors• Subpopulation means and cumulative distributions
were well estimated for those with greater than 5 cognitive responses based on the population model of 7 BQ and no item responses.
• Larger subgroups means and cumulative distributions for combined populations regardless of amount of cognitive responses were well estimated for both English speaking populations of Canada and Ontario.
• Estimation errors on the means were greater (>10) for some small groups such as those who do not report level of education (1.4%), those with Ph D.(0.6%), permanently disabled (3.4%), and and not so small groups such as immigrant (18.9%), and failed ICT core(6.2%) and refused to take CBA.

Approaches to Increase Accuracy• Further development on the population model can be realized using the full interaction among
background variables to increase accuracy.
• 7 variables are not sufficient for some of the groups to capture covariance with pro!ciencies for those who respond less than 5 cognitive items. Search for the best combination of BQ variables.
• All groups with large errors have often 50% or more who responded less than 5 cognitive responses, i.e., not sufficient information to estimate population parameters.

Future Applications• Estimate pro!ciency distributions of a group of special interest, a region, and a state based on
the national population model.
• Smaller population model with reduced BQ enables us to use a subset of national data to develop unique population model for further customization as well as optimization.
• Use of census information to monitor changes in demographic characteristics to be re$ected in pro!ciency distributions based on the optimized population model based on the common variables.

Conclusion• Large Scale Assessments such as PIAAC provide a reliable and valid database that can be used
by researchers and others to inform policy makers. Because they require a lot of resources to develop and implement there is some concern about the resources needed to conduct them frequently. This presentation provides a conceptual approach to Small Area Estimation using population modeling based on direct assessments, and demonstrates that it can provide reliable and valid estimates of pro!ciency distributions with much less demands on resources.

Thank you for your attention