small business access to capital - nsba.biz on credit unions to strengthening sba lending programs...
TRANSCRIPT

ACCESS TO CAPITALSMALL BUSINESS
SURVEY
2
In the last four years, small businesses have struggled to find reasonable, affordable capital. According to NSBA data from as far back as 1993, there is a clear correlation to a small-business owner’s ability to hire and his/her ability to get financing. When small businesses can access adequate financing, they create jobs—an important footnote given the persistent economic challenges facing the U.S. In addition to our biannual Economic Reports, NSBA’s new Small Business Access to Capital Survey aims to address the issue by providing detailed insight on how small businesses utilize financing and how cash-flow issues impact their business.
Amid all the noise about the importance of small business and claims that lending is improving—or was never really the issue—NSBA has continued to call for a better understanding of small-business lending and the support of policies that promote greater access to capital. The prospect of getting financed as a small business—even in a growing economy—is very difficult simply due to the fact that many small businesses lack the assets necessary for a traditional bank loan, making them a riskier lending option for banks.
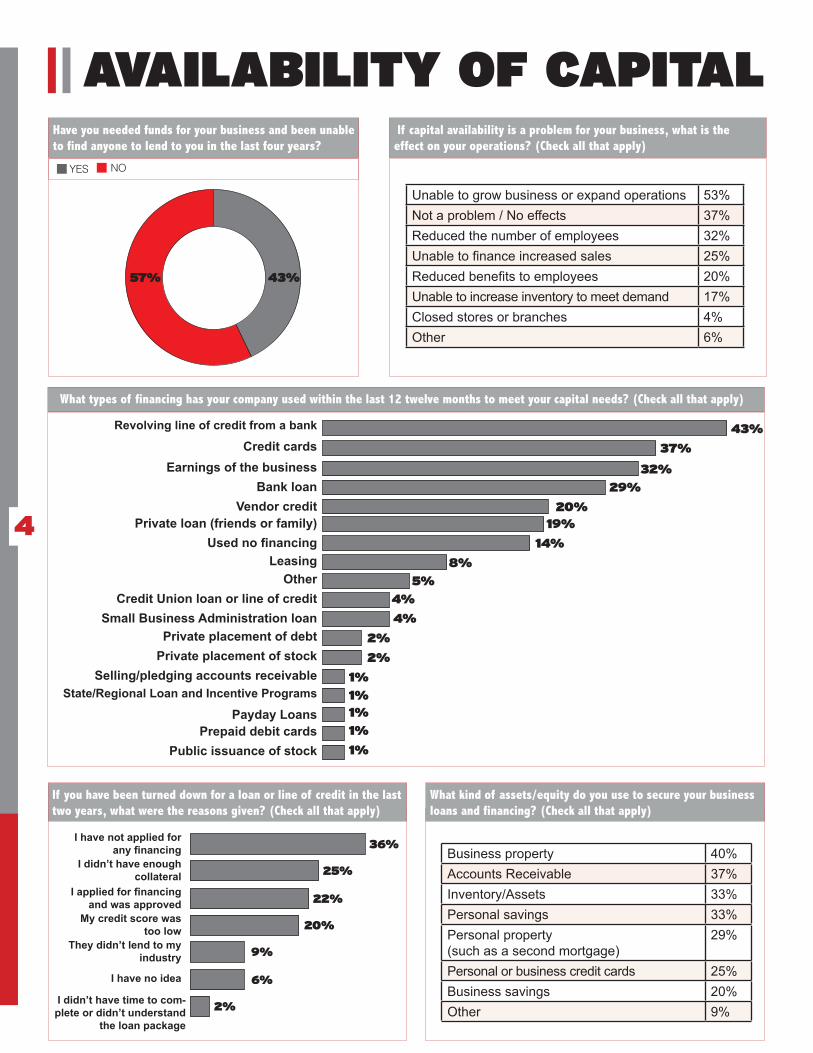
Unfortunately that challenge has only been exacerbated in recent years. According to the survey, nearly half (43 percent) of small-business respondents said that, in the last four years, they needed funds and were unable to find any willing sources, be it loans, credit cards or investors. This failure to secure financing has caused 32 percent to reduce their number of employees, 20 percent to reduce employee benefits and 17 percent were unable to meet existing demand.
Nearly one in three (29 percent) small-business respondents report that, in the last four years, their loans or lines of credit were reduced. Perhaps even more concerning - nearly one in 10 had their loans or lines of credit called in early by the bank. Among those whose loan or line of credit was called in early, 19 percent were given less than 15 days.
Given that the average balance on a loan or line of credit is $256,060, 15 days is a death sentence for most small businesses. Adding insult to injury, 60 percent of those who reported changes to their loans or lines of credit stated that the reason was due to the bank’s internal risk assessment, and 15 percent weren’t even given a reason.
While the majority of small-business respondents (60 percent) say they use a large bank, only small community banks (73 percent total positive rating) and credit unions were (60 percent total positive rating) received a majority overall positive rating by respondents. Large banks came in third with a 47 percent total positive rating.
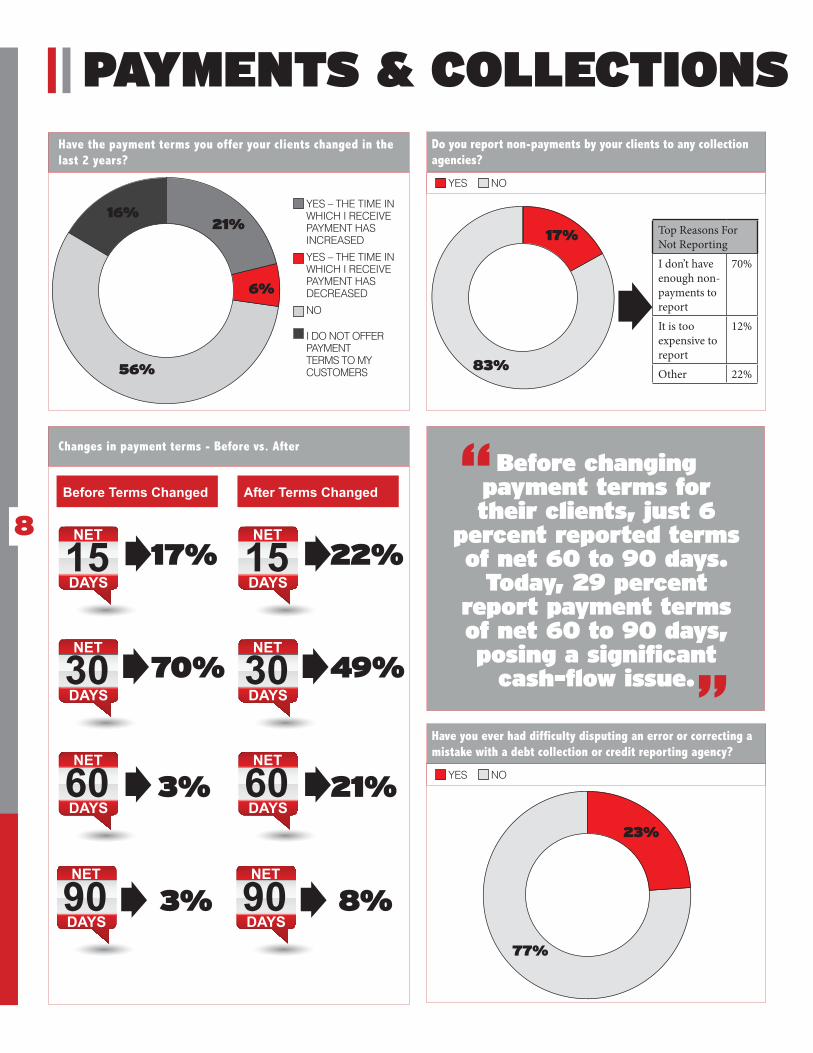
Cash-flow problems for small companies don’t just stem from difficulties with outside financing. Small businesses also are getting pinched when it comes to client payments. Twenty-one percent of respondents reported longer payment times by their clients with a notable jump in terms of net 60 to 90 days. Furthermore, federal contractors also are getting squeezed, with 55 percent of small subcontractors reporting late payments from a prime contractor.
Despite the relatively gloomy outlook on small-business financing, there are a few bright spots--namely the recently-passed JOBS Act has made 19 percent of small-business respondents more likely to seek outside investors. Yet more must be done to improve finance options for small business, from increasing the lending cap on credit unions to strengthening SBA lending programs to reforming the way the banking industry treats small-business loans.
We hope you find this survey—which was conducted on-line among 300 small-business members of NSBA for three weeks in May 2012—informative.
Sincerely,
Chris Holman Todd McCrackenNSBA Chair NSBA President and CEOMichigan Business Network
FOREWORD
3
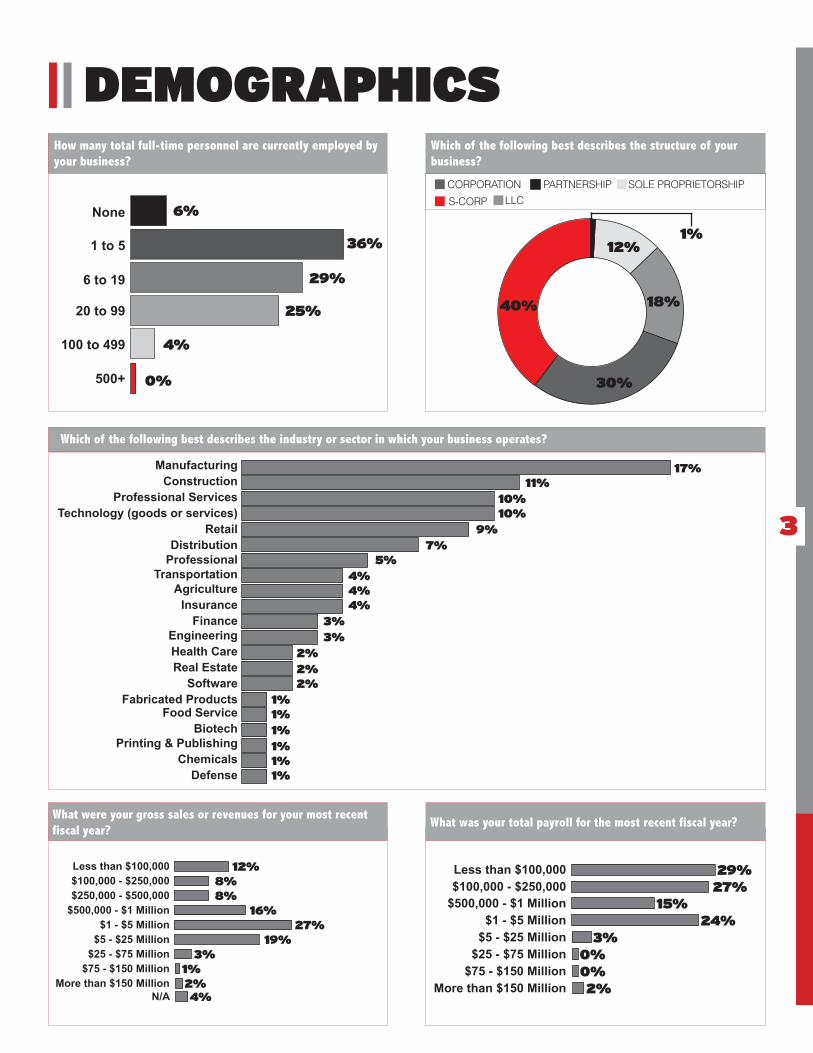
DEMOGRAPHICSHow many total full-time personnel are currently employed by your business?
Which of the following best describes the industry or sector in which your business operates?
What were your gross sales or revenues for your most recent fiscal year?
What was your total payroll for the most recent fiscal year?
Which of the following best describes the structure of your business?
6%
36%
29%
25%
4%
0%
None
1 to 5
6 to 19
20 to 99
100 to 499
500+
PARTNERSHIP SOLE PROPRIETORSHIPLLC
CORPORATION
S-CORP
1%12%
18%
30%
17%11%
10%10%
9%7%
5%4%4%4%
3%3%
2%2%2%
1%1%1%1%1%1%
40%
ManufacturingConstruction
Professional ServicesTechnology (goods or services)
RetailDistribution
ProfessionalTransportation
AgricultureInsurance
FinanceEngineeringHealth CareReal Estate
SoftwareFabricated Products
Food ServiceBiotech
Printing & PublishingChemicals
Defense
Less than $100,000 Less than $100,000$100,000 - $250,000 $100,000 - $250,000$250,000 - $500,000
$500,000 - $1 Million $500,000 - $1 Million$1 - $5 Million $1 - $5 Million
$5 - $25 Million $5 - $25 Million$25 - $75 Million $25 - $75 Million
$75 - $150 Million $75 - $150 MillionMore than $150 Million More than $150 Million
N/A
12% 29%8% 27%8%
16% 15%
27% 24%19% 3%
3% 0%1% 0%2% 2%4%
4
AVAILABILITY OF CAPITALHave you needed funds for your business and been unable to find anyone to lend to you in the last four years?
If capital availability is a problem for your business, what is the effect on your operations? (Check all that apply)
YES NO
57% 43%
What types of financing has your company used within the last 12 twelve months to meet your capital needs? (Check all that apply)
43%
37%
32%29%
20%19%
14%
8%5%
4%
4%
2%
2%
1%1%1%1%
1%
Revolving line of credit from a bank
Credit cardsEarnings of the business
Bank loanVendor credit
Private loan (friends or family)Used no financing
LeasingOther
Credit Union loan or line of creditSmall Business Administration loan
Private placement of debtPrivate placement of stock
Selling/pledging accounts receivableState/Regional Loan and Incentive Programs
Payday LoansPrepaid debit cards
Public issuance of stock
If you have been turned down for a loan or line of credit in the last two years, what were the reasons given? (Check all that apply)
What kind of assets/equity do you use to secure your business loans and financing? (Check all that apply)
I have not applied for any financing
I didn’t have enough collateral
I applied for financing and was approved
My credit score was too low
They didn’t lend to my industry
I have no idea
I didn’t have time to com-plete or didn’t understand
the loan package
36%
25%
22%
20%
9%
6%
2%
Unable to grow business or expand operations 53%Not a problem / No effects 37%Reduced the number of employees 32%Unable to finance increased sales 25%Reduced benefits to employees 20%Unable to increase inventory to meet demand 17%Closed stores or branches 4%Other 6%
Business property 40%Accounts Receivable 37%Inventory/Assets 33%Personal savings 33%Personal property (such as a second mortgage)
29%
Personal or business credit cards 25%Business savings 20%Other 9%

5
LESS THAN $100k $100k - $500k $500k - $1Million $1Million+
SMALL BUSINESS LENDINGFor bank or credit union loans that are currently outstanding, which of the following has occurred in the last twelve months?
What was the balance on your loan/line of credit?
If your loan was called in early, how many days did the lender give you?
Have your loans or lines of credit been threatened in the last 4 years?
What was the reason you were given for the changes to your loan terms or suggesting changes to your business? (Check all that apply)
TERMS HAVE BECOME LESS FAVORABLE
YES – MY AVAILABLE LIMIT WAS REDUCED
TERMS HAVE STAYED THE SAME
YES – MY LOAN OR CREDIT LINE WAS CALLED IN EARLY BY THE BANK
TERMS HAVE BECOME MORE FAVORABLE
YES – LENDER SUGGESTED CHANGES TO MY BUSINESS TO MAINTAIN MY LEVEL OF FINANCINGI DO NOT HAVE
OUTSTANDING LOANS. NO
OTHER
Less than 15 days
Bank’s internal risk assessments on all loans
Increased scrutiny by bank regulators
Increased riskiness of my business
No reason given
Other
Late payment(s) on my loan
15 to 30 days30 to 60 days
More than 60 days
23%
39%
8%
30%
29%
9%
4%
52%
6%
45%
AVERAGE BALANCE
$256,060.0042%
6%6%
19%39%23%19%
60%
36%
30%
15%
12%
“ “
11%
Twenty-nine percent report having their loans or lines of credit reduced in the last four years and nearly one in 10 had their loan or line of credit called in early by the bank.

6
A
A
BANKING INSTITUTIONS
Please rate the services and finance offerings you have received from following lending institutions.
Which of the following kinds of banking institutions do you use? (Check all that apply)
14%
43%
38%
16%
9%
60%
33%
29%
23%
16%
27%
47%
26%
16%
15%
16%
39%
33%
15%
8%
13%
25%
10%
13%
3%
13%
25%
14%
11%
2%
1 = BEST 5 = WORST
2%
1%
1%
Large bank
Small community bank
Credit cards
Credit union
Other
Prepaid debit cards
Non-traditional lenders
Payday lenders
Large bank
Small community
bank
Credit union
Non-traditional lenders
Credit cards
EXCELLENT MORE LIKELYGOOD LESS LIKELYMODERATE NOT GOOD VERY POOR
Please rank the following lending institutions in terms of which you think best serves the small-business community.
In the last two years, have you been more or less likely to use the following financing sources?
In the last four years, have you changed banking institutions?If so, why?
INSTITUTION TYPE SCORESmall community banks 1.75
Credit unions 2.46
Large banks 2.98
Credit cards 3.61
Non-traditional lenders 3.84
I felt mistreated by my bank 38%I got better financing terms from another bank 36%
I wanted to bank at a smaller bank 24%
Other 21%I moved 5%I wanted to bank at a larger bank 2%
PREPAID DEBIT CARDS
PAYDAY LENDERS
13%
99%
1%
87%
27%
CHANGED BANKS

7
Forty-four percent of respondents report worsening
terms—interest rates, late fees, etc.—on their credit
cards in the last year.
The average interest rate charged on credit cards is
15.6 percent.
Twenty-two percent pay credit card interest rates of 20
percent or more.
CREDIT CARDSHave you experienced any of the following changes on any of your credit cards in the last six months? (On the actual account limits, not interest rates or fees)
Do you believe that the terms of the credit cards you use for business, including interest rates, late fees, time to pay in full, etc., have improved or gotten worse over the last year?
62%
13% 12%
12%
IMPROVED - 7%
GOTTEN WORSE - 44%
NOT SURE - 48%
INCREASE DECREASE NO CHANGE DON‘T USE CREDIT CARDS
Thinking about the credit cards you use for business... Do you...
What is the approximate interest rate you charged on your primary credit card?
CARRY A BALANCE OF LESS THAN $10,000
LESS THAN 10%
CARRY A BALANCE OF $10,000-$25,000
10% - 14%
CARRY A BALANCE OF MORE THAN $25,000
15% - 19%
PAY OFF YOUR CREDIT CARD BILL EACH MONTH
20% OR MORE
26%
13%
15%
32%
9%
34%
50%
22%
AVERAGEINTEREST
RATE 15.6%
AIn the last four years, have you closed any of your credit card accounts and used debit cards?
Yes – I use debit cards exclusively now 5%Yes – I closed some of my credit cards and use some debit cards
12%
No – have not closed any credit cards but also use debit cards
14%
No – I only use credit cards 63%No – I didn't use credit cards at any point in the last four years
7%
“
“
8
PAYMENTS & COLLECTIONSHave the payment terms you offer your clients changed in the last 2 years?
Changes in payment terms - Before vs. After
YES – THE TIME IN WHICH I RECEIVE PAYMENT HAS INCREASED
YES – THE TIME IN WHICH I RECEIVE PAYMENT HAS DECREASED
NO
I DO NOT OFFER PAYMENT TERMS TO MY CUSTOMERS
21%
6%
56%
16%
NET NET
NET NET
NET NET
NET NET
15 15
30 30
60 60
90 90
DAYS DAYS
DAYS DAYS
DAYS DAYS
DAYS DAYS
17% 22%
3% 21%
70% 49%
3% 8%
Before Terms Changed After Terms Changed
Do you report non-payments by your clients to any collection agencies?
NOYES
17%
83%
Top Reasons For Not Reporting I don’t have enough non-payments to report
70%
It is too expensive to report
12%
Other 22%
Have you ever had difficulty disputing an error or correcting a mistake with a debt collection or credit reporting agency?
NOYES
23%
77%
Before changing payment terms for their clients, just 6
percent reported terms of net 60 to 90 days.
Today, 29 percent report payment terms of net 60 to 90 days, posing a significant
cash-flow issue.
““

9
If you are a subcontractor, have you ever failed to receive prompt payment from a prime contractor for work performed (goods or services) on a government contract?
If you are a prime contractor, have you ever failed to receive prompt payment from a government agency for work performed (goods or services) on a government contract?
If you have failed to receive a prompt payment for federal contracting work, did it affect your ability to expand your business or hire new employees?
NO
NO NO
YES
YES YES
55%
41% 48%
45%
59% 52%
Cash-flow problems for small companies don’t just stem from a shortage of outside financing - late and non-payments can be catastrophic for some small businesses. Financing shortages and cash-flow problems have forced 20 percent of small-business respondents to reduce employee benefits, and 17 percent were unable to increase inventory to meet demand. –Todd McCracken, NSBA President and CEO
“ “FEDERAL CONTRACTING
Among small-
business
subcontractors, 55
percent report they
have received late
payments from a
prime contractor.
“
“

10
INVESTORSDo you currently have, or have you ever had, any of the following investors in your company? (Check all that apply)
Congress recently passed legislation creating a “crowdfunding” exception to securities registration requirements that would allow businesses to raise up to $1 million in any 12 month period over the internet from individual investors, generally $10,000 or less per investor. Does this make you more or less likely to consider seeking outside investors?
Approximately how much of your company is owned by outside investors?
31%
24%
2%
4%
4%
8%
8%
5%
69%
9%
51%
Friends & Family
Angel or Venture Capital
Other businesses
Small individual investors
No investors
1 to 5 percent
5 to 10 percent
10 to 20 percent
20 to 50 percent
50 percent or more
None – I do not have investors
LESS LIKELY NO CHANGEI DO NOT HAVE, OR PLAN TO HAVE OUTSIDE INVESTORSMORE LIKELY
19%
2%
31%
48%
One in five (19 percent) report they are more likely to
seek outside investors due to the recently-
passed JOBS Act which will ease
restrictions on
crowdfunding and
solicitation of investors.
““

11