small business advocacy review panel comments on epa’s
TRANSCRIPT
Small Business Advocacy Review Panel Comments on EPA’s Federal Plan Requirements for
Greenhouse Gas Emissions from Electric Generating Units Constructed on or Before January 8, 2014
Submitted Electronically to: Lanelle Wiggins RFA/SBREFA Team Leader U.S. EPA
Office of Policy
By
Alex Hoffman Director of Energy Services
and Carolyn Slaughter
Director of Environmental Policy
May 28, 2015

I. Introduction
The American Public Power Association (APPA) appreciates the opportunity to participate in the Small
Business Advocacy Review (SBAR) panel on the Environmental Protection Agency’s (EPA) Federal
Plan for Regulating Greenhouse Gas Emissions from Electric Generating Units (EGU). APPA filed an
extensive set of comments on December 1, 2014, outlining our concerns with EPA’s Proposed Rule (or
Proposal) under section 111(d) of the Clean Air Act (CAA) to reduce emissions of carbon dioxide (CO2)
from fossil fuel-fired EGUs.1,2
In those comments, APPA raised legal and substantive concerns, in
addition to the recommendations we believe will improve the affordability and workability of the
Proposed Rule3. In general, we believe the Proposed Rule imposes inequitably distributed additional
costs to consumers, threatens electric system reliability, and forces an over-reliance on a single fuel—
natural gas—to generate electricity. APPA and its members recommend EPA address the flaws in the
proposed rule as enumerated in our comments and given during the Small Business Advocacy Review
(SBAR) panel.
EPA’s Proposal has the ability to rapidly transform the utility sector in an unprecedented manner. Its
impact on small public power utilities could be enormous, forcing them to prematurely shut down EGUs
and strand costs, resulting in significant price increases for consumers. As specified in federal statute,
EPA must carefully consider the impact of its proposed rules, such as the soon-to-be-proposed Federal
Plan (FP), will have on small entities and must act to lessen the burden of the rule on those small
entities.4 The Regulatory Flexibility Act (RFA), and the amendments made to it by the Small Business
Regulatory Enforcement Fairness Act (SBREFA), were enacted by Congress to provide small entities a
meaningful voice in major federal rulemakings. SBREFA’s primary goals are to encourage “effective
participation” of small business in the federal regulatory process and create a more cooperative
regulatory environment among businesses in the federal regulatory process,5 as well as create a more
cooperative regulatory environment among agencies and small businesses that is less punitive and more
solution oriented.6 Section 609 of SBREFA envisions that small business panels will review “any
material the agency has prepared in connection with this chapter,” including information required to be
part of the initial regulatory flexibility analysis.7 This information typically includes descriptions of
significant alternatives to the proposed rule, differing compliance or reporting requirements or
timetables that take into account the resources available to small entities, and the clarification,
consolidation or simplification of compliance and reporting requirements for small entities.8
Acting EPA Assistant Administrator Janet McCabe announced on January 15, 2015, the Agency’s plan
to issues a proposed FP to implement EPA’s proposed section 111(d) rule and provide interested states
with a model for compliance with its Proposal. Subsequently, EPA announced plans to convene a
SBAR panel on April 30, 2015, and held its first preliminary teleconference on May 1, 2015, an in-
person meeting on May 14, 2015, and a follow up teleconference on May 19, 2015. The unusually short
1 Carbon Pollution Emission Guidelines for Existing Stationary Sources: Electric Utility Generating Units, 79 Fed.
Reg. 34,830 (June 18, 2014) (Proposed Rule or Proposal). 2 42 U.S.C. § 7411 (2012).
3 Comments of the American Public Power Association (APPA) on EPA’s Section 111(d) Proposed Rule for Carbon Dioxide
Emissions from Existing EGUs EPA-HQ-OAR-2013-0602 (December 1, 2014). 4 42 U.S.C § 111(d)(1)(B)
5 5 U.S.C §203 (3)
6 5 U.S.C § 203 (6)
7 5 U.S.C §609(b)(4); see also 5 U.S. C §603(b)(3),(4) and (5) and 603(c)
8 5 U.S.C §603(c)

timeframe did not provide Small Entity Representatives (SERs) with sufficient time to offer meaningful
comment and participation in the SBREFA process. APPA believes EPA has not prepared sufficient
materials to convene this SBAR panel. The Agency has not provided the panel members with
information on the potential impacts of this proposed rule, nor has it provided SERs with the necessary
information upon which to discuss alternatives and provide recommendations to EPA, as required by
SBREFA.
II. Who is APPA?
APPA is the national service organization representing the interests of not-for-profit, publicly
owned electric utilities throughout the United States. More than 2,000 public power utilities provide
over 15 percent of all kilowatt-hour sales of electricity to consumers and do business in every state
except Hawaii. All APPA utility members are Load Serving Entities (LSEs), with the primary goal of
providing customers in the communities they serve with reliable electric power and energy at the lowest
reasonable cost, consistent with good environmental stewardship. This orientation aligns the interests of
APPA utility members with the long-term interests of the residents and businesses in their communities.
Collectively, public power utilities serve more than 48 million customers.
III. Number and Types of Small Entities Affected by a Section 111(d) Federal
Plan
More than 90 percent of public power utilities qualify as small businesses under SBREFA. Under SBA
regulations, small entities are defined as governments of cities, counties, towns, townships, villages,
school districts, or special districts, with populations of 50,000 or less. SBREFA was enacted by
Congress to provide small entities a meaningful voice in major federal rulemakings. Among the Act’s
goals is to encourage the “effective participation” of small businesses in the federal regulatory process
and to create a more cooperative regulatory environment among agencies and small businesses that is
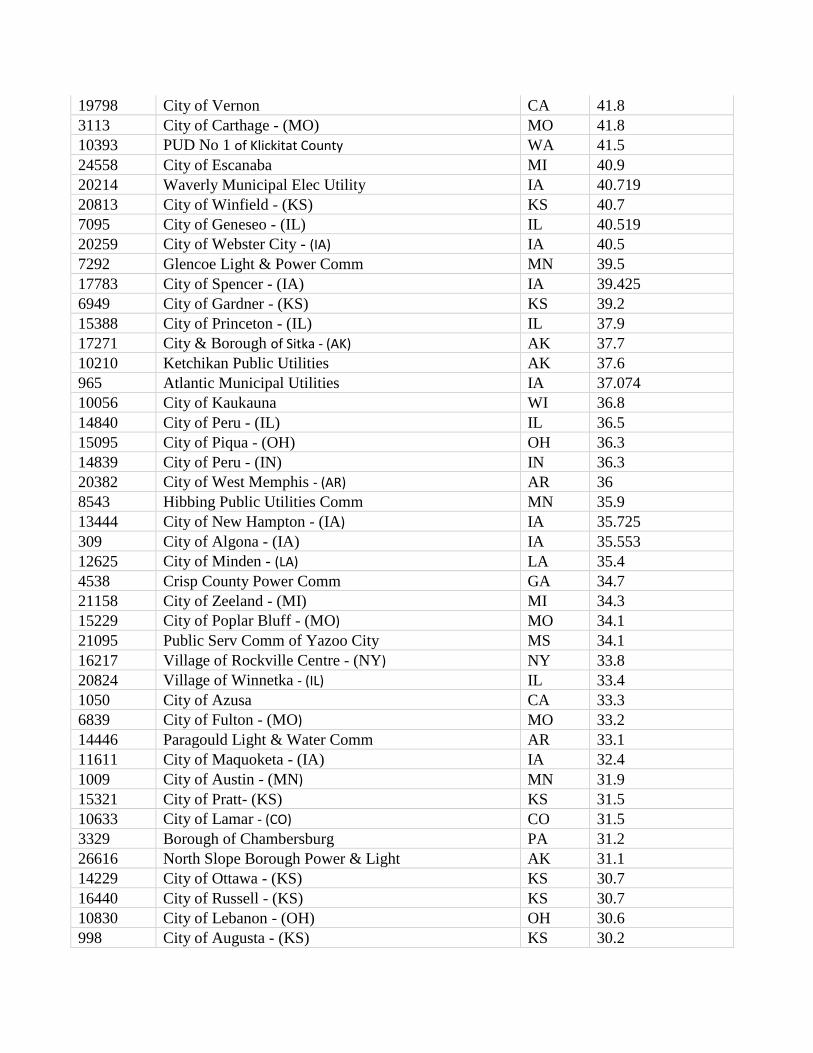
less punitive and more solution orientated . Table 1 is illustrative of affected public power communities
that service communities with less than 50,000 people and have greater than 25 MW of nameplate
capacity fossil fuel fired generation.
Owner
code Utility Name State
Adjusted Cap
(MW)
13470 City of New Madrid - (MO) MO 650
8449 Henderson City Utility Comm KY 405
1647 City of Bethany - (MO) MO 404
3702 Clarksdale Public Utilities MS 361.6
12208 City of McPherson - (KS) KS 330.4
17177 City of Sikeston - (MO) MO 261
5335 City of Dover - (DE) DE 196.3
8245 City of Hastings - (NE) NE 176.98
6779 City of Fremont - (NE) NE 170
19804 City of Vero Beach - (FL) FL 158.4

2144 Town of Braintree - (MA) MA 138.97
9130 Hutchinson Utilities Comm MN 125.8
55772 Paducah Power System KY 120
3271 Central Nebraska Pub P&I Dist NE 115.7
7634 City of Greenville - (TX) TX 109.9
11701 City of Marquette - (MI) MI 104.7
7483 City of Grand Haven - (MI) MI 100.9
3355 City of Chanute KS 98.8
9645 Jamestown Board of Public Util NY 96.3
6775 Village of Freeport - (NY) NY 91.8
3486 Chillicothe Municipal Utils MO 90
14194 City of Orrville - (OH) OH 84.5
14653 PUD No 1 of Pend Oreille County WA 82.5
8884 Terrebonne Parish Consol Gov't LA 78.9
13488 New Ulm Public Utilities Comm MN 78.5
21048 Wyandotte Municipal Serv Comm MI 78.4
7651 Greenwood Utilities Comm MS 76.5
5625 Easton Utilities Comm MD 72.4
11204 Los Alamos County NM 65.25
3892 City of Coffeyville - (KS) KS 62.7
11142 City of Logansport - (IN) IN 61
11740 City of Marshfield - (WI) WI 60.4
14381 City of Painesville OH 58.48
12927 Morgan City - (LA) LA 58.3
11732 City of Marshall - (MO) MO 57.3
2548 City of Burlington Electric - (VT) VT 55.25
11251 Loup River Public Power Dist NE 54
5336 City of Dover - (OH) OH 52.58
8567 City of Higginsville - (MO) MO 51.6
9275 Indianola Municipal Utilities IA 50
3400 City of Chaska MN 49
15202 City of Ponca City - (OK) OK 48
13485 New Smyrna Beach Utilities Commission FL 48
42652 Quincy-Columbia Basin Irr Dist WA 47.982
42653 East Columbia Basin Irr Dist WA 47.982
42654 South Columbia Basin Irr Dist WA 47.982
2439 City of Bryan - (OH) OH 45.84
5571 East Bay Municipal Util Dist CA 45.6
10152 City of Kennett - (MO) MO 44.5
20315 City of Wellington - (KS) KS 44
15137 City of Plaquemine - (LA) LA 44
2010 City of Bountiful UT 43.6
20737 Willmar Municipal Utilities MN 42
19798 City of Vernon CA 41.8
3113 City of Carthage - (MO) MO 41.8
10393 PUD No 1 of Klickitat County WA 41.5
24558 City of Escanaba MI 40.9
20214 Waverly Municipal Elec Utility IA 40.719
20813 City of Winfield - (KS) KS 40.7
7095 City of Geneseo - (IL) IL 40.519
20259 City of Webster City - (IA) IA 40.5
7292 Glencoe Light & Power Comm MN 39.5
17783 City of Spencer - (IA) IA 39.425
6949 City of Gardner - (KS) KS 39.2
15388 City of Princeton - (IL) IL 37.9
17271 City & Borough of Sitka - (AK) AK 37.7
10210 Ketchikan Public Utilities AK 37.6
965 Atlantic Municipal Utilities IA 37.074
10056 City of Kaukauna WI 36.8
14840 City of Peru - (IL) IL 36.5
15095 City of Piqua - (OH) OH 36.3
14839 City of Peru - (IN) IN 36.3
20382 City of West Memphis - (AR) AR 36
8543 Hibbing Public Utilities Comm MN 35.9
13444 City of New Hampton - (IA) IA 35.725
309 City of Algona - (IA) IA 35.553
12625 City of Minden - (LA) LA 35.4
4538 Crisp County Power Comm GA 34.7
21158 City of Zeeland - (MI) MI 34.3
15229 City of Poplar Bluff - (MO) MO 34.1
21095 Public Serv Comm of Yazoo City MS 34.1
16217 Village of Rockville Centre - (NY) NY 33.8
20824 Village of Winnetka - (IL) IL 33.4
1050 City of Azusa CA 33.3
6839 City of Fulton - (MO) MO 33.2
14446 Paragould Light & Water Comm AR 33.1
11611 City of Maquoketa - (IA) IA 32.4
1009 City of Austin - (MN) MN 31.9
15321 City of Pratt- (KS) KS 31.5
10633 City of Lamar - (CO) CO 31.5
3329 Borough of Chambersburg PA 31.2
26616 North Slope Borough Power & Light AK 31.1
14229 City of Ottawa - (KS) KS 30.7
16440 City of Russell - (KS) KS 30.7
10830 City of Lebanon - (OH) OH 30.6
998 City of Augusta - (KS) KS 30.2
20180 City of Waterloo - (IL) IL 30.2
3710 City of Clay Center - (KS) KS 29.9
7096 City of Geneva- (IL) IL 29.5
1366 City of Bay City - (MI) MI 28
14645 City of Pella - (IA) IA 28
6205 City of Farmington - (MO) MO 28
12298 City of Menasha - (WI) WI 28
19150 Trenton Municipal Utilities - (MO) MO 27.5
15686 Village of Rantoul - (IL) IL 27.2
17845 City of Springville - (UT) UT 27
16179 Rochelle Municipal Utilities IL 26.9
11460 City of Macon - (MO) MO 26.8
7222 City Of Gillette WY 26.726
9603 City of Jackson - (MO) MO 26.3
19883 City of Virginia - (MN) MN 26.2
18277 City of Sullivan - (IL) IL 25.4
Source: ABB Velocity Suite, accessed May 4, 2015
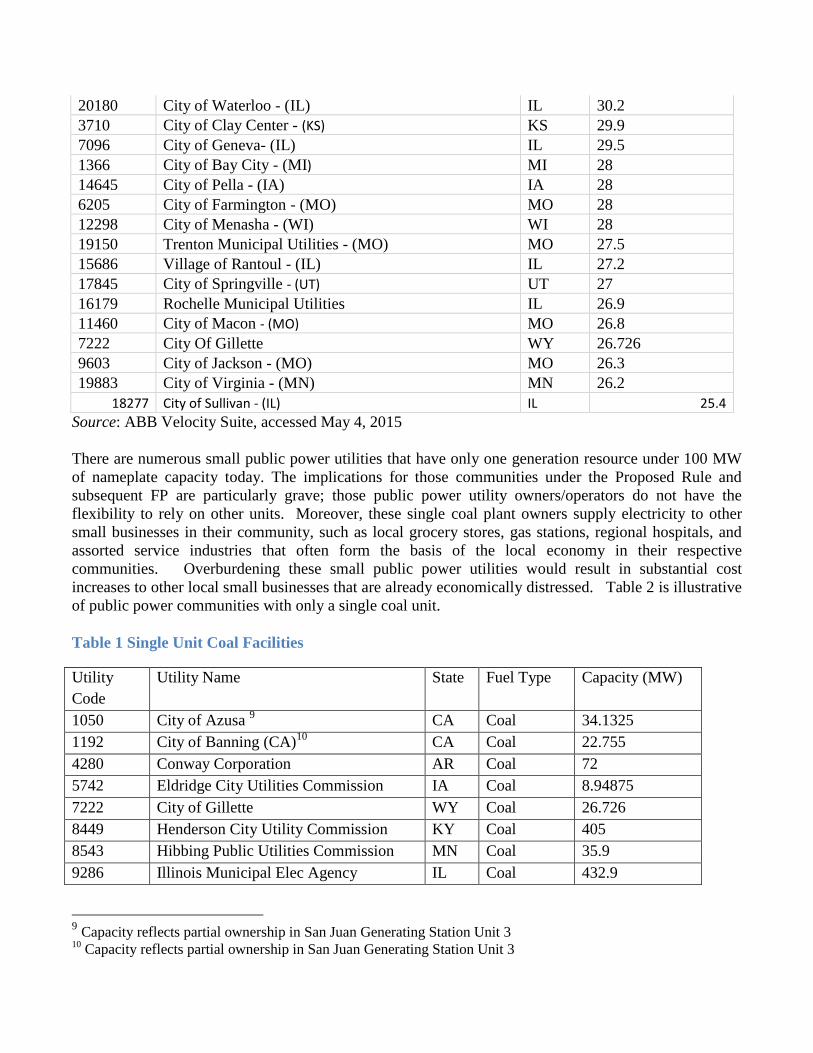
There are numerous small public power utilities that have only one generation resource under 100 MW
of nameplate capacity today. The implications for those communities under the Proposed Rule and
subsequent FP are particularly grave; those public power utility owners/operators do not have the
flexibility to rely on other units. Moreover, these single coal plant owners supply electricity to other
small businesses in their community, such as local grocery stores, gas stations, regional hospitals, and
assorted service industries that often form the basis of the local economy in their respective
communities. Overburdening these small public power utilities would result in substantial cost
increases to other local small businesses that are already economically distressed. Table 2 is illustrative
of public power communities with only a single coal unit.
Table 1 Single Unit Coal Facilities
Utility
Code
Utility Name State Fuel Type Capacity (MW)
1050 City of Azusa 9 CA Coal 34.1325
1192 City of Banning (CA)10
CA Coal 22.755
4280 Conway Corporation AR Coal 72
5742 Eldridge City Utilities Commission IA Coal 8.94875
7222 City of Gillette WY Coal 26.726
8449 Henderson City Utility Commission KY Coal 405
8543 Hibbing Public Utilities Commission MN Coal 35.9
9286 Illinois Municipal Elec Agency IL Coal 432.9
9 Capacity reflects partial ownership in San Juan Generating Station Unit 3
10 Capacity reflects partial ownership in San Juan Generating Station Unit 3

9667 City of Jasper- (IN) IN Coal 14.5
10704 Lansing Broad of Water and Light MI Coal 529.7
11235 Lafayette Public Power Authority LA Coal 279
11833 Municipal Energy Agency of MS MS Coal 43.2
12807 Michigan South Central Power
Authority
MI Coal 55
12840 Town of Montezuma- (IN) IN Coal 3.8745
13470 City of New Madrid- (MO) MO Coal 650
14194 City of Orrville (OH) OH Coal 84.5
14268 City of Owensboro (KY) KY Coal 445.3
15989 City of Richmond (IN) IN Coal 93.9
17177 City of Sikeston- (MO) MO Coal 261
18715 Texas Municipal Power Authority TX Coal 453.5
19883 City of Virginia MN Coal 30.2
20382 City of West Memphis – (AR) AR Coal 36
21704 MSR Public Power Agency CA Coal 159.34
24431 Utah Municipal Power Agency11
UT Coal 100
26253 Louisiana Energy& Power Authority LA Coal 111.6
40576 Intermountain Power Agency UT Coal 1640
40603 Wyoming Municipal Power Agency WY Coal 50.7
40604 Heartland Consumers Power District SD Coal 140.58
5000 Northern Illinois Municipal Power
Agency
IL Coal 141.28
50002 Kentucky Municipal Power Agency IL Coal 141.28
TOTAL 6, 4212
All public power coal capacity 34,539
Source: Energy Information Administration, Form EIA-860-2012 data
The first thing EPA can do to assist small public power utilities, short of withdrawing and re-proposing
the rule, would be to adopt APPA’s recommendations for changes in the final rule. Those include
providing additional time for states to develop their plans, fixing the numerous errors and adjusting the
unrealistic assumptions in the building block computations, providing full credit for early action, and
eliminating the interim reduction goal would provide more flexibility and make the rule more workable.
Moreover, since EPA has indicated its intent to make the proposed FP be similar to an approvable state
plan, these benefits and added flexibility would presumably transfer into any FP issued by EPA.
11
Capacity reflects partial ownership in San Juan Generating Station Unit 3 and Hunter Unit 2

A. Exclude Reciprocating Internal Combustion Engines (RICE) and Simple
Cycle Natural Gas (SCNG) Units
Assuming the FP is applicable to any boiler, integrated gasification combined cycle (IGCC), or
combustion turbine meeting the requirements in the Proposal, a section 111(d) FP should exclude simple
cycle natural gas (SCNG) turbines and reciprocating internal combustion engines (RICE). RICE units
are used for emergency power, voltage support, and demand response, and provide reliability to the Bulk
Power System. Furthermore, the preamble to EPA’s proposed section 111(b) rule suggests SCNG units
are not affected units if they sells less than one-third of their potential electric output to the grid. The
section 111(d) proposal would cover (or exempt) the same types of EGUs that were in operation or had
commenced construction on or before January 8, 2014.
IV. Potential Reporting, Recordkeeping, and Compliance Requirements
Monitoring and recordkeeping requirements have significant impacts on small entities. Such
requirements are problematic because small entities do not have the financial resources, manpower, or
technical expertise needed to operate electronic reporting and tracking systems that could be used to
track emissions, as well as energy efficiency (EE) and renewable energy (RE) credits. The FP should
seek to lessen the impact of reporting and recordkeeping requirements on small entities by reducing such
obligations for EGUs that have a name plate capacity of less than 100 MW. Unfortunately, EPA’s
presentation materials did not specifically discuss any particular reporting structure or credit allocation
tracking system. Therefore small entities are unable to offer any meaning full comment on this point. At
a minimum, EPA should consider utilizing existing reporting and tracking platforms rather than creating
new ones.
V. Related Federal Rules
A. New Source Review (NSR)
The Proposed rule offers heat rate improvements under building block 1 as a means to reduce CO2
emissions within a facilities fence line. EPA explains that these heat rate improvements can be achieved
by “installing and using equipment upgrades…such as extensive overhaul or upgrade of major
equipment (turbine or boiler) or replacing existing components with improved versions.”12
Historically
EPA has targeted these sorts of projects as triggers for compliance with the Clean Air Act’s New Source
Review (NSR) requirements. The Agency’s policy has led to hundreds of NSR enforcement actions and
citizen suits targeting the very sort of projects that the Proposed Rule would now seek to require EGUs
to undertake. EPA should eliminate the threat of protracted NSR litigation and provide a clear statement
that any upgrades necessary to implement building block 1 for small entities would not trigger NSR.
While NSR presents a barrier for small entities to pursue heat rate improvement projects, the cost
impacts and limited CO2 benefits present their own set of challenges to meeting the Proposal’s goals.
12
79 Fed. Reg. 34,859.

Small EGUs are key components of both public power and rural co-operative generating systems. Small
units—historically are considered those less than 200 MW of capacity—are limited in their ability to
install state-of-art heat rate-improving steps. Please see the discussion in the section VI Heat Rate
Improvement Challenges, summarizing the results of a whitepaper on the heat rate improvement options
for small, low capacity facts EGUs. The whitepaper quantifies the challenges of cost-effectively
installing heat rate-improving steps in an attempt to meet the goals of building block 1.
B. Section 111(b) for Modified and Reconstructed Units
In numerous parts of the Modified/Reconstructed Proposed Rule, EPA suggests EGUs that become
subject to a state or federal plan under section 111(d) and then undergo a modification or reconstruction
must remain subject to the requirements of the state or federal plan, in addition to having to comply with
the requirements for modified and reconstructed EGUs proposed here. See, e.g., 79 Fed. Reg. at 34,962-
63, 34,965. Under the Clean Air Act, a source is either “existing” or it is “new.” It cannot be both at the
same time. Compare CAA § 111(a)(2)(definition of “new source”) with CAA § 111(a)(6) (definition of
“existing source”). Therefore, a source that is regulated under section 111(b), either because it is a “new
source” or because it underwent a major modification or reconstruction and became subject to section
111(b), cannot simultaneously be subject to regulation under section 111(d) as an “existing source.” If a
state wishes to keep an EGU that is modified or reconstructed within its section 111(d) state plan, it may
do so as a matter of state law. See id. § 116. EPA cannot, however, require states to keep that EGU
within its section 111(d) state or federal plan.
VI. Heat Rate Improvement Challenges
APPA believes EPA has no statutory authority to define the “best system of emission reduction”
(BSER) in a way that goes beyond technological or operational improvements that can be made at an
individual source. We offer the following discussion of inside-the-fence-line heat rate improvement
options to highlight the challenges facing small public power and rural co-operatives since they are least
likely to be able to employ “outside-the-fence-line” measures, such as re-dispatch to other types of
generation or requiring consumers to reduce their demand for electricity. The whitepaper, “Heat Rate-
Improving Options for Small, Low Capacity Factor Generating Units: Comparison of Capital, CO2
Avoided, Payback” looks at representative sample units owned by APPA and the National Rural
Electric Cooperatives Association (NRECA) members, illustrating the challenges of installing heat rate-
improving options using building block 1. The whitepaper’s analysis determined higher capital cost
project such as a steam turbine upgrade for a 500 MW name plate capacity unit will lower CO2 by 40
lbs/MWh, and require three years to payback capital expenditures. For a 100 MW unit, 60 lbs/MWh of
CO2 is avoided, but the payback period is 12 years. A 12 year payback period is not sustainable by
owners of small EGUs in the present power market. Lower capital cost options such as improved
process controls and boiler cleaning have lower capital requirements – typically less than $600K for a
100 MW unit. The CO2 avoided is 15 lbs/MWh and a seven year payback is required.13
Despite the
lower capital costs, these projects still require financing, another barrier to implementing heat rate
improvements. Small public power utilities require regulatory relief in the form of additional timing and
13
J. Edward Cichanowicz and Michael C, Hein; “Heat Rate-Improving Options for Small, Low Capacity Factor Generating
Units: Comparison of Capital, CO2 Avoided, Payback”, May 27,2015.
or credits/ allowances least they be forced to shut down due to an inability to meeting prescribed goals
under building block 1.
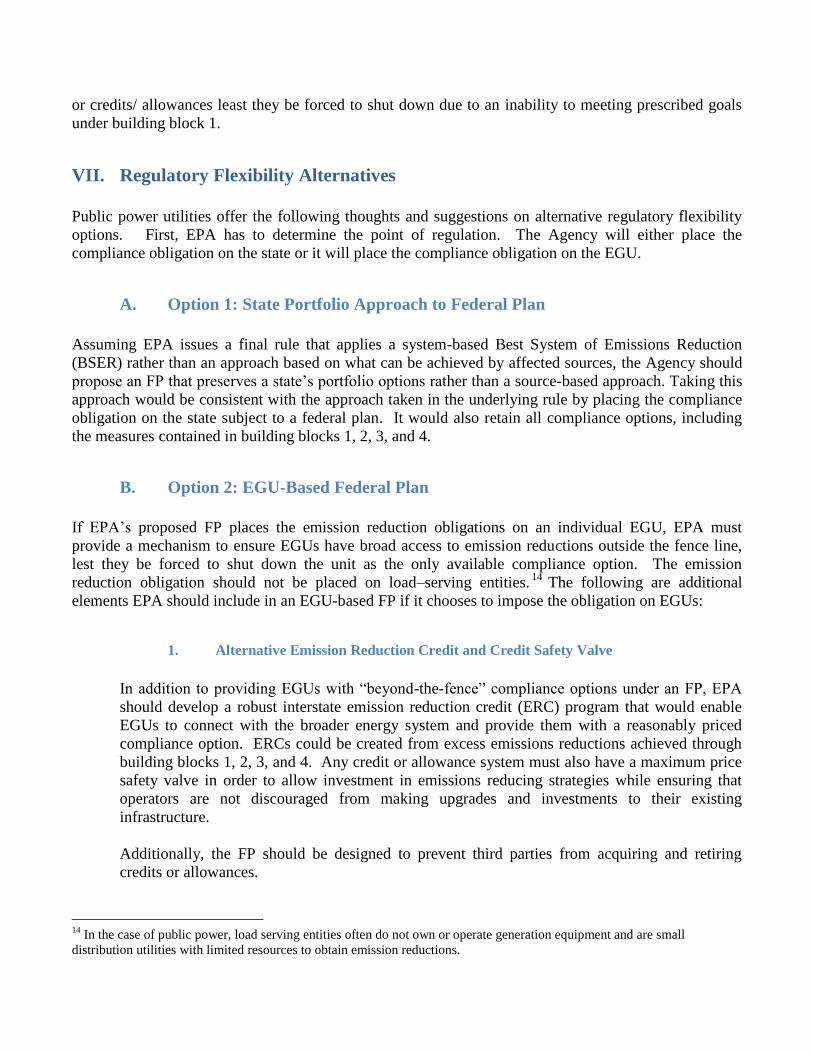
VII. Regulatory Flexibility Alternatives
Public power utilities offer the following thoughts and suggestions on alternative regulatory flexibility
options. First, EPA has to determine the point of regulation. The Agency will either place the
compliance obligation on the state or it will place the compliance obligation on the EGU.
A. Option 1: State Portfolio Approach to Federal Plan
Assuming EPA issues a final rule that applies a system-based Best System of Emissions Reduction
(BSER) rather than an approach based on what can be achieved by affected sources, the Agency should
propose an FP that preserves a state’s portfolio options rather than a source-based approach. Taking this
approach would be consistent with the approach taken in the underlying rule by placing the compliance
obligation on the state subject to a federal plan. It would also retain all compliance options, including
the measures contained in building blocks 1, 2, 3, and 4.
B. Option 2: EGU-Based Federal Plan
If EPA’s proposed FP places the emission reduction obligations on an individual EGU, EPA must
provide a mechanism to ensure EGUs have broad access to emission reductions outside the fence line,
lest they be forced to shut down the unit as the only available compliance option. The emission
reduction obligation should not be placed on load–serving entities.14
The following are additional
elements EPA should include in an EGU-based FP if it chooses to impose the obligation on EGUs:
1. Alternative Emission Reduction Credit and Credit Safety Valve
In addition to providing EGUs with “beyond-the-fence” compliance options under an FP, EPA
should develop a robust interstate emission reduction credit (ERC) program that would enable
EGUs to connect with the broader energy system and provide them with a reasonably priced
compliance option. ERCs could be created from excess emissions reductions achieved through
building blocks 1, 2, 3, and 4. Any credit or allowance system must also have a maximum price
safety valve in order to allow investment in emissions reducing strategies while ensuring that
operators are not discouraged from making upgrades and investments to their existing
infrastructure.
Additionally, the FP should be designed to prevent third parties from acquiring and retiring
credits or allowances.
14
In the case of public power, load serving entities often do not own or operate generation equipment and are small
distribution utilities with limited resources to obtain emission reductions.

2. Single and Small Asset Minimum Run Time
Small entities that own single coal-fired generation units are particularly at risk under an FP.
EPA should give special consideration to these EGUs through the development of compliance
options based on an annual “minimum run time” that would prevent stranded costs. This process
must take in to consideration unit-by-unit criteria, such as utilization factors, age, remaining
useful life, and feasibility of emission reduction measures.
3. Small Entity Exemption
Assuming small single EGUs are unable to purchase ERCs or benefit from reductions achieved
through building blocks 1, 2, 3, and 4, these units should be exempt from meeting emission
reduction goals in order to preserve their remaining useful life and prevent the loss of economic
value.
4. Reliability Review and Dynamic Reliability Safety Valve
APPA supports the adoption of several mechanisms to assure grid reliability throughout the
development and implementation of state and federal plans. These include an initial review of
state and federal plans conducted by the North American Reliability Corporation (NERC), a
reliability safety valve to address unforeseen circumstances, and periodic review by NERC of the
state and federal plans on a regional basis.
5. Allow Full Credit for Early Actions and Innovative Efficiency Programs
Any FP EPA proposes should include some mechanism to provide credit for early action.
Assuming a small entity can show verifiably that it has reduced its emissions via some measure,
it should receive credit. Small entities have deployed a variety of energy efficiency programs
utilizing deemed saving to reduce electricity consumption by promoting products or programs
that support efficiency or conservation of electricity.
A FP should include a crediting mechanism to EGUs for improved city building codes, energy
efficiency programs from the utility, beneficial steam use, and other innovative methods for
optimizing the electric system, such as water heater demand response.
Beneficial electrification such as electric cars should receive credits as they will add load, but
reduce overall criteria pollutants.
6. Flexibility through Allowance Allocation Methodology
Allow states to make allocation of allowance/credit decisions even after a FP. This is critical
because the state will best understand local and regional reliability conditions. The state will also
understand which entities are most able to afford certain compliance elements and be better able
to consider the compliance cost as is a part of the section 111 (d) process.
7. Multi Year Averaging
The proposed FP should utilize multi-year averaging for compliance over at least a five year
period. Multi-year averaging affords small entities important flexibility given the increasing
climate variability. As recognized in EPA’s NODA to the underlying Clean Power Plan,15
variations in weather have a significant impact on not only the demand for electricity, but also
the type of electricity generated in a given year. Averaging the baseline will tend to reduce the
impact of weather anomalies as well as scheduled unit outages.
8. Mass vs. Rate Compliance Mechanisms
The SBAR panel presentation materials suggested EPA is evaluating both a massed based and a
rate based compliance approach. APPA supports allowing small entities subject to a FP the
ability to choose a rate or mass based compliance pathway most appropriate to their geographic
location and generation mix.
If a mass-based program is selected, EPA should reduce the burden of small communities by
providing allowance mitigation for small public power utilities on behalf of their communities in
the form of free credits. Utilities (or their communities) would have flexibility to determine how
the credit value associated with the sale of the free credit is utilized, although its intent would be
to reduce the financial burdens of investing in a cleaner resource portfolio.
9. Interstate Impacts
The proposed FP needs to take into consideration the complex circumstances in which public
power utilities operate. Many small entities have generating assets located in one state and
allowances/credits may be earned in another state where there is no state-to-state agreement. For
example, a city owns land and builds community solar in its home state for compliance with a FP
emission rate in another state. In this scenario, cities are looking at much larger compliance
costs, or the possibility of having no compliance option, despite their investment.
10. Remaining Useful Life Impacts on Rate and Economic Losses
Compliance with the emission goals contained in the Proposed Rule will cause the retirement of
a significant number of U.S. coal-fired generating plants. In particular small entities are
especially vulnerable. If these facilities are retired while they are still able to yield on-going
economic value, their retirement will impose an economic cost on the owner-generator and, in
turn, its customers. APPA believes a proposed FP must account for the remaining useful life of a
unit to provide a backstop against stranding assets.
Clearly, source-level emissions standards are likely to translate into reduced run times and lower
electric production from coal-fired electric generators. In most cases, this will lead to economic
15 http://www2.epa.gov/carbon-pollution-standards/clean-power-plan-proposed-rule-technical-documents#NODA and http://www2.epa.gov/carbon-pollution-standards/clean-power-plan-proposed-rule-translation-state-specific-ratebased-co2

losses in the form of higher electric rates for consumers or uncompensated costs for utilities, or
both. The following analysis depicts the potential losses for a hypothetical, but representative,
utility and its retail customers.
The analysis shows the situation for an illustrative small utility that relies primarily on a single
(100 MW), self-owned, coal-fired-generator to serve its retail load.16
Based on assumed values
for key inputs, including initial capital cost, fixed operation and maintenance (O&M), debt
service, fuel, variable O&M and average capacity factor, the annual cost of service (or revenue
requirement), the present value life-cycle cost of service and the leveleized electric rate
necessary to recoup the present value (PV) cost of service, are all calculated. The economic
impacts at several different levels of assumed lost production are measured by comparing the
results of these cases to a reference case depicting costs and rates prior to the output reductions.
The underlying notion is that utility rates are designed to recover the utility’s cost of providing
service, which will be equal to the sum of the costs associated with individual assets and expense
items. A generating asset has both fixed and variable costs and when production levels change,
both total cost, and the average cost upon which rates are based, change as well. When
production declines, variable costs fall but fixed costs do not, therefore average costs rise.
Average costs will also rise if the lost output is replaced by higher cost resources. If rates remain
unchanged when average cost rise, revenues will be insufficient to recover total costs and the
utility will suffer an economic loss. If rates rise commensurate with increasing average costs,
customers will suffer a loss in terms of higher total payments for any given level of electricity
consumption or the unit will be forced to shut down
Several factors can affect the outcomes, but the tables below focus on the varying impacts
associated with two crucial variables, the magnitude of production losses, and remaining useful
asset life, while holding other factors constant. Because it is unlikely that a utility with an
obligation to serve load would fail to replace lost production, 17
the outcomes reflect the
assumption that lost coal output is replaced with some combination of other resources costing 25
percent more than the forgone coal production.18
Table 3 below shows the economic losses borne by the utility if rates do not adjust when output
declines. Table 4 shows the impact on customers, in terms of percent change in leveleized rates,
when rates do adjust in order to make the utility whole. Both tables have the same layout. The
rows show differing assumptions regarding remaining useful life, and the columns show
different assumptions regarding percentage reductions in output. For example, referring to Table
3, a 10 percent reduction in output for a plant with 20 years of remaining useful life, will lead to
a present value economic loss to the utility of approximately $6.8 million if rates don’t adjust.
16
It would be rare to find a utility that relies exclusively on a single generator to meet all its energy requirements, so in most
cases, it might be more meaningful to frame the analysis in terms of stand-alone impacts on generators, which will have
incremental impacts on a utility’s overall supply portfolio costs. 17
It is conceivable that a utility with excess generation might simply forgo market sales, but this would translate into losses
for the utility or higher consumer costs, through loss of the associated a cost of service credit. It is also conceivable that the
lost output could be made with energy efficiency programs, but average rates would rise and one would have to calculate the
total costs of providing the energy services with energy efficiency program costs and higher rates. 18
This factor represents a reasonable approximation of the ratio of all-in costs of a replacement gas unit to the variable
operating costs of a coal plant. The factor could be higher or lower depending on the assumed replacement portfolio.
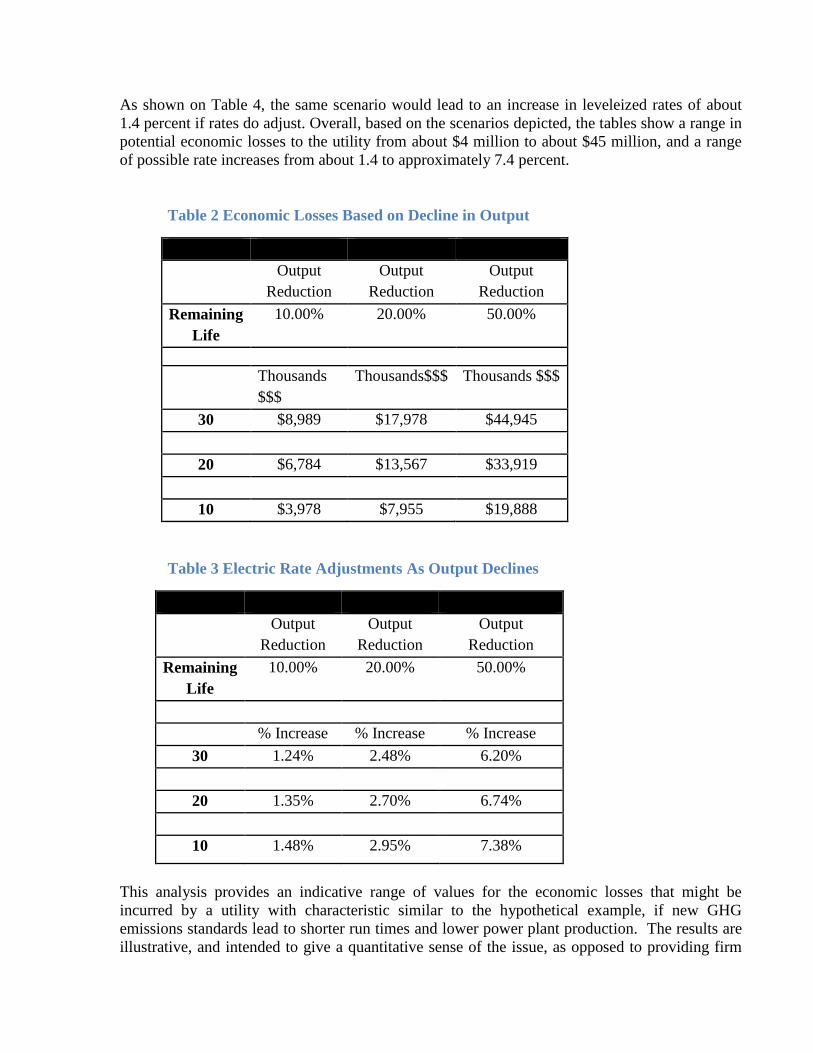
As shown on Table 4, the same scenario would lead to an increase in leveleized rates of about
1.4 percent if rates do adjust. Overall, based on the scenarios depicted, the tables show a range in
potential economic losses to the utility from about $4 million to about $45 million, and a range
of possible rate increases from about 1.4 to approximately 7.4 percent.
Table 2 Economic Losses Based on Decline in Output
Output
Reduction
Output
Reduction
Output
Reduction
Remaining
Life
10.00% 20.00% 50.00%
Thousands
$$$
Thousands$$$ Thousands $$$
30 $8,989 $17,978 $44,945
20 $6,784 $13,567 $33,919
10 $3,978 $7,955 $19,888
Table 3 Electric Rate Adjustments As Output Declines
Table II
Output
Reduction
Output
Reduction
Output
Reduction
Remaining
Life
10.00% 20.00% 50.00%
% Increase % Increase % Increase
30 1.24% 2.48% 6.20%
20 1.35% 2.70% 6.74%
10 1.48% 2.95% 7.38%
This analysis provides an indicative range of values for the economic losses that might be
incurred by a utility with characteristic similar to the hypothetical example, if new GHG
emissions standards lead to shorter run times and lower power plant production. The results are
illustrative, and intended to give a quantitative sense of the issue, as opposed to providing firm

estimates of potential outcomes. However, we do believe that new emission standards could lead
to significant economic losses for utilities and/or electricity consumers, and that this should be
explicitly taken into account when new emission standards are being considered.
VIII. Overarching Regulatory Flexibility Need in the Proposed Clean Power Plan
A. Interim Goals
APPA supports a relaxation of the interim goals, they do not support an orderly transition for
small entities seeking to utilize or develop low carbon intensity technologies. The Proposed Rule
states that its interim goals, which must be achieved on average over 2020 to 2029, and its final
goals, which must be achieved by 2030, provide states with flexibility to design plans over the
long term. But because the interim goals are so stringent, many states will have to take
significant actions by 2020 in order to comply. The Proposed Rule also requires significant effort
by the states in preparing their plans, including the requirement to include achievement
“demonstrations” that use utility-scale capacity expansion and dispatch planning models to show
the state can meet the interim and final goals. This requirement exceeds the statutory standard
that a state plan be “satisfactory.” Moreover, if EPA is going to require this type of effort from
the states to develop the plans, then the Agency must give far more time to the states than the
Proposal contemplates.
B. Emission Baseline
Any state or federal plan should provide small entities with the flexibility to use the highest three
out of the past five years for baseline determination for a unit. For plants that were not online in
the baseline case, should be the average of the three highest years for which the plant is fully
online. Therefore, instead of prescribing 2012 as the baseline, the final rule should allow each
state to establish a baseline the state believes equitably represents its circumstances, utility
generation, and related emissions. Variations of this approach are obviously available as well.
The key element is to provide some flexibility so that the final emission goal is equitable.
IX. Conclusion APPA appreciates opportunity to share our overarching concerns about the Proposed Rule and comment
on the small entity regulatory flexibility alternatives we believe EPA should consider as the Agency
drafts the Federal Plan for Regulating Greenhouse Gas Emissions from EGUs. We strongly recommend
the FP include:
A mechanism to account for a small entities remaining useful life as prescribed in the statue.
Exclude Reciprocating Internal Combustion Engines (RICE) and Simple Cycle Natural Gas
(SCNG) Units.
Reduce reporting obligations for EGUs with a nameplate capacity of less than 100MW.
A clear statement that any upgrades necessary to implement building block 1 for small entities
does not trigger NSR.
A clarifying statement that new units are not subject to section 111(d)

Provisions to ensure EGUs have broad access to emission reductions outside the fence line, lest
they be forced to shut down the unit as the only available compliance option.
A robust interstate ERC program that would enable EGUs to connect with the broader energy
system ensuring reasonable access to credits.
A compliance option based on an annual “minimum run time” that would prevent stranded costs.
A provision for small entities unable to purchase ERCs or benefit from reductions achieved
through building blocks 1, 2, 3, and 4, these units should be exempt.
A reliability review by FERC and NERC and inclusion of a dynamic reliability safety valve.
Full credit for early actions and innovative efficiency programs
Multi-year averaging for compliance over at least a five year period.
Giving small entities the ability to choose a rate or mass based compliance pathway.
Consideration for the multi-jurisdictional and regional circumstances in which small public
power utilities operate.
Please contact Mr. Alex Hoffman ([email protected]) or Ms. Carolyn Slaughter
([email protected]) if you have questions regarding APPA’s comments on regulatory
flexibility for small entities under EPA’s Federal Plan for Regulating Greenhouse Gas Emissions from
EGUs.
Sincerely,
Carolyn Slaughter
Director, Environmental Policy
American Public Power Association
Email: [email protected]

APPENDIX 1

HEAT RATE-IMPROVING OPTIONS FOR SMALL, LOW CAPACITY FACTOR GENERATING UNITS: COMPARISON OF CAPITAL, CO2 AVOIDED, AND PAYBACK
Prepared for the
American Public Power Association
And the
National Rural Electric Cooperative
Prepared by
J. Edward Cichanowicz Saratoga, CA
and
Michael C. Hein Whitefish, MT
May 27, 2015

I. Table of Contents
SECTION 1 INTRODUCTION AND SUMMARY ............................................................................ 1
SECTION 2 APPROACH ........................................................................................................................ 3
SECTION 3 OPERATING CHARACTERISTICS OF SMALL ELECTRIC GENERATING UNITS ........................................................................................................................................................... 4
Reference Units ................................................................................................................................... 4
Small EGU Capacity Factor, CO2 Emission Rate ...................................................................... 4
Comparison to Conventional Inventory .................................................................................... 7
Small Unit Operating Characteristics: ........................................................................................ 7
SECTION 4 EVALUATION OF HEAT RATE-IMPROVING OPTIONS .................................. 10
Heat Rate Improving Options ..................................................................................................... 10
Reference Generating Unit Evaluation.................................................................................... 12
SECTION 5 RESULTS OF THE ANALYSIS ................................................................................... 14
Normalized Capital Per Payback Period ................................................................................ 14
CO2 Reduction vs. Payback Period ............................................................................................ 14
Results: Key Observations .......................................................................................................... 16
SECTION 6 CONCLUSIONS............................................................................................................... 17
APPENDIX A ........................................................................................................................................... 18

LIST OF FIGURES
Figure 3-1. Capacity Factor for “Small” APPA/NRECA EGUs, 2007- 2013 .................. 6 Figure 3-2. CO2 Emission Rate (Net) for “Small” APPA/NRECA EGUs, 2007- 2013 ............................................................................................................................................ 6 Figure 3-3. CO2 Emission Rates by Categories of Generating Capacity (MW): Small APPA/NRECA EGUs, 2007 - 2013 ................................................................................................. 8 Figure 3-4. CO2 Emission Rates by Category Unit Age (Years): Small APPA/NRECA EGUs, 2007 - 2013 ................................................................................................................................ 8 Figure 3-5. CO2 Emission Rates for Small EGUs vs. National Inventory, By Quartiles of Capacity Factor ................................................................................................................................. 9 Figure 3-6. CO2 Emission Rates for Small EGUs vs. National Inventory, By Coal Rank .......................................................................................................................................... 9 Figure 5-1. Normalized Capital Investment vs. Payback Period ..................................... 15 Figure 5-2. CO2 Reduction vs. Calculated Payback Period ................................................. 15 Figure A-1. Gross Plant Heat Rate vs. Load: CR Lowman Unit 1 ..................................... 18 Figure A-2. Gross Plant Heat Rate vs. Load: Muscatine 8 .................................................. 18

LIST OF TABLES
Table 3-1. Small Units Owned by APPA/NRECA ..................................................................... 5 Table 4-1. Heat Rate Improving Options .................................................................................. 11 Table 4-2. Capital Required and Payoff of Heat Rate Improving Options ..................... 12 Table 4-3. Characteristics of Reference EGUs ......................................................................... 13

1
II. SECTION 1
INTRODUCTION AND SUMMARY
Electric generating units (EGU) of “small” output capacity will encounter barriers to meeting the carbon dioxide (CO2) reduction targets used as the basis of Building Block 1 of the proposed Clean Power Plan. Small generating units, typically considered those of less than 200 MW capacity, cannot economically derive the same benefits in heat rate and CO2 reduction as the larger units that comprise the bulk of the U.S. coal-fired fleet. Many small units are owned by public power utilities or rural cooperatives and qualify as small entities, as defined by the Regulatory Flexibility Act (RFA) and amended by the Small Business Regulatory Enforcement Fairness Act of 1996 (SBREFA). Small entities can face limits in raising capital due to the control procedures required for expending public funds. Municipal utilities raise capital for many of their environmental projects by issuing bonds, which are rated by three major agencies: Moody’s, Standards & Poor and Fitch. A bond rating does not constitute a recommendation to invest in a bond and does not take into consideration the risk preference of the investor. While many factors go into the investment decision-making process, the bond rating is often the single most important factor affecting the interest cost on bonds. Moody’s has developed a municipal utility scorecard19 that outlines the rating factors taken into consideration by the agency; these include the system characteristics, financial strength, and various management and legal provisions. These rating factors are particularly important for small entities as they can dictate decisions about replacing, repairing or modifying aging equipment, all while delivering adequate service with existing resources. Regulatory compliance and capital planning are also factors that rating agencies consider; specifically how well a utility complies with relevant regulations and their plans for capital expenditure to comply with future mandates. Small public power utilities and rural cooperatives are less likely to have generation redundancies, which allow a system to shut down some of its operation in an emergency or to make repairs without interrupting service. Any capital needed is likely to be more costly relative to the limited annual budget of small entities, while evaluating and deploying heat rate improvements will be hampered by limited engineering staff. This paper explores the barriers that public power or cooperative owners of small units could encounter in deploying heat rate improvements in an attempt to meet the proposed Building Block 1 CO2 reduction goals. The results of this analysis quantify the capital
19 Dan Seymour and Brady Olsen, US Municipal Utility Revenue Debt, Moody’s, July 30, 2014.

2
requirement and the “payback” time to recoup the investment for heat rate improvements. Several examples of heat rate-improving options are selected to evaluate the benefit of avoided CO2 emissions in addition to capital required and the payback time. For this analysis, an investment of $750K is selected as an arbitrary threshold defining “higher” or “lower” cost investments. Thus, options considered in this analysis reflect investments of both “lower” cost – those requiring less than $750K – and of “higher” cost, requiring greater than $750K. The capital requirement, CO2 avoided, and the payback for several heat rate-improving options is calculated for two reference units, reflecting “small” and “conventional” generating capacity. A reference unit of 100 MW capacity is selected to reflect small units, representing the 25-200 MW range. A reference unit of 500 MW capacity is selected to represent “conventional” units. The capital cost for and the benefits of various heat rate options were obtained from analysis conducted for the Utility Air Regulatory Group (UARG)20 and from the 2014 National Coal Council report to the Department of Energy Secretary.21 The reduction in operating cost and the payback time is determined using heat rate benefits and capacity factors appropriate for each unit; the latter 45% and 75% for the 100 MW and 500 MW units, respectively. The delivered fuel price is the same ($2.25/MBtu) for both units. The results show owners of small generating units will incur a payback period for heat rate-improving options that significantly exceeds that for owners of conventional (e.g., 500 MW) units. Most notably, the payback period for a steam turbine upgrade to a 500 MW unit is shown to be 3-4 years, based on a 200 Btu/kWh reduction in heat rate. In contrast, owners of small generating units – even if assumed to extract a greater heat rate benefit of 250 Btu/kWh – incur an almost 12-year payback period. This extended payback time, given present environmental mandates and the wholesale power market, presents significant risk to owners that a unit will remain a viable generating option. Further, the absolute value of capital required – likely exceeding several million dollars for an installed system – could be a challenge to acquire for small public power entities. Section 2 describes the approach used in this analysis, and Section 3 the key operating characteristics of small generating units that dictate results. Section 4 summarizes the heat rate-improving options considered in this analysis, and Section 5 presents the results. Conclusions are offered in Section 6.
20 Evaluation of Heat Rate Improving Techniques for Coal-Fired Utility Boilers as a Response to Section 111(d)
Mandates, Prepared for UARG by J.E. Cichanowicz and M.C. Hein, October 13, 2014. Hereafter UARG 2014 Heat Rate Report. 21 National Coal Council 2014 Report to the Secretary of Energy, Reliable and Resilient: The Value of Our Existing Coal Fleet, May 2014. Hereafter National Coal Council 2014 Report.

3
III. SECTION 2
APPROACH
This analysis employs three elements: (a) quantifying the capacity factor and CO2 emission rate (lbs MWh, net basis) for small generating units; (b) selecting several “reference” units and heat rate-improving options that could be deployed to small and conventional units, and (c) quantifying the results in terms of capital required, CO2 avoided, and the payback period. First, quantifying the capacity factor and CO2 emission rate of small units that are owned by public power and rural cooperative entities is necessary to distinguish between the operation of small and conventional generating units. This paper focuses on owners that qualify as small businesses, although data from small units owned by a variety of entities is used to strengthen the analysis. Small unit data is compared to analogous data describing the operation of conventional, larger units. Second, examples of heat rate improvements potentially available to use in an attempt to meet Building Block 1 goals of the Clean Power Plan are selected, based on 2014 reports issued by UARG and the National Coal Council. Heat rate-improving options qualifying as “lower” cost (e.g., less than $750K capital) and “higher” cost (greater than $750K capital) are both considered. The $750K threshold represents an arbitrary but rationale means to delineate heat rate-improving options, which range in cost from several hundred thousand dollars to $7M, depending on unit output. Third, we define two reference units as examples to quantify the results for a limited number of heat rate-improving options. As noted, capital investment, avoided CO2 emission rate, and “payback” period to recover that investment are determined. Details and results are presented in subsequent sections.
4
IV. SECTION 3
OPERATING CHARACTERISTICS OF SMALL ELECTRIC GENERATING UNITS
Section 3 describes the operating characteristics of small generating units that determine the benefit and cost recovery for heat rate reduction options. This discussion is preceded by a description of the generating units selected for analysis.
A. Reference Units
Reference units are drawn mostly from APPA and NRECA portfolios, focusing on small units operated by owners considered by the Environmental Protection Agency (EPA) to be small business entities. Table 3-1 summarizes the units used to establish trends in capacity factor and CO2 emission rate based on the last 7 years of operation. Not all generating units in Table 3-1 are owned by entities designated as small businesses (e.g., Tri-State G&T) but these are included to broaden the database. Seventeen of the units in Table 3-1 are owned by members of NRECA while five are owned by members of APPA.
B. Small EGU Capacity Factor, CO2 Emission Rate
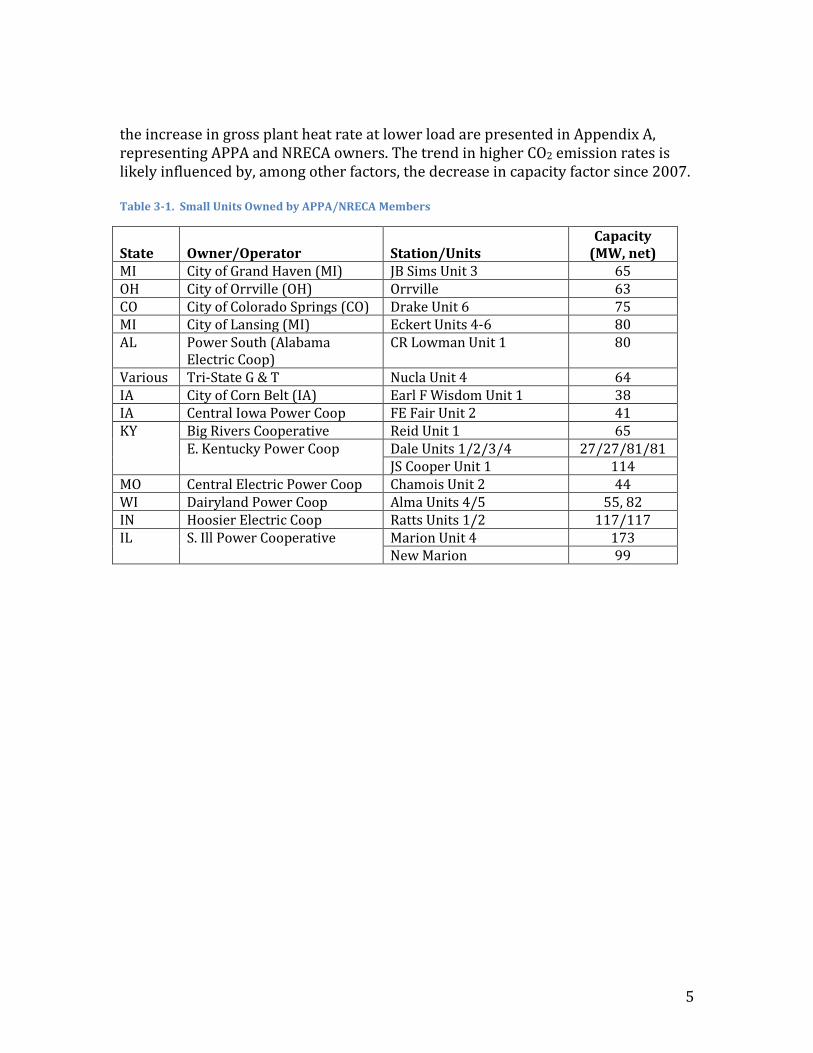
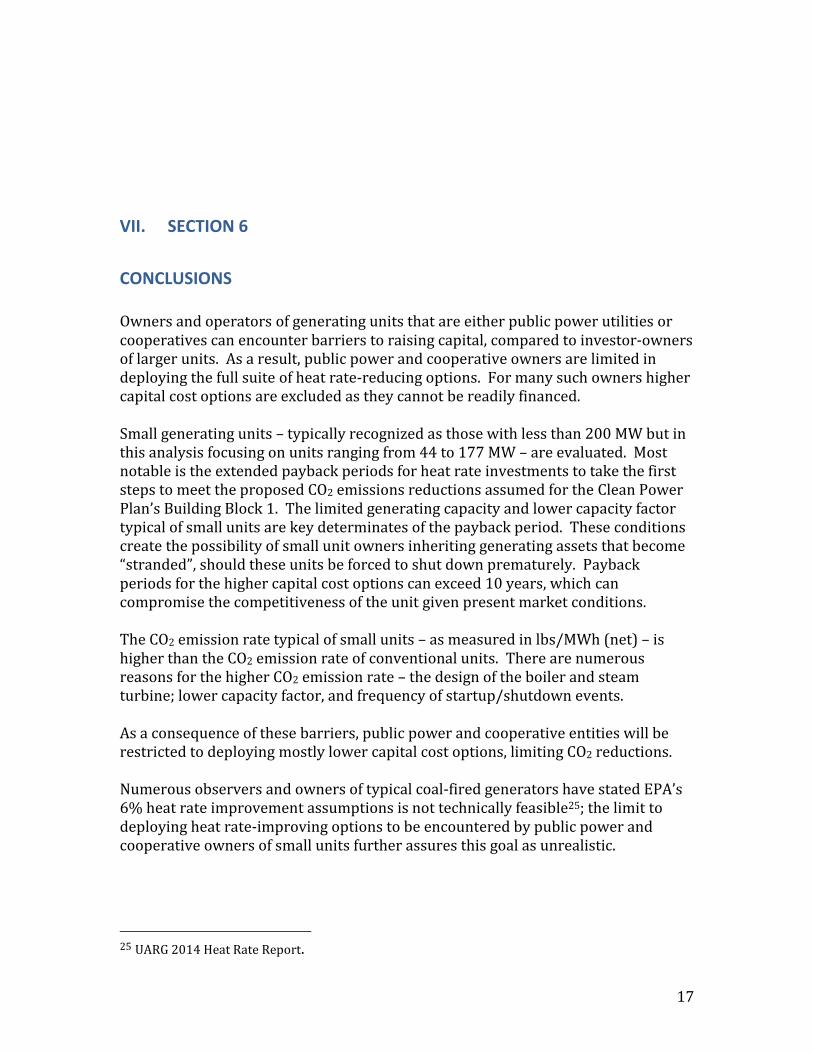
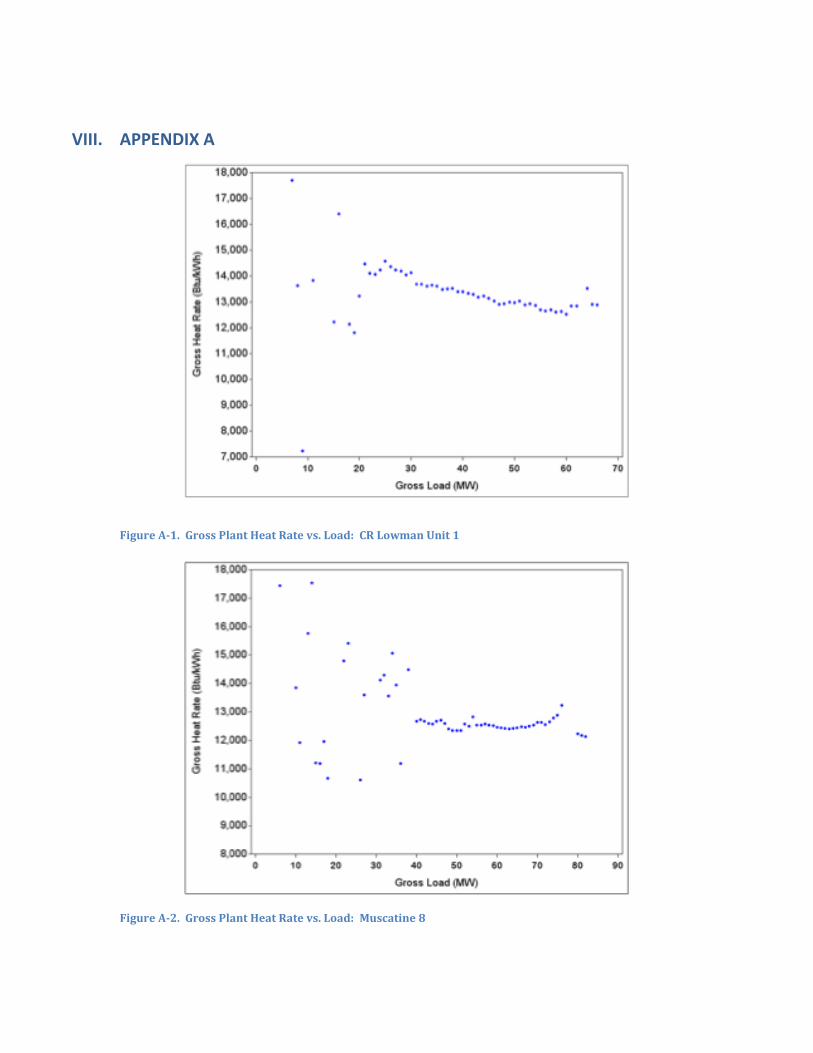
The capacity factor and heat rate for the small generating units in Table 3-1 are presented in Figures 3-1 and 3-2. Figure 3-1 describes the average capacity factor, distinguishing between NRECA and APPA owners, based on generation data submitted to the Energy Information Agency (EIA). The data presented Figure 3-1 show an almost year-by-year decrease (with the exception of 2010) in capacity factor from 2007 through 2013. There is little difference in the capacity factor of NRECA and APPA–member units over this time period; capacity factor in four of the seven years is almost identical. Notably, in 2013 the small unit capacity factor is approximately 15 percentage points less than the average generating unit in the national coal-fired inventory. Figure 3-2 shows the CO2 emission rate (lbs/MWh, net basis) increases over the same period of 2007 through 2013. It is well known that operating at lower load compromises heat rate and elevates the CO2 emission rate. Two examples showing
5
the increase in gross plant heat rate at lower load are presented in Appendix A, representing APPA and NRECA owners. The trend in higher CO2 emission rates is likely influenced by, among other factors, the decrease in capacity factor since 2007. Table 3-1. Small Units Owned by APPA/NRECA Members
State
Owner/Operator
Station/Units
Capacity (MW, net)
MI City of Grand Haven (MI) JB Sims Unit 3 65 OH City of Orrville (OH) Orrville 63 CO City of Colorado Springs (CO) Drake Unit 6 75 MI City of Lansing (MI) Eckert Units 4-6 80 AL Power South (Alabama
Electric Coop) CR Lowman Unit 1 80
Various Tri-State G & T Nucla Unit 4 64 IA City of Corn Belt (IA) Earl F Wisdom Unit 1 38 IA Central Iowa Power Coop FE Fair Unit 2 41 KY
Big Rivers Cooperative Reid Unit 1 65 E. Kentucky Power Coop Dale Units 1/2/3/4 27/27/81/81
JS Cooper Unit 1 114 MO Central Electric Power Coop Chamois Unit 2 44 WI Dairyland Power Coop Alma Units 4/5 55, 82 IN Hoosier Electric Coop Ratts Units 1/2 117/117 IL
S. Ill Power Cooperative Marion Unit 4 173 New Marion 99

6
Figure 3-1. Capacity Factor for Small APPA/NRECA EGUs, 2007- 2013
Figure 3-2. CO2 Emission Rate (Net) for Small APPA/NRECA EGUs, 2007- 2013

7
C. Comparison to Conventional Inventory
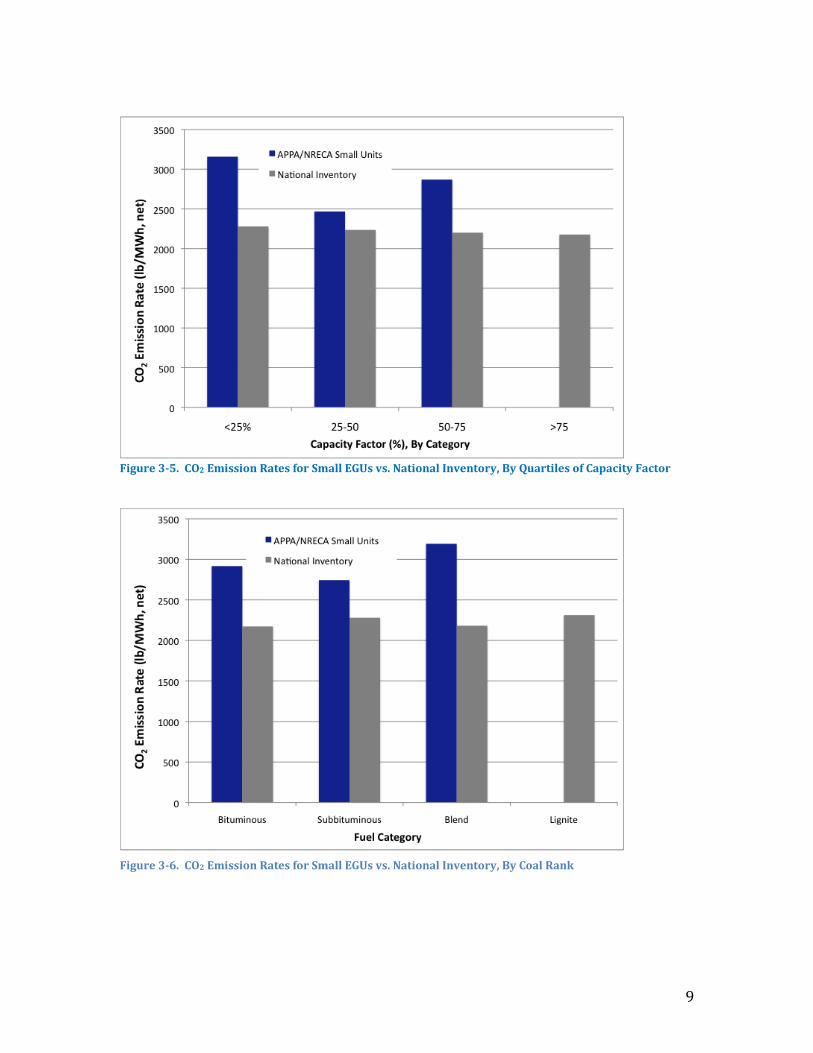
The uniqueness of small generating units compared to conventional, larger coal-fired units is demonstrated by comparing the capacity factor and CO2 emissions from these groups, as revealed in Figures 3-3 to 3-6. Figure 3-3 shows CO2 emission rates from small units exceed those of conventional, larger units. Units of higher generating capacity can deploy heat rate-improving concepts that may not be economically feasible or even applicable to small units. Figure 3-4 shows the higher CO2 emission rate of small units is not solely due to unit age. Higher CO2 emissions are observed not only for units with greatest longevity – those in service for at least 40 years – but also for units with service of 20-40 years. Even a relatively “new” unit – in service for less than 10 years – will emit more CO2 than newer units in the national inventory, due to either a low capacity factor or constrained design options. Figure 3-5 provides further insight to the role of capacity factor. This depiction presents data for three of the four quartiles of capacity factor data describing both small and conventional units. The results show higher CO2 emissions are generated from small generating units. Figure 3-5 demonstrates capacity factor alone is not responsible for the higher CO2 emission rate. Finally, regardless of coal source – bituminous, subbituminous, or a blend of these – higher CO2 emissions are incurred with small generating units (Figure 3-6).
D. Small Unit Operating Characteristics:
The observations based on data presented in Section 3 are summarized as follows:
The capacity factor of small EGUs has almost continually decreased each year since 2003. For the year 2013, capacity factor is 15 percentage points less than the capacity factor of an average unit in the national coal-fired fleet.
Over the same period of time, the CO2 emission rate (lbs/MWh, net basis) has
increased, and exceeds by 25% the CO2 emission rate of the average unit in the national coal-fired fleet.
The higher observed CO2 emission rate of small units compared to the national fleet
is observed for units of all ages, ranging from those with less than 10 years to those with more than 40 years of service, and is independent of coal rank.

8
Figure 3-3. CO2 Emission Rates by Categories of Generating Capacity (MW): Small APPA/NRECA EGUs, 2007 - 2013
Figure 3-4. CO2 Emission Rates by Category of Unit Age (Years): Small APPA/NRECA EGUs, 2007 - 2013
9
Figure 3-5. CO2 Emission Rates for Small EGUs vs. National Inventory, By Quartiles of Capacity Factor
Figure 3-6. CO2 Emission Rates for Small EGUs vs. National Inventory, By Coal Rank

10
V. SECTION 4
EVALUATION OF HEAT RATE-IMPROVING OPTIONS
Section 4 describes example heat rate-improving options for small generating units, and the basis for calculating how these options affect unit operation.
A. Heat Rate Improving Options
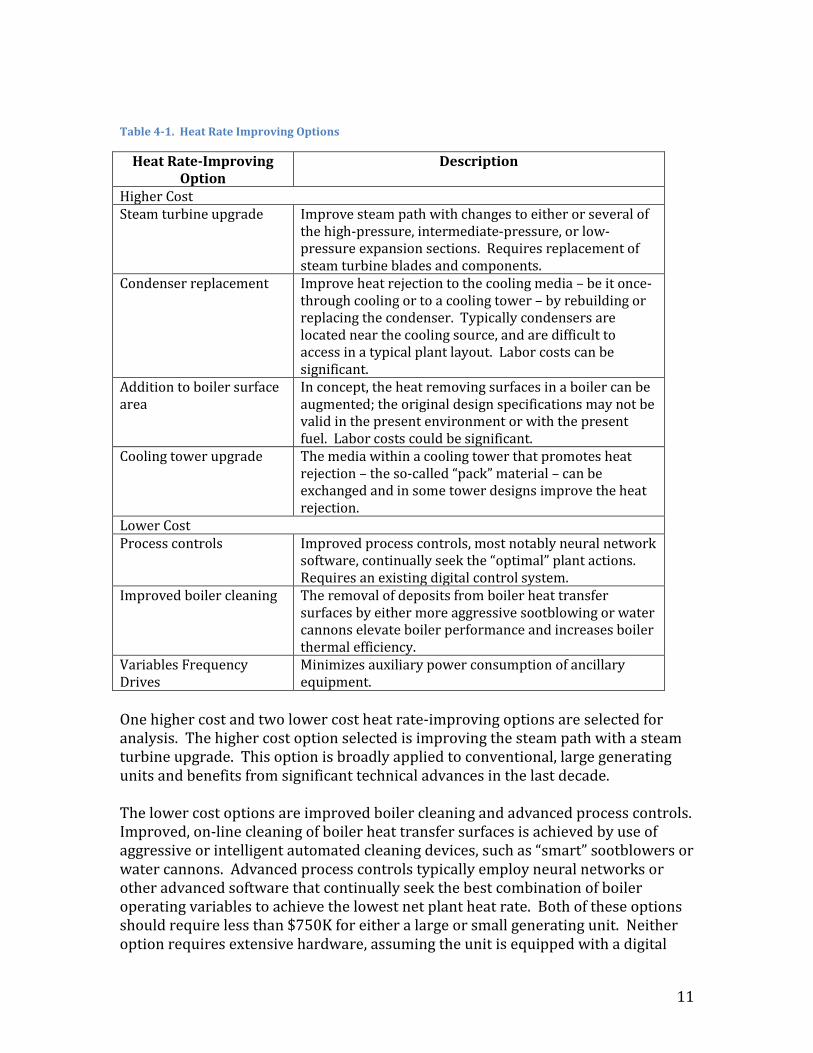
The options for improving coal-fired plant heat rate have been summarized in two recent reports – one prepared for the UARG for submission to the EPA as part of comments for Section 111 (d) rulemaking,22 and a second report prepared by the National Coal Council in 2014 recommending research and development actions to the Secretary of Energy.23 A detailed treatment of heat rate-improving options is beyond the scope of this paper; further discussion is referenced to these reports. This section summarizes examples of heat rate-improving options that are available and selects several for evaluation for a reference small and conventional EGU. Table 4-1 summarizes heat rate-improving actions derived from the UARG and National Coal Council reports. The options are delineated according to the threshold of $750K as defining “higher” and “lower” cost. The higher cost options in Table 4-1 could require capital for a 500 MW unit from $1 M (boiler surface changes) to $6 M (steam turbine upgrade), providing heat rate savings from 50 to 225 Btu/kWh. The lower cost options all require capital less than $750,000 and could deliver benefits of 20 to 100 Btu/kWh. Three of the heat rate-improving options in Table 4-1 are selected to evaluate their impact on the two “reference” unit defined. These options are evaluated in terms of (a) capital requirement, in terms of both total expenditure (i.e., $M of dollars) and normalized to generating output ($/kW), and (b) investment payoff in heat rate and CO2 reduction.
22 UARG 2014 Heat Rate Report. 23 National Coal Council 2014 Report.
11
Table 4-1. Heat Rate Improving Options
Heat Rate-Improving Option
Description
Higher Cost Steam turbine upgrade Improve steam path with changes to either or several of
the high-pressure, intermediate-pressure, or low-pressure expansion sections. Requires replacement of steam turbine blades and components.
Condenser replacement Improve heat rejection to the cooling media – be it once-through cooling or to a cooling tower – by rebuilding or replacing the condenser. Typically condensers are located near the cooling source, and are difficult to access in a typical plant layout. Labor costs can be significant.
Addition to boiler surface area
In concept, the heat removing surfaces in a boiler can be augmented; the original design specifications may not be valid in the present environment or with the present fuel. Labor costs could be significant.
Cooling tower upgrade The media within a cooling tower that promotes heat rejection – the so-called “pack” material – can be exchanged and in some tower designs improve the heat rejection.
Lower Cost Process controls Improved process controls, most notably neural network
software, continually seek the “optimal” plant actions. Requires an existing digital control system.
Improved boiler cleaning The removal of deposits from boiler heat transfer surfaces by either more aggressive sootblowing or water cannons elevate boiler performance and increases boiler thermal efficiency.
Variables Frequency Drives
Minimizes auxiliary power consumption of ancillary equipment.
One higher cost and two lower cost heat rate-improving options are selected for analysis. The higher cost option selected is improving the steam path with a steam turbine upgrade. This option is broadly applied to conventional, large generating units and benefits from significant technical advances in the last decade. The lower cost options are improved boiler cleaning and advanced process controls. Improved, on-line cleaning of boiler heat transfer surfaces is achieved by use of aggressive or intelligent automated cleaning devices, such as “smart” sootblowers or water cannons. Advanced process controls typically employ neural networks or other advanced software that continually seek the best combination of boiler operating variables to achieve the lowest net plant heat rate. Both of these options should require less than $750K for either a large or small generating unit. Neither option requires extensive hardware, assuming the unit is equipped with a digital

12
control system; consequently the economies of scale are negligible (e.g. the cost is similar for either a small or large generating unit). Both options impose a small fixed operating cost that is considered in the payback analysis.
B. Reference Generating Unit Evaluation
Two reference generating units are selected to quantify the benefit of the heat rate-improving options and define the barriers to implementation. The benefit is the reduction in operating cost and the associated avoided CO2 emissions, the latter expressed in terms of lbs/MWh (net) basis. The barrier to implementation is cost in terms of both capital required (i.e., $M) and per output of power ($/kW). Table 4-2 summarizes the capital cost and payoff in terms of heat rate improvement that is assumed for the three heat rate-improving options, as applied to the two reference units. The capital costs are derived from the UARG and National Coal Council reports, both of which document capital requirement for units of nominally 500 MW. Table 4-2. Capital Required and Payoff of Heat Rate Improving Options
Option Conventional (500 MW) EGU
Small (100 MW) Unit
Steam Turbine Upgrade - Capital ($M) 5 2.2 - Heat Rate Reduction (Btu/kWh)
200 250
Advanced Controls - Capital ($M) 0.6 0.4 - Heat Rate Reduction (Btu/kWh)
50 75
Advanced Boiler Cleaning - Capital ($M) 0.5 0.25 - Heat Rate Reduction (Btu/kWh)
60 80
13
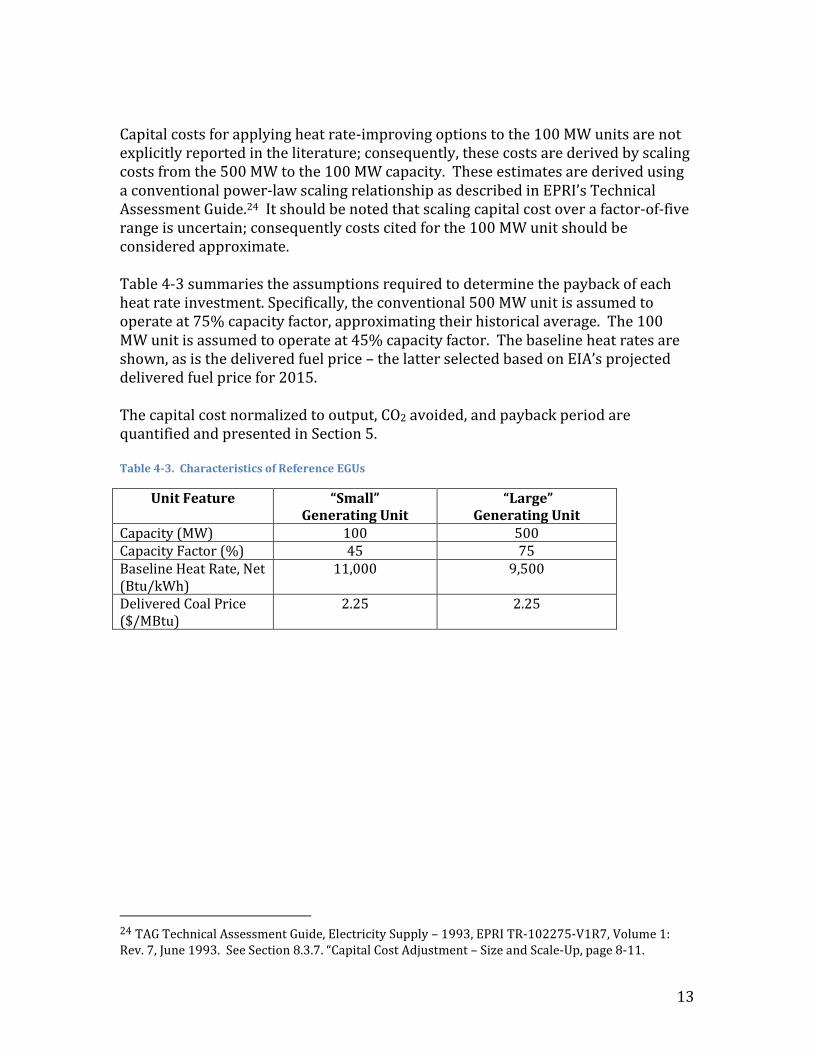
Capital costs for applying heat rate-improving options to the 100 MW units are not explicitly reported in the literature; consequently, these costs are derived by scaling costs from the 500 MW to the 100 MW capacity. These estimates are derived using a conventional power-law scaling relationship as described in EPRI’s Technical Assessment Guide.24 It should be noted that scaling capital cost over a factor-of-five range is uncertain; consequently costs cited for the 100 MW unit should be considered approximate. Table 4-3 summaries the assumptions required to determine the payback of each heat rate investment. Specifically, the conventional 500 MW unit is assumed to operate at 75% capacity factor, approximating their historical average. The 100 MW unit is assumed to operate at 45% capacity factor. The baseline heat rates are shown, as is the delivered fuel price – the latter selected based on EIA’s projected delivered fuel price for 2015. The capital cost normalized to output, CO2 avoided, and payback period are quantified and presented in Section 5. Table 4-3. Characteristics of Reference EGUs
Unit Feature “Small” Generating Unit
“Large” Generating Unit
Capacity (MW) 100 500 Capacity Factor (%) 45 75 Baseline Heat Rate, Net (Btu/kWh)
11,000 9,500
Delivered Coal Price ($/MBtu)
2.25 2.25
24 TAG Technical Assessment Guide, Electricity Supply – 1993, EPRI TR-102275-V1R7, Volume 1: Rev. 7, June 1993. See Section 8.3.7. “Capital Cost Adjustment – Size and Scale-Up, page 8-11.

14
VI. SECTION 5
RESULTS OF THE ANALYSIS
The results of this analysis clarify the challenges faced by owners of small units in deploying heat rate-improving options. This is demonstrated by considering the payback period over which capital is returned, which in addition to capital required is a key financial metric. In the context of this analysis, the “payback” period is the number of years over which lower operating cost due to fuel savings returns the capital investment. The payback period is determined without considering the cost of financing the capital equipment, or the levelization of operating cost over future years. A strict determination of “payback” period would entail accounting for these cost-of-money factors; these are ignored in this approximate analysis.
A. Normalized Capital Per Payback Period
Figure 5-1 presents the payback period anticipated for investments associated with the three heat rate-improving options for the two reference units. Figure 5-1 shows the capital investment – in this depiction cast in terms of cost per output capacity ($/kW) – for the three options, presented versus the payback period. Figure 5-1 shows the larger generating capacity and higher capacity factor of the 500 MW unit minimizes the payback period – about 4 years for the highest cost option (steam turbine upgrade). In contrast, the 100 MW unit – although requiring less capital on an absolute basis (i.e., $M of dollars) – is penalized as capital required per generator output is very high. For the steam turbine upgrade, the payback period is almost 12 years - exceeding the payback for the 500 MW unit by a factor of 3. The lower cost options of advanced process controls and deep boiler cleaning feature significantly shorter payback periods – 1-2 years for the 500 MW unit. For the 100 MW unit the extended payback period is 6-7 years.
B. CO2 Reduction vs. Payback Period
Figure 5-2 presents the CO2 reduction anticipated versus the payback period.

15
Figure 5-1. Normalized Capital Investment vs. Payback Period
Figure 5-2. CO2 Reduction vs. Calculated Payback Period
Figure 5-2 shows that a CO2 emission rate of 10 and 50 lbs/MWh net can be avoided, depending on the heat rate improving option and the reference unit. The highest
16
value of CO2 avoided – up to 50 lbs/MWh for a steam turbine upgrade for the 100 MW unit – requires almost a 12-year payback. The smallest values of CO2 avoided (10-12 lbs/MWh) require less than 2 years payback.
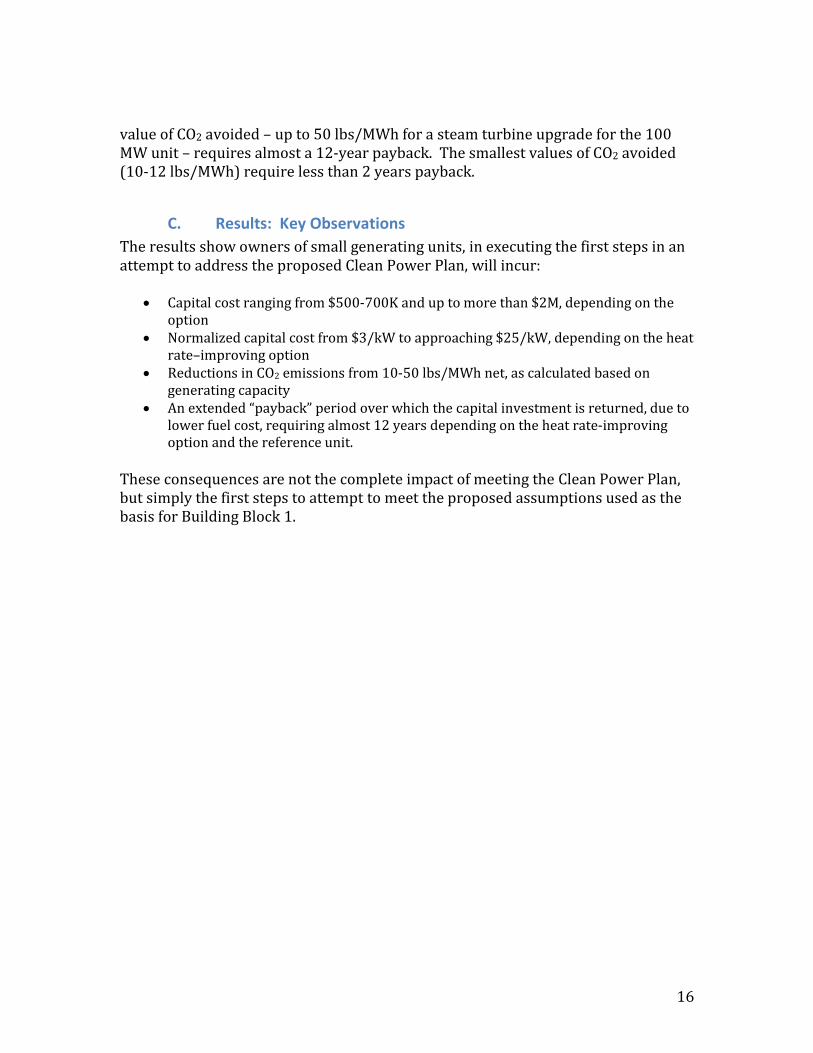
C. Results: Key Observations
The results show owners of small generating units, in executing the first steps in an attempt to address the proposed Clean Power Plan, will incur:
Capital cost ranging from $500-700K and up to more than $2M, depending on the option
Normalized capital cost from $3/kW to approaching $25/kW, depending on the heat rate–improving option
Reductions in CO2 emissions from 10-50 lbs/MWh net, as calculated based on generating capacity
An extended “payback” period over which the capital investment is returned, due to lower fuel cost, requiring almost 12 years depending on the heat rate-improving option and the reference unit.
These consequences are not the complete impact of meeting the Clean Power Plan, but simply the first steps to attempt to meet the proposed assumptions used as the basis for Building Block 1.
17
VII. SECTION 6
CONCLUSIONS
Owners and operators of generating units that are either public power utilities or cooperatives can encounter barriers to raising capital, compared to investor-owners of larger units. As a result, public power and cooperative owners are limited in deploying the full suite of heat rate-reducing options. For many such owners higher capital cost options are excluded as they cannot be readily financed. Small generating units – typically recognized as those with less than 200 MW but in this analysis focusing on units ranging from 44 to 177 MW – are evaluated. Most notable is the extended payback periods for heat rate investments to take the first steps to meet the proposed CO2 emissions reductions assumed for the Clean Power Plan’s Building Block 1. The limited generating capacity and lower capacity factor typical of small units are key determinates of the payback period. These conditions create the possibility of small unit owners inheriting generating assets that become “stranded”, should these units be forced to shut down prematurely. Payback periods for the higher capital cost options can exceed 10 years, which can compromise the competitiveness of the unit given present market conditions. The CO2 emission rate typical of small units – as measured in lbs/MWh (net) – is higher than the CO2 emission rate of conventional units. There are numerous reasons for the higher CO2 emission rate – the design of the boiler and steam turbine; lower capacity factor, and frequency of startup/shutdown events. As a consequence of these barriers, public power and cooperative entities will be restricted to deploying mostly lower capital cost options, limiting CO2 reductions. Numerous observers and owners of typical coal-fired generators have stated EPA’s 6% heat rate improvement assumptions is not technically feasible25; the limit to deploying heat rate-improving options to be encountered by public power and cooperative owners of small units further assures this goal as unrealistic.
25 UARG 2014 Heat Rate Report.
VIII. APPENDIX A
Figure A-1. Gross Plant Heat Rate vs. Load: CR Lowman Unit 1
Figure A-2. Gross Plant Heat Rate vs. Load: Muscatine 8