small business & agriculture advisory council federal ... you plan to increase investment in...
TRANSCRIPT

Small Business & Agriculture Advisory Council Federal Reserve Bank of New York
33 Liberty Street 10F, Paul Volcker Boardroom
Thursday, November 20 AGENDA 10:30am Introductory Remarks
Christine Cumming, First Vice President 10:40am-11:10am The National Economy
Richard Peach, Senior Vice President 11:10am-11:30am Regional Update
Jason Bram, Vice President 11:30am-12:00pm International Update
John Clark, Senior Vice President
12:00pm 12:15pm 12:15pm-1:55pm
Adjourn to NWCR-10F Lunch Round Table Discussion with William Dudley, President Questions for discussion with President Dudley: Your experience and that of your customers and suppliers can give us insight into current economic conditions. 1. Did your firm’s sales volume increase, decrease or stay the
same in the second half of the year? 2. Next year, do you expect your firms’ sales to increase, decrease, or stay the same? 3. Do you plan to increase investment in your firm (plant &
equipment) next year? 4. Has your firm faced any shortage of labor that has limited your
ability to meet demand? 5. Do you plan to increase employment next year? 6. Do you expect input prices to increase next year? Do you
expect prices of products/services sold to increase? 7. Over the past six months, how have the terms and conditions
for obtaining financing changed (tightened, eased, not changed)?
2:00 pm Adjourn

Small Business & Agricultural Advisory Council Federal Reserve Bank of New York
33 Liberty Street New York, NY
Thursday, November 20, 2014
ATTENDEE LIST
Council Members Michael Arnoff President Arnoff Moving & Storage Stewart Brunhouse President A&A Company, Inc. William Byrne Chairman of the Board Byrne Dairy, Inc. Eric Caslow President Acme Smoked Fish
David Campbell President and CEO Rings End, Inc. Peter Maglathlin Chief Executive Officer MBI, Inc. Patrick Marotta President/CEO Marotta Controls Edward J. Tregurtha President Moran Towing Corporation
Federal Reserve Bank of New York William Dudley President Christine Cumming Richard Peach John Clark
First Vice President SVP, Research & Statistics SVP, Development Studies & Foreign Research
Kausar Hamdani Anand Marri Rae Rosen Claire Kramer Jason Bram Luis Uranga David Parkinson
SVP, Communication & Outreach VP, Head of Outreach & Education VP, Outreach & Education AVP, Outreach & Education Officer, Research & Statistics Sr. Associate, Chief of Staff’s Office Counsel, Legal

US Macro Overview November 20, 2014

GDP Trillions of 2009 US$ Trillions of 2009 US$
Source: Bureau of Economic Analysis, Congressional Budget Office
2000Q1 to 2007Q4: 2.5% Growth Rate
2009Q2 to 2014Q3: 2.3% Growth Rate
Time Period Potential GDP (CBO)
2000 - 2005 3.14%
2005 – 2010 2.11%
2010 – 2015 1.55%
2015 – 2020 2.18%
2

56
58
60
62
64
66
68
0
2
4
6
8
10
12
2000 2002 2004 2006 2008 2010 2012 2014
Labor Market Indicators
Source: Bureau of Labor Statistics
Unemployment Rate (Left Axis)
Labor Force Participation Rate
(Right Axis)
Percent Percent
Employment to Population
Ratio (Right Axis)
3

PCE Deflator
% Change – Year to Year % Change – Year to Year
Source: Bureau of Economic Analysis
Total PCE
Core PCE
FOMC Objective
4

Disposable Income, Consumption, and Wealth
% Change over 20 Quarters, Annual Rate % of Disposable Income
Real Personal Consumption
(Left Axis)
Real Disposable Income
(Left Axis)
Household Net Worth
(Right Axis)
Source: Bureau of Economic Analysis, Federal Reserve Board 5

0
2
4
6
8
10
12
400 450 500 550 600 650 7000
2
4
6
8
10
12
Source: Bureau of Economic Analysis and Federal Reserve Board Households’ Net Worth as a Percent of Disposable Income
2006-2007
2008Q2
2009Q2
Note: Fitted line is from 1983Q1 to 2005Q4.
2011Q2
Personal Saving Rate and Household Net Worth Personal Saving Rate (Percent) Personal Saving Rate (Percent)
2010Q2
2014Q3E
(630, 5.5)
2012Q2 If SFP 500 at 1800
(618, 5.5)
6

-15
-10
-5
0
5
10
15
20
25
30
-15
-10
-5
0
5
10
15
20
25
30
2000 2002 2004 2006 2008 2010 2012 2014
Consumer Debt by Credit Score % Change – Year to Year % Change – Year to Year
Source: FRBNY Consumer Credit Panel
1st Quintile (Highest)
2nd Quintile
3rd Quintile 4th Quintile
5th Quintile (Lowest)
Note: Includes Student Loans 7

-30
-20
-10
0
10
20
30
-30
-20
-10
0
10
20
30
305 - 603 604 - 679 680 - 749 750 - 801 802 - 842
Change in Debt 2013Q3-2014Q3 By Credit Score Quintile Percent Percent
Equifax Risk Score Quintiles*
Mortgage/HELOC Auto Credit Card Inquiries
Note: * 2013Q3 Quintiles 8

Housing Starts Thousands, 3 MMA Thousands, 3 MMA
Source: Census Bureau
Total Multifamily (Right Axis)
1 Unit (Left Axis)
9

3
4
5
6
7
8
9
10
11
12
13
20
50
80
110
140
170
200
230
2000 2002 2004 2006 2008 2010 2012 2014
Single Family Housing Market Index, January 2000 = 100 Months’ Supply
Source: CoreLogic, National Association of Realtors
CoreLogic House Price Index
(Left Axis)
Months’ Supply (Right Axis)
“Normal” Range for Months’ Supply
10

-1000
-500
0
500
1000
1500
2000
1999 2001 2003 2005 2007 2009 2011 2013-1000
-500
0
500
1000
1500
2000
Household Formations 2 Year Avg. Change 2 Year Avg. Change
Source: Bureau of the Census
Total
Owner Occupied
Renter Occupied
11 11
Homeownership rate down to 64.3% from peak of 69.4% in 2004Q2. (6 million fewer homeowners)

500
550
600
650
700
750
800
500
550
600
650
700
750
800
1999 2002 2005 2008 2011 2014
About 35 to 40 Million People
Credit Score at Mortgage Origination: All First Mortgages Credit Score Credit Score
Source: FRBNY Consumer Credit Panel.
Median
10th Percentile
25th Percentile
12

Share of GDP Share of GDP
Source: Bureau of Economic Analysis / Haver Analytics
Structures
Equipment
Intellectual Property
Private Nonresidential
Private Nonresidential Fixed Investment Spending
13

Equipment Investment Spending and Capacity Real Business Investment in New Equipment (% Change – Year to Year)
Real Business Investment in New Equipment (% Change – Year to Year)
Source: Federal Reserve Board, Bureau of Economic Analysis
Manufacturing Capacity Utilization (Percent of Capacity)
2014Q3:
(77.3, 7.7)
14

0
1
2
3
4
5
6
0
1
2
3
4
5
6
1948 1960 1972 1984 1996 2008
Real Net Stock of Private Fixed Nonresidential Capital Year/Year % Change Year/Year % Change
Source: Bureau of Economic Analysis
Includes structures, equipment, and intellectual property products.
15
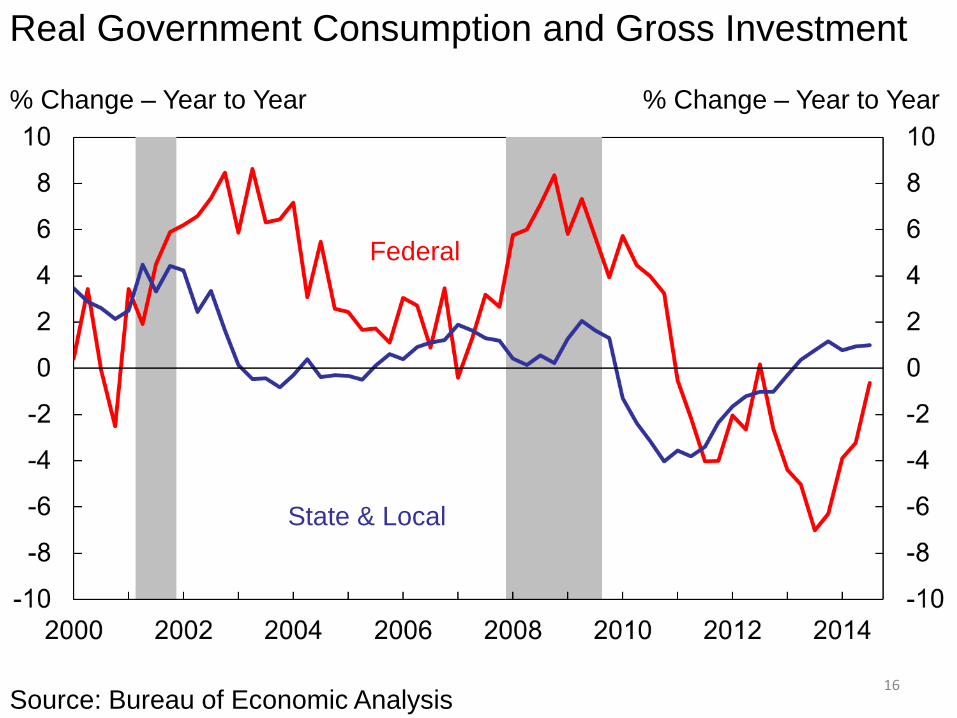
Real Government Consumption and Gross Investment
% Change – Year to Year % Change – Year to Year
Source: Bureau of Economic Analysis
Federal
State & Local
16

Growth of Real Exports of Goods and Manufacturing Output
-20
-10
0
10
20
-20
-10
0
10
20
2004 2005 2006 2007 2008 2009 2010 2011 2012 2013 2014
Percent Change Over Year Percent Change Over Year
Sources: BEA, FRB / Haver
Real Exports of Goods (SAAR, Chn.2009$)
Industrial Production: Manufacturing
r = 0.84

95
105
115
125
135
145
155
165
175
95
105
115
125
135
145
155
165
175
2010 2011 2012 2013 2014
Goods Exports by Destination Index, Q1 2010 = 100 Index, Q1 2010 = 100
Asia NIE
Japan
NAFTA
China
EU15
Source: Census Bureau. Data are 4 Quarter moving averages
Share of imports: NAFTA 33%, EU 17%, China 8%, Asia NIE 9%,Japan 4%. 18

Private Nonfarm Payroll Employment and Hours % Change – Year to Year
Source: Bureau of Labor Statistics
Hours*
Employment
% Change – Year to Year
* Note: Production and Non-Supervisory, Employees Only
19
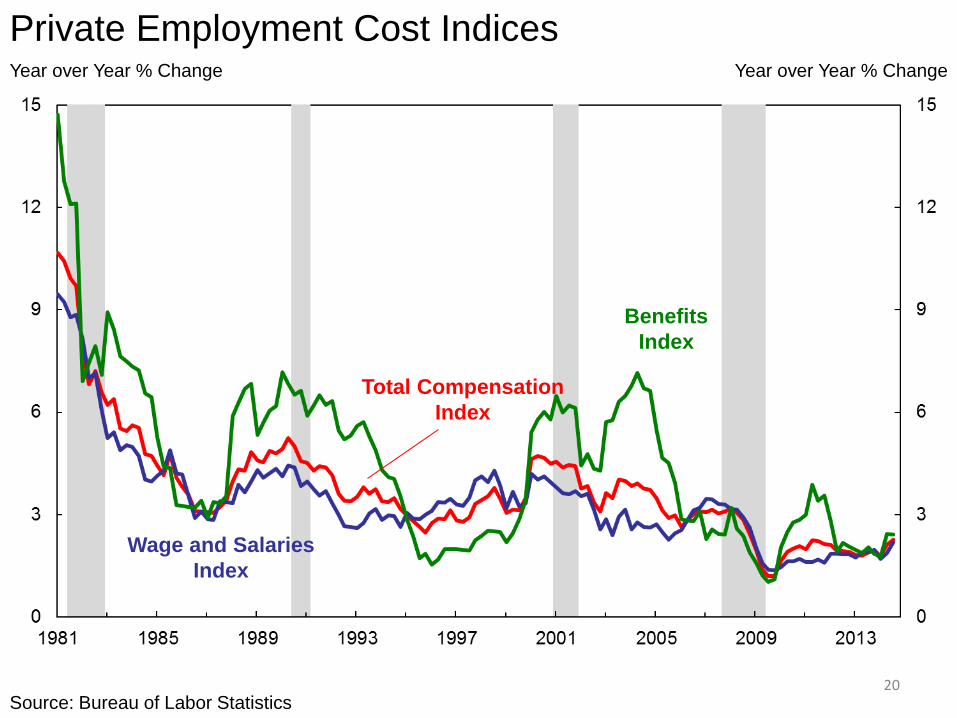
Private Employment Cost Indices Year over Year % Change Year over Year % Change
Source: Bureau of Labor Statistics
Total Compensation Index
Benefits Index
Wage and Salaries Index
20

-1
-0.5
0
0.5
1
1.5
2
2.5
3
3.5
4
4.5
5
-1.0
-0.5
0.0
0.5
1.0
1.5
2.0
2.5
3.0
3.5
4.0
4.5
5.0
1991 1994 1997 2000 2003 2006 2009 2012
Long-Term Trends in Productivity and Compensation 5 % Year Change, AR 5 Year % Change, AR
Source: Bureau of Labor Statistics, and Bureau of Economic Analysis
Real Output Per Hour
(Left Axis)
Real Compensation
Per Hour (Left Axis)
21

Job-Finding Rate and Job-to-Job Transitions 12 MMA
Source: Bureau of Labor Statistics
U-to-E (Left Axis)
E-to-E (Right Axis)
12 MMA
22

CPI Inflation: Core, Core Goods and Core Services Yr/Yr % Change Yr/Yr % Change
Source: Bureau of Labor Statistics / Haver Analytics
Core Goods
Core Services
23
Rent inflation continues to increase, but inflation in medical care services and transportation services has slowed.
Continued appreciation of the dollar may put renewed downward pressure on core good prices.

Dollar Exchange Rate and Nonoil Import Prices % Change – Year to Year % Change – Year to Year
-8
-6
-4
-2
0
2
4
6
8
-20
-15
-10
-5
0
5
10
15
20
2000 2002 2004 2006 2008 2010 2012 2014Sources: Federal Reserve Board, Bureau of Labor Statistics. Dollar is Board’s Trade-Weighted M
Nonoil Import Prices (right axis)
Dollar (left axis)
r = -0.61
24

-1
0
1
2
3
4
5
-1
0
1
2
3
4
5
2003 2005 2007 2009 2011 2013
Rent of Primary Residence and Owner’s Equivalent Rent
% Change – Year to Year % Change – Year to Year
Source: Bureau of Labor Statistics
Owner’s Equivalent Rent
(22.5%)
Rent of Primary Residence
(6.5%)
25

Personal Consumption Expenditures: Health Care Price Index % Change – Year to Year
Source: Bureau of Economic Analysis / Haver Analytics
% Change – Year to Year
17% of total PCE deflator 19% of core PCE deflator
26

Producer Price Index: General Medical and Surgical Hospitals by Patient Type LN(Index) LN(Index)
Source: Bureau of Labor Statistics PPI Note: Jan-2005 set to 1
Medicare Patients (26.1%)
Medicaid Patients (18.1%)
Private Insurance and all other
Patients (55.8%)
27

TIPS Based Inflation Expectations
Source: Federal Reserve Board
Percent Percent
Note: Dashed lines represent 2 Standard Deviations from the mean
5-10 Years
3.06 (+2 SD)
2.63 (-2 SD) 2011 – Present
Average 2.63
November 12: 2.16

-10
-5
0
5
10
15
20
-10
-5
0
5
10
15
20
2000 2002 2004 2006 2008 2010 2012 2014
% Change – Year to Year % Change – Year to Year
Loans and Leases at Banks
Source: Federal Reserve Board Note: "Large Banks" include the 25 largest domestically chartered banks, ranked by assets (about 2/3 of the total).
All Domestically Chartered Banks
Small Banks
Large Banks
29

Actual and Expected Fed Funds Target Percent Percent
Source: Federal Reserve Board
Actual
June 16, 2014
Jul 14, 2014
May 14, 2014
30
Sep 15, 2014
Oct 15, 2014 Oct 27, 2014

31
Reference Charts

0
10
20
30
40
50
60
2000 2001 2002 2003 2004 2005 2006 2007 2008 2009 2010 2011 2012 2013 20140
10
20
30
40
50
60
Transition of Mortgage Accounts from 30-60 Days Late Percent Percent
Source: FRBNY Consumer Credit Panel
To Current
To 90+ Days Late
32 32

33
% SA % SA
Source: BLS, Haver Analytics
25-54 (left axis)
55+ (right axis)
Labor Force Participation Rate by Age Group

34
% %
Source: BLS, Haver Analytics
25-54 (left axis)
55+ (right axis)
Population Shares by Age Group (4Q MA)

Components of Net Lending/Borrowing as a Share of GDP Share of GDP Share of GDP
Source: Federal Reserve Board, BEA Note: Shading represents NBER recessions.
-15
-10
-5
0
5
10
-15
-10
-5
0
5
10
1960 1965 1970 1975 1980 1985 1990 1995 2000 2005 2010
Government
Business
Households
35
Net Lending
35

Regional Economic Outlook Presentation to the Advisory Council on Small Business and Agriculture
Jason Bram, Officer November 20, 2014
The views expressed here are those of the presenter and do not necessarily represent the views of the Federal Reserve Bank of New York or the Federal Reserve System.


Regional Economic Activity Index of Coincident Economic Indicators (CEI)
3 Source: Federal Reserve Bank of New York; Puerto Rico Government Development Bank. Note: The Puerto Rico composite index is based on a different methodology than the indexes produced by the FRBNY.
80
90
100
110
120
130
2007 2008 2009 2010 2011 2012 2013 2014
Index (December 2007 = 100)
Shading indicates NBER recession
New Jersey
New York City
New York State
Puerto Rico
Sep
Apr08 Mar08 Nov05
Jan08
Nov09
Oct09 Nov10

Current Economic Conditions FRBNY Business Surveys, Current Conditions
Source: Federal Reserve Bank of New York. 4
-60
-40
-20
0
20
40
60
2007 2008 2009 2010 2011 2012 2013 2014 2015
NBER
Empire State Manufacturing Survey
Business Leaders Survey
Nov
Diffusion Index
Shading indicates NBER recession

Total Employment Seasonally Adjusted Index
Source: Bureau of Labor Statistics and Moody’s Economy.com. 5
88
92
96
100
104
108
2007 2008 2009 2010 2011 2012 2013 2014
Index (December 2007 = 100)
Shading indicates NBER recession
Dashed Line Indicates U.S. Employment Trough (February 2010)
Oct
Sep
Puerto Rico
New York State
New Jersey
United States
New York City

Total Employment Seasonally Adjusted Index
Source: Bureau of Labor Statistics and Moody’s Economy.com. 6
88
92
96
100
104
108
2007 2008 2009 2010 2011 2012 2013 2014
Index (December 2007 = 100)
Shading indicates NBER recession
Dashed Line Indicates U.S. Employment Trough (February 2010)
Oct
United States
New York City
Northern New Jersey
Putnam- Rockland-
Westchester
Long Island
Sep

Dashed Line Indicates U.S. Employment Trough (February 2010)
Total Employment Seasonally Adjusted Index
Source: Bureau of Labor Statistics and Moody’s Economy.com. 7
80
90
100
110
120
130
2007 2008 2009 2010 2011 2012 2013 2014
Index (December 2007 = 100)
Shading indicates NBER recession
Nevada
North Dakota
Florida
New York City
United States
New Jersey
Sep
Oct

Status of Jobs Recovery Share of Lost Jobs Gained Back During Local Recovery, September 2014
8
Source: Bureau of Labor Statistics and Moody’s Economy.com. Note: Putnam and Bergen are the Putnam-Rockland-Westchester and Bergen-Hudson-Passaic Special BLS Areas.
Newark
Glens Falls
Elmira Binghamton
Putnam Fair- field
Edison
Kingston
Buffalo
Rochester Syracuse
Utica
Albany
Ithaca
NYC
Recovered All Lost Jobs Recovered At Least 75 percent of Lost Jobs Recovered Less Than 75 percent of Lost Jobs No Recovery
US = 113 percent (115% through Oct14)
Puerto Rico

Job Growth by Sector Year-Over-Year Percent Change, September 2014
Source: Bureau of Labor Statistics and Moody’s Economy.com. 9
United States
New Jersey
New York City
New York State
3.9 -6.5 1.9 3.0 3.6 1.6 3.1 2.7 2.7 4.6 0.8 0.7 2.6 -3.2 4.1 2.5 2.0 1.4 4.0 2.2
1.9 1.4 0.2 0.2 1.7 1.6 4.6 2.0 1.4 0.6 0.3 -2.3
1.2 -1.4 1.7 0.7 1.1 -1.8 -2.2 -1.1 0.5 -0.3 -0.4 -0.3
2.0 0.1 2.4 1.3
Construction Professional & Business Services
Transportation & Utilities Leisure & Hospitality
Education & Health Services
Wholesale Trade Retail Trade
Manufacturing
Financial Activities Information
State & Local Government
Total

Job Growth by Sector Year-Over-Year Percent Change, September 2014
Source: Bureau of Labor Statistics and Moody’s Economy.com. 10
Fairfield County
Puerto Rico
0.0 8.7 4.6 0.0 5.7 1.4
-1.0 1.8 0.1 0.8
0.7 -1.0 2.7 -1.1 3.3 -0.7
-1.0 -1.1 0.8 2.1 3.3 -0.3
1.8 0.2
Construction Professional & Business Services
Transportation & Utilities Leisure & Hospitality
Education & Health Services
Wholesale Trade Retail Trade
Manufacturing
Financial Activities Information
State & Local Government
Total
United States
3.9 3.6 2.7 2.6 2.0
1.9 1.7 1.4
1.2 1.1 0.5
2.0

State and Local Government Seasonally Adjusted Index
Source: Bureau of Labor Statistics and Moody’s Economy.com.
11
95
96
97
98
99
100
101
102
2007 2008 2009 2010 2011 2012 2013 2014
Shading indicates NBER recession
Note: Dotted line smoothes fluctuations due to summer jobs programs.
Oct
Sep
United States
New York State
New Jersey
Index (December 2007 = 100)

Financial Activities Employment Seasonally Adjusted
Source: Bureau of Labor Statistics and Moody’s Economy.com. 12
200
225
250
275
300
325
350
375
400
350
375
400
425
450
475
500
525
550
1990 1992 1994 1996 1998 2000 2002 2004 2006 2008 2010 2012 2014
Sep New York City
(left scale)
New Jersey (right scale)
Sep01
Thousands – New York City Thousands – New Jersey
Shading indicates NBER recessions
Financial Activities Employment Sep 2014
NYC 444,730 NJ 250,600

New York City Industrial Specialization 2012 Employment and Earnings Location Quotients
13 Source: U.S. Census Bureau, County Business Patterns.
Professional & Business
Food & Drink
Ambulatory Health
Education
Securities
Information Real Estate
Credit Intermediation
Manufacturing
Arts & Sports
Museums
Auto Dealers
Gas Stations
Employment Location Quotient 2012: Log (Ratio) Scale
Earn
ings
Loc
atio
n Q
uotie
nt 2
012:
Log
(Rat
io) S
cale
1/16 1/8 1/4 1/2 1 2 4 8 16
16
8
4
2
1
1/2
1/4
1/8
1/16
Bubble Size Represents Number of Employees in 2012
(Star represents the U.S. average)

Home Prices CoreLogic Home Price Index, Seasonally Adjusted
14 Source: CoreLogic Home Price Index (including distressed sales); Seasonally adjusted by FRBNY staff. Note: ‘NYC Metro’ refers to the ‘New York-White Plains-Wayne NY-NJ Metro Division.’
40
50
60
70
80
90
100
110
2000 2001 2002 2003 2004 2005 2006 2007 2008 2009 2010 2011 2012 2013 2014
Sep
NYC Metro
New York State
United States
New Jersey
Northern New Jersey
Dec11 Shading indicates NBER recessions
Index (U.S. Peak of March 2006 = 100)

Backlog of Foreclosures Share of Mortgages in Foreclosure
15 Source: CoreLogic LoanPerformance (LP) and Lender Processing Services Mortgage Performance data (LPS).
0%
2%
4%
6%
8%
10%
2005 2006 2007 2008 2009 2010 2011 2012 2013 2014
Downstate New York includes Ulster, Dutchess, Orange, and all New York counties to the south. Upstate New York
includes all metropolitan counties to the north. Northern New Jersey includes Ocean, Monmouth, Middlesex,
Somerset, Hunterdon and all counties to the north.
Shading indicates NBER recession
Jul
Downstate NY
United States
Northern NJ
Upstate NY

Office Vacancy Rates Overall Vacancy Rates
16 Source: Cushman & Wakefield.
0%
5%
10%
15%
20%
25%
2000 2001 2002 2003 2004 2005 2006 2007 2008 2009 2010 2011 2012 2013 2014
Shading indicates NBER recessions
Q3
Northern NJ
NYC Midtown
NYC Downtown
Central NJ

Office Vacancy Rates Overall Vacancy Rates
17 Source: Cushman & Wakefield.
0%
5%
10%
15%
20%
25%
2000 2001 2002 2003 2004 2005 2006 2007 2008 2009 2010 2011 2012 2013 2014
Shading indicates NBER recessions
Q3
Long Island
Westchester County
Fairfield County

Appendix

Unemployment Rates in the Nation Seasonally Adjusted, September 2014
19 Source: Bureau of Labor Statistics and Moody’s Economy.com.
4.9% or Less 4.9% to 6.9% 6.9% or More
U.S. Rate in Sept = 5.9%

Unemployment Rates in the Region Seasonally Adjusted, September 2014
20 Source: Bureau of Labor Statistics and Moody’s Economy.com.
0%
2%
4%
6%
8%
New
Jersey
New York
City New York State United
States
Connecticut
5.9% (5.8% Oct)
6.2%
6.8% 6.5% 6.4%

Household Debt Total Debt Balance Per Capita
Source: FRBNY Consumer Credit Panel/Equifax.
21
$0
$20
$40
$60
$80
$100
2003 2004 2005 2006 2007 2008 2009 2010 2011 2012 2013 2014
Thousands
Shading indicates NBER recession
New York State
United States
Nevada
California
Texas
New Jersey
Q2

International UpdatePresentation to the Small Business and AgricultureAdvisory Council
John ClarkNovember 20, 2014

-6
-4
-2
0
2
4
6
8
10
12
14
-6
-4
-2
0
2
4
6
8
10
12
14
07 08 09 10 11 12 13 14
Advanced and EM Economies: GDP GrowthPercent change from year ago quarter
Source: National authorities, FRBNY estimates for Q3 2014Data as of November 20, 2014
EMEs Ex. China
China
AdvancedForeign
Economies
Percent
US
Figure 1: Advanced and EM Economies: GDP GrowthPercent change form a year ago quarter Percent
-10
-8
-6
-4
-2
0
2
4
6
-10
-8
-6
-4
-2
0
2
4
6
07 08 09 10 11 12 13 14
Advanced and EM Economies: GDP GrowthPercent change from year ago quarter
Source: National authorities, FRBNY estimates
Euro Area
Percent
Japan
UnitedStates
United Kingdom
Figure 2: Advanced Economies: GDP GrowthPercent change form a year ago quarter Percent

4
6
8
10
12
14
16
18
20
4
6
8
10
12
14
16
18
20
1999 2001 2003 2005 2007 2009 2011 2013
Euro Area Unemployment RatesPercent, SA Percent, SA
1/ GDP-w eighted: Italy, Spain, Greece, Ireland, Portugal.Source: EuroStat. Data as of 11/18.
Other EMU
Peripheral 1/
Germany
Figure 3: Euro Area Unemployment RatesPercent, SA Percent, SA
0
1
2
3
4
0
1
2
3
4
Jan-10 Jan-11 Jan-12 Jan-13 Jan-14
Euro Area: Headline and Core InflationPercent y/y Percent
Headline
Core
Source: Haver. Data as of November 18, 2014
October0.8
0.4
2% TargetCeiling
Figure 4: Euro Area: Headline and Core InflationPercent y/y Percent

1.7
1.8
1.9
2.0
2.1
2.2
2.3
2.4
1.7
1.8
1.9
2.0
2.1
2.2
2.3
2.4
Jan-13 Apr-13 Jul-13 Oct-13 Jan-14 Apr-14 Jul-14 Oct-14
Euro Area: Long-term Inflation Expectations5Y5Y Inflation forward swap rates Percent
Source: Bloomberg. Data through November 18, 2014
President Draghi's Jackson Hole speech on
August 22
Figure 5: Euro Area: Long-term Inflation Expectations5Y5Y Inflation forward swap rates Percent
0
500
1000
1500
2000
2500
3000
3500
0
500
1000
1500
2000
2500
3000
3500
Jan-99 Jan-01 Jan-03 Jan-05 Jan-07 Jan-09 Jan-11 Jan-13 Jan-15
European Central Bank: Total Asset HoldingsBillions of euros Billions of euros
Sources: National authorities, Haver. Data as of November 18, 2014.
Figure 6: European Central Bank: Total Asset HoldingsBillions of euros Billions of euros

-8
-6
-4
-2
0
2
4
6
-8
-6
-4
-2
0
2
4
6
Dec-09 Jun-10 Dec-10 Jun-11 Dec-11 Jun-12 Dec-12 Jun-13 Dec-13 Jun-14
Europe: Bank Credit GrowthPercent, Nominal Y/Y Percent
Core euro-area
Peripheral euro-area
Total euro-area
Source: ECB. Most recent data point is end-September 2014.
Figure 7: Europe: Bank Credit GrowthPercent, Nominal Y/Y Percent
35
40
45
50
55
60
65
-6
-4
-2
0
2
4
6
1999 2001 2003 2005 2007 2009 2011 2013 2015
Euro Area GDP Growth and Composite PMIPercent SAAR Index
GDP Growth (LHS)
CompositePMI (RHS)
Correlation: .86
Source: Haver, Markit. Data as of November 18, 2014
November51.4
0.6Q3
Figure 8: Euro Area GDP Growth and Composite PMIPercent SAAR Index

051015202530354045505560657075
05
1015202530354045505560657075
2007 2008 2009 2010 2011 2012 2013 2014 2015 2016
Monetary BasePercent of GDP Percent of GDP
Source: National authorities. Data as of November 18th, 2014.
Japan
US
Euro Area
Figure 9: Monetary BasePercent of GDP Percent
-8
-6
-4
-2
0
2
4
6
8
10
-8
-6
-4
-2
0
2
4
6
8
10
Japan: GDP growth (seasonally-adjusted annual rate)Percent Percent
Sources: Cabinet Office, Bloomberg. Data as of October 1, 2014. 1/ Bloomberg.
Q/(Q-4)
Average analyst forecast
1/Q/Q SAAR
Tohokuearthquake
Figure 10: Japan GDP Growth (SAAR)Percent Percent

3.0
3.5
4.0
4.5
5.0
5.5
6.0
-6
-4
-2
0
2
4
6
1995 1997 1999 2001 2003 2005 2007 2009 2011 2013
Japan: Unemployment and labor earningsPercent y/y, 6mma
1/ total workers * average monthly earnings Source: Country Authorities, data as of November 18th, 2014
Labor income1/ (LHS)
Percent
Unemployment (RHS)
Figure 11: Japan: Unemployment and Labor EarningsPercent y/y, 6mma Percent
-60
-40
-20
0
20
40
60
-60
-40
-20
0
20
40
60
Mar-82 Mar-87 Mar-92 Mar-97 Mar-02 Mar-07 Mar-12
Japan: Tankan Business Conditions SurveyDiffusion index for large manufacturers Index
Source: Haver Analytics, data as of November 18th, 2014.
Figure 12: Japan: Tankan Business Conditions SurveyDiffusion index for large manufacturers Index

-60
-40
-20
0
20
40
60
-60
-40
-20
0
20
40
60
2005 2006 2007 2008 2009 2010 2011 2012 2013 2014 2015
Japan: Industrial Production and Real ExportsPercent 3m saar
IP
Exports
Source: Japan METI, data as of November 18th, 2014.
T hokuearthquake
Figure 13 Japan Industrial Production and Real ExportsPercent 3m saar Percent
-3
-2
-1
0
1
2
3
4
-3
-2
-1
0
1
2
3
4
1990 1994 1998 2002 2006 2010 2014
Japan: Headline and Core CPIPercent Percent
Headline
Core
Source: Haver, data as of November 18th, 2014.
Target (2%)
Excluding impact of VAT hikeApril 1997
VAT hike
Figure 14: Japan: Headline and Core CPIPercent Percent

0
2
4
6
8
10
12
14
16
18
0
2
4
6
8
10
12
14
16
18
05 06 07 08 09 10 11 12 13 14
China: Real GDP growthPercent, y/y and q/q saar
y/y
Percent
Source: CEIC, FRBNY. Data as of November 19, 2014.
Q/Q SAAR, FRBNY est.
Figure 15: China: Real GDP GrowthPercent, y/y and q/q saar Percent
0
10
20
30
40
50
60
0
10
20
30
40
50
60
2008 2009 2010 2011 2012 2013 2014
China: Bank and Non-traditional Credit, Total FinancingPercent, y/y Percent, y/y
Source: CEIC, data as of November 18, 2014.1/Total financing includes bank loans, off-balance sheet & trust loans, net corp debt/equity
Bank credit
Total financing 1/
Non-traditional credit (off-balance sheet &
trust loans)
Figure 16: China: Bank and Non-traditional Credit, Total FinancingPercent, y/y Percent, y/y

5
10
15
20
47
50
53
56
2010 2011 2012 2013 2014
TitleDiffusion Index Percent, rolling q/q saar
1/ Official PMI is seasonably adjusted by FRBNY staff. Industrial Production is "Value Added of Industry".Source: CEIC, Haver. Data updated as of November 18.
Average of Official and HSBC/Markit
PMIs 1/ (LHS)
Industrial Production 1/ (RHS)
Figure 17: China: Manufacturing PMI and IPDiffusion Index Percent, rolling q/q saar
-60
-40
-20
0
20
40
60
80
100
-60
-40
-20
0
20
40
60
80
100
Dec-06 Dec-07 Dec-08 Dec-09 Dec-10 Dec-11 Dec-12 Dec-13
China: Commercial and Residential Real EstatePercent Y/Y, 3mma, Floor Percent
Source: CEIC, data as of November 18, 2014.
Construction, ytd Sales
Starts
Figure 18: China: Commercial and Residential Real EstatePercent Y/Y, 3mma, Floor Percent

4.0
4.5
5.0
5.5
6.0
4.0
4.5
5.0
5.5
6.0
Jan-12 Jul-12 Jan-13 Jul-13 Jan-14 Jul-14
EMEs: Evolution of Consensus Growth ForecastsPercent y/y Percent y/y
Source: Consensus Forecasts through October
2013
2014
2015
Figure 19: EMEs: Evolution of Consensus Growth ForecastsPercent y/y Percent y/y
0
1
2
3
4
5
6
0
1
2
3
4
5
6
Jan-13 Apr-13 Jul-13 Oct-13 Jan-14 Apr-14 Jul-14 Oct-14
EMEs: Evolution of 2014 Growth Forecasts% y/y % y/y
Source: Consensuse forecasts, through October
Asia (ex-China)
LatAm
EMEA
Figure 20: EMEs: Evolution of 2014 Growth Forecasts% y/y % y/y

50
60
70
80
90
100
110
60
70
80
90
100
110
120
Jan-13 Apr-13 Jul-13 Oct-13 Jan-14 Apr-14 Jul-14 Oct-14
Oil, Grain, and Industrial Metals PricesUSD/Barrel Index
Sources: S&P, Haver, data as of November 18th
Brent Crude(LHS)
Grains(RHS)
Industrial Metals(RHS)
Figure 21: Oil, Grain, and Industrial Metals PricesUSD/Barrel Index
-4
-3
-2
-1
0
1
2
3
4
5
-15
-10
-5
0
5
10
15
20
Mar-92 Mar-95 Mar-98 Mar-01 Mar-04 Mar-07 Mar-10 Mar-13
Emerging Economies: Exports and AE GDPPercent change, Q/Q-4 Percent
Sources: National authorities, Netherlands Bureau of Economic Policy Analysis, Haver. Data as of November 19.
EM Exports (LHS)
AE GDP (RHS)
Figure 22: EMEs: Export Volumes and AE GDPPercent change, Q/Q-4 Percent

HungaryChina
TaiwanKorea
Indonesia
Malaysia
ArgentinaRussia
Poland
Colombia Mexico
PhilippinesThailand
ChileTurkey
India
South AfricaBrazil
-20
-15
-10
-5
0
5
-20
-15
-10
-5
0
5
-50 -40 -30 -20 -10 0 10 20 30
Current Account Balances vs. Recent CurrencyPerformance
Source: Bloomberg, Consensus Estimates
Current Account Balance as a % of Goods Exports (2013p)N
omin
al c
urre
ncy
mov
es fr
omM
ay 1
to A
ug 2
7
Peru
Figure 23: Current Account Balance vs. Recent Currency Performance
CNY
INRIDR
KRW
MYRPHP
THB
CZKHUF
PLN
TRY
BRL
CLP
COP
MXN
PENZAR
-20
-15
-10
-5
0
5
-20
-15
-10
-5
0
5
-60 -40 -20 0 20 40 60 80
Exchange Rate Changes (since July 2014) vs. Net Commodity Export Share
Source: Unctad, Bloomberg, data as of Nov 19
Net commodity exports as share of total goods exports (%)
EMFX
vs.
USD
sin
ce J
uly
1
PercentPercent
RUB(-27%)
Percent
Figure 24: Exchange Rate Changes (since July 2014) vs. Net Commodity Export SharePercent Percent

100
200
300
400
500
600
100
200
300
400
500
600
Jan-13 Apr-13 Jul-13 Oct-13 Jan-14 Apr-14 Jul-14 Oct-14
Bond Spreads to TreasuriesBasis points Bps
Source: Bloomberg, JP Morgan. Data through 11/18.
US High Yield
BBB Rated U.S. Corporates
EM Sovereign Bonds(EMBIG)
EM Corporate Bonds (CEMBI)
Figure 25: Bond Spreads to TreasuriesBasis points Bps
-350
-300
-250
-200
-150
-100
-50
0
-350
-300
-250
-200
-150
-100
-50
0
Jan-10 Aug-10 Mar-11 Oct-11 May-12 Dec-12 Jul-13 Feb-14 Sep-14
Cumulative changes in EM 5-yr. and U.S. 10-yr. yieldsBasis points, changes from 1/1/2010 bps
Source: Bloomberg
EM 5yr
US 10yr
Figure 26: Cumulative Changes in EM-yr. and US 10-yr. yieldsBasis points, changes from 1/1/2010 Bps

Leading Structural Challenges
Argentina Brazil China India Indonesia Korea Mexico Russia Saudi Arabia
South Africa Turkey
Distortionary Tax Code 153 159 120 158 137 25 118 56 3 24 71
Inadequate Power 80 14 119 111 121 2 133 117 15 150 49
Inadequate Infrastructure 120 71 74 85 61 23 66 93 22 66 49
Excessive Energy Subsidies 2.9 0.2 3.8 4.5 5.4 1.5 2.4 6.3 16.7 4.3 1.0
Excessive Red Tape 57 121 19 186 147 2 71 10 127 80 38
Labor Market Rigidities 144 92 34 99 103 78 113 72 70 116 130
Health & Primary Education 61 89 40 102 72 18 73 71 53 135 59Sources: IMF, World Bank, World Economic Forum
Figure 27: EMEs: Structural Challenges
Major EME Elections in 2014
Month Country Winner 1/March Turkey (Municipal) IncApril South Africa (Legislature and President) 2/ Inc
Indonesia (Parliament) 0ppMay India (Parliament) 0ppJuly Indonesia (President) 0ppAugust Turkey (Presidential) IncOctober Brazil (President, Legislature, Governors) Inc
1/ Incumbent (Inc) or Opposition (Opp) party2/ The National Assembly elects the President following its election.
Figure 28 Major EM Elections in 2014

0.0
0.5
1.0
1.5
2.0
2.5
3.0
3.5
0.0
0.5
1.0
1.5
2.0
2.5
3.0
3.5
Jan-13 Apr-13 Jul-13 Oct-13 Jan-14 Apr-14 Jul-14 Oct-14
Advanced Economies: 10yr Bond YieldsPercent Percent
Source: Bloomberg, data through 11/19.
Germany
US
Japan
UK
Figure 29: AE 10yr Bond YieldsPercent Percent
88
90
92
94
96
98
100
102
104
88
90
92
94
96
98
100
102
104
Jan-14 Mar-14 May-14 Jul-14 Sep-14 Nov-14
Currency Performance vs USDIndex, 1 Jan 2014 = 100 Index, 1 Jan 2014 = 100
1/ JP Morgan EMFX Index (includes China)Source: Bloomberg, data as of 11/18/2014
Euro
Yen
EMEs 1/
Figure 30: Currency Performance vs USDIndex, 1 Jan 2014 = 100 Index

since Feb2013 2014 2015 2014 2015
Advanced 1/ 0.0 1.7 2.2 -0.4 0.0o/w: United States 2.2 2.2 3.0 -0.7 0.0
Euro Zone 0.0 0.8 1.2 -0.2 -0.2United Kingdom 1.7 3.0 2.6 0.5 0.2Japan 1.5 0.9 1.3 -0.8 -0.1
Emerging Markets 1/ 0.0 4.2 4.6 -0.6 -0.6o/w: China 7.7 7.3 7.0 -0.2 -0.3
Brazil 2.5 0.3 1.1 -2.0 -1.5India 4.7 5.5 6.1 0.3 0.1Russia 1.3 0.2 0.8 -2.2 -2.1Mexico 1.1 2.4 3.6 -1.0 -0.3Korea 3.0 3.5 3.6 -0.1 -0.2
ForecastsConsensus Forecast change
Data as of November 18. Sources: Blue Chip as of November where available, Consensus as of October. 1/ Dollar-GDP weighted average
Figure 31: Growth ForecastsPercent, yoy