small glints as an aid for imaging geosats using an ... filesmall glints as an aid for imaging...
TRANSCRIPT

Small glints as an aid for imaginggeosats using an optical Michelsoninterferometer
Robert HindsleyJohn Thomas ArmstrongHenrique SchmittEllyn Baines
Downloaded From: https://www.spiedigitallibrary.org/journals/Journal-of-Applied-Remote-Sensing on 26 May 2019Terms of Use: https://www.spiedigitallibrary.org/terms-of-use

Small glints as an aid for imaging geosats using anoptical Michelson interferometer
Robert Hindsley, John Thomas Armstrong, Henrique Schmitt, andEllyn Baines
Naval Research Laboratory, Remote Sensing Division, Code 7215,4555 Overlook Avenue SW, Washington, DC 20375
Abstract. A Michelson optical interferometer, such as an upgraded version of the NavyPrecision Optical Interferometer, could image geosynchronous satellites (geosats) with resolu-tion of roughly 1 m. Baselines that sample features as small as 0.2 m can be built, however, thefringes would be swamped by the resolved component. Recent observations have shown thatsmall glints known as “glintchen,” aside from being a nuisance, serve to isolate and highlight thesignal from these structures. Imaging of geosats during glintchen events can determine thedimensions of these structures and can also play a critical role in determining if these glintchenare due to a previously undetected companion satellite. An approach for performing this glint-aided imaging of geosats and the wealth of detail it would yield, is discussed. © The Authors.Published by SPIE under a Creative Commons Attribution 3.0 Unported License. Distribution or repro-duction of this work in whole or in part requires full attribution of the original publication, including itsDOI. [DOI: 10.1117/1.JRS.7.073549]
Keywords: interferometry; satellites; image analysis; spectrophotometry; remote sensing.
Paper 12408 received Nov. 4, 2012; revised manuscript received Apr. 21, 2013; accepted forpublication Apr. 25, 2013; published online Jun. 3, 2013.
1 Introduction
The first steps toward imaging a geosat using a Michelson interferometer have been taken and afringe has been successfully tracked on one baseline (a baseline is a vector between a pair oftelescopes) using the Navy Precision Optical Interferometer (NPOI).1 By adding more imagingelements and baselines, we will be able to generate an image. There are still some shortcomingswith NPOI geosat observations. Most notably, the observation can only be made when the geosatis glinting, i.e., specularly reflecting during two periods in early October and February to March.This restriction is due to the low sensitivity of the NPOI which uses 0.12 m apertures. The NPOIcannot fringe track on an object fainter than about R ∼ 6.5 magnitude. During the two roughlyweek-long glint seasons, geosats can increase in brightness by a factor of 104 (10 mag) for aperiod of a few minutes each night and many become naked-eye objects.2 Interference fringeshave been detected on one geosat to date using the NPOI, DirecTV-9S.
Although the possibility of imaging geosats during the glinting season may seem to solve thebrightness limit issue, Jorgensen et al. pointed out a less obvious drawback of imaging duringglints.3 While the glint greatly enhances the signal-to-noise ratio (SNR) for fringe tracking, itdegrades the SNR of the image itself. Simply put, the immense amount of light coming from theglinting structures swamps the amount of light from the smaller structures. The glinting struc-tures are on the order of 1 m or more in size. Smaller structures, even if they are also glinting,produce fringes that are lost in the noise from the bright glint. In essence, the image shows onlythe glinting structures, which must be large to glint so brightly, at the expense of the smallerstructures.
Clearly, both of these issues, being able to image only during the short glint seasons andbeing able to image only the large glinting structures, could be obviated if larger aperturesare used. This would allow observing when the geosat is not glinting, however, it introducesthe need for adaptive optics.
Journal of Applied Remote Sensing 073549-1 Vol. 7, 2013
Downloaded From: https://www.spiedigitallibrary.org/journals/Journal-of-Applied-Remote-Sensing on 26 May 2019Terms of Use: https://www.spiedigitallibrary.org/terms-of-use
Nevertheless, there is a fundamental issue due to the nature of the objects themselves. Thereis little power in the fringes produced by structures much smaller than the largest structures (e.g.,solar panels or the main bus). Long baselines are sensitive to the high spatial frequencies but thelargest structures, with dimensions of the order of a few meters or larger, are resolved on thesebaselines, i.e., they do not produce interference fringes. Due to their large dimensions, thesestructures are bright, even though reflecting diffusely, and swamp the signal from the small struc-tures (10 s of cm). The fringes due to small structures could be brought out with long-enoughintegration times, however, the inescapable fact is that they are weak against the background dueto the larger components and this renders it difficult to obtain geosat images with resolutionsmuch smaller than 1 m.
We propose an alternative technique that allows the imaging of these small structures.Because many of these structures are oriented differently than the large structures, theyglint at different times. Furthermore, because these structures are physically small, they producefainter glints, which we have dubbed “glintchen,” using the German diminutive ending “-chen.”These glintchen would seem to increase the difficulty in obtaining long integration times asthe surface brightness of these small structures would suddenly increase by factors ofroughly 100 and put a halt to any exposure. However, it turns out that these glintchen canbe exploited not only to obtain images that display small structures, but spectra obtained duringthe glintchen can be compared to spectra before or after to provide some information on thecomposition of the glinting structure. This paper is organized in the following way.Examples of glintchen are presented in Sec. 2 and the physics behind them in Sec. 3.Characteristics of a Michelson optical interferometer, specialized for glint-aided imaging, aredescribed in Sec. 4. Section 5 explains how additional data from auxiliary telescopes can beexploited as well and how the combination of imaging with other data would prove useful.Section 6 discusses the abilities and limitations of the concept, and a concept of operationsis described in Sec. 7, as an efficient way of performing the observations is not obvious.Conclusions are presented in Sec. 8.
2 Glintchen Examples
It has been known for decades, that geosats glint when major structures on the geosat reflectspecularly and cause the geosat to brighten by factors of ∼104 (10 mag) or more. We will refer tothese extreme events as “major glints.”
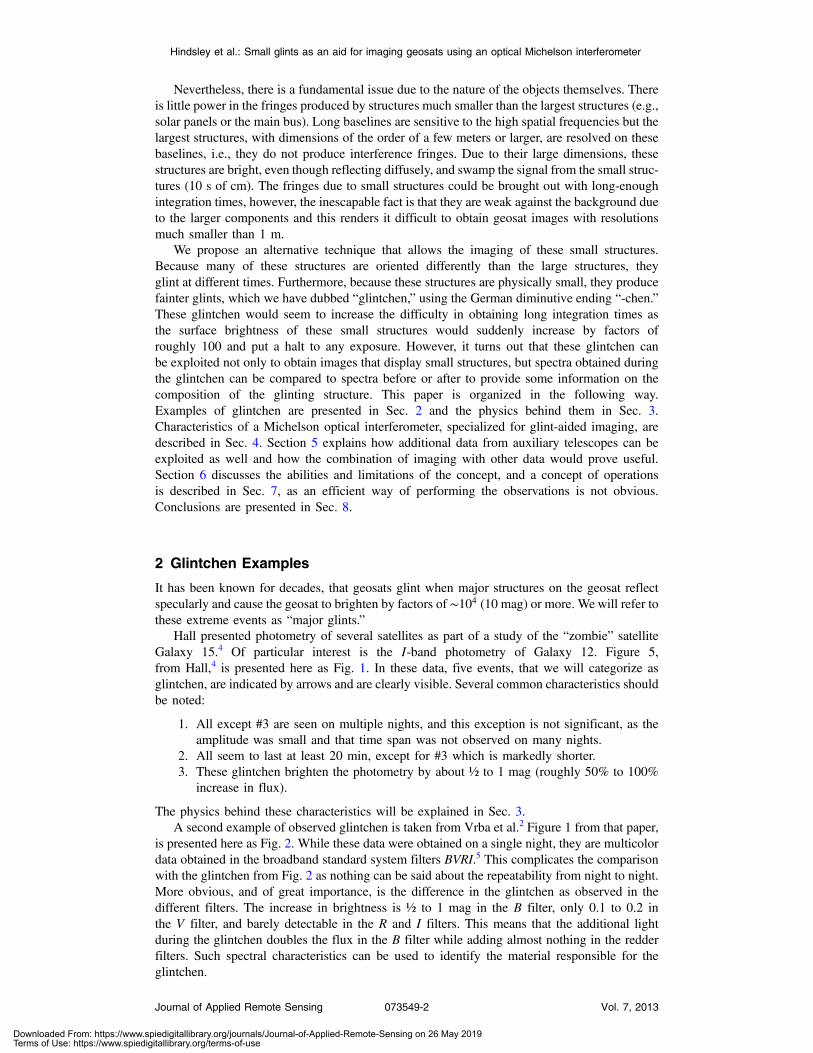
Hall presented photometry of several satellites as part of a study of the “zombie” satelliteGalaxy 15.4 Of particular interest is the I-band photometry of Galaxy 12. Figure 5,from Hall,4 is presented here as Fig. 1. In these data, five events, that we will categorize asglintchen, are indicated by arrows and are clearly visible. Several common characteristics shouldbe noted:
1. All except #3 are seen on multiple nights, and this exception is not significant, as theamplitude was small and that time span was not observed on many nights.
2. All seem to last at least 20 min, except for #3 which is markedly shorter.3. These glintchen brighten the photometry by about ½ to 1 mag (roughly 50% to 100%
increase in flux).
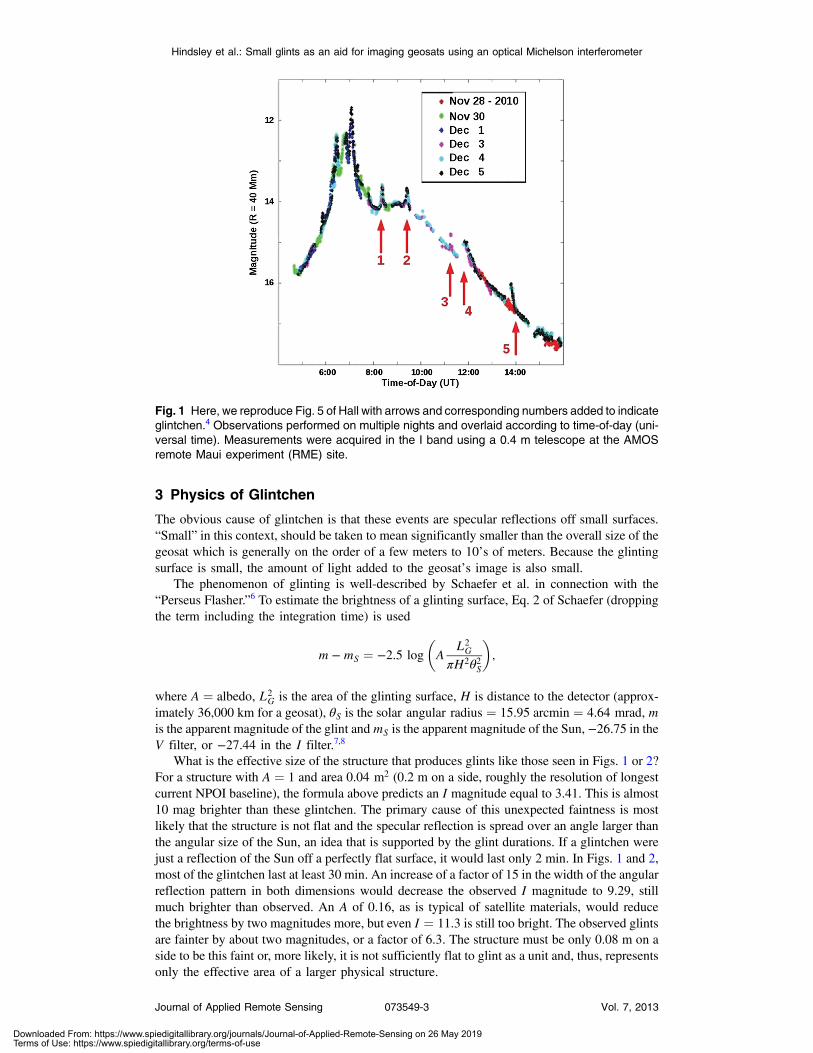
The physics behind these characteristics will be explained in Sec. 3.A second example of observed glintchen is taken from Vrba et al.2 Figure 1 from that paper,
is presented here as Fig. 2. While these data were obtained on a single night, they are multicolordata obtained in the broadband standard system filters BVRI.5 This complicates the comparisonwith the glintchen from Fig. 2 as nothing can be said about the repeatability from night to night.More obvious, and of great importance, is the difference in the glintchen as observed in thedifferent filters. The increase in brightness is ½ to 1 mag in the B filter, only 0.1 to 0.2 inthe V filter, and barely detectable in the R and I filters. This means that the additional lightduring the glintchen doubles the flux in the B filter while adding almost nothing in the redderfilters. Such spectral characteristics can be used to identify the material responsible for theglintchen.
Hindsley et al.: Small glints as an aid for imaging geosats using an optical Michelson interferometer
Journal of Applied Remote Sensing 073549-2 Vol. 7, 2013
Downloaded From: https://www.spiedigitallibrary.org/journals/Journal-of-Applied-Remote-Sensing on 26 May 2019Terms of Use: https://www.spiedigitallibrary.org/terms-of-use
3 Physics of Glintchen
The obvious cause of glintchen is that these events are specular reflections off small surfaces.“Small” in this context, should be taken to mean significantly smaller than the overall size of thegeosat which is generally on the order of a few meters to 10’s of meters. Because the glintingsurface is small, the amount of light added to the geosat’s image is also small.
The phenomenon of glinting is well-described by Schaefer et al. in connection with the“Perseus Flasher.”6 To estimate the brightness of a glinting surface, Eq. 2 of Schaefer (droppingthe term including the integration time) is used
m −mS ¼ −2.5 log
�A
L2G
πH2θ2S
�;
where A ¼ albedo, L2G is the area of the glinting surface, H is distance to the detector (approx-
imately 36,000 km for a geosat), θS is the solar angular radius ¼ 15.95 arcmin ¼ 4.64 mrad, mis the apparent magnitude of the glint andmS is the apparent magnitude of the Sun, −26.75 in theV filter, or −27.44 in the I filter.7,8
What is the effective size of the structure that produces glints like those seen in Figs. 1 or 2?For a structure with A ¼ 1 and area 0.04 m2 (0.2 m on a side, roughly the resolution of longestcurrent NPOI baseline), the formula above predicts an I magnitude equal to 3.41. This is almost10 mag brighter than these glintchen. The primary cause of this unexpected faintness is mostlikely that the structure is not flat and the specular reflection is spread over an angle larger thanthe angular size of the Sun, an idea that is supported by the glint durations. If a glintchen werejust a reflection of the Sun off a perfectly flat surface, it would last only 2 min. In Figs. 1 and 2,most of the glintchen last at least 30 min. An increase of a factor of 15 in the width of the angularreflection pattern in both dimensions would decrease the observed I magnitude to 9.29, stillmuch brighter than observed. An A of 0.16, as is typical of satellite materials, would reducethe brightness by two magnitudes more, but even I ¼ 11.3 is still too bright. The observed glintsare fainter by about two magnitudes, or a factor of 6.3. The structure must be only 0.08 m on aside to be this faint or, more likely, it is not sufficiently flat to glint as a unit and, thus, representsonly the effective area of a larger physical structure.
Fig. 1 Here, we reproduce Fig. 5 of Hall with arrows and corresponding numbers added to indicateglintchen.4 Observations performed on multiple nights and overlaid according to time-of-day (uni-versal time). Measurements were acquired in the I band using a 0.4 m telescope at the AMOSremote Maui experiment (RME) site.
Hindsley et al.: Small glints as an aid for imaging geosats using an optical Michelson interferometer
Journal of Applied Remote Sensing 073549-3 Vol. 7, 2013
Downloaded From: https://www.spiedigitallibrary.org/journals/Journal-of-Applied-Remote-Sensing on 26 May 2019Terms of Use: https://www.spiedigitallibrary.org/terms-of-use
For discussion purposes, we limit the term glintchen to events that, by themselves, would befainter than magnitude 10. The particular filter in which the brightness is measured will vary. Theglintchen in Fig. 2 occur only in the B filter and possibly V, there are no glintchen in the other,redder filters.
As noted above, the glintchen in Fig. 1 are seen to repeat over several nights when observed onmore than one night. There is only one glintchen that does not occur on multiple nights, glintchen#3, which occurs only on December 3. An inspection of this glintchen indicates that it hasrelatively small amplitude, thus, suggesting that the fact that it does not repeat on December 4may be due to a change in the solar inclination. A similar behavior is observed in glintchen#5, which shows similar peaks on December 4 and 5, but no corresponding glintchen onNovember 28. During the interval from November 28 to December 4, the declination of theSun changes from −21.3 to −22.3. The major glints near equinox typically occur over an intervalonly a few days long with the rate of change in solar declination defining the length of the majorglint season near equinox.A change in solar declination, equivalent to that seen fromNovember 28to December 4, occurs in only about three days near equinox. It is possible that the change indeclination betweenNovember 28 andDecember 4 is sufficient to change the Sun-geosat-observerconfiguration so that the glintchen is no longer seen by the observer.
Is it legitimate to compare the Fig. 1 glintchen, measured in the R filter, to the Fig. 2 glintchenthat do not even appear in the R filter? In both cases, a surface is reflecting specularly and bothsurfaces are small compared to the size of the satellite. The difference in Fig. 2 is that theglintchen are measured in the different filters, thus, giving us an indication of the compositionof the glinting structure. Cowardin et al. describe how photometric data can be used for materialidentification.9 The use of such data is explored further in Sec. 5.
4 Observing Geosats with a Michelson Interferometer
The NPOI is the only Michelson interferometer to date to detect interferometric fringes froma geosat. Here, we describe the NPOI along with some of the associated challenges in geosatimaging. A full description of the NPOI can be found in Armstrong et al.10 We also describesome of the characteristics of an interferometer designed to image geosats. Given the existinginfrastructure at the NPOI and the ability to upgrade it with larger aperture telescopes anddifferent beam combiners, it would be an excellent potential site for a dedicated geosat imaginginstrument.
Fig. 2 Here, we reproduce Fig. 1 of Vrba et al. with arrows and corresponding numbers added toindicate glintchen.2 Measurements were acquired using a 1.0 m telescope at the Flagstaff Stationof the U.S. Naval Observatory. These are observations taken at B, V, R and I band (blue, greenmagenta, and red, respectively).
Hindsley et al.: Small glints as an aid for imaging geosats using an optical Michelson interferometer
Journal of Applied Remote Sensing 073549-4 Vol. 7, 2013
Downloaded From: https://www.spiedigitallibrary.org/journals/Journal-of-Applied-Remote-Sensing on 26 May 2019Terms of Use: https://www.spiedigitallibrary.org/terms-of-use
4.1 Navy Precision Optical Interferometer
The NPOI is a collaborative effort of the U.S. Naval Observatory, the Naval ResearchLaboratory, and Lowell Observatory. It is located about 19 km southeast of Flagstaff,Arizona on Anderson Mesa. The array has three arms, 120 deg apart, with arms runningnorth, southeast, and southwest. Siderostats, at fixed stations, direct light into the system.Although the siderostat flats are 0.5 m in diameter, the aperture is set at 0.12 m by the fast-steering mirrors that guide the light into the vacuum system. Some of the siderostats can beshifted from station to station and the stations which are populated by siderostats determinesthe baselines. While eventually the NPOI will have baselines as long as 437 m, currently,the longest baseline is 79 m and, in the case of the 2009 geosat observations, we used onlya 15.9 m baseline oriented close to the east to west direction.1 Currently, the NPOI observesin 16 channels spanning 550 to 850 nm in wavelength. Data taken at the longer wavelengthssamples source structure at lower resolution, while data taken at shorter wavelength samplessource structure at higher resolution.
The NPOI maintains a zero delay difference among paths by employing a delay line foreach siderostat. When the path lengths are equal, the NPOI sees the central fringe of the interfero-gram. To ensure that the fringe is, in fact, the central fringe, the delay lines dither aroundthe expected position of the central fringe, thus, producing an estimate of the fringe position(and delay mismatch) every 2 ms. This time frame is imposed by the atmospheric coherence time.
The ability to track fringes is limited by a combination of two factors, target brightness andsize, which, so far, have limited the use of the NPOI to observations of major geosat glints.Having enough photons to make a reliable estimate of the central fringe position every 2 mssets the faint magnitude limit for NPOI observations, which is about R ¼ 6.5 mag in theJohnson system on the best seeing nights. Fringes are unacceptably noisy for fainter stars.However, this magnitude limit is only applicable to slightly resolved stars. Targets that are sig-nificantly resolved by a given baseline have low fringe amplitudes and require a higher numberof photons in order to be detected on a 2 ms time frame, thus, limiting the interferometer toobserve even brighter targets.
When the central fringe is found, it is tracked by the NPOI control system. For stellar obser-vations, computer memory constraints limit how long an attempt at obtaining fringes can beattempted. For geosats, the observations may be limited, instead, by the time interval duringwhich the geosat is sufficiently bright.
4.2 Designing the Ideal Geosat Imager
Although the NPOI did succeed in obtaining fringes from a geosat, it is not the optimal instru-ment for observing geosats. The NPOI was built for imaging stars, which are smaller in angularextent than any geosat and have greater surface brightness. An interferometer, optimized forgeosat observations, would use shorter baselines to avoid resolving the object combinedwith some baselines, as long as 100 m, to achieve resolution of 1 milli-arcsec, or about0.2 m for a target at a distance of 36,000 km. The baselines needed to observe geosats are avail-able at the NPOI, however, geosat observations would require other upgrades to the system.A discussion about other interferometer designs, the u-v coverage (modulation transfer function)and image quality they achieve, and their application to the imaging of geosats can be found inRefs. 10–16.
Observing in the near infrared, such as K band at 2.2 μm, has certain advantages. Geosats arebrighter in the near infrared and the atmosphere is better behaved at these wavelengths, thus,resulting in longer coherence lengths (ros) and coherence times (tos). This would allow the useof larger apertures and longer integration times. However, because resolution is a function ofwavelength as well as baseline length, switching from the optical to K band would require base-lines longer by about a factor of 3, or up to 300 m.
Larger siderostats, or telescopes, would be needed to make an instrument sensitive enough toobserve geosats year round. This, in turn, requires adaptive optics as the apertures now extendover multiple ros. Simulations suggest that apertures of 1.5 m are sufficient. Again, this is some-what alleviated by switching to the infrared.
Hindsley et al.: Small glints as an aid for imaging geosats using an optical Michelson interferometer
Journal of Applied Remote Sensing 073549-5 Vol. 7, 2013
Downloaded From: https://www.spiedigitallibrary.org/journals/Journal-of-Applied-Remote-Sensing on 26 May 2019Terms of Use: https://www.spiedigitallibrary.org/terms-of-use

The NPOI feed system can accept light from only six siderostats at a time which correspondsto 15 baselines. An operational instrument would require more than this as simulations show that9 to 12 siderostats (36 to 66 baselines) are the minimum required.11,14 The NPOI could switchsiderostats during an observation in order to recover some of the missing baselines, however, thishas never been implemented or attempted and would not generate the u-v coverage that would beobtained with 12 siderostats simultaneously.
5 Combining the Interferometric Data with Other Data
The information obtained with optical interferometric observations of glintchen can be aug-mented with information from other kinds of observations. For example, Cowardin et al.,among others, have used photometry to characterize the surfaces of geosats.9 In Sec. 3, it wasdemonstrated how the size of a glinting surface can be found based on the photometry, albeit,with rather large uncertainty in the results. In Fig. 3, a schematic of a glint is used to demonstrateother characteristics of the satellite that can be measured:
Orientation: The solar phase angle at which a particular glintchen occurs indicates the orienta-tionof the surfacewith respect to the line between the observer and thegeosat, as shown inFig. 3(b).
Composition: The spectrum during the glintchen should combine the spectrum as seen out-side glintchen plus the spectrum of the glinting structure. Figure 3(c) shows two simulated spec-tra, one taken inside and one taken outside of glintchen. This difference spectrum, also shown inFig. 3(c), is due to the glinting structure and can yield the composition of the structure. It may bethe case that the spectrum is a composite of two or more different materials.
Flatness: The duration of the glintchen indicates the flatness or smoothness of the structure.A perfectly smooth and flat structure would glint for only 2 min (determined by the angular sizeof the Sun). Broadening of the reflected pattern is due to irregularities in or lack of flatness of theglinting surface.
Fig. 3 The top left panel (a) shows the schematic of a glintchen observation, showing an increaseof 50% in the flux level around UT ¼ 04∶42. The right panel (b) shows that the time when thespecular reflection of the sun (yellow) is seen on Earth (blue) fixes the orientation of the structure.For an observation obtained at UT ¼ 04∶42, the observer on Earth detects the glintchen whichwas not detected at an observation taken at UT ¼ 04∶00. The bottom left panel (c) shows in theupper sub-panel the spectrum during glintchen (green, UT ¼ 04∶42) and the spectrum beforeglintchen (black, UT ¼ 04∶00). The bottom sub-panel shows the difference between the glintchenspectrum and the spectrum outside glintchen (blue) which, when compared to the spectrum ofwhite paint (red), shows a good agreement, thus, revealing the composition of the glinting surface.
Hindsley et al.: Small glints as an aid for imaging geosats using an optical Michelson interferometer
Journal of Applied Remote Sensing 073549-6 Vol. 7, 2013
Downloaded From: https://www.spiedigitallibrary.org/journals/Journal-of-Applied-Remote-Sensing on 26 May 2019Terms of Use: https://www.spiedigitallibrary.org/terms-of-use
Size: The size of the glinting structure can be inferred from the brightness. This calculation ismore constrained when combined with the albedo as indicated by the composition.
These parameters are derived from the photometry alone. The important missing datum foreach glinting structure is where the structure is located on the bus. Observing the position of aglinting structure on the geosat may or may not be important. If the geosat and the configurationof structures are known, the position of a glinting structure may be determined without imaging.However, changes to the spacecraft structure would be of great interest. For example, imaging anantenna showing that it is not pointing toward Earth would be valuable in diagnosing why a lossof communication has occurred. Changes in multiple glintchen, due to adjacent structures, wouldbe evidence of a collision that caused structural deformation.
In addition, if the satellite is previously unknown or uncharacterized, knowing the position ofstructures on the bus might be a helpful clue to the function of those structures. This, in turn,could assist in understanding the mission of such an unknown geosat should other data proveambiguous.
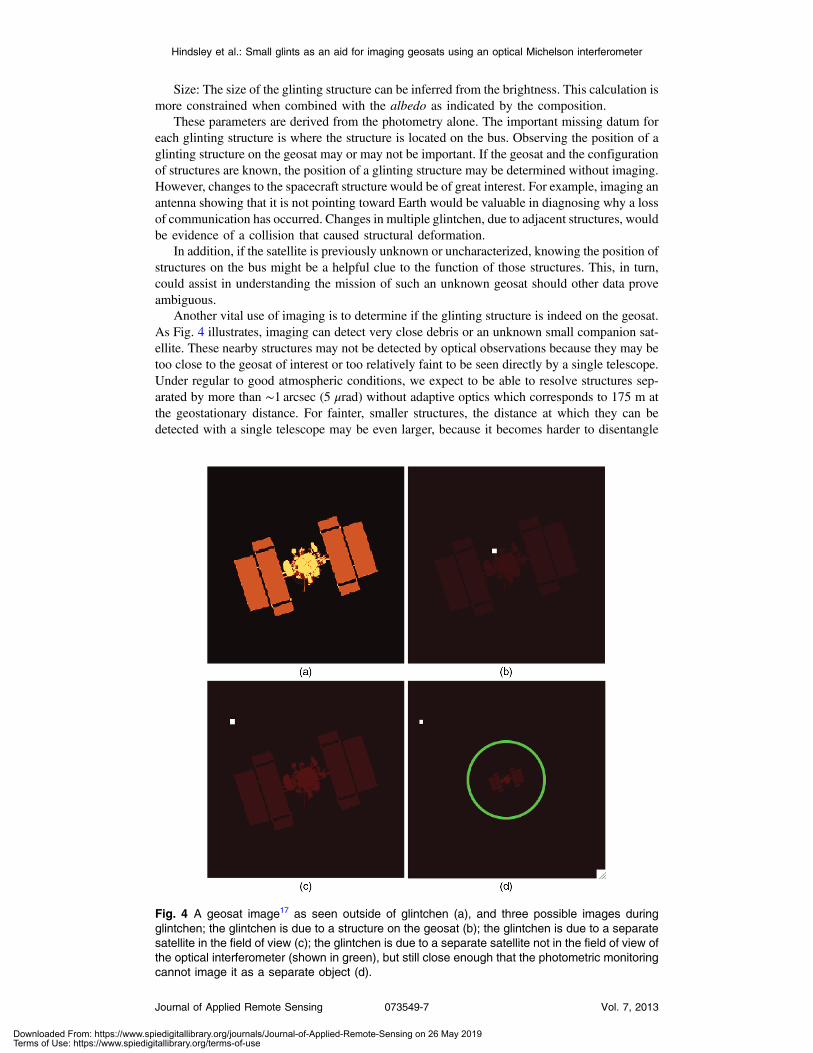
Another vital use of imaging is to determine if the glinting structure is indeed on the geosat.As Fig. 4 illustrates, imaging can detect very close debris or an unknown small companion sat-ellite. These nearby structures may not be detected by optical observations because they may betoo close to the geosat of interest or too relatively faint to be seen directly by a single telescope.Under regular to good atmospheric conditions, we expect to be able to resolve structures sep-arated by more than ∼1 arcsec (5 μrad) without adaptive optics which corresponds to 175 m atthe geostationary distance. For fainter, smaller structures, the distance at which they can bedetected with a single telescope may be even larger, because it becomes harder to disentangle
Fig. 4 A geosat image17 as seen outside of glintchen (a), and three possible images duringglintchen; the glintchen is due to a structure on the geosat (b); the glintchen is due to a separatesatellite in the field of view (c); the glintchen is due to a separate satellite not in the field of view ofthe optical interferometer (shown in green), but still close enough that the photometric monitoringcannot image it as a separate object (d).
Hindsley et al.: Small glints as an aid for imaging geosats using an optical Michelson interferometer
Journal of Applied Remote Sensing 073549-7 Vol. 7, 2013
Downloaded From: https://www.spiedigitallibrary.org/journals/Journal-of-Applied-Remote-Sensing on 26 May 2019Terms of Use: https://www.spiedigitallibrary.org/terms-of-use
them from the glare of the geosat. Furthermore, in the case of an unknown satellite, it may besilent, in which case, it would not be detected by radio observations. This extremely valuableknowledge, the possible presence of a close companion, is the unique contribution of the im-aging. There is no other way to gain evidence indicating this situation. It should be borne in mindthat the glintchen seen in Figs. 1 and 2 may already be indicating the presence of shadowingsatellites.
The above discussion demonstrates the utility of glintchen observations. The glintchen iso-late individual small structures on the geosat and permit measurement of various characteristicsthat otherwise cannot be performed. Normally, the light from a small structure is lost in the lightfrom the much larger satellite body. During a glintchen, the increase in the flux from a smallstructure allows its light to be analyzed separately from the normal flux. In the spectral realm, thelight from the individual small structure may be sufficiently bright to allow the determination ofthe composition of that structure. In the imaging realm, the fringes from that structure arebrought out of the constant background (the background due to the resolved geosat bus andsolar panels) so that the placing of the structure, whether on the bus or close to it, can be deter-mined. These combined data would be a valuable tool to diagnose problems with known geosats,to determine the function of unknown geosat, and as a tool to detect nearby unknown satellites.
6 Limitations
While glintchen can be exploited to yield information not otherwise available, there are fivelimitations inherent in the phenomenon which include orientation, repeatability, duration, homo-geneity, and size variability. The first four affect photometric measurements as well as imagingwhile the last limitation is relevant only for imaging.
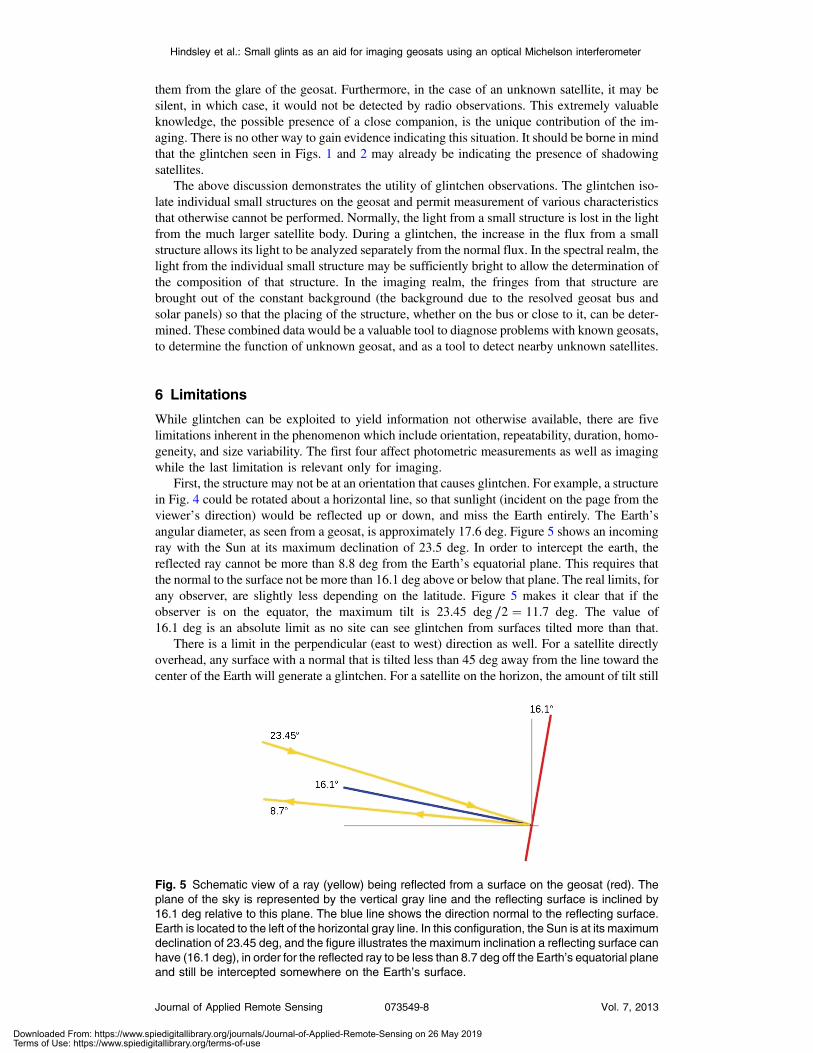
First, the structure may not be at an orientation that causes glintchen. For example, a structurein Fig. 4 could be rotated about a horizontal line, so that sunlight (incident on the page from theviewer’s direction) would be reflected up or down, and miss the Earth entirely. The Earth’sangular diameter, as seen from a geosat, is approximately 17.6 deg. Figure 5 shows an incomingray with the Sun at its maximum declination of 23.5 deg. In order to intercept the earth, thereflected ray cannot be more than 8.8 deg from the Earth’s equatorial plane. This requires thatthe normal to the surface not be more than 16.1 deg above or below that plane. The real limits, forany observer, are slightly less depending on the latitude. Figure 5 makes it clear that if theobserver is on the equator, the maximum tilt is 23.45 deg ∕2 ¼ 11.7 deg. The value of16.1 deg is an absolute limit as no site can see glintchen from surfaces tilted more than that.
There is a limit in the perpendicular (east to west) direction as well. For a satellite directlyoverhead, any surface with a normal that is tilted less than 45 deg away from the line toward thecenter of the Earth will generate a glintchen. For a satellite on the horizon, the amount of tilt still
Fig. 5 Schematic view of a ray (yellow) being reflected from a surface on the geosat (red). Theplane of the sky is represented by the vertical gray line and the reflecting surface is inclined by16.1 deg relative to this plane. The blue line shows the direction normal to the reflecting surface.Earth is located to the left of the horizontal gray line. In this configuration, the Sun is at its maximumdeclination of 23.45 deg, and the figure illustrates the maximum inclination a reflecting surface canhave (16.1 deg), in order for the reflected ray to be less than 8.7 deg off the Earth’s equatorial planeand still be intercepted somewhere on the Earth’s surface.
Hindsley et al.: Small glints as an aid for imaging geosats using an optical Michelson interferometer
Journal of Applied Remote Sensing 073549-8 Vol. 7, 2013
Downloaded From: https://www.spiedigitallibrary.org/journals/Journal-of-Applied-Remote-Sensing on 26 May 2019Terms of Use: https://www.spiedigitallibrary.org/terms-of-use
ranges over 90 deg, but from 8.7 deg on one side to 81.3 deg on the other side of the line towardthe Earth’s center, the limit of 81.3 deg is geometrically correct, however, as a practical matter,anything tilted over 60 deg suffers from severe foreshortening.
A second limitation on the glintchen phenomenon is that a glintchen from a particular struc-ture will occur for only a few consecutive nights clumped in two seasons, typically about a weeklong. As with a major glint, the occurrence of a glintchen depends on the declination of the Sunand that can change by 0.4 deg per night at the equinox. However, unlike a major glint, the tilt ofthe structure can cause the glintchen to occur near an extremum in solar declination. In that case,the two glintchen seasons can be very close together and then the structure would be invisible formore than 10 months. This will have a major effect on the development of an efficient observingstrategy, as discussed in Sec. 7. The important fact is that no structure can be imaged on demandwhen relying on glintchen.
The third limitation is that glintchen last only a short portion of the night. While the glintchenseen in the examples in Figs. 2 and 3 last 30 min or more, a perfectly flat surface would produce aglintchen lasting only 2 min.
A fourth limitation on glintchen is that while each individual structure glints for only a weekor so, different structures at different orientations can glint at any time throughout the year andthroughout the night. To sample the full range of available solar phase angles requires sixmonths, from solstice to solstice and even these are not sufficient to make glintchen fromevery structure on the geosat.
Finally, a fifth limitation, that affects only imaging, is the relatively huge increase in surfacebrightness of the glinting structure as compared to the rest of the satellite. A glinting structure asbright as the rest of the satellite could easily be smaller by a factor of 100. While the glintchenaids in the fringe tracking, it tends to blind the optical interferometer so that it cannot see the restof the satellite. In order to place the glinting structure on the geosat, it is necessary to see somebackground structure to connect all the different structures seen to glint at different times.
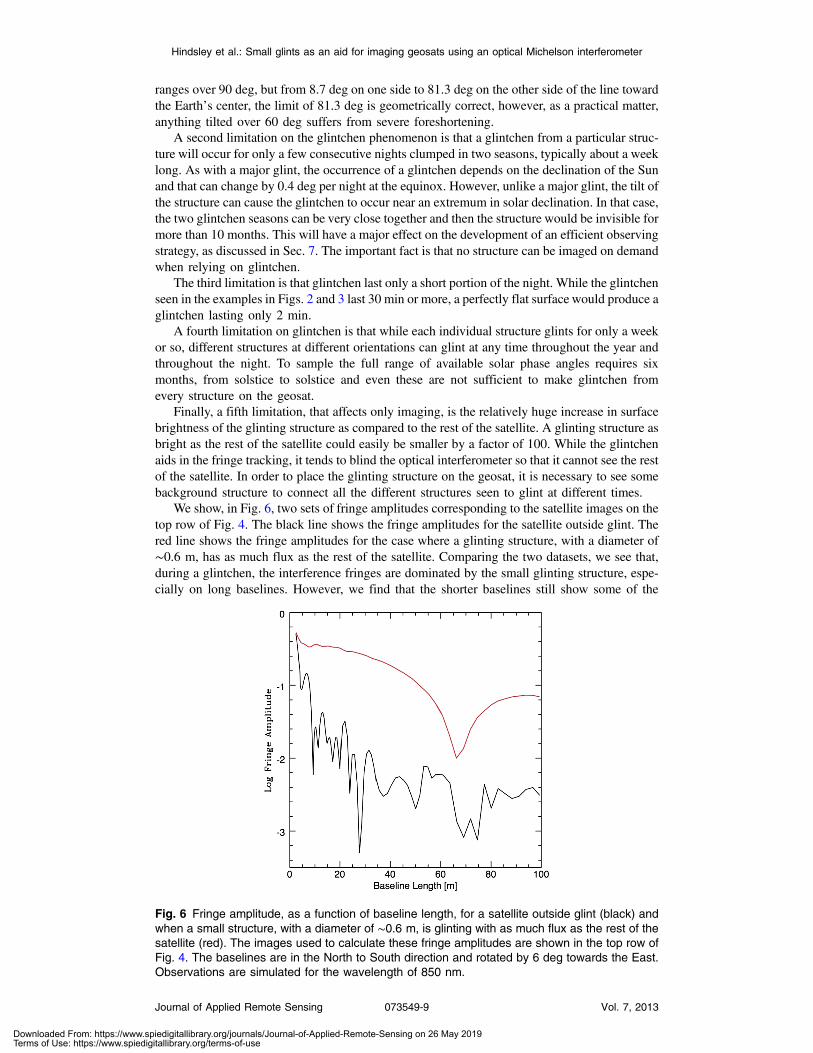
We show, in Fig. 6, two sets of fringe amplitudes corresponding to the satellite images on thetop row of Fig. 4. The black line shows the fringe amplitudes for the satellite outside glint. Thered line shows the fringe amplitudes for the case where a glinting structure, with a diameter of∼0.6 m, has as much flux as the rest of the satellite. Comparing the two datasets, we see that,during a glintchen, the interference fringes are dominated by the small glinting structure, espe-cially on long baselines. However, we find that the shorter baselines still show some of the
Fig. 6 Fringe amplitude, as a function of baseline length, for a satellite outside glint (black) andwhen a small structure, with a diameter of ∼0.6 m, is glinting with as much flux as the rest of thesatellite (red). The images used to calculate these fringe amplitudes are shown in the top row ofFig. 4. The baselines are in the North to South direction and rotated by 6 deg towards the East.Observations are simulated for the wavelength of 850 nm.
Hindsley et al.: Small glints as an aid for imaging geosats using an optical Michelson interferometer
Journal of Applied Remote Sensing 073549-9 Vol. 7, 2013
Downloaded From: https://www.spiedigitallibrary.org/journals/Journal-of-Applied-Remote-Sensing on 26 May 2019Terms of Use: https://www.spiedigitallibrary.org/terms-of-use

structure seen in the dataset without the glintchen. The amount of information about the satel-lite’s large scale structure that can be recovered from the short baselines depends on the area andrelative brightness of the glinting region. This information is important to pinpoint the position ofthe glinting structure relative to the body of the satellite.
Due to this limitation, glintchen have been considered, when considered at all, as, at best,nuisances and, at worst, fatal to efforts to image small details on satellite. A glintchen can inter-rupt the long integrations needed to find fringes from these same small features. The veryincrease in surface brightness that renders a glintchen visible can also make it useless. The sit-uation when glintchen is useful depends on the size of the glinting structure and its brightnessrelative to the rest of the satellite. Another solution to the problem posed by the large increase insurface brightness will be presented in the next section.
7 Efficient Observing Strategy
The limitations presented in the previous Section imply that glintchen are of little use in theobservation of geosats. While the smallest structures on a geosat can be analyzed noother way, it would seem that each geosat must be observed full time by a dedicated interfer-ometer. The surface brightness issue would appear to render imaging of glintchen pointless inany case.
A clever observation strategy can deal with the surface brightness issue and improve thenumber of glintchen observed by at least two orders of magnitude. The enabling concept isthe realization that the glintchen are somewhat repeatable from night to night for at least afew nights. Thus, repeated photometric observations of many geosats can be performed witha dedicated single-aperture telescope one evening, the observed glintchen cataloged, andthen an interferometer can be efficiently scheduled on a subsequent night. Because the photo-metric data are an integral part of the analysis and yield spectra as well as time of occurrence,duration, and magnitude of each glintchen, these observations are needed in any case.Measurements of these data contemporaneous with the imaging observations are desirable, how-ever, those can be obtained with a relatively small and simple auxiliary telescope scheduled toobserve the same geosat as the interferometer.
From any site, approximately 100 geosats are visible. Ideally, each would be measured pho-tometrically in multiple bands at a tempo sufficiently fast to obtain repeated observations over aninterval short enough to catch any glintchen. This can be done if a series of long/shortpass filterscan be used to separate the light onto separate detectors and measure all the bands simultane-ously. The process is also helped if the field is sufficiently large as, then, multiple geosats can bemeasured simultaneously. However, the telescope must be able to move quickly along the geobelt, settle, obtain data on a satellite, and then move on to the next field. Considering that thisphotometric telescope can be relatively small and cheap, an obvious partial solution is to employmultiple telescopes.
What is an appropriately short interval between photometric observations of a geosat? Asstated previously, a perfectly flat surface would produce a glintchen lasting only 2 min. While theobserved glintchen are all far longer than this, this minimum interval would look like aproper goal.
Clever scheduling can also deal with the issue of the extreme surface brightness of aglintchen. Looking at the glintchen in Figs. 1 and 2, it is noted that these glintchen do not “switchon” instantaneously. Rather, there seems to be some rise time that looks to be on the order of aminute. If the interferometer attempts to image the geosat during the first few seconds of theglintchen, there should be an interval during which the surface brightness of the glinting area isbright enough to produce measurable fringes but faint enough not to overwhelm the rest of thesignal. If sufficient signal can be obtained, the glinting structure can be placed on the geosatimage. Likewise, this should be possible during the decay of the glintchen. Thus, far frombeing only a nuisance, the glintchen can yield information on some small structures in ashort observation.
Another solution, applicable in some cases, is the use of the differential phases technique assuggested by the results presented in Fig. 2.18 If a glintchen is markedly fainter over an interval of
Hindsley et al.: Small glints as an aid for imaging geosats using an optical Michelson interferometer
Journal of Applied Remote Sensing 073549-10 Vol. 7, 2013
Downloaded From: https://www.spiedigitallibrary.org/journals/Journal-of-Applied-Remote-Sensing on 26 May 2019Terms of Use: https://www.spiedigitallibrary.org/terms-of-use

the spectrum, light in that band will still be sensitive only to the large spacecraft bus. The fringecontrast and, particularly, the phase difference between different parts of the spectrum would stillallow the place of the glinting structure to be determined. A “white” glintchen, meaning a glintthat is equally bright throughout the optical, would not produce a differential phase as a functionof wavelength and this technique would not be applicable.
When the glintchen observed by photometric telescopes during an evening are cataloged,they can be used to schedule subsequent observations with the interferometer. Like the photo-metric telescopes, the interferometer must be able to quickly acquire an object, obtain the data,and then reconfigure for the next object. Reconfigure means not only pointing the apertures butalso repositioning the delay lines. Currently, the NPOI requires ∼5 min to switch from object toobject. A shorter interval is desirable as glintchen from different satellites will occur at randomintervals. However, it certainly will be impossible to observe all available glintchen on onenight. Because each glintchen occurs on several nights, near coincidences can be handled tosome degree.
8 Conclusion
Glintchen are small glints that allow the flux from small structures to be isolated and the struc-tures to be analyzed in some detail. In particular, they enable conventional Michelson interfer-ometers to image details as small as 0.2 m on geosats. Conventional photometry can be used tolearn much about these structures, however, only imaging can unambiguously determine theposition of these structures on the spacecraft bus. Imaging is beneficial for diagnosing changeson a known satellite, for determining the structure and function of an unknown satellite, and,most importantly, it is invaluable for detecting a companion satellite.
There are a number of challenges to be met. The utility of glintchen, both photometricallyand in imaging, is limited by the lack of glintchen from some structures, the short intervals (bothin terms of nights per year and minutes per night) during which glintchen occur, and thepossibility of glintchen occurring at any time throughout the year rather than in a single week-long season. These issues mean that a geosats must be monitored at a rapid cadence and theprospects for imaging may also be uncertain due to the large surface brightness of a glintingstructure.
When taken at face value, these issues seem to suggest that a single optical interferometerwould be needed to monitor each geosat. However, clever scheduling can resolve most of theseissues. Using auxiliary photometric telescopes, glintchen can be cataloged and used to generatean efficient observing schedule for the interferometer on a later night. Timing of interferometricobservations may be extremely critical in order to obtain fringes while the surface brightness ofthe glinting surface is still low enough not to swamp the dynamic range.
Acknowledgments
The NPOI is a joint project of the Naval Research Laboratory and the U.S. Naval Observatory, inco-operation with Lowell Observatory, and is funded by the Office of Naval Research and theOceanographer of the Navy.
References
1. R. B. Hindsley et al., “Navy prototype optical interferometer observations of geosynchro-nous satellites,” Appl. Opt. 50(17), 2692–2698 (2011), http://dx.doi.org/10.1364/AO.50.002692.
2. F. J. Vrba et al., “A survey of geosynchronous satellite glints,” in Proc. AMOS Tech. Conf.,Wailea, Maui, Hawaii (2009).
3. A. M. Jorgensen et al., “Satellite imaging and characterization with optical interferometry,”in Proc. AMOS Tech. Conf., Wailea, Maui, Hawaii (2010).
4. D. Hall, “AMOS galaxy 15 satellite observations and analysis,” in Proc. AMOS Tech. Conf.,Wailea, Maui, Hawaii (2011).
Hindsley et al.: Small glints as an aid for imaging geosats using an optical Michelson interferometer
Journal of Applied Remote Sensing 073549-11 Vol. 7, 2013
Downloaded From: https://www.spiedigitallibrary.org/journals/Journal-of-Applied-Remote-Sensing on 26 May 2019Terms of Use: https://www.spiedigitallibrary.org/terms-of-use
5. M. S. Bessell, “UBVRI passbands,” Publ. ASP 102(10), 1181–1199 (1990)6. B. E. Schaefer et al., “The Perseus Flasher and satellite glints,” Astrophys. J. 320, 398–404
(1987), http://dx.doi.org/10.1086/165552.7. W. C. Livingston, “Sun,” in Allen’s Astrophysical Quantities, A. N. Cox, Ed., 4th ed.,
pp. 339–341, Athlone, London (2000).8. J. Holmberg, C. Flynn, and L. Portinari, “The colours of the Sun,”Mon. Not. R. Astron. Soc.
367(2), 449–453 (2006), http://dx.doi.org/10.1111/j.1365-2966.2005.09832.x.9. H. Cowardin et al., “An assessment of GEO orbital debris photometric properties derived
from laboratory-based measurements,” in Proc. AMOS Tech. Conf., Wailea, Maui, Hawaii(2009).
10. J. T. Armstrong et al., “The navy prototype optical interferometer,” Astrophys. J. 496(1),550–571 (1998), http://dx.doi.org/10.1086/apj.1998.496.issue-1.
11. D. Mozurkewich et al., “ Toward the ground-based imaging of satellites at geosynchronousaltitude,” in Proc. AMOS Tech. Conf., Wailea, Maui, Hawaii (2011).
12. A. Jorgensen et al., “Interferometric imaging of geostationary satellites: signal-to-noise con-siderations,” in Proc. AMOS Tech. Conf., Wailea, Maui, Hawaii (2011).
13. A. Jorgensen et al., “Imaging geostationary satellites with a common-mount interferometer:image quality and fringe tracking,” in Proc. AMOS Tech. Conf., Wailea, Maui, Hawaii(2012).
14. H. R. Schmitt et al., “Simulated optical interferometric observations of geostationary sat-ellites,” Proc. SPIE 8165, 81650T (2011), http://dx.doi.org/10.1117/12.893863.
15. D. Mozurkewich et al., “An imaging interferometer for compact sources,” Proc. SPIE 8165,81650X (2011), http://dx.doi.org/10.1117/12.893476.
16. J. T. Armstrong et al., “Interferometric imaging of geostationary satellites,” Proc. SPIE8385, 83850D (2011), http://dx.doi.org/10.1117/12.919381.
17. H. R. Schmitt et al., “Simulated synthesis imaging of geostationary satellites,” in Proc.AMOS Tech. Conf., Wailea, Maui, Hawaii (2011).
18. H. R. Schmitt et al., “Navy prototype optical interferometer imaging of line emissionregions of β lyrae using differential phase referencing,” Astrophys. J. 691(2), 984–996(2009), http://dx.doi.org/10.1088/0004-637X/691/2/984.
Robert Hindsley is a senior research astrophysicist with the RemoteSensing Division of the Naval Research Laboratory in Washington, DC.He received a PhD in astronomy from the University of Maryland in1986. From 1986 to 1999, he was employed at the U.S. NavalObservatory including a three-year tour at Black Birch AstrometricObservatory near Blenheim, New Zealand. While at USNO, he also devel-oped the USNO Catalog of Positions of Infrared Stellar Sources (CPIRSS)and was a member of the Sloan Digital Sky Survey (SDSS) Consortium. In1999, he moved to NRL where he has been involved with the Navy
Precision Optical Interferometer (NPOI). In 2008 and 2009, he headed NRL’s involvementin the successful effort to use the NPOI to obtain interferometric fringes on a geocentric satellite.He has also been Spectrophotometric Scientist for the Joint Milliarcsec Astrometric Pathfinder(JMAPS) mission.
John Thomas Armstrong has been a member of the OpticalInterferometry Group at the Naval Research Laboratory (NRL) since1989. He observed with the Mark III Interferometer on Mt. Wilson, helpeddesign the Navy Precision Optical Interferometer (NPOI) now operating atthe Lowell Observatory near Flagstaff, Arizona, and is now the principalNRL investigator on the NPOI project. His research interests include fun-damental parameters of binary stars and rapidly rotating stars. Before com-ing to NRL, he was a radio astronomer at the National Radio AstronomyObservatory and at the University of Cologne, using centimeter- and milli-
meter-wavelength telescopes to investigate starformation regions and the Galactic Center. Hereceived his PhD in physics from MIT in 1983.
Hindsley et al.: Small glints as an aid for imaging geosats using an optical Michelson interferometer
Journal of Applied Remote Sensing 073549-12 Vol. 7, 2013
Downloaded From: https://www.spiedigitallibrary.org/journals/Journal-of-Applied-Remote-Sensing on 26 May 2019Terms of Use: https://www.spiedigitallibrary.org/terms-of-use

Henrique Schmitt is a research astronomer at the Remote SensingDivision of the Naval Research Laboratory in Washington, DC. Hereceived his PhD in astrophysics from Universidade Federal do RioGrande do Sul, Brazil, in 1998. After his PhD he was a postdoctoralresearcher at the Space Telescope Science Institute and a Jansky postdoc-toral fellow at the National Radio Astronomy Observatory. In 2004 hejoined the Navy Precision Optical Interferometry group at NRL, wherehe works on the imaging of circumstellar disks, and interferometric obser-vations of geostationary satellites. He was a member of the team who used
the NPOI for the first detection of interferometric fringes from a geostationary satellite.
Ellyn Baines received a PhD in astronomy from Georgia State Universityin 2007 and currently works as an astrophysicist at the Naval ResearchLaboratory in Washington, DC. Her research focuses on using the NavyPrecision Optical Interferometer (NPOI) to measure the fundamentalparameters of a variety of stellar types, from exoplanet host stars to stellaroscillators. She is also leading an effort to create an image of a geostation-ary satellite using the NPOI within the next several years.
Hindsley et al.: Small glints as an aid for imaging geosats using an optical Michelson interferometer
Journal of Applied Remote Sensing 073549-13 Vol. 7, 2013
Downloaded From: https://www.spiedigitallibrary.org/journals/Journal-of-Applied-Remote-Sensing on 26 May 2019Terms of Use: https://www.spiedigitallibrary.org/terms-of-use