small unmanned aircraft systems and … · kimball, anne e. kinsinger, wiley m. kitchens, elizabeth...
TRANSCRIPT

SMALL UNMANNED AIRCRAFT SYSTEMS AND THEIR PAYLOADS AS AERIAL DATA COLLECTION PLATFORMS FOR NATURAL RESOURCE-BASED
APPLICATIONS
By
MATTHEW ALEXANDER BURGESS
A DISSERTATION PRESENTED TO THE GRADUATE SCHOOL OF THE UNIVERSITY OF FLORIDA IN PARTIAL FULFILLMENT
OF THE REQUIREMENTS FOR THE DEGREE OF DOCTOR OF PHILOSOPHY
UNIVERSITY OF FLORIDA
2017

© 2017 Matthew Alexander Burgess

To my loving wife, Brandy Leigh Burgess, and our Labrador retriever ‘children’: Baxter, Spencer, George, and Frank

4
ACKNOWLEDGMENTS
This dissertation would not be possible without the help, guidance, and support
of so many people. I am especially indebted to the members of my graduate
committee: H. Franklin Percival, Raymond R. Carthy, Peter C. Frederick, Peter G. Ifju,
and Benjamin E. Wilkinson. Each of them was instrumental in helping me navigate
through the Ph.D. process, providing ways to make ends meet, and offering outstanding
mentorship that has no doubt prepared me for the future. Other individuals contributed
greatly toward the success of this dissertation who were not on my official graduate
committee, but certainly could have been, including Amr. H. Abd-Elrahman, Mark I.
Cook, Bon A. Dewitt, Jennifer S. Forbey, Susan Newman, Janet L. Rachlow, H. LeRoy
Rodgers, Lisa A. Shipley, Scot E. Smith, and Christa L. Zweig.
I am grateful to W. James Fleming, John F. Organ, John Thompson, Kevin G.
Whalen, and B. Ken Williams, among others, of the U.S. Geological Survey Cooperative
Research Units Program for all that they do to prepare up-and-coming researchers and
academics. Other U.S. Geological Survey employees (some current, some now retired)
have helped me with my endeavors: Josip D. Adams, Gordon H. Anderson, Nicholas G.
Aumen, Christopher A. Barnes, Mark A. Bauer, Cathy A. Beck, G. Ronnie Best, William
D. Christiansen, Courtney J. Conway, Jill J. Cress, Donald E. Dennerline, Robert M.
Dorazio, Thomas W. Doyle, Lisa M. Faust, Mark R. Feller, Leanne Hanson, Kristen M.
Hart, Vic Hines, Christopher L. Holmquist-Johnson, Dane H. Huge, Michael E. Hutt,
David A. Johncox, Fred A. Johnson, John W. Jones, Siddiq S. Kalaly, Suzette M.
Kimball, Anne E. Kinsinger, Wiley M. Kitchens, Elizabeth Martin, Julien Martin, James
D. Nichols, Abby N. Powell, Bruce K. Quirk, Kenneth G. Rice, Timothy S. Saucier, Kate

5
Schoenecker, J. Michael Scott, Matthew Sexson, Jeff L. Sloan, E. Terrence Slonecker,
Bradley M. Stith, Jonathan Stock, Lynn J. Torak, and Scott A. Wilson.
Thanks to personnel at the Federal Aviation Administration: Byron Chew, Andrew
Collins, Douglas Gould, Ashley Hale, Mark A. Jordan, Earl Lawrence, Keith Lusk,
Joseph Maibach, Douglas R. Murphy, Lynda G. Otting, Thomas Rampulla, Dina Reyes-
Garcia, Ardyth M. Williams, James H. Williams, Randy Willis, and Michael K. Wilson,
who are just a few of the many people with whom I have had the pleasure of interacting
with.
Thanks to Harry J. Kieling, Mark L. Bathrick, Erin Horsburgh, Bradley S.
Koeckeritz, Keith C. Raley, Blaine Moriarty, Martha Watkins, Frank Crump III, and Shari
Moultrie and others at the US Department of the Interior, Office of Aviation Services, for
their assistance. A special thanks to Alexander J. Brostek, James Denigris, Robert A.
Flathmann, Gary Hansen, W. Lee McBrien, AnnMarie Muscardin, Ivan Ortiz-Sepulveda,
David Reinert, and Joseph K. Wells at the South Florida Water Management District
Flight Operations Unit for their patience, understanding, and willingness to try new
ideas.
The following people provided support, assistance, and/or opportunities along the
way: Guy W. Adema, Brad Alcorn, David W. Allen, Robyn P. Angliss, Bill D. Arnsberg,
Joel Arrieta, William Auer, Suzanne C. Baird, Steve Banks, Gail Banta, M. Lee Barber,
Kim Bassos-Hull, Susan Bates, Suzanne Beauchaine, Daniel Beck, Megan Benish,
Courtney Bensey, Bruce M. Bicknell, Aitor Bidaburu, Ronald R. Bielefeld, David M. Bird,
Mark Blanks, Matthew R. Bobo, Robin G. Boughton, Lance R. Brady, Laura A. Brandt,
Gary Brennan, Danielle Broussard, Todd A. Burton, Amanda Campbell, Joshua Castro,

6
Dominique M. Chabot, Ryan M. Chabot, John C. Coffey, Bradley B. Compton, Kendra
Cope, Jeremy M. Crossland, Glenn Cullingford, Pam Darty, Hany Derias, Joe DeVivo,
Victor R. Doig, Joe DuPont, Andrew Eastwick, Holly H. Edwards, Susan N. Ellis-Felege,
Matthew M. Fladeland, George L. Flynn, Hassan Foroosh, Cindy Fury, Margaret
Gallagher, Michael S. Gallagher, G. Daniel Gann, Helena C. Gianniai, Phillip A. Groves,
Susan Goplen, Patti Gorman, Andrew G. Gude, Philip G. Hall, Daren Harmon, David
Harmon, Peter B. Heasley, Dennis W. Heinemann, Van T. Helker, Michael T. Hensch,
Art W. Hinaman, Steven M. Hogan, Susan M. Hohner, Robbie E. Hood, Peter T. Hull,
David A. Hunnicutt, Delia B. Ivanoff, Jim W. Jeffords, Robert L. Johnson, Joel Kerley,
John K. Kilpatrick, Joyce M. Kleen, Kristen R. Kneifl, William R. Koski, Jeffrey Krueger,
Peter W. Kubiak, Jon S. Lane, Anthony Lascano, Brad J. Laubach, Brent Lignell,
Christopher Long, Marguerite M. Madden, Michael G. Manna, Deepak R. Mishra,
Michael J. Moore, Lisa Moore-LaRoe, Erin E. Moreland, Jon M. Morton, Colleen E.
Moulton, Margarita Mulero-Pázmány, Brian J. Mullin, Shawn Nagle, Tom Noble, Antonio
Pernas, Wayne L. Perryman, Andrew E. Pontzer, Jane Powers, Kyle E. Rambo,
Stephen V. Rauch, Jed R. Redwine, Jonathan J. Rees, Glenn G. Rhett, Jennifer H.
Richards, Orien M.W. Richmond, David J. Robar, David W. Roberts, Jon Rollens,
Robert Roth, Shaun Sanchez, Colin J. Saunders, Raymond M. Sauvajot, Monette V.
Schwoerer, Jennifer R. Seavey, Kristin L. Seitz, Roger Semler, Fred H. Sklar,
Jacqueline C. Smith, Ray W. Snow, Lawrence J. Spencer, Thomas M. Spencer, Andrew
Sterner, Michael H. Story, Kathryn L. Sweeney, Stuart S. Taft, Marshall F. Tappen,
Adam N. Tarplee, Larry E. Taylor, James Traub, Karen K. Trevino, David A. Viker,
Betsy Von Holle, Martha C. Wackenhut, Paul Wackenhut, Robert M. Wallace, Richard

7
W. Ward, Vicki Ward, John F. Weishampel, Nick Wiley, Victor L. Wilhelm, Larry A.
Woodward, James S. Wortham, Peter E. Zager, and William C. Zattau.
This work would not have been possible without the assistance of Travis J.
Whitley, Joseph G. DiRodio, Chad S. Tripp, H. Andrew Lassiter, Yun Ye, Tyler S. Ward,
Abraham Balmori, Rodney M. Hunt, Jesse A. Durrance, Zoltan Szantoi, Spencer J.
Ingley, Damon A. Wolfe, John H. Perry, Brandon S. Evers, Thomas J. Rambo, Thomas
S. Reed, Kyuho Lee, Joshua A. Childs, Hector Y. Rodriguez Asilis, John C. Simon,
Adam C. Watts, R. Scott Bowman, Michael J. Morton, Jamie A. Duberstein, George P.
Jones, Ahmed H. Mohamed, Leonard G. Pearlstine, and Kenneth D. Meyer, among
others as well.
Thanks to Becky Abel, Jason Beck, Toby Boudreau, Steven M. Bradbury, Arnie
F. Brimmer, Kenneth Bugler, Mark A. Chappell, Miranda M. Crowell, Donna M.
Delparte, Joe DuPont, Wendy A. Estes-Zumpf, Marcella R. Fremgen, Aaron P. Garcia,
Kristina Gehlken, Gifford L. Gillette, Nancy F. Glenn, Jeff Gould, Jon K. Heggen, Pam
R. Johnson, Meghan J. Leiper, Zachary B. Lockyer, Jeff Lonneker, Robert C. Lonsinger,
Kris Millgate, Charlotte R. Milling, Jessica J. Mitchell, Frank Mullins, Jordan D. Nobler,
Peter J. Olsoy, Amanda J. Price, Scott Putnam, Jon Rachael, Brecken C. Robb, Rex
Sallabanks, Gael Sanchez, William C. Schrader, David M. Teuscher, Daniel H.
Thornton, Amy C. Ulappa, Jamie L. Utz, Natasha L. Wiggins, and James H. Witham, for
assistance with various efforts conducted in and around Idaho.
I am indebted to University of Florida administrators and faculty including:
Michael S. Allen, Brandi K. Boniface, Lyn C. Branch, Jacqueline K. Burns, Stephen F.
Coates, Irene M. Cooke, Terra A. DuBois, B. Dianne Farb, Dennis Fleetwood, William

8
M. Giuliano, Joseph Glover, David W. Hahn, Amy Meyers Hass, John P. Hayes, Eric C.
Hellgren, Steven A. Johnson, Joseph C. Joyce, Jamie L. Keith, Jeanna M.
Mastrodicasa, Kenneth W. McCain, Robert A. McCleery, Christina S. Moore,
Christopher J. Moran, David P. Norton, Jack M. Payne, Elizabeth F. Pienaar, William E.
Pine, Brian E. Prindle, William S. Properzio, Kathryn E. Sieving, Gary E. Vallad, and
Tim L. White, who have provided advice, education, and support through the course of
exponential growth in small unmanned aircraft systems.
Thanks to M. Gay Hale, Jennifer L. Miller, Hannah M. Taylor, Kathleen Van Riet,
Alexis T. Martin, Janet L. Fay, Amanda S. Burnett, Joan G. Hill, and the entire Florida
Cooperative Fish and Wildlife Research Unit staff. I would also like to thank Tom J.
Barnash, Heather l. Bradley, Clare A. Condon-Grade, Kyle D. Cook, J. Elaine
Culpepper, Kelley J. Cunningham, Fiona I. Hogan, Samuel A. Jones, Monica M.
Lindberg, Caprice M. McRae, Kaleigh N. Riley, Claire C. Williams, and all the University
of Florida Department of Wildlife Ecology and Conservation support staff over the years.
Thanks also to Krystan A. Wilkinson, Travis M. Thomas, Brian M. Jeffery, Nichole
D. Bishop, Brian J. Smith, Nicole J. Wood, Rachel M. Cassoff, Noah S. Burrell, Auriel
M.V. Fournier, Brian E. Reichert, Chelsey R. Faller, Benjamin K. Atkinson, Rio W.
Bonds, Janell M. Brush, Carolyn M. Enloe, Cameron B. Carter, Melissa A. DeSa, and
Zachariah C. Welch.
I thank my parents, George H. and Linda S. Burgess, my brother Nathan H.
Burgess, and my in-laws, Kenneth C. and JoAnn M. Quiggle, for their love and
encouragement through this journey. Thanks also to my many relatives across the
country for their appreciation.

9
Last, but certainly not least, I thank my wonderful wife, Brandy L. Burgess, for all
that she has done to encourage me and accommodate my pursuits of this degree. I
certainly would not have been able to do this without her unconditional love and
generous support.

10
TABLE OF CONTENTS page
ACKNOWLEDGMENTS .................................................................................................. 4
LIST OF FIGURES ........................................................................................................ 13
LIST OF ABBREVIATIONS ........................................................................................... 18
ABSTRACT ................................................................................................................... 25
CHAPTER
1 INTRODUCTION ..................................................................................................... 27
Primary Data Collection Methods in Natural Resources ......................................... 28 Boots-on-the Ground ........................................................................................ 28
Manned Aircraft ................................................................................................ 29 Space-borne Satellites ..................................................................................... 31 Unmanned Aircraft Systems ............................................................................. 32
What are Unmanned Aircraft Systems? .................................................................. 33 The Unmanned Aircraft .................................................................................... 34
The Ground Control Station .............................................................................. 34 The Communication Linkages .......................................................................... 35 The Flight Team ............................................................................................... 36
UAS in Natural Resource-Based Sciences ............................................................. 36
Foundations of the Research Topic ........................................................................ 38
2 INFERENCES OF HABITAT SELECTION BY PYGMY RABBITS (Brachylagus idahoensis) BASED ON NORMALIZED DIFFERENCE VEGETATIVE INDICES GENERATED FROM IMAGERY COLLECTED VIA SMALL UNMANNED AIRCRAFT SYSTEM .............................................................................................. 42
The Sagebrush-Steppe Study Areas ...................................................................... 48
Magic Reservoir ............................................................................................... 48 Rocky Canyon .................................................................................................. 49
Methods Used for Assessing Pygmy Rabbit Habitats with sUAS-derived NDVI Imagery Products ................................................................................................ 50
Results of Pygmy Rabbit Habitat Selection Using sUAS NDVI Imagery Products .. 56
Discussion of Pygmy Rabbit Habitat Selection Based on sUAS NDVI Imagery Products .............................................................................................................. 60
3 ESTIMATES OF AMERICAN WHITE PELICANS (Pelecanus erythrorhynchos) OBTAINED FROM PHOTOGRAMMETRIC PRODUCTS OF IMAGERY GATHERED USING A SMALL UNMANNED AIRCRAFT SYSTEM ....................... 76
American White Pelican Study Area ....................................................................... 80
11
Methods Used for Estimating Nesting American White Pelicans from sUAS-derived Imagery Products .................................................................................... 82
Results of the sUAS Imagery Products for Assessing Estimates of American White Pelican Nesting.......................................................................................... 86
Discussion on the Use of sUAS Imagery Products to Assess Estimates of American White Pelican Nesting ......................................................................... 89
4 AN INNOVATIVE DATA COLLECTION APPROACH FOR MANNED AERIAL SURVEYS USING OPTICAL PAYLOADS DESIGNED FOR SMALL UNMANNED AIRCRAFT SYSTEMS .................................................................... 110
Study Areas .......................................................................................................... 113 Archie Carr National Wildlife Refuge .............................................................. 113 Water Conservation Area-2A .......................................................................... 114
Methods ................................................................................................................ 116 Results .................................................................................................................. 120
Discussion ............................................................................................................ 122
5 CONCLUSIONS .................................................................................................... 146
Pygmy Rabbit (Brachylagus idahoensis) Habitat Selection Inferences Determined by Normalized Difference Vegetative Index Computations of Aerial Imagery Products Generated from Data Collected by a Small Unmanned Aircraft System ................................................................................ 147
Generating Estimates of Nesting American White Pelicans (Pelecanus erythrorhynchos) on Spoil Islands in Minidoka National Wildlife Refuge (Idaho) from Aerial Imagery Products Produced from Data Collected by a Small Unmanned Aircraft System ...................................................................... 148
Use of High-Resolution Optical Payloads Designed for Small Unmanned Aircraft Systems as an Innovative Approach for Aerial Data Collection from Manned Aircraft Flights ...................................................................................... 149
APPENDIX
A THE HISTORY OF THE UNIVERSITY OF FLORIDA UNMANNED AIRCRAFT SYSTEMS RESEARCH PROGRAM (UFUASRP): 1999–2017 ............................ 151
The MLB Company® FoldBat™ ............................................................................. 152
The UF Tadpole .................................................................................................... 161
The UF Nova 1 (Polaris) ....................................................................................... 168 The UF Nova 2 ..................................................................................................... 181 The UF Nova 2.1 (Mako) ...................................................................................... 192
The DJI® Spreading Wings S1000+™ ................................................................... 208
B A BRIEF HISTORY OF UNMANNED AIRCRAFT SYSTEM REGULATIONS IN THE UNITED STATES ......................................................................................... 217

12
C THE UNIVERSITY OF FLORIDA UNMANNED AIRCRAFT SYSTEMS RESEARCH PROGRAM (UFUASRP) FLIGHT CREW MODEL ........................... 226
Pilot-in-Command ........................................................................................... 226
Ground Station Operator ................................................................................ 227 Qualified Visual Observer ............................................................................... 228
D DIGITAL IMAGERY AND METADATA POST-PROCESSING METHODOLOGY USED .................................................................................................................... 230
E SEVERAL CRITICAL LESSONS LEARNED BY THE UNIVERSITY OF FLORIDA UNMANNED AIRCRAFT SYSTEMS RESEARCH PROGRAM (UFUASRP): 1999-2017 ....................................................................................... 234
F THE UNIVERSITY OF FLORIDA UNMANNED AIRCRAFT SYSTEMS RESEACH PROGRAM (UFUASRP) BLANK FLIGHT DATA SHEET ................... 243
LIST OF REFERENCES ............................................................................................. 244
BIOGRAPHICAL SKETCH .......................................................................................... 261

13
LIST OF FIGURES
Figure page 1-1 Several of the most widely recognized drones used for unmanned military
applications......................................................................................................... 41
2-1 A pygmy rabbit (Brachylagus idahoensis). .......................................................... 64
2-2 Signs of recent pygmy rabbit (Brachylagus idahoensis) presence.. .................... 65
2-3 The extent of known pygmy rabbit (Brachylagus idahoensis) populations in the western United States. ................................................................................. 66
2-4 An orthophotomosaic aerial image showing mima mounds distributed across the sagebrush-steppe landscape in the Lemhi Valley, Lemhi County, Idaho, USA. ................................................................................................................... 67
2-5 The geographic information system spatial modeling concept for generating a response surface based on individual predictor variable layers for pygmy rabbits (Brachylagus idahoensis). ....................................................................... 68
2-6 The ‘scaling-up’ process of pygmy rabbit (Brachylagus idahoensis) data collection. ........................................................................................................... 69
2-7 The location of the Magic Reservoir study site for pygmy rabbits (Brachylagus idahoensis), in Blaine County, Idaho, USA. ........................................................ 70
2-8 The location of the Rocky Canyon study site for pygmy rabbits (Brachylagus idahoensis), in Lemhi County, Idaho, USA. ........................................................ 71
2-9 Locations and distribution of the n = 84 geolocated ground control points established at the Magic Reservoir study site during summer 2013 in Blaine County, Idaho, USA. ........................................................................................... 72
2-10 Locations and distribution of the n = 111 geolocated ground control points established at the Rocky Canyon study site during summer 2014 in Lemhi County, Idaho, USA. ........................................................................................... 72
2-11 Selected mima mounds intensively ground truthed at the Magic Reservoir study site during summer 2013 in Blaine County, Idaho, USA. .......................... 73
2-12 An orthophotomosaic aerial image with a normalized difference vegetation index (NDVI) overlay of the Rocky Canyon study site during summer 2014 in Lemhi County, Idaho, USA. ................................................................................ 74

14
2-13 The southern two subareas of the Rocky Canyon study site shown with a normalized difference vegetative index (NDVI) overlay generated during summer 2014 in Lemhi County, Idaho, USA....................................................... 75
3-1 A colony of American White Pelicans (Pelecanus erythrorhynchos) nesting on Pelican Island, Minidoka National Wildlife Refuge, Cassia County, Idaho, USA. ................................................................................................................... 95
3-2 The location of the three spoil islands used for nesting by American White Pelicans (Pelecanus erythrorhynchos) in Minidoka National Wildlife Refuge, Cassia County, Idaho, USA. ............................................................................... 96
3-3 The three spoil islands used for nesting by American White Pelicans (Pelecanus erythrorhynchos) in Minidoka National Wildlife Refuge, Cassia County, Idaho, USA. ........................................................................................... 97
3-4 The Virtual Cockpit™ preplanned flight path designed for autonomous waypoint navigation by the University of Florida Nova 2.1 small unmanned aircraft system over the three spoil islands used for nesting by American White Pelicans (Pelecanus erythrorhynchos) on 10 June 2014 in Minidoka National Wildlife Refuge, Cassia County, Idaho, USA. ....................................... 98
3-5 Examples of American White Pelican (Pelecanus erythrorhynchos) nesting locations on spoil islands in Minidoka National Wildlife Refuge, Cassia County, Idaho, USA. ........................................................................................... 99
3-6 Swirls that result from mosaicking still imagery of herbaceous vegetation blown around by ambient winds. ...................................................................... 100
3-7 Exaggerating the elevations of a digital elevation model in attempt to highlight ground-nesting American White Pelicans (Pelecanus erythrorhynchos) on Gull Island, Minidoka National Wildlife Refuge, Cassia County, Idaho, USA. ... 101
3-8 Comparison of iTAG™ software for counting a subarea of nesting American White Pelicans (Pelecanus erythrorhynchos) on Gull Island, Minidoka National Wildlife Refuge, Cassia County, Idaho, USA. ..................................... 102
3-9 An orthophotomosaic generated by PhotoScan© software from imagery collected using a small unmanned aircraft system over Pelican Island, Minidoka National Wildlife Refuge, Cassia County, Idaho, USA on 10 June 2014. ................................................................................................................ 103
3-10 An orthophotomosaic generated by PhotoScan© software from imagery collected using a small unmanned aircraft system over Tern Island, Minidoka National Wildlife Refuge, Cassia County, Idaho, USA on 10 June 2014. ......... 104
15
3-11 An orthophotomosaic generated by PhotoScan© software from imagery collected using a small unmanned aircraft system over Gull Island, Minidoka National Wildlife Refuge, Cassia County, Idaho, USA on 10 June 2014. ......... 105
3-12 Frequency histogram of observed number of American White Pelicans (Pelecanus erythrorhynchos) on Pelican Island, in Minidoka National Wildlife Refuge, Cassia County, Idaho, USA. ............................................................... 106
3-13 Frequency histogram of observed number of American White Pelicans (Pelecanus erythrorhynchos) on Tern Island, in Minidoka National Wildlife Refuge, Cassia County, Idaho, USA. ............................................................... 107
3-14 Frequency histogram of observed number of American White Pelicans (Pelecanus erythrorhynchos) on Gull Island, in Minidoka National Wildlife Refuge, Cassia County, Idaho, USA. ............................................................... 108
3-15 Abandoned or empty nests are visible among ground-nesting American White Pelicans (Pelecanus erythrorhynchos) in a small subarea of an aerial orthophotomosaic constructed from imagery collected using a small unmanned aircraft over Pelican Island, Minidoka National Wildlife Refuge, Cassia County, Idaho, USA on 10 June 2014. ................................................. 109
4-1 The location of the July 2013 external sensor pod study site over Archie Carr National Wildlife Refuge, Brevard County, Florida, USA. ................................. 129
4-2 The 21.0 kilometer stretch of beach that was aerially imaged in July 2013 with the external sensor pod over the Archie Carr National Wildlife Refuge, Brevard County, Florida, USA. ......................................................................... 130
4-3 The location of the active restoration project sites in Water Conservation Area-2A of the Greater Florida Everglades, Palm Beach and Broward Counties, Florida, USA. .................................................................................... 131
4-4 The active restoration project sites in Water Conservation Area-2A of the Greater Florida Everglades, Palm Beach and Broward Counties, Florida, USA. ................................................................................................................. 132
4-5 The initial external sensor pod. ......................................................................... 133
4-6 The second-generation external sensor pod. .................................................... 134
4-7 The third-generation external sensor pod. ........................................................ 135
4-8 The third-generation external sensor pod affixed to a Bell® 407. ...................... 136
4-9 The second-generation external sensor pod affixed to multiple manned aircraft types. .................................................................................................... 137

16
4-10 Image of the Cessna® 172M Skyhawk™ equipped with the second-generation external sensor pod flying a linear transect over the photographer on 23 July 2013 at Archie Carr National Wildlife Refuge, Brevard County, Florida, USA. . 138
4-11 A resulting orthophotomosaic of selected imagery from a portion of a flight of the second-generation external sensor pod attached to a Cessna® 172M Skyhawk™ on 23 July 2013 over Archie Carr National Wildlife Refuge, Brevard County, Florida, USA. ......................................................................... 139
4-12 Enlarged portion of an orthophotomosaic generated from selected imagery collected during the flight of the second-generation external sensor pod attached to a Cessna® 172M Skyhawk™ on 23 July 2013 at kilometer 14.7 of Archie Carr National Wildlife Refuge, Brevard County, Florida, USA. .............. 140
4-13 Enlarged portion of an orthophotomosaic generated from selected imagery collected during the flight of the second-generation external sensor pod attached to a Cessna® 172M Skyhawk™ on 23 July 2013 at kilometer 14.8 of Archie Carr National Wildlife Refuge, Brevard County, Florida, USA. .............. 141
4-14 Enlarged portion of an orthophotomosaic generated from selected imagery collected during the flight of the second-generation external sensor pod attached to a Cessna® 172M Skyhawk™ on 23 July 2013 at kilometer 14.9 of Archie Carr National Wildlife Refuge, Brevard County, Florida, USA. .............. 142
4-15 The paths of three separate flights with the second-generation external sensor pod attached to a Bell® 407 helicopter in August 2014 over the active restoration projects in WCA-2A, Palm Beach and Broward Counties, Florida, USA. ................................................................................................................. 143
4-16 The two-dimensional locations of imagery exposures from three separate flights with the second-generation external sensor pod attached to a Bell® 407 helicopter in August 2014 over experimental and control plots ‘T3’ in WCA-2A, Broward County, Florida, USA. ......................................................... 144
4-17 The resulting orthophotomosaic of imagery from three separate flights with the second-generation external sensor pod attached to a Bell® 407 helicopter in August 2014 over the ‘T3’ experimental and control plots in WCA-2A, Broward County, Florida, USA.......................................................................... 145
A-1 Components of the University of Florida Nova 2.1 small unmanned aircraft system used to collect imagery and metadata of sagebrush-steppe landscapes during summer 2013 and summer 2014 in Idaho, USA. ................ 215
A-2 The Olympus® E-420™ and the Canon® EOS-Rebel SL1™ optical sensor payloads. .......................................................................................................... 216
E-1 An illustration showing the generalized process of proceeding from a starting point to an ending point. ................................................................................... 242

17
E-2 A recommended methodology for efficiently moving from the start of a scientific project in which a small unmanned aircraft system (sUAS) will be used for data collection to achieving the desired end products necessary for analyses. .......................................................................................................... 242

18
LIST OF ABBREVIATIONS
≈ Approximately
× By
° Degree
< Fewer than, Less than
≤ Less than or Equal to
> Greater than, More than
≥ Greater than or Equal to
µm Micrometer
µs Microsecond
− Negative
± Plus or Minus
+ Positive
§ Section
2D Two-Dimensional
3D Three-Dimensional
A Ampere
AC Advisory Circular
ACNWR Archie Carr National Wildlife Refuge
AGL Above Ground Level
aka Also Known As
AMA Academy of Model Aeronautics
AMI Active Marsh Improvement
ASL Above Sea Level
ATV All-Terrain Vehicle

19
AUVSI Association of Unmanned Vehicle Systems International
AWP American White Pelican
BOTG Boots-on-the-Ground
BSU Boise State University
© Copyright
C Celsius
CAD Computer-Aided Design
CCD Charge Coupled Device
CFR Code of Federal Regulations
CG Center of Gravity
CHIP Cattail Habitat Improvement Project
cm Centimeter
cm/pix Centimeter per Pixel
CMOS Complementary Metal Oxide Semiconductor
CNC Computer Numerical Control
COA Certificate of Waiver or Authorization
COTS Commercial-off-the-Shelf
DEM Digital Elevation Model
dSLR Digital Single-Lens Reflex
EAR Export Administration Regulations
EM Electromagnetic
EPS Expanded Polystyrene
ESC Electronic Speed Controller
ESP External Sensor Pod
f/sec Frame per Second

20
FAA Federal Aviation Administration
FFWCC Florida Fish and Wildlife Conservation Commission
FMRA Federal Aviation Administration Modernization and Reform Act of 2012
g Gram
GB Gigabyte
GCP Ground Control Point
GCS Ground Control Station
GEOM Geomatics Program
GHz Gigahertz
GIS Geographic Information System
GNSS Global Navigation Satellite System
GPS Global Positioning System
GPS/INS Global Positioning System/Inertial Navigation System
GSO Ground Station Operator
GUI Graphical User Interface
ha Hectare
HALE High-Altitude, Long-Endurance
HFS Hybrid Flap/Spoiler
hr Hour
Hz Hertz
IACUC Institutional Animal Care and Use Committee
IDFG Idaho Department of Fish and Game
IDPR Idaho Department of Parks and Recreation
IFAS Institute of Food and Agricultural Sciences

21
INS Inertial Navigation System
IR Infrared
ISR Intelligence, Surveillance, and Reconnaissance
ITAR International Trade in Arms Regulations
kg Kilogram
km Kilometer
KMIA Miami International Airport
KMLB Melbourne International Airport
KPBI Palm Beach International Airport
LiDAR Light-Detection and Ranging
LiPo Lithium Polymer
LSCKNWR Lower Suwannee and Cedar Keys National Wildlife Refuge
m Meter
m2 Square Meter
m/sec Meter per Second
mA Milliampere
MAE Department of Mechanical and Aerospace Engineering
mAh Milliampere-Hour
MALE Medium-Altitude, Long-Endurance
MAV Micro Aerial Vehicle
MB Megabyte
MEMS Microelectromechanical System
mg milligram
mg/kg Milligram per Kilogram
MHz Megahertz

22
min Minute
mm Millimeter
mm2 Square Millimeter
MNWR Minidoka National Wildlife Refuge
MOA Memorandum of Agreement
MP Megapixel
M.S. Master of Science
mUAS Micro Unmanned Aircraft System
mW Milliwatt
n Number of Samples
NAS National Airspace System
NASA National Aeronautics and Space Administration
NDVI Normalized Difference Vegetation Index
NIR Near-Infrared
nm Nanometer
NOAA National Oceanic and Atmospheric Administration
NOTAM Notice To Airmen
NPRM Notice of Proposed Rule Making
NSF National Science Foundation
NUASPO National Unmanned Aircraft Systems Project Office
OAS Office of Aviation Services
OEM Original Equipment Manufacturer
Ph.D. Doctor of Philosophy
PIC Pilot-in-Command
pix Pixel

23
QVO Qualified Visual Observer
® Registered Trademark
RC Remote Control
RGB Red-Green-Blue
RMS Root-Mean-Square
RPAS Remotely Piloted Aircraft System
RTK Real-Time Kinematic
SD™ Secure Digital™
sec Second
SfM Structure-from-Motion
SFWMD South Florida Water Management District
SOP Standard Operating Procedure
sp. Species
sUA Small Unmanned Aircraft
sUAS Small Unmanned Aircraft System
TIR Thermal Infrared
™ Unregistered Trademark
UA Unmanned Aircraft
UAS Unmanned Aircraft System
UASIO Unmanned Aircraft Systems Integration Office
UCF University of Central Florida
UDP User Datagram Protocol
UF University of Florida
UFUASRP University of Florida Unmanned Aircraft Systems Research Program

24
UI University of Idaho
US United States
US$ United States Dollar
USACE United States Army Corps of Engineers
USB Universal Serial Bus
USBLM United States Bureau of Land Management
USBOR United States Bureau of Reclamation
USDOC United States Department of Commerce
USDOD United States Department of Defense
USDOI United States Department of the Interior
USDOS United States Department of State
USDOT United States Department of Transportation
USFS United States Forest Service
USFWS United States Fish and Wildlife Service
USGS United States Geological Survey
V Volt
VLOS Visual-Line-of-Sight
VTOL Vertical Takeoff and Landing
WCA-2A Water Conservation Area – 2A
WCA-3A Water Conservation Area – 3A
WEC Department of Wildlife Ecology and Conservation
WGS84 World Geodetic System 1984
WSU Washington State University
25
Abstract of Dissertation Presented to the Graduate School of the University of Florida in Partial Fulfillment of the Requirements for the Degree of Doctor of Philosophy
SMALL UNMANNED AIRCRAFT SYSTEMS AND THEIR PAYLOADS AS AERIAL
DATA COLLECTION PLATFORMS FOR NATURAL RESOURCE-BASED APPLICATIONS
By
Matthew Alexander Burgess
May 2017
Chair: H. Franklin Percival Major: Wildlife Ecology and Conservation
During the last decade, the interest in small unmanned aircraft systems for
civilian purposes has grown exponentially, and investigations into whether these
systems can be used as scientific tools for field studies are actively taking place. The
University of Florida Unmanned Aircraft Systems Research Program was created 18-
years ago by a group of truly interdisciplinary researchers with the goals of developing
low-cost, autonomous, small unmanned aircraft systems and payloads specifically
designed to address applications in natural resource-based scientific disciplines.
Advancements in technology have enabled small unmanned aircraft systems to become
viable remote sensing platforms capable of supplementing existing data collection
methodologies and techniques used to assess, study, and monitor focal targets of
environmental, natural resources, ecology, conservation, and management interests.
Improvements in airframe designs and construction methods, coupled with
implementation of directly-georeferenced remote sensing capabilities into small
unmanned aircraft system payloads, have transformed what were initially recreational
hobby aircraft with a camera attached, into highly sophisticated spatiotemporal data

26
collection tools. Payloads are capable of obtaining high-resolution aerial imagery and
metadata, which can then be post-processed with computer software to generate
products such as three-dimensional point clouds, digital elevation models, and
georectified orthophotomosaics having actual spatial resolutions of less than 3.0
centimeters per pixel.
The research highlighted in this document is but a fraction of a much larger effort
involving many collaborators and years of testing and development. The two case
studies presented show several of the advantages, and a few of the known limitations
that small unmanned aircraft systems can provide to the natural resource professional
for collecting data in the field. The third topic explores an alternative means of obtaining
data from low-altitude, slow-airspeed manned aircraft flights using the high-resolution
directly-georeferenced optical imagery payloads designed for small unmanned aircraft
systems. The document also includes critical lessons learned from conducting flights in
many different environments with diverse objectives, and recommendations for future
developments of small unmanned aircraft systems and their payloads for natural
resource-based data collection missions.

27
CHAPTER 1 INTRODUCTION
The need for cost-effective spatial and temporal monitoring, floral or faunal
enumeration, or mapping of focal targets is a ubiquitous mission for natural resource
scientists and managers to assess trends in attributes such as population density,
community composition, conservation needs, and restoration efficacy (e.g., Ralph and
Scott 1981, Williams et al. 2002, Nichols et al. 2004, Bart et al. 2010). Gathering
baseline data permits tendencies in quantifiable measures to be analyzed over space
and time, which allows researchers to provide guidance to decision makers in
formulating policies, drafting regulations, or establishing management strategies based
on research-derived facts. When directly compared to research in other scientific
disciplines, most studies within the natural resources are at a disadvantage due to
comparatively smaller fiscal budgets under which natural resource-based entities
operate (Giudice et al. 2010, Kobziar et al. 2015, Reynolds et al. 2016). Efforts to
secure research funding for studies within natural resources are extremely competitive
owing to the relatively limited opportunities available for obtaining financial support.
Perhaps this has contributed in part to some methodologies, techniques, and tools used
to gather scientific data in natural resources to remain relatively unchanged through the
years. Finding affordable ways to use emerging technological advances occurring in a
myriad of scientific domains beyond natural resources could facilitate critical
conservation, management, and resource use studies that are potentially safer, more
time efficient, and produce results that are statistically stronger and more accurate.

28
Primary Data Collection Methods in Natural Resources
Three broad data collection methods are primarily exercised for conducting field
research in the natural resource sciences: 1) ‘boots-on-the-ground’ techniques; 2)
manned aircraft surveys; and 3) space-borne satellites. Within the last decade, a fourth
data collection method has gained significant attention, and is the primary topic of this
dissertation: the use of small unmanned aircraft systems (sUAS) and their payloads as
scientific data collection tools in natural resource-based research. Brief overviews of
each of these broad data collection methods are presented, several advantages and
disadvantages of each technique are discussed, as are a few considerations that must
be accounted for when using each methodology.
Boots-on-the Ground
In terms of field studies for natural resource-based sciences, both aquatic and
terrestrial, most research data are collected at or below the surface of the Earth. These
data acquisition techniques and methodologies are referred to as ‘boots-on-the-ground’
(BOTG) throughout this dissertation, although the term is admittedly general. Field
researchers often select BOTG methodologies for data collection in part because BOTG
methods are: 1) often suitable for smaller-scale, manageable investigations with a
natural resource-based budget; 2) able to be conducted in nearly all environmental
conditions; 3) characteristically among the cheaper methods available for collecting
data; and 4) occasionally accomplished without the need for specialized equipment
and/or training.
However, BOTG methods are typically some of the most time- and labor-
intensive data collection options available to the natural resources scientific community,
and can require researchers to potentially put their lives at risk due to the location or
29
proximity of their data collection sites to dangerous situations or focal targets (Towler et
al. 2012, Junda et al. 2015, Mulero-Pázmány 2015). In certain BOTG data collection
situations, researchers could either directly or inadvertently disturb the natural behavior
or ecology of the focal object of study, yielding biased data sets that might go
undetected (Kendall et al. 2009, Williams et al. 2015). Complicating BOTG efforts even
further are situations where focal targets are mobile, cryptic, or dependent on the
presence of specific environmental cues or conditions for researchers to observe them.
These are just a few of the many elements that may need to be addressed when
planning, conducting, or making inferences from data collected using BOTG techniques
or methodologies for natural resource-based research.
Manned Aircraft
Aerial data collection from flights of manned aircraft over focal targets or regions
of interest is a technique that has been used for over a century. Riding as passengers
onboard either fixed- or rotary-wing manned aircraft, visual observers generally collect
data in real-time by making notations on paper, electronic tablets, or onto voice
recorders for transcription at a later date (Kushlan 1979, Strong and Cowardin 1995,
Wozencraft and Lillycrop 2003). Certain data can also be collected by hand-held
sensors by the observers, or from devices directly affixed to the aircraft itself. Use of
manned aircraft also enables coverage of larger focal areas and collection of data at
target field sites that have considerable distance or unforgiving terrain between them,
which might restrict or inhibit BOTG methodologies.
However, manned aircraft-based data collection methodologies are commonly
accompanied with some of the highest fiscal costs per field hour (Urbanek et al. 2012),
and the proximity and/or availability of aviation fueling locations relative to focal target

30
areas are logistical concerns that must be accounted for before using manned aircraft
for data collection. Manned aerial surveys often result in data that consists of a stack of
paper data sheets containing a series of tick marks representing the number of target
items observed per some prearranged unit of measure (Tracey et al. 2008, Booth and
Cox 2011, August et al. 2015). At the conclusion of a flight, the multiple visual
observers tally their tick marks, compare their counts and apply various mathematical
approaches to obtain a single number, or perhaps a set of counts, which then become
the long-term data available for analyses from that particular flight. Manned aerial
surveys also require observers to identify and enumerate focal items quickly and
accurately as the aircraft circumnavigates a target area or conducts linear transects.
Factors such as observer experience, visual acuity, and fatigue must be accounted for
when using manned aircraft methods for data collection (Caughley 1977, Fleming and
Tracey 2008). Visual observers are generally not provided much time to resolve
possible doubts that may arise, nor are they given many opportunities to reassess areas
in which the density of focal targets may be particularly high and difficult to enumerate.
Similar-looking targets or rare species may be misidentified or overlooked completely
which can generate biased data that may ultimately be used in part to determine larger
management decisions, set seasonal bag limits, or other natural resource policies
(Caughley 1974, Fewster et al. 2008, Pacifici et al. 2012).
Finally, a significant concern when utilizing manned aircraft for data collection
purposes is that conducting these flights typically requires aircraft to be flown at slow-
airspeeds and low-altitudes presenting limited capability for successful recovery of flight
should the flying of a manned aircraft become compromised. Sasse (2003) reported
31
that the leading cause of on-the-job mortality for wildlife biologists was death due to
trauma sustained during crashes of manned aircraft performing slow-airspeed, low-
altitude data collection surveys. While the Sasse (2003) study was focused specifically
on wildlife biologists, and an update to the study is recommended, it is hypothesized
that a revised study with the latest data and extension of the subject matter to include
additional natural resources professionals would reveal that slow and low manned aerial
data collection flights would still be near the top of the list of leading causes of on-the-
job mortality for natural resources professionals.
Space-borne Satellites
Gathering natural resources data from an aerial perspective adds an additional
layer of information that can be difficult to procure physically, financially, and/or
repeatedly; however, these data can reveal details that would be extremely challenging
or impossible to observe or document from BOTG methods alone. The addition of
satellite-acquired data to natural resource-based research can be a powerful tool in
generating plausible explanations for events, or may spur additional scientific
hypotheses for researchers to investigate. Over the past 40+ years, space-borne
satellite-generated data suitable for natural resource-based studies have become an
increasingly valuable resource (Ozesmi and Bauer 2002, LaRue et al. 2015, Zweig and
Newman 2015). With significant advancements in computer hardware and software,
along with parallel developments in satellite sensors, both obtaining and utilizing
satellite data has become a much more conventional practice.
Yet even with these improvements, factors such as finite data resolution, timing
and location of satellite data collection, and atmospheric occlusion between the satellite
sensors and the focal target of interest on or around the Earth, can hinder the reliance
32
of space-borne satellites to provide continuous data sets that may be necessary for
specific analyses (Loarie et al. 2007, Gann et al. 2011). In such cases, manned aircraft
surveys may be a more reliable choice because they can usually be conducted under
overcast skies, and commonly provide data with higher resolution than those produced
from affordable satellite data sources. Many examples exist of space-borne satellites
that have exceeded their ‘projected useful lifespan’ that still orbit the Earth and provide
very reliable data; even if the data resolution produced are coarser than those available
from ‘newer’ satellite platforms. These ‘older’ satellites remain valuable, especially for
natural resource-based studies, because obtaining their data is largely cheaper than
attaining similar data from ‘newer’ satellite platforms (Gann and Richards 2009, Zweig
and Newman 2015). In addition, the ‘older’ satellites tend to have lengthy historical
records of archived data that can be used for a plethora of analyses.
Unmanned Aircraft Systems
Located between BOTG and manned aircraft flights in the hierarchy of data
collection options is a technology-driven methodology and emerging tool: sUAS. The
term ‘unmanned aircraft system’ (UAS) is used to describe an unoccupied aircraft that is
flown either remotely by a human pilot, or autonomously under the purview of a human
pilot who can instantly attain manual control of the aircraft. Perhaps the most
appropriate term for these systems is ‘remotely piloted aircraft systems’ (RPAS), but
currently this term has not been generally adopted in the unmanned systems vernacular
(Fahlstrom and Gleason 2012, Colomina and Molina 2014). Use of the RPAS term has
the advantage that the word ‘piloted’ is in its definition; whereas, UAS are sometimes
misconstrued as hobby aircraft toys, or autonomous flying robots that have no method
of intervention by a human operator. Both of these UAS characterizations are

33
inaccurate for the systems that natural resource-based researchers would use for data
collection purposes.
Conversely, the term that has earned worldwide recognition primarily due to its
lengthy history of usage and widespread employment by the media and others is
‘drone’. When the word drone is used, many people tend to conjure a mental picture of
a large, military-purposed aircraft designed to spy on someone or something to acquire
intelligence, surveillance, and reconnaissance (ISR) data, or to provide strike
capabilities to the warfighter in theater, which often invokes a negative connotation.
Because this dissertation is focused on civilian applications of UAS technology as a tool
for data collection in natural resource sciences, not UAS designed for covert spying or
ordinance delivery, the use of the term ‘drone’ is relegated to UAS that are designed
specifically for military applications as their primary role. Some of the more widely
recognized drones include the AeroVironment® Raven™, the Boeing-Insitu®
ScanEagle™, the AAI Corporation® Shadow™, the Aeronautics Defense Systems®
Aerostar™, the General Atomics® Predator™, and the Northrup Grumman® Global
Hawk™ (Figure 1-1).
What are Unmanned Aircraft Systems?
A UAS is truly a system, in that it consists of four primary components, all
working together to achieve takeoff, flight, and landing of an aircraft without a manned
pilot onboard. The four key elements of a nonspecific UAS are: 1) the unmanned
aircraft (UA) and its payload; 2) the ground control station (GCS); 3) the communication
linkages between the UA and the GCS; and 4) a fundamental item that does not always
appear in the definitions of a UAS, but should likely be included: the trained, qualified,
and experienced flight crew executing the mission. Each of these four essential

34
components are generally supplemented with various subsystems, equipment, and
technical knowledge which assist in transforming what might be otherwise be
considered a basic remote control (RC) model or hobby aircraft into an unmanned
airborne data collection platform.
The Unmanned Aircraft
The UA is strictly the flying component of the system; consisting of the airframe,
its appendages, and the contents that leave the ground, fly in the air, and then return to
the ground without a manned pilot onboard. Subsystems of an UA normally include
elements such as a power source, a propulsion system, avionics, a communication
linkage device, and an antenna. Other elements onboard might include flight-specific
payloads, an onboard data storage mechanism, an autopilot component, a flight
stabilization unit, a global positioning system (GPS), an inertial navigation system (INS),
and additional antennae. The UA typically has either a fixed-wing (airplane) or rotary-
wing (helicopter or multirotor) configuration, although other airframe options are
available, e.g., ducted fan, flapping-wing, and lighter-than-air UA (Fahlstrom and
Gleason 2012). Wingspans of UA can range from approximately (≈) 3.0 centimeters
(cm) to ≈ 40 meters (m) in length, and takeoff masses can range from ≈ 100 milligrams
(mg) to ≥ 1,400 kilograms (kg) (Fahlstrom and Gleason 2012). Mass of the UA at
takeoff is predominantly the determining factor used for the classification (and
concomitantly the operational regulations) of UAS worldwide.
The Ground Control Station
The second component of a UAS is the GCS; generally a computer-based
terminal with software that provides some level of telemetry and/or UA status
information to ground-based personnel before, during, and after a UA flight. Depending

35
on the sophistication of the GCS, examples of additional features they may offer are a
method of establishing and uploading of an autonomous flight plan for the UA to
execute, ability to set failsafe protocols and waypoints should communications between
the UA and GCS unexpectedly become severed while the aircraft is in flight, a method
for allowing instantaneous manual command to control the UA, and perhaps present
some level of visualization or control of the data being collected by the UA payload
during a flight. A GCS can range in size from a smartphone up to a multi-screened,
multi-terminal, climate-controlled semi-trailer, which can accommodate a dozen
personnel or more depending on the UA and its mission. However, most GCS units are
simply a laptop computer.
The Communication Linkages
The third component of a UAS is the communication linkages between the UA
and the GCS. The communication linkages minimally consist of command and control
which are bidirectional between the UA and the GCS, but may also include data feeds
which can be either unidirectional or bidirectional from the UA to the GCS.
Communication linkages between the UA and the GCS can be of many different types
and specifications, e.g., analog or digital, unencrypted or encrypted, single-frequency or
frequency-hopping spread spectrum, depending on the operational environment and
types of equipment used both on the airframe and on the ground. With increasing
numbers of UAS-users looking to occupy a finite area for operations of various
applications, limitations due to available communication frequencies are already an
issue that will most likely get worse in the short-term until a long-term solution is
devised.

36
The Flight Team
The fourth component of a UAS is the flight crew conducting the mission. A well
trained, aviation knowledgeable, safety-oriented, and collectively focused flight crew
working as a team to conduct missions is an essential part of a UAS. Each individual is
assigned a specific role and designated duties during all phases of a mission, which
helps distribute the individual workload for the entire team, and helps to ensure that no
tasks are inadvertently overlooked before, during, or after a flight. By having flight
crewmembers cross-trained in the various roles on the team, tasks can be
crosschecked and confirmed as being completed which incorporates an additional level
of safety into the operation of the UAS. Further details about an endorsed flight
crewmember model are provided in Appendix C of this dissertation.
When all four elements are present and functioning together, a UAS can be a
very safe and efficient aerial data collection platform. Advantages in human safety,
imagery resolution, frequency of flights, speed of mobilization, and the potential for long-
term cost savings are just a few of the reasons why UAS are garnering so much
attention from natural resources users, and other civil consumers alike.
UAS in Natural Resource-Based Sciences
A number of commercial companies produce large drones designed for high-
altitude, long-endurance (HALE) military flights whose platforms and sensors can be
adapted for scientific use; although the purchase price and the hourly operation and
maintenance costs of these systems is for all intents and purposes beyond the scope of
most natural resource-users’ budgets. The United States (US) National Aeronautics
and Space Administration (NASA) Airborne Science Program has the means to own, fly,
and maintain an Ikhana™ UAS, which is a General Atomics® Predator™ B drone system

37
that has been modified for Earth sciences research. Missions with the Ikhana™ UAS
have included mutual aid for wildfire monitoring (Ambrosia et al. 2011), sensor
development (NASA 2015), and marine conservation initiatives (Brooke et al. 2015).
The US National Oceanic and Atmospheric Administration (NOAA) has also used
HALE, and medium-altitude, long-endurance (MALE), and sUAS (those whose mass at
takeoff is ≤ 24.9 kg) for natural resource-based data collection. Several examples of
NOAA UAS missions include mapping forest fires, tracking sea pack ice (Moreland et al.
2015), and identifying individual cetaceans based on distinctive external markings
(Mocklin et al. 2012).
Based on the budgets and desired applications of most natural resource
scientists, routine scientific data collection airframes and sensors have emerged in the
sUAS market. Over the past nine years, the interest in civil- and commercial-based
sUAS uses has grown exponentially. Only a short time ago, a very limited number of
commercial companies produced small and affordable airframes and/or sensors that
had the necessary flight features, imaging resolution, or georeferencing capabilities
needed to generate scientific data to assist in answering questions based in natural
resource disciplines.
Beginning as a hypothetical framework concept in 1999, then more formally
structured by 2002, the University of Florida (UF) Unmanned Aircraft Systems Research
Program (UFUASRP) was among the first academic-based sUAS research programs in
the US to custom design a sUAS explicitly purposed as a data collection tool to assist
natural resource professionals. As a hallmark of the UFUASRP, efforts to acquire low-
altitude aerial data of focal targets in scientifically applicable manners, and keeping total
38
costs within natural resource-scale budgets, are just two of the major themes which
have driven the UF Research Program since its’ inception. After nearly two decades of
research and development funded in parts primarily by the United States Geological
Survey (USGS), United States Fish and Wildlife Service (USFWS), Florida Fish and
Wildlife Conservation Commission (FFWCC), Idaho Department of Fish and Game
(IDFG), United States Army Corps of Engineers (USACE), South Florida Water
Management District (SFWMD), National Science Foundation (NSF), UF, and the UF
Institute of Food and Agricultural Sciences (IFAS), the UFUASRP is currently fielding
sUAS operations with its fifth-generation fixed-wing platform, the UF Nova 2.1 sUAS,
and its first-generation rotary-wing airframe, a modified DJI® Spreading Wings
S1000+™. A brief history of the UFUASRP can be found in Appendix A of this
dissertation.
Through years of research, development, and experience, UFUASRP personnel
have been conducting studies concerning all aspects of sUAS, e.g., airframes, avionics,
sensors, payloads, flight planning, post-processing, logistics, etc., and providing results,
information, and guidance to others about the subject. A fundamental goal of the
UFUASRP has been to provide examples to others considering fielding sUAS as a tool
for natural resources research and data collection so that current and future sUAS users
do not waste time, money, and energy ‘reinventing the wheel’, or perhaps making
mistakes similar to those already realized by the UFUASRP.
Foundations of the Research Topic
Emerging out of the high-profile success and remarkable videos generated by
various military drones and their payloads while in theater during the 1990s through the
mid-2000s, the comparatively well-fiscally funded US Department of Defense (USDOD)

39
and its contractors spurred various groups and individuals within both the public and
private sectors to investigate ways to use sUAS technology to augment data collection
options for a seemingly limitless number of non-military applications – including those in
natural resources (Boucher 2015). Integrating new technology into natural resource-
based research has potentially been protracted over time due in part to the
characteristically high costs of obtaining and fielding newer technology; but in response
to a recent push within the scientific community as a whole for increased
multidisciplinary and integrated research efforts, scientists in natural resource fields of
expertise are collaborating with researchers in other scientific disciplines, and gaining
the benefits of utilizing new technology as tools and methodologies to improve their own
science and research efforts (Benson et al. 2010, Blickley et al. 2012, Galan-Diaz et al.
2015).
Developing ways to integrate novel technology into natural resource-based
science can be complicated by multiple factors, e.g.:
1. Working within the confines of particularly limited fiscal resources 2. Meeting the desires to obtain data/analyses/answers in very short periods of time 3. Focusing on specific applications in which novel technology can aptly assist
researchers 4. Recognizing the diverse user skill levels and scopes of knowledge within the natural
resource disciplines 5. Navigating the bureaucracy which generally accompanies new endeavors
The goals of creating tools and techniques to gather data for natural resource-
based research more efficiently, accurately, and safely, by supplementing existing data
collection methods with novel advancements in technology (such as sUAS and their
payloads) are the foundations on which the UFUASRP was established. Fortuitously,
the last decade has been a period in history where UAS for natural resource

40
applications have progressed from a topic that would quite literally empty convention
halls at professional meetings, to a subject that now often garners full-day special
sessions, symposia, and crowded presentation rooms at conferences.
This dissertation consists of two chapters that document case studies of sUAS
fielded as aerial data collection platforms in natural resources, and a third chapter
highlights an alternative method of using sUAS payloads to help address specific
circumstances where sUAS may not be a suitable or legal data collection option. The
chapters show both benefits and limits of the technology that have been determined,
and provide insight into both the short- and long-term prospects for sUAS and their
payloads as data collection tools for the natural resource-based scientific community.
Because technology is always advancing, some of the material contained within these
chapters is already outdated, but it still provides a historical account of where sUAS
technology has been during its’ progression.
The dissertation also contains a series of appendices that documents information
that could provide useful reference material to future sUAS endeavors. A detailed
history of the UFUASRP from its’ inception in 1999 (Appendix A), a very brief history of
UAS regulations in the US (Appendix B), and a flight crew model adopted by the
UFUASRP that received abundant praise from the US Federal Aviation Administration
(FAA) (Appendix C) are provided. Also included as appendices are an overview of the
imagery data post-processing methodologies used throughout this dissertation
(Appendix D), a short commentary on some of the critical lessons learned by the
UFUASRP (Appendix E), and a blank copy of the flight data log completed for each
UFUASRP sUAS flight since 2009 (Appendix F).

41
A B
C D
E F Figure 1-1. Several of the most widely recognized drones used for unmanned military
applications. A) The AeroVironment® Raven™. B) The Boeing-Insitu® ScanEagle™. C) The AAI Corporation® Shadow™. D) The Aeronautics Defense Systems® Aerostar™. E) The General Atomics® Predator™. F) The Northrup Grumman® Global Hawk™.
www.northropgrumman.com/Media/Resources/Photos/ www.ga-asi.com/predator-b
M.A. Burgess
M.A. Burgess M.A. Burgess
M.A. Burgess

42
CHAPTER 2 INFERENCES OF HABITAT SELECTION BY PYGMY RABBITS (Brachylagus idahoensis) BASED ON NORMALIZED DIFFERENCE VEGETATIVE INDICES
GENERATED FROM IMAGERY COLLECTED VIA SMALL UNMANNED AIRCRAFT SYSTEM
With anthropomorphic changes altering ecosystems worldwide, there is an
increasingly urgent need for researchers to identify characteristics of landscapes that
are critical components in habitat selection preferences of wildlife (Edgel et al. 2014).
Fragmentation, degradation, and loss of critical habitat areas for wildlife results in
decreased population sizes (Francis et al. 2011, Hartter et al. 2015, McCleery et al.
2015, Zweig and Newman 2015). It is hoped that through prioritized research efforts,
predictive models of consequential changes to landscapes can be generated which will
help decision makers mitigate some of the negative effects of landscape change
(Rachlow and Svancara 2006, Anderson et al. 2010, Parsons et al. 2016).
Sagebrush-obligate species face increased survival pressures primarily in
response to declines in available sagebrush-steppe landscape due to land conversion
for urbanization and agriculture, introduction of invasive species, energy development,
unsustainable overgrazing by livestock, and increased fire frequency (Edgel 2013). The
abundance and distribution of the pygmy rabbit (Brachylagus idahoensis), a sagebrush-
specialist, has been documented to be declining, but the rates of which are difficult to
establish (e.g., Keinath and McGee 2004, Himes and Drohan 2007, Edgel 2013,
Parsons et al. 2016).
The pygmy rabbit is a small, cryptic, semi-fossorial, generally solitary leporid that
inhabits the semi-arid intermountain sagebrush-steppe landscape year-round (e.g.,
Green and Flinders 1980a, Rachlow et al. 2005, Himes and Drohan 2007, Lee 2008,
Ulmschneider et al. 2008, Edgel 2013) (Figure 2-1). With this life history, the pygmy
43
rabbit is reliant on dense patches of sagebrush (Artemisia sp.) for both protective cover
and as a source of forage (Green and Flinders 1980b). The pygmy rabbit is also unique
in that it is one of only two North American lagomorphs known to excavate their own
burrow systems that they use as shelter for avoiding predation and thermal extremes
which occur throughout their range (e.g., Katzner and Parker 1997, Siegel Thines et al.
2004, Larrucea and Brussard 2009, Camp et al. 2013, Camp et al. 2015, Crowell et al.
2016). Interestingly, pygmy rabbit burrow system entrances are nearly always found at
the base of sagebrush plants, which makes the approximately (≈) 10–12 centimeter
(cm) diameter burrow entrances difficult to locate for researchers and predators alike
(Green and Flinders 1979;1980a, Rachlow et al. 2005, Edgel et al. 2014). Sagebrush
contains unusually high levels of toxic secondary compounds that are generally
deterrents to herbivory; however, the pygmy rabbit has evolved mechanisms to
consume and digest sagebrush (e.g., White et al. 1982, Shipley et al. 2006, Shipley et
al. 2009, Nobler et al. 2013, Ulappa et al. 2014, Fremgen 2015). During warm summer
months, the pygmy rabbit diet consists primarily of sagebrush (51%) while grasses and
forbs constitute a majority of the remainder; however, in winter months when grasses
and forbs are absent, ≈ 99% of the pygmy rabbit diet consists of sagebrush (e.g., Green
and Flinders 1980b, White et al. 1982, Shipley et al. 2006, Utz 2012, Olsoy 2013).
Actually spotting a pygmy rabbit among the sagebrush can be challenging,
therefore presence or absence is chiefly determined by looking for signs of recent
pygmy rabbit activity, i.e., fresh 45° bite marks on sagebrush plants, new fecal pellet
deposits near burrow entrances or foraging sites, active burrow system entryways, or
leaping/landing pad snow-compaction trails from burrows during winter (Green and
44
Flinders 1979, Rachlow and Witham 2006, Ulmschneider et al. 2008, Edgel et al. 2014)
(Figure 2-2). Based on occasional sightings of individuals, and mapping locations of
recent signs of pygmy rabbit presence, their native distribution has been identified as
patchy (Severaid 1950, Green and Flinders 1980a, Rachlow and Witham 2006,
Sanchez and Rachlow 2008) (Figure 2-3). The native pygmy rabbit distribution
historically included parts of central Washington as well; however, a combination of fires
and large-scale losses and fragmentation of the sagebrush-steppe landscape there
extirpated the native population from that region (Becker et al. 2011).
The small size of adult pygmy rabbits [mass: 375–500 grams (g); length: 23.5–
29.5 cm] (Becker et al. 2011) influences their thermal regulation, concealment from
predators, and changes their locomotion strategies when compared to other
lagomorphs. Three other rabbit species have ranges which overlap in part with that of
the pygmy rabbit: the mountain cottontail rabbit (Sylvilagus nuttallii), white-tailed
jackrabbit (Lepus townsendii), and black-tailed jackrabbit (L. californicus), all have larger
body sizes, appendages, and home ranges than pygmy rabbits (Shufeldt 1888, Katzner
and Parker 1997, Ulmschneider et al. 2008, Nobler 2016). These other rabbit species
often utilize their sheer speed to escape predators; however, due to their
disproportionally short hind legs, pygmy rabbits must use agility and precision cornering
ability among vegetation en route back to a burrow as a means of eluding capture
(Green and Flinders 1980a). It is hypothesized that these attributes may limit pygmy
rabbits from venturing too far from a burrow to browse on forage (Ulmschneider et al.
2008, Crowell et al. 2016, Utz et al. 2016). Additionally, cover provided by
comparatively tall, dense sagebrush year-round, and grasses and forbs during the

45
warmer months, help pygmy rabbits minimize detection from both aerial and terrestrial
predators (Camp et al. 2012, Utz 2012, Olsoy et al. 2015).
Pygmy rabbits inhabit microhabitats that have deep, loose, loamy soils, often with
a clay component, capable of supporting their extensive burrow systems, yet soft
enough for tunneling (Gabler et al. 2000, Ulmschneider et al. 2008). Within Idaho, and
perhaps in other parts of their range, pygmy rabbit burrow systems are largely found
associated with mima mounds; circular or oblong microtopographic features composed
of loosely compacted mounded soil having an elevation of ≈ 0.5–1.0 meter (m) above
the surrounding terrain, and diameters of ≈ 5–20 m. The origins of mima mounds
remain debated, but they harbor ‘on-mound’ sagebrush patches which are generally
taller, denser, and have higher above-ground biomass than ‘off-mound’ interstitial areas
where soils typically are more compacted and sagebrush plants are shorter, thinner,
and have lower biomass (e.g., Weiss 1984, Roberts 2001, Ulmschneider et al. 2008,
Estes-Zumpf and Rachlow 2009, Cramer and Barger 2014) (Figure 2-4).
Through years of data collection via boots-on-the-ground (BOTG) methodologies,
combined with laboratory-based analyses of forage and non-forage vegetation, fecal
pellet analyses, and other field-collected samples, researchers with the cooperative
pygmy rabbit research group from the University of Idaho (UI), Boise State University
(BSU), and Washington State University (WSU), have identified many of the habitat
features that pygmy rabbits seemingly require, prefer, tolerate, or avoid, within their
home range (J. L. Rachlow, UI, personal communication; J. S. Forbey, BSU, personal
communication; L. A. Shipley, WSU, personal communication). Their global hypothesis
is that pygmy rabbit habitat selection is determined by areas having the most valuable

46
attributes available within the sagebrush-steppe ecosystem, and therefore the locations
of active burrows and signs of recent pygmy rabbit presence should theoretically be
prominent indicators of regions containing preferred habitat features.
To test this hypothesis, the cooperative pygmy rabbit research group looked to
create a series of spatial response models using geographic information system (GIS)
techniques based on smaller-scale, intensive BOTG efforts at multiple study locations,
primarily within Idaho. The GIS response models would consist of multiple layers of
spatially mapped predictor variable data that would include, but not limited to the
following:
1. Location, density, size, spacing, above-ground biomass, and species of available vegetation
2. Nutritional quality, quantity, and energetics of forage and non-forage items 3. Identification and concentrations of toxic secondary compounds found in
browsed and unbrowsed vegetation 4. Availability and location of cover as refugia from predators and thermal extremes 5. Soil features, mima mound sizes, and locations 6. Locations of active, inactive, and abandoned pygmy rabbit burrow entrances 7. Distances from burrows to roads, fences, open spaces, water, edge habitat,
agriculture, and free-ranging livestock operations 8. Identification and proximity of known rabbit predator sightings, tracks, scat, or
other signs of predator presence
Using GIS, the predictor variable data layers could then be stacked in various
combinations, resulting in spatial response models revealing the geographic locations
possessing the ‘more preferred’ combinations of habitat features for pygmy rabbits in
addition to locations that were noticeably avoided (Figure 2-5). Should the spatial
response models work for the smaller-scale intensive BOTG pygmy rabbit study sites,
the subsequent objective was to ‘scale-up’ to larger regions, with the ultimate goal of
achieving models at landscape levels.
47
To scale-up, extrapolation of remotely sensed data collected by space-borne
satellites, manned aircraft surveys, or perhaps emerging small unmanned aircraft
systems (sUAS) was needed (Figure 2-6). The resolution of affordable satellite data
was too coarse, and manned aerial surveys were not budgeted, thus the cooperative
pygmy rabbit research group approached the University of Florida Unmanned Aircraft
Systems Research Program (UFUASRP) for assistance. The UFUASRP proposed to
conduct low-altitude, sUAS fixed-wing flights over sagebrush-steppe habitats in Idaho
using both visible (RGB) and near-infrared (NIR) wavelength optical sensors to address
the following objectives:
1. Compare normalized difference vegetative index (NDVI) values between sagebrush plants located on and off mima mounds within each of two study sites
2. Compare NDVI values between sagebrush plants that exhibited signs of recent pygmy rabbit activity, to sagebrush plants not exhibiting signs of recent pygmy rabbit activity within each of the two study sites
3. Compare the mean NDVI values of sagebrush plants that were growing on or off mima mounds, and showing or not showing signs of recent pygmy rabbit presence to sagebrush plants having the same disposition between the two study sites
At both study sites, we predicted that mima mounds, which harbor denser
patches of sagebrush, would have higher mean NDVI values than those for sagebrush
plants located off mima mounds in interstitial areas. We also predicted that at both
study sites, sagebrush plants associated with recent signs of pygmy rabbit activity
would have higher mean NDVI values than those where signs of recent pygmy rabbit
activity were absent. Additionally, we predicted that the mean NDVI values for
sagebrush plants possessing the same disposition at both sites would be statistically
different from each other because from ground level the vegetation distribution at the
two sites presents a visual dissimilarity.
48
The Sagebrush-Steppe Study Areas
Magic Reservoir
The Magic Reservoir field site was located on the Camas Prairie, 3.3 kilometers
(km) southeast of Magic Reservoir, and due west of Wedge Butte peak on the western
side of paved State Highway 75, in Blaine County, Idaho (WGS84 Datum: 43.241965°
North; −114.318094° West) (Figure 2-7). The focal area of study covered ≈ 30 hectares
(ha) of sagebrush-steppe habitat, dominated by Wyoming big sagebrush (Artemisia
tridentata wyomingensis), with a few small patches of low sagebrush (A. arbuscula) and
three-tip sagebrush (A. tripartita), and several species of warm-season grasses and
forbs. Site topography was relatively flat with a slight downhill grade from the northeast
[elevation: 1,478 m above sea level (ASL)] to the southwest (elevation: 1,470 m ASL)
extents of the study site, and the surface was defined by mima mounds harboring
denser clusters of sagebrush with less-dense sagebrush located off the mounds among
areas of grasses, forbs, and some areas of bare ground.
An unnamed two-rut dirt road ran north and south through the study site, and
another two-rut road named ‘Big Wood River Access’ ran westerly from State Highway
75 just north of the southern edge of the study site across the northern extent of a 1.2
ha dry borrow pit which created the southeastern quadrat of the dirt road intersection. A
wire fence line with wooden fenceposts defined the northern limits of the study site. A
similar fence line delimited the eastern edge of the study site.
National Oceanic and Atmospheric Administration (NOAA) climatology data for
the locality classified it as semi-arid with an average annual precipitation total of 20.2
cm per year (NOAA 2016). Historical data showed that for the months of June, average
daily air temperatures range from 5.5–24.5° Celsius (C), and rainfall is infrequent, while

49
in the months of December, average daily air temperatures range from −13.8– −0.3° C,
with infrequent snow showers (NOAA 2016).
Rocky Canyon
The Rocky Canyon field site was located in the Lemhi Valley, 10.8 km east-
southeast of Leadore, on an alluvial fan of gravelly silt loam at the foothills of the
Beaverhead Mountains, in Lemhi County, Idaho (WGS84 Datum: 44.664152° North;
−113.225143° West) (Figure 2-8). The focal area within the site encompassed ≈ 135 ha
of sagebrush-steppe habitat, dominated by Wyoming big sagebrush (Artemisia
tridentata wyomingensis), with patches of three-tip sagebrush (A. tripartita) and several
species of rabbitbrush (Chrysothamnus sp.), and warm-season grasses and forbs. Site
topography was on a grade downhill from the northeast (elevation: 2,040 m ASL) corner
of the study site to the southwest (elevation: 1,952 m ASL) corner, and the surface was
defined by mima mounds harboring dense clusters of sagebrush with less-dense, but
nearly continuous sagebrush, rabbitbrush, grasses, and forbs located between the
mounds.
An unnamed two-rut dirt road ran generally north and south just west of the
eastern edge of the study site from Hawley Creek at its’ southern end, up the foothill
grade to its’ northern terminus in Rocky Canyon proper. Hawley Creek Road (also a
two-rut dirt road) ran westerly along the mountain foothills just south of the northern
extent of the study area from Rocky Canyon proper. Located just north of the southern
limits of the study site was Hawley Creek proper, and access to the entire site required
driving through Hawley Creek via a two-rut dirt road which originated perpendicularly off
Forest Service Road 275, 2.0 km southwest of the Hawley Creek Lower Campground,
US Forest Service (USFS) recreational area. Forest Service Road 275 was a graded

50
gravel and dirt road that was wide enough for two vehicles to pass, and possessed
ditches on each shoulder to direct water runoff during occasional rain showers.
NOAA climatology data for the Rocky Canyon site classified it as semi-arid with
an average annual precipitation total of 20.5 cm per year (NOAA 2016). Historical data
showed that for the months of June, average daily air temperatures range from 3.2–
22.3° C, and rainfall is infrequent, while in the months of December, average daily air
temperatures range from −14.6– −1.2° C, with infrequent snow showers (NOAA 2016).
Methods Used for Assessing Pygmy Rabbit Habitats with sUAS-derived NDVI Imagery Products
The University of Florida (UF) Nova 2.1 sUAS (detailed in Appendix A) was
designed specifically as a platform for housing optical payloads capable of obtaining
high-resolution digital imagery and associated metadata to assist in answering natural
resource-based scientific questions. Emulating many principles of a glider to maximize
flight time aloft, the 2.74 m wingspan fixed-wing airframe was fabricated to offer hand-
launch and belly-landing capabilities with a 6.0 kilogram (kg) maximum total mass at
takeoff. The low-altitude Idaho missions were conducted under Federal Aviation
Administration (FAA) Certificate of Waiver or Authorization (COA) permits 2013-WSA-
85 (Magic Reservoir study site), and 2013-WSA-89 (Rocky Canyon study site),
respectively. At the time of the study, obtaining a COA was not trivial, requiring a huge
investment of time over a period of three to six months if not longer.
Flights conducted with the UF Nova 2.1 sUAS for the pygmy rabbit missions
followed a standard operating procedure (SOP) developed at UF that met or exceeded
FAA requirements for sUAS flights. The entire process from unpacking the UA from its’
transport case upon arrival at the field site, to packing the UA away at the end of the

51
operational day, was conducted by a qualified three-person flight crew: 1) a pilot-in-
command (PIC); 2) a ground station operator (GSO); and 3) a qualified visual observer
(QVO). Each of the flight crewmembers had specific duties during all phases of the
operation, and further detail about the UFUASRP flight crew model can be found in
Appendix C.
Once the UF Nova 2.1 was airborne, it flew preprogrammed parallel transects
under autopilot control over the target study area. Transects were arranged to capture
individual images with sufficient overlap (≥ 60% endlap and ≥ 50% sidelap) for complete
ground coverage. At any time during a flight, manual remote control (RC) of the
unmanned aircraft (UA) could be achieved by the PIC with the flip of a switch. After a
target area had been thoroughly imaged by the sUAS payload, or if the system battery
voltage approached a threshold value, the aircraft would be commanded by the GSO to
proceed to a predetermined rally waypoint located downwind, then begin a controlled
descent spiral, and autonomously land itself into the prevailing wind at a prearranged
waypoint on the ground.
To achieve the intended research goals of obtaining both RGB and NIR digital
imagery and its associated metadata to conduct NDVI analyses, a collaborative
decision was made to gather NIR data only in the summer months when vegetation on
the sagebrush-steppe landscape was most active and not covered with snow. Two
separate summer field missions to Idaho were made with the UF Nova 2.1 sUAS, the
Olympus® E-420™ optical payloads, and a three-person flight crew.
The first field mission for collecting imagery of pygmy rabbit habitat took place
24–26 June 2013 (summer 2013) at the Magic Reservoir study site. To assist in
52
tightening the accuracy of the resultant post-processed imagery end products, n = 84
ground control points (GCP) were spread throughout the entire site (Figure 2-9), and
were marked with 30 × 30 cm laminated coverboards; the centers’ of which were
individually geolocated (latitude, longitude, and altitude) using a survey-grade Topcon®
HiPer V™ dual-frequency global navigation satellite system (GNSS) receiver unit with
base station. The entire study site was subdivided into four smaller subareas east to
west for imagery collection to maximize ground coverage of aerial transects that were
oriented north and south with ambient winds having a southerly component on each of
the flight days. All of the four smaller subareas were flown once with the RGB spectrum
payload, and once with the NIR optical sensor. The preprogrammed flight paths over
each subarea were executed twice during each of the eight individual flights; an
additional effort to maximize imagery of the target area for mosaicking.
The UFUASRP learned a tremendous amount about the UF Nova 2.1 sUAS
aircraft performance during the summer 2013 flights at Magic Reservoir, as they were
the first flown with that system from ground elevations considerably higher than sea
level. Combining the altitude ASL (and the actual station pressure experienced at those
altitudes) with the low dew points and uncharacteristically warm air temperatures
experienced at the field site in June 2013 led to calculated density altitude values that
effectively thinned the air to levels encountered at substantially higher altitudes. The
effects of the density altitude were noted in aircraft performance; especially evident in
the decreased lift provided by the aircraft wings, and with decreased thrust due to the
thinner air.

53
The second field mission for these research objectives took place 15–19 June
2014 (summer 2014) at the Rocky Canyon study site. As was done in summer 2013 at
the Magic Reservoir site, n = 111 GCP were spread throughout the entire Rocky
Canyon site (Figure 2-10), marked with coverboards, and geolocated in three-
dimensions (3D) using a HiPer V™ GNSS receiver unit with base station. The Rocky
Canyon site was subdivided into three subareas south to north to conduct east-west
flight transects in account of the easterly ambient winds encountered. Based on flights
conducted in Idaho the previous summer, the UFUASRP outfitted the UF Nova 2.1
sUAS with a larger diameter propeller that also had an increased pitch in an attempt to
more effectively operate in the higher altitudes ASL. The first two flights conducted at
the Rocky Canyon site were executed with the RGB payload, and covered the two
southernmost of the three subareas. After several days of poor weather, including rain,
low clouds, poor visibility, and even snow showers, the next two flights were conducted
with the NIR sensor payload over the same two southernmost Rocky Canyon subareas
previously flown with the RGB payload.
Each of the four flights that had been conducted up until that point during the
summer 2014 mission had all experienced particularly rough landings on the only
suitable landing strip available at the Rocky Canyon site; the graded gravel and dirt
Forest Service Road 275 south of the study area. Having landed on the same road
during January 2014 flights with the same equipment and personnel for other mission
objectives (not featured in this dissertation), landings at the Rocky Canyon site
presented little problems for the UF Nova 2.1 sUAS because there was an appreciable
layer of snow and/or ice on the road surface that allowed the aircraft to skid to a stop

54
relatively smoothly. However, during the summer 2014 flights, every landing on the
Forest Service Road did various levels of damage to the airframes, avionics, or
payloads.
During summer 2014, slightly elevated exposed faces of larger gravel and rocks
imbedded in Forest Service Road 275 had a tendency to snag parts of the fuselage or
main wing tips during belly-landings causing the UA to either stop abruptly initiating a
cartwheel, or induce a pivot about the obstruction redirecting the aircraft into the
roadway ditch containing larger exposed rocks, or further off course into the adjacent
sagebrush patches beyond the road shoulder. All minor repairs were conducted in the
field, but repairs that were more significant had to be conducted back at the local field
station. By the end of the fourth Rocky Canyon summer 2014 flight, two of the three UA
fuselages brought to Idaho were damaged beyond repair. With future flights still
planned, the UFUASRP flight team met with the cooperative pygmy rabbit research
group to discuss their priorities for the ensuing flights. It was determined that
completing the RGB spectrum data set for the remaining northernmost subarea at
Rocky Canyon was a priority. If the last RGB flight could be completed and landed
without damage, then a flight with the NIR payload would be executed to finish complete
imagery coverage of the study site.
The last RGB flight was flown over the remaining northernmost subarea,
completing full coverage of the Rocky Canyon site with visible wavelength imagery.
Unfortunately, the landing of that flight on Forest Service Road 275 damaged the
fuselage, main wingset, and tail components beyond repair. Data collection was
55
effectively terminated with no additional airframes available for conducting further
flights.
Data post-processing for this study was conducted using the methodology
delineated in Appendix D. Each of the eight flights at the Magic Reservoir study site
were post-processed individually, as were the five flights at the Rocky Canyon study
site. The final PhotoScan© post-processing step was to merge the individual RGB
flights and NIR flights at each site into large digital elevation models (DEMs) and
orthophotomosaic scenes for further analyses.
The NIR orthophotomosaic image was loaded into QGIS™, a free and open
source GIS software program. The image was saved as a raster file, and then a custom
Python™ script was used to break down the NIR orthophotomosaic image into its’ ‘blue,
green, and red’ wavelength component bands; which in reality were ‘a small amount of
green wavelength light+some NIR, a small amount of red wavelength light+some NIR,
and a limited NIR band’, based on the camera conversion process and user-defined cut-
filter replacement specifications.
Using the raster calculator in QGIS™, the formula for computing NDVI:
[(NIR−red)/(NIR+red)] was applied to the appropriate component bands and a resultant
black and white NDVI raster layer was generated with a scale from black–white (values:
−1.0– +1.0). Very low NDVI values (≤ −0.2) are typically water, impenetrable surfaces,
etc., while low values (−0.1– +0.1) are generally associated with barren earth or rock.
Moderate NDVI values (0.2–0.4) correspond with shrubs and grasses, while high values
(> 0.5) occur in dense areas of very green and healthy vegetation. Healthy green plants
do not reflect much RGB light as they use these wavelengths for photosynthesis, but

56
less-healthy plants tend to reflect much higher levels of RGB light. The black and white
NDVI raster layers were recolored with a scale from red–green, which enhanced
visualization of variations that the black and white layers did not reveal as easily.
Initial analyses were conducted on the Magic Reservoir site and the Rocky
Canyon site individually, and then subsequently the information from both was used.
Using QGIS™ software, a standard basemap was projected, and the post-processed
orthophotomosaic products (RGB and NIR) were added as layers. An additional layer
containing the 3D locations of the GCPs was added to ensure that all of the layers lined
up properly. Next, the NDVI raster layers were added to the GIS tree. A final layer
consisting of 3D locations of specific sagebrush plants that were identified, ground
truthed, and geolocated by the cooperative pygmy rabbit group was added (Figures 2-
11, 2-12, and 2-13).
The NDVI values for an equal number of sagebrush plants on and off mima
mounds were selected from the list of geolocated plants using a random-number
generator. The same system was used to randomly select sagebrush plants exhibiting
signs of recent pygmy rabbit activity versus those that did not. The selected plants were
queried in the QGIS™ software for their NDVI values, the results were tabulated, and a
series of statistical tests were conducted to assess various combinations of factors.
Results of Pygmy Rabbit Habitat Selection Using sUAS NDVI Imagery Products
The summer 2013 Magic Reservoir field mission resulted in eight flights (four
with the RGB payload, four with the NIR payload). The three days of flying yielded a
total flight time of 5 hours (hr), 42 minutes (min), and 8 seconds (sec); nearly 43 min per
flight on average. During the eight flights, 7,678 total 10.0 megapixel (MP) JPEG format
images were captured, occupying 24.4 gigabytes (GB) of digital drive space. The
57
imagery collected covered ≈ 62 ha of sagebrush-steppe habitat, although the targeted
area of study had an area of 29.3 ha. The difference between the two area calculations
was attributed to imaging an intentional buffer zone of significant extent around the
target study area to maximize complete imagery coverage over the focal target area.
Resultant ground resolution of the post-processed imagery products had an average of
2.33 centimeters per pixel (cm/pix).
The summer 2014 Rocky Canyon mission resulted in five flights (three with the
RGB payload, and two with the NIR payload). The three days of flying yielded a total
flight time of 3 hr, 7 min, and 28 sec; nearly 37 min per flight on average. During the
five flights, 3,876 total 10.0 MP JPEG format images were captured, occupying 16.0 GB
of digital drive space. The RGB imagery collected covered ≈ 205 ha of sagebrush-
steppe habitat, although the targeted area of study had an area of roughly 135 ha. The
difference was again attributed to imaging an intentional buffer zone of substantial area
around the focal target study site to maximize imagery coverage over the target area of
interest. The NIR imagery collected covered ≈ 141 ha of sagebrush-steppe habitat,
although the area within the targeted area of study was roughly 95 ha. Resultant
ground resolution of the post-processed imagery products had an average of 2.88
cm/pix.
The NDVI values computed for sagebrush plants within the greater sagebrush-
steppe landscape from the sUAS imagery collected, independent of site, resulted in
values that ranged from −0.156– +0.248. For the Magic Reservoir site, sagebrush
plants located on mima mounds that exhibited signs of recent pygmy rabbit presence,
and those lacking signs of recent pygmy rabbit presence had mean NDVI values of

58
0.148 (SE = 0.014, n = 35), and 0.074 (SE = 0.017, n = 35), respectively. Also at Magic
Reservoir, sagebrush plants located off mima mounds that exhibited signs of recent
pygmy rabbit presence, and those lacking signs of recent pygmy rabbit presence had
mean NDVI values of 0.077 (SE = 0.016, n = 35), and 0.005 (SE = 0.019, n = 35),
respectively.
At the Rocky Canyon site, sagebrush plants located on mima mounds that
showed signs of recent pygmy rabbit presence, and those lacking evidence of recent
pygmy rabbit presence had mean NDVI values of 0.141 (SE = 0.014, n = 35), and 0.078
(SE = 0.017, n = 35), respectively. Additionally at Rocky Canyon, sagebrush plants
located off mima mounds that exhibited signs of recent pygmy rabbit presence, and
those lacking signs of recent pygmy rabbit presence had mean NDVI values of 0.080
(SE = 0.017, n = 35), and −0.014 (SE = 0.018, n = 35), respectively.
Within the Magic Reservoir site, tests of the mean NDVI values for sagebrush
plants located on mima mounds exhibiting signs of recent pygmy rabbit presence were
statistically different compared to: 1) plants located on mounds showing no signs of
recent pygmy rabbit presence (t66 = 3.29; P ≤ 0.001); 2) plants off mima mounds
exhibiting signs of recent pygmy rabbit presence (t67 = 3.25; P ≤ 0.001); and 3) plants
off mima mounds showing no signs of recent pygmy rabbit presence (t64 = 6.06; P ≤
0.001). The mean NDVI values for sagebrush plants located off mima mounds
exhibiting no signs of recent pygmy rabbit were statistically different compared to those
of plants located on mima mounds showing no signs of recent pygmy rabbit presence
(t68 = 2.73; P = 0.004), and to those off mima mounds exhibiting signs of recent pygmy
rabbit presence (t67 = 2.90; P = 0.002). However, the mean NDVI values for sagebrush

59
plants located on mima mounds that showed no signs of recent pygmy rabbit presence
and those located off mima mounds exhibiting signs of recent pygmy rabbit presence
were not statistically different (t68 = −0.11; P = 0.453).
Within the Rocky Canyon site, tests of the mean NDVI values for sagebrush
plants located on mima mounds showing signs of recent pygmy rabbit presence differed
compared to: 1) plants located on mounds exhibiting no signs of recent pygmy rabbit
presence (t66 = 2.77; P = 0.004); 2) plants off mima mounds showing signs of recent
pygmy rabbit presence (t67 = 2.75; P = 0.004); and 3) plants off mima mounds showing
no signs of recent pygmy rabbit presence (t65 = 6.77; P ≤ 0.001). The mean NDVI
values for sagebrush plants located off mima mounds exhibiting no signs of recent
pygmy rabbit presence differed statistically compared to those of plants located on
mima mounds showing no signs of recent pygmy rabbit presence (t68 = 3.69; P ≤ 0.001)
and to those off mima mounds exhibiting signs of recent pygmy rabbit presence (t67 =
3.84; P ≤ 0.001). However, the mean NDVI values for sagebrush plants located on
mima mounds that showed no signs of recent pygmy rabbit presence and those located
off mima mounds exhibiting signs of recent pygmy rabbit presence were not statistically
different (t68 = −0.080; P = 0.468).
Statistical comparisons of mean NDVI values for sagebrush plants growing in
similar microhabitats between the two study sites were all found not to differ statistically
from each other. Sagebrush plants at both sites growing on mima mounds showing
signs of recent pygmy rabbit presence had mean NDVI values that were not statistically
different from each other (t68 = 0.344; P = 0.366), while sagebrush plants at both sites
growing on mima mounds and not showing any signs of recent pygmy rabbit presence

60
also had mean NDVI values that were not statistically different from each other (t68 =
−0.143; P = 0.443). Sagebrush plants at both sites not growing on mima mounds and
exhibiting recent signs of pygmy rabbit presence had mean NDVI values that were not
statistically different from each other (t68 = −0.114; P = 0.455), while sagebrush plants at
both sites growing off mima mounds and not showing any signs of recent pygmy rabbit
presences also had mean NDVI values that were not statistically different from each
other (t68 = 0.750; P = 0.228).
Discussion of Pygmy Rabbit Habitat Selection Based on sUAS NDVI Imagery Products
Determining the NDVI was just one option from a very lengthy list of vegetative
indices that are available to isolate specific spectra from composite imagery (Zhang et
al. 2015). Chlorophyll, the green pigment in plants, strongly absorbs RGB light
wavelengths as part of the photosynthetic process, and therefore the cells within green
leaves strongly reflect NIR wavelengths. By creating an index of ‘greenness’, and
capitalizing on the NIR reflective properties of vegetation, NDVI was designed to
provide information specifically for green plants (e.g., Huang et al. 2002, Pettorelli et al.
2005, Agapiou et al. 2012, Dandois and Ellis 2013, Nijland et al. 2014, Boswell 2015).
Within the published literature, manuscripts that utilize NDVI values for analyses
are dominated by agricultural disciplines for vegetation such as planted row crops and
turfgrass. Comparing NDVI values reported within that literature to those of a
sagebrush plant that has relatively small leaves and rather substantial woody structural
components is inequitable. Although the computed NDVI values in this study were low
and had a seemingly narrow spread of values, the use of NDVI was still appropriate for
comparisons made among sagebrush-steppe communities.
61
The mean NDVI values were the highest at both sites for sagebrush plants
located on mima mounds that showed signs of recent pygmy rabbit presence as
expected. With the pygmy rabbit depending on sagebrush for food and cover year-
round, and knowing that mima mounds tend to harbor pygmy rabbit burrow systems, it
was not surprising to observe that the ‘greenest’ sagebrush plants close to rabbit
burrows would be preferred by showing signs of recent pygmy rabbit presence. Also
not unexpected was that the lowest mean NDVI values at both study sites were
associated with sagebrush plants off mima mounds that showed no signs of recent
pygmy rabbit presence. Based on the behavior and ecology of pygmy rabbits,
sagebrush plants in the interstitial areas between mima mounds are areas typically
having less cover, and therefore lower mean NDVI values would indicate that those
plants are less green; suggesting that they do not provide as many green parts as
forage or concealment cover to pygmy rabbits. This leads us to wonder if pygmy rabbit
foraging and defecation influence sagebrush plants and cause them to potentially have
higher NDVI values as a result of ‘pruning’ and ‘fertilization.’
The determination that the mean NDVI values for sagebrush plants on mima
mounds that did not exhibit signs of recent pygmy rabbit presence were not statistically
different from mean NDVI values of sagebrush plants off mima mounds that did show
signs of recent pygmy rabbit presence was unpredicted. Finding this to be the case at
both study sites further reinforced the result. Perhaps this has to do with tradeoffs
between forage quality and distance from burrows (e.g., Siegel Thines et al. 2004,
Shipley et al. 2009, Camp et al. 2013, Ulappa et al. 2014, Olsoy et al. 2015, Utz et al.
2016). In situations where pygmy rabbits may be forced to leave the security of a mima

62
mound due to age, sex, or territoriality issues, those individual rabbits likely select the
‘greenest’ plants available in the interstitial areas to provide both cover and forage.
Conceivably the NDVI findings from this study may also be better explained and lead to
additional justifications when these data are added to other GIS layers and response
models are generated.
Determining that mean NDVI values between sites for sagebrush plants with
similar location and signs of recent pygmy rabbit activity dispositions were all found to
be not statistically different was also unanticipated. It was thought that because the
mima mound spacing and sagebrush densities appear visibly different between the two
study sites at ground level, the likelihood of the mean NDVI values for sagebrush having
similar dispositions at both sites was expected to be low. A factor potentially
contributing to these results was that the majority of the sagebrush plant species at both
study sites consisted of Wyoming big sagebrush although their distribution was discrete.
Sagebrush-steppe sites that are less homogeneous with Wyoming big sagebrush might
reveal alternative results. Nevertheless, these findings certainly warrant further
exploration through the testing of additional sites. If similar results are found elsewhere,
then the results of this study could theoretically be an important characterization in the
conservation and management of critical pygmy rabbit habitat.
When developing mechanistic models of herbivore habitats, it is important to
consider that factors such as forage quality, density, cover, and biomass can all
influence NDVI values, and therefore may not singlehandedly identify any particular
feature or element of a preferred area as ideal habitat. For spatial analyses, Anderson
et al. (2010) suggested vegetation quality and quantity are probably better predictors of

63
herbivore habitat preference than selected alternatives. Additionally, the monitoring of
rangeland landscapes is difficult and particularly complicated due to the high degree of
spatial and temporal variation in both vegetation and soils.
An issue that presented problems in computing NDVI values as part of this study
was the influence that plant shadows created when using high-resolution sUAS
imagery. Several papers over the years have addressed shadows and the effects that
they can have on vegetative indices (e.g., Ono et al. 2010, Park 2013, Gunasekara et
al. 2015, Zhang et al. 2015, Cerra et al. 2016). The time of day when imagery for NDVI
analyses are obtained can change the overall impacts that shadows have on the
resulting data. Further research is needed to account for the influence that shadows
can introduce to NDVI assessments, especially with the high-resolution imaging
capabilities that sUAS provide.
This study focused on NDVI values generated from imagery collected by a sUAS
over several sagebrush-steppe field sites in Idaho. As part of a larger effort to scale-up
data collected at the plant- and patch-levels, to larger habitat-scales and landscape
levels, the sUAS payloads were able to collect valuable data regarding pygmy rabbit
habitat selection. This study found that remote sensing techniques of NDVI calculation
via sUAS-acquired imagery and metadata could be used as a tool to augment field-
based sampling methodologies. Utilizing the results of this work, theoretically an area
of sagebrush-steppe landscape could be overflown with a sUAS platform capable of
generating NDVI data, and specific sagebrush locations within the resulting
orthogeorectified scene could be identified as ‘highly likely’ or ‘highly unlikely’ to harbor
pygmy rabbits based on NDVI values.

64
Figure 2-1. A pygmy rabbit (Brachylagus idahoensis). This individual was preparing to
be transported to Washington State University as part of an Institutional Animal Care and Use Committee (IACUC)-approved forage selection study by another researcher.
M.A. Burgess

65
A B
C D Figure 2-2. Signs of recent pygmy rabbit (Brachylagus idahoensis) presence. A)
Characteristic 45° angle, clean browse of sagebrush (Artemisia sp.). B) Representative scat deposits of jackrabbit (Lepus sp.), mountain cottontail rabbit (Sylvilagus nuttallii), and pygmy rabbit, respectively. C) A mima mound covered in dense sagebrush harboring a pygmy rabbit burrow system. D) Leaping/landing pad snow-compaction trails emanating from burrow systems.
M.A. Burgess
M.A. Burgess www.rabbitweb.net/images/scat/
Rachlow and Witham 2006
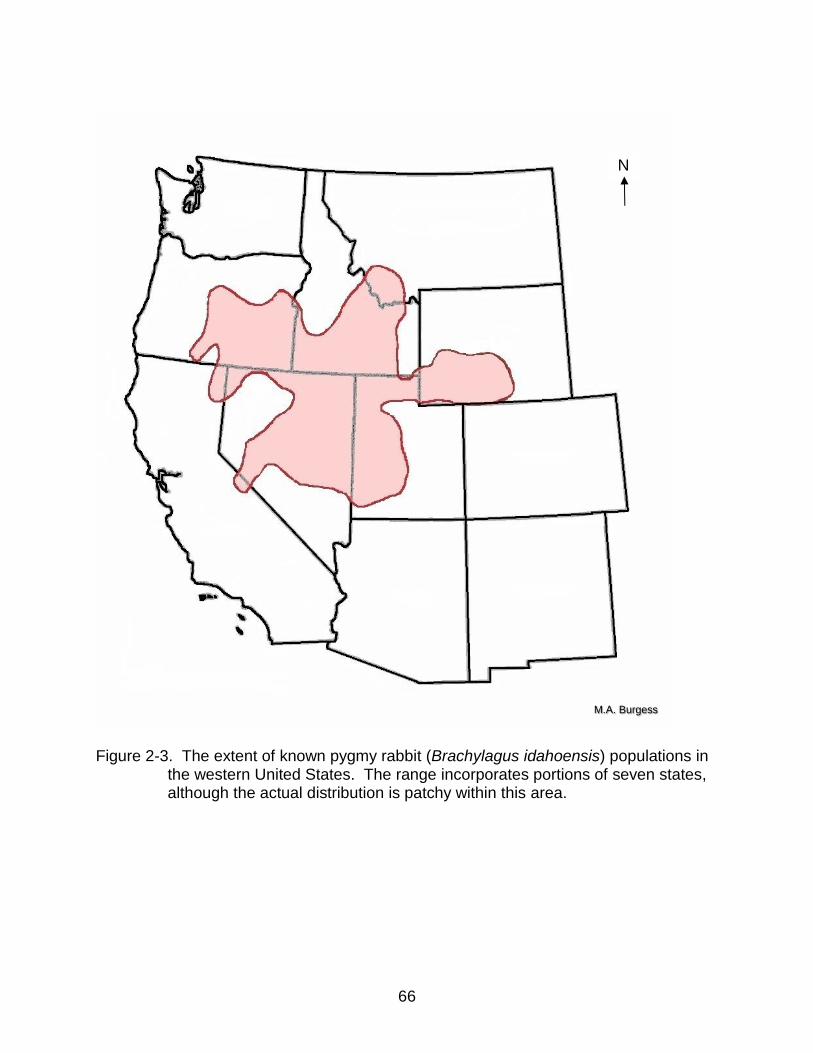
66
Figure 2-3. The extent of known pygmy rabbit (Brachylagus idahoensis) populations in
the western United States. The range incorporates portions of seven states, although the actual distribution is patchy within this area.
M.A. Burgess
N

67
Figure 2-4. An orthophotomosaic aerial image showing mima mounds distributed
across the sagebrush-steppe landscape in the Lemhi Valley, Lemhi County, Idaho, USA. Darker green patches are mima mounds harboring denser concentrations of sagebrush (Artemisia sp.) than interstitial areas having less-dense sagebrush, rabbitbrush (Chrysothamnus sp.), grasses, and forbs. The remnants of an old railroad grade possessing denser vegetation and a two-rut dirt road are also visible traversing the top left of this orthophotomosaic.
M.A. Burgess
0 100m

68
Figure 2-5. The geographic information system spatial modeling concept for generating
a response surface based on individual predictor variable layers for pygmy rabbits (Brachylagus idahoensis). The creation of a spatial response surface model should indicate geographic locations exhibiting ‘more preferred’ and ‘less preferred’ areas by pygmy rabbits.
J.R. Forbey
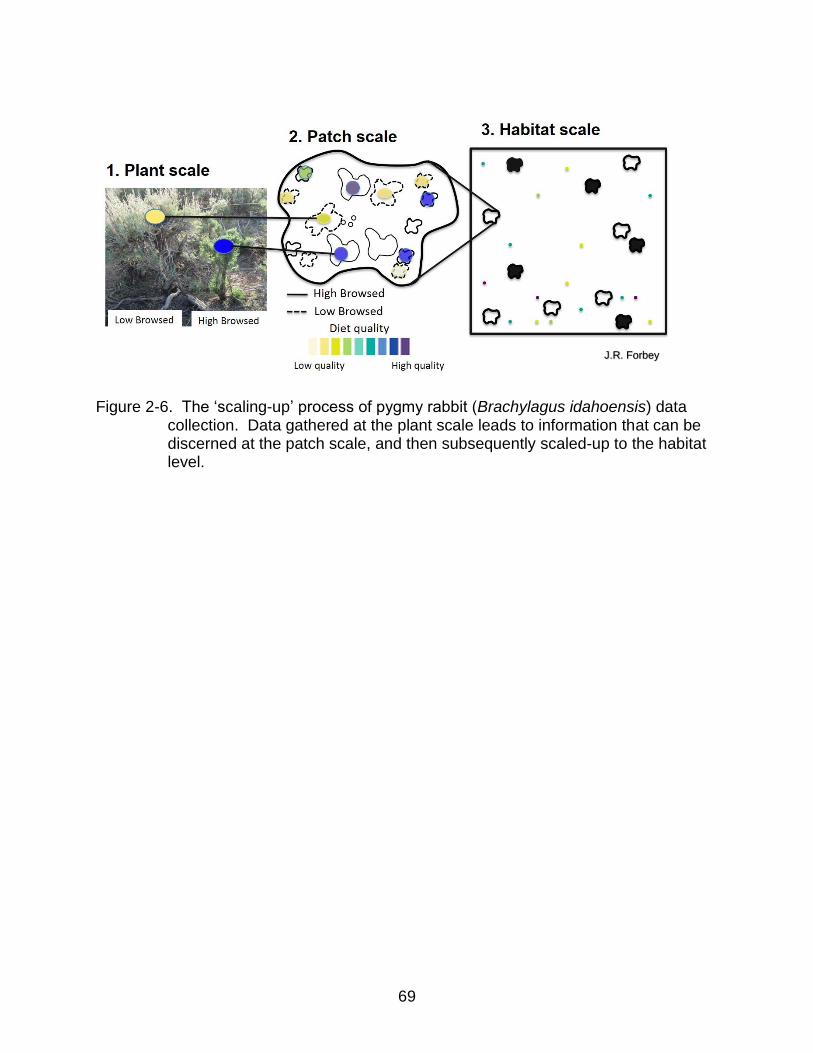
69
Figure 2-6. The ‘scaling-up’ process of pygmy rabbit (Brachylagus idahoensis) data
collection. Data gathered at the plant scale leads to information that can be discerned at the patch scale, and then subsequently scaled-up to the habitat level.
J.R. Forbey

70
Figure 2-7. The location of the Magic Reservoir study site for pygmy rabbits
(Brachylagus idahoensis), in Blaine County, Idaho, USA. The region shaded in red delineates the 29.3 hectare focal area of study during summer 2013.
GoogleEarth™

71
Figure 2-8. The location of the Rocky Canyon study site for pygmy rabbits (Brachylagus
idahoensis), in Lemhi County, Idaho, USA. The region shaded in red delineates the approximately 135 hectare focal area of study during summer 2014.
GoogleEarth™

72
Figure 2-9. Locations and distribution of the n = 84 geolocated ground control points
established at the Magic Reservoir study site during summer 2013 in Blaine County, Idaho, USA.
Figure 2-10. Locations and distribution of the n = 111 geolocated ground control points
established at the Rocky Canyon study site during summer 2014 in Lemhi County, Idaho, USA.
M.A. Burgess
0 200m
M.A. Burgess 0 200m
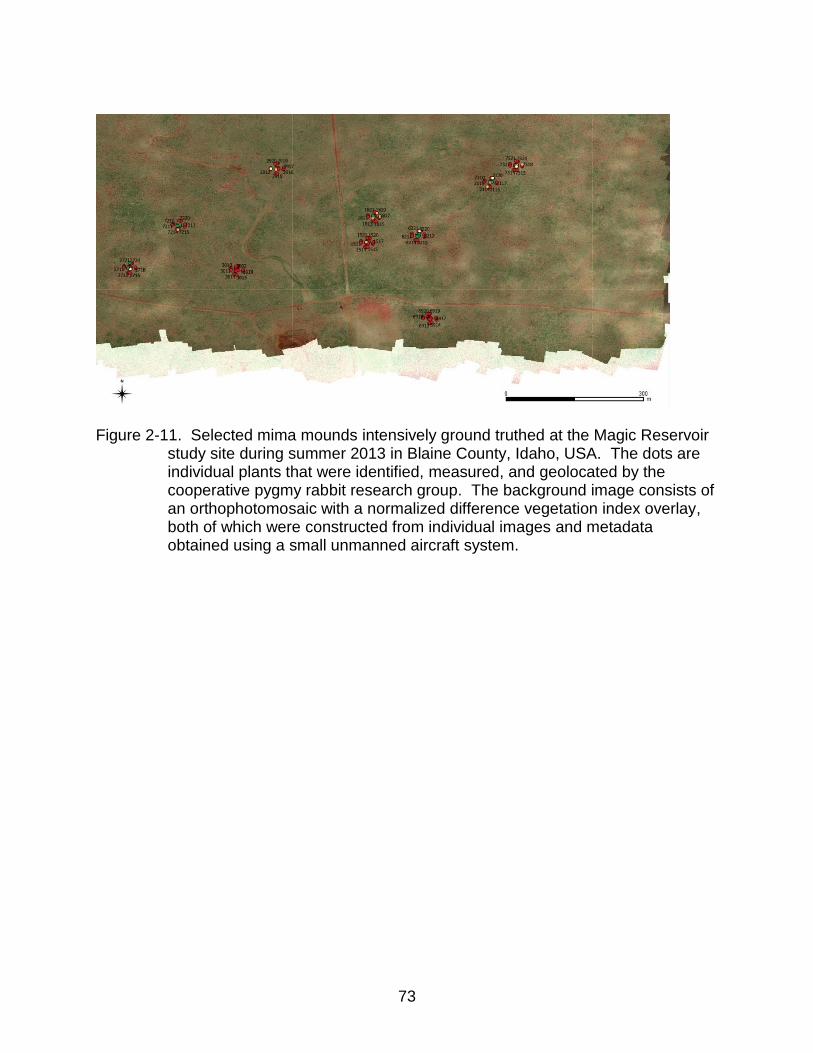
73
Figure 2-11. Selected mima mounds intensively ground truthed at the Magic Reservoir
study site during summer 2013 in Blaine County, Idaho, USA. The dots are individual plants that were identified, measured, and geolocated by the cooperative pygmy rabbit research group. The background image consists of an orthophotomosaic with a normalized difference vegetation index overlay, both of which were constructed from individual images and metadata obtained using a small unmanned aircraft system.
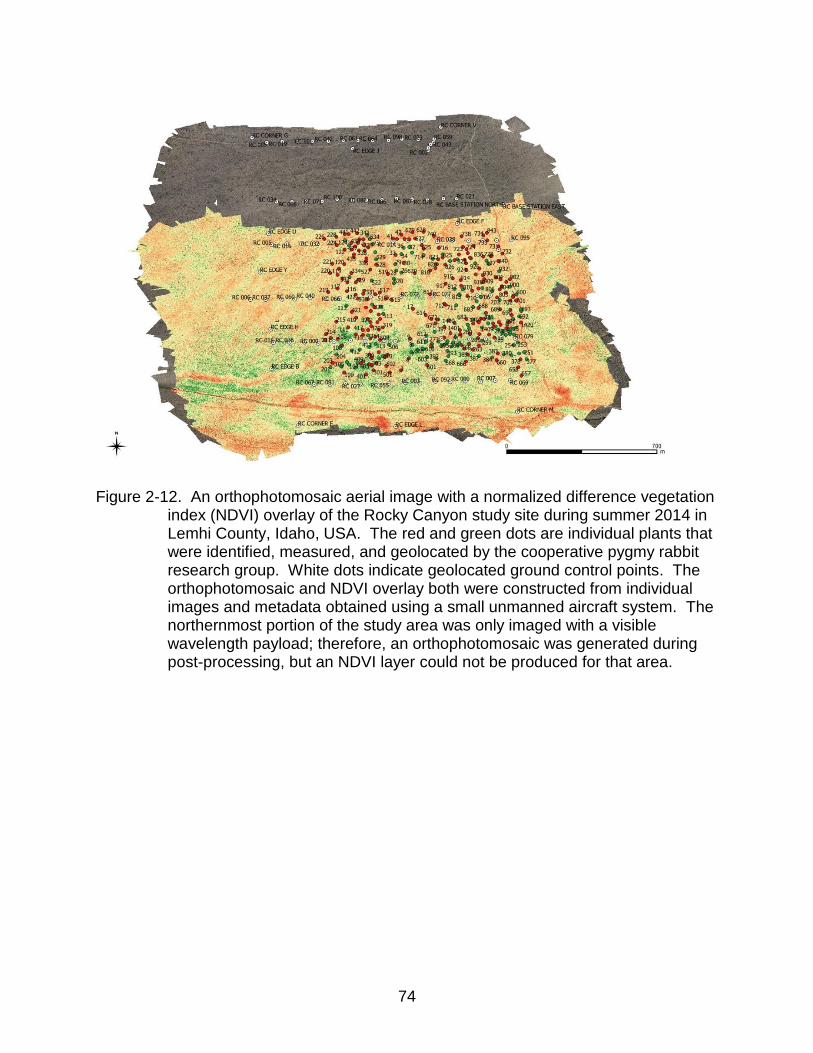
74
Figure 2-12. An orthophotomosaic aerial image with a normalized difference vegetation
index (NDVI) overlay of the Rocky Canyon study site during summer 2014 in Lemhi County, Idaho, USA. The red and green dots are individual plants that were identified, measured, and geolocated by the cooperative pygmy rabbit research group. White dots indicate geolocated ground control points. The orthophotomosaic and NDVI overlay both were constructed from individual images and metadata obtained using a small unmanned aircraft system. The northernmost portion of the study area was only imaged with a visible wavelength payload; therefore, an orthophotomosaic was generated during post-processing, but an NDVI layer could not be produced for that area.
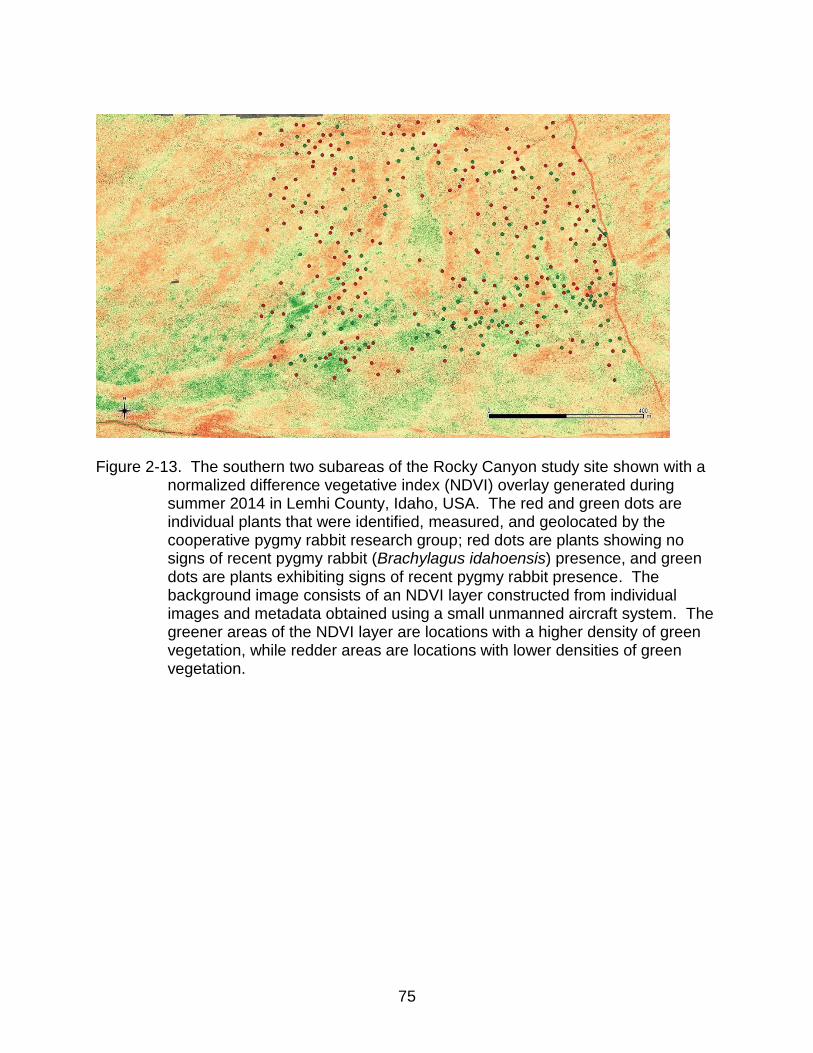
75
Figure 2-13. The southern two subareas of the Rocky Canyon study site shown with a
normalized difference vegetative index (NDVI) overlay generated during summer 2014 in Lemhi County, Idaho, USA. The red and green dots are individual plants that were identified, measured, and geolocated by the cooperative pygmy rabbit research group; red dots are plants showing no signs of recent pygmy rabbit (Brachylagus idahoensis) presence, and green dots are plants exhibiting signs of recent pygmy rabbit presence. The background image consists of an NDVI layer constructed from individual images and metadata obtained using a small unmanned aircraft system. The greener areas of the NDVI layer are locations with a higher density of green vegetation, while redder areas are locations with lower densities of green vegetation.

76
CHAPTER 3 ESTIMATES OF AMERICAN WHITE PELICANS (Pelecanus erythrorhynchos)
OBTAINED FROM PHOTOGRAMMETRIC PRODUCTS OF IMAGERY GATHERED USING A SMALL UNMANNED AIRCRAFT SYSTEM
During the decade 2006—2017, civilian use of small unmanned aircraft systems
(sUAS) became an increasingly popular means of conducting aerial surveys, including
scientific studies with natural resources and conservation applications (e.g., Jones IV et
al. 2006, Watts et al. 2010, Chabot 2014, Shahbazi et al. 2014, Johnson et al. 2015,
Mulero-Pázmány 2015). Significant developments in various components of sUAS,
e.g., airframes, sensors, payloads, avionics, acquisition and operational costs, and legal
regulations, etc. have all contributed to heightened use of these systems worldwide
(e.g., Hardin and Hardin 2010, Gordon et al. 2013, Stark et al. 2013, Cress et al. 2015,
Pajares 2015). Use of any visual data collection technique within natural resources
research is subject to covariates such as observer biases, variations in sightings,
discrepancies in training, observer fatigue, and detection probability issues that must be
accounted for when generating assessments of focal targets (e.g., Link and Sauer
1997, Alldredge et al. 2006, Tracey et al. 2008, Walsh et al. 2011, Cook 2013, Beaver
et al. 2014). Quantification of focal items are also influenced by factors such as their
heterogeneity, variability, behavior, physical features, and the timing of when the
assessments are made (e.g., Magnusson et al. 1978, Kushlan and Frohring 1985,
Packard et al. 1985, Frederick et al. 2003, Pollock et al. 2006, Langtimm et al. 2011).
Whether data collection of focal targets is obtained from space-borne satellites,
aerially, or conducted from the surface of the Earth or below [‘boots-on-the-ground’
(BOTG) methods], the selection and execution of the data collection techniques and
their subsequent analyses requires thorough knowledge of the biases, limitations, and

77
underlying assumptions of the methods used (Hines et al. 2010, Royle and Dorazio
2010, Thomas et al. 2010). Inappropriate application of data collection techniques or
statistical analyses can produce inaccurate results of focal target abundance, their
spatial and temporal trends, and potentially lead to inappropriate management
decisions (e.g., Anderson 2001, Rosenstock et al. 2002, Williams et al. 2002, Tracey et
al. 2008, Schmidt et al. 2012, Iknayan et al. 2014).
Field researchers often default to BOTG methodologies because the data
desired are collected at a finer resolution than affordable space-borne satellite options
can generate, or are logistically and fiscally easier to obtain than manned aerial
methods (Berni et al. 2009, Madden et al. 2015). However, BOTG techniques can
disrupt focal targets physically or behaviorally which introduces biases into the data
collected, and BOTG methods are typically some of the most time- and labor-intensive
data collection options available in natural resources (e.g., Ralph and Scott 1981,
Kendall et al. 2009, Wang et al. 2010, Mulero-Pázmány et al. 2014, Williams et al.
2015). Just like any tool, sUAS are by no means a magic bullet for all scientific data
collection needs in natural resources. However, using an appropriate sUAS, payload,
sampling methodology, and data post-processing technique, many applications exist
where sUAS can assist researchers by overcoming specific deficiencies that
accompany alternative data collection methods.
A ‘count’ is someone’s notion of a specific number of focal target items detected
within some defined unit of measure (Chong and Evans 2011). Count data can be used
to generate an index of relative abundance of focal targets, the total number or
frequency of detections across sampling units, etc. (Anderson 2003, Engeman 2003);
78
however in doing so, index counts often violate critical assumptions concerning uniform
detectability (Anderson 2001, Rosenstock et al. 2002, Stober and Smith 2010). On the
other hand, an ‘estimate’ is a statistically defensible number of focal targets that is
generated using empirical models, and incorporates statistical parameters such as a
coefficient of variance, confidence bounds, standard deviation, etc. (Grenier et al. 2009,
Chong and Evans 2011, Miller et al. 2011).
The American White Pelican [AWP, (Pelecanus erythrorhynchos)] has generated
particular interest over the years due to its’ large size and prominent bright white
plumage. Because of a relatively complex wildlife and fisheries management conflict, it
has generated heightened attention from the Idaho Department of Fish and Game
(IDFG) and other natural resource agencies (IDFG 2016) (Figure 3-1). Each spring,
AWP migrate north from their warm winter ranges along marine coastlines of southern
North America to nest in large colonies on specific inland remote islands within
freshwater lakes and reservoirs of the western and north-central United States (US) and
southern Canada (Knopf and Evans 2004, IDFG 2016). From the 1880s–1960s, AWP
populations were decimated by the damming of rivers for water storage and power
generation, creation of reservoirs and artificial wetland habitat on former agricultural
lands, draining of natural wetlands, and widespread spraying of organochlorine
pesticides (Knopf and Evans 2004, Keith 2005). After enactment of stringent
environmental protection laws AWP populations have slowly improved (King and
Anderson 2005). Annual counts of the total AWP population have fluctuated
considerably since the 1800s. The extensive breeding range, irregular timing of counts,

79
and inconsistent estimation methodologies contributed to the unreliability of any single
annual abundance estimate up until the 1990s (Keith 2005).
In Idaho, AWP nesting colony populations have been systematically monitored
by IDFG regional biologists since 2002 at Blackfoot Reservoir and Minidoka Reservoir
(IDFG 2009). Surveys conducted using BOTG transects across each island resulted in
a visual count of the number of nests (IDFG 2009). These intrusive surveys were
conducted in late May or early June during the late incubation/early nestling stage of
AWP breeding (IDFG 2009). Dramatic increases in AWP breeding populations in Idaho
were noted from 2002–2008 at both the Blackfoot Reservoir and the Minidoka Reservoir
locations where the counts of breeding birds increased from approximately (≈) 1,400 to
2,400, and ≈ 400 to ≥ 4,400, respectively (IDFG 2009;2016).
The larger AWP population had negative impacts on native Yellowstone cutthroat
trout (Oncorhynchus clarkii bouvieri), Bonneville cutthroat trout (O. c. utah), rainbow
trout (O. mykiss), and other recreational fisheries within Idaho (IDFG 2016, Meyer et al.
2016). Adult AWP and other piscivorous birds predominantly feed on abundant
nongame fish species (e.g., Knopf and Evans 2004, IDFG 2009, Teuscher et al. 2015,
IDFG 2016, Meyer et al. 2016). Due to declines in gamefish, the State of Idaho
invested significant funding into fish hatchery programs to help recover native
recreational fish populations (Knopf and Evans 2004, Teuscher et al. 2015, Meyer et al.
2016). In 2009, IDFG generated a five-year AWP management plan to balance viable
AWP nesting populations with native and recreational fisheries interests using adaptive
management approaches. Trout stocking events were moved later into the year to
reduce AWP depredation effects, and AWP nesting areas at the Blackfoot Reservoir
80
location were intentionally decreased [with US Fish and Wildlife Service (USFWS)
approval]. Counts of AWP at the Blackfoot and Minidoka Reservoir locations have
averaged 2,126 (range 724–3,174) breeding birds/year, and 3,600 (range 1,998–4,408)
breeding birds/year, respectively (IDFG 2016). In 2012, AWP established a new
breeding colony of ≈ 300 birds at Island Park Reservoir, Idaho (IDFG 2016). As part of
the five-year AWP management plan, IDFG biologists looked to find potential methods
of generating more accurate AWP population estimates (IDFG 2009).
In this study, our objectives were to use the UF Nova 2.1 sUAS and its optical
payload to: 1) determine if the sUAS could successfully fly autonomous transects over
nesting AWP at an altitude that would produce sufficiently high-resolution imagery
without disturbing the nesting birds; 2) determine if the orthophotomosaics generated
from the transect imagery could be used to create counts of nesting AWP; and 3)
compare the latter counts with BOTG counts.
American White Pelican Study Area
This study was conducted over AWP nesting colonies in Minidoka Reservoir
(Lake Walcott) within the USFWS Minidoka National Wildlife Refuge (MNWR), Cassia
County, Idaho, USA (Figure 3-2). The AWP breeding sites were located 2.75 kilometers
(km) east of the Minidoka Dam, and consisted of three artificial spoil islands; Pelican
(WGS84 Datum: 42.662538° North; −113.454403° West), Tern (WGS84 Datum:
42.663919° North; −113.451394° West), and Gull (WGS84 Datum: 42.662837° North;
−113.450570° West) Islands (Figure 3-3). Each spoil island had nearly flat topography
with a maximum ground elevation above the waterline ≤ 2.0 meters (m), and was
composed principally of a light-colored sandy-mud substrate with interspersed gravel
and larger rocks of non-uniform size or shape. Essentially all rock surfaces which

81
projected above the waterline near each island were preferred perching, loafing, and
feeding sites for AWP and other avifauna including Ring-billed Gull (Larus
delawarensis), California Gull (L. californicus), and Double-crested Cormorant
(Phalacrocorax auritus). The exposed rock surfaces were generally coated with white
feces. Sparse vegetation consisting of small shrubs and few trees were located
irregularly along the perimeters of Pelican and Gull Islands, which supported nests of
Double-crested Cormorant.
Based on US Bureau of Reclamation (USBOR) data, the Minidoka Reservoir was
at 98.1% of its total active storage capacity during this study (USBOR 2016), and the
southern- and western-most of the three spoil islands, Pelican Island, had an exposed
area at water level of 0.17 hectares (ha), possessed the most total vegetation cover,
and was the closest island to the mainland (59 m). Tern Island, the northern-most and
smallest (0.03 ha) of the three spoil islands lacked any vegetation, had the least amount
of available sandy nesting area for AWP, but had the most exposed rock surrounding
the island, and was located the furthest distance from the mainland at 300 m. The
eastern-most and largest (0.30 ha) of the three islands, Gull Island, exhibited some
shrubby vegetation and tree cover, offered copious sandy substrate for AWP nesting,
and was located 152 m from the mainland.
The Minidoka Reservoir AWP nesting sites are at 1,295 m above sea level
(ASL), and National Oceanic and Atmospheric Administration (NOAA) climatology data
for the locality classified it as semi-arid with an average annual precipitation total of 24.2
centimeters (cm) per year (NOAA 2016). Historical data showed that for the month of
June when AWP are nesting, average daily air temperatures range from 7.8–25.6°
82
Celsius (C), and rainfall is infrequent, while in the month of December when AWP have
migrated south to warmer latitudes, average daily air temperatures range from −8.9–
+2.2° C, and regular snows contribute the most to annual precipitation totals (NOAA
2016).
Methods Used for Estimating Nesting American White Pelicans from sUAS-derived Imagery Products
The UF Nova 2.1 sUAS equipped with an Olympus® E-420™ optical payload
(both detailed in Appendix A) was flown over the Minidoka Reservoir spoil islands on 10
June 2014 under permits issued by the Federal Aviation Administration (FAA)
Certificate of Waiver or Authorization (COA) #: 2014-WSA-42-COA; and a USFWS
Research and Monitoring Special Use Permit #: 14614-10-14. The mission was
executed by a three-person University of Florida Unmanned Aircraft Systems Research
Program (UFUASRP) flight crew (detailed in Appendix C) aboard an IDFG boat
operated by the southeastern regional biologist. The boat was positioned toward the
middle of Minidoka Reservoir due north of the three spoil islands. Personnel from the
MNWR had already positioned a USFWS boat along the buoy line delineating the
boundary of recreational boating activities to observe the sUAS operations, and to
answer questions that might arise from curious boaters.
Personnel from the USFWS, US Bureau of Land Management (USBLM), IDFG,
and Idaho Department of Parks and Recreation (IDPR) were on hand with binoculars
and cameras along the southern reservoir shoreline to observe and note any bird
reactions, and report any issues via radio to the IDFG regional biologist and flight team
if disturbance were observed so the mission could be terminated.

83
Meteorological conditions recorded during preflight checks by the ground station
operator (GSO) at 0752 hours from the boat were clear skies, ≥ 18.5 km visibility,
steady wind out of the west at 8.6 meters per second (m/sec) with occasional gusts to
10.0 m/sec, air temperature of 15.5° C, dew point 9.1° C, relative humidity 60.4%, and a
barometric pressure of 1012 hectopascals. At 0757, the UF Nova 2.1 sUAS was
launched, ascended to the preprogrammed altitude of 225 m above ground level (AGL),
and began initial waypoint navigation through the preprogrammed flight path. The first
three upwind passes (from east to west) were directly over Tern Island to evaluate if the
UF Nova 2.1 sUAS overflights elicited any response from the AWP. The first upwind
pass was conducted at 225 m AGL, and decreased by 50 m to 175 m AGL for the
second pass, and by another 50 m to 125 m AGL all directly over Tern Island. No
changes in bird behavior were reported by any of the observers during the three trial
passes, therefore at 0803, the aircraft was instructed to execute the entire
preprogrammed flight path autonomously at a commanded altitude of 125 m AGL.
The preprogrammed flight path (separate from the altitude testing flight path)
consisted of 16 parallel linear transects, ten exclusively upwind, and six exclusively
downwind. A 30.0 m spacing between parallel horizontal transects was calculated to be
appropriate for sufficient imagery sidelap. All three islands were uniformly covered with
upwind transects, which in response to the ambient winds aloft slowed the ground
speed of the aircraft and therefore met or exceeded the desired imagery endlap
calculated for the planned orthophotomosaic post-processing. All downwind transects
captured imagery as well; however, due to the sum of both the ambient wind speed aloft
and the 15.0 m/sec cruise airspeed of the aircraft, downwind imagery were captured
84
with the knowledge that they would have insufficient endlap for mosaicking purposes,
but they could provide additional imagery samples of the nesting avifauna.
With the westerly wind and location of the three focal islands taken into
consideration, a rectangular area with dimensions of 700 × 450 m would cover all three
islands with parallel upwind transects and produce sufficient 30.0 m sidelap spacing for
post-processing. However, due to the triangular geographic orientation of the three
focal islands, the flight path was arranged so that the focal area of interest in which
straight and level flight was required was reduced. The horizontal transects over Tern
Island were shortened from 700 m in length to 300 m in length to save time and effort
collecting imagery of open water in the areas directly west and north of Tern Island,
which would not assist in meeting the specific objectives of this mission which was
focused on the islands (Figure 3-4).
The entire flight path was completed in ≈ 14 minutes (min), at which time
everything checked out as nominal by the flight crew, so the aircraft was instructed to
repeat the entire flight path. With favorable time and conditions, additional exposure
stations would add a larger number of tie points for orthophotomosaic production during
post-processing. At 0829, the second pass of the entire flight plan was completed, and
the aircraft was landed at 0832 at the landing waypoint. The total elapsed flight time
was 35 min and 45 sec.
Once back at the boat ramp, the onboard computer containing the imagery and
metadata collected during the flight was backed-up onto a secondary portable storage
device for archival and reassurance purposes. Preliminary views of the imagery and

85
metadata were all positive; imagery of the islands and the nesting AWP were clear, and
the metadata file of telemetry data for the payload sensor system was complete.
Data post-processing for this study was conducted using the methodology
delineated in Appendix D. Each of the three spoil islands were post-processed
individually, and the final PhotoScan© post-processing step of merging the individual
products was omitted as it was not necessary for the objectives of this study. Several
methods were used to experiment with various exported imagery products from the
PhotoScan© software to ultimately make counts of AWP on each of the three spoil
islands.
The first method of analyses used Applied Imagery® Quick Terrain Reader™
software to exaggerate the ‘z-axis’ (elevation data) of the Gull Island digital elevation
model (DEM) produced using PhotoScan©. It was thought that inflating the elevation
profiles of objects on the relatively flat topography of Gull Island might assist in manually
counting the number of AWP. A second method of analyses involved manually
counting the AWP observed in the orthophotomosaic product of Gull Island using iTAG™
counting software (Viquerat and van Neer 2015). The third method of counting AWP for
comparative purposes was conducted using the Gull Island orthophotomosaic product
generated in PhotoScan© and a single nadir-oriented individual JPEG image from the
flight, in which a small subarea within the orthophotomosaic was also identified within
the individual JPEG image. Using the iTAG™ software, the AWP were counted within
the subarea from the orthophotomosaic, and then the number of AWP within the same
subarea on the individual JPEG flight image were enumerated by an observer counting
visually. The results of this analysis were designed to assess effects of AWP moving

86
between aerial transect overflights, which the PhotoScan© software would have to
address when creating a single, static imagery product of Gull Island. The fourth
analyses involved selecting a single method from the three outlined above that provided
the most consistent counts using subsampling techniques of Gull Island.
Using crowdsourcing (a method of achieving desired content through workforce
multiplication–in this case data in the form of AWP counts–from a large pool of
individuals), n = 30 volunteers with unknown histories of ornithology, aerial observation,
or focal object identification within digital imagery, were asked to conduct AWP counts
for each of the three spoil islands in MNWR. Each volunteer was shown n = 5 AWP
individuals in each of the three orthophotomosaics loaded into the software as
examples of the focal items in which to count. Volunteers took as much time as they
needed to count individual AWP from the three orthophotomosaics, and could stop and
resume as necessary. The final analyses were to compare sUAS estimates of AWP
determined by the crowdsourced count data to IDFG nest counts that were obtained
using BOTG transect methods within a week after the 10 June 2014 sUAS flight.
Results of the sUAS Imagery Products for Assessing Estimates of American White Pelican Nesting
The AWP and other birds near the target islands showed no signs of disturbance
by the fixed-wing UF Nova 2.1 sUAS conducting transects over their nesting islands in
Minidoka Reservoir at 225 m, 175 m, and 125 m altitudes AGL. Based on the optical
parameters of the payload used along with the ambient wind speed and direction, the
125 m altitude for overflight of the islands was calculated to deliver sufficient endlap and
optical resolution of the imagery captured during the flight; therefore, attempting
transects at lower altitudes was not necessary.

87
With their large bodies, orange bills, occasional black crest, and characteristic
shadow signatures, detecting AWP within the post-processed orthophotomosaics was
particularly easy for pelicans nesting in open areas on the islands even with the light-
colored sandy-mud substrate as a backdrop. The detection of nesting AWP individuals
adjacent to large rocks was more challenging because nearly all rock surfaces were
generally coated in white feces. Large rocks generated shadows that resembled the
shadows of nesting AWP, and vice versa. Additionally, detection of AWP was
sometimes difficult in areas with overhanging vegetation. With nadir-oriented imagery,
individuals nesting close to tree trunks, or within the peripheral margins of dense brush,
presented some detection issues. It was also noted that Double-crested Cormorants
nesting or roosting in trees or other elevated locations on Pelican and Gull Islands
created particularly extensive areas of white feces on, and under the supporting nesting
structure, making detection of AWP near or under those localities quite difficult (Figure
3-5).
The windy conditions during the data collection flight contributed to some
orthophotomosaic blur which manifested itself as swirls in herbaceous vegetation
waving in the wind, but otherwise did not present any appreciable issues for the study
goals of imaging AWP nesting on the islands (Figure 3-6). To address other research
questions, the post-processed imagery products using the PhotoScan© software of Gull
Island were selected as the testbed for various AWP enumeration techniques. The use
of Quick Terrain Reader™ software to exaggerate the ‘z-axis’ (elevation data) of the
DEM was not effective at a factor of 5.0 times the true elevation in helping to identify
AWP within the Gull Island DEM. The DEM model elevation data was then exaggerated

88
by a factor of 10.0 times the true elevation, and similarly was not of any substantial
assistance in identifying AWP within the scene (Figure 3-7).
Using the iTAG™ counting software, an arbitrary small subarea of the Gull Island
orthophotomosaic yielded a count of 88 AWP individuals. Coincidentally, counting AWP
within the same small subarea using iTAG software of an individual JPEG image
collected during the sUAS flight also yielded 88 individual AWPs; however, several of
the AWP individuals within the JPEG image were not in the same physical location
within the orthophotomosaic, and vice versa (Figure 3-8). Individual pelican movements
that occurred between imaging transects over the exact same target area were short,
but these movements illustrate just how valuable direct georeferencing of imagery can
be for identifying movement of featured targets between aerial transect passes.
Based on the various software titles employed, and subsampling of several
arbitrary small subareas of each of the three islands, using the iTAG™ counting software
on the orthophotomosaic output from PhotoScan© provided the most consistent and
straightforward combination of data products and software for manually counting AWP
on the three islands (Figures 3-9, 3-10, and 3-11). The crowdsourced data of AWP
counts by each of the n = 30 volunteers using the iTAG™ software resulted in
remarkably similar values for each of the three islands.
For Pelican Island, the mean number of AWP counted was 571.5, with a
standard deviation of 6.58, or 1.2%. The individual counts ranged from 559–582, and
had a 95% confidence level of ±2.46 (Figure 3-12). For Tern Island, the mean number
of AWP counted was 75.2, with a standard deviation of 2.62, or 3.5%. The individual
counts ranged from 70–80, and had a 95% confidence level of ±0.98 (Figure 3-13). For
89
Gull Island, the mean number of AWP counted was 1,217.1, with a standard deviation
of 7.38, or 0.6%. The individual counts ranged from 1,203–1,231, and had a 95%
confidence level of ±2.75 (Figure 3-14).
The mean total counts of crowdsourced AWP detections for all three spoil islands
was 1,863.9, with a standard deviation of 15.8, or 0.8%. The individual sums ranged
from 1,835–1,890, and had a 95% confidence level of ±5.91. The regional biologist with
IDFG provided the following AWP nest counts based on a BOTG survey across each of
the three islands less than a week after the sUAS overflight: 812, 90, and 1,230, AWP
nests for Pelican, Tern, and Gull Islands, respectively. The sum total of AWP nests
based on the BOTG survey of all three spoil islands was 2,132.
Comparing crowdsourced mean total counts of individual AWP for Pelican, Tern,
and Gull Island with counts generated by a BOTG survey revealed that sUAS estimates
were 70.4%, 83.6%, and 99.0% (P < 0.05) of BOTG nest counts, respectively.
Discussion on the Use of sUAS Imagery Products to Assess Estimates of American White Pelican Nesting
The UF Nova 2.1 sUAS fixed-wing platform outfitted with an Olympus® E-420™
optical payload system was an effective combination of airframe and payload for the
desired data collection needs. Flying at an altitude of 125 m AGL provided sufficient
resolution for discriminating AWP from cormorants and gulls, while not disturbing any of
the birds. Using the UF Nova 2.1 sUAS airframe was particularly beneficial because
transects over the target areas were conducted into the wind, which capitalized on the
glider-features of the airframe design by limiting the use of the electric motor even with
stiff ambient winds. The resulting transects were flown nearly silently. Spacing the
parallel transects 25.0 m apart rather than at the 30.0 m spacing would have increased
90
the sidelap slightly and possibly improved the post-processing results. Repeating the
entire flight plan a third total time would have captured more imagery over the focal
targets, and would have likely enhanced the post-processing results somewhat as well.
The use of manual counting techniques of imagery for enumerating AWP did
take time to accomplish, and was tedious work. Use of iTAG™ software made the
process much easier for several reasons. The software left a mark on a ‘counted’
target, and attempting to mark another target very near to an existing mark would trigger
a warning screen asking the observer to verify that the newly identified target was not
the same target that had already been marked. This feature reduced the chances of
double counting a target contained within a single orthophotomosaic to nearly zero.
The software kept a running tally of the selected targets, so the observer making counts
did not have to take their eyes off the computer screen to record physical counts by
hand or in a separate spreadsheet, etc. This saved time and permitted the observer to
stay focused on identifying target items on the screen. Lastly, the ability to pause
counting, save the file, and re-open it to resume counting later was also advantageous.
Using automated detection computer recognition algorithms for estimating AWP
seemingly would present several challenges due to their white plumage against a
predominately lightly colored substrate. Other issues include: 1) white feces-coated
rocks adjacent to nesting AWP; 2) adult AWP on nests were generally sitting, not
standing; and 3) detection of AWP nesting under dense, low-elevation vegetation, or
under trees containing large cormorant nests was difficult with only nadir-oriented
imagery.
91
In regards to the difference in numbers reported between the orthophotomosaics
generated by the sUAS imagery and the BOTG manual ground surveys conducted
across the islands, several important details were realized during the data analyses.
First, and probably the most notable issue that somehow failed to be recognized until
the IDFG sent their BOTG ground count data to the UFUASRP, was that the UFUASRP
was collecting data to count individual AWP on each of the three spoil islands in
MNWR. The biologists at IDFG conduct their BOTG surveys by counting the number of
nests observed on each island. The target items being enumerated by the two entities
were not one and the same. Understanding the source of discrepancy between the
numbers generated by analyses of the sUAS data products and the data provided by
IDFG was reassuring. After identifying the primary source of error, additional
investigation was conducted to analyze the Pelican Island orthophotomosaic even
closer to try to establish why a difference of nearly 30% occurred between the total
number of AWP counted on the island from a sUAS-generated aerial orthophotomosaic
and the number of nests counted using BOTG methods were considerably different.
Upon further inspection, there were several areas on Pelican Island that contained
abandoned or empty nests that were not counted using the existing orthophotomosaic
analysis protocols established before the data was crowdsourced, but those abandoned
or empty nests were likely counted as part of the IDFG nest totals (Figure 3-15). Taking
this concept further, seeing that 99% of Gull Island aerial AWP counts from the
orthophotomosaic image corresponded to IDFG BOTG nest survey numbers, careful
investigation of the Gull Island orthophotomosaic that was generated revealed that there
92
were virtually no abandoned or empty nests detectable; therefore the counts of the
respective targets were nearly identical on Gull Island.
Because of the repeatable, tightly georeferenced imagery that is capable of being
collected using the optical payloads of the UF Nova 2.1 sUAS, existing and new avian
nests are identifiable at times ‘t’, ‘t+1’, ‘t+2’, … ‘t+n’. When critical factors such as
spatial sampling assumptions and detection probability are accounted for, best effort
counts of individual targets using dual-observer techniques from a moving manned
aircraft could possibly give way to more accurate population estimates of a specific
target areas of known size at time ‘t’ by analyzing sUAS-collected imagery.
Conceivably even more attractive is the possibility of generating estimates of seasonal
production of individual nests at times ‘t+1’, ‘t+2’, etc. which theoretically are also
possible if a routine sUAS flight schedule can be established and maintained throughout
an entire reproductive season (Williams et al. 2011).
An advantageous reason for using a sUAS to conduct aerial surveys is that when
outfitted with direct georeferencing payloads, the digital imagery and associated
metadata collected can be catalogued, archived, and stored in perpetuity as a
photographic record of the flight. This feature permits a multitude of qualitative and
quantitative analyses to be conducted in the future, especially temporal-based
assessments of alterations that may be attributed to global climate change, natural
disaster impacts, or other salient events in natural resources and environmental
disciplines. Unlike traditional visual observer manned aerial surveys where
identification and enumeration of targets must be conducted immediately and quickly
from the air as the aircraft makes transects over, or circumnavigates a target area,

93
sUAS-collected raw data can be analyzed at any occasion after a flight concludes.
Typical visual observer aerial surveys do not afford much time for observers to resolve
potential doubts or reassess many areas while a flight is in progress, whereas sUAS
data can be examined repeatedly.
Rare or difficult to identify targets are photographically documented and can be
evaluated by numerous subject matter experts for their opinions, and sUAS data sets
can be reanalyzed repeatedly into the future; benefits that are especially valuable as
new computer software for imagery post-processing emerges, innovative computer-
based feature recognition algorithms become available, and as statisticians develop
novel methods to assist researchers in moving from typically providing counts of focal
targets to generating estimates having testable bounds. If questions arise about the
estimates of target items generated from a sUAS flight, digital imagery of the target area
can be provided to help justify the reported results, rather than merely providing a stack
of paper data sheets containing a series of tick marks, which may be wrought with
errors.
Using increasingly sophisticated computer software which is progressively more
prolific and affordable, directly-georeferenced two-dimensional (2D) imagery can be
post-processed using ‘Structure-from-Motion’ (SfM) procedures into three-dimensional
(3D) point clouds, DEMs, seamless orthophotomosaics, or other output types,
permitting analyses that were historically both time- and labor-intensive to now be
conducted relatively quickly and with improved precision. Utilizing the same software,
portions of larger orthophotomosaic scenes can be cut into smaller sampling areas with
known dimensions, which allow detectable target density calculations, and other

94
computational inferences to be conducted with a level of accuracy that is potentially
superior to those constructed strictly from visual observers in manned aerial surveys.
The count data accumulated from multiple observers of orthophotomosaics can later be
used as input for more powerful statistical analyses to generate target item estimates
having testable limits. Additionally, biases associated with multiple observers, imperfect
detection, heterogeneity, timing, and other inherent limitations of aerial surveying can be
accounted for and included as covariates in statistical analyses.
It is important to emphasize that seamless orthophotomosaics are not
necessarily the only or required product of all aerial imagery data collection efforts using
a sUAS. A myriad of applications exist where smaller sampling units within post-
processed raw imagery can provide appropriate data needed to use a number of
powerful statistical techniques. Therefore using directly-georeferenced imagery
collected with a calibrated sUAS has the potential to improve the accuracy of the
answers to the oft-asked questions: “How many are there?” or “How much is there?”
Although some will argue that sUAS have matured enough for routine scientific
use, there is still much to be learned and disseminated about appropriate use of sUAS
as a tool for scientific data collection. For example, selection and availability of an
effective sensor and airframe combination, based on the scientific question at hand
seems to be a relatively straightforward process on the surface. However, suitably
making these decisions is often underemphasized. There is still research that needs to
be done, especially since sUAS and their payloads have fostered new methodologies
for data collection, and enabled modifications of existing techniques for studies using
aerial surveys with greater efficiency, safety, and accuracy.

95
Figure 3-1. A colony of American White Pelicans (Pelecanus erythrorhynchos) nesting
on Pelican Island, Minidoka National Wildlife Refuge, Cassia County, Idaho, USA. This image was taken from the southern shore of Minidoka Reservoir on 8 July 2011 during a preliminary site reconnaissance visit for potentially flying a small unmanned aircraft system over the colony to generate an estimate of the number of nesting pelicans. Double-crested Cormorant (Phalacrocorax auritus) and gulls (Larus sp.) are also seen using the spoil island.
M.A. Burgess
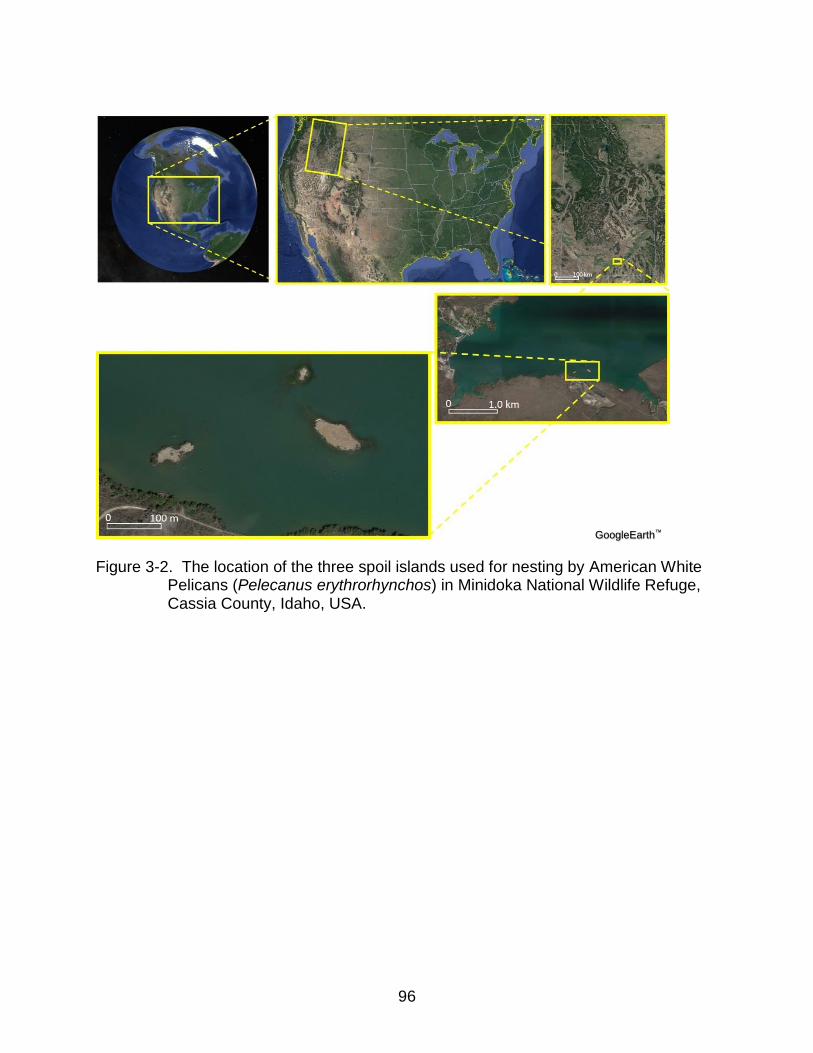
96
Figure 3-2. The location of the three spoil islands used for nesting by American White
Pelicans (Pelecanus erythrorhynchos) in Minidoka National Wildlife Refuge, Cassia County, Idaho, USA.
GoogleEarth™
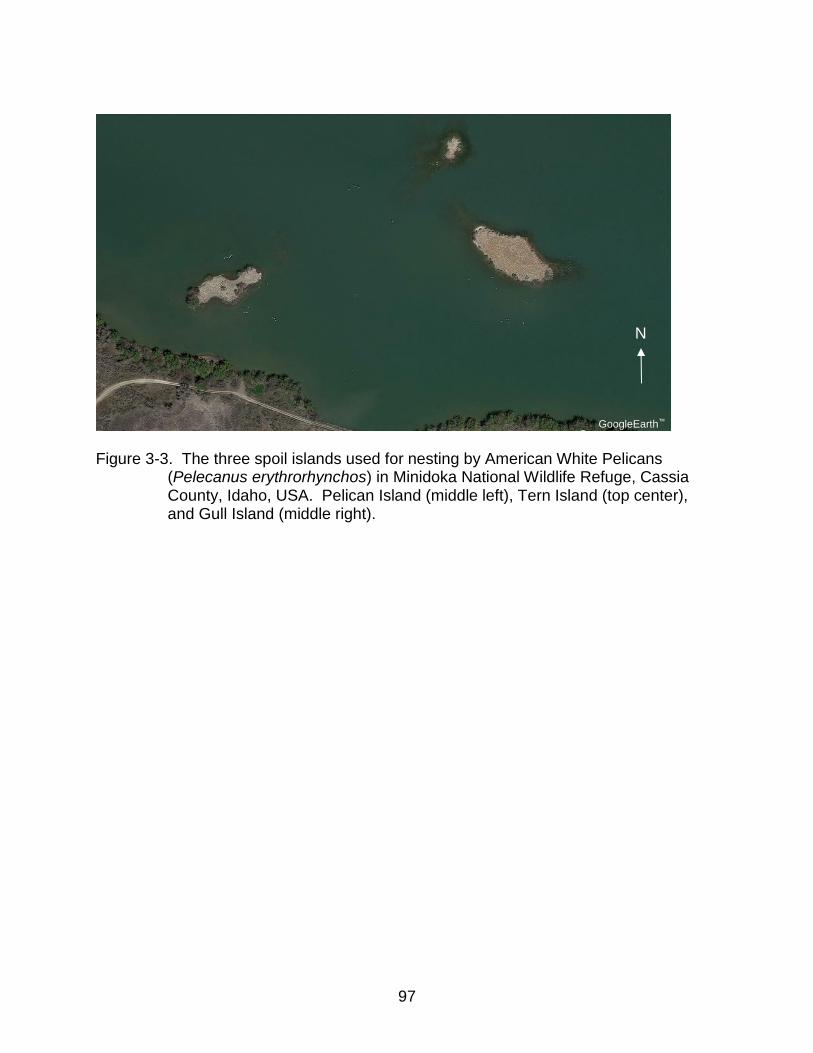
97
Figure 3-3. The three spoil islands used for nesting by American White Pelicans
(Pelecanus erythrorhynchos) in Minidoka National Wildlife Refuge, Cassia County, Idaho, USA. Pelican Island (middle left), Tern Island (top center), and Gull Island (middle right).
GoogleEarth™
N

98
Figure 3-4. The Virtual Cockpit™ preplanned flight path designed for autonomous
waypoint navigation by the University of Florida Nova 2.1 small unmanned aircraft system over the three spoil islands used for nesting by American White Pelicans (Pelecanus erythrorhynchos) on 10 June 2014 in Minidoka National Wildlife Refuge, Cassia County, Idaho, USA. Ambient wind direction was from the west, so upwind passes over the target islands from right to left (increasing waypoint numbers) were arranged. The flight line spacing between parallel transects north to south was 30.0 m based on the parameters of the optical payload, the commanded flight altitude, and the calculated ground speed projection for the aircraft. All flight operations were conducted from a boat idling approximately 20.0 m south of the ‘L’ landing waypoint at the top-center of the image. The ‘T’ waypoint at the top-left is the location for which the aircraft loitered about after the hand-launch takeoff from the stationary boat. The ‘R’ rally waypoint located at the top-right is the location where the aircraft performed a controlled descent spiral from its’ flight altitude to 40.0 m above ground (water) level before proceeding along the landing glideslope line connecting ‘R’ to ‘L’ for an amphibious landing.
Virtual Cockpit™
N

99
A B
C D Figure 3-5. Examples of American White Pelican (Pelecanus erythrorhynchos) nesting
locations on spoil islands in Minidoka National Wildlife Refuge, Cassia County, Idaho, USA. Images are from orthophotomosaics generated with imagery and metadata collected from a small unmanned aircraft system flown over the islands on 10 June 2014. A) Pelicans nesting in open areas present very few detection issues. B) Nesting adjacent to rocks covered in white feces can affect pelican detection. C) Nesting under trees or dense vegetation influences detection of pelicans. D) Nesting under Double-crested Cormorant (Phalacrocorax auritus) nests or roosts complicates ground-nesting pelican detection.
M.A. Burgess
M.A. Burgess M.A. Burgess
M.A. Burgess

100
Figure 3-6. Swirls that result from mosaicking still imagery of herbaceous vegetation
blown around by ambient winds. Imagery and metadata were collected 10 June 2014 using a small unmanned aircraft system and its optical payload flown over Pelican Island, Minidoka National Wildlife Refuge, Cassia County, Idaho, USA.
M.A. Burgess

101
A
B
C Figure 3-7. Exaggerating the elevations of a digital elevation model in attempt to
highlight ground-nesting American White Pelicans (Pelecanus erythrorhynchos) on Gull Island, Minidoka National Wildlife Refuge, Cassia County, Idaho, USA. A) Native digital elevation model showing the true elevations without exaggeration. B) Elevations exaggerated by a factor of 5.0 times the true elevation. C) Elevations exaggerated by a factor of 10.0 times the true elevation.
Quick Terrain Reader™
Quick Terrain Reader™
Quick Terrain Reader™
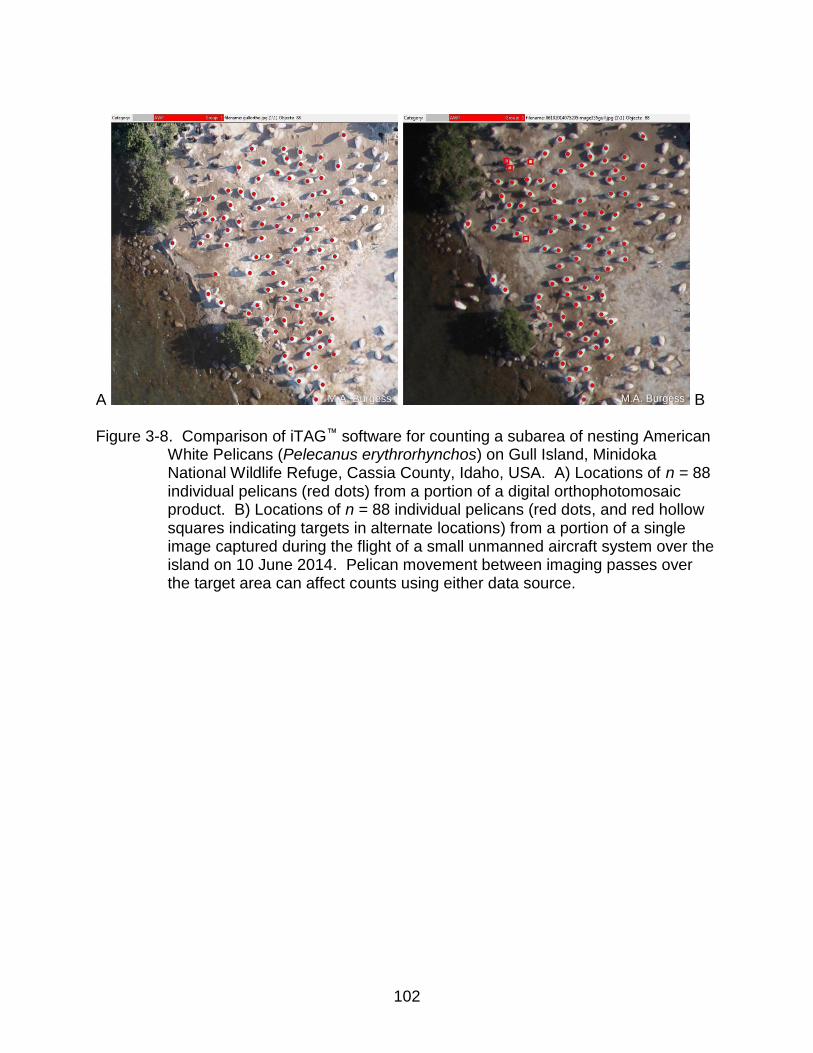
102
A B Figure 3-8. Comparison of iTAG™ software for counting a subarea of nesting American
White Pelicans (Pelecanus erythrorhynchos) on Gull Island, Minidoka National Wildlife Refuge, Cassia County, Idaho, USA. A) Locations of n = 88 individual pelicans (red dots) from a portion of a digital orthophotomosaic product. B) Locations of n = 88 individual pelicans (red dots, and red hollow squares indicating targets in alternate locations) from a portion of a single image captured during the flight of a small unmanned aircraft system over the island on 10 June 2014. Pelican movement between imaging passes over the target area can affect counts using either data source.
M.A. Burgess M.A. Burgess
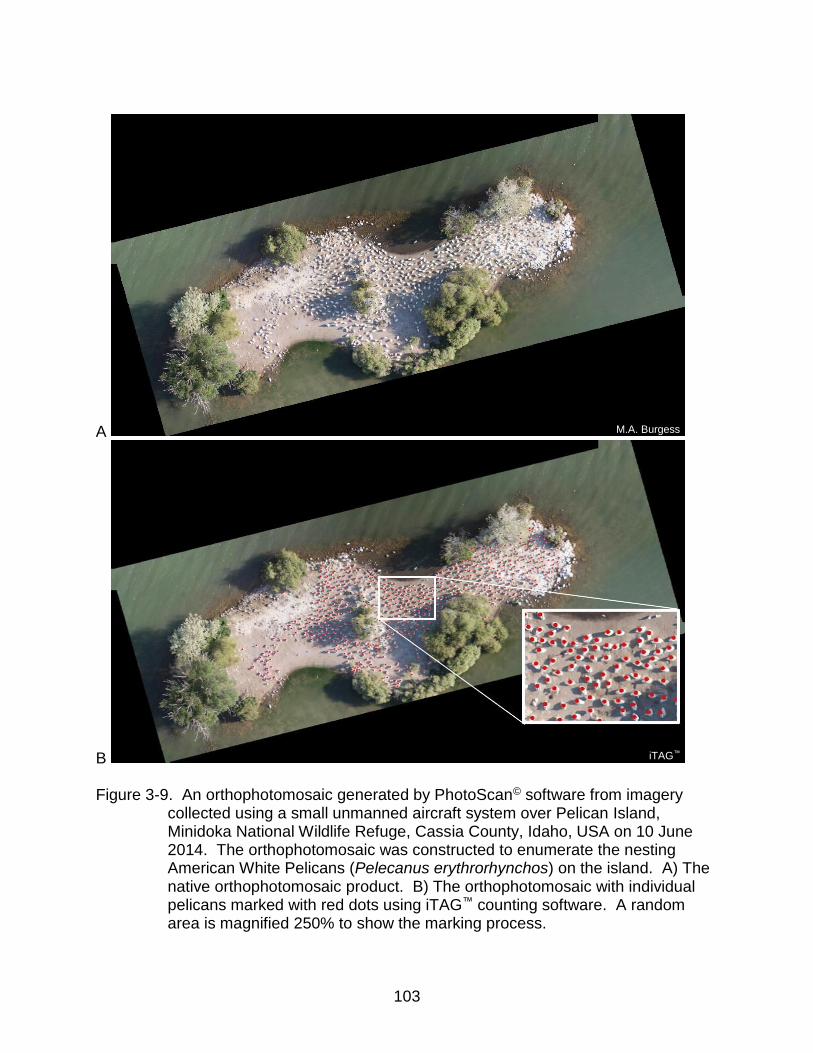
103
A
B Figure 3-9. An orthophotomosaic generated by PhotoScan© software from imagery
collected using a small unmanned aircraft system over Pelican Island, Minidoka National Wildlife Refuge, Cassia County, Idaho, USA on 10 June 2014. The orthophotomosaic was constructed to enumerate the nesting American White Pelicans (Pelecanus erythrorhynchos) on the island. A) The native orthophotomosaic product. B) The orthophotomosaic with individual pelicans marked with red dots using iTAG™ counting software. A random area is magnified 250% to show the marking process.
M.A. Burgess
iTAG™

104
A B Figure 3-10. An orthophotomosaic generated by PhotoScan© software from imagery
collected using a small unmanned aircraft system over Tern Island, Minidoka National Wildlife Refuge, Cassia County, Idaho, USA on 10 June 2014. The orthophotomosaic was constructed to enumerate the nesting American White Pelicans (Pelecanus erythrorhynchos) on the island. Distinguishing pelicans from large rocks coated in white feces can present challenges. A) The native orthophotomosaic product. B) The orthophotomosaic with individual pelicans marked with red dots using iTAG™ counting software. A random area is magnified 125% to show the marking process.
M.A. Burgess iTAG™

105
A
B Figure 3-11. An orthophotomosaic generated by PhotoScan© software from imagery
collected using a small unmanned aircraft system over Gull Island, Minidoka National Wildlife Refuge, Cassia County, Idaho, USA on 10 June 2014. The orthophotomosaic was constructed to enumerate the nesting American White Pelicans (Pelecanus erythrorhynchos) on the island. A) The native orthophotomosaic product. B) The orthophotomosaic with individual pelicans marked with red dots using iTAG™ counting software. A random area is magnified 300% to show the marking process.
M.A. Burgess
iTAG™

106
Figure 3-12. Frequency histogram of observed number of American White Pelicans
(Pelecanus erythrorhynchos) on Pelican Island, in Minidoka National Wildlife Refuge, Cassia County, Idaho, USA. Visual counts ( = 571.5, SE = 1.20)
were made using iTAG™ software of a digital orthophotomosaic of the island constructed from imagery collected with a small unmanned aircraft flown on 10 June 2014. Crowdsourced volunteers (n = 30) with an unknown ornithology, aerial observation, or focal object identification history generated the pelican count data.
0
1
2
3
45
58
559
560
561
562
563
564
565
566
567
568
569
570
571
572
573
574
575
576
577
578
579
580
581
582
Fre
qu
en
cy
Observed Number of Pelicans
x
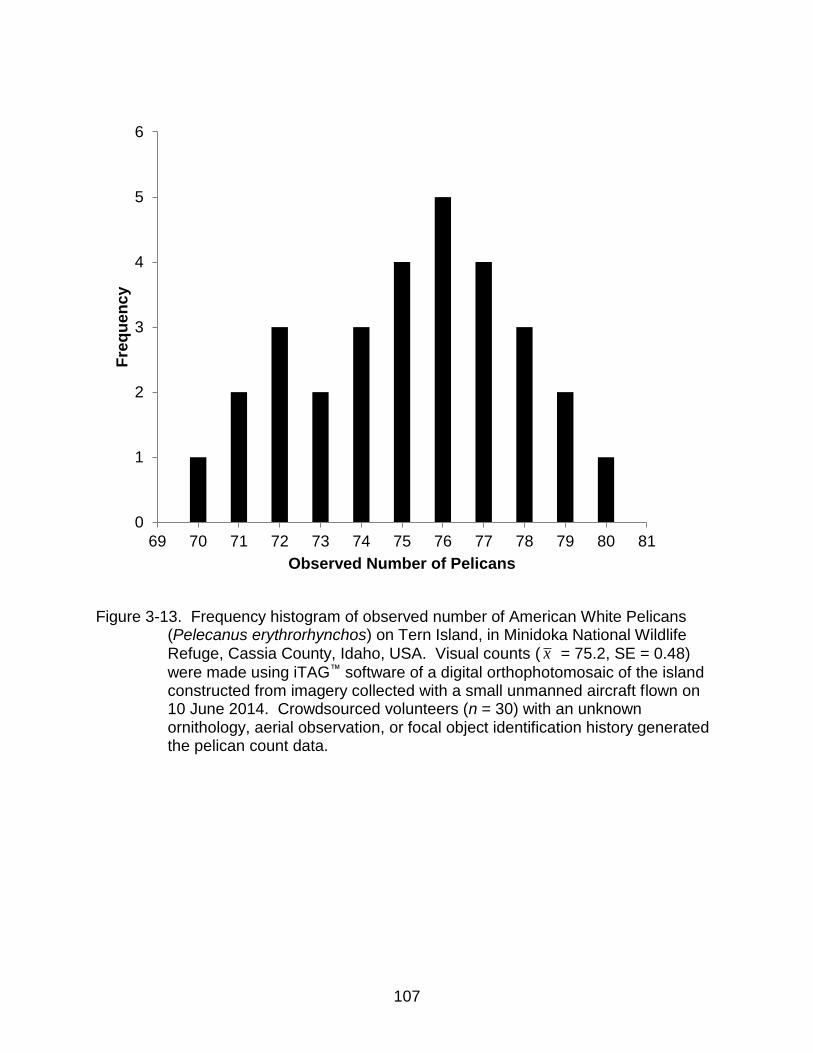
107
Figure 3-13. Frequency histogram of observed number of American White Pelicans
(Pelecanus erythrorhynchos) on Tern Island, in Minidoka National Wildlife Refuge, Cassia County, Idaho, USA. Visual counts ( = 75.2, SE = 0.48)
were made using iTAG™ software of a digital orthophotomosaic of the island constructed from imagery collected with a small unmanned aircraft flown on 10 June 2014. Crowdsourced volunteers (n = 30) with an unknown ornithology, aerial observation, or focal object identification history generated the pelican count data.
0
1
2
3
4
5
6
69 70 71 72 73 74 75 76 77 78 79 80 81
Fre
qu
en
cy
Observed Number of Pelicans
x
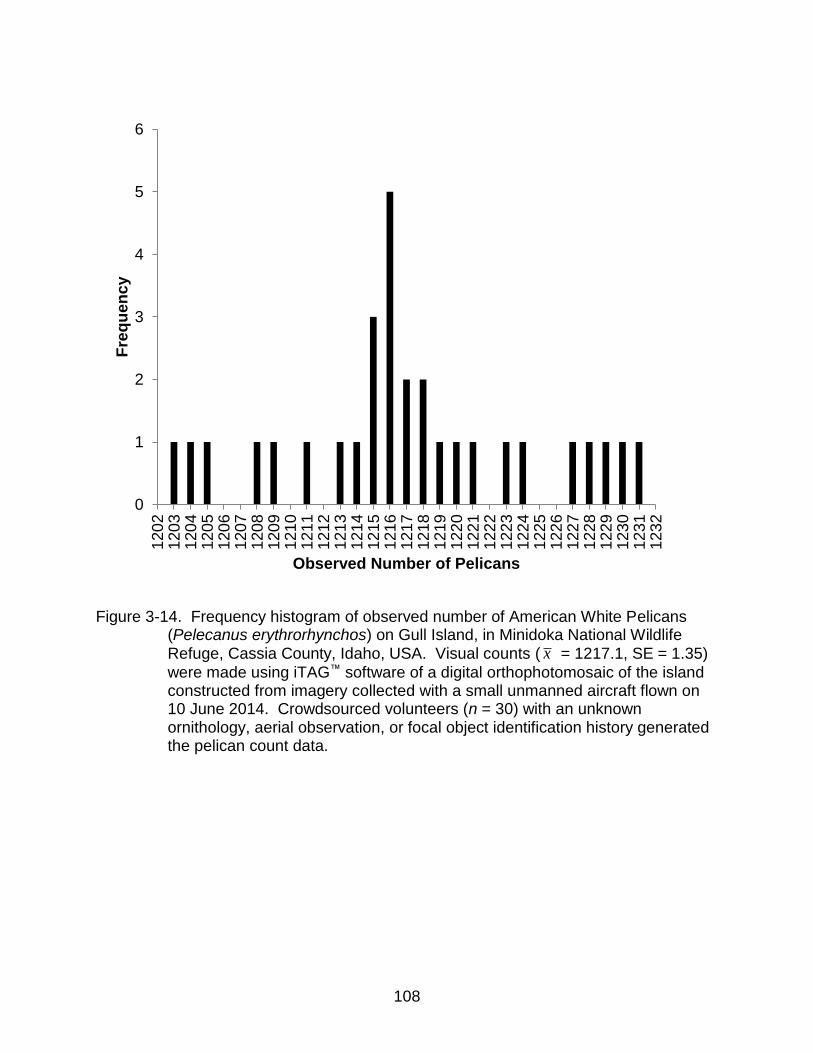
108
Figure 3-14. Frequency histogram of observed number of American White Pelicans
(Pelecanus erythrorhynchos) on Gull Island, in Minidoka National Wildlife Refuge, Cassia County, Idaho, USA. Visual counts ( = 1217.1, SE = 1.35)
were made using iTAG™ software of a digital orthophotomosaic of the island constructed from imagery collected with a small unmanned aircraft flown on 10 June 2014. Crowdsourced volunteers (n = 30) with an unknown ornithology, aerial observation, or focal object identification history generated the pelican count data.
0
1
2
3
4
5
6
120
21
20
31
20
41
20
51
20
61
20
71
20
81
20
91
21
01
21
11
21
21
21
31
21
41
21
51
21
61
21
71
21
81
21
91
22
01
22
11
22
21
22
31
22
41
22
51
22
61
22
71
22
81
22
91
23
01
23
11
23
2
Fre
qu
en
cy
Observed Number of Pelicans
x
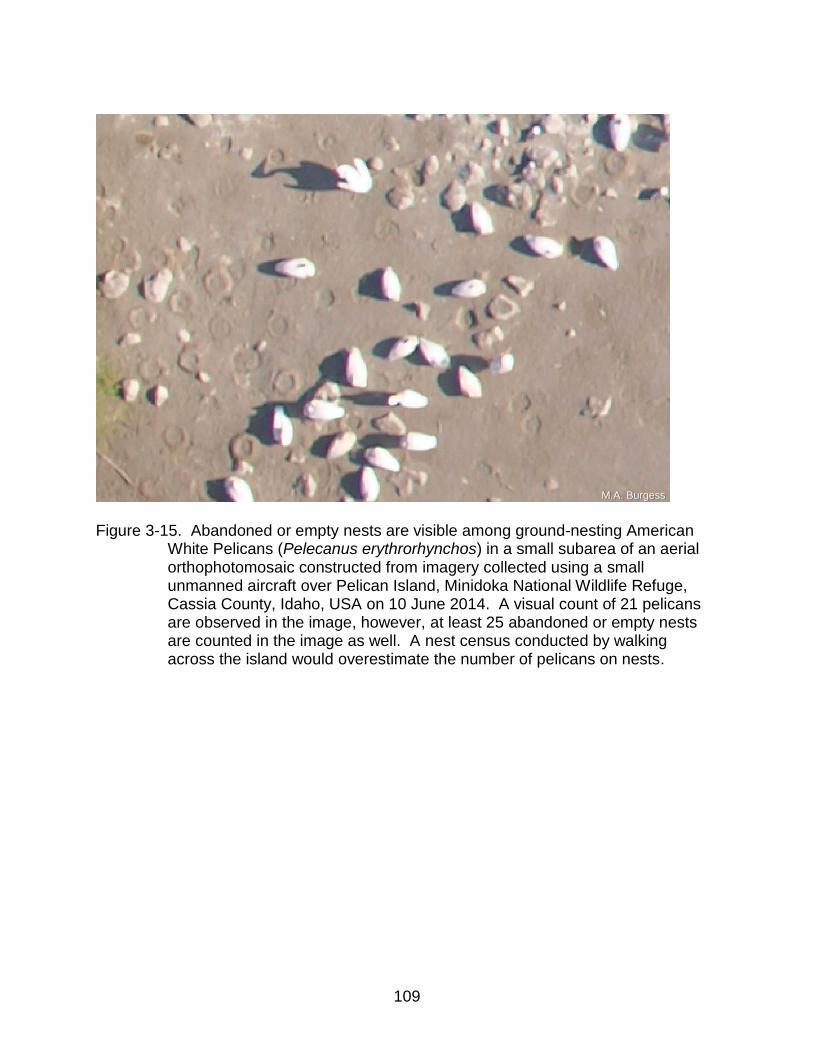
109
Figure 3-15. Abandoned or empty nests are visible among ground-nesting American
White Pelicans (Pelecanus erythrorhynchos) in a small subarea of an aerial orthophotomosaic constructed from imagery collected using a small unmanned aircraft over Pelican Island, Minidoka National Wildlife Refuge, Cassia County, Idaho, USA on 10 June 2014. A visual count of 21 pelicans are observed in the image, however, at least 25 abandoned or empty nests are counted in the image as well. A nest census conducted by walking across the island would overestimate the number of pelicans on nests.
M.A. Burgess
110
CHAPTER 4 AN INNOVATIVE DATA COLLECTION APPROACH FOR MANNED AERIAL
SURVEYS USING OPTICAL PAYLOADS DESIGNED FOR SMALL UNMANNED AIRCRAFT SYSTEMS
One of the most often asked questions of natural resource and environmental
professionals is “How many are there?” or “How much is there?” which for example
could refer to the population size of some specific flora or fauna, or to the extent of
some habitat type. The answers provided by experts are critical and often influence
resource management decisions. Anderson (2001) indicates, data collection
methodologies are not trivial, and statistically valid estimates must account for many
sources of error, e.g., detection probability, observer bias, timing of data collection, etc.
An aerial perspective of natural resource targets of interest can reveal important
features which may be challenging or unattainable using ground-based data collection
methods alone. From a historical standpoint, gathering remotely sensed information
from an aerial perspective precedes manned flight by quite some time (Verhoeven
2009, Colomina and Molina 2014).
Since 1900, both photography and aviation have advanced tremendously. Black-
and-white film still frame photographs requiring darkroom development have progressed
to high-resolution digital sensors recording visible color (RGB) and other wavelengths to
electronic storage media capable of immediate viewing (Verhoeven 2010). Aircraft
design, construction methods and materials, propulsion systems, and aircraft reliability
have similarly evolved with facilitating science and technology (Crouch 2004). By the
end of World War II, aerial imagery taken from manned aircraft for mapping,
intelligence, surveillance, and reconnaissance (ISR) purposes were a primary
application of flight (Wolf et al. 2014). Now, orbiting satellites capture and transmit
111
remotely sensed imagery and data, and enable three-dimensional (3D) positional
determination and advanced navigational capabilities through global positioning
systems (GPS) and inertial navigation systems (INS) (Kuenzer and Dech 2013, Finkl
and Makowski 2014, Wolf et al. 2014).
Within the last decade, exponential growth in civilian-based small unmanned
aircraft systems (sUAS), their sensor payloads, and applications, have occurred from
technology initially developed for military purposes. As costs have decreased for sUAS,
their availability has increased; yet in the United States (US), Federal Aviation
Administration (FAA) regulations integrating sUAS into the National Airspace System
(NAS) lagged behind the technology impeding routine sUAS flight (e.g., Rango and
Laliberte 2010, Watts et al. 2010, Hardin and Jensen 2011, Elias 2016). As the number
of sUAS flights has increased worldwide, the use of sUAS as a tool for collecting high-
resolution aerial imagery has opened countless new doors for obtaining aerial imagery
of focal targets (Richards 2013).
Nearly all sUAS are equipped with an autopilot unit capable of making numerous
simultaneous flight adjustments per second, maintaining altitude, airspeed, and course
(Christiansen 2004, Linchant et al. 2015). Existing methods of aerial surveying and
monitoring of natural resource targets using visual observers from manned aircraft are
primarily accomplished at slow-airspeeds and low-altitudes in fixed- or rotary-wing
aircraft which generally lack cost-prohibitive autopilot units. Consequently, the reliance
on pilot skill and experience in conducting prolonged slow and low flight is paramount
for the safety and success of such missions. Sasse (2003) reported aviation accidents
were the most prevalent form of on-the-job mortality for wildlife biologists. The safety

112
benefit that sUAS offer as an aerial data collection tool is just one reason that interests
in civilian-based uses of sUAS technology have flourished. However, sUAS are not
necessarily a solution for all aerial data collection activities in natural resources. In fact,
fielding sUAS may be more expensive or even impractical than using manned aircraft
for aerial data collection due to logistics, costs, and regulations that accompany sUAS
operations.
The use of sUAS can assist in data collection for certain applications, but not all.
For example, when: 1) extreme weather events occur; 2) field sites are separated by
significant geographic distances; 3) focal targets encompass large landscapes; 4)
operational field sites are difficult to access by ground- or water-based transportation
methods; or 5) field sites are located in areas prohibited to sUAS flight; each of these
situations can render sUAS data collection methods impossible, impractical, or illegal.
Capitalizing on advantages that sUAS payloads offer, the following objectives are
addressed herein: 1) determine the legality of attachment of a small external sensor pod
(ESP) containing affordable high-resolution digital camera payloads designed for sUAS
to manned aircraft commonly used in natural resource-based applications; 2) determine
if sufficient imagery resolution could be obtained from optical payloads in ESP-equipped
manned aircraft safely flying at slow-airspeeds and low-altitudes; and 3) determine if
imagery and metadata collected from payloads contained within ESPs can be post-
processed into orthogeorectified imagery products.
This chapter highlights two ESP applications: 1) identification and enumeration of
sea turtle nesting crawls along a 21.0 kilometer (km) stretch of the Archie Carr National
Wildlife Refuge (ACNWR) on the Atlantic coastline of central Florida in which existing

113
FAA regulations would not permit use of sUAS because of proximity to housing, people
on the beach, and a nearby airport, and logistically collecting imagery of an area of such
size in a short amount of time was impractical with a sUAS; and 2) developing methods
for maximizing the efficiency of ESP flights over several different vegetation-based
targets in Water Conservation Area (WCA)-2A of the Everglades in south Florida where
use of sUAS was impractical owing to distances between plots, and illegal at the time
due to existing FAA regulations surrounding Miami International Airport (KMIA).
Study Areas
Archie Carr National Wildlife Refuge
The imagery and metadata collection for the first part of this study were
conducted over a stretch Atlantic Ocean coastline that is located south of Melbourne
Beach, in southern Brevard County, Florida, USA (Figure 4-1). A 21.0 km portion of
beach that began at the northern limits of the ACNWR (WGS84 Datum: 28.039419°
North; −80.543389° West), and terminated approximately (≈) 1.0 km north of Sebastian
Inlet (WGS84 Datum: 27.861850° North; −80.446855° West) was the focal area of study
(Figure 4-2). The University of Central Florida (UCF) marine turtle research group
marked the 21.0 km stretch of beach every 0.1 km with wooden stakes in the dunes
starting at the northern end of ACNWR and proceeding south to Sebastian Inlet to
provide general turtle crawl locations along the focal survey area. The white sandy
beaches found along the coastline in this part of Florida are characteristic of the high-
energy near-shore coastal systems found along many parts of the eastern coast of
Florida, and are preferred nesting habitat for three species of sea turtles: leatherback
(Dermochelys coriacea), loggerhead (Caretta caretta), and green turtles (Chelonia
114
mydas). Female sea turtles show high site fidelity for nesting beaches, lay several
clutches per season, and nest every 2–3 years (Weishampel et al. 2003).
The ACNWR has an elevation of ≤ 2.0 meters (m) above sea level (ASL)
depending on the location, and National Oceanic and Atmospheric Administration
(NOAA) climatology data for the locality classified it as subtropical with an average
annual precipitation total of 126.0 centimeters (cm) per year (NOAA 2016). Historical
data showed that for the month of June, average daily air temperatures ranged from
22.3–31.4° Celsius (C), and rainfall was frequent, while in the month of December,
average daily air temperatures ranged from 12.1–22.9° C, and rainfall was irregular
(NOAA 2016).
Water Conservation Area-2A
Imagery and metadata collection for the second part of this study were
conducted over several specific experimental and control plots located within
northeastern WCA-2A in the Greater Florida Everglades, incorporating the southern
Palm Beach and northern Broward County line, Florida, USA (Figure 4-3). Located 4.0
km west of Parkland, Florida, and 4.0 km south-southwest of the L-39 Levee/Hillsboro
Canal, the primary focal area where these experimental rehabilitation efforts are
occurring lies within an region that occupies a rectangular area of 6.0 × 3.25 km [≈
2,000 hectares (ha)] that extends southwesterly. An additional 200 ha region that is
also part of the study is located southwest of the primary focal area (WGS84 Datum:
26.326737° North; −80.369351° West).
In the mid-2000s, the South Florida Water Management District (SFWMD)
established a series of six 250 × 250 m Cattail Habitat Improvement Project (CHIP)
experimental plots and adjacent controls in WCA-2A. Various treatments were used to
115
clear the experimental CHIP plots of dense cattail (Typha domingensis) vegetation
including herbicides, prescribed fire, and manual vegetation removal. The experimental
plots are tests of management practices to control dense cattail establishment resulting
from anthropogenic alterations upstream of WCA-2A.
The CHIP treatment plots and their adjacent controls are located in two groups of
three for replication purposes. The northernmost group of three plots are termed ‘E’ for
‘Enriched’ having soil total phosphorous levels ≥ 1,000 milligrams per kilogram (mg/kg).
The middle group of three are termed ‘T’ for ‘Transitional’ having soil total phosphorous
levels 401–999 mg/kg. The southernmost group of control-only plots are termed ‘U’ for
‘Unenriched’ having soil total phosphorous level 200–400 mg/kg (Newman 2016). Also
created in the primary focal area were a pair of larger Active Marsh Improvement (AMI)
plots having dimensions of 500 × 750 m. The AMI plots were also cleared of vegetation
to evaluate changes in ruderal community composition and spatial hydrological effects
for comparison to the smaller experimental ‘E’ and ‘T’ treatment plots over time (Figure
4-4).
The WCA-2A CHIP plots are inundated during ‘normal’ water levels having both
submerged and emergent wetland vegetation, possess an elevation of ≤ 6.0 m ASL,
and NOAA climatology data for the locality classified it as subtropical with an average
annual precipitation total of 145.5 cm per year (NOAA 2016). Historical data showed
that for the month of June, average daily air temperatures ranged from 23.2–32.7° C,
and rainfall was frequent, while in the month of December, average daily air
temperatures ranged from 16.3–26.1° C, and rainfall was fairly infrequent (NOAA 2016).

116
Methods
The initial ESP design was a box constructed from folded and riveted sheet
aluminum with a hole cut in the bottom over which the optical payload lens was
positioned (Figure 4-5). The maiden ESP flights were conducted to examine the
resultant imagery for effects from aircraft engine vibrations, ambient airflow buffeting,
and to inspect the imagery metadata files for interference potentially generated by the
manned aircraft engine, electrical, or communication systems. These proof-of-concept
flights of the initial ESP design provided important information revealing that the ESP
methodology was viable, and with refinements warranted further exploration.
A second-generation ESP design possessing a larger internal volume to facilitate
simultaneous use of multiple payload systems was created using computer-aided
design (CAD). The CAD diagrams served as input files to mill sheets of thicker
aluminum alloy into ESP structural components via computer numerical control
methods. The resulting second-generation ESP was assembled with FAA-approved
hardware, and provided capacity for two complete optical payloads, a single lithium
polymer (LiPo) system battery, and the ability to host alternative payloads as technology
allowed (Figure 4-6).
To improve the success of obtaining imagery of the focal targets below the ESP
affixed to a manned aircraft, a nadir-oriented GoPro® Hero™ video camera was added to
the second-generation ESP payload in early 2014 (which was after the flights over
ACNWR, but before the WCA-2A flights), which transmitted a wireless stream of RGB
video to an Apple® device inside the manned aircraft providing a situational awareness
view of what the nadir-oriented still frame sensors in the ESP were capturing. Used
primarily for ensuring that the focal targets of interest were located within the field-of-
117
view of the still imagery being collected by the digital single-lens reflex (dSLR) sensors
in the ESP, the GoPro® video was ultimately a useful aid for future ESP flights.
In early spring 2015, a third-generation ESP design having an even more
voluminous capacity for payloads was built out of aluminum alloy and assembled with
high-strength welded seams for a reduction in ESP hardware and improved water
resistance. A 3D-printed tapered nosecone was designed and attached to help make
the entire third-generation ESP more aerodynamic (Figure 4-7). The design of the third-
generation ESP incorporated details such as: 1) an identical aircraft mounting bolt
configuration as the second-generation ESP; 2) a compressible neoprene watertight
seal between the ESP body and lid; 3) a sizeable glass pane on its ventral surface over
which optical sensors could be arranged in countless nadir configurations; and 4)
features that simplified accessibility to the pod contents while the unit was affixed to an
aircraft. This pod was the heaviest of the ESP models, and therefore was best suited
for operations aboard rotary-wing aircraft having a wide entry/exit step mounting surface
area to distribute the additional mass. The data collection flights for this dissertation
chapter had been completed before the third-generation pod was put into service, and it
has only been affixed to a SFWMD rotary-wing aircraft through 2017 (Figure 4-8).
Data collection flights for both parts of this dissertation chapter utilized the
second-generation ESP outfitted with an commercial-off-the-shelf (COTS) Olympus® E-
420™ optical payload system (detailed in Appendix A) that was designed by the
University of Florida Unmanned Aircraft Systems Research Program (UFUASRP) for
use primarily in the UF Nova 2.1 sUAS (also detailed in Appendix A). The data
collection for the ACNWR sea turtle nesting crawl surveys was initially proposed to be

118
conducted with the UF Nova 2.1 sUAS over a smaller portion of the ACNWR; however,
the FAA was reluctant to issue a Certificate of Waiver or Authorization (COA) for the
proposed low-altitude sUAS flights due to: 1) the proximity of the study site to housing
along the beach; 2) potential gathering of onlookers on the beach to observe the sUAS
flight transects; and 3) the vicinity of the Melbourne International Airport (KMLB) to the
study site.
With the FAA hesitant to issue a COA, and the window of opportunity to capture
aerial imagery of sea turtle nesting crawls during 2013 coming to a close, data collection
for the sea turtle nesting survey over ACNWR were conducted using an ESP attached
to a Cessna® 172M Skyhawk™ fixed-wing aircraft on 23 July 2013 from the Valkaria
Airport in Valkaria, Florida. The flight took off at 0627 hours (shortly after civil twilight)
and began beach transects at 0631 hours. Four complete transects of the 21.0 km of
beach were imaged, and four partial passes of concentrated areas within the 21.0 km
stretch were also imaged by 0801 hours. By this time, human foot traffic on the beach
was picking up, and nesting tracks left in the sand by sea turtles were beginning to be
inadvertently disturbed by the human traffic. The aircraft landed safely back at Valkaria
Airport a short time later. Average altitude of the beach survey transects was 196.9 m
ASL, with an average ground speed of 35.8 meters per second (m/sec).
Flights for the AMI and CHIP plots in WCA-2A took place 13–15 August 2014
with the ESP affixed to a SFWMD-Aviation Unit Bell® 407 helicopter based out of West
Palm Beach International Airport (KPBI). On 13 August, the aircraft departed KPBI at
0906 hours, and conducted imagery transects over both AMI and all primary focal area
CHIP plots and their controls. The three ‘E’ plots and the ‘T1’ plot were all imaged with
119
four horizontal (east to west, or west to east) transects each, ‘T2’ was imaged with five
transects, ‘T3’ imaged with six transects, and both AMI plots were imaged with 12
transects each. A single pass over the three ‘U’ plots was made just for reference only.
The aircraft arrived back at KPBI at 1122 hours, collecting 2,271 images total, with an
average altitude of 203.1 m ASL, and an average ground speed of 21.2 m/sec.
The following morning, 14 August 2014, the aircraft departed KPBI at 0844
hours, and conducted imagery transects over all of the CHIP plots and their controls.
The three ‘E’ plots, ‘T1’, ‘T3’, and ‘U1’ were all imaged with six horizontal transects
each, and plots ‘T2’, ‘U2’, and ‘U3’ were all imaged with eight horizontal transects each.
The aircraft arrived safely back at KPBI at 1042 hours, collecting 2,026 images total,
with an average altitude of 194.7 m ASL, and an average ground speed of 19.6 m/sec.
On 15 August, the SFWMD Bell® 407 helicopter with ESP attached departed
KPBI at 0839 hours, and conducted vertical (north to south or south to north) transects
over the two AMI plots and CHIP plot ‘T1’ and its’ control. Nine transects were made
over AMI East and 11 transects were made over AMI West and CHIP plot ‘T1’. Seven
horizontal transects were made over CHIP plot ‘E3’ and its’ control before the flight
arrived back at KPBI at 1039 hours, collecting 1,505 total images, with an average
altitude of 200.3 m ASL, and an average ground speed of 21.9 m/sec.
Data post-processing for both parts of this study were conducted using the
methodology delineated in Appendix D. The July 2013 flight over the 21.0 km focal
stretch of ACNWR beach for sea turtle nesting crawl survey was broken down into
smaller and manageable chunks (each chunk ≈ 0.5 km in length) for areas that had the
most imagery overlap occurring over the sandy beach focal target area. Similarly, each
120
of the primary focal CHIP experimental and its’ adjacent control plots were post-
processed individually by pooling imagery collected during the three consecutive
morning flights conducted with the second-generation ESP affixed to a SFWMD Bell®
407 helicopter, and the AMI plots were processed independently with imagery amassed
from the days in which those plots were included as focal target areas.
Results
Since the inaugural ESP flight test in December 2009, > 40 total ESP flights have
been conducted. The second-generation ESP design has been the workhorse for
testing natural resource-based applications of the methodology, ESP flight planning
procedures, novel payload testing, and mission execution techniques. The engineering
of the second-generation ESP and its mounting configuration incorporated details which
necessitated only slight modifications to an existing external component of the manned
aircraft by an FAA-authorized mechanic, e.g.: drilling several small holes for mounting
bolt attachment into a fueling, inspection, or entry/exit step, etc. Once the ESP was
affixed on an individual airframe, an FAA field approval for the airframe modification
could then be requested. The second-generation ESP design has received FAA
authorization as an approved aircraft modification when affixed to five separate manned
airframes: two Cessna® 172 fixed-wing aircraft, a Bell® 206 and a pair of Bell® 407
rotary-wing aircraft (Figure 4-9).
For the sea turtle nesting crawl survey flight over ACNWR, successful generation
of imagery post-products for portions of the 21.0 km target area that were able to be
aligned and composed into orthophotomosaics were indications that suitable flight
parameters were indeed able to be attained (Figure 4-10). As mentioned, the sea turtle
nesting flight was accomplished before a GoPro® Hero™ video camera was added to the

121
ESP payload to provide a situational awareness view in the cockpit of what the nadir-
oriented still frame sensor in the ESP was capturing. Although the manned pilot and co-
pilot tried their very best to keep the ESP over the target area of sandy beach from the
waterline to the base of the sand dunes, portions of the parallel flight transects recorded
imagery over the surf zone, or locations west of the dunes which hindered the
construction of a single seamless orthophotomosaic of the 21.0 km of sandy beach
(Figure 4-11). The ability to distinguish fresh sea turtle crawls along the beach from
older crawls that had been traversed by an all-terrain vehicle (ATV) indicating that the
crawl had been previously counted the day before (or even earlier) was also used a
measure of success (Figure 4-12). In Figure 4-12, the narrower crawl with an
alternating gait was deposited by a loggerhead, while a green turtle left the other crawl
with a noticeable tail drag. Further classifying each fresh sea turtle crawl as a
successful nesting or a false nesting crawl was another form of ESP evaluation used in
this study (Figure 4-13). In Figure 4-13, the top crawl pattern was a false nesting crawl
by a green turtle, and the other crawl was a successful nesting crawl by another green
turtle. Determination of individual sea turtle species as revealed by the crawl deposited
in the sand was utilized as a final assessment of the ESP methodology for this specific
application (Figure 4-14). As indicated in the previous two figures and in Figure 4-14
which shows two fresh successful nesting crawls by green turtles, sea turtle species
identification via crawl examination was straightforward using the imagery collected with
the ESP technique.
For the ESP flights over the CHIP and AMI vegetation plots, the primary analysis
was to post-process each experimental plot individually, and identify the plots that were
122
able to produce nearly complete and seamless orthophotomosaics as indicators that
adequate flight parameters and ESP flight methodologies were achieved for this specific
application (Figure 4-15). The distribution of the imagery exposures in remote sensing
is extremely critical, and maintaining altitude, airspeed, course, and attitude from a
moving aircraft without the aid of an autopilot unit can be quite challenging, for even the
most experienced manned pilots. It is imperative that ample imagery overlap (ideally ≥
60% endlap and ≥ 50% sidelap) is achieved to attain full target area coverage if that is
the end product needed to answer the scientific question (Figure 4-16). Creating an
orthophotomosaic from imagery that lacks sufficient overlap across the entire scene will
leave areas where the post-processing software is unable to match enough tie points to
generate a full seamless orthophotomosaic (Figure 4-17). However, a tremendous
amount of information can still be garnered from the remaining intact portions of such
products, or from individual images that have been orthogeorectified.
Discussion
Furnishing a manned aircraft able to conduct slow-airspeed and low-altitude
manned visual surveys with an ESP containing optical payload systems capable of
producing directly-georeferenced near-nadir imagery permits multiple data sets of the
target area to be obtained during a single flight. By limiting the need for substantial
physical alterations to the manned aircraft or considerable changes to existing manned
survey flight plan methodologies, the benefits of utilizing an ESP affixed to a manned
aircraft outweigh potential drawbacks. A well-piloted ESP-equipped aircraft can be
systematically flown over the focal area at a predetermined altitude, airspeed, and along
parallel flight paths based on ESP payload specifics, aircraft performance
characteristics, and the target item of interest.
123
An advantageous reason for using a sUAS payload in an ESP to conduct aerial
surveys is that when outfitted with direct georeferencing payloads, the digital imagery
and associated metadata collected can be catalogued, archived, and stored in
perpetuity as a photographic record of the flight. This feature permits a multitude of
qualitative and quantitative analyses to be conducted in the future, especially temporal-
based assessments of alterations that may be attributed to global climate change,
natural disaster impacts, or other salient events in natural resources and environmental
disciplines. Unlike traditional visual observer manned aerial surveys where
identification and enumeration of targets must be conducted immediately and quickly
from the air as the aircraft makes transects over, or circumnavigates a target area,
ESPs containing sensors designed for sUAS can typically collect raw data that can be
analyzed at any occasion after a flight concludes. Typical visual observer aerial surveys
do not afford much time for observers to resolve potential doubts or reassess many
areas while a flight is in progress, whereas most ESP sensor data can be examined
repeatedly.
Rare or difficult to identify targets are photographically documented and can be
evaluated by numerous subject matter experts for their opinions. These benefits are
especially valuable as new computer software for imagery post-processing emerges,
innovative computer-based feature recognition algorithms become available, and as
statisticians develop novel methods to assist researchers in moving from providing
counts of focal targets to generating estimates having testable bounds.
In situations where target areas for aerial data collection are separated by
extensive distances, or isolated by terrain that is difficult to traverse via ground or boat

124
(such as in the Everglades), the ability of a manned aircraft to ferry an ESP from a
specific survey area to the next is considerably more time efficient than conducting
surveys reliant on surface-based transportation methodologies. Consequently, a much
greater sampling area containing targets for aerial data collection can be accomplished
during an operational day. Equipping manned flights for surveys with an ESP using
slow-airspeed and low-altitude methodologies still put pilots and their manned aircraft in
potentially risky situations. However, with the currently rapid advances in optical sensor
and payload technologies predicted to continue, soon optical sensors should provide
improved resolution and payload systems ought to become quicker, permitting ESP
flights by manned aircraft to be conducted at higher flight altitudes and at greater
airspeeds, therefore increasing the overall safety of such missions.
Williams et al. (2015) used digital video acquisition from four video cameras
simultaneously affixed to a fixed-wing aircraft as part of their data collection of mid-
Atlantic Outer Continental Shelf fauna, and their study highlighted several of the same
benefits that are mentioned in this study regarding the gains that optical sensors provide
as data collection methods over traditional manned visual aerial surveys alone. Using
the ESP and its’ methodology offers advantages in that the use of a high-accuracy
GPS/INS in synchronization with still frame optical sensors in a nadir orientation are
able to generate directly-georeferenced imagery products during post-processing. In
addition, this approach uses increasingly higher-resolution optical sensors that improve
the ability of observers to routinely identify individual focal targets to the species level.
While conducting ongoing ESP research, there has been interest in generating a
quantitative-based preflight software program to accompany an ESP that could enable

125
natural resources or environmental professionals to input basic details of the ESP
optical payloads, the desired resultant imagery end products, and the aircraft hosting
the ESP, whereby the software would generate an optimum altitude, flight path spacing
for transects, and ideal ground speed for successfully capturing the desired imagery
and associated metadata from the sensors contained within the ESP. Theoretically,
effective development of preplanning software could permit a researcher to design and
upload a flight plan into a GPS unit for a manned aircraft pilot to execute; eliminating the
necessity of having a natural resources professional onboard the aircraft, and thereby
reducing the number of souls at risk being airborne at slow-airspeeds and low-altitudes.
For certain natural resource applications, e.g.: documenting animal behavior,
rudimentary presence/absence determinations, or in cases where directly-
georeferenced imagery is not required to generate the desired end product, etc., the
video data collected by a GoPro® camera is generally sufficient for such purposes (e.g.,
Anderson et al. 2014, Mulero-Pázmány et al. 2014, Bevan et al. 2015, Pomeroy et al.
2015, van Gemert et al. 2015). As pixel resolution of optical sensors and number of
frames captured per sec continue to advance with COTS digital video camera
technology, the ability to obtain individual high quality still frame images from video
recordings have greatly improved. Perhaps the greatest drawback to aerial video data
collection is that unless a network of surveyed ground control points appear within the
resultant video, retroactively attempting to georeference target items from recorded
video can be a difficult and time-intensive task (e.g., Jones IV et al. 2006, Wilkinson
2007, Eugster and Nebiker 2008, Sarda-Palomera et al. 2012).
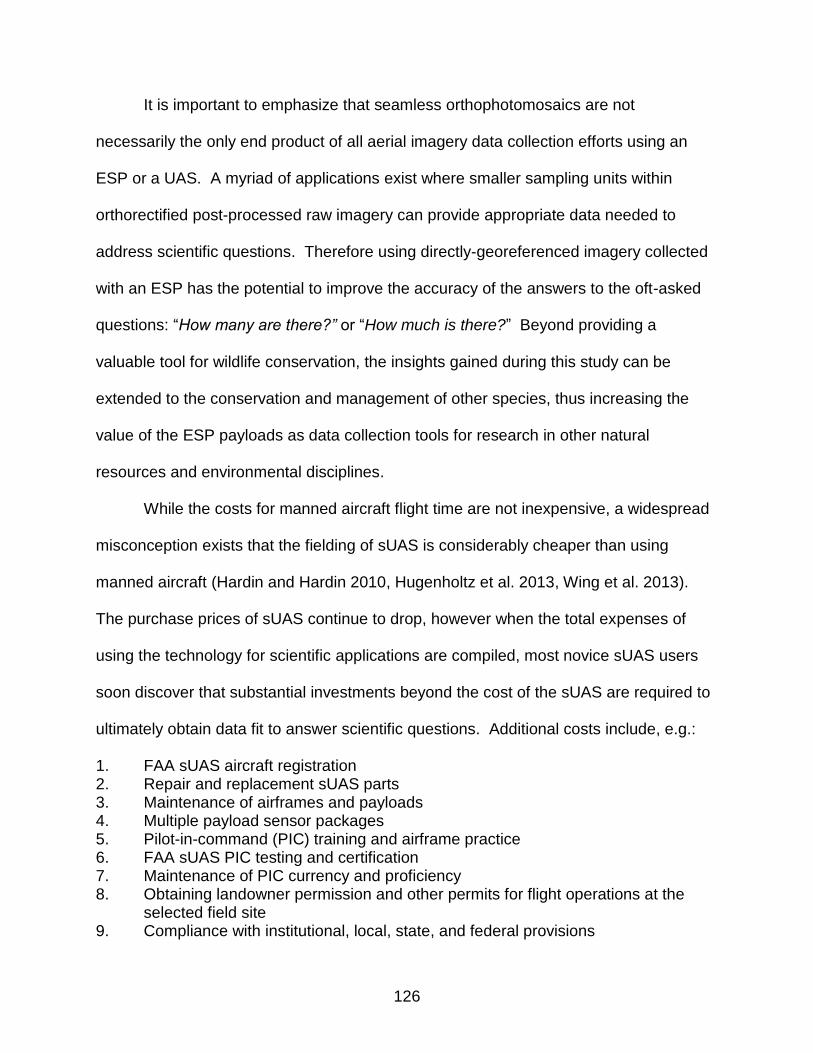
126
It is important to emphasize that seamless orthophotomosaics are not
necessarily the only end product of all aerial imagery data collection efforts using an
ESP or a UAS. A myriad of applications exist where smaller sampling units within
orthorectified post-processed raw imagery can provide appropriate data needed to
address scientific questions. Therefore using directly-georeferenced imagery collected
with an ESP has the potential to improve the accuracy of the answers to the oft-asked
questions: “How many are there?” or “How much is there?” Beyond providing a
valuable tool for wildlife conservation, the insights gained during this study can be
extended to the conservation and management of other species, thus increasing the
value of the ESP payloads as data collection tools for research in other natural
resources and environmental disciplines.
While the costs for manned aircraft flight time are not inexpensive, a widespread
misconception exists that the fielding of sUAS is considerably cheaper than using
manned aircraft (Hardin and Hardin 2010, Hugenholtz et al. 2013, Wing et al. 2013).
The purchase prices of sUAS continue to drop, however when the total expenses of
using the technology for scientific applications are compiled, most novice sUAS users
soon discover that substantial investments beyond the cost of the sUAS are required to
ultimately obtain data fit to answer scientific questions. Additional costs include, e.g.:
1. FAA sUAS aircraft registration 2. Repair and replacement sUAS parts 3. Maintenance of airframes and payloads 4. Multiple payload sensor packages 5. Pilot-in-command (PIC) training and airframe practice 6. FAA sUAS PIC testing and certification 7. Maintenance of PIC currency and proficiency 8. Obtaining landowner permission and other permits for flight operations at the
selected field site 9. Compliance with institutional, local, state, and federal provisions
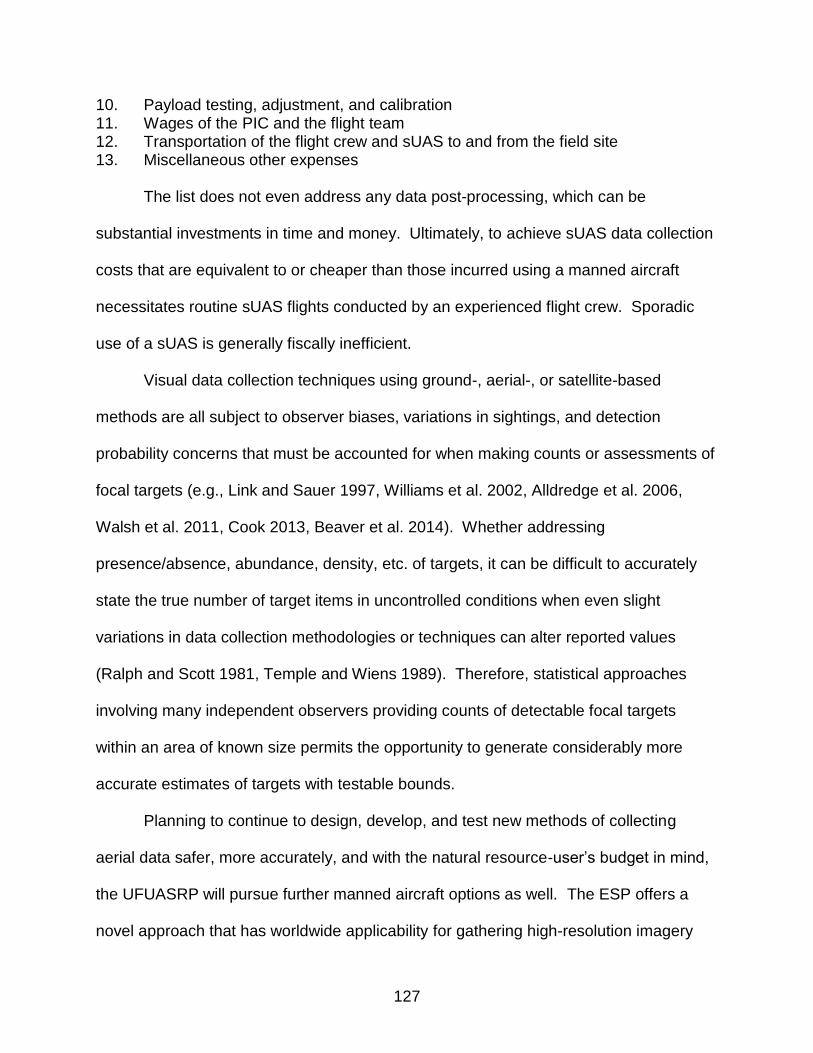
127
10. Payload testing, adjustment, and calibration 11. Wages of the PIC and the flight team 12. Transportation of the flight crew and sUAS to and from the field site 13. Miscellaneous other expenses
The list does not even address any data post-processing, which can be
substantial investments in time and money. Ultimately, to achieve sUAS data collection
costs that are equivalent to or cheaper than those incurred using a manned aircraft
necessitates routine sUAS flights conducted by an experienced flight crew. Sporadic
use of a sUAS is generally fiscally inefficient.
Visual data collection techniques using ground-, aerial-, or satellite-based
methods are all subject to observer biases, variations in sightings, and detection
probability concerns that must be accounted for when making counts or assessments of
focal targets (e.g., Link and Sauer 1997, Williams et al. 2002, Alldredge et al. 2006,
Walsh et al. 2011, Cook 2013, Beaver et al. 2014). Whether addressing
presence/absence, abundance, density, etc. of targets, it can be difficult to accurately
state the true number of target items in uncontrolled conditions when even slight
variations in data collection methodologies or techniques can alter reported values
(Ralph and Scott 1981, Temple and Wiens 1989). Therefore, statistical approaches
involving many independent observers providing counts of detectable focal targets
within an area of known size permits the opportunity to generate considerably more
accurate estimates of targets with testable bounds.
Planning to continue to design, develop, and test new methods of collecting
aerial data safer, more accurately, and with the natural resource-user’s budget in mind,
the UFUASRP will pursue further manned aircraft options as well. The ESP offers a
novel approach that has worldwide applicability for gathering high-resolution imagery

128
and metadata that cannot be affordably obtained from satellite imagery, or in situations
where using a sUAS is impossible, impractical, or illegal. The use of ESP methods
have the potential to improve aerial data collection and produce more accurate
estimates of target items that can assist decision makers by generating more informed
choices. While both convenience sampling and reliance on index values are simplified
means for generating data, Anderson (2001) reminds researchers that valid inferences
about target items are only dependable when data are appropriately collected and
measures of their precision can be reliably justified.
Due primarily to the attention that civilian sUAS and their payloads have received
over the last decade, there are some who feel that the technology has already reached
maturity; however, there is still much to learn about sUAS, their sensor payloads, and
appropriately utilizing them as tools for aerial data collection in support of answering
scientific-based questions. By enacting rules specifically directed towards sUAS in fall
2016, the FAA has made advances that will enable increased testing of sUAS and their
payloads in the US. In the meantime, the small, yet affordable, high-resolution directly-
georeferenced and calibrated optical payloads currently available for use in an ESP
affixed to a manned aircraft appears to be a viable alternative method for collecting
aerial data for many applications; especially for natural resources and environmental
research.
129
Figure 4-1. The location of the July 2013 external sensor pod study site over Archie
Carr National Wildlife Refuge, Brevard County, Florida, USA. The red box encompasses the 21.0 kilometers of sandy beach that was the focal area of sea turtle nesting crawls for this study.
GoogleEarth™
130
Figure 4-2. The 21.0 kilometer stretch of beach that was aerially imaged in July 2013
with the external sensor pod over the Archie Carr National Wildlife Refuge, Brevard County, Florida, USA. The yellow star shows the proximity of Melbourne International Airport to the study area.
GoogleEarth™
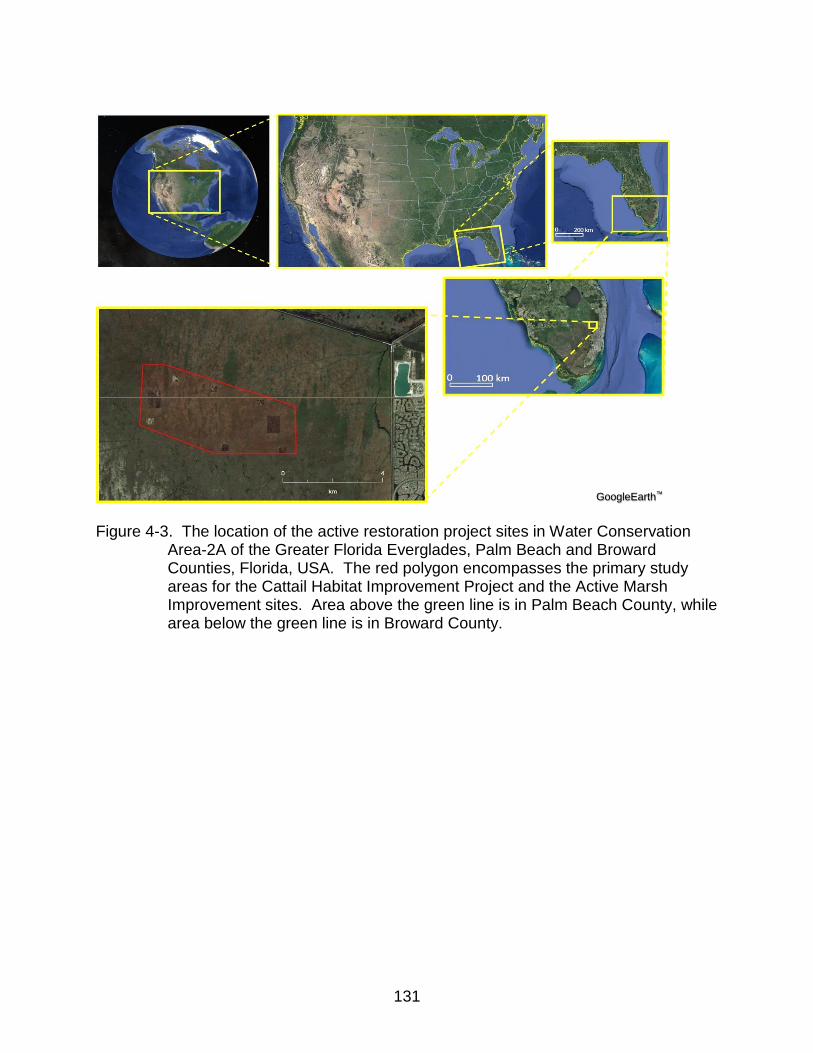
131
Figure 4-3. The location of the active restoration project sites in Water Conservation
Area-2A of the Greater Florida Everglades, Palm Beach and Broward Counties, Florida, USA. The red polygon encompasses the primary study areas for the Cattail Habitat Improvement Project and the Active Marsh Improvement sites. Area above the green line is in Palm Beach County, while area below the green line is in Broward County.
GoogleEarth™

132
Figure 4-4. The active restoration project sites in Water Conservation Area-2A of the
Greater Florida Everglades, Palm Beach and Broward Counties, Florida, USA. The primary Cattail Habitat Improvement Project (CHIP) experimental plots are outlined in solid white, and their control plots are outlined in broken white lines. Three control-only CHIP plots, ‘U1, U2, and U3’, are located a short distance southwest of this image. The two Active Marsh Improvement (AMI) experimental plots are outlined in red.
GoogleEarth™

133
Figure 4-5. The initial external sensor pod. Constructed from folded and riveted sheet
aluminum, the initial external sensor pod had a hole cut in the bottom over which the optical payload lens was positioned. The power switches and global positioning system/inertial navigation system antenna utilized the holes in the lid.
M.A. Burgess

134
Figure 4-6. The second-generation external sensor pod. This design possessed a
larger internal volume to facilitate simultaneous use of multiple payload systems. With the added volume, the pod was fabricated out of milled sheets of thicker aluminum alloy to support the additional mass.
M.A. Burgess

135
Figure 4-7. The third-generation external sensor pod. Even more voluminous, this
external sensor pod was also built out of aluminum alloy, but was assembled with high-strength welded seams for a reduction in hardware and improved water resistance. A three-dimensional-printed tapered nosecone was custom designed and attached to help make the entire pod more aerodynamic.
M.A. Burgess

136
Figure 4-8. The third-generation external sensor pod affixed to a Bell® 407. The third-
generation pod used the same mounting plate configuration as the second-generation pod. In addition, the third-generation pod featured a much larger glass window over which to position multiple nadir-oriented optical sensors.
M.A. Burgess
M.A. Burgess
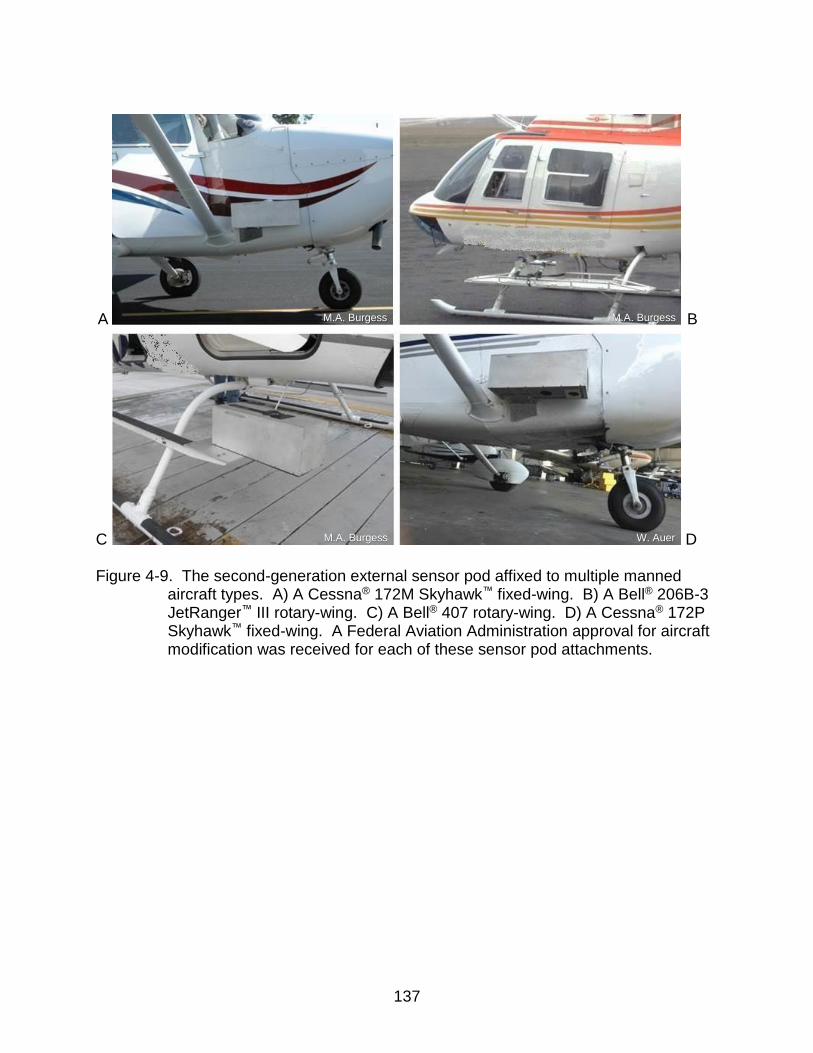
137
C D Figure 4-9. The second-generation external sensor pod affixed to multiple manned
aircraft types. A) A Cessna® 172M Skyhawk™ fixed-wing. B) A Bell® 206B-3 JetRanger™ III rotary-wing. C) A Bell® 407 rotary-wing. D) A Cessna® 172P Skyhawk™ fixed-wing. A Federal Aviation Administration approval for aircraft modification was received for each of these sensor pod attachments.
M.A. Burgess M.A. Burgess
M.A. Burgess W. Auer
B A
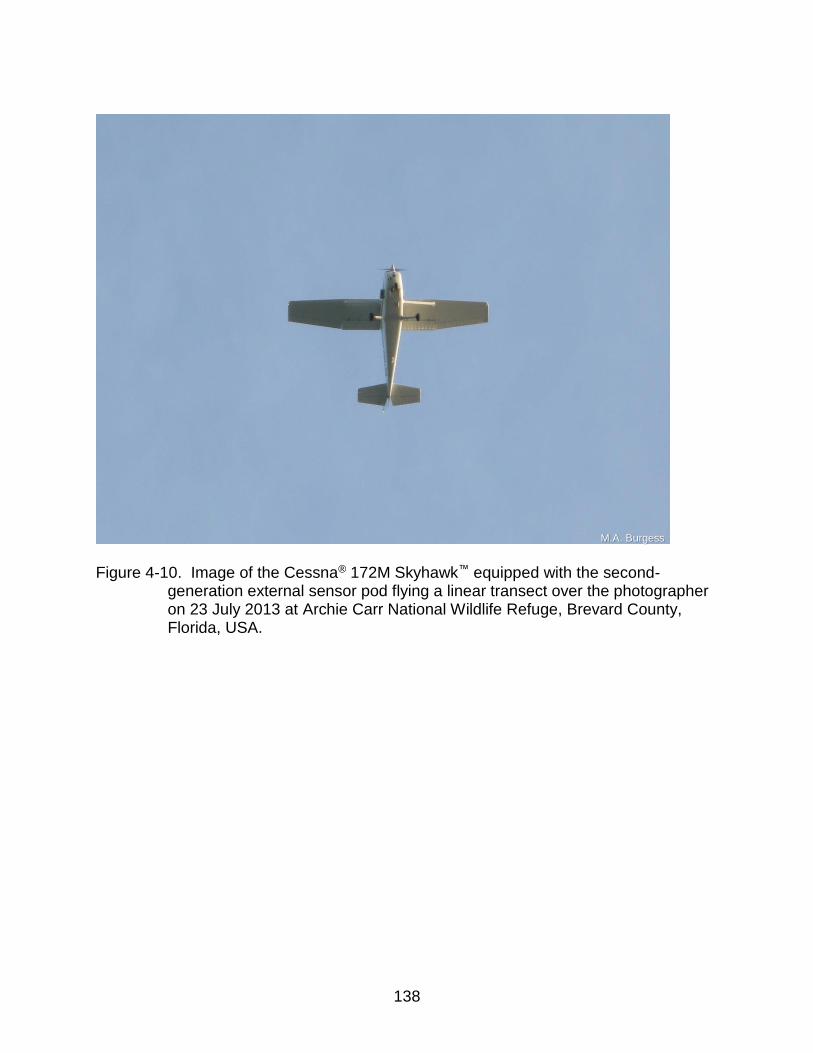
138
Figure 4-10. Image of the Cessna® 172M Skyhawk™ equipped with the second-
generation external sensor pod flying a linear transect over the photographer on 23 July 2013 at Archie Carr National Wildlife Refuge, Brevard County, Florida, USA.
M.A. Burgess
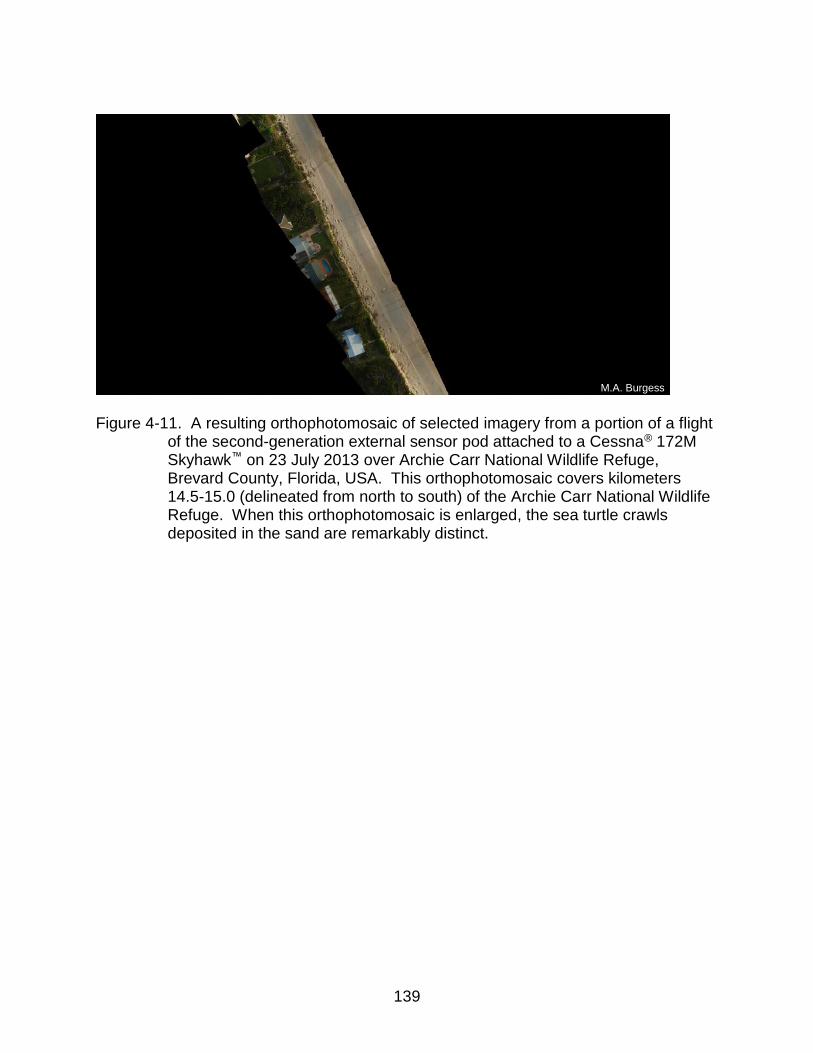
139
Figure 4-11. A resulting orthophotomosaic of selected imagery from a portion of a flight
of the second-generation external sensor pod attached to a Cessna® 172M Skyhawk™ on 23 July 2013 over Archie Carr National Wildlife Refuge, Brevard County, Florida, USA. This orthophotomosaic covers kilometers 14.5-15.0 (delineated from north to south) of the Archie Carr National Wildlife Refuge. When this orthophotomosaic is enlarged, the sea turtle crawls deposited in the sand are remarkably distinct.
M.A. Burgess
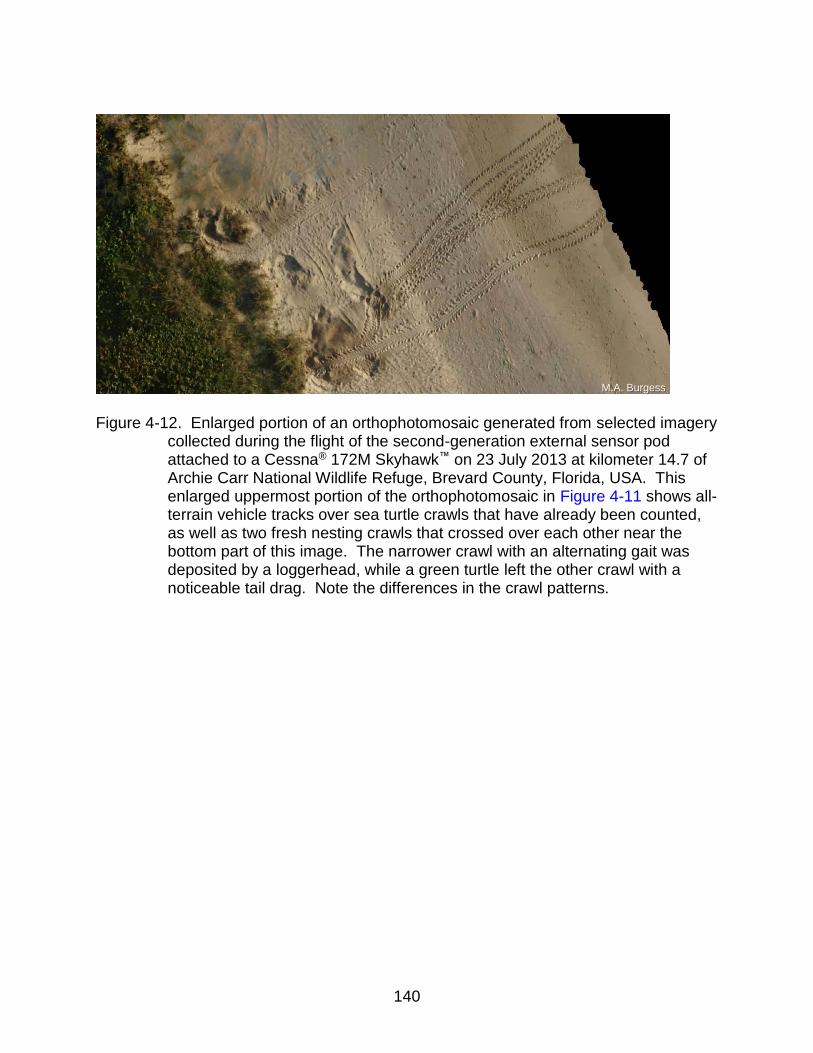
140
Figure 4-12. Enlarged portion of an orthophotomosaic generated from selected imagery
collected during the flight of the second-generation external sensor pod attached to a Cessna® 172M Skyhawk™ on 23 July 2013 at kilometer 14.7 of Archie Carr National Wildlife Refuge, Brevard County, Florida, USA. This enlarged uppermost portion of the orthophotomosaic in Figure 4-11 shows all-terrain vehicle tracks over sea turtle crawls that have already been counted, as well as two fresh nesting crawls that crossed over each other near the bottom part of this image. The narrower crawl with an alternating gait was deposited by a loggerhead, while a green turtle left the other crawl with a noticeable tail drag. Note the differences in the crawl patterns.
M.A. Burgess
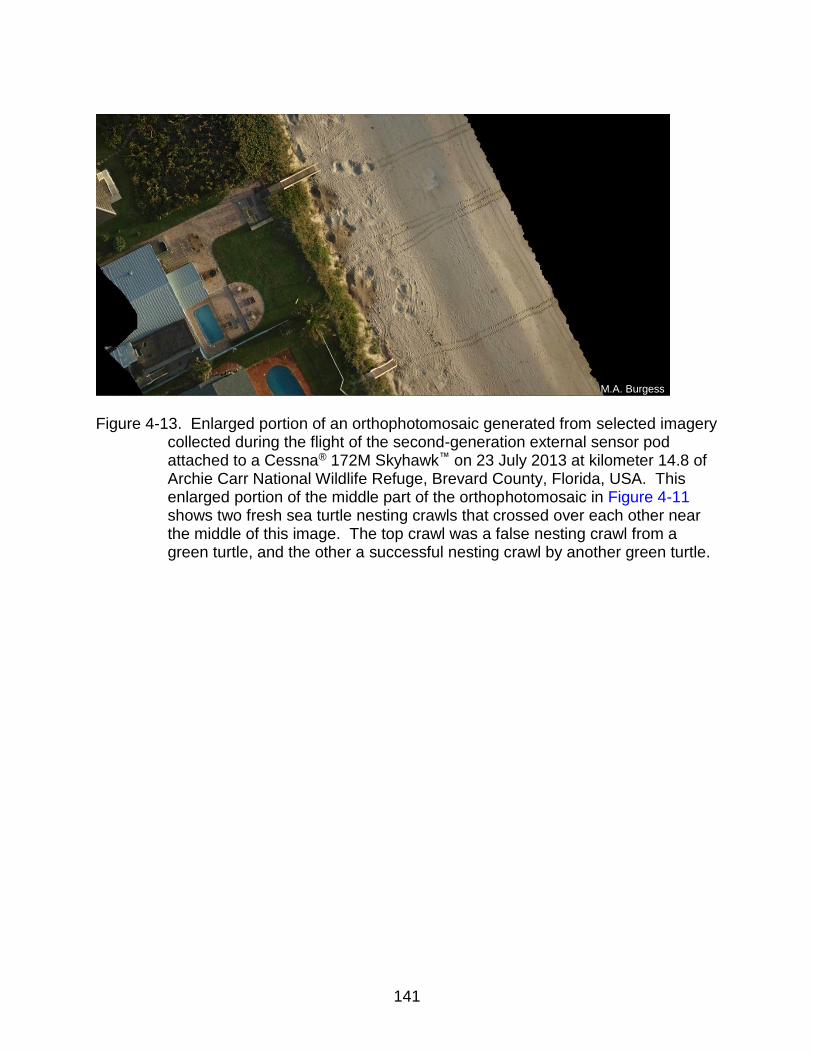
141
Figure 4-13. Enlarged portion of an orthophotomosaic generated from selected imagery
collected during the flight of the second-generation external sensor pod attached to a Cessna® 172M Skyhawk™ on 23 July 2013 at kilometer 14.8 of Archie Carr National Wildlife Refuge, Brevard County, Florida, USA. This enlarged portion of the middle part of the orthophotomosaic in Figure 4-11 shows two fresh sea turtle nesting crawls that crossed over each other near the middle of this image. The top crawl was a false nesting crawl from a green turtle, and the other a successful nesting crawl by another green turtle.
M.A. Burgess
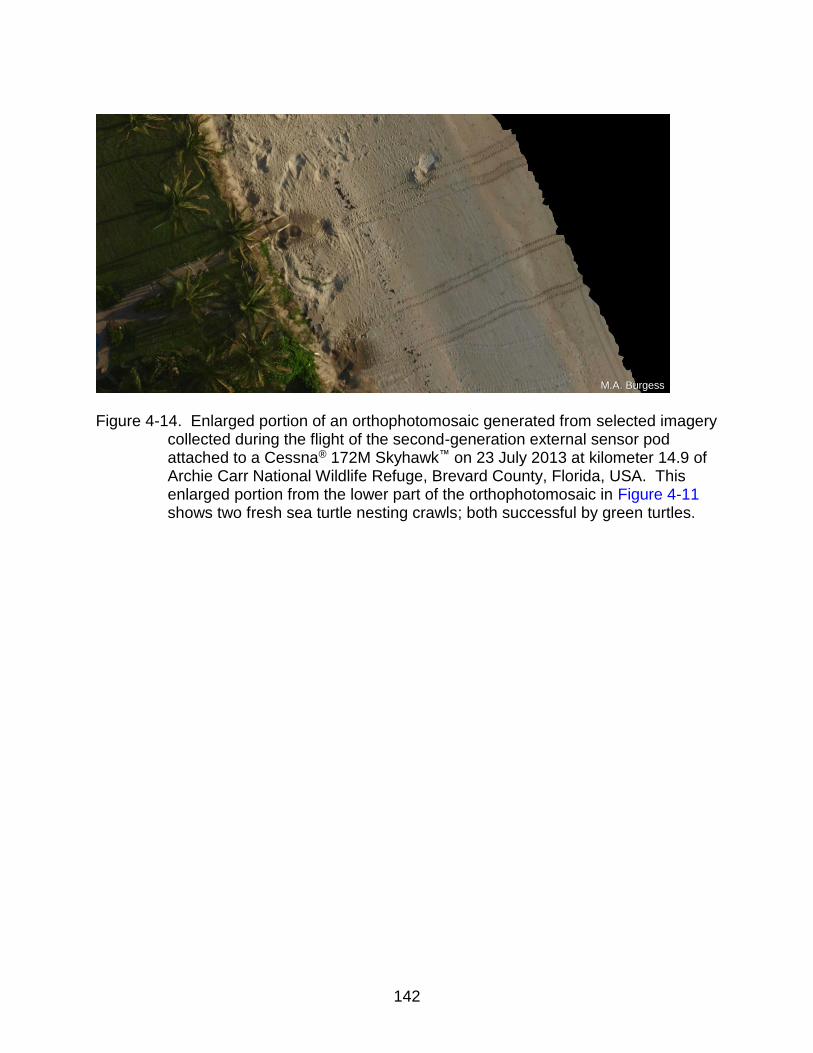
142
Figure 4-14. Enlarged portion of an orthophotomosaic generated from selected imagery
collected during the flight of the second-generation external sensor pod attached to a Cessna® 172M Skyhawk™ on 23 July 2013 at kilometer 14.9 of Archie Carr National Wildlife Refuge, Brevard County, Florida, USA. This enlarged portion from the lower part of the orthophotomosaic in Figure 4-11 shows two fresh sea turtle nesting crawls; both successful by green turtles.
M.A. Burgess
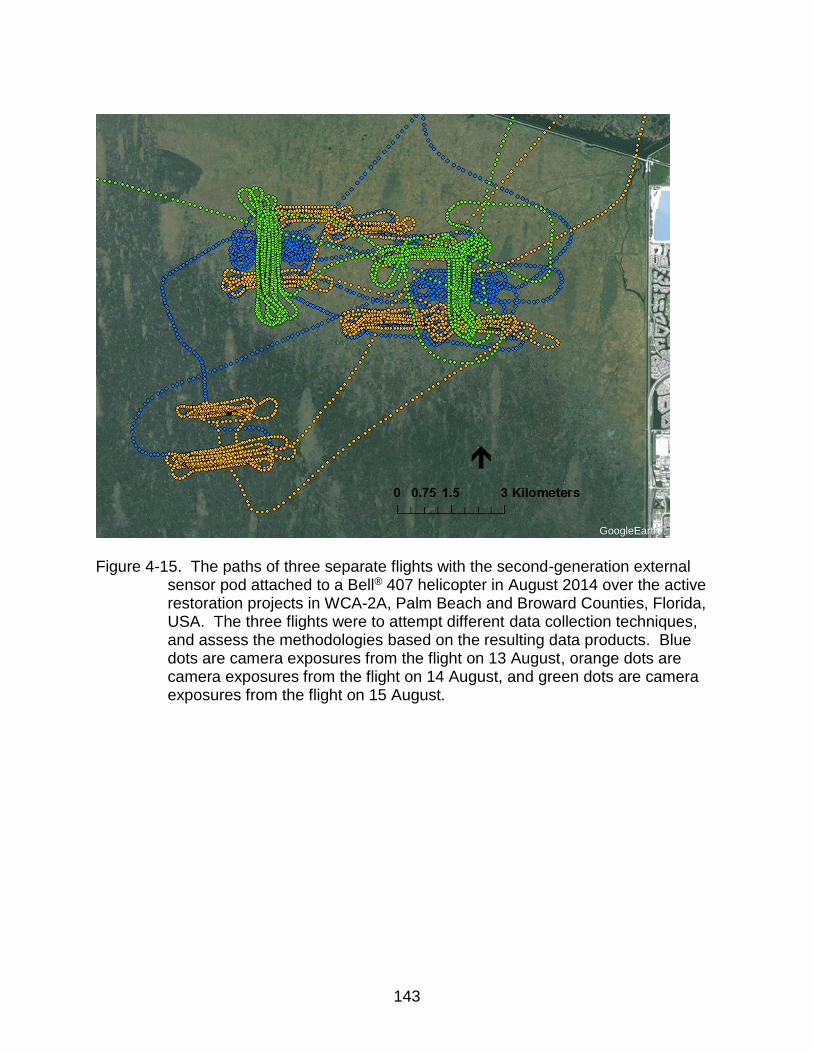
143
Figure 4-15. The paths of three separate flights with the second-generation external
sensor pod attached to a Bell® 407 helicopter in August 2014 over the active restoration projects in WCA-2A, Palm Beach and Broward Counties, Florida, USA. The three flights were to attempt different data collection techniques, and assess the methodologies based on the resulting data products. Blue dots are camera exposures from the flight on 13 August, orange dots are camera exposures from the flight on 14 August, and green dots are camera exposures from the flight on 15 August.
GoogleEarth™
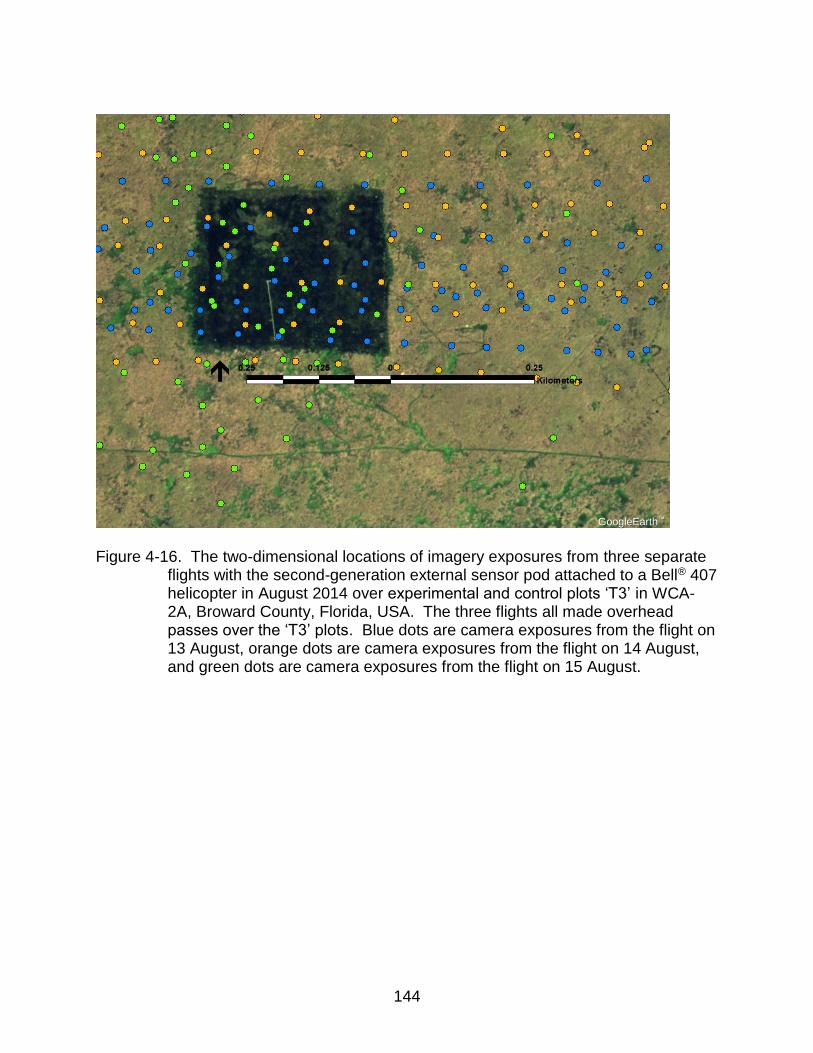
144
Figure 4-16. The two-dimensional locations of imagery exposures from three separate
flights with the second-generation external sensor pod attached to a Bell® 407 helicopter in August 2014 over experimental and control plots ‘T3’ in WCA-2A, Broward County, Florida, USA. The three flights all made overhead passes over the ‘T3’ plots. Blue dots are camera exposures from the flight on 13 August, orange dots are camera exposures from the flight on 14 August, and green dots are camera exposures from the flight on 15 August.
GoogleEarth™
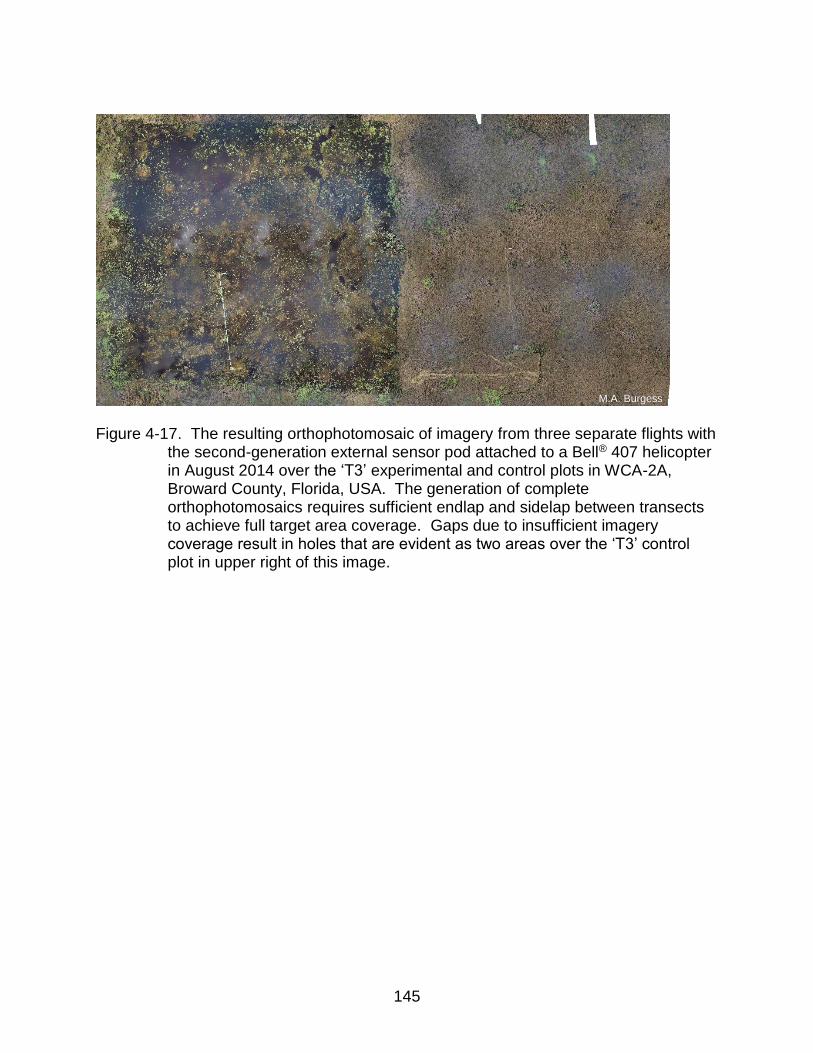
145
Figure 4-17. The resulting orthophotomosaic of imagery from three separate flights with
the second-generation external sensor pod attached to a Bell® 407 helicopter in August 2014 over the ‘T3’ experimental and control plots in WCA-2A, Broward County, Florida, USA. The generation of complete orthophotomosaics requires sufficient endlap and sidelap between transects to achieve full target area coverage. Gaps due to insufficient imagery coverage result in holes that are evident as two areas over the ‘T3’ control plot in upper right of this image.
M.A. Burgess

146
CHAPTER 5 CONCLUSIONS
Throughout the last decade, the interest and desire to use small unmanned
aircraft systems (sUAS) and their payload systems for civilian uses has grown
exponentially. In what is now predicted to be a multi-billion US$ industry around the
world, sUAS as payload platforms for a seemingly endless number of applications only
continues to grow. Having been immersed in the technology before and during this
recent upsurge, it is safe to say that sUAS are not going away anytime in the near
future. Working with sUAS and their payloads, the remote sensing industry and others
have already seen major shifts in how data are acquired on a routine basis. For the
natural resource-based user, both sUAS and their high-resolution, yet affordable
payloads, present many advantageous features that have the potential to supplement
existing data collection methodologies and techniques in positive ways. The University
of Florida (UF) Unmanned Aircraft Systems Research Program (UFUASRP) will
continue to provide valuable aerial data collection tools through further research and
development for the natural resource-based user while remaining mindful of the limited
fiscal resources available, and diverse knowledge base that environmental research
professionals and scientists possess.
Within the published literature, there has been a noticeable increase in the
number of manuscripts highlighting sUAS as a tool for natural resources and
environmental professionals as an aerial survey platform. A majority of these articles
have focused on the sUAS, rather than data or results from conducting quantitative
studies using said aircraft and payloads. Without doubt, sUAS are data collection tools
that grab significant attention, and the execution of proof-of-concept applications are

147
essential to the development of any novel technique or methodology. However, it is
imperative to stress that the unmanned aircraft (UA) is just a platform or an avenue for
positioning a sensor, or a suite of sensors, over a specific target area to collect aerial
data. The real value of sUAS as a scientific tool lies within the quality and
methodologies used to obtain and post-process the data once it has been collected.
We anticipated that soon research manuscripts in which sUAS were tools used to obtain
scientific data should begin to shift away from, “Hey, look what we can see from a
sUAS…” to “Using an suitable sUAS airframe outfitted with a calibrated data collection
payload, we observed…”. These papers will highlight the results garnered from the
aerial data collected, rather than focusing so much on the data collection device itself.
The vast utility of sUAS as aerial data collection tools in the fields of natural resources,
wildlife, forestry, fisheries, ecology, conservation, management, etc. is particularly
exciting; especially for researchers who have interdisciplinary expertise in appropriately
combining the critical components of the various sciences with the capabilities of the
emerging technology.
Pygmy Rabbit (Brachylagus idahoensis) Habitat Selection Inferences Determined by Normalized Difference Vegetative Index Computations of Aerial Imagery
Products Generated from Data Collected by a Small Unmanned Aircraft System
Based on the results of this study conducted at two separate sagebrush-steppe
field sites during two consecutive summers in Idaho, we determined that computation of
normalized difference vegetative indices (NDVI) of individual sagebrush plants could be
used to successfully identify plants having a higher likelihood of harboring active pygmy
rabbits within a post-processed scene. Using this methodology, a sUAS with a payload
capable of generating directly-georectified NDVI data values could theoretically be flown
over an area of sagebrush-steppe that has never been ground truthed or was ground
148
truthed some time ago. Through data post-processing and NDVI calculations, field-
based ‘boots-on-the-ground’ (BOTG) survey teams could then be directed to specific
sagebrush plant locations with the highest likelihood of harboring signs of recent pygmy
rabbit activity via global positioning systems (GPSs). The technique could save
substantial time for BOTG surveyors from having to systematically traverse large areas
of sagebrush-steppe landscape looking for signs of recent pygmy rabbit activity by
guiding the surveyors immediately to plants having the highest NDVI values within a
post-processed scene.
Generating Estimates of Nesting American White Pelicans (Pelecanus erythrorhynchos) on Spoil Islands in Minidoka National Wildlife Refuge (Idaho)
from Aerial Imagery Products Produced from Data Collected by a Small Unmanned Aircraft System
The use of the UF Nova 2.1 sUAS and its’ Olympus® E-420™ optical payload
system was able to successfully conduct parallel transects at 125 meters (m) above
ground level (AGL) over three spoil islands in the Minidoka National Wildlife Refuge that
harbor colonies of nesting American White Pelicans (AWP) without disturbing them.
Using the airframe and payload combination selected, two-dimensional (2D) digital
imagery and metadata captured during the flight was able to post-processed into high-
resolution three-dimensional (3D) imagery end products which facilitated manual counts
of AWP on each of the islands by means of computer software. Using crowdsourcing
methods of obtaining AWP counts, the pooled count data for each island were able to
be statistically tested to generate estimates of total AWP individuals detected on each of
the three islands. When the estimates of AWPs on the islands were compared to data
provided by Idaho Department of Fish and Game (IDFG) biologists using BOTG
techniques, it was realized that we were developing estimates of individual AWP birds
149
using the post-processed imagery products, while the IDFG was generating total nest
counts with BOTG methodologies. Ultimately enumerating two different targets made
direct comparisons inappropriate; however, upon further review of the sUAS-obtained
data products it appears that using the sUAS data collection methods which were
unobtrusive to the nesting avifauna, were time and labor efficient, and could be
conducted on a regular sampling schedule in the future to assess nesting turnover rates
through the entirety of the reproductive season, was able to generate reliable estimates
that could be used for future AWP nesting surveys.
Use of High-Resolution Optical Payloads Designed for Small Unmanned Aircraft Systems as an Innovative Approach for Aerial Data Collection from Manned
Aircraft Flights
While the use of sUAS and their payload systems for civil applications have
grown exponentially during the last decade, there are still situations where using sUAS
data collection methods may be impossible, impractical, or illegal. Therefore, utilizing
manned aircraft equipped with a small external sensor pod (ESP) containing high-
resolution optical payloads and sensors designed for sUAS applications may be a better
choice logistically, fiscally, and legally for obtaining aerial imagery and metadata for
certain applications. Circumstances such as when sampling sites have extensive
distances or inhospitable terrain for ground- or water-based transportation located
between them, or when a targeted area of study is large in size and collecting aerial
data must be accomplished in a short period of time, or if sUAS use is prohibited due to
proximity of property, people, or airports, the use of an ESP affixed to a manned aircraft
can often be a viable solution. The ESP technique was conducted over sea turtle
nesting crawls on a 21.0 kilometer (km) stretch of beach in 2013, and was tested again
in 2014 over aquatic vegetation targets in the Greater Florida Everglades for additional

150
feasibility analyses. In both scientific trial applications, specific refinements of the
methodology were identified, and modifications to future ESP flight plans and
techniques established. At the conclusion of the ESP trials, we determined that the
methodology appears to be a feasible aerial data collection alternative to coarse
resolution satellite imagery data, traditional double-observer manned visual surveys,
and for study sites where sUAS flights are impossible, impractical, or illegal.

151
APPENDIX A THE HISTORY OF THE UNIVERSITY OF FLORIDA UNMANNED AIRCRAFT
SYSTEMS RESEARCH PROGRAM (UFUASRP): 1999–2017
In the late 1990s, researchers within three independent departments at the
University of Florida (UF) were actively addressing key components of what would
ultimately become a pioneering academic-based unmanned aircraft systems (UAS)
research program in the United States (US). Wildlife biologists and ecologists in UFs’
Department of Wildlife Ecology and Conservation (WEC) were using ‘boots-on-the-
ground’ (BOTG), manned aerial survey techniques, and satellite-borne imagery to
gather data pertaining to a multitude of natural resource-based questions. Researchers
within the UF Department of Mechanical and Aerospace Engineering (MAE) were
developing novel micro aerial vehicle (MAV) airframes out of composite materials with
wingspans as small as 10 centimeters (cm), total masses of approximately (≈) 40 grams
(g), flight endurance of up to 15 minutes (min), and having both manual and
autonomous control and imagery capturing capabilities. Meanwhile, Geomatics
(GEOM) Program professors in the UF Department of Civil and Coastal Engineering
(the GEOM Program is now located within the School of Forest Resources and
Conservation) were investigating ways to improve and augment natural resource-
focused remote sensing data obtained from orbiting satellites, manned aerial flights, and
BOTG methodologies.
In June 1999, two UF WEC professors attended an afternoon seminar on the UF
campus about a prototype 1.5 meter (m) wingspan, 4.3 kilogram (kg) maximum takeoff
mass, nitromethane-powered pusher-configuration FoldBat™ UAS that the MLB
Company® was in the process of developing. After attending the seminar, the WEC
professors expressed interest to each other about the possibilities of perhaps trying a

152
FoldBat™ system as a method of imagery data collection for scientific questions within
natural resources if they could procure the money to purchase a system (≈ US$
35,000), and secure funding to support a Master of Science (M.S.)-level graduate
student for several years who would be interested in taking on such a novel project.
Concurrently in the UF MAE MAV Laboratory, a team of graduate and
undergraduate students were preparing for competing in their first national MAV
competition; an event in which they would earn top honors, and retain that title over the
next eight years. Also at that time, another UF WEC research scientist with a team of
biological field technicians were annually enumerating predominately long-legged
wading bird species (Ciconiiformes and their allies) colonially nesting on selected tree
islands in the Greater Florida Everglades via BOTG and dual-observer manned aircraft
survey methodologies. Information spread quickly in UF WEC that an effort was coming
together to test the ability of using a small unmanned aircraft system (sUAS) as a
natural resource-purposed data collection platform. The WEC avian ecologist
expressed interested in experimenting with the technology to collect imagery over
several of the nesting bird colonies to compare, contrast, and potentially supplement
existing enumeration techniques that were in use.
The MLB Company® FoldBat™
In the fall of 2000, UF WEC researchers contacted the MLB Company® and
expressed their desire for purchasing a prototype FoldBat™ system as a test platform for
acquisition of low-altitude aerial imagery over several areas of Florida that contained
natural resource targets of interest. In June 2001, a prototype FoldBat™ system arrived
at UF from the MLB Company® in California. The aircraft fuselage was constructed of
Kevlar®, carbon fiber, balsa wood, and aluminum components, and had its unique
153
Dacron®-covered accordion-folding main wingset and tail surfaces for which the
platform derived its named (Jones IV 2003). Additional components also arrived
including the ground control station (GCS) laptop computer containing proprietary MLB
Company® software featuring a moving basemap, telemetry, and up to 15
preprogrammed waypoint capability, a directional 2.4 gigahertz (GHz) video downlink
antenna, and other essentials such as the standard 8-channel 72 megahertz (MHz)
pulse-code modulation remote control (RC) aircraft radio controller used for traditional
hand-launch takeoffs, manual flight ability, and belly-sliding landings, interface cabling,
and video recording equipment (Jones IV 2003, Jones IV et al. 2006). The FoldBat™
was natively furnished with two underwing sensor pods, each containing a nadir-
oriented (downward-oriented) complementary metal oxide semiconductor (CMOS)
analog interlaced video chip camera with 330-horizontal line resolution and a fixed focal
length 50 millimeter (mm) lens; one sensor pod capturing imagery in the visible range of
the electromagnetic (EM) spectrum [the visible range is often referred to by the red-
green-blue (RGB) additive color model in which various quantities of red, green, and
blue wavelength light are added together to form a broad range of colors that the normal
human eye is capable of viewing], and the second sensor pod capturing imagery in the
near-infrared (NIR) wavelength range of the EM spectrum. The interlaced video
imagery feeds were downlinked with a pair of 2.4 GHz transmitters aboard the aircraft to
a directional antenna located at the GCS where the feeds were recorded onto digital
Sony® GV-D800 Hi8 video cassette recorders in the field for future viewing and analysis
back in the laboratory (Jones IV 2003, Jones IV et al. 2006).
154
At that time, interlaced video format was the industry standard for affordable
high-speed movie recording. By capturing 50% of an image frame (every other
horizontal line) at a rate of 50 frames per second (f/sec), a 0.02 second (sec) time delay
occurred between each half frame recorded using the interlaced format. Depending on
the altitude and ground speed of the interlaced imagery sensor at the time of half frame
captures, a noticeable gap (or shift) within the sequential captures could be observed
when the video stream was reviewed frame-by-frame. This drawback made extracting
photographically clear still imagery from the interlaced video format recordings
problematic. Most of the video captured with the CMOS chip cameras in the FoldBat™
underwing sensor pods produced blurry still imagery and difficulties in reliably capturing
images of targets with a physical size smaller than the gap induced by the movement of
the imaging sensor between half frame exposures. A UF WEC professor suggested
that professors in the UF GEOM Program be consulted about suggestions for improving
the optical payload and remote sensing data collected by the FoldBat™ platform. After a
brief meeting among the group in mid-2002, a unanimous decision was made by the UF
UAS collaboration to move away from the native interlaced video format sensors
included with the FoldBat™, and transition to newly emerging, and increasingly more
affordable, progressive scan video sensors which was capable of taking a full-frame
image every 0.033 sec.
In late 1999, Canon® introduced the ELURA2™ digital video camcorder to the
commercial-off-the-shelf (COTS) market as a small and affordable digital progressive
scan video camcorders. The ELURA2™ featured 525-horizontal line RGB video
captured with a 6.35 square millimeter (mm2) progressive scan charge coupled device
155
(CCD) imaging sensor having 0.36 megapixel (MP) resolution, its own battery power
supply, and onboard MiniDV™ 8-mm videotape storage in a relatively small physical and
lightweight (460 g) package. The ELURA2™ camcorder was inserted into the FoldBat™
fuselage; however, the added mass introduced by the larger payload required that the
two external underwing pods be removed, and the nitromethane fuel tank only be filled
to a maximum of halfway before flight to keep the aircraft below the critical takeoff
mass. Fuel reduction limited the flight duration, and the high wing loading induced by
the ratio of the relatively small main wing area to the substantial overall mass of the
aircraft contributed to general flight instability and many failed takeoffs. To further
reduce mass, the downlink video modems were removed from the airframe, and the
progressive scan imagery was stored directly to MiniDV™ 8-mm video cassette tapes
onboard the aircraft. Overall, the decision to move away from interlaced video to the
progressive scan format made capturing clearer still images from video a reality, and
therefore target identification contained within the still images was considerably
improved.
From mid-2001 through spring 2003, the FoldBat™ flew > 30 total flights for the
UF UAS collaboration at altitudes from 100–150 m above ground level (AGL) and
airspeeds of ≈ 13.0–16.0 meters per second (m/sec) to investigate the strengths and
weaknesses of using the platform and payloads over various natural resource-based
targets of interest within the State of Florida. At Goodwin Waterfowl Management Area,
a wetland impoundment located near Melbourne, the FoldBat™ was flown several times
to collect imagery over a series of nesting wading bird species [White Ibis (Eudocimus
albus), egrets (Egretta sp.), and Wood Stork (Mycteria americana)] (Jones IV 2003).
156
Other missions using the FoldBat™ included flights to collect imagery over: 1)
agricultural land southwest of Archer, for both planted crops and grazing livestock; 2) an
island used extensively for nesting by birds at Seahorse Key [part of the Lower
Suwannee and Cedar Keys National Wildlife Refuge (LSCKNWR)] for additional
avifauna imagery; 3) a mangrove estuary (Pine Island) for vegetation classification
purposes; 4) a eutrophic freshwater lake for partially submerged American alligator
(Alligator mississippiensis) decoys and emergent wetland vegetation at Lake Alice; and
5) a Florida manatee (Trichechus manatus latirostris) warm-water winter aggregation
site north of Apollo Beach (Jones IV 2003, Jones IV et al. 2006)(H. F. Percival,
University of Florida, personal communication).
The FoldBat™ required a ≥ 90 × 15 m, open and nearly ‘improved’ runway for
skid-style landings on its fuselage belly (Jones IV 2003). Finding a suitable landing site
in the field meeting these criteria were a difficult task, and on average only 25% of
takeoff launches were successful with the FoldBat™; a low percentage for an unmanned
aircraft (UA) that did not ship with many spare parts, and all major structural repairs
required sending the unit back to manufacturer (Jones IV 2003). From personal
conversation with WEC researchers, the prototype FoldBat™ may have accrued more
flight time aboard a FedEx® manned cargo aircraft making trips back and forth between
Florida and California for repairs than it did flying operational missions (H. F. Percival,
personal communication). The operation of the FoldBat™ required a two-person flight
team: an individual to hand-launch the aircraft (which required significant arm strength
and general athleticism), who then observed the aircraft in flight while monitoring the
telemetry on the GCS, and then manually landed the aircraft; while a second person

157
had to aim the directional antenna panels toward the UA at all times to maintain data
and communication linkages between the aircraft and the GCS. An added difficulty
encountered when fielding the FoldBat™ was its nitromethane-fueled small engine which
was ultimately undersized for the aircraft due to the modifications of the optical payload,
was messy to refuel, and required a considerable amount of fine adjustment via needle
valve tinkering due to it being tuned to run smoothly for ambient conditions encountered
at the MLB Company® in California, but operational flight environments in Florida were
substantially different (e.g., higher temperatures, humidity, and air density, etc.) (Jones
IV 2003, Jones IV et al. 2006). It was an engine failure during a Florida manatee survey
mission near Apollo Beach in spring 2003 which ultimately landed the prototype
FoldBat™ into Tampa Bay; its final flight for the UF UAS collaboration (Jones IV et al.
2006).
To assess whether a wildlife biologist without any prior RC flight training could
quickly learn enough to become proficient in successfully launching, flying, and landing
a model aircraft, the UF UAS collaboration pilots joined ‘The Flying Gators,’ a local RC
aircraft club to receive flight lessons and gain ‘stick time’ using RC controls for a
comparatively inexpensive gas-powered, Styrofoam™ constructed, fixed-wing model
aircraft purchased as a surrogate trainer for the considerably more expensive FoldBat™
UAS. As part of the RC aircraft club membership, each UF UAS collaboration pilot-in-
command (PIC) had to join the Academy of Model Aeronautics (AMA), a national non-
profit RC model flight organization for hobbyists that looks out for the best interests of
model aircraft operators at a national level, and encourages the public to explore the fun
and excitement of RC model aviation in a safe and responsible manner. The AMA
158
developed a recommended set of standardized flight safety guidelines for RC model
aircraft hobbyists over 70 years ago to keep the flights of model aviation hobbyists
safely separated from those of manned flight operations. The AMA regularly revisits its
safety code with updates, and an annual AMA membership insures its members with a
liability policy that covers costs incurred if property is damaged or people are injured
while operating an RC model aircraft within the parameters specified by the AMA safety
code.
Back in early 2002, the UF UAS collaboration was contacted by the Federal
Aviation Administration (FAA), and made aware of a policy that at that juncture was not
very well known or publicized, that indicated because UA lacked a method to ‘see-and-
avoid’ a potential incursion due to the absence of a manned pilot onboard, every UA
flight must be kept within a 1.85 km visual-line-of-sight (VLOS) radius from the PIC at all
times in the interest of safety. Up until this instance, the UF UAS collaboration was
under the impression that the flights that they had been conducting with the FoldBat™
were supported under the ‘encouraged voluntary compliance’ of US hobby-based model
aircraft operating standards contained in FAA Advisory Circular (AC) 91-57 which was
issued in 1981, and made no mention of limitations in horizontal flying distance from the
PIC (H. F. Percival, personal communication). It took until fall of 2015 for the FAA to
issue AC 91-57A, the first model/hobby aircraft operating standard update in 34 years.
The FAA policy for keeping UAS flights within a 1.85 km VLOS radius of the PIC
at all times presented a significant obstacle that ultimately shelved several upcoming
field missions that the UF UAS collaboration had intended to conduct from the levee
system surrounding Lake Okeechobee (in southern Florida) to collect imagery of

159
floating and emergent vegetation. The plans that had to be tabled were to hand launch
the FoldBat™ from the top of the levee, have the aircraft fly out ≈ 5.6 km from shore to
the target area, conduct a series of linear transects over the selected area of vegetation,
and then have the aircraft fly back to the levee where it could be manually belly landed.
It was at this time that the UF UAS collaboration came to the realization that to fulfill the
1.85 km VLOS radius operational guideline imposed by the FAA, and meet the data
collection needs of many natural resource scientists, especially those conducting
wetlands research, would require a sUAS airframe that could be hand-launched from a
boat, and recovered on the water surface similar to a floatplane. Unfortunately at the
time, no publicly available model aircraft existed that could repeatedly land on the
surface of a waterbody, so the UF UAS collaboration was obligated to brainstorm
alternative solutions while it continued to fly the MLB Company® FoldBat™ UAS within
the 1.85 km VLOS radius for other natural resource-based missions.
As part of the efforts to find ways to comply with the FAA policy while meeting the
data collection needs of natural resource-based users, the UF UAS collaboration
assembled a list of criteria or features that at the time they believed would make for an
‘ideal’ sUAS for use in addressing natural resource-based questions. The list was
established from the experiences that the UF collaboration had realized while fielding
the FoldBat™ UAS, and many of the desired items listed were believed to be achievable
simply with engineering, changes in FAA policy, and continued advances in technology
over time.
In late spring 2002, the UF UAS collaboration met with the UF MAE MAV
Laboratory engineers, and showed them the prototype FoldBat™ (H. F. Percival and P.

160
G. Ifju, University of Florida, personal communication). The MAE contingent recognized
right away that the prototype UA had some design and construction flaws that were
contributing to making routine flight a challenge; however, considering that it was just a
prototype and not a more polished final version, they were quite impressed with several
features of the FoldBat™ including its autopilot system and GCS software which were
particularly advanced for their time (P. G. Ifju, personal communication). The UF UAS
collaborative briefed the UF MAV Laboratory personnel about several of the specific
issues that had been encountered that made fielding the FoldBat™ system perhaps
more difficult, expensive, and less reliable than had been initially anticipated; including
the FAA 1.85 km VLOS radius operational restriction. It was then that the UF UAS
collaborative asked the UF MAE MAV Laboratory if they might be able to develop
something MAV-like, yet larger, that would be simple enough for novice sUAS operators
to fly, save time and money by being constructed (and ultimately repaired when
needed) locally rather than shipping the equipment across the US for service, and meet
as many of the desired criteria for an ‘ideal natural resource-focused sUAS’. Intrigued
by the challenge, the UF MAE MAV Laboratory was onboard for research and
development of a natural resource-based sUAS to succeed the FoldBat™.
Although not knowing it at the time, it was at that late spring 2002 meeting that
the University of Florida Unmanned Aircraft Systems Research Program (UFUASRP)
was essentially established for all extents and purposes. Before that meeting, the
WEC/end-user component, and the GEOM/photogrammetry connection had been built
as the UF UAS collaboration; however, with the addition of the MAE experts to the fold,
the foundations of knowledge needed for a successful academic-based UAS research
161
program with a concentration on natural resource-based applications were officially in
place. What started as an idea after an afternoon seminar in 1999 had come full circle
and developed into what would ultimately become a pioneering academic-based sUAS
research programs in the US, and perhaps the first sUAS research program in the world
to focus specifically on natural resource-based applications.
The UF Tadpole
In the fall of 2002, design and fabrication of a new sUAS specifically for natural
resource-focused applications was completed at UF. The system was constructed to
meet as many of the desired items on the list of criteria as possible, and the resulting
airframe model was named ‘The Tadpole’. From personal conversations with
UFUASRP personnel, the folding main wingset of the prototype MLB Company®
FoldBat™ was probably the weakest physical component of that airframe (H. F. Percival
and P. G. Ifju, personal communication); a situation that was exacerbated by
emphasizing the need for portability of the platform which ultimately was lost in the
durability that a rigid main wingset would have provided. Therefore, the UF MAE team
invested a considerable amount of time and effort into the design and construction of
the main wingset of the UF Tadpole. The additional attention to wing durability was
beneficial as the wings only ever received minor damage during its lifetime of flights.
The resulting 2.0 m wingspan, 3.37 kg takeoff mass, completely electric-powered fixed-
wing airframe was hand constructed from high-density foam, Kevlar®, fiberglass, balsa
wood, and carbon fiber materials for high-strength and the lowest mass possible. The
UF Tadpole had a 0.47 square meter (m2) main wing surface area, and used a high-
aspect ratio LHK2411 airfoil, which improved overall lift (Lee 2004). The propulsion
system for the Tadpole consisted of an AXI® 2028/10 brushless motor with a twin-blade

162
propeller in a conventional tractor configuration, a Jeti® Advance 40 Plus™ brushless
electronic speed controller (ESC), and power was provided by a Thunder Power® 2050
4S4P 14.8 volt (V) 7,600 milliampere-hour (mAh) lithium polymer (LiPo) battery which
gave the aircraft a 22.0 m/sec cruising airspeed, and an average flight time of ≈ 32 min
(Lee 2004). The Tadpole was outfitted with a Procerus Technologies® Kestrel™ v.2.2
autopilot featuring global positioning system (GPS) waypoint navigation, a temperature-
compensated microelectromechanical system (MEMS) inertial navigation system (INS),
a barometric pressure altimeter, and a pitot tube airspeed sensor which were all
monitored on the ground with Procerus Technologies® Virtual Cockpit™ GCS software.
An E2TEK® 12.0 V 1,300 mAh LiPo battery provided electrical power to almost all of the
non-propulsion system electronics in the Tadpole airframe including the autopilot,
control surface servos, and the modems (Lee 2004). According to Lee (2004), the
Tadpole UAS used a Furuno® GH-80 16-channel GPS receiver which provided
positional information for waypoint navigation to the Kestrel™ autopilot unit in the
aircraft, and a pair of Aerocomm® AC4490 spread spectrum 900 MHz modems (a unit
onboard the aircraft and a matching modem at the GCS) to provide a communications
and telemetry linkage between the aircraft and the flight personnel on the ground.
In late 2001, Canon® introduced the ELURA20™ progressive scan camcorder to
the consumer market as a successor to the ELURA2™ model which had been retrofitted
into the MLB Company® FoldBat™ by UF personnel and provided superior imagery to
the smaller and lighter CMOS interlaced sensors that were shipped with the FoldBat™
system. The Canon® ELURA20™ possessed the same optical and physical
specifications as the ELURA2™, having 525-horizontal line RGB video captured with a

163
6.35 mm2 progressive scan CCD imaging sensor producing 0.36 MP resolution and
onboard MiniDV™ 8-mm videotape storage capability, and due to its general success as
the primary imagery collection sensor for the FoldBat™, it was therefore selected as the
primary optical sensor for the UF Tadpole airframe. The ELURA™ payloads used their
original equipment manufacturer (OEM) compact rechargeable batteries for power. The
Tadpole was equipped with a U-NAV® PDC1200™ GPS video overlay device that
imprinted the GPS positional information from the Ketstrel™ autopilot to the video feed
before it was recorded to the onboard cassette tape (Lee 2004). Accuracy analyses
conducted later found that the GPS positional information recorded on the video was
better than not having any information at all; however, a highly significant amount of
error was determined to be present in the positional data, and therefore reliance upon
the on-screen positional coordinates for survey-grade accuracy purposes was deemed
inappropriate (Wilkinson 2007).
The UF Tadpole also carried a small side-mounted Super Circuit® KPC-S900C™
camera which featured a 4.3 mm fixed focal length pinhole lens and a Sony® 6.35 mm2
super hole-accumulation diode CCD sensor producing a 380-line interlaced video
stream (Lee 2004). The Canon® ELURA20™ imagery was recorded to the onboard
MiniDV™ 8-mm videotape at all times during flight, but a Teledyne Relays® ER412D
video feed switch allowed flight personnel to downlink either the ELURA20™ or the side-
looking KPC-S900C™ video stream using a Black Widow AV® 1,000 milliwatt (mW) 2.4
GHz video transmitter on the aircraft to a RF Link® SDX-22LP 2.4 GHz video receiver
on the ground at the GCS for near real-time video monitoring (Lee 2004). The KPC-
S900C™ camera was affixed to the left side of the fuselage under the main wing at an

164
angle 20° below-the-horizon so that if a target of interest to the researchers were to be
encountered during a flight while monitoring the ELURA20™ video feed at the GCS, the
aircraft could be immediately commanded to loiter about the current UA GPS location in
a left bank so that researchers could have an extended look at the target (Lee 2004).
Once the fuselage, main wingset, and tail components were fabricated and
compiled for the UF Tadpole, the propulsion system, avionics, and payload elements
were then integrated into the aircraft. It became apparent as the pieces were being
assembled that preliminary estimations for component mass were underestimated and
lever arm calculations for the placement of components were also affected. As a result,
some mass would have to be removed for the aircraft to achieve flight, and selected
elements would have to be rearranged within the fuselage to attain an appropriate
center of gravity (CG) location (Lee 2004). Lee (2004) determined that the easiest way
to accomplish these tasks was to carefully disassemble the COTS Canon® ELURA20™
camcorder leaving only its OEM battery and parts that were essential for imagery
capture and videotape recording, and movement of components within the fuselage
would resolve the CG issues encountered during system assembly.
The UF Tadpole flew missions from spring 2003 through fall 2006 for the
UFUASRP, with most missions flown at an altitude of 150 m AGL, but ranged from 100–
400 m AGL depending on the target subject of interest (Wilkinson 2007). Flights with
the Tadpole were conducted over a series of natural resource-based targets across the
State of Florida, as well in Idaho and Montana. Within Florida, flights occurred primarily
over areas south of Lake Okeechobee for imagery of nesting wading bird colonies,
aquatic vegetation, and another effort over manatee aggregations. Professors in UF

165
WEC and GEOM, members of the UFUASRP, developed algorithms and software from
both wading bird and aquatic vegetation data collected using the sensor payload system
used aboard the UF Tadpole which was published in several peer-reviewed papers and
presented at professional meetings (Abd-Elrahman et al. 2000, Abd-Elrahman et al.
2001, Abd-Elrahman et al. 2005).
In the late spring of 2005, through a partnership between the UFUASRP and the
Idaho Department of Fish and Game (IDFG), the UF Tadpole was flown over several
leks of Greater Sage Grouse, Centrocercus urophasianus. Among many results
realized from that mission, conducting unmanned flights with the UF Tadpole UAS at
high relative altitudes (400 m AGL) did not seem to cause disturbance to the birds;
however the resulting video imagery resolution of the ELURA20™ payload was
extremely poor at relative flight altitudes greater than 200 m AGL (H. F. Percival,
personal communication). Incremental relative flight altitude reductions of the flight line
transects over the grouse leks in Idaho also revealed that at ≈ 230 m flight altitude AGL,
these particular birds would show a behavioral reaction to the Tadpole UA passing
overhead, and would temporarily cease to exhibit their reproductive rituals (P. E. Zager,
Idaho Department of Fish and Game, personal communication).
As part of the annual meeting of The Wildlife Society held in Madison, Wisconsin
during the fall of 2005, a symposium titled ‘Unmanned Aircraft in Natural Resource
Research and Management’ took place in which the UFUASRP was a prime contributor.
The symposium was attended by ≈ 25 people who were provided with a series of short
presentations, a question-and-answer session, and displays of three different wingspan
UA: the 2.0 m UF Tadpole, and a 60 cm and a 10 cm UF MAV. Those in attendance

166
showed great interest in the use of sUAS to their particular fields of study, with future
development and implementation of this novel tool anxiously awaited.
The UF Tadpole was also flown over four field sites in the National Bison Range
located near Moiese, Montana, in the fall of 2005 as a collaborative effort between the
UFUASRP and the US Fish and Wildlife Service (USFWS). The National Bison Range
flights were designed to capture sUAS imagery of American bison (Bison bison) herds
for population estimates which were at the time conducted exclusively by a combination
of dual-observer manned aircraft surveys and ground-based visual surveys by the
USFWS (Wilkinson 2007).
In the spring of 2006, the UF Tadpole sUAS was flown at the Florida Panther
National Wildlife Refuge east of Naples, Florida, to collect imagery for assessing
vegetative cover and vegetative change in response to intensive physical removal of
willows (Salix sp.) from a pair of ponds as part of an ongoing wetland restoration
project. In the fall of 2006, the Tadpole UAS flew several flights at the Tom Yawkey
Wildlife Center Heritage Preserve, near Georgetown, South Carolina, to census wading
birds in several coastal marsh impoundments.
As flights were concluding in South Carolina with the UF Tadpole sUAS, the
UFUASRP was putting the final touches on a multi-year contractual agreement with the
US Army Corps of Engineers (USACE)–Jacksonville District, for generating a fleet of
sUAS that would potentially assist the USACE efforts at an operational level in invasive
vegetation mapping and herbicide treatment efficacy, and other infrastructure
monitoring applications. The USACE proposal would fund several UFUASRP graduate
students and support a full-time UFUASRP program coordinator to be the ‘point person’

167
for collaboration with the USACE as cooperative funders and sUAS end users, and
coordinate the day-to-day interdisciplinary actions of the various departments and
people involved in the rapidly growing UFUASRP.
During the years in which the Tadpole fixed-wing sUAS was the airframe of focus
of the UFUASRP, a plethora of undergraduate students from various disciplines on the
UF campus became interested in, and/or volunteered with the UFUASRP laboratories
gaining hands-on training and experience with the various aspects of the budding
Research Program. Several of these volunteers and undergraduate hourly employees
went on to become graduate students in the UFUASRP, as their advisors were able to
secure funding sources for research topics specifically related to the UFUASRP
objectives. A M.S. degree-seeking GEOM student completed thesis work on
developing imagery georeferencing techniques for UAS using video data collected from
the 2005 National Bison Range flights of the UF Tadpole (Wilkinson 2007). Wilkinson
(2007) indicated that the UF Tadpole sUAS possessed a number of valuable attributes,
but was still a bit limited in its utility as an aerial imagery sensor platform because the
resultant optical payload video suffered from non-uniform zig-zag motion along the
preplanned flight lines most likely attributed to the inherent positional accuracy errors of
the Furuno® GH-80 receiver (15 m horizontal; 22 m vertical), imperfect tuning of the
autopilot units, and perhaps most importantly, the U-NAV® PDC1200™ GPS video
overlay device which imprinted geolocation data on the recorded videos was found to
be fairly unreliable due to sporadic dropouts and irregular time lags. These issues
made accurate reconstruction of the scene geometry during imagery post-processing an
arduous task (Wilkinson 2007).

168
Several other shortcomings discovered during the fielding of the UF Tadpole
motivated the UFUASRP to pursue the development of a subsequent UA platform that
retained the best features of the Tadpole design, yet implemented newer technology
and novel solutions to address some of the deficits (Wilkinson 2007, Bowman 2008).
For example, the realization that the main wing set of the UF Tadpole was notably
overbuilt and consequently much heavier than initially drawn up on paper that led to a
change in design and construction. Recall that wing durability was a major point of
emphasis during the design phase of the UF Tadpole sUAS as a successor to the
prototype FoldBat™; however, the resulting product was overbuilt. Overall, the UF
Tadpole was much more successful for the UFUASRP during field deployments for
natural resource-based applications, in that the fully electric design of the Tadpole was
remarkably sturdier during flight operations, recorded video data having substantially
less effect from vibration in the absence of a liquid-fueled engine, and presented a
much lower level of disturbance to noise-sensitive targets on the ground (Wilkinson
2007). A few of the other findings with the design, development, and fielding of the UF
Tadpole sUAS included advancements in airframe component prototyping and
composite layup, flight planning techniques for various floral and faunal targets,
autonomous aircraft flight control tuning, data post-processing, and logistics to be
considered when traveling and transporting a sUAS and its crew across the country.
The UF Nova 1 (Polaris)
In the second half of 2006, the UF MAE portion of the UFUASRP spent an
abundant amount of time developing the successor to the UF Tadpole sUAS to rectify
some of the flaws discovered during its tenure. The resulting sUAS airframe was
named the ‘UF Nova 1’, also known as (aka) ‘Polaris’ due to its fuselage-mounted
169
forward-facing single white light emitting diode. A significant push was made to develop
the UF Polaris optical payload system so that it could collect imagery that might lead to
directly-georeferenced end products (Bowman 2008). According to Mohamed and
Wilkinson (2009), direct georeferencing is defined as the computation of the
transformation parameters between an arbitrary input coordinate system [such as that
of an airborne integrated GPS/INS unit], and a global or mapping coordinate system.
The implementation of direct georeferencing can lead to photogrammetric end products
that do not rely on having ground control points (GCP) with measured three-dimensional
(3D) position information within the individual images or the resulting scene, and can
assist in locating specific ground-based focal targets repeatedly over time (Perry 2009).
Direct georeferencing is a significant advantage for natural resource-based aerial
imagery data collection applications in that many of the targeted areas of study are not
easily accessible by BOTG to place and geolocate GCPs, or doing so may undesirably
disturb the target subject. Lisein et al. (2013) describe direct georeferencing as the act
of measuring and recording the exterior orientation parameters, i.e., the 3D position in
relation to the Earth and the attitude (angles of pitch, roll, and yaw) of a remote sensing
optical sensor at the moment of imagery capture, which improves the precision of the
resulting post-processed photogrammetric products. Direct georeferencing enables the
alignment of aerial imagery products with a two-dimensional (2D) or perhaps 3D surface
constructed using a terrestrial-based mapping coordinate system.
Built on a modified Tadpole fuselage design, the UF Polaris sUAS fixed-wing
airframe had a 2.44 m wingspan, 4.80 kg takeoff mass, and was fully electric-powered.
The airframe was constructed using Kevlar®, carbon fiber, fiberglass, expanded

170
polystyrene (EPS) foam, high-strength epoxy-based resin, and epoxy-doped balsa and
spruce wood materials (Bowman 2008). Polaris was constructed with water resistance
for its contents including creation of airtight enclosures for specific avionic and
electronic components. A NACA2313 and NACA0012 airfoil design were used for the
main wingset and tail sections, respectively. The propulsion system of the UF Polaris
consisted of an E-flite® Power 46™ brushless outrunner motor, a three-blade 25.4 cm
diameter propeller in a conventional tractor configuration, and a Jeti® Advance 70 Pro
Opto™ brushless ESC. A single 10,000 mAh, 18.4 V LiPo battery powered all elements
of the Polaris UA through a custom-designed power distribution circuit board. Typical
flight time for an operational flight was ≈ 40 min, the cruise airspeed was 14.0 m/sec,
and the stall airspeed was 10.0 m/sec (Bowman 2008). A Procerus Technologies®
Kestrel™ v.2.23 autopilot system was used in the UF Polaris sUAS which featured a
barometric pressure altimeter, a pitot tube airspeed sensor, a temperature-
compensated MEMS three-axis gyroscope/accelerometer INS, and GPS waypoint
navigation capability via a three-axis magnetometer and a Furuno® GH-81 16-channel
GPS receiver. The aircraft and GCS communication linkages were achieved using
Aerocomm® AC4490 900 MHz spread spectrum modems which provided bidirectional
control and telemetry feeds that were monitored on the ground with Procerus
Technologies® Virtual Cockpit™ GCS software.
Yearning to make incremental improvements from the UF Tadpole to the
airframe, optical payloads, and onboard computing of the new Polaris sUAS, several
details about the optical payload pushed the UFUASRP in new directions. First,
Canon® ended the production of the ELURA20™ camcorder, which made their

171
availability low and replacements difficult to obtain, even on the used market. Second,
the ELURA20™ only permitted collection of video imagery data in the RGB wavelengths
of the EM spectrum, and there was increasing demand for imagery capture in other
spectral regions for certain natural resource-based targets of interest. Finally, the
UFUASRP had realized that directly-georeferencing still images obtained from video
recordings was an extremely difficult endeavor due to inherent errors in isolating the
specific 3D position and attitude metadata information at the instantaneous time of
exposure (Wilkinson et al. 2009). In response to these challenges, the UFUASRP
transitioned to a still frame COTS optical camera with the Polaris sUAS, which reduced
overall payload mass, increased optical sensor resolution, provided a means to capture
imagery in various EM wavelength regions, and improved the ability to synchronize
optical exposure with georeferencing metadata.
The primary optical payload for the UF Polaris sUAS changed several times
during the first few months of testing and tuning. Initially a COTS Canon® PowerShot™
SD600 point-and-shoot still frame RGB camera with a 4.3 × 5.8 mm CCD optical sensor
producing 6.0 MP images was selected. Shortly thereafter, the primary optical payload
was upgraded to a 10.0 MP COTS Canon® PowerShot™ A640 point-and-shoot still
frame RGB camera having a 5.3 × 7.2 mm CCD imaging sensor. By summer 2007, the
primary optical payload was further upgraded to a COTS Canon® PowerShot™ A650
point-and-shoot still frame RGB camera having a larger (5.7 × 7.6 mm) CCD imaging
sensor producing even higher (12.1 MP) resolution imagery (Bowman 2008).
A method of field calibration for the primary optical payload before each flight
was devised to provide a fast and repeatable method of standardizing the resulting

172
imagery and metadata from flight to flight. The COTS PowerShot™ point-and-shoot still
frame cameras were selected by the UFUASRP due to their small form-factor,
increasingly larger sensor sizes and higher sensor resolutions, while maintaining their
relatively low-costs. Because these COTS cameras were not designed or produced by
Canon® as mapping-grade metric imaging devices, the calibration process before each
flight was particularly necessary to capture imagery whose pixels could be used as
scientific data rather than just capturing high-resolution ‘pretty pictures’ of focal targets
or areas (Bowman 2008)(H. F. Percival, personal communication).
A custom-built onboard payload control computer was developed and integrated
into the UF Polaris airframe. This custom computer served as the hub of activity for the
success of the newly designed payload system. Through a reverse engineering
process of the Canon® camera firmware code, the onboard payload control computer
was able to generate simulated electronic signals of button presses on the camera to
create a system of ‘digital fingers’ which could be operated from the remotely located
GCS providing a mechanism to change optical payload settings if desired while in-flight.
The onboard payload control computer also synchronized the captured imagery from
the primary optical sensor with GPS/INS metadata generated by the Procerus
Technologies® Kestrel™ v.2.23 autopilot system. Finally, the onboard payload control
computer was equipped with a pair of DOSonChip™ Secure Digital™ (SD™) memory
card slots: one-each for recording the imagery data, and corresponding GPS/INS
metadata.
By carefully considering the location of the SD™ card slots during the design of
the onboard computer such that they would be in an accessible location within the UA

173
fuselage, time spent on the ground between flights was minimized. Once a flight was
completed, the discharged LiPo system battery could be removed and replaced with a
fully recharged pack, and the two 250 megabyte (MB) SD™ data cards could be
removed from the onboard computer and replaced with formatted empty cards for the
next flight. In a similar fashion to the Canon® ELURA20™ camcorder optical payload
used in the UF Tadpole, the UFUASRP looked to reduce unneeded mass within the
Polaris UA, so the COTS Canon® PowerShot™ point-and-shoot still frame cameras were
delicately disassembled to remove any components determined to be unnecessary for
capturing imagery while aboard the sUAS platform (e.g., flash, battery holder, liquid-
crystal display, external plastic casing, etc.). After disassembly, the primary optical
payload of the UF Polaris was ≈ 35% lighter than a COTS PowerShot™ before being
installing into the sUAS (Bowman 2008).
The UF Polaris sUAS was also equipped with a secondary camera capturing
RGB video located in the nose of the aircraft oriented forward in the direction of flight.
This camera was strictly used for general situational awareness. The small KX-141
circuit board-based video camera featured a 2.8 mm fixed focal length lens and a 480-
horizontal line resolution CCD sensor. The KX-141 camera configuration generated an
≈ 90° field-of-view whose interlaced video output stream was downlinked via a 1,000
mW, 2.4 GHz transmitter to a complementary receiver at the GCS. The resulting video
stream possessed inherent delay, and was not intended or used as a means of first-
person flight; however, the video stream did provide an additional measure of increased
situational awareness to the ground-based flight crew, and was especially helpful during
the tuning process of the autopilot unit for observing minor changes in attitude as the

174
gains were adjusted. The secondary camera video feed could be viewed at the GCS
and on an additional monitor, television, or computer projector, and provided a
‘hypothetical’ view of what an individual might ‘see’ directly ahead if they were aboard
the UA which was a marvelous feature to most spectators at flight demonstrations,
especially to young people, the media, funding managers, or executives who were
ordinarily office- or desk-based.
In addition to the custom hardware (power distribution circuit board, and onboard
payload control computer), two custom software programs, each with a graphical user
interface (GUI) were written to help support the utility of the UF Polaris UAS. The first
program, ‘PolarisLink’, facilitated user interaction with the optical payload from the GCS
while in the field. The use of the PolarisLink software GUI and window showing the
downlinked video stream necessitated that the GCS be equipped with a second
touchscreen monitor so that the Virtual Cockpit™ GCS software interface could occupy
the entire primary computer screen in the field. An additional reason for the creation of
the PolarisLink software was as a video stream switching mechanism for the anticipated
integration of a FLIR® Photon™ 320 uncooled microbolometer thermal infrared (TIR)
camera into the payload options for the UF Polaris sUAS. The Photon™ 320 featured a
324 × 256-line sensor array of 38 × 38 micron pixels, equipped with a 19 mm fixed focal
length lens providing a 36° horizontal field-of-view. At that time, TIR cameras were
being produced almost exclusively for the military, and the sensor units were large and
liquid-cooled for resolution improvements, which added mass and were for the most
part fiscally unattainable with natural resource-scale budgets. The FLIR® Photon™ 320
was perhaps the first TIR unit available on the commercial market that could even be

175
considered as a payload option for smaller UA and was still extremely expensive. With
the help and guidance of FLIR® sales representatives in selecting an appropriate sensor
and lens combination for the UFUASRP desired applications, the representatives
indicated that the TIR camera system ultimately purchased by the UFUASRP would be
a fine product for the anticipated end products. As the UFUASRP discovered after
several test flights with the Photon™ 320, the relatively low spatial resolution and lack of
a sufficiently fine range in temperature sensitivity of the uncooled sensor array, were
ultimately not satisfactory for the sUAS applications of natural resources users with a
UF Polaris UA.
The second custom software program, ‘PolarisView’, was written so that after a
Polaris sUAS flight was completed, the resulting imagery and metadata saved to SD™
cards from the primary optical sensor could be pseudo-registered directly into a Google
Earth® viewer to provide a flat-Earth model of the resultant imagery footprints and their
relative coverage (Bowman 2008). The results of the PolarisView software were not
orthophotomosaics, and multiple-image geometry was not fully integrated into the
software; however, as a first attempt at direct georeferencing for the UFUASRP by
projecting each of the UF Polaris-captured still images to a flat surface, the UF
Research Program was on the right path toward achieving direct georeferencing
capabilities from sUAS-captured imagery (Perry 2009). The culmination of all the UF
Polaris flights provided sufficient proof-of-concept for obtaining outside funding to keep
the UFUASRP moving forward and expanding into the coming years.
The USACE–Jacksonville District sUAS administrators had many goals for the
UFUASRP in funding the research and development of the UF Polaris sUAS. That

176
being said, a goal that seemingly overshadowed all others was for the UFUASRP to
produce a sUAS that would be fully operational by USACE personnel so that they could
fly routine missions independently of UFUASRP assistance as soon as possible (A. C.
Watts, University of Florida, personal communication). To achieve this goal, many of
the other objectives had to be completed first, for example:
1. Producing a pair of fully outfitted UF Polaris airframes with optical payloads and an additional airframe for RC flight training containing a simulated payload
2. Enhancing the reliability and ease of operation of the new airframe and payload designs
3. Training of USACE personnel how to fly RC and then sUAS fixed-wing aircraft 4. Developing flight planning technique manuals for the optical payloads 5. Writing operational user manuals and troubleshooting manuals 6. Teaching basic field repairs 7. Finding an efficient method for post-processing the collected data
Realistically, accomplishing these objectives was projected to take ≥ 30 months
to achieve, but the USACE–Jacksonville District sUAS administrators pushed the
UFUASRP extremely relentlessly so that the Jacksonville District could become
operational in just a fraction of that time.
Most UF Polaris sUAS flights were for airframe and payload testing and tuning in
late 2006 and early 2007, followed by a series of USACE demonstration flights
throughout the remainder of 2007 and into spring of 2008. Missions of the Polaris sUAS
were almost all conducted within Florida, and included flights over agricultural fields
near Archer, flights over water and emergent vegetation at Lake Santa Fe near Melrose,
and USACE–Jacksonville District flight demonstrations arranged by Jacksonville District
sUAS administrators, but conducted by UFUASRP personnel, were flown at Gateway
RC Airpark in northwest Jacksonville, a levee demonstration near Clewiston, a flight
demonstration and USACE–Jacksonville District official acceptance of an operational

177
UF Polaris sUAS platform at Camp Blanding Joint Military Training Center northeast of
Starke in February 2008, followed by a demonstration flight in Vicksburg, Mississippi at
the US Army Engineer Research and Development Center, and a final demonstration
flight at John Stretch Park near South Bay, Florida in March 2008. Ten days before the
February 2008 USACE–Jacksonville District product acceptance flight demonstration at
Camp Blanding, a USACE–Jacksonville District sUAS administrator who had been
training independently to operate as a PIC, successfully assumed PIC duties of a UF
Polaris sUAS during a flight initiated by UFUASRP personnel, and manually landed the
aircraft without incident. During a second flight that day, the same administrator serving
as PIC preceded to auger the Polaris UA into the ground, totaling that airframe and
payload. Using the second of two UF Polaris airframes and payloads constructed for
the USACE–Jacksonville District for the official acceptance flight demonstration at
Camp Blanding, the demonstration in Vicksburg, Mississippi, and the demonstration
near South Bay, which were attended by many high-ranking USACE personnel, the
UFUASRP fully executed those demonstration flights without any issues. After the
USACE dignitaries left the South Bay flight demonstration, the same USACE–
Jacksonville District sUAS administrator who destroyed the first UF Polaris airframe and
payload seven weeks prior insisted that USACE personnel conduct a full flight on their
own with UFUASRP personnel looking on but not actively participating so that the
USACE could be ‘officially operational’. The UFUASRP personnel on hand repeatedly
questioned whether the sUAS administrator really felt ready for the challenge and
provided numerous opportunities for the flight to be called off; but as the liaison for the
funding agency, the administrator was determined to be independently operational, and
178
the UFUASRP personnel on hand felt pressured to comply. With UFUASRP personnel
standing aside, the USACE–Jacksonville District personnel conducted the preflight
checklists, and shortly thereafter, the aircraft was hand launched, and flown directly by
the sUAS administrator serving as PIC into the rocky aggregate composing the landside
slope of the levee upon takeoff, inflicting major damage to both the airframe and
payload (A. C. Watts, personal communication).
Fortunately in the fall of 2007, as testing and tuning of the USACE–Jacksonville
Districts’ UF Polaris airframes and payloads were being conducted, the UFUASRP was
able to pool non-USACE funding from the Florida Fish and Wildlife Conservation
Commission (FFWCC), the South Florida Water Management District (SFWMD), and
the UF Institute of Food and Agricultural Sciences (IFAS) to construct an additional UF
Polaris UA airframe and payload for several scientific research missions in Florida over
the next year. These missions included flights off Cedar Key for a series of floral and
faunal targets, Honeymoon Island west of Dunedin for shorebird surveys, Snake Bight
near Flamingo in Everglades National Park for additional shorebird aggregation
surveys, the Greater Everglades Water Conservation Area-3A (WCA-3A) over tree
islands harboring colonies of nesting wading birds, Seahorse Key for vegetation and
shorebird surveys, and flights over agricultural land for a series of aeronautical and
optical payload tests.
Although limited primarily by the low metadata update rate from the autopilot to
the onboard payload control computer, and also by the inherent error in the autopilot-
caliber GPS/INS components which were accurate enough for navigating the UF Polaris
UA through a flight plan, but not nearly as exact as required for photogrammetry- or
179
mapping-grade standards, the resulting Polaris-captured imagery did enable the
horizontal georegistration of targets within individual frames to a 67.6 m root-mean-
square (RMS) error level (Bowman 2008). Even in 2008, the 67.6 m RMS error was
knowingly large; however, it revealed several key elements for the UFUASRP to
consider as the Research Program moved forward. First, calibration of the optical
sensors was critical for comparing data products. Second, use of the autopilot GPS/INS
as the source of metadata for direct georeferencing of sUAS imagery was clearly an
inferior method for the desired generation of highly accurate, georectified
photogrammetric end products. Third, a higher-end, higher-accuracy, GPS/INS unit,
totally independent from the autopilot, would need to be obtained and integrated as part
of the optical payload to enable the required rates of metadata update and data transfer,
and provide the increased accuracy needed for direct georeferencing of end products.
Lastly, the suggested higher-end GPS/INS unit would be most effective if it were affixed
directly to the imaging sensor device (camera) to both account for any motion of the
imagery sensor within the fuselage of the aircraft, and to reduce the cumulative error
introduced by the boresight and lever arm misalignment effects of separation between
the optical sensor and the GPS/INS unit.
The GEOM personnel of the UFUASRP were satisfied with the resolution that the
sensors in the later COTS Canon® PowerShot™ point-and-shoot still frame camera
models produced; however, the relatively poor lens optics of those cameras led the
GEOM team to recommend that the next primary optical payload for the UFUASRP
feature a COTS digital single-lens reflex (dSLR) camera providing the capability of
180
interchangeable lenses for producing appreciably superior optics, and improved
photogrammetric end products.
Perry (2009) indicated that the naïve projection of UF Polaris-obtained imagery to
a flat surface as produced by the PolarisView software compared poorly to
photogrammetrically adjusted direct georeferenced solutions generated by fully
calibrated metric optical sensors accompanied with higher-accuracy GPS/INS systems.
These professional units were routinely flown on traditional manned aerial survey
platforms where their large volume and mass were not nearly as restrictive as payloads
for sUAS, and had been shown to attain horizontal RMS accuracies on the order of
centimeters (Cramer et al. 2000). The UFUASRP proposed an optical payload design
improvement for the next UF sUAS platform with the goals of direct georeferencing the
captured dSLR imagery, attempting to approach the accuracy of existing manned
aircraft imaging systems using primarily COTS components, and to accomplish these
goals within the confines of a natural resource-scale budget (Perry 2009).
To incorporate the proposed larger dSLR imaging device, and potentially have
payload space to fly a second dSLR simultaneously in the future, the existing UF Polaris
sUAS did not have sufficient planform wing surface area to lift such mass nor space in
the fuselage for carrying such volume. Additionally, the MAE personnel of the
UFUASRP had accumulated several airframe design improvements to assimilate into
the next UFUASRP fixed-wing sUAS platform, e.g., moving from a conventional tail to a
t-tail configuration to keep the horizontal stabilizer and its electronic actuator above the
waterline after an amphibious landing, designing a larger diameter fuselage-to-tail
composite tube that would be stronger and provide a larger grip location under the UA

181
CG enabling easier hand-launching, elevating the motor mounting location to the
highest position on the fuselage to accommodate the largest diameter propeller
possible, and reverting to a pusher-configuration for the motor and propeller to increase
the airflow over the tail control surfaces at low-airspeed/high-rotations per min
experienced during takeoff conditions, and to accommodate mounting the pitot tube as
high above the waterline without airflow interference introduced by other airframe
components or propeller wash.
The UF Nova 2
In late 2007, a new airframe design was drawn up and developed based on
estimated dimensions and masses of the optical payload, onboard computer, system
battery, avionics components, and the anticipated approximate mass of the airframe
materials and hardware. Throughout the spring and summer of 2008, the new airframe
was fabricated, and by fall 2008, the resulting UF ‘Nova 2’ UA prototype was ready for
initial RC flight-testing. With a full slate of missions planned to begin in the coming
months and throughout the following year, after several RC test flights of the prototype
aircraft, the UFUASRP and its funding partners were satisfied with the resulting UA
design to proceed with mass production of the seven additional airframes needed to
meet the contractual obligations of the various funding groups. As the UF Nova 2 UA
prototype was being fabricated and while its initial flight tests were taking place, the
development of a new optical payload system with a COTS dSLR camera and an
independent higher-end GPS/INS was concurrently taking place.
The UF Nova 2 sUAS fixed-wing airframe had a 2.51 m wingspan, which
provided 0.67 m2 of main wing area, a 6.21 kg maximum takeoff mass, and was hand
constructed from high-density foam, carbon fiber, and fiberglass. The propulsion

182
system for the UF Nova 2 consisted of a Scorpion Power Systems® 4025/12 brushless
outrunner motor with a twin-blade 43.2 cm diameter propeller in a pusher configuration,
a Castle Creations® Phoenix-80™ brushless ESC, and power for all UA components
was provided by a single 18.5 V 10,000 mAh MaxAmps® 5-cell LiPo battery which gave
the aircraft a 22.0 m/sec cruising airspeed, and an average flight time of ≈ 40 min for
flights conducted with ground elevations near sea level. The UF Nova 2 UA used a
Procerus Technologies® Kestrel™ v.2.3 autopilot featuring GPS waypoint navigation, a
temperature-compensated MEMS INS, a barometric pressure altimeter, and pitot tube
airspeed sensor, which were all monitored at the GCS through Procerus Technologies®
Virtual Cockpit™ software. A UBlox® LEA-5H™ code-solution single-frequency GPS
module directly mounted to a copper ground plane antenna provided positional
information for waypoint navigation to the Kestrel™ autopilot onboard the aircraft, and
Maxstream® 9XTend™ 900 MHz spread spectrum modems were used to provide
bidirectional communication and telemetry linkages between the aircraft and the GCS.
A preplanned flight path was designed and uploaded before each aircraft launch and
autonomously executed by the UA with a level of precision exceeding that of a human
pilot. As with previous Procerus Technologies® autopilots, this version allowed
instantaneous flight plan changes, a user-friendly GUI, and an abundance of failsafes to
ensure positive aircraft control and promote the safety of other objects in the air and on
the ground.
The standard optical payload for the UF Nova 2 sUAS consisted of a COTS 10.0
MP Olympus® E-420™ dSLR still frame camera with a fixed focal length 25 mm
Olympus® Zuiko Digital™ ultra-compact f/2.8 ‘pancake’ lens equipped with a Hoya® HMC
183
ultraviolet filter. The E-420™ natively captured RGB wavelength imagery with its 17.3 ×
13.0 mm Micro Four-Thirds ‘Live MOS’ imaging sensor. The Live MOS sensor of the
Olympus® camera produced high-quality imagery and had the dynamic sensitivity range
of a CCD array, but through advancements in technology, it only drew the power of a
typical CMOS sensor. The Olympus® E-420™ was selected because at the time it was
the smallest and lightest dSLR on the market, and offered a software development kit
that allowed control of the camera settings and a method of digital exposure triggering
which was essential for the continued efforts of the UFUASRP to capture directly-
georeferenced imagery. The optical payload was outfitted with an independent, higher-
accuracy GPS/INS unit; a commercially available Xsens® MTi-G™ that was
hypothesized to provide major improvements in 3D position, attitude, and data update
rates over the comparatively coarse devices used by the UA autopilot system. All of the
imagery from the optical sensor, and the telemetry metadata from the MTi-G™ were
synchronized through a custom circuit board device, which both initiated a shutter
exposure, and timestamped each captured image with a telemetry data packet at the
exact moment of maximum shutter aperture. The custom synchronization board was
dubbed the ‘Burrito’ by the UFUASRP, due to initial versions being fairly large and
wrapped for protection in white rubberized foam; having an appearance much like the
tortilla-wrapped edible item. Over time, the ‘Burrito’ synchronization board got smaller,
faster, and looked less like the original component; however, the ‘Burrito’ name
persisted. Imagery and the telemetry data were stored together aboard the aircraft on a
VIA Technologies® EPIA-P700-10L™ Pico-ITX form-factor x86 computer running
Microsoft® Windows© XP™ with a 1.0 GHz VIA C7™ processor, 1.0 gigabytes (GB) of

184
system memory, and an 80 GB solid-state hard drive. The entire payload system was
integrated with a series of universal serial bus (USB) 2.0 interfaces.
With the Nova 2 sUAS conducting most of its flights over wetland environments,
efforts were made to try to keep as many of the electronic components within the
fuselage resistant to water. The autopilot unit aboard the aircraft was outfitted with its
own sealed composite box to protect it from moisture; meanwhile the ESC, modem, and
onboard computer were all positioned relatively high within the fuselage as a means to
try to protect them from small amounts of water that might enter the fuselage during
amphibious landings. As an additional means to keep water out of the fuselage, the
fully loaded aircraft was designed with an increased distance from the waterline when
floating on the water surface to the main payload hatch. All of these approaches
assisted in trying to keep the sensitive electronic components contained within the UF
Nova 2 from failing due to small amounts of water entering the fuselage.
In an endeavor to facilitate the potential need to obtain replacement parts for the
UA and/or its optical payload while in remote locations (places where natural resource
sUAS-users often operate), extra consideration was imparted into the design and
construction of the UF Nova 2 sUAS. With the exception of the hand-fabricated
composite airframe elements, and the custom timing synchronization circuit board, the
remainder of the UF Nova 2 was built from items that could be obtained commercially
with relative ease. By adhering to this model, when the Nova 2 needed a replacement
part, a field-based flight crewmember would have a spare on hand, could potentially find
a replacement in the nearest town/city, or go online to a distributer and place an order to
have items overnighted to the closest parcel-delivery location; thereby losing as little

185
fieldwork time as possible, and essentially eliminating the possibility of having to
completely terminate a mission due to unavailability of obtaining replacement parts. For
UF Nova 2 custom-made elements, a minimum of at least a spare of each item was
brought into the field for every mission, and for extended missions, multiple spares
accompanied the flight crew. In keeping with the ease of replacement model, every
effort was made to be able to directly swap a faulty component with a replacement
without extensive modifications that took expertise, training, and significant time, e.g.,
removing the ‘non-essential’ body parts of a camera, rewiring a power distribution
board, soldering connectors to specialty wire connectors, etc., which had been a
constituent of UFUASRP systems before the Nova 2 sUAS.
A typical consumer who purchases a COTS dSLR is looking to capture imagery
within the RGB wavelengths of the EM spectrum. The cones within the retina of the
normal human eye are generally sensitive to EM wavelengths in the range of ≈ 400
nanometer (nm) (deep violet color) to ≈ 700 nm (deep red color). Because of this,
optical sensors within consumer digital cameras are composed of millions of
photodiodes that are designed to measure and record the intensities of EM wavelengths
within the RGB spectrum. Human bodies are subjected to various EM wavelengths in
regions making up the entire EM spectrum, e.g., ultraviolet rays, microwaves, radio
waves, etc.; however the human eye is not capable of naturally ‘seeing’ these other EM
wavelengths. According to (Stark and Chen 2014), the sun produces most of its energy
within the RGB range of the EM spectrum; however, the sun emits slightly more NIR
than RGB wavelength light. Therefore, nearly all COTS dSLR cameras are equipped
with a NIR ‘cut’ (aka: ‘low-pass’ or ‘hot’) filter directly in front of the optical sensor which
186
eliminates NIR wavelengths of the EM spectrum from reaching the sensitive optical
sensor sites as they measure and record RGB light intensities. If this NIR filter were
carefully removed from the camera optical sensor, the resulting imagery would appear
overexposed due to the noise introduced by NIR wavelengths overwhelming the optical
sensor photodiodes with both RGB and NIR wavelengths. However, if a calibrated filter
blocking a range of wavelengths in a portion of the RGB spectrum is installed where the
native ‘cut filter’ had been, the total range of EM light that can reach the optical sensor
is reduced to a manageable level for the photodiode sensor sites.
The UFUASRP sent off two of its Olympus® E-420™ dSLR camera units to
Spencer’s Camera & Photo (Alpine, Utah, USA) who specialize in converting COTS
natively RGB optical sensors into sensors that can capture imagery in portions of the
NIR spectrum. Spencer’s uses the cut filter removal method, and replaces them with an
‘infrared (IR) pass filter’ which permits a user-defined portion of the NIR spectrum to be
captured by the photodiodes of the optical sensor in lieu of a user-defined range of
wavelengths in the RGB-portion of the EM spectrum. For example, individual
photodiodes that make up a typical COTS digital camera optical sensor are sensitive to
red, green, and blue wavelengths. During an RGB camera exposure, each individual
photodiode making up the optical sensor simultaneously measures the intensity of red,
green, and blue light at a sensor site, whereby a composite of all the sites can be
assembled forming an RGB image. However, the same COTS digital camera optical
sensor that has undergone the most common NIR filter exchange modification will no
longer be exposed to violet and blue visible color wavelengths; instead what was NIR,
red, and green to the normal human eyes will be captured and reproduced as red,

187
green, and blue, respectively, by the modified camera sensor. Light wavelengths in the
NIR spectrum are absorbed and reflected differently by objects on Earth; and when this
information is captured and used appropriately, it can help to determine features such
as soil moisture, plant health, and other factors that are not visible to normal human
eyes.
Due to the collaborative work with the USACE–Jacksonville District, the
UFUASRP was able to earn a Certificate of Aircraft Airworthiness in October 2008 from
the Department of the Army at Redstone Arsenal who certify the entire US Army drone
inventory. With the Certificate of Aircraft Airworthiness, and through a Memorandum of
Agreement (MOA) between the US Department of Defense (USDOD) and the FAA, the
UFUASRP was able to achieve clearance to fly low-altitude (≤ 366 m AGL) missions
with the UF Nova 2 sUAS throughout large portions of the National Airspace System
(NAS). Some of the earliest UF Nova 2 sUAS flights were achieved at a nearby
National Guard training site, and subsequent missions with the USACE in and around
Lake Okeechobee, the Greater Florida Everglades, and nearshore coastal areas of the
LSCKNWR which were ideal places to conduct low-altitude aerial missions because
they contained significant ecological targets, were essentially uninhabited by people,
and were nearly uniform in elevation.
The Nova 2 sUAS completed 17 missions within Florida using a combination of
RGB and NIR optical sensors for a total of 53 flights from fall 2008 through summer
2009. Missions included: 1) conducting research and development of optical sensor
calibration techniques by integrating real-time kinematic (RTK) surveyed GCPs and
imagery metadata provided by the higher-end GPS/INS unit in north-central Florida; 2)
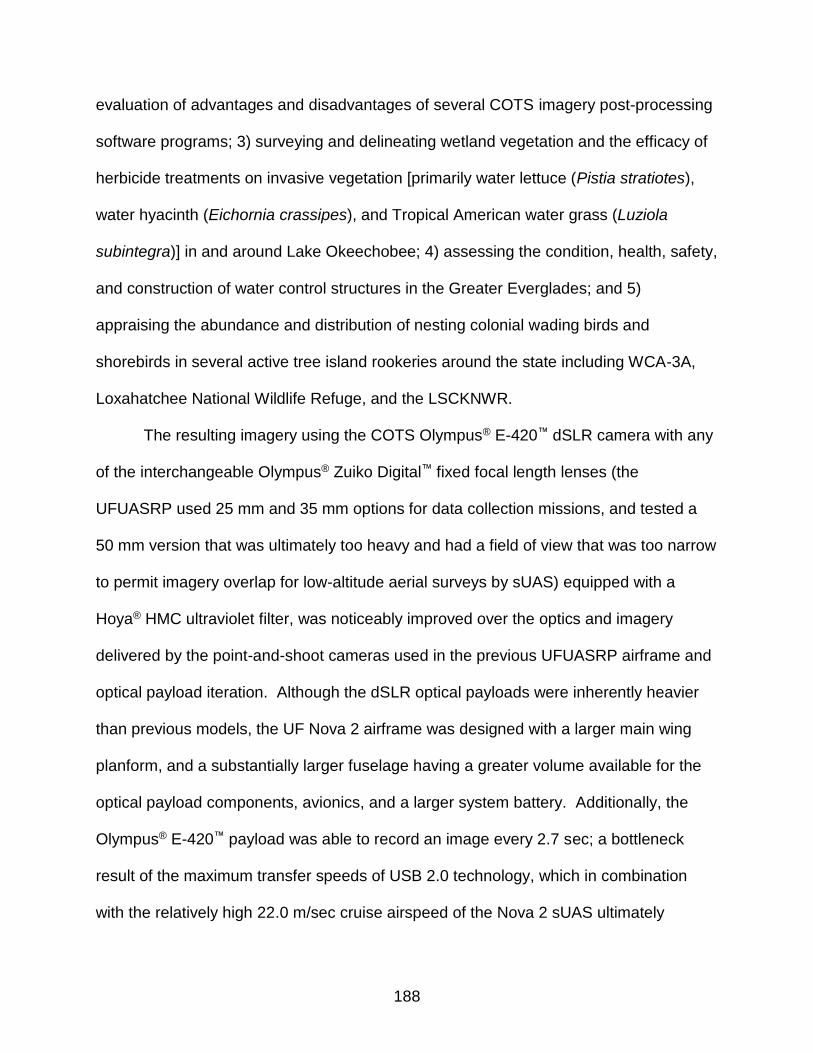
188
evaluation of advantages and disadvantages of several COTS imagery post-processing
software programs; 3) surveying and delineating wetland vegetation and the efficacy of
herbicide treatments on invasive vegetation [primarily water lettuce (Pistia stratiotes),
water hyacinth (Eichornia crassipes), and Tropical American water grass (Luziola
subintegra)] in and around Lake Okeechobee; 4) assessing the condition, health, safety,
and construction of water control structures in the Greater Everglades; and 5)
appraising the abundance and distribution of nesting colonial wading birds and
shorebirds in several active tree island rookeries around the state including WCA-3A,
Loxahatchee National Wildlife Refuge, and the LSCKNWR.
The resulting imagery using the COTS Olympus® E-420™ dSLR camera with any
of the interchangeable Olympus® Zuiko Digital™ fixed focal length lenses (the
UFUASRP used 25 mm and 35 mm options for data collection missions, and tested a
50 mm version that was ultimately too heavy and had a field of view that was too narrow
to permit imagery overlap for low-altitude aerial surveys by sUAS) equipped with a
Hoya® HMC ultraviolet filter, was noticeably improved over the optics and imagery
delivered by the point-and-shoot cameras used in the previous UFUASRP airframe and
optical payload iteration. Although the dSLR optical payloads were inherently heavier
than previous models, the UF Nova 2 airframe was designed with a larger main wing
planform, and a substantially larger fuselage having a greater volume available for the
optical payload components, avionics, and a larger system battery. Additionally, the
Olympus® E-420™ payload was able to record an image every 2.7 sec; a bottleneck
result of the maximum transfer speeds of USB 2.0 technology, which in combination
with the relatively high 22.0 m/sec cruise airspeed of the Nova 2 sUAS ultimately
189
influenced the imagery footprint overlap that resulted from flights with the Nova 2 UA
airframe and optical payload combination. The independent higher-accuracy Xsens®
MTi-G™ GPS/INS unit directly affixed to the E-420™ dSLR camera body provided an
incredible improvement in the collection of imagery metadata which facilitated directly-
georeferenced images, and subsequent imagery end products, confirming the
UFUASRP hypotheses about its use. The UFUASRP was able to routinely achieve a
relative ground accuracy of ≤ 1.0 m in spatially registered imagery products, and actual
spatial resolution of ≤ 3 cm with the UF Nova 2 sUAS and its’ optical payloads (Perry
2009).
Obstacles that were encountered during the fielding of the Nova 2 sUAS included
situations where small amounts of water would enter the fuselage during an amphibious
landing. Generally a small collection of water would gather in each of the fuselage skid
channels after a water landing which did not cause any problems until the airframe was
lifted off the water surface, and the pooled liquid in the skid channels would tend to
move about, often leaving water droplets on the camera lens filter or on the interior
surface of the through-fuselage glass panel over which the camera and lens were
positioned. When this occurred, almost all of the fuselage contents would have to be
carefully removed and appropriately dried in the field so that subsequent flights could
take place without potential electronics damage or inhibited optical clarity.
After many dunk tests in the laboratory, it finally was determined where the water
was entering the fuselage. Two areas, which were difficult to necessarily recreate: 1) at
the tail boom/fuselage interface; and 2) through areas of the fuselage ‘skin’ lacking
adequate composite materials. At the location where the tail boom connected to the

190
fuselage, minute conduits would form between the applied caulking and the fuselage
skin due to dynamic stresses induced at this location as the grip for hand-launching the
airframe. Routine water testing in the laboratory was generally conducted with
airframes that had been freshly re-caulked at the fuselage and tail boom connection;
therefore, they had not been subjected to the dynamic stresses of a hand-launch which
was causing the opportunity for water entry observed in the field. Additional laboratory
testing also revealed that due to the mass production of eight airframes in a short
period, not all of the fuselages were laid up during hand-fabrication with equal layers of
carbon fiber fabric or epoxy resin. Closer attention to detail and documentation of each
step completed during each fuselage layup would have prevented this situation from
occurring in the first place.
Another shortcoming of the Nova 2 sUAS was that in the efforts to make the
fuselage as waterproof as possible, there was essentially no airflow within the fuselage.
As the UFUASRP learned quite quickly during an initial flight for a mission in south
Florida, when all of the UF Nova 2 UA electronic equipment was running, a tremendous
amount of byproduct heat was produced. Coupling the derivative heat generated by the
electronics in a sealed fuselage with the ambient temperatures of south Florida, led to
audible warnings by both the ESC and the autopilot, that those components were
approaching the upper limits of their operational temperature ranges. Upon hearing the
audible warnings, the aircraft was safely landed, and once the main payload hatch was
opened, the component temperatures rapidly cooled. To remedy the ESC temperature
issue, a small hole in the fuselage was made over the ESC attachment location and an
aluminum heatsink was externally affixed. The ESC unit itself was internally mounted to
191
the external heatsink using thermal epoxy. Additionally, a conscious effort was made as
part of the standard operating procedures (SOPs) for the Nova 2 sUAS to keep the
fuselage shaded during periods of non-flight, i.e., repositioning transit, preflight, and
post flight, which helped keep the electronic components contained within the fuselage,
especially the autopilot unit inside its watertight composite box, from overheating while
on the ground or on the deck of a boat.
Ultimately the UF Nova 2 sUAS ended up becoming practically too heavy for its
main wing design, and complicating these issues was the fact that the airframe was
becoming more and more nose-heavy from efforts to keep water out of the fuselage by
applying various sealants excessively throughout the fuselage shifting the CG location
further and further forward. While flight with the UF Nova 2 was still achievable even
with its increasing mass, maintaining straight and level flight conditions was difficult
under manual control, and the general success of hand-launching the progressively
heavier aircraft began to decline. Finally, as a result of the UF Nova 2 airframes being
constructed primarily out of carbon fiber due to its relative ease and speed of layup, and
since carbon fiber is an electrical conductor, ultimately did cause radio frequency
interference and antenna ‘shadowing’ between the GCS and the airframe during initial
flight testing. Repositioning the various antennae onboard the aircraft resolved these
issues.
While the UFUASRP was able to complete a number of valuable missions with
the UF Nova 2 sUAS, and continue its hallmark of steady learning, identification of
operational limits, and evolution of various sUAS techniques for natural resource-based
applications, it became quite apparent that perpetual attempts at retrofitting the UF
192
Nova 2 airframe design to keep water out of the fuselage were simply ineffective. As
electronic components began to succumb to issues resulting from water entering the
fuselage, the entire UFUASRP gathered together with its cooperators and collectively
decided that it was in the best interest of all involved to design another airframe to
reliably carry the optical payload components of the UF Nova 2 over focal targets of
natural resource-based sUAS applications. Allocating additional time, effort, and
money, into makeshift solutions to inherent flaws in the airframe design and
construction of the Nova 2 UA was simply going to exhaust all remaining funding
without fulfilling the contracted deliverables. The UF MAE team provided some
rudimentary sketches of a proposed airframe that could theoretically resolve many of
the UF Nova 2 issues. Those sketches would ultimately lead to the next fixed-wing
airframe design in the UFUASRP lineage.
The UF Nova 2.1 (Mako)
As mentioned, the UF Nova 2 UA airframe had several fundamental problems
that could not be retroactively engineered out while staying under budget and with
collecting overlapping still imagery of natural resource-based targets as the primary
UAS application, maximizing the runtime and ground area coverage of each flight was
extremely important. With this in mind, the UFUASRP retained the best features of the
UF Nova 2 airframe, including most of the optical payload, and designed an aerial
platform around the calculated mass and volumes of the avionics, optical payload,
system battery, and anticipated airframe materials and hardware into an airframe which
emulated many aeronautical features of a glider; having a main wingset with a large
planform surface area, general thinning and decambering of the wing from the root
toward the tips, and polyhedral, taper, and sweep to generate maximum lift and
193
minimize parasitic drag due to laminar flow separation. During the fall of 2009, the
UFUASRP produced the prototype UF Nova 2.1 sUAS (aka: Mako). The fully loaded
6.0 kg at takeoff, fixed-wing airframe had a 2.74 m wingspan, which provided a 0.82 m2
main wing area, and was outfitted with a v-tail ruddervator to minimize drag that other
empennage configurations would have eclipsed. The fuselage was constructed using a
Kevlar® and epoxy resin laminate with strategic carbon fiber reinforcements that
provided high-strength and radio frequency transparency. Significant features
incorporated into the fuselage design included a single deep-basin lower fuselage
section that composed most of the total fuselage surface including a contoured area
under the gasketed main wing-to-fuselage attachment hatch to assist hand-launching
techniques, a single upper fuselage section on which the interior surface served as a
location for affixing many of the electrical components, and a joggle seam (similar to the
junction that holds two halves of a plastic Easter egg together) which projected
downwards ≈ 2.0 cm from the interior ventral portion of the upper fuselage section
creating a strong seam with ample surface area for a continuous bead of adhesive to
bond and seal the upper and lower fuselage sections together. The fuselage seam was
purposely located extremely high above the waterline to reduce potential conduits for
water entry.
The wings and the tails of the UF Nova 2.1 were constructed with dense
extruded Styrofoam™ cores that were cut in-house from customized computer-aided
design (CAD) files on a laptop computer connected to a computer numerical control
(CNC) hot wire cutting machine to produce an SD7032 airfoil for the main wingset which
tapered toward the tips, and a progressively blended HT14 to HT12 airfoil for the v-tail
194
members. The custom-cut wing cores were then reinforced with a thin strip of aramid
fiber along the leading edge for integrity, and then covered with several layers of
fiberglass and epoxy resin to create a skin for lamination using vacuum bagging and
heat curing composite material layup methodologies. The main wing was divided into
three sections for portability during transport but retained horizontal rigidity with minimal
lift-induced bending moments at the wing joints when assembled via embedded
aluminum joiner tubes and small anti-rotation pins. In the design of the ruddervator,
efforts were made to make it both easily attachable and removable. Additionally,
rotational drive systems affixed to the control surface actuators were used throughout
the airframe wings and tails to move the control surfaces of the UF Nova 2.1; a design
feature which prevented any electrical connections from having to bridge removable
segments of the wing or tail, further improving the water resistance of the aircraft and
reducing the opportunity for amphibious landings to damage electrical components due
to shorts in wire connectors bridging wing segments. The larger area of the control
surfaces aided in achieving and maintaining straight and level flight by minimizing the
amount of actuator throw input needed to initiate changes in the aircraft attitude and/or
altitude. After several years of field experience working from the relatively cramped
quarters of an airboat deck to assemble and preflight previous UF sUAS airframes, the
Nova 2.1 sUAS was designed to be as tool-free as possible by using knurled thumb
screws for main wing attachment and forward payload hatch closure allowing for quick
access to components within the fuselage, and for rapid field assembly and breakdown.
The propulsion system of the UF Nova 2.1 consisted of a NeuMotors® 1509-1.5Y
6.7:1-geared and fanned brushless electric motor, spinning an Aeronaut CAM® 45.2 cm

195
diameter folding propeller in a conventional tractor configuration. When the motor
would be commanded to stop spinning during routine gliding flight, or especially during
the later stages of a landing sequence, the blades of the propeller would fold flat
anteriorly against the fuselage, reducing induced drag while in flight, and protecting the
propeller blades from damage during landings. A Castle Creations® Phoenix Ice 100™
brushless ESC was selected to regulate the motor, and a single 18.5 V 10,000 mAh
MaxAmps® 5-cell LiPo battery powered all onboard systems. The aircraft had a 15.0
m/sec cruise airspeed, an 11.0 m/sec stall airspeed, and an average flight time of ≈ 50
min for flights conducted with ground elevations near sea level. The UF Nova 2.1 UA
used a Procerus Technologies® Kestrel™ v.2.4 autopilot featuring a barometric pressure
altimeter, a pitot tube airspeed sensor, GPS waypoint navigation, and a temperature-
compensated MEMS INS, which were all monitored at the GCS through Procerus
Technologies® Virtual Cockpit™ software. A UBlox® LEA-5H™ code-solution single-
frequency GPS module directly mounted to a copper ground plane antenna provided
positional information for waypoint navigation to the Kestrel™ autopilot onboard the
aircraft, and Microhard® Nano™ 900 MHz spread spectrum modems were used to
provide bidirectional communications and telemetry linkages between the aircraft and
the GCS.
As with previous UFUASRP fixed-wing airframes, the UF Nova 2.1 sUAS was
designed to be hand-launched to eliminate the need for hauling specialized launching
equipment, and was fabricated for belly-landings on relatively flat terrestrial terrain or on
the surface of a water body. Operational reliability was enhanced for the Nova 2.1 UA
by utilizing the autonomous takeoff and landing flight modes incorporated into the
196
Kestrel™ autopilot unit. During each preflight, the autopilot was programmed with a
user-designed flight path based on specific flight goals, payload capabilities, and
ambient environmental conditions. Additionally during preflight, the onboard autopilot
unit was uploaded with detailed failsafe procedures so that if bidirectional
communications were lost while the aircraft was in flight, the UA would transition
seamlessly into a sequence of failsafe protocols allowing adequate time for
communications to be reestablished while proactively making its way into a controlled
loiter about the GCS and aircraft operator. If bidirectional communication
reestablishment failed to occur after a user-defined period of time, the autopilot unit
would autonomously initiate a controlled descent and landing approach sequence for
the UA at a user-defined location as part of the failsafe protocols uploaded before each
flight.
Reliable sUAS operations in wetland areas necessitated a waterproof platform,
so the UF Nova 2.1 fuselage used numerous waterproofing features. The electric motor
generated a significant amount of byproduct heat; therefore, a motor compartment in
the nose of the airframe was isolated from the rest of the main fuselage with an interior
watertight composite bulkhead. The motor compartment assisted in reducing motor-
generated heat from adding to the total heat budget within the main fuselage, and
allowed the strategic placement of several small openings to facilitate ambient air-
cooling of the fanned motor, the motor compartment, and a method of draining any
water droplets that might enter the motor compartment. During aircraft fabrication, the
smooth metallic exterior can of the geared electric motor was inserted into a custom-
milled sleeve portion of an aluminum block heatsink that bridged the interior of the

197
motor compartment with ambient air moving over the fuselage. The exterior surface of
the motor heatsink was flat and nearly flush with the fuselage which provided very little
surface area for heat transfer; however, the motor block heatsink was equipped with six
vertically drilled holes for accepting up to six Thermacore® copper heat pipe
temperature dissipation tubes which increased surface area, thermal conductance, and
substantially wicked away heat generated by the motor. All of these methods
simultaneously reduced the negative effects of thermal damage on the electric motor
used for propulsion of UF Nova 2.1 aircraft; therefore increasing the overall motor
efficiency and lengthening its service life.
The sealed main fuselage of the UF Nova 2.1 UA contained most of the onboard
electronic components including the optical payload, and was outfitted with
advantageously placed heatsinks and heat dissipation devices. An externally mounted
aluminum heatsink with substantial surface area was thermally epoxied directly to the
ESC unit. Also in the main fuselage, the autopilot unit was placed within a custom-
milled aluminum box having waterproof connectors for both wiring and tubing interfaces
to provide an added layer of water protection and promote heat transfer away from the
thermally sensitive autopilot unit itself. The onboard computer natively supported an
onboard brushless system fan to direct cooling ambient air over heatsinks affixed to
critical onboard computer chips. Upon further investigation it was determined that the
system fan of the onboard computer provided essential air movement and thermal
benefits to all components within the sealed main fuselage of the UF Nova 2.1 sUAS
(Figure A-1).

198
Retaining the standard optical payload that was used for the UF Nova 2 sUAS,
the UF Nova 2.1 continued to use a COTS 10.0 MP Olympus® E-420™ dSLR still frame
camera with a fixed focal length 25 mm Olympus® Zuiko Digital™ ultra-compact f/2.8
‘pancake’ lens equipped with a Hoya® HMC ultraviolet filter. The E-420™ natively
captured RGB wavelength imagery with its 17.3 × 13.0 mm Micro Four Thirds Live MOS
imaging sensor. Two additional COTS Olympus® E-420™ dSLR RGB cameras were
shipped to Spencer’s Camera & Photo for low-pass IR filter replacement that enabled
the cameras to collect imagery in a portion of the NIR spectrum in the place of visible
violet and blue wavelengths. All of the optical payloads were outfitted with independent
high-accuracy Xsens® MTi-G™ combination GPS/INS units and antennae that provided
enhanced 3D position, attitude, and data update rates compared to similar devices used
by the UA autopilot system. All of the imagery from the optical sensor, and the
telemetry metadata from the MTi-G™ were synchronized through a custom circuit board
that both initiated a shutter exposure and timestamped each captured image with a
telemetry data packet at the exact moment of maximum shutter aperture. Imagery and
the telemetry data were stored together aboard the aircraft on a VIA Technologies®
EPIA-P700-10L™ Pico-ITX form-factor x86 computer running Microsoft® Windows© XP™
with a 1.0 GHz VIA C7™ processor, 1.0 GB of system memory, and an 160 GB solid-
state hard drive. The entire payload system was integrated with a series of USB 2.0
interfaces which allowed imagery to be captured every 2.7 sec.
Due to the time lapse between successive imagery exposures, imagery payloads
were oriented with the longer axis of the sensors parallel to the direction of flight. By
positioning the sensors in this configuration, sequential images possessed a higher
199
endlap percentage than if the imagery were collected with the shorter axis of the sensor
parallel to the direction of flight. Tradeoffs between resultant imagery resolution and
imagery overlap for generating the desired end products had to be decided prior to each
flight.
The UFUASRP has used the fixed-wing UF Nova 2.1 sUAS for an extended
period of time (eight years to date – the longest of any single UF design) due to its
rugged construction, general utility, and ability to meet the needs of many of the natural
resource-based data collection applications a fixed-wing sUAS platform of its size can
deliver. However, just because the UFUASRP has not designed a new fixed-wing
airframe in quite some time, the Research Program has continued to examine, develop,
and test ways to use technological advances in many areas pertaining to sUAS for
natural resource-based data collection such as optical sensors, payload architecture,
avionics, aircraft controls, mission planning, data post-processing, end products, etc.,
through the support of its funding cooperators.
With interest in sUAS technology for commercial and industrial interests
increasing at exponential rates, and with a surplus of companies looking to provide
products to meet those demands, many of the electrical components used in the initial
UF Nova 2.1 airframes were soon being replaced on the COTS electronics market with
newer, faster, and smaller devices. For example, the Olympus® E-420™ dSLR was
discontinued shortly after the UF Nova 2.1 began operational missions, so the
UFUASRP proactively bought up a few of the remaining units that were available and
still affordable while researching newer dSLR options. Finding a dSLR RGB (and
potential NIR) successor on the COTS market that offered a software development kit
200
was more difficult than initially anticipated as most consumer camera companies
ceased access to their proprietary firmware codes. Xsens® announced that the MTi-G™
model GPS/INS would soon be discontinued and replaced with a similar, slightly smaller
but more expensive version; therefore questions about the output format and timing of
the metadata packets of the new GPS/INS unit and its compliance with existing ‘Burrito’
synchronization hardware and software code became concerns to the UFUASRP.
As an academic-based Research Program, the UFUASRP was accustomed to
having students at all levels join the Program for various lengths of time; some
volunteering for a semester or two to gain hands-on experience, others working hourly
on a regular schedule seeking letters of recommendation before they graduate, and still
others had lengthy tenures with the Program as undergraduate and/or graduate
students before moving on to new opportunities as they became available. Generally
speaking, rates of ingress and egress of student personnel had been nearly equivalent
and predictable for the UFUASRP through 2011; however in summer 2012, about the
time that operational field missions with the UF Nova 2.1 sUAS were scheduled to
increase, and the need to update and integrate new electrical components into the UA
was taking place, a significant change in student personnel occurred that temporarily
impeded progress.
A new cohort of students were brought into the UFUASRP to replace the exiting
personnel, however the amount of time to mentor the incoming individuals with the
institutional knowledge on how to build, troubleshoot, and repair UF Nova 2.1 sUAS
airframes, existing payloads, and conduct flights under established SOPs was short.
With the introduction of new students into the Research Program came fresh thoughts

201
and ideas, which historically had been an advantageous characteristic of the UFUASRP
in keeping the Research Program on the cutting edge of UAS technology; especially
about applications pertaining to natural resource-based questions. The incoming group
of new personnel into the UFUASRP during this particular transition was no different;
i.e., regarding the onboard computer there was particular interest in 1) moving from a
Microsoft® Windows© operating system to an open source Linux®-based Ubuntu
operating system; 2) progressing from an x86 computer board to a smaller and lighter
ODROID-U3®; and 3) writing new computer code to accommodate the implementation
of the two proposed changes to the onboard computer system. Several COTS dSLR
cameras were purchased for bench testing and payload integration assessments as
potential RGB optical sensor replacements into the novel optical payload framework
that had been proposed. The UFUASRP experimented with an 18.0 MP Canon® EOS-
M™, an 18.0 MP Canon® EOS-Rebel T2i™, a 24.3 MP Sony® α6000™, and a 36.0 MP
Sony® α7R, all of which presented issues of some sort that prevented each of them
from being a viable option as an RGB (and NIR) sensor for the updated UFUASRP
optical payload.
The most recently tested alternative COTS dSLR camera ended up becoming
the sensor of choice as a successor to the discontinued Olympus® E-420™: a Canon®
EOS-Rebel SL1™ 18.0 MP dSLR with a fixed focal length Canon® EF 40 mm f/2.8
Stepping Motor™ lens equipped with a Hoya® HMC ultraviolet filter. The COTS SL1™
captured RGB wavelength still frame imagery with its 22.3 × 14.9 mm CMOS sensor.
Several SL1™ bodies were sent to Spencer’s Camera & Photo to have the low-pass IR
filter over the optical sensor exchanged for a filter that allowed the optical sensor to

202
collect visible green, red, and a portion of the NIR spectrum wavelengths, as had been
done previously with other UFUASRP COTS dSLR optical sensors. The camera bodies
were affixed with independent high-accuracy Xsens® MTi-G-700™ GPS/INS units to
provide 3D position and attitude metadata of the optical sensor with accuracy superior
to that of the devices used to navigate the aircraft from waypoint to waypoint. As with
previous UFUASRP optical payloads, all of the imagery from the optical sensors and the
telemetry metadata from the MTi-G™ units were synchronized through a custom circuit
board device that both initiated a shutter exposure, and timestamped each captured
image with a telemetry data packet at the exact moment of maximum shutter aperture.
The imagery and telemetry data were stored together aboard the aircraft on an
ODROID-U3® Linux®-based Ubuntu operating system with a 1.7 GHz quad-core
processor, 2.0 GB of system memory, and data storage on a 128 GB Class 10
MicroSD™ card. The payload was integrated with USB 2.0 interfaces, and was able to
collect imagery every 2.5 sec (Figure A-2).
Just as it had done with the Nova 2 sUAS in October 2008, the UFUASRP was
able to secure a Certificate of Aircraft Airworthiness from the Department of the Army at
Redstone Arsenal for the UF Nova 2.1 sUAS in March 2010. With the Certificate of
Aircraft Airworthiness, and through the MOA between the USDOD and the FAA, the
UFUASRP was able to achieve clearance to fly low-altitude (≤ 366 m) missions with the
UF Nova 2.1 sUAS throughout large portions of the NAS. In spring 2011, the
UFUASRP filed for, and acquired its own FAA Certificate of Waiver or Authorization
(COA) to fly the UF Nova 2.1 sUAS for missions in the Big Bend coastal region of
Florida, independent of the USACE military agreement. Since that time, the UFUASRP

203
has been granted 29 additional COAs by the FAA, which has permitted the Research
Program to fly the UF Nova 2.1 in areas for which most other sUAS entities were
prohibited from legally operating until 2015. Experience in working with the FAA as they
developed and refined the COA process for sUAS helped the UFUASRP acquire FAA
authorizations to fly the UF Nova 2.1 in many locations. In 2014 (and again in 2015),
the UFUASRP confirmed its good standing with the FAA when the Research Program
was personally invited by the FAA to represent ‘academic sUAS operational testing and
research endeavors’ by manning a large booth about the UFUASRP within the FAA
hangar at the 2014 Sun ‘n Fun International Fly-In & Expo in Lakeland, Florida. A
Southeastern Region FAA UAS administrator advised the UFUASRP, “the way that your
Program [the UFUASRP] conducts and fields small unmanned aircraft systems is the
way that we [the FAA] would like all academic institutions to operate…” (M. K. Wilson,
Federal Aviation Administration, personal communication).
The UFUASRP has flown the UF Nova 2.1 on over 130 flights; predominantly
over grassy fields, lakes, wetlands, inshore coastal areas, forest stands, and agricultural
fields throughout Florida; but has also flown the sUAS over six different sites across
Idaho as well. Missions with the UF Nova 2.1 sUAS have produced high-resolution
imagery and very dense directly-georeferenced imagery products. Individual images
can be post-processed into end products that allow data to be extracted from individual
pixels to provide evidence to address ecological questions. For example, RGB imagery
of a specific Lake Okeechobee 25.0 hectare (ha) target area, Fisheating Bay, with
emergent vegetation known to contain areas of invasive vegetation were collected
during a single flight by the UF Nova 2.1 on a day that for the sake of convenience will

204
be called time ‘t’. After the sUAS flight was conducted, and the aircraft was recovered
off the water surface, wetland vegetation experts ground-truthed a series of random
geographic locations within the target area with 2D GPS positions to identify the primary
vegetation composition at each location. The day after the UF Nova 2.1 sUAS flight,
USACE-contracted airboat crews went into the target area and spot-treated invasive
vegetation with herbicide. Back in the laboratory, the RBG imagery collected at time ‘t’
was post-processed into a large georeferenced orthophotomosaic image, which
consisted of n = 248 individual images. Using the ground-truthed GPS data points in
combination with the vegetation identifications at the random locations within the target
area, the georeferenced orthophotomosaic image was classified into seven macro-level
vegetative categories based on computer recognition algorithms utilizing spectral
signatures. Six weeks after the spot treatment of invasive vegetation with herbicide
inside the defined target area of interest at Fisheating Bay, a day that will be referred to
as time ‘t+1’, the UFUASRP re-flew the exact same 25.0 ha target area with the UF
Nova 2.1 to collect another round of RGB imagery. A time ‘t+1’ post-treatment RGB
georeferenced orthophotomosaic was constructed back in the laboratory of the exact
same area, and temporal change was clearly evident and able to be quantified.
Missions with the UF Nova 2.1 have also recorded imagery of avifauna of many
different species at various locations, e.g., White Ibis (Eudocimus albus) in the
Loxahatchee National Wildlife Refuge and on Seahorse Key in the LSCKNWR, Brown
Pelican (Pelecanus occidentalis) in the LSCKNWR, American White Pelican (Pelecanus
erythrorhynchos) in the LSCKNWR and on spoil islands in several reservoirs in Idaho,
Double-crested Cormorant (Phalacrocorax auritus) on spoil islands in Idaho reservoirs,
205
and a number of gull species (Laridae) in the LSCKNWR and on spoil islands in Idaho
reservoirs. Because of the repeatable, tightly georeferenced imagery that is capable of
being collected using the optical payloads of the UF Nova 2.1 sUAS, existing and new
avian nests are identifiable at times ‘t’, ‘t+1’, ‘t+2’, … ‘t+n’. When critical factors such as
spatial sampling assumptions and detection probability are accounted for, best effort
counts of individual targets using dual-observer techniques from a moving manned
aircraft could possibly give way to more accurate population estimates of a specific
target areas of known size at time ‘t’ by analyzing sUAS-collected imagery; but perhaps
even more inspiring is the possibility of generating estimates of seasonal production of
individual nests at times ‘t+1’, ‘t+2’, etc. which theoretically are also possible if a routine
sUAS flight schedule can be established and maintained throughout an entire
reproductive season (Williams et al. 2011). While the example detailed above is
focused on avifauna, a similar methodology using sUAS could be applied to a
tremendous number of other faunal targets with relative ease.
Other missions conducted in Florida utilizing the UF Nova 2.1 sUAS included
flights over water control structures for the USACE–Jacksonville District in the Greater
Everglades and Picayune Strand, a mission for investigating statistical techniques
accounting for the distribution of hidden objects from sUAS-derived imagery (Martin et
al. 2012), and missions over various small islands in the LSCKNWR to collect baseline
data and imagery for ongoing and future climate change and sea level rise studies.
Other UF Nova 2.1 missions to date include flights over Greater Everglades wetland
vegetation in WCA-3A to examine the ability of the airframe and payload to delineate
fine-scale vegetation types (Zweig et al. 2015), and a series of three separate missions
206
to collect data over three discrete terrestrial sites in Idaho during subsequent summers
and a winter field season to investigate the possibility of using the UF Nova 2.1 sUAS to
assist in minimizing time spent with BOTG methodologies looking for preferred pygmy
rabbit (Brachylagus idahoensis) habitat in the sagebrush-steppe ecosystem. The Nova
2.1 sUAS also conducted a discrete autumn mission in the lower Clearwater River of
Idaho to evaluate the potential for using the fixed-wing UA platform to estimate the
number of Chinook salmon (Oncorhynchus tshawytscha) redds in portions of the river
as an alternative to the existing method of using dual-observer biologists in low-altitude
manned helicopters (which have tragically taken the lives of multiple biologists and
pilots). Additional vegetation delineation missions were conducted with the UF Nova
2.1 over Orange Lake in north-central Florida, agricultural fields near Archer, Myakka,
and Balm, Florida, and over the Ocklawaha Prairie also located in north-central Florida.
While the UF Nova 2.1 sUAS fixed-wing design has been the most reliable
UFUASRP platform to date, it still has room for improvement (Balmori 2014). Perhaps
the biggest drawback with the design is ironically a product of overachieving success in
meeting a few of the fundamental design objectives; once airborne in straight and level
flight, and at or above the 15.0 m/sec cruising airspeed, the UF Nova 2.1 does not
rapidly scrub speed due to an airframe design built to minimize total drag. The aircraft
has a tendency to remain airborne during a landing sequence in which the motor is off
and the sinking rate of the airframe is particularly shallow due to the high lift-to-drag
ratio of the main wingset, especially when descending below the altitude of the ground
effect cushion generated by the wings. Due to most of its flights occurring in or over
wetland environments which requires belly landings, and the desire to maximize flight
207
time to systematically cover a user-defined target area of interest by capturing
overlapping imagery and metadata, the need for landing gear which adds drag and
additional mass to an airframe was intentionally omitted for the UF Nova 2.1 sUAS
(Balmori 2014). A number of COTS fixed-wing sUAS without landing gear use either a
deep stall landing method, or the use of a parachute to land the airframe at the
conclusion of a flight. However, the UFUASRP is not a proponent of these methods
because once either technique is initiated, there is essentially no way to abort a landing
should the need arise to do so. Deep stall methods cause the airframe to hit the ground
at relatively high rates of speed, imparting undue stress on the UA and its payloads,
while parachutes must be folded and stowed properly within the fuselage and once
deployed are subject to ambient winds aloft which make landing at a specific location on
the ground difficult at best.
As natively designed, the glideslope ratio of the UF Nova 2.1 sUAS is ≈ 10:1;
therefore, landing the aircraft requires a fairly lengthy strip of relatively unobstructed
terrain or water surface, particularly when descending through the final 5.0 m AGL. The
UFUASRP MAE contingency spent time in 2010 and 2011 working on developing a set
of plain flaps (12.7 × 50.8 cm) to the trailing edge of the root span of the main wing on
each side of the fuselage that could be deployed 30° downward during landing to: 1)
increase the main wing camber; 2) change the ‘virtual’ angle of attack of the wing; and
3) induce parasitic drag to help shorten the glideslope ratio (Evers 2011). The initial
plain flap efforts by Evers (2011) were ultimately able to reduce the glideslope ratio by a
substantial 55%.
208
However, the UFUASRP fielded applications for natural resource-based flights
with the UF Nova 2.1 sUAS where an even shorter glideslope ratio was desired. As
documented in Balmori (2014), the UFUASRP MAE group took the plain flaps (deployed
30° downward) on the trailing edge of the root span of the main wing and combined
them with spoilerons (essentially ailerons deployed upwards 20° which still permitted
limited aileron roll control even when deployed) but unfortunately this combination
created too much instability and induced a crash during field testing. Balmori (2014)
reported that the trailing edge plain flaps deployed at 30° downward were then
combined with 2.5 × 15.2 cm Schempp-Hirth airbrakes, which extended vertically up out
of the root span of the main wing section on each side of the fuselage when the flaps
were deployed downward, and reduced the glideslope ratio to an improved 3.6:1.
Ultimately the third option tested, a novel hybrid flap/spoiler (HFS) design reduced the
glideslope ratio to 3.3:1 (Balmori 2014).
The DJI® Spreading Wings S1000+™
The UFUASRP had always wanted to dabble in the rotary-wing sUAS market,
but since most natural resource-based questions required the payload capacity and
flight endurance that a fixed-wing platform could deliver, the Research Program focused
on learning as much as possible and refining details encountered as it fielded fixed-wing
sUAS platforms for natural resource applications. In August 2014, personnel from the
US Geological Survey (USGS) National UAS Project Office (NUASPO) came to UF to
discuss with the UFUASRP a proposal to construct a rotary-wing sUAS that could meet
certain criteria for natural resource-based applications, including integrating a series of
new optical sensors, and conducting operations primarily in the western US where
vertical takeoff and landing (VTOL) multirotor capability is advantageous over fixed-wing
209
airframe designs due to rugged terrain limiting feasible runway landing options. The
UFUASRP determined that it could build a custom multirotor sUAS for the USGS
NUASPO that would meet nearly all the desired requirements at a very reasonable cost;
but with the limitations that the US Department of the Interior (USDOI) Office of Aviation
Services (OAS) instilled in regulating UAS used by the USGS, the UFUASRP
suggested that going with a COTS airframe and avionics as most of the rotary-wing
platform would most likely be a more advisable route for the collaboration to pursue.
The thinking behind this was that obtaining a fairly elusive certificate of airworthiness
which was a barrier that had immobilized USDOI UAS acquisitions up until that time,
and since COTS rotary-wing platform availability was in the process of exponential
growth, and certain COTS companies were emerging as clear leaders in rotary-wing
platforms and avionics, the UFUASRP thought that the USDOI OAS logically would be
more amenable to approving the operation of an airframe and avionics from a company
whose products were logging hundreds of thousands of operational hours worldwide,
rather than attempting to gain approval of a custom-designed and constructed airframe.
Additionally, by going with a COTS platform as most of the airframe opposed to a
custom-built design or prototype would make obtaining replacement parts much easier
for the USGS NUASPO in the long run (a lesson learned by the UFUASRP in fielding
the MLB Company® FoldBat™ UAS many years earlier).
Optical payload components were scoped out based on specific criteria
prioritized by the USGS NUASPO. With the range of EM wavelength spectra that
natural resource scientists currently use to collect data to assist in assessing and
monitoring focal targets from satellites, manned aircraft, and BOTG methodologies,

210
obtaining a single sensor package that would encompass the entire EM spectral ranges
desired by the NUASPO could potentially be available on the market; however, the total
cost of an all-in-one sensor package was most likely well beyond the available fiscal
budget available to the USGS NUASPO, and the mass and volume of such a device
was almost certainly too great for a rotary-wing UAS within the size class the NUASPO
was looking to field. The UFUASRP had also realized through its years of experience
that only sensors collecting data pertinent to the scientific question at hand should leave
the ground during any sUAS flight. Collecting data for the sake of collecting data was
generally a waste of time, money, and effort if it was not helping lead to answering the
scientific question necessitating the sUAS flight in the first place. Putting all of the
available payload budget into a single all-in-one sensor package was extremely risky
because if something caused the airborne UA to fail and crash, there would be little to
no funding available to repair or replace the damaged items. Another reason that the
UFUASRP suggested only flying the sensors needed to answer a scientific question
aboard a sUAS is that the least amount of mass that has to be flown around during a
flight generally leads to longer flight durations over the target area of interest and less
time spent on the ground where no aerial data collection takes place. A multitude of
additional reasons exist suggesting not to fly sensors aboard a sUAS unless they are
actively collecting data leading to answering the question at hand, but a final reason
advocated by the UFUASRP is that if a single sensor included in the all-in-one package
should fail, then executing the flight and/or subsequent flights of a mission may have to
be delayed, postponed, or ultimately cancelled so that the failed sensor could be
repaired. This situation is unfortunate because time dedicated to repairing a failed
211
sensor in the all-in-one package essentially grounds the remainder of the sensors from
collecting valuable data even though they may be fully operational.
A number of physically small, lightweight, and predominantly affordable sensors
with appropriate optical specifications were selected to meet the highest priority EM
spectral ranges chosen by the USGS NUASPO. Once the sensors were identified, the
UFUASRP got to work acquiring them, and made tentative plans on how the various
sensors could be grouped into at least two separate, but interchangeable, gimbaled
payload bays to reduce the total mass of any single flight to increase runtime of an
electric-powered rotary-wing platform which inherently has a reduced runtime compared
to fixed-wing designs, and to assemble sensor combinations that would most often be
running together to address natural resource-based sUAS applications. The UFUASRP
discussed several sensor grouping options with the NUASPO, and the collaborative
group decided that a gimbaled payload bay should include the dSLR RGB still frame
camera, the TIR camera, and the digital video camera, while a second payload bay
should include the hyperspectral camera, and the digital video camera. Regrettably, the
first sensor cut from the initial USGS NUASPO proposal due to budget limitations was a
light detection and ranging (LiDAR) unit. However, the UFUASRP was able to procure
a LiDAR unit independently, which the Research Program was able to ultimately test as
a potential payload option for the USGS NUASPO. Through continued collaboration,
the USGS NUASPO was able to purchase a LiDAR unit of their own, and the
UFUASRP is poised to integrate it into the gimbaled payload options.
The following sensors were selected for the USGS NUASPO octocopter project:
1) a COTS Canon® EOS-Rebel SL1™ 18.0 MP dSLR imager with a fixed focal length
212
Canon® EF 40 mm f/2.8 Stepping Motor™ lens equipped with a Hoya® HMC ultraviolet
filter for RGB wavelength still frame imagery; 2) a FLIR® A65 SC™ TIR focal plane array
uncooled microbolometer with a 7.5 hertz (Hz) streaming resolution of 640 × 512 pixel
(pix) digital video, a spectral range of 7.5–13.0 micrometer (µm), a −25– +135° Celsius
(C) object temperature range, and a f/1.25 fixed focal length 13 mm lens; 3) a GoPro®
HERO 3+™ Silver Edition 1080p RGB video camera producing 1,920 × 1,080 pix screen
resolution digital video files; 4) a Rikola® Snapshot™ hyperspectral camera with a 12-bit
CMOS image sensor capable of recording spectral images with 1,010 × 1,010 pix
resolution, up to 380 user-programmable spectral bands in the range from 500–900 nm
at ≈ 1 nm steps, with an f/2.8 lens having a fixed focal length of 9 mm; and 5) a
Velodyne® VLP-16 Puck™ LiDAR sensor featuring 16-channels of dual returns from a
Class 1 – eye safe 903 nm wavelength laser, a range of up to 100 m with an accuracy
of ±3 cm, a vertical field of view of 30° with an angular resolution of 2°, a
horizontal/azimuth field of view of 360° with an angular resolution of 0.1–0.4°, and user
datagram protocol (UDP) output packets containing distances, calibrated reflectivities,
rotational angles, and microsecond (µs) resolution synchronized time stamps.
Based on the calculated masses and volumes of the payload gimbal mounts, the
payload bays, and their contents, an approximation of the total payload physical size
was used to seek out an appropriate COTS airframe capable of reliably situating the
payload sensors over the target areas of interest. Several manufacturers offered
products that were potential options, however, in keeping with the plan to select a
COTS airframe brand that was emerging as a leader in rotary-wing design, sales, and
service, the UFUASRP went with DJI®, maker of the Phantom™ platforms, which are
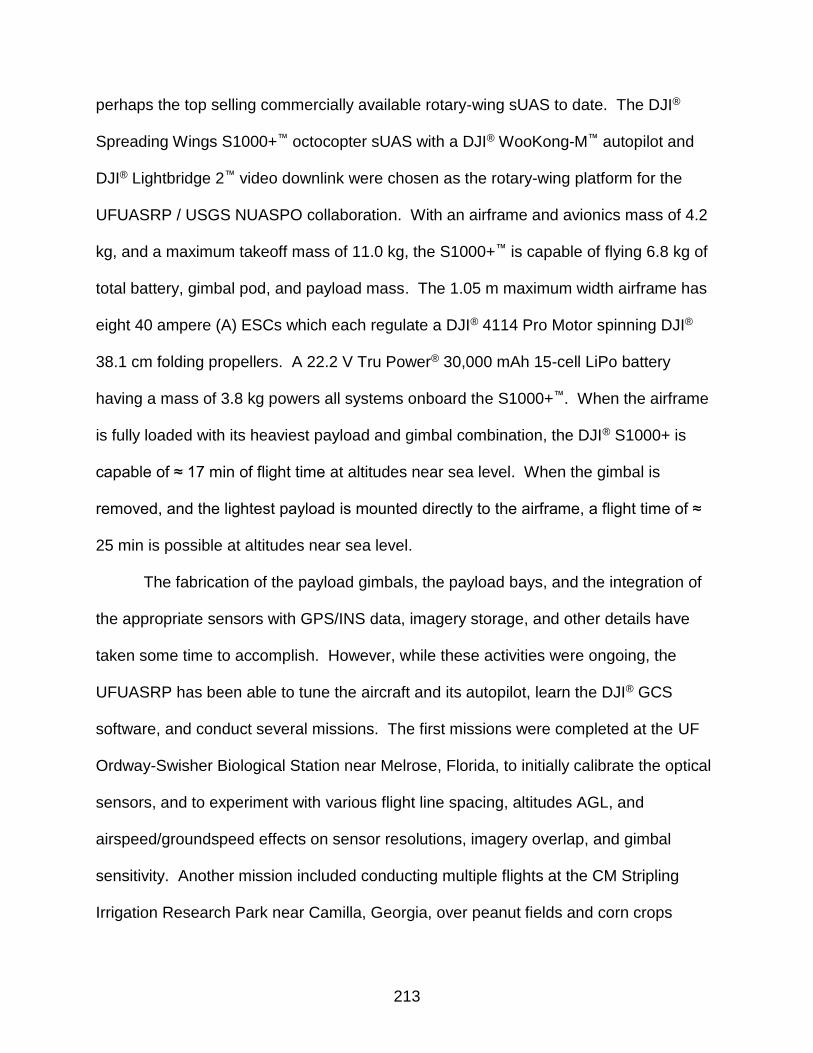
213
perhaps the top selling commercially available rotary-wing sUAS to date. The DJI®
Spreading Wings S1000+™ octocopter sUAS with a DJI® WooKong-M™ autopilot and
DJI® Lightbridge 2™ video downlink were chosen as the rotary-wing platform for the
UFUASRP / USGS NUASPO collaboration. With an airframe and avionics mass of 4.2
kg, and a maximum takeoff mass of 11.0 kg, the S1000+™ is capable of flying 6.8 kg of
total battery, gimbal pod, and payload mass. The 1.05 m maximum width airframe has
eight 40 ampere (A) ESCs which each regulate a DJI® 4114 Pro Motor spinning DJI®
38.1 cm folding propellers. A 22.2 V Tru Power® 30,000 mAh 15-cell LiPo battery
having a mass of 3.8 kg powers all systems onboard the S1000+™. When the airframe
is fully loaded with its heaviest payload and gimbal combination, the DJI® S1000+ is
capable of ≈ 17 min of flight time at altitudes near sea level. When the gimbal is
removed, and the lightest payload is mounted directly to the airframe, a flight time of ≈
25 min is possible at altitudes near sea level.
The fabrication of the payload gimbals, the payload bays, and the integration of
the appropriate sensors with GPS/INS data, imagery storage, and other details have
taken some time to accomplish. However, while these activities were ongoing, the
UFUASRP has been able to tune the aircraft and its autopilot, learn the DJI® GCS
software, and conduct several missions. The first missions were completed at the UF
Ordway-Swisher Biological Station near Melrose, Florida, to initially calibrate the optical
sensors, and to experiment with various flight line spacing, altitudes AGL, and
airspeed/groundspeed effects on sensor resolutions, imagery overlap, and gimbal
sensitivity. Another mission included conducting multiple flights at the CM Stripling
Irrigation Research Park near Camilla, Georgia, over peanut fields and corn crops

214
grown under differing irrigation schedules. This data will be used to augment ongoing
research that could potentially improve agricultural irrigation schedules for farmers in
the southeastern US where water use and water conservation tradeoffs are critical
issues.

215
A B
C D Figure A-1. Components of the University of Florida Nova 2.1 small unmanned aircraft
system used to collect imagery and metadata of sagebrush-steppe landscapes during summer 2013 and summer 2014 in Idaho, USA. A) The Nova 2.1 small unmanned aircraft. B) The ground control station, bidirectional communications box, and manual flight controller. C) The three-person trained, qualified, and experienced flight team. D) The optical payload system composed of a system battery (bottom left, black), onboard computer (right, white), power switch (top left, black), MTi-G™ combination global positioning system and inertial navigation system (center, orange) with antenna (bottom center, black), ‘Burrito’ payload synchronization device (center, red), universal serial bus 2.0 interfaces (center, black), all affixed to the back of a nadir-oriented Olympus® E-420™ digital single-lens reflex camera equipped with a 25 millimeter ‘pancake’ lens.
C.R. Milling
M.A. Burgess M.A. Burgess
M.A. Burgess
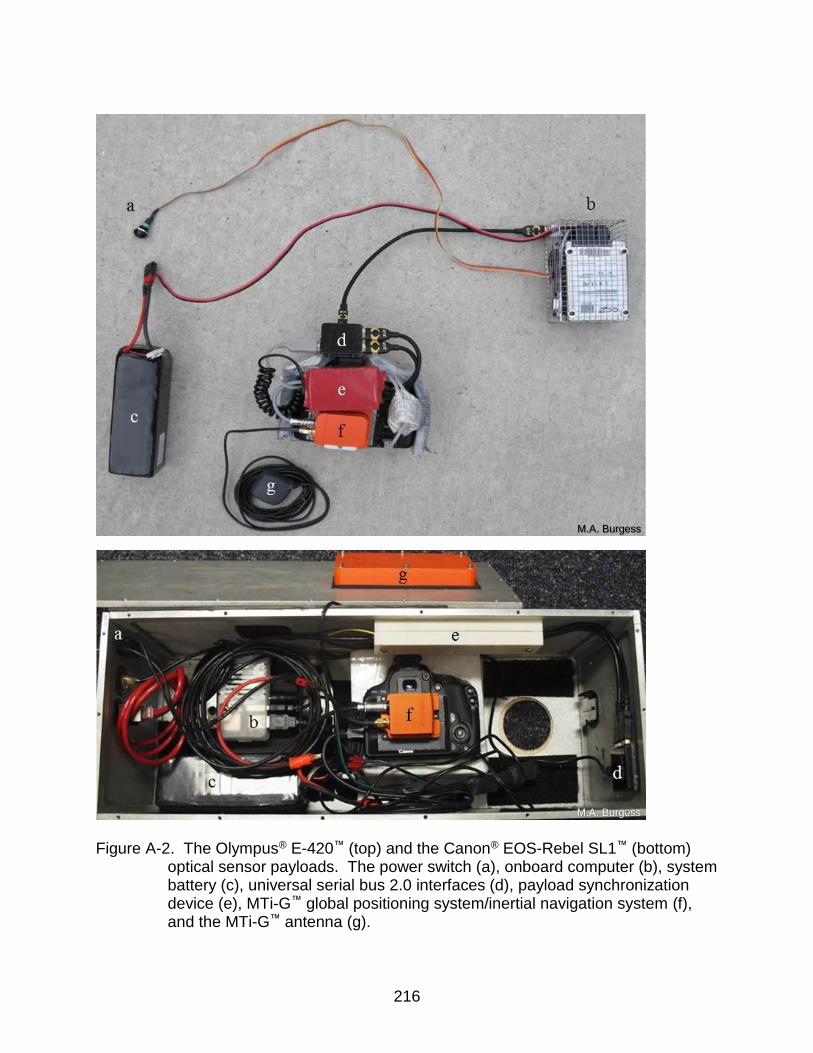
216
Figure A-2. The Olympus® E-420™ (top) and the Canon® EOS-Rebel SL1™ (bottom)
optical sensor payloads. The power switch (a), onboard computer (b), system battery (c), universal serial bus 2.0 interfaces (d), payload synchronization device (e), MTi-G™ global positioning system/inertial navigation system (f), and the MTi-G™ antenna (g).
M.A. Burgess
M.A. Burgess

217
APPENDIX B A BRIEF HISTORY OF UNMANNED AIRCRAFT SYSTEM REGULATIONS IN THE
UNITED STATES
Putting together information on the current regulatory environment in which
unmanned aircraft systems (UAS) must operate in the United States (US) is difficult
because it is a complex arrangement that up until fairly recently was frequently
changing. This appendix provides a brief look at the history of UAS regulation in the
US, and is provided to help explain why the University of Florida (UF) Unmanned
Aircraft Systems Research Program (UFUASRP) conducted small unmanned aircraft
system (sUAS) flights in the manner described as it was based on the regulatory
environment at the time.
In the US, the Federal Aviation Administration (FAA) is charged with supervising
the safety and regulations of any contrivance invented, used, or designed to navigate,
or fly in, the air (Title 49 US Code Section (§) 40102 and § 40103; Title 14 Code of
Federal Regulations (CFR) § 1.1; and Title 14 CFR § 91). The air located outdoors,
over land, water, or territory of the US, from the surface of the Earth skyward is known
as the National Airspace System (NAS). The US military has worked cooperatively with
the FAA since its inception to temporarily restrict air traffic in certain parts of the NAS
from time to time to conduct testing and training exercises of both manned and
unmanned aircraft in designated military operations areas across the country. When
the US military requests that the FAA close a specific military operations area to air
traffic and the FAA approves the request, the military then assumes control,
responsibility, and regulatory oversight for all aircraft operations within that designated
area for a predetermined period of time.

218
Because UAS are legally considered aircraft within the US (Public Law 112-95 §
331 and § 336), the FAA is responsible for ensuring the safety and regulation of
unmanned systems in the same manner that they oversee manned aircraft operations in
the NAS. Up until the mid-2000s, UAS in the US were primarily model remote
controlled (RC) aircraft built and flown manually for recreation/hobby purposes, or
military drones that were either preparing to be deployed or returning from theater
overseas. At that time, the model aviation industry and the manned aircraft industry in
the US were for the most part able to coexist amicably as they had done for decades
prior with few documented confrontations. The preeminent model aviation oversight
organization in the US, the Academy of Model Aeronautics (AMA), issued safety
guidelines and incentives for aviation modelers to operate safely which were largely
followed, and the manned aircraft industry continued to function as it had with FAA
oversight. However, by the mid-2000s, three major events occurred nearly
simultaneously that altered the congruence between the manned aircraft, hobby aircraft,
and UAS interests: 1) the desire of the US military to fly many of its large drones back to
the US from theater and through the NAS to various facilities across the country for
scheduled overhaul, maintenance, and repairs was not permitted by the FAA; 2) the
initially slow rise in the numbers of model aviation hobbyists beginning to experiment
with sUAS having autopilots and optical payloads quickly grew at an exponential rate;
and 3) the general lack of the FAA to act on repeated expert recommendations to
proactively prepare for an unparalleled upsurge in sUAS technology that was just
beginning, but had been forecasted to require a substantial number of additional FAA

219
personnel for integration and management, and the development of a regulatory
framework catered specifically to sUAS.
The FAA is faced with the unfortunate reality that the NAS is the busiest and
most complicated airspace in the world, and with the safety of all the existing NAS users
and the safety of people and property on the ground as its primary mandates, the FAA
is exceptionally methodical in generating new regulations; especially those that may
somehow jeopardize the existing levels of safety. Initially, the FAA attempted to
regulate all UAS as if they were manned aircraft, which led to a series of legal
challenges, loopholes, and semantics. Realizing that unmanned aircraft (UA) were
generally not compliant with many of the various sections of rules and regulations for
manned aircraft in the NAS which are found in Title 14 CFR, in September 2005 the
FAA produced several alternative compliance methods for UA, including the Certificate
of Waiver or Authorization (COA) methodology, and a set of interim UA regulations
(AFS-400 UAS Policy 05-01; and 14 CFR § 91.113). The 2005 ‘quick-fix’ string of
solutions imposed by the FAA affected all unmanned flight activities; including those
being tested for natural resource-based purposes. The FAA and their parent
organization, the US Department of Transportation (USDOT), were burdened with
additional litigation, objections, challenges, and pushback from model aviation
enthusiasts and AMA administrators, legal teams from the Association of Unmanned
Vehicle Systems International (AUVSI)—the undisputed international society for all
things unmanned, the US military, from Congress, and the public. In response to the
uproar, the FAA and USDOT further acknowledged that UAS were indeed intrinsically
different from manned aircraft; stating that a set of rules and regulations specifically for
220
UAS operations in the NAS would need to be developed, but it would take some time to
accomplish these tasks.
To facilitate the need for UAS-specific regulatory and NAS integration policies,
the FAA created the Unmanned Aircraft Systems Integration Office (UASIO), and then
followed that by releasing a document titled ‘Interim Operational Approval Guidance 08-
01 – Unmanned Aircraft Systems Operations in the U.S. National Airspace System’.
This document further refined the 2005 interim framework in which UAS operations
would be conducted in the NAS until the FAA UASIO could draft a finalized set of rules.
The unmanned industry was reminded by the FAA that once a proposed set of final
rules was drafted, it would then be available for a 60-day period of public comment,
revised by the FAA and its’ legal staff, then the revised draft would be submitted to the
FAA authorization board and then the USDOT authorization board for approvals. Once
both authorization boards had given their approvals, the draft would be released back to
the public, and then shortly thereafter written into the Federal Register, and finally 60-
days later the rules would actually go into effect – a lengthy process by any standards.
It was about this period in time that sUAS for civil and commercial applications were
gaining traction and transformation from merely abstract ideas to actually being
constructed and in some cases being fielded as potential tools for various applications
such as law enforcement, telecommunications, surveying/mapping, and natural
resources.
In 2008, the FAA UASIO said publicly that the proposed set of final rules for UAS
would be coming out within the next two years; however, 18-months after that
announcement was made, it became quite apparent that the final rules for UAS

221
integration into the NAS were still a ways away from becoming a reality. In the
meantime, the FAA UASIO continued to use the COA system as a method of regulating
UAS operations in the NAS, and COAs that were approved were only issued to
governmental agencies or public academic institutions. The UFUASRP worked with the
FAA to obtain nearly 30 COAs, and was a UAS Research Program that earned FAA
respect to legally fly many of its’ sUAS within a tight set of regulations and operational
guidelines that provided the UF Program to make significant strides in all phases of
civilian sUAS research and development; especially for natural resource-based
applications of the technology. Businesses or commercial entities at that time were not
authorized to use the COA process, and were forced to use an alternative method that
took considerable time and effort. The inability for US businesses or commercial
entities to use the COA system ultimately put the US at a significant disadvantage
behind most other nations developing sUAS from a business standpoint. On 14
February 2012, seeing that the FAA UASIO was continuing to struggle to release a
proposed set of final rules for routine UAS flights in the NAS, the FAA Modernization
and Reform Act of 2012 (FMRA), (Public Law 112-95) was passed by Congress and
signed by the President of the US. The FMRA mandated that the FAA UASIO develop
a comprehensive plan for safely integrating UAS into the NAS by 30 September 2015.
During the period between the issuance of the FMRA and the mandated
deadline, the FAA UASIO sporadically would amend its interim UAS regulatory
guidelines to allow certain low-risk sUAS flights to take place in the NAS while it
continued to draft a proposed set of final rules for sUAS. By introducing several key
legislative initiatives during this period such as: 1) producing a multi-year UAS
222
Integration Roadmap document in November 2013; 2) establishing six FAA UAS test
sites across the US in December 2013; 3) issuing the first Public Law 112-95 § 333
exemptions in June 2014 to several commercial movie and television production
companies; and 4) releasing a proposed framework of regulations, or a notice of
proposed rulemaking (NPRM) titled ‘Operation and Certification of Small Unmanned
Aircraft Systems’ for 60-days of public comment on 23 February 2015 that outlined how
the FAA proposed to integrate certain sUAS operations to fly routinely in the NAS; the
FAA UASIO was able to somewhat pacify the budding sUAS industry and other critics in
the US by shifting focus away from the looming congressionally-mandated deadline,
and focus on what the UASIO had been able to do for sUAS to date. As the 30
September 2015 deadline approached and passed without the FAA UASIO producing a
set of final rules for sUAS integration, US sUAS industry leaders, investors, and others
presented a letter to the administrator of the FAA, urging him to finalize a set of rules for
sUAS as soon as possible, citing the significant benefits that the technology offered to
such a wide variety of commercial, public, and academic efforts in the US. The letter
also indicated that the US was in a position to lose additional jobs and billions of US$ in
sales to foreign entities the longer the country waited to break into the sUAS market
with routine sUAS flights.
Perhaps as an additional attempt to shift focus away from the missed deadline, in
December 2015, the FAA UASIO revisited the fact that small unmanned aircraft (sUA)
were indeed legally considered aircraft just like their manned counterparts; therefore, in
the interest of safety, sUA should be registered in the same method that manned
aircraft are registered as of February 2016 (Public Law 112-95 § 331 and § 336). By

223
registering an aircraft and marking it with an assigned FAA registration number, a sUA
would be linked to the contact information for an individual via a nationally searchable
database. Recently, the FAA mandated that all UAS be registered through an online
portal, with the exception of micro unmanned aircraft systems (mUAS) which are
defined below. Should a sUA be observed flying in a reckless manner and the FAA
registration number be obtained, or if the ‘carcass’ of a crashed sUA flown irresponsibly
or illegally possessed an FAA registration number, the registered party could face legal
consequences from the FAA and/or law enforcement agencies.
In the spring of 2016, the FAA UASIO clarified a series of definitions of UA
classes based on the aircraft mass at takeoff, and elucidated interim guidelines for
operating UAS in the NAS depending on the UA classification. According to the FAA
UASIO, an autonomous-flight capable UA having a mass ≤ 250 grams (g) at takeoff was
classified as a micro UAS ‘mUAS’, while systems with a mass > 250 g but ≤ 24.9
kilograms (kg) at takeoff were defined as ‘sUAS’. These two categories enveloped most
UAS in the US; therefore, the FAA UASIO prioritized establishing regulations for
operating mUAS and sUAS in the NAS as their first priority under the FMRA. Any UA
platforms with a mass > 24.9 kg at takeoff in the US, were categorized as ‘UAS’, and
the FAA UASIO would address regulatory matters for these larger unmanned systems
upon completion of final rulemaking for the mUAS and sUAS categories.
As of late spring 2016, the FAA UASIO had yet to produce a final rulemaking
document for sUAS; stating that it was still reviewing each of the > 4,600 public
comments that were submitted during the 60-day comment period from spring 2015,
and wanted the issuance of the final rules to be appropriately restrictive, yet not too

224
overbearing to cease advancement of US-based sUAS ventures. The FAA UASIO
looked to incorporate suitable accommodations in the final sUAS rules to adapt to the
rapid advancements in technology, in the hopes that they would not have to amend the
final rules for sUAS immediately upon their release. Finding a suitable balance between
restriction and accommodation continued to stall the release of final rules for sUAS
operations in the NAS until 21 June 2016, when the UASIO and USDOT released ‘Title
14 CFR Part 107’ [also known as (aka): ‘the Small Unmanned Aircraft Rules’ or ‘Part
107’] to the public. The final version of Part 107 was written into the US Federal
Register a week later, making 29 August 2016 the date the Small Unmanned Aircraft
Rules officially went into effect in the US.
Some of the basic policies of Part 107 remain essentially unchanged from
existing guidelines concerning sUAS flights in the NAS, e.g., the takeoff mass of the UA
must be less than ≤ 24.9 kg, the UA must remain within 1.85 km visual-line-of-sight
(VLOS) radius of the pilot-in-command (PIC) at all times, the UA must give way to
manned aircraft operations, and the PIC can only operate a single UA at a time, etc.
Some of the changes incorporated into Part 107 included removing the stipulation that
the PIC be a licensed and current manned aircraft pilot holding a Class 2 medical
clearance, the elimination of the provision requiring a pilot to provide the FAA with a
certificate of aircraft airworthiness, and Part 107 established that all sUAS flight must
remain below 121.9 meters (m) above ground level (AGL) unless the flight is within a
121.9 m radius of a structure (such as a bridge, stack, silo, radio tower, etc.). With the
changes mentioned above, the FAA also established: 1) a remote pilot airman
certificate requirement, and placed the medical onus decision on the PIC; 2) that the

225
PIC inspect the aircraft for airworthiness and declare its condition as safe for operation
before each flight; and 3) a clause which eliminated the need for certain sUAS flights to
obtain a COA or other FAA exemption before flight as long as specific provisions within
a detailed set of rules were met. Prudently, Part 107 was constructed with a framework
based on the recognition that sUAS technology is evolving and maturing at a rapid
pace, and therefore the rules were composed in such a way to best accommodate the
anticipated changes.

226
APPENDIX C THE UNIVERSITY OF FLORIDA UNMANNED AIRCRAFT SYSTEMS RESEARCH
PROGRAM (UFUASRP) FLIGHT CREW MODEL
Prior to the ‘Part 107’ changes in unmanned aircraft (UA) operations regarding
the piloting requirements of small unmanned aircraft systems (sUAS), the University of
Florida Unmanned Aircraft Systems Research Program (UFUASRP) utilized a flight
crew model that was highly regarded by the Federal Aviation Administration (FAA).
Even since the Part 107 changes have been instituted, the UFUASRP continues to
utilize its’ flight crew model; the personnel have just added the additional FAA
requirements for sUAS pilots outlined in Part 107 to the existing qualifications necessary
for the flight crewmember roles.
The UFUASRP flight crew model consists of a minimum of three individuals,
each with a specific set of duties, qualifications, and responsibilities. All three
crewmembers of a UFUASRP flight team have completed and passed an FAA-
accredited ground school curriculum that provides considerable knowledge of the basics
of aviation in the National Airspace System (NAS). Since the implementation of the Part
107 regulations, the flight team members have also achieved FAA sUAS pilot
certificates as well. The three individuals that make up a UFUASRP flight crew consist
of the following: 1) a pilot-in-command (PIC), 2) a ground station operator (GSO), and 3)
a qualified visual observer (QVO).
Pilot-in-Command
The PIC minimally holds a Title 14 Code of Federal Regulations (CFR) Part 61
certification as a licensed and current manned private pilot with a Class 2 Medical
Certificate. The PIC is responsible for keeping visual contact on the UA at all times
during a flight. While keeping eyes on the UA, the PIC holds a traditional two-stick

227
remote control (RC) controller or gamepad device, and has the ability to instantaneously
regain full manual RC control of the aircraft with the flip of a single toggle switch or the
press of a button should the need arise. The PIC is ultimately the legal party
responsible for the flight of the aircraft (both under autonomous or manual control), even
though a team of individuals is involved in conducting a flight.
Ground Station Operator
The GSO records a written flight log for each flight attempt, and monitors the
ground control station (GCS) and telemetry data throughout the entirety of a flight. The
GSO scans the GCS and oversees items such as: power and connectivity strength of
the bidirectional communication signals, system battery voltage, indicated airspeed,
number of global positioning system (GPS) satellite signals the aircraft is locked onto,
the pitch, roll, and yaw of the aircraft, the total flight time, winds aloft speed and
direction, UA ground speed, and a moving map of the aircraft position showing the
location, range, and bearing of the UA from the GCS and the preloaded flight path and
failsafe protocols. During the flight, the GSO is also responsible for announcing
upcoming UA turns, manual changes to the flight path, etc. so that the other flight crew
personnel are aware of impending aircraft actions before observing them. This helps
the PIC recognize a commanded alteration in the flight of the aircraft that could
otherwise be misinterpreted as a flight anomaly cueing the PIC to assume manual RC
control. The GSO reports if any of the observed parameters shown on the GCS extend
beyond their nominal ranges so that the entire flight team can determine an appropriate
course of action. As required, the GSO may deviate the aircraft from the
preprogrammed flight path (i.e.: have the aircraft loiter about its current position,
manually increase or decrease the commanded airspeed or altitude, etc.), or switch

228
between the various flight modes (e.g.: takeoff climb, waypoint navigation, loiter now,
return to home, initiate a landing sequence, etc.) depending on the flight as it evolves.
Qualified Visual Observer
A QVO also holds an FAA Class 2 Medical Certificate, prepares the airframe and
payload for flight, launches the aircraft, and then is responsible for scanning the
airspace within and beyond the FAA-mandated 1.85 kilometer (km) radius visual-line-of-
sight (VLOS) sUAS operational area looking for potential hazards. Examples of
hazards include any other aircraft, flocks of birds, approaching weather, etc. Should a
potential hazard present itself during a flight, the QVO announces the identification and
location of the hazard, and determines its’ proximity to the UA in flight so that the entire
flight team can collectively decide on a course of action to mitigate a potential incursion.
In some cases, the UFUASRP will have several QVOs available for a flight, which is
advantageous in that more eyes and ears are available for scanning the operational
area for potential hazards.
The division of labor delineated above helps to ensure that: 1) safety is never
compromised from flight to flight; 2) crucial steps in preparation, execution, and
termination of an unmanned flight are performed orderly and completely which helps
curtail an inadvertent omission of an essential task; and 3) with routine practice
together, the flight crew becomes a cohesive team which conducts missions with
effective coordination of the many critical elements necessary to achieve success.
Additionally, all UFUASRP sUAS flights operate with a ‘sterile cockpit’ approach,
whereby the three flight crewmembers are able to communicate with each other using
an ordinary speaking volume, conversation is only in regards to the flight being
conducted, and any non-crewmembers nearby are asked to withhold questions or
229
comments until after a flight is completed, or asked to move to a safe and remote
location before takeoff so that the sterile cockpit conditions can be maintained until the
aircraft is safely back on the ground after a flight.
A final component of the UFUASRP flight crew model that also promotes safety
is that the Research Program operates with a policy that at any time before, during, or
after a flight, if any member of the flight crew feels that conducting an upcoming flight is
not a sensible decision, or if the success of a flight is in doubt, all a crewmember has to
do is speak up and say something to the rest of the crew. At that point, a flight will not
be initiated, or a flight in progress will be safely terminated as quickly as possible
without question. This policy provides each flight crewmember an equal voice within the
team, and aids in the overall safety of the flight operations.
230
APPENDIX D DIGITAL IMAGERY AND METADATA POST-PROCESSING METHODOLOGY USED
All imagery and its associated metadata were preprocessed so that they could be
input directly into advanced imagery processing software. The MTi-G™ global
positioning system/inertial navigation system (GPS/INS) data log file which recorded
multitudes of data parameters per second (sec) during the flight was parsed via a
custom Python™ script to generate a geotag text file which contained delimited image
identification, three-dimensional (3D) positional information, and roll, pitch, and yaw
data of the imagery sensor at the exact moment of maximum shutter aperture for each
image captured. Using ArcMap™ software, the geotag text file metadata of the
exposure stations was added to a basemap as a shapefile layer. Casual visual
analyses of the exposure station distributions provided a rough estimate of how well the
focal target area was covered with imagery during the flights.
Depending on the computational ‘power’ of the image processing computer
selected to run the advanced imagery processing software (‘power’ referring to the
collective amount of total system memory, clock speed, and number of core processors
available on the system- and video-hardware boards), study site subareas were
required to be broken into smaller and more manageable chunks with the ArcMap™
software to avoid potentially crashing the image processing software. Multiple flights
over a specific target area, or independent flights could be post-processed individually
depending on the particular study and/or its’ objectives.
Advanced imagery post-processing software titles, many designed especially for
small unmanned aircraft system (sUAS) imagery have rapidly improved over the last
five years. Until fairly recently, post-processing software had computational operations

231
that would often take days to complete; however, through advances in computing
technology, the ability for software manufacturers to update their products and instantly
have the updates available to its’ end-users, and cutting-edge photogrammetric- and
computer-vision-based algorithms used in newer software titles, were able to
accomplish even more complex tasks than their predecessors, with steps measured in
hours (hr) or minutes (min) rather than days.
Several specific software titles have excelled in their ability to create 3D imagery
products suitable for planimetric measurements from two-dimensional (2D) imagery
using a technique called ‘Structure-from-Motion’ (SfM) (e.g., Turner et al. 2012,
Westoby et al. 2012, Fonstad et al. 2013, Lucieer et al. 2014, Burns et al. 2015,
Madden et al. 2015). A popular SfM software title was used for imagery post-
processing, Agisoft LLC® PhotoScan© Professional Edition, to produce the desired
imagery products necessary to address the scientific questions in this dissertation.
Using PhotoScan©, the imagery from a particular chunk was loaded, the camera
calibration parameters were entered, and the delimited exposure station geotag data
were added. Next, the images were aligned to create a digital sparse point cloud using
a three-step automated image correlation process of detecting tie points, selecting pairs
of images, and matching the tie points. This activity would repeat itself until all of the tie
points and image pair combinations had been assessed. Images that could not be
automatically aligned were selectively disabled, and the alignment procedure was
conducted again to create an updated and more precise digital sparse point cloud.
The 3D metadata for the ground control points (GCPs) was added during the
next phase of post-processing. After the GCP metadata was entered, the software
232
would identify specific flight images that contained a GCP, and would ask the user to
fine-tune the placement of the GCP at the center of each marker. The next post-
processing step performed a photogrammetric bundle adjustment by optimizing the
imagery alignment. This procedure helped account for lens distortions based on the
camera focal length, the principal point of the lens, and a portion of the radial distortion
coefficients; all of which helped reduce the root-mean-square (RMS) error, and provided
a nominal indication of the accuracy of the digital sparse point cloud model at the
current stage of imaging processing. Through a series of three separate refining
processes, the geometry of the model being constructed via modified aerotriangulation
techniques was improved by eliminating points collectively distorting the level of
reconstruction uncertainty, the level of projection accuracy, and the level of reprojection
error. Also by incorporating the remaining camera alignment and distortion parameters,
and tightening the accuracy threshold of the tie points, the RMS error of the digital
sparse point cloud model continued to improve after each successive step of the
process.
The next phase of imagery post-processing using PhotoScan© was the creation
of a dense point cloud model based on information derived during the refinements of the
digital sparse point cloud. Once the dense point cloud was constructed, a 3D polygon
mesh of the model was generated which helped account for variations in topographic
relief, and an image overlay of texture for the model was built. After these stages of
post-processing had been completed, the creation of a digital elevation model (DEM) in
a desired coordinate system and projection was conducted, and an overlay of isometric
contour lines at user-specified elevation intervals was provided as an option. Next was

233
the creation of an orthophotomosaic via orthorectification methods in a user-desired
coordinate system and projection. The final post-processing step was to merge any
chunks that were post-processed independently into much larger DEMs and
orthophotomosaics of the entire scene if necessary for subsequent analyses.
A plethora of products that were generated during the PhotoScan© imagery post-
processing workflow were then available for export in various file formats for visual
display, or to be used as input files into other software titles for additional analyses or
investigations.

234
APPENDIX E SEVERAL CRITICAL LESSONS LEARNED BY THE UNIVERSITY OF FLORIDA
UNMANNED AIRCRAFT SYSTEMS RESEARCH PROGRAM (UFUASRP): 1999-2017
The University of Florida (UF) Nova 2.1 fixed-wing small unmanned aircraft
system (sUAS) was specifically designed as a precision natural resources data
collection tool. The airframe of the Nova 2.1 was designed around the imaging sensor
and payload components necessary to complete missions that specifically address
natural resource-based questions. This is a distinctly different approach than that which
is often used by other entities. Many who seek to collect aerial data for natural
resource-based applications using sUAS begin by acquiring an airframe and then
attempt to find a sensor or a suite of sensors that will fit into, or attach onto the fuselage.
In learning by doing over the last 18-years, the UFUASRP has determined that the most
efficient approach to maximizing sUAS utility for multiple natural resources applications
is to follow a course of action based on answers to questions raised in a decision matrix
outlined below.
A critical lesson was realized by the UFUASRP just before the design of the UF
Nova 2.1 sUAS; a lesson that applied to all unmanned aircraft system (UAS)
applications, not just those primarily focused on natural resources. Although it took the
UFUASRP nearly a decade of airframes, optical payloads, and experience fielding
sUAS to recognize the gaffe that had been repeatedly made, once the Research
Program identified that to achieve the utmost efficiency and utility out of a sUAS
airframe and payload, adhering as closely as possible to the methodology for sUAS
project success detailed below was frankly indispensable.
In any project/study/endeavor, there is a starting point ‘A’, an ending point ‘B’,
and series of details/processes/particulars located in between which must be completed
235
or accounted for to get from point ‘A’ to point ‘B’ (Figure E-1). This concept is not novel,
yet unambiguously defining points ‘A’ and ‘B’ is paramount at the onset of embarking on
any project because obscurities in either endpoint lead to inefficiencies in progressing
from point ‘A’ to point ‘B’. For scientific researchers, especially those in realms that are
comparatively underfunded, the efficiency in moving from point ‘A’ to point ‘B’ is vital for
stretching the scarce resources that are available.
The UFUASRP has found that abiding by the following methodology provides a
remarkably efficient means for garnering the most utility out of a sUAS for practically all
applications. This methodology is described in a manner as if a single objective is the
endpoint of a sUAS data collection project; however, this is solely for the sake of
simplicity of conveying the critical steps in the process. It has been found that the
methodology is valid for much more complicated efforts and objectives as well. As
stated above, clearly defining the endpoints ‘A’ and ‘B’ is imperative and cannot be
overstressed when considering a sUAS as an aerial sensor platform for data collection
purposes. It all begins with pinpointing the specific scientific question to be answered,
and defining the goal or desired end products at endpoint ‘B’. The more detail and
specifics that can be used to narrow down a generally broad problem into a focused
query, the more resourceful and productive the use of this methodology is for sUAS
projects.
Once the scientific question has been thoroughly defined and framed along with
the expected products at endpoint ‘B’, the next step is to determine the types and
amount of data necessary to collect to assist in answering the scientific question at
hand. Critical sub steps in determining the types of data to be collected include

236
electromagnetic (EM) spectra range, minimum and maximum useable resolution of
sensor products, frequency of data collection, season of data collection, metadata
accuracy, etc., which then leads to the selection of the appropriate sensor. The
selection of the payload sensor depends on a series of factors primarily driven by the
decisions about the varieties of data needed to get to from endpoints ‘A’ to ‘B’, and by
finding a sensor unit that has a relatively small mass and volume as well; that being
said, at least in most natural resource-based sUAS applications, the sensor selection is
often ultimately driven by the available budget.
The UFUASRP has realized over the years, nearly every type of sensor that a
researcher could realistically want to include on a sUAS has probably already been
developed and used by the military for intelligence, surveillance, or reconnaissance
(ISR) or other purposes on drones in theater. Additionally, many of those very sensors
could be used to assist in answering some of the most critical and salient scientific
questions faced by researchers today. Unfortunately, the sensors used by the military
in their existing form-factor are commonly not small enough in mass or volume to serve
as payload items for sUAS in the size range of most civilian users. Furthermore, those
military sensors that are physically small enough to be payload items on civilian use
sUAS are largely cost-prohibitive and/or subject to laws restricting their sale and usage
to entities outside of the military. In nearly all cases, a US$ 1,500 sensor is better than
a US$ 150 sensor, and a US$ 15,000 sensor is considerably better than a US$ 150
sensor.
Users of sUAS need to be aware of import and export laws about sensitive items
that may be included as part of a sUAS purchase. The US Department of State

237
(USDOS) has a list of items that are restricted by International Traffic in Arms
Regulations (ITAR), and the US Department of Commerce (USDOC) has a similar list of
items that are restricted by Export Administration Regulations (EAR). Both of these lists
of items specify who, what, where, when, how, and why, a person has access to
individual components and/or their schematics, imagery, or collected data because they
are deemed ‘sensitive’ or so accurate that if they got into the wrong hands, they could
be used against the US in a nefarious manner. Items such as higher-end global
positioning system/inertial navigation system (GPS/INS) units, autopilots, and high-
resolution sensors, etc., are just a few of the items that may appear on an ITAR- or
EAR-list. The responsibility of complying with ITAR and EAR laws falls on the PIC to
ensure that no laws are broken, and that all personnel having access to controlled items
have been vetted in some manner by qualified authorities. Both commercial and
industrial sUAS manufacturers abound who are so focused on making sales to turn a
profit, that they may very willingly sell a sUAS that contains ITAR- or EAR-controlled
items to a customer without indicating that said items are part of the purchase. It is up
to the buyer to make certain that the products being purchased do or do not include
restricted items, and are handled appropriately. Penalties and consequences of
violating Federal import or export regulations can lead to incarceration and serious fiscal
punishments.
The UFUASRP has witnessed over the last decade, both patience and
persistence have generally been rewarded with advances in technology that have
improved virtually all EM spectra sensors. With increasing demand for smaller, lighter,
and lower power-consuming sensor units, additional players are now in the market
238
initiating competition into what was predominantly a monopoly held by a handful of
corporations who catered primarily to the military. Increased competition has resulted in
lower acquisition costs for nearly all sensors, especially for users with reduced fiscal
budgets such as those found in natural resources and environmental fields of study.
After the sensor has been selected, the next step in the methodology is to find an
airframe that will appropriately position the sensor over the target area of interest. The
UFUASRP has found that four primary questions about the anticipated sUAS flights
generally dictate the airframe selection; however, each of these primary questions has a
series of sub questions and tradeoffs that may alter the final airframe decision. The four
primary questions are:
1. How much ground area needs to be covered in a single day? 2. How long must the airframe stay aloft for the payload sensor to capture the data
required to answer the scientific question? 3. What are the total mass, volume, and power requirements of the optical payload
components? 4. What are the environmental conditions in which the sUAS will be expected to
operate?
The first question determines whether a fixed-wing or a rotary-wing sUAS
airframe is the most appropriate platform design for the intended mission. If a
significant area of interest [> 300 hectares (ha)] needs to be flown per day, then a fixed-
wing platform is highly recommended. If the target area of ground coverage is smaller,
or a ‘perch-and-stare’ aerial view is desired or more appropriate, then a rotary-wing
platform is likely a better choice. Other considerations that should be addressed about
the selection of a sUAS platform design, especially for natural resource-based users
include focal and non-focal target noise tolerance levels, resemblance of the airframe to

239
a predator of the focal target, and flight crew training/capabilities of flying either a fixed-
or rotary-wing sUAS.
The second question determines the sUAS airframe primary source of power,
e.g., battery, or liquid fuel, that is most appropriate for the intended mission. Maximum
flight time for most battery-powered rotary-wing platforms is < 25 minutes (min), while
maximum flight time for most battery-powered fixed-wing platforms is < 75 min. Liquid
fueled airframes vary in flight time capabilities based on many factors; however nearly
all liquid fueled airframes can run for > 60 min before having to land for refueling.
Considerations that play a part in determining the airframe source of power, especially
for natural resource-users, are sensitivities of the focal and non-focal targets to noise,
obtaining or transporting liquid fuels may present problems for travel or during fieldwork,
determining how much data the optical payload can store with increasingly larger data
sets and lengthy airframe runtimes, and with the 1.85 kilometer (km) visual-line-of-sight
(VLOS) radius restriction in place, a user can only cover an operational circle of just less
than 1,100 ha before repeating coverage or landing and moving the ground control
station (GCS) to a new 1.85 km radius VLOS circle center location. Coverage of 1,100
ha is a large area, and while many researchers aim to collect as much data as possible,
a factor that must be kept in mind is that all of the data collected will need to be post-
processed in some fashion; otherwise, time and resources will be wasted.
The third question helps determine the physical size of the sUAS airframe. If a
micro air vehicle (MAV) is all that is needed to gather the desired data, there is no need
to arrange for a Northrup Grumman® Global Hawk™ UAS to serve as the aerial sensor
platform. Ideally, an airframe that is sufficiently rated for the anticipated payload mass

240
and volume in addition to the mass and volume of the airframe, avionics, and propulsion
system would be recommended. Other considerations, especially for natural resource-
based users include airframe portability, the need to use and consequently tote
specialty launching equipment, the cost per hour for contracting the airframe (if that
route of data collection is selected), or the cost per hour of the contracted flight crew (if
that route is selected).
The final question to ask in regards to airframe selection is to account for the
effects of the anticipated environmental conditions in which the small unmanned aircraft
(sUA) airframe will be operated. Airframes purchased commercial-off-the-shelf (COTS),
and certainly those that are hand-fabricated, have not necessarily been tested or rated
as airworthy for the environmental conditions in which they may be selected for routine
operations. Just a few of the environmental items of the flight operational area that
need to be considered when selecting a sUAS airframe, particularly for natural
resource-based users of sUAS include:
1. Ambient temperature, humidity, and dew point 2. Ambient wind speed and direction 3. Typical weather patterns for the season 4. Hours of operational daylight available 5. Elevation of the ground above sea level (ASL) 6. Air density and density altitude calculations 7. Cloud ceilings 8. Terrain and appropriate takeoff, landing, and emergency landing locations 9. Ability to maintain a 1.85 km VLOS radius of the aircraft at all times 10. Icing of the wing surfaces and/or pitot tube 11. Overheating of electronic components 12. Performance of the propulsion system components in the ambient conditions 13. Stability of autonomous and/or manual flight over intense thermal changes, i.e.,
fire, volcanic activity, etc. 14. Communication reliability based on known sources of nearby interference

241
As mentioned, this is not an exhaustive list, however selecting an effective sUA
airframe depends on a plethora of factors; and for these reasons, just like sensor
selection, no single airframe is appropriate for all types of applications.
Once the airframe has been selected, there are a substantial number of
additional details that need attention in order to successfully and efficiently ending up at
endpoint ‘B’. However, for the sake of simplicity, following the process of first defining
the scientific question and desired end products, next determining the data collection
needs, followed by acquiring the appropriate sensor, then selecting the suitable airframe
based on design, power source, physical size, and environmental conditions needed for
the application, has shown to be an exceptionally efficient method of getting from point
‘A’ to point ‘B’ with a sUAS for the UFUASRP (Figure E-2).

242
Figure E-1. An illustration showing the generalized process of proceeding from a
starting point to an ending point. Once the endpoints are clearly established, a series of steps must be completed in between to move from left to right. The order in which these steps are conducted can dramatically affect the efficiency of the whole process of moving from the start to the end.
Figure E-2. A recommended methodology for efficiently moving from the start of a
scientific project in which a small unmanned aircraft system (sUAS) will be used for data collection to achieving the desired end products necessary for analyses. Always start by defining the scientific question to be answered, and the desired end products to be generated as specifically as possible at the onset. Through experience, it has been found that starting a project with an airframe, or a sensor first, and then trying to develop a methodology to get to the desired endpoint can be extremely inefficient. However, moving from left to right using the methodology contained within the green box has repeatedly shown to be an exceptionally efficient technique for selecting and employing the appropriate sUAS components to meet the desired end products.
M.A. Burgess
M.A. Burgess

243
APPENDIX F THE UNIVERSITY OF FLORIDA UNMANNED AIRCRAFT SYSTEMS RESEACH
PROGRAM (UFUASRP) BLANK FLIGHT DATA SHEET
244
LIST OF REFERENCES
Abd-Elrahman, A. H., L. G. Pearlstine, B. A. Dewitt, and S. E. Smith. 2001. Detection of
positional errors in systems utilizing small-format digital aerial imagery and navigation sensors using area-based matching techniques. Photogrammetric Engineering & Remote Sensing 67:825-831.
Abd-Elrahman, A. H., L. G. Pearlstine, and H. F. Percival. 2005. Development of pattern
recognition algorithm for automatic bird detection from unmanned aerial vehicle imagery. Surveying and Land Information Science 65:37-45.
Abd-Elrahman, A. H., L. G. Pearlstine, S. E. Smith, and P. Princz. 2000. Use of small
format digital aerial images for classification of satellite images, Page 6 in XVI IMEKO World Congress. 25-28 September 2000.
Agapiou, A., D. G. Hadjimitsis, and D. D. Alexakis. 2012. Evaluation of broadband and
narrowband vegetation indices for the identification of archaeological crop marks. Remote Sensing 4:3892-3919.
Alldredge, M. W., K. H. Pollock, and T. R. Simons. 2006. Estimating detection
probabilities from multiple-observer point counts. The Auk 123:1172-1182. Ambrosia, V. G., S. S. Wegener, T. Zajkowski, D. V. Sullivan, S. W. Buechel, F.
Enomoto, B. M. Lobitz, S. Johan, J. A. Brass, and E. Hinkley. 2011. The Ikhana unmanned airborne system (UAS) western states fire imaging missions: from concept to reality (2006-2010). Geocarto International 26:85-101.
Anderson, D. R. 2001. The need to get the basics right in wildlife field studies. Wildlife
Society Bulletin 29:1294-1297. Anderson, D. R. 2003. Response to Engeman: index values rarely constitute reliable
information. Wildlife Society Bulletin 31:288-291. Anderson, R. C., P. C. Shanks, L. A. Kritis, and M. G. Trani. 2014. Supporting remote
sensing research with small unmanned aerial systems, Pages 51-56 in The International Archives of the Photogrammetry, Remote Sensing and Spatial Information Sciences. 17-20 November 2014.
Anderson, T. M., J. G. C. Hopcraft, S. Eby, M. Ritchie, J. B. Grace, and H. Olff. 2010.
Landscape-scale analyses suggest both nutrient and antipredator advantages to Serengeti herbivore hotspots. Ecology 91:1519-1529.
August, T., M. Harvey, P. Lightfoot, D. Kilbey, T. Papadopoulos, and P. Jepson. 2015.
Emerging technologies for biological recording. Biological Journal of the Linnean Society 115:731-749.
245
Balmori, A. 2014. Design of secondary control surfaces on unmanned aircraft systems to achieve low glide slope ratios. Master's Thesis, University of Florida, Gainesville, Florida, USA.
Bart, J., S. Droege, P. Geissler, B. Peterjohn, and C. J. Ralph. 2010. Density estimation
in wildlife surveys. Wildlife Society Bulletin 32:1242-1247. Beaver, J. T., C. A. Harper, R. E. Kissell Jr., L. I. Muller, P. S. Basinger, M. J. Goode, F.
T. Van Manen, W. Winton, and M. L. Kennedy. 2014. Aerial vertical-looking infrared imagery to evaluate bias of distance sampling techniques for white-tailed deer. Wildlife Society Bulletin 38:419-427.
Becker, P. A., D. W. Hays, and R. D. Sayler. 2011. 2011 Columbia Basin pygmy rabbit
(Brachylagus idahoensis) reintroduction and genetic management plan: addendum to Washington State recovery plan for the pygmy rabbit (1995). Washington Department of Fish and Wildlife. Olympia, Washington, USA.
Benson, B. J., B. J. Bond, M. P. Hamilton, R. K. Monson, and R. Han. 2010.
Perspectives on next-generation technology for environmental sensor networks. Frontiers in Ecology and the Environment 8:193-200.
Berni, J. A. J., P. J. Zarco-Tejada, L. Suarez, V. Gonzalez-Dugo, and E. Fereres. 2009.
Remote sensing of vegetation from UAV platforms using lightweight multispectral and thermal imaging sensors, Page 6 in The International Archives of the Photogrammetry, Remote Sensing and Spatial Information Sciences. C. Heipke, K. Jacobsen, S. Muller, and U. Sorgel, editors. 2-5 June 2009.
Bevan, E., T. Wibbels, B. M. Z. Najera, M. A. C. Martinez, L. A. S. Martinez, F. I.
Martinez, J. M. Cuevas, T. Anderson, A. Bonka, M. H. Hernandez, L. J. Pena, and P. M. Burchfield. 2015. Unmanned aerial vehicles (UAVs) for monitoring sea turtles in near-shore waters. Marine Turtle Newsletter 145:19-22.
Blickley, J. L., K. Deiner, K. Garbach, I. Lacher, M. H. Meek, L. M. Porensky, M. L.
Wilkerson, E. M. Winford, and M. W. Schwartz. 2012. Graduate student's guide to necessary skills for nonacademic conservation careers. Conservation Biology 27:24-34.
Booth, D. T., and S. E. Cox. 2011. Art to science: tools for greater objectivity in resource
monitoring. Rangelands 33:27-34. Boswell, A. K. 2015. Rangeland monitoring using remote sensing: an assessment of
vegetation cover comparing field-based sampling and image analysis techniques. Master's Thesis, Brigham Young University, Provo, Utah, USA.
Boucher, P. 2015. Domesticating the drone: the demilitarisation of unmanned aircraft for
civil markets. Science and Engineering Ethics 21:1393-1412.
246
Bowman, W. S. 2008. Design and validation of autonomous rapid mapping system
using small UAV. Master's Thesis, University of Florida, Gainesville, Florida, USA.
Brooke, S., D. Graham, T. Jacobs, C. Littnan, M. Manuel, and R. O'Conner. 2015.
Testing marine conservation applications of unmanned aerial systems (UAS) in a remote marine protected area. Journal of Unmanned Vehicle Systems 3:237-251.
Burns, J. H. R., D. Delparte, R. D. Gates, and M. Takabayashi. 2015. Integrating
structure-from-motion photogrammetry with geospatial software as a novel technique for quantifying 3D ecological characteristics of coral reefs. PeerJ 3:e1077.
Camp, M. J., J. L. Rachlow, B. A. Woods, T. R. Johnson, and L. A. Shipley. 2012. When
to run and when to hide: the influence of concealment, visibility, and proximity to refugia on perceptions of risk. Ethology 118:1010-1017.
Camp, M. J., J. L. Rachlow, B. A. Woods, T. R. Johnson, and L. A. Shipley. 2013.
Examining functional components of cover: the relationship between concealment and visibility in shrub-steppe habitat. Ecosphere 4:1-14.
Camp, M. J., L. A. Shipley, T. R. Johnson, J. S. Forbey, J. L. Rachlow, and M. M.
Crowell. 2015. Modeling trade-offs between plant fiber and toxins: a framework for quantifying risks perceived by foraging herbivores. Ecology 96:3292-3302.
Caughley, G. J. 1974. Bias in aerial survey. The Journal of Wildlife Management
38:921-933. Caughley, G. J. 1977. Sampling in aerial survey. The Journal of Wildlife Management
41:605-615. Cerra, D., J. Bieniarz, F. Beyer, J. Tian, R. Muller, T. Jarmer, and P. Reinartz. 2016.
Cloud removal in image time series through sparse reconstruction from random measurements. IEEE Journal of Selected Topics in Applied Earth Observations and Remote Sensing 9:3615-3628.
Chabot, D. M. 2014. The rise of unmanned aircraft in wildlife science: a review of
potential contributions and their application to waterbird research. Doctoral Dissertation, McGill University, Montreal, Canada.
Chong, S. C., and K. K. Evans. 2011. Distributed versus focused attention (count vs
estimate). WIREs Cognitive Science 2:634-638.

247
Christiansen, R. S. 2004. Design of an autopilot for small unmanned aerial vehicles. Master's Thesis, Brigham Young University, Provo, Utah, USA.
Colomina, I., and P. Molina. 2014. Unmanned aerial systems for photogrammetry and
remote sensing: a review. ISPRS Journal of Photogrammetry and Remote Sensing 92:79-97.
Cook, M. I. 2013. South Florida wading bird report. Volume 19. South Florida Water
Management District. West Palm Beach, Florida, USA. Cramer, M. D., and N. N. Barger. 2014. Are mima-like mounds the consequence of
long-term stability of vegetation spatial patterning? Palaeogeography, Palaeoclimatology, Palaeoecology 409:72-83.
Cramer, M. D., D. Stallmann, and N. Haala. 2000. Direct georeferencing using
GPS/inertial exterior orientations for photogrammetric applications, Pages 198-205 in International Archives of Photogrammetry and Remote Sensing.
Cress, J. J., M. E. Hutt, J. L. Sloan, M. Bauer, M. Feller, and S. Goplen. 2015. U.S.
Geological Survey unmanned aircraft systems (UAS) roadmap 2014. Open File Report 2015-1032. U.S. Geological Survey. Reston, Virginia, USA.
Crouch, T. D. 2004. Wings: a history of aviation from kites to the space age. Reprinted.
W.W. Norton & Company, New York, New York, USA. Crowell, M. M., L. A. Shipley, M. J. Camp, J. L. Rachlow, J. S. Forbey, and T. R.
Johnson. 2016. Selection of food patches by sympatric herbivores in response to concealment and distance from a refuge. Ecology and Evolution 6:2865-2876.
Dandois, J. P., and E. C. Ellis. 2013. High spatial resolution three-dimensional mapping
of vegetation spectral dynamics using computer vision. Remote Sensing of Environment 136:259-276.
Edgel, R. J. 2013. Habitat selection and response to disturbance by pygmy rabbits in
Utah. Master's Thesis, Brigham Young University, Provo, Utah, USA. Edgel, R. J., J. L. Pierce, and R. T. Larsen. 2014. Pygmy rabbit (Brachylagus
idahoensis) habitat selection: does sagebrush (Artemisia spp.) age influence selection? Western North American Naturalist 74:145-154.
Elias, B. 2016. Unmanned aircraft operations in domestic airspace: U.S. policy
perspectives and the regulatory landscape. R44352. Congressional Research Service.
Engeman, R. M. 2003. More on the need to get the basics right: population indices.
Wildlife Society Bulletin 31:286-287.

248
Estes-Zumpf, W. A., and J. L. Rachlow. 2009. Natal dispersal by pygmy rabbits
(Brachylagus idahoensis). Journal of Mammalogy 90:363-372. Eugster, H., and S. Nebiker. 2008. UAV-based augmented monitoring--real-time
georeferencing and integration of video imagery with virtual globes, Pages 1229-1236 in The International Archives of the Photogrammetry, Remote Sensing and Spatial Information Sciences.
Evers, B. S. 2011. Improving operational efficiency of small unmanned aircraft systems
for remote sensing applications. Master's Thesis, University of Florida, Gainesville, Florida, USA.
Fahlstrom, P. G., and T. J. Gleason. 2012. Introduction to UAV systems. Fourth edition.
John Wiley & Sons, Ltd., Chichester, West Sussex, United Kingdom. Fewster, R. M., C. Southwell, D. L. Borchers, S. T. Buckland, and A. R. Pople. 2008.
The influence of animal mobility on the assumption of uniform distances in aerial line-transect surveys. Wildlife Research 35:275-288.
Finkl, C. W., and C. Makowski, editors. 2014. Remote sensing and modeling: advances
in coastal and marine resources. Volume 9. Springer. Fleming, P. J. S., and J. P. Tracey. 2008. Some human, aircraft and animal factors
affecting aerial surveys: how to enumerate animals from the air. Wildlife Research 35:258-267.
Fonstad, M. A., J. T. Dietrich, B. C. Courville, J. L. R. Jensen, and P. E. Carbonneau.
2013. Topographic structure from motion: a new development in photogrammetric measurement. Earth Surface Processes and Landforms 38:421-430.
Francis, C. D., J. Paritsis, C. P. Ortega, and A. Cruz. 2011. Landscape patterns of avian
habitat use and nest success are affected by chronic gas well compressor noise. Landscape Ecology 26:1269-1280.
Frederick, P. C., B. Hylton, J. A. Heath, and M. Ruane. 2003. Accuracy and variation in
estimates of large numbers of birds by individual observers using an aerial survey simulator. Journal of Field Ornithology 74:281-287.
Fremgen, M. R. 2015. Plant toxins influence diet selection and intestinal parasites in a
specialist herbivore. Master's Thesis, Boise State University, Boise, Idaho, USA. Gabler, K. I., J. W. Laundre, and L. T. Heady. 2000. Predicting the suitability of habitat
in southeast Idaho for pygmy rabbits. The Journal of Wildlife Management 64:759-764.

249
Galan-Diaz, C., P. Edwards, J. D. Nelson, and R. van der Wal. 2015. Digital innovation
through partnership between nature conservation organisations and academia: a qualitative impact assessment. Ambio 44:S538-S549.
Gann, D., and J. H. Richards. 2009. Determine the effectiveness of plant communities
classification from satellite imagery for the greater Everglades freshwater wetlands & community abundance, distribution and hydroperiod analysis for WCA-2A. Final Report. Florida Internationl University. Miami, Florida, USA.
Gann, D., J. H. Richards, and H. Biswas. 2011. Consulting services to determine the
effectiveness of vegetation classification using WorldView 2 satellite data for the greater Everglades. Synthesis Report. Florida International University. Miami, Florida, USA.
Giudice, J. H., J. R. Fieberg, M. C. Zicus, D. P. Rave, and R. G. Wright. 2010. Cost and
precision functions for aerial quadrat surveys: a case study of Ring-necked Ducks in Minnesota. The Journal of Wildlife Management 74:342-349.
Gordon, C., M. Kujawa, J. Luttrell, D. K. MacArthur, J. Robinson-Willmott, and C.
Thaxter. 2013. High-resolution aerial imaging surveys of marine birds, mammals, and turtles on the US Atlantic outer Continental Shelf--utility assessment, methodology recommendations, and implementation tools. BOEM 2013-01130. Normandeau Associates, Inc. Herndon, Virginia, USA.
Green, J. S., and J. T. Flinders. 1979. Techniques for capturing pygmy rabbits. The
Murrelet 60:112-113. Green, J. S., and J. T. Flinders. 1980a. Brachylagus idahoensis. Mammalian Species
125:1-4. Green, J. S., and J. T. Flinders. 1980b. Habitat and dietary relationships of the pygmy
rabbit. Journal of Range Management 33:136-142. Grenier, M. B., S. W. Buskirk, and R. Anderson-Sprecher. 2009. Population indices
versus correlated density estimates of black-footed ferret abundance. The Journal of Wildlife Management 73:669-676.
Gunasekara, N. K., M. M. Al-Wardy, G. A. Al-Rawas, and Y. Charabi. 2015. Applicability
of VI in arid vegetation delineation using shadow-affected SPOT imagery. Environmental Monitoring and Assessment 187:454-464.
Hardin, P. J., and T. J. Hardin. 2010. Small-scale remotely piloted vehicles in
environmental research. Geography Compass 4:1297-1311.

250
Hardin, P. J., and R. R. Jensen. 2011. Small-scale unmanned aerial vehicles in environmental remote sensing: challenges and opportunities. GIScience & Remote Sensing 48:99-111.
Hartter, J., S. J. Ryan, C. A. MacKenzie, A. Goldman, N. Dowhaniuk, M. Palace, J. E.
Diem, and C. A. Chapman. 2015. Now there is no land: a story of ethnic migration in a protected area landscape in western Uganda. Population and Environment 36:452-479.
Himes, J. G., and P. J. Drohan. 2007. Distribution and habitat selection of the pygmy
rabbit, Brachylagus idahoensis, in Nevada (USA). Journal of Arid Environments 68:371-382.
Hines, J. E., J. D. Nichols, J. A. Royle, D. I. MacKenzie, A. M. Gopalaswamy, N. S.
Kumar, and K. U. Karanth. 2010. Tigers on trails: occupancy modeling for cluster sampling. Ecological Applications 20:1456-1466.
Huang, C., B. Wylie, L. Yang, C. Homer, and G. Zylstra. 2002. Derivation of a tasselled
cap transformation based on Landsat 7 at-satellite reflectance. International Journal of Remote Sensing 23:1741-1748.
Hugenholtz, C. H., K. Whitehead, O. W. Brown, T. E. Barchyn, B. J. Moorman, A.
LeClair, K. Riddell, and T. Hamilton. 2013. Geomorphological mapping with a small unmanned aircraft system (sUAS): feature detection and accuracy assessment of a photogrammetrically-derived digital terrain model. Geomorphology 194:16-24.
IDFG. 2009. Management of American White Pelicans in Idaho: a five-year plan (2009-
2013) to balance American White Pelican and native cutthroat trout conservation needs and manage impacts to recreational fisheries in southeast Idaho. Idaho Department of Fish and Game. Boise, Idaho, USA.
IDFG. 2016. Management plan for the conservation of American White Pelicans in
Idaho 2016-2025. Idaho Department of Fish and Game. Boise, Idaho, USA. Iknayan, K. J., M. W. Tingley, B. J. Furnas, and S. R. Beissinger. 2014. Detecting
diversity: emerging methods to estimate species diversity. Trends in Ecology & Evolution 29:97-106.
Johnson, R., K. Smith, and K. Wescott. 2015. Unmanned aircraft system (UAS)
application to land and natural resource management. Environmental Practice 17:170-177.
Jones IV, G. P. 2003. The feasibility of using small unmanned aerial vehicles for wildlife
research. Master's Thesis, University of Florida, Gainesville, Florida, USA.
251
Jones IV, G. P., L. G. Pearlstine, and H. F. Percival. 2006. An assessment of small unmanned aerial vehicles for wildlife research. Wildlife Society Bulletin 34:750-758.
Junda, J., E. Greene, and D. M. Bird. 2015. Proper flight technique for using a small
rotary-winged drone aircraft to safely, quickly, and accurately survey raptor nests. Journal of Unmanned Vehicle Systems 3:222-236.
Katzner, T. E., and K. L. Parker. 1997. Vegetative characteristics and size of home
ranges used by pygmy rabbits (Brachylagus idahoensis) during winter. Journal of Mammalogy 78:1063-1072.
Keinath, D. A., and M. McGee. 2004. Species assessment for pygmy rabbit
(Brachylagus idahoensis) in Wyoming. United States Department of the Interior, Bureau of Land Management, Wyoming State Office. Cheyenne, Wyoming, USA.
Keith, J. O. 2005. An overview of the American White Pelican. Waterbirds: The
International Journal of Waterbird Biology 28:9-17. Kendall, W. L., S. J. Converse, P. F. Doherty Jr., M. B. Naughton, A. Anders, J. E.
Hines, and E. Flint. 2009. Sampling design considerations for demographic studies: a case of colonial seabirds. Ecological Applications 19:55-68.
King, D. T., and D. W. Anderson. 2005. Recent population status of the American White
Pelican: a continental perspective. Waterbirds: The International Journal of Waterbird Biology 28:48-54.
Knopf, F. L., and R. M. Evans. 2004. American White Pelican (Pelecanus
erythrorhynchos). In P. G. Rodewald, editor. The Birds of North America Online. The Cornell Lab of Ornithology, Ithaca, New York, USA. <https://birdsna.org/Species-Account/bna/species/amepel/>. Accessed Dec 2016.
Kobziar, L. N., D. Godwin, L. Taylor, and A. C. Watts. 2015. Perspectives on trends,
effectiveness, and impediments to prescribed burning in the southern U.S. Forests 6:561-580.
Kuenzer, C., and S. Dech, editors. 2013. Thermal infrared remote sensing: sensors,
methods, applications. Volume 17. Springer, New York, New York, USA. Kushlan, J. A. 1979. Effects of helicopter censuses on wading bird colonies. The
Journal of Wildlife Management 43:756-760. Kushlan, J. A., and P. C. Frohring. 1985. Decreases in the Brown Pelican population in
southern Florida. Colonial Waterbirds 8:83-95.
252
Langtimm, C. A., R. M. Dorazio, B. M. Stith, and T. J. Doyle. 2011. New aerial survey and hierarchical model to estimate manatee abundance. The Journal of Wildlife Management 75:399-412.
Larrucea, E. S., and P. F. Brussard. 2009. Diel and seasonal activity patterns of pygmy
rabbits (Brachylagus idahoensis). Journal of Mammalogy 90:1176-1183. LaRue, M. A., S. Stapleton, C. Porter, S. Atkinson, T. Atwood, M. Dyck, and N.
Lecomte. 2015. Testing methods for using high-resolution satellite imagery to monitor polar bear abundance and distribution. Wildlife Society Bulletin 39:772-779.
Lee, J. E. 2008. Pygmy rabbit (Brachylagus idahoensis) habitat use, activity patterns
and conservation in relationship to habitat treatments. Master's Thesis, Brigham Young University, Provo, Utah, USA.
Lee, K. 2004. Development of unmanned aerial vehicle (UAV) for wildlife surveillance.
Master's Thesis, University of Florida, Gainesville, Florida, USA. Linchant, J., J. Lisein, J. Semeki, P. Lejeune, and C. Vermeulen. 2015. Are unmanned
aircraft systems (UASs) the future of wildlife monitoring? A review of accomplishments and challenges. Mammal Review 45:239-252.
Link, W. A., and J. R. Sauer. 1997. Estimation of population trajectories from count
data. Biometrics 53:488-497. Lisein, J., J. Linchant, P. Lejeune, P. Bouche, and C. Vermeulen. 2013. Aerial surveys
using an unmanned aerial system (UAS): comparison of different methods for estimating the surface area of sampling strips. Tropical Conservation Science 6:506-520.
Loarie, S. R., L. N. Joppa, and S. L. Pimm. 2007. Satellites miss environmental
priorities. Trends in Ecology & Evolution 22:630-632. Lucieer, A., S. M. de Jong, and D. Turner. 2014. Mapping landslide displacements using
Structure from Motion (SfM) and image correlation of multi-temporal UAV photography. Progress in Physical Geography 38:97-116.
Madden, M. M., T. Jordan, S. Bernardes, D. L. Cotten, N. O'Hare, and A. Pasqua. 2015.
Unmanned aerial systems and structure from motion revolutionize wetlands mapping. Pages 195-220 In R. W. Tiner Jr., M. W. Lang, and V. V. Klemas, editors. Remote Sensing of Wetlands: Applications and Advances. CRC Press.
Magnusson, W. E., G. J. Caughley, and G. C. Grigg. 1978. A double-survey estimate of
population size from incomplete counts. The Journal of Wildlife Management 42:174-176.
253
Martin, J., H. H. Edwards, M. A. Burgess, H. F. Percival, D. E. Fagan, B. E. Gardner, J.
G. Ortega-Ortiz, P. G. Ifju, B. S. Evers, and T. J. Rambo. 2012. Estimating distribution of hidden objects with drones: from tennis balls to manatees. PLoS ONE 7:e38882.
McCleery, R. A., A. R. Holdorf, L. L. Hubbard, and B. D. Peer. 2015. Maximizing the
wildlife conservation value of road right-of-ways in an agriculturally dominated landscape. PLoS ONE 10:e0120375.
Meyer, K. A., C. L. Sullivan, P. Kennedy, D. J. Schill, D. M. Teuscher, A. F. Brimmer,
and D. T. King. 2016. Predation by American White Pelicans and Double-crested Cormorants on catchable-sized hatchery rainbow trout in select Idaho lentic waters. North American Journal of Fisheries Management 36:294-308.
Miller, M. W., E. V. Pearlstine, R. M. Dorazio, and F. J. Mazzotti. 2011. Occupancy and
abundance of wintering birds in a dynamic agricultural landscape. The Journal of Wildlife Management 75:836-847.
Mocklin, J. A., D. J. Rugh, S. E. Moore, and R. P. Angliss. 2012. Using aerial
photography to investigate evidence of feeding by bowhead whales. Marine Mammal Science 28:602-619.
Mohamed, A. H., and B. E. Wilkinson. 2009. Direct georeferencing of stationary LiDAR.
Remote Sensing 1:1321-1337. Moreland, E. E., M. F. Cameron, R. P. Angliss, and P. L. Boveng. 2015. Evaluation of a
ship-based unoccupied aircraft system (UAS) for surveys of spotted and ribbon seals in the Bering Sea pack ice. Journal of Unmanned Vehicle Systems 3:114-122.
Mulero-Pázmány, M. 2015. Unmanned aerial systems in conservation biology. Doctoral
Dissertation, University of Seville, Seville, Spain. Mulero-Pázmány, M., R. Stolper, L. D. van Essen, J. J. Negro, and T. Sassen. 2014.
Remotely piloted aircraft systems as a rhinoceros anti-poaching tool in Africa. PLoS ONE 9:e83873.
Newman, S. 2016. Update on rehabilitating impacted regions of Water Conservation
Area (WCA)-2A: the Active Marsh Improvement (AMI) project. South Florida Water Management District, West Palm Beach, Florida, USA.
Nichols, J. D., W. L. Kendall, and M. C. Runge. 2004. Estimating survival and
movement. Pages 119-139 In W. J. Sutherland, I. Newton, and R. E. Green, editors. Bird Ecology and Conservation: A Handbook of Techniques. Oxford University Press, Oxford, United Kingdom.
254
Nijland, W., R. de Jong, S. M. de Jong, M. A. Wulder, C. W. Bater, and N. C. Coops.
2014. Monitoring plant condition and phenology using infrared sensitive consumer grade digital cameras. Agricultural and Forest Meteorology 184:98-106.
NOAA. 2016. Historical climate data online. In National Oceanic and Atmospheric
Administration, National Centers for Environmental Information, Asheville, North Carolina, USA. <https://www.ncdc.noaa.gov/cdo-web/search>. Accessed Dec 2016.
Nobler, J. D. 2016. Risky business: tradeoffs between nutrition, toxicity, and predation
by a specialist mammalian herbivore. Master's Thesis, Boise State University, Boise, Idaho, USA.
Nobler, J. D., P. J. Olsoy, and J. S. Forbey. 2013. Spectroscopy as a tool to measure
the foodscapes of vertebrate herbivores. Boise State University. Boise, Idaho, USA.
Olsoy, P. J. 2013. Determination of sagebrush aboveground biomass using terrestrial
laser scanning (TLS). Master's Thesis, Idaho State University, Pocatello, Idaho, USA.
Olsoy, P. J., J. S. Forbey, J. L. Rachlow, J. D. Nobler, N. F. Glenn, and L. A. Shipley.
2015. Fearscapes: mapping functional properties of cover for prey with terrestrial LiDAR. BioScience 65:74-80.
Ono, A., K. Kajiwara, Y. Honda, and A. Ono. 2010. Development of new vegetation
indexes, shadow index (SI) and water stress trend (WST), Pages 710-714 in The International Archives of the Photogrammetry, Remote Sensing and Spatial Information Sciences. C. Jun, editor.
Ozesmi, S. L., and M. E. Bauer. 2002. Satellite remote sensing of wetlands. Wetlands
Ecology and Management 10:381-402. Pacifici, K., R. M. Dorazio, and M. J. Conroy. 2012. A two-phase sampling design for
increasing detections of rare species in occupancy surveys. Methods in Ecology and Evolution 3:721-730.
Packard, J. M., R. C. Summers, and L. B. Barnes. 1985. Variation of visibility bias
during aerial surveys of manatees. The Journal of Wildlife Management 49:347-351.
Pajares, G. 2015. Overview and current status of remote sensing applicaitons based on
unmanned aerial vehicles (UAVs). Photogrammetric Engineering & Remote Sensing 81:281-329.

255
Park, S. 2013. Cloud and cloud shadow effects on the MODIS vegetation index
composites of the Korean Peninsula. International Journal of Remote Sensing 34:1234-1247.
Parsons, M. A., T. C. Barkley, J. L. Rachlow, J. L. Johnson-Maynard, T. R. Johnson, C.
R. Milling, J. E. Hammel, and I. Leslie. 2016. Cumulative effects of an herbivorous ecosystem engineer in a heterogeneous landscape. Ecosphere 7:e01334.
Perry, J. H. 2009. A synthesized directly georeferenced remote sensing technique for
small unmanned aerial vehicles. Master's Thesis, University of Florida, Gainesville, Florida, USA.
Pettorelli, N., J. O. Vik, A. Mysterud, J.-M. Gaillard, C. J. Tucker, and N. C. Stenseth.
2005. Using the satellite-derived NDVI to assess ecological responses to environmental change. Trends in Ecology & Evolution 20:503-510.
Pollock, K. H., H. D. Marsh, I. R. Lawler, and M. W. Alldredge. 2006. Estimating animal
abundance in heterogeneous environments: an application to aerial surveys for dugongs. The Journal of Wildlife Management 70:255-262.
Pomeroy, P., L. O'Connor, and P. Davies. 2015. Assessing use of and reaction to
unmanned aerial systems in gray and harbor seals during breeding and molt in the UK. Journal of Unmanned Vehicle Systems 3:102-113.
Rachlow, J. L., D. M. Sanchez, and W. A. Estes-Zumpf. 2005. Natural burrows and
nests of free-ranging pygmy rabbits (Brachylagus idahoensis). Western North American Naturalist 65:136-139.
Rachlow, J. L., and L. K. Svancara. 2006. Prioritizing habitat for surveys of an
uncommon mammal: a modeling approach applied to pygmy rabbits. Journal of Mammalogy 87:827-833.
Rachlow, J. L., and J. Witham. 2006. Aerial surveys for pygmy rabbits in the BLM
Shoshone Field Office area: results and an evaluation of the technique. DLF050581. University of Idaho. Moscow, Idaho, USA.
Ralph, C. J., and J. M. Scott, editors. 1981. Estimating numbers of terrestrial birds.
Volume 6. Cooper Ornithological Society and Allen Press, Inc., Lawrence, Kansas, USA.
Rango, A., and A. S. Laliberte. 2010. Impact of flight regulations on effective use of
unmanned aircraft systems for natural resources applications. Journal of Applied Remote Sensing 4:1-12.
256
Reynolds, J. H., M. G. Knutson, K. B. Newman, E. D. Silverman, and W. L. Thompson. 2016. A road map for designing and implementing a biological monitoring program. Environmental Monitoring and Assessment 188:399-423.
Richards, J. A., editor. 2013. Remote sensing digital image analysis: an introduction.
Fifth edition. Springer-Verlag, New York, New York, USA. Roberts, H. B. 2001. Survey of pygmy rabbit distribution, numbers and habitat use in
Lemhi and Custer Counties, Idaho. Technical Bulletin 01-11. Rosenstock, S. S., D. R. Anderson, K. M. Giesen, T. Leukering, and M. F. Carter. 2002.
Landbird counting techniques: current practices and an alternative. The Auk 119:46-53.
Royle, J. A., and R. M. Dorazio. 2010. Parameter-expanded data augmentation for
Bayesian analysis of capture–recapture models. Journal of Ornithology 152:S521-S537.
Sanchez, D. M., and J. L. Rachlow. 2008. Spatio-temporal factors shaping diurnal
space use by pygmy rabbits. The Journal of Wildlife Management 72:1304-1310. Sarda-Palomera, F., G. Bota, C. Vinolo, O. Pallares, V. Sazatornil, L. Brotons, S.
Gomariz, and F. Sarda. 2012. Fine-scale bird monitoring from light unmanned aircraft systems. IBIS: The International Journal of Avian Science 154:177-183.
Sasse, D. B. 2003. Job-related mortality of wildlife workers in the United States, 1937-
2000. Wildlife Society Bulletin 31:1015-1020. Schmidt, J. H., K. L. Rattenbury, J. P. Lawler, and M. C. Maccluskie. 2012. Using
distance sampling and hierarchical models to improve estimates of Dall's sheep abundance. The Journal of Wildlife Management 76:317-327.
Severaid, J. H. 1950. The pigmy rabbit (Sylvilagus idahoensis) in Mono County,
California. Journal of Mammalogy 31:1-4. Shahbazi, M., J. Théau, and P. Ménard. 2014. Recent applications of unmanned aerial
imagery in natural resource management. GIScience & Remote Sensing 51:339-365.
Shipley, L. A., T. B. Davila, N. J. Thines, and B. A. Elias. 2006. Nutritional requirements
and diet choices of the pygmy rabbit (Brachylagus idahoensis): a sagebrush specialist. Journal of Chemical Ecology 32:2455-2474.
Shipley, L. A., J. S. Forbey, and B. D. Moore. 2009. Revisiting the dietary niche: when is
a mammalian herbivore a specialist? Integrative and Comparative Biology 49:274-290.

257
Shufeldt, R. W. 1888. The leaps of Lepus. Nature 37:247. Siegel Thines, N. J., L. A. Shipley, and R. D. Sayler. 2004. Effects of cattle grazing on
ecology and habitat of Columbia Basin pygmy rabbits (Brachylagus idahoensis). Biological Conservation 119:525-534.
Stark, B., and Y. Q. Chen. 2014. Optimal collection of high resolution aerial imagery
with unmanned aerial systems, Pages 89-94 in 2014 International Conference on Unmanned Aircraft Systems (ICUAS). 27-30 May 2014.
Stark, B., C. Coopmans, and Y. Q. Chen. 2013. Concept of operations for personal
remote sensing unmanned aerial systems. Journal of Intelligent & Robotic Systems 69:5-20.
Stober, J. M., and L. L. Smith. 2010. Total counts versus line transects for estimating
abundance of small gopher tortoise populations. The Journal of Wildlife Management 74:1595-1600.
Strong, L. L., and L. M. Cowardin. 1995. Improving prairie pond counts with aerial video
and global positioning systems. The Journal of Wildlife Management 59:708-719. Temple, S. A., and J. A. Wiens. 1989. Bird populations and environmental changes: can
birds be bio-indicators? American Birds 43:260-270. Teuscher, D. M., M. T. Green, D. J. Schill, A. F. Brimmer, and R. W. Hillyard. 2015.
Predation by American White Pelicans on Yellowstone cutthroat trout in the Blackfoot River drainage, Idaho. North American Journal of Fisheries Management 35:454-463.
Thomas, L., S. T. Buckland, E. A. Rexstad, J. L. Laake, S. Strindberg, S. L. Hedley, J.
R. B. Bishop, T. A. Marques, and K. P. Burnham. 2010. Distance software: design and analysis of distance sampling surveys for estimating population size. Journal of Applied Ecology 47:5-14.
Towler, J., B. Krawiec, and K. Kochersberger. 2012. Radiation mapping in post-disaster
environments using an autonomous helicopter. Remote Sensing 4:1995-2015. Tracey, J. P., P. J. S. Fleming, and G. J. Melville. 2008. Accuracy of some aerial survey
estimators: contrasts with known numbers. Wildlife Research 35:377-384. Turner, D., A. Lucieer, and C. Watson. 2012. An automated technique for generating
georectified mosaics from ultra-high resolution unmanned aerial vehicle (UAV) imagery, based on structure from motion (SfM) point clouds. Remote Sensing 4:1392-1410.
258
Ulappa, A. C., R. G. Kelsey, G. G. Frye, J. L. Rachlow, L. A. Shipley, L. Bond, X. Pu, and J. S. Forbey. 2014. Plant protein and secondary metabolites influence diet selection in a mammalian specialist herbivore. Journal of Mammalogy 95:834-842.
Ulmschneider, H., D. Hays, H. B. Roberts, J. L. Rachlow, T. Forbes, J. Himes, E.
Sequin, M. Haworth, T. E. Katzner, A. Kozlowski, R. Rauscher, and P. Lauridson. 2008. Surveying for pygmy rabbits (Brachylagus idahoensis). Idaho Pygmy Rabbit Working Group.
Urbanek, R. E., C. K. Nielsen, T. S. Preuss, and G. A. Glowacki. 2012. Comparison of
aerial surveys and pellet-based distance sampling methods for estimating deer density. Wildlife Society Bulletin 36:100-106.
USBOR. 2016. Historical data for MIN - Minidoka Dam and Lake Walcott, ID. In US
Bureau of Reclamation, Pacific Northwest Region, Boise, Idaho, USA. <https://www.usbr.gov/pn-bin/arcread.pl?station=MIN>. Accessed Dec 2016.
Utz, J. L. 2012. Understanding the tradeoff between safety and food quality in a
mammalian herbivore specialist, the pygmy rabbit. Master's Thesis, Boise State University, Boise, Idaho, USA.
Utz, J. L., L. A. Shipley, J. L. Rachlow, T. Johnstone-Yellin, M. J. Camp, and J.
Sorensen Forbey. 2016. Understanding tradeoffs between food and predation risks in a specialist mammalian herbivore. Wildlife Biology 22:167-173.
van Gemert, J. C., C. R. Verschoor, P. Mettes, K. Epema, L. P. Koh, and S. A. Wich.
2015. Nature conservation drones for automatic localization and counting of animals. Pages 255-270 In L. Agapito, M. M. Bronstein, and C. Rother, editors. Computer Vision - ECCV 2014 Workshops. Springer International Publishing, Zurich, Switzerland.
Verhoeven, G. J. J. 2009. Providing an archaeological bird's-eye view – an overall
picture of ground-based means to execute low-altitude aerial photography (LAAP) in archaeology. Archaeological Prospection 16:233-249.
Verhoeven, G. J. J. 2010. It's all about the format – unleashing the power of RAW aerial
photography. International Journal of Remote Sensing 31:2009-2042. Viquerat, S., and A. van Neer. 2015. iTag image tagging software manual. Walsh, D. P., H. Campa III, D. E. Beyer Jr., and S. R. Winterstein. 2011. Measurement
error and survey design in sightability model development. The Journal of Wildlife Management 75:1228-1235.
259
Wang, K., S. E. Franklin, X. Guo, and M. Cattet. 2010. Remote sensing of ecology, biodiversity and conservation: a review from the perspective of remote sensing specialists. Sensors 10:9647-9667.
Watts, A. C., J. H. Perry, S. E. Smith, M. A. Burgess, B. E. Wilkinson, Z. Szantoi, P. G.
Ifju, and H. F. Percival. 2010. Small unmanned aircraft systems for low-altitude aerial surveys. The Journal of Wildlife Management 74:1614-1619.
Weishampel, J. F., D. A. Bagley, L. M. Ehrhart, and B. L. Rodenbeck. 2003.
Spatiotemporal patterns of annual sea turtle nesting behaviors along an east central Florida beach. Biological Conservation 110:295-303.
Weiss, N. T. 1984. Habitat and distribution of pygmy rabbits (Sylvilagus idahoensis) in
Oregon. Master's Thesis, Oregon State University, Corvallis, Oregon, USA. Westoby, M. J., J. Brasington, N. F. Glasser, M. J. Hambrey, and J. M. Reynolds. 2012.
'Structure-from-Motion' photogrammetry: a low-cost, effective tool for geoscience applications. Geomorphology 179:300-314.
White, S. M., J. T. Flinders, and B. L. Welch. 1982. Preference of pygmy rabbits
(Brachylagus idahoensis) for various populations of big sagebrush (Artemisia tridentata). Journal of Range Management 35:724-726.
Wilkinson, B. E. 2007. The design of georeferencing techniques for unmanned
autonomous aerial vehicle video for use with wildlife inventory surveys: a case study of the National Bison Range, Montana. Master's Thesis, University of Florida, Gainesville, Florida, USA.
Wilkinson, B. E., B. A. Dewitt, A. C. Watts, A. H. Mohamed, and M. A. Burgess. 2009. A
new approach for pass-point generation from aerial video imagery. Photogrammetric Engineering & Remote Sensing 75:1415-1423.
Williams, B. K., J. D. Nichols, and M. J. Conroy. 2002. Analysis and management of
animal populations. Academic Press, San Diego, California, USA. Williams, K. A., E. E. Connelly, S. M. Johnson, and I. J. Stenhouse, editors. 2015.
Wildlife densities and habitat use across temporal and spatial scales on the Mid-Atlantic Outer Continental Shelf (2012-2014): final report to the Department of Energy EERE Wind & Water Power Technologies Office. Biodiversity Research Institute, Portland, Maine, USA.
Williams, K. A., P. C. Frederick, and J. D. Nichols. 2011. Use of the superpopulation
approach to estimate breeding population size: an example in asynchronously breeding birds. Ecology 92:821-828.
260
Wing, M. G., J. Burnett, J. Sessions, J. Brungardt, V. Cordell, D. Dobler, and D. Wilson. 2013. Eyes in the sky: remote sensing technology development using small unmanned aircraft systems. Journal of Forestry 111:341-347.
Wolf, P. R., B. A. Dewitt, and B. E. Wilkinson. 2014. Elements of photogrammetry with
applications in GIS. Fourth edition. McGraw-Hill Education, New York, New York, USA.
Wozencraft, J. M., and W. J. Lillycrop. 2003. SHOALS airborne coastal mapping: past,
present, and future. Journal of Coastal Research:207-215. Zhang, L., X. Sun, T. Wu, and H. Zhang. 2015. An analysis of shadow effects on
spectral vegetation indexes using a ground-based imaging spectrometer. IEEE Geoscience and Remote Sensing Letters 12:2188-2192.
Zweig, C. L., M. A. Burgess, H. F. Percival, and W. M. Kitchens. 2015. Use of
unmanned aircraft systems to delineate fine-scale wetland vegetation communitites. Wetlands 35:303-309.
Zweig, C. L., and S. Newman. 2015. Using landscape context to map invasive species
with medium-resolution satellite imagery. Restoration Ecology 23:524-530.

261
BIOGRAPHICAL SKETCH
Matthew Alexander Burgess was born in July 1977, in Gainesville, Florida.
Growing up, his routine participation in fieldwork with his father, annual family vacations
to Crescent Beach, and summers sailing on the Hudson River and Long Island Sound
helped foster his love of science and the environment. In June 1995, Matthew
graduated from Gainesville High School. After beginning his collegiate career at the
University of Florida (UF) in civil engineering, he realized that his desire for working
outdoors was stronger than computing integrals, so he changed his major to zoology.
In August 1999, he earned his Bachelor of Science degree from UF, and was hired full-
time as a laboratory assistant and international field technician in the UF Zoology
Department. Matthew accepted a five-year term appointment in late 2001 as a fisheries
biologist for the US Geological Survey in Gainesville. During that time, he began a
master’s degree at UF in interdisciplinary ecology. When the USGS appointment
ended, he worked part-time for the Florida Program for Shark Research at the Florida
Museum of Natural History, which provided time to complete his thesis, ‘Quantification
and Ecological Role of Snag Habitat in the Apalachicola River, Florida.’ In August 2008,
Matthew earned his Master of Science degree from UF. Never thinking his hobby of
racing remote control cars would ever end up on his CV, nor be a factor in landing a job,
Matthew was hired in July 2008 as the Program Coordinator of the UF Unmanned
Aircraft Systems Research Program, administered out of the Florida Cooperative Fish
and Wildlife Research Unit. Serving in that role full-time and slowly becoming a subject
matter expert in UAS for natural resource applications, his boss and mentor Dr. Percival
encouraged Matthew to pursue a Ph.D. in the UF Department of Wildlife Ecology and
Conservation, which he began in August 2011, and completed in May 2017.