smart balance - nyu stern school of...
TRANSCRIPT

SMART BALANCE
Todd Tamagnini
Neha Gaddam
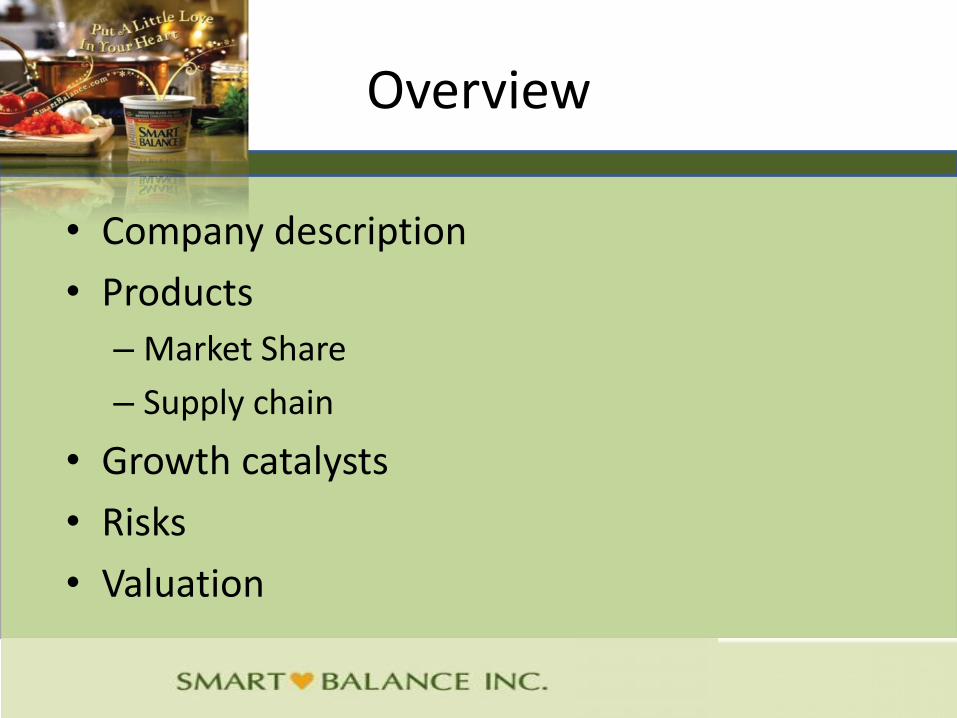
Overview
• Company description
• Products
– Market Share
– Supply chain
• Growth catalysts
• Risks
• Valuation

The Company
• Smart Balance distributes heart healthy and low fat
food products (‘functional foods’) in the United
States
• Products include buttery spreads, Popcorn, Oil, Oil
spray, mayonnaise, cheese, Peanut Butter
• $500m market cap
• SB acquired by boulder specialty brands (BSB) in ‘07
for $491m
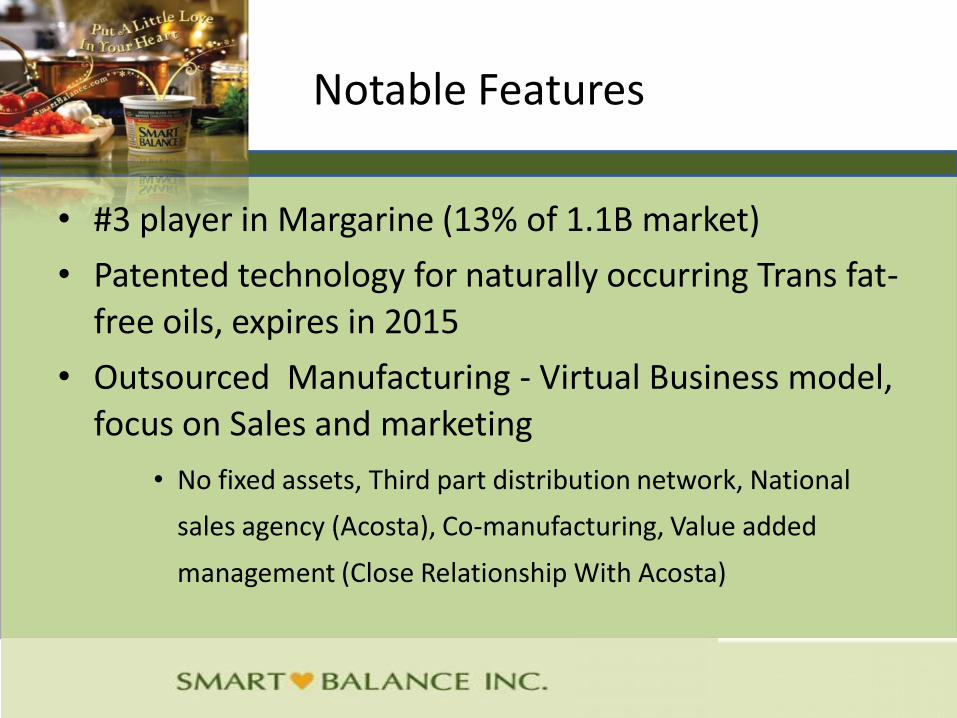
Notable Features
• #3 player in Margarine (13% of 1.1B market)
• Patented technology for naturally occurring Trans fat-free oils, expires in 2015
• Outsourced Manufacturing - Virtual Business model, focus on Sales and marketing
• No fixed assets, Third part distribution network, National
sales agency (Acosta), Co-manufacturing, Value added
management (Close Relationship With Acosta)
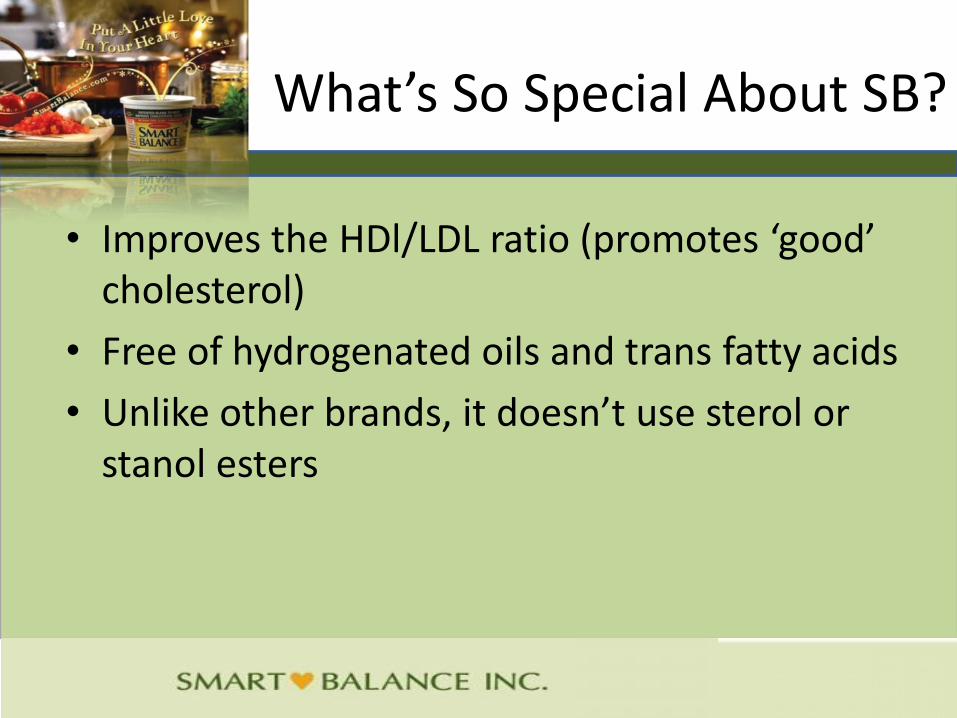
What’s So Special About SB?
• Improves the HDl/LDL ratio (promotes ‘good’ cholesterol)
• Free of hydrogenated oils and trans fatty acids
• Unlike other brands, it doesn’t use sterol or stanol esters

Corporate History
Pre-1996: Robert Harris
(Weight Watchers) starts GFA
brands
1996: GFA licenses a patented blend of natural
vegetable oils
1997: GFA launches
Smart Balance margarine
2005: Boulder specialty
brands (BSB) formed as a blank check
company
2007: BSB acquired GFA and changes its name to
Smart Balance

Capital Structure
Price 7.90
Shares Outstanding 62,000
Market Cap 49,4000
Cash 7,000
Debt 90,000
Enterprise Value 580,000
• Recently recalled all preferred stock and warrants
•Used proceeds to pay down debt

Buttery Facts
Market Share increased from 2.4% to 12.6%

Smart BalanceTM Products
Current Products Recent launches (2007) Future scope (2009?)
Buttery spreads Butter Blend Stick Yogurt
Omega Peanut Butter Milk(with omega-3s and Vit E)
Sour cream
Omega Cooking Oil Cream Cheese Oatmeal
Omega plus light Mayonnaise
Popcorn
Cheese
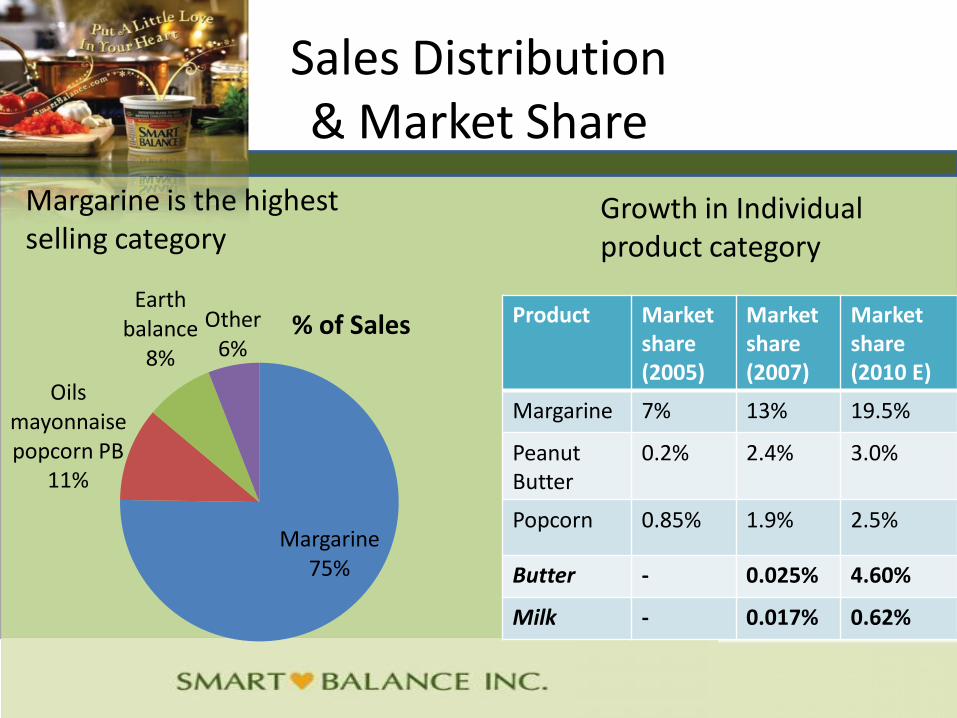
Sales Distribution& Market Share
Margarine75%
Oils mayonnaise popcorn PB
11%
Earth balance
8%
Other6%
% of Sales Product Market share (2005)
Market share (2007)
Marketshare(2010 E)
Margarine 7% 13% 19.5%
PeanutButter
0.2% 2.4% 3.0%
Popcorn 0.85% 1.9% 2.5%
Butter - 0.025% 4.60%
Milk - 0.017% 0.62%
Margarine is the highest selling category
Growth in Individual product category

19.8% 19.1% 19.0%18.0% 17.6% 17.5%
13%
0.0%
5.0%
10.0%
15.0%
20.0%
25.0%
San Francisco
New York Portland Boise Denver Seattle Total US
Smartbalance Mkt Share
Select Markets

Target Market
1B
5B
25B
0
5
10
15
20
25
30
Core (margarine)Initial Expansion (oil, PB, popcorn, mayo)Target Expansion (cheese, cream cheese, milk, other)
Market Size ($Billion)

Supply Chain & Control
Outsourced Manufacturers
Third party Distributors, Warehouses Supermarket chains
• Business model that works on 50 employees
• Consultants at each site, quality control reportsNegotiate certain commodities & packaging costs with suppliers
Price = Cost of ingredients + Packaging + Fixed toll charge
Pay monthly handling and logistics fees, freight charges
Internal sales force and sales agency Acosta, Inc.

Leading Customers
• Wal- Mart
• C&S Wholesale
• Kroger
• Publix
• Safeway
Growth Catalysts
• Rapid growth of the company
• Expansion in product lines & consumer retention
• Increase marketing spending
• Great management
• Drivers of functional food industry
• Penetration opportunity
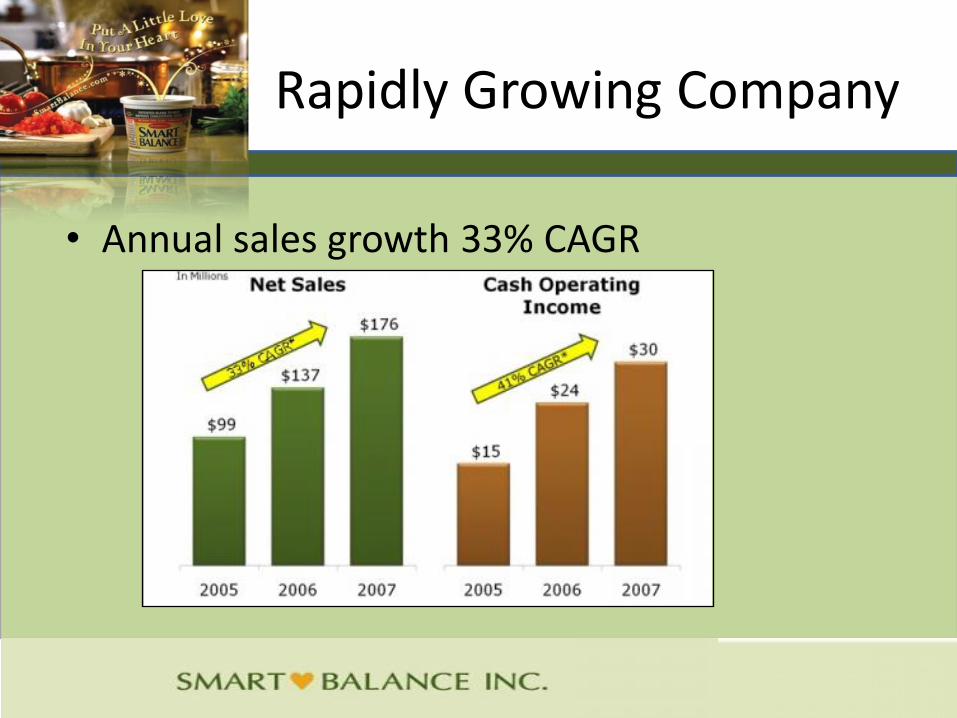
Rapidly Growing Company
• Annual sales growth 33% CAGR

Expanding Product Lines & Consumer Loyalty
• Expansion into other product lines –cheese, milk, cream cheese
• Ability to retain old consumers and attract new ones
57%
42% 42% 46%
33%
50%41%
35%
Smart Balance
Mayonnaise w/ Omega
Smart Balance
Cooking Oil
Smart Balance Popcorn
Smart Balance Peanut
Butter w/ Omega
Analysis of consumers
% tried SB Spreads % New to SB

• Increase in marketing spending, and target population base
– Increase marketing expense from $20m to $40m
– Research on consumers: 80% revenues generated by 2-4m of 44m potential households
– Pay higher slotting fee
Increase Marketing

High-caliber leadership –Stephen Hughes
• CEO – Stephen Hughes (25 years)– (1988-1992) led the development of Healthy Choice frozen food line
(revenues grew from 0 to 1B)
– (1994-1996) executive vice president of Tropicana Products (Led turnaround of US business, increasing sales from 1B-2B in four years)
– (1997-2000) CEO of Celestial Seasonings (Grew Revenue from 75-125m)
– (2000-2002) CEO of Frontier Natural Product
– (2002-2004) White Wave Foods (Part of Dean Foods) Grew Silk brand from 175-400m in two years
• CFO – Bob Gluck– Bestfoods
– Unilever
• Management Stock Ownership: 6%
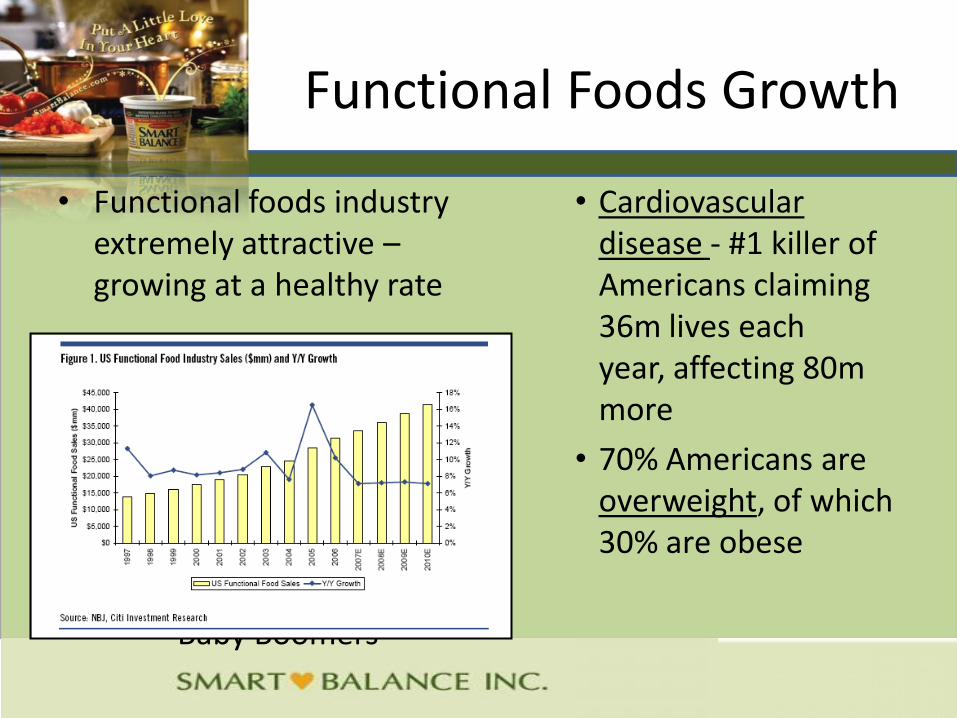
Functional Foods Growth
• Functional foods industry extremely attractive –growing at a healthy rate
• Baby Boomers
• Cardiovascular disease - #1 killer of Americans claiming 36m lives each year, affecting 80m more
• 70% Americans are overweight, of which 30% are obese

Low Penetration, High Growth = ‘Smart’ Opportunity
5%-1%
6% 9%
52%
40%
2% 3%
Breakfast Foods Fresh Juice Dressings & spreads
Dairy (milk, butter)
Y/Y growth Functional food penetration
SB product categories: Dairy & condiments, dressings spreads, sauces – low penetration and high growth

• Strong Insider Buying
• Large hedge funds in stock, more coming in
• O. O. S. Capital
Insider Buying /Large Institutions
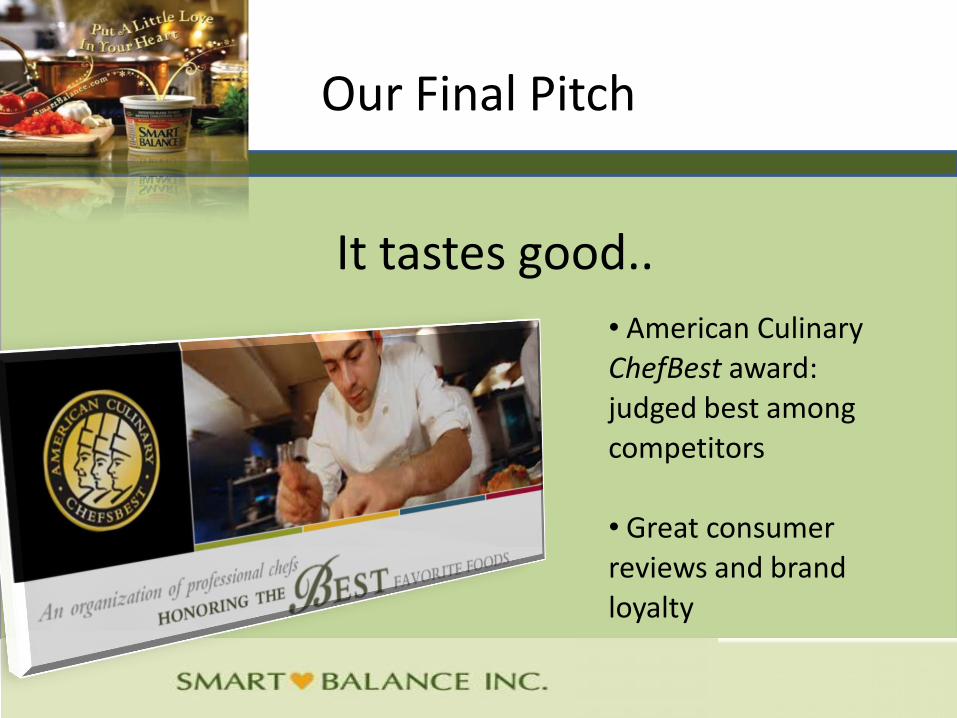
It tastes good..
Our Final Pitch
• American Culinary ChefBest award:
judged best among
competitors
• Great consumer reviews and brand
loyalty

Risks
• Product concentration
• Customer concentration
• Commodities
• Competition
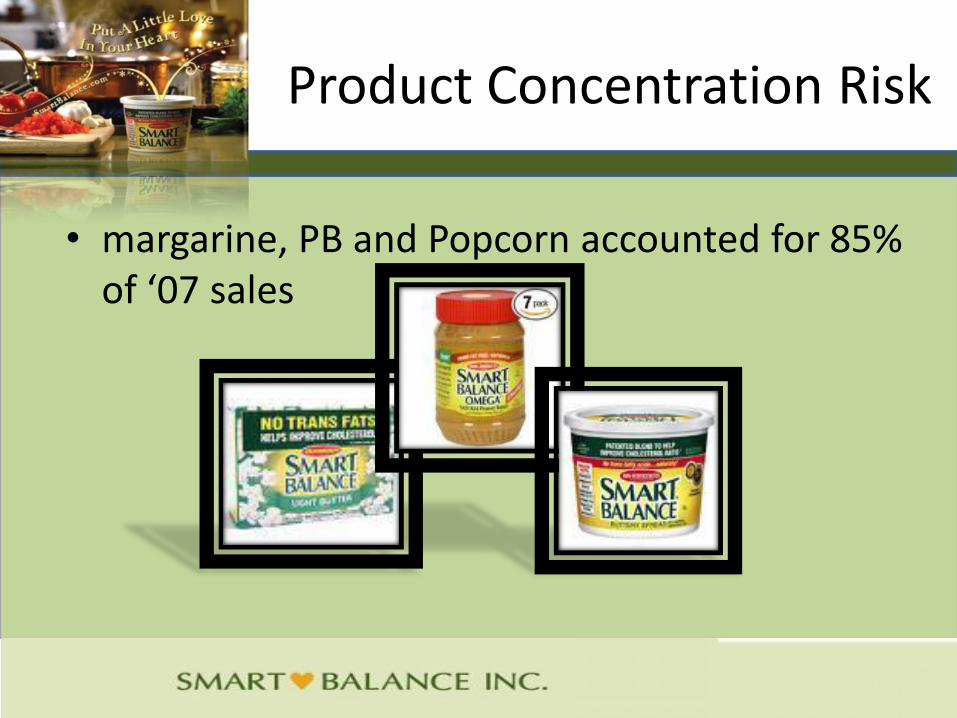
Product Concentration Risk
• margarine, PB and Popcorn accounted for 85% of ‘07 sales

Wal-Mart
• Customer concentration risk : Top three customers = 32% of sales
• Wal-mart = 13%
• However, wal-mart is the biggest player for most other products as well!
• Gives higher exposure to consumers

Commodities
$-
$0.50
$1.00
$1.50
$2.00
$2.50
Milk - Last 12 months (Per Pound)
Milk - Last 12 months
Commodity prices : Spike in milk price

Commodities
Soybean spot pricesSoybean oil prices

Formidable Competition
• Competition from well establishes brands (Unilever, ConAgra, JM Smucker, Act II, etc.)
– SB margarine sales grow in spite of dip in market

Peanut Butter Market Share
36.50%
23% 21.90%
5.50%3.70% 2.40%
33.40%
20.30%19.70%
5.10%
13.10%
1.50%
Jif Skippy Private Label Smuckers Peter Pan Smart Balance
2007 2006
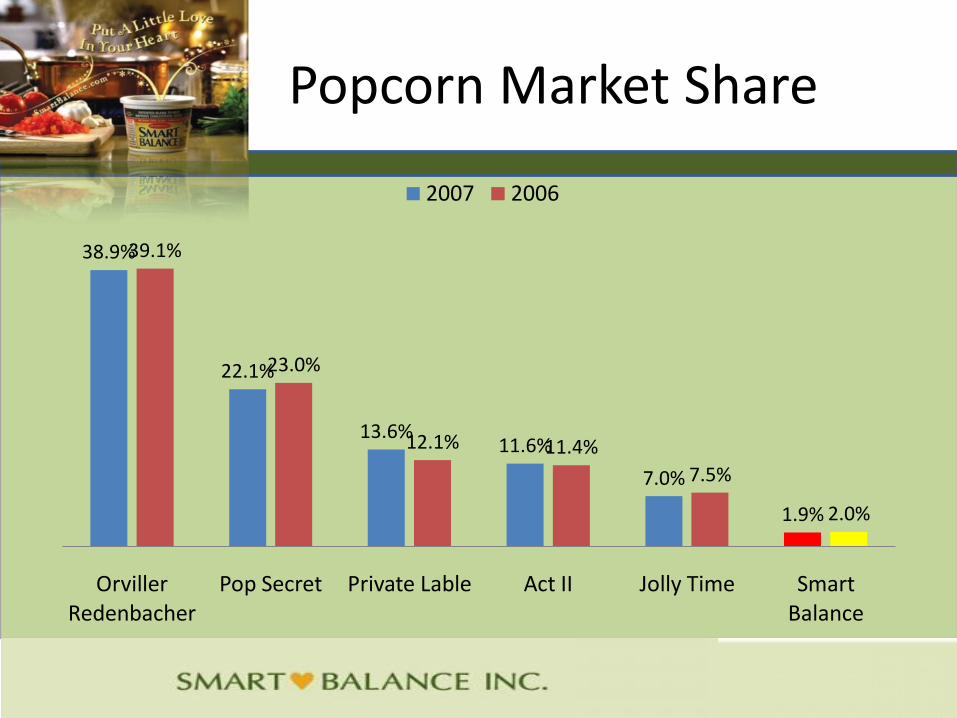
Popcorn Market Share
38.9%
22.1%
13.6%11.6%
7.0%
1.9%
39.1%
23.0%
12.1% 11.4%
7.5%
2.0%
Orviller Redenbacher
Pop Secret Private Lable Act II Jolly Time Smart Balance
2007 2006

Butter Spread Market Share
22.1%
19.5%
13.2%
7.5% 7.1%5.6% 4.8%
22%
19%
12%
8%7% 6%
5%
Shedd's Spread
I Can't Believe its Not Butter
Smart Balance
Private Lable
Blue Bonnet Parkay Land O'Lakes
2007 2006

I Like…

Marketing Strategy


Valuation
• Transaction Comps
• DCF
• No direct trading competitor

Transaction Comps
• Recent Acquisitions in the market have gone for 20x EBITDA
– 20x puts SMBL at about 600 million
• Recent Acquisitions in the market have gone for about 2x Revenue
– 2x puts SMBL at about 400 million