smart beta: 2018 global survey findings from asset owners · widely adopted smart beta equity...
TRANSCRIPT

Smart beta:2018 global survey findings from asset owners
ftserussell.com


3Smart beta: 2018 global survey findings from asset owners
Contents
5 Introduction
6 Summary of key themes
8 Survey background
11 Section 1: Smart beta evaluation and adoption
18 Section 2: Why smart beta?
24 Section 3: Equity smart beta strategies
32 Section 4: Fixed income smart beta strategies
35 Section 5: Application of ESG considerations and smart beta
41 Section 6: Outlook
44 Conclusion
45 Appendix

4 Smart beta: 2018 global survey findings from asset owners
5Smart beta: 2018 global survey findings from asset owners
Over the past five years, our survey has documented global institutional asset owners’ growing interest in smart beta index-based strategies and allocations to investable products based on smart beta indexes. In the 2018 survey, 77% of survey respondents have implemented, are currently evaluating, or plan to evaluate smart beta strategies. Just 9% of survey respondents reported no existing allocation and no plans to evaluate it in the near future. In the past, asset owners with more than $10B AUM had the largest adoption rate by far. Today, adoption rates are more evenly distributed between small (39%), medium (43%) and large (56%) asset owners. Clearly, smart beta has become an important part of an industry-wide conversation.
The 2017 survey documented a strong trend in multi-factor strategy adoption. That headline continued in 2018, where multi-factor combinations accounted for the largest number of adoptions (49%), well past the second and third place single factor indexes of Low Volatility (35%) and Value (28%). Furthermore, 87% of those who have implemented a smart beta strategy for the first time within the last two years are using a multi-factor combination. This dramatically illustrates a growing awareness of the
diversification, downside protection, and return potential of combining factors, something we have witnessed during our many discussions with asset owners. By contrast, fundamentally-weighted strategies have steadily fallen in use from 41% in 2014 to 19% in 2018.
As in past surveys, risk reduction, return enhancement and improved diversification remain the top three motives for allocations to smart beta. Cost saving has remained steady in fourth place (31%), as budgetary considerations continue to play a significant role in investment planning. As a bonus this year, we also asked respondents for their opinion of factor timing: 28% believe it is possible for timing strategies to be successful.
In 2017, we initiated questions on smart beta in fixed income. Similar to last year, few asset owners have a smart beta fixed income allocation (9%) in 2018. This highlights the need for additional education and greater product choice.
Regarding ESG, a substantial number (42%) of all respondents who anticipate applying ESG considerations to a smart beta strategy are doing so because they see a compatibility of the smart beta approach with ESG. This is a theme that FTSE Russell has been emphasizing within its indexes with its tilt-tilt
methodology. The greatest interest in ESG continues to be from European asset owners.
A happy customer is a repeat customer. When asked how satisfied asset owners are with their smart beta strategies, 62% said they were satisfied or very satisfied. Only 3% reported being dissatisfied, in spite of a challenging year for some strategies. So perhaps it is no surprise that 60% of those with an existing smart beta allocation are contemplating further allocations. The high satisfaction levels of current users suggest growth will continue.
Finally, the largest barrier to smart beta allocation and implementation is “How to determine the best strategy or combination of strategies for my portfolio” (45%). This underscores the continuing need for research, education and product innovation to meet the needs of asset owners. We hope the results of this survey provide a degree of insight for all market participants with an interest in smart beta.
Introduction
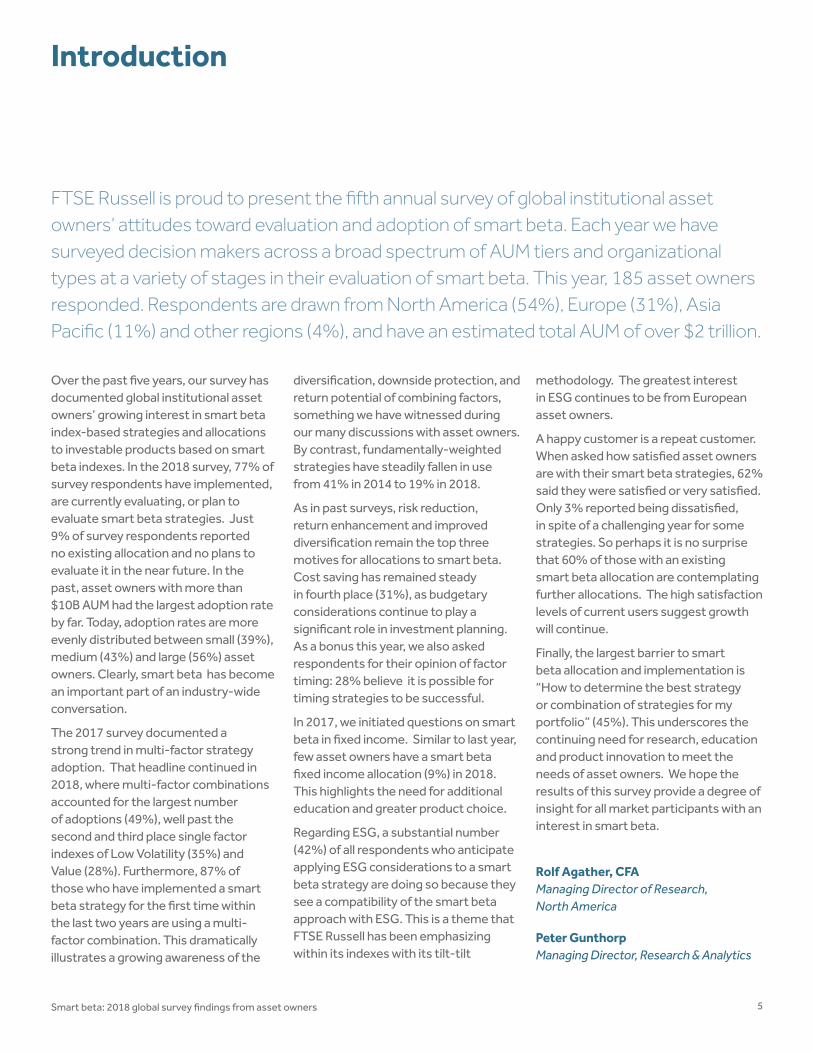
FTSE Russell is proud to present the fifth annual survey of global institutional asset owners’ attitudes toward evaluation and adoption of smart beta. Each year we have surveyed decision makers across a broad spectrum of AUM tiers and organizational types at a variety of stages in their evaluation of smart beta. This year, 185 asset owners responded. Respondents are drawn from North America (54%), Europe (31%), Asia Pacific (11%) and other regions (4%), and have an estimated total AUM of over $2 trillion.
Rolf Agather, CFA Managing Director of Research, North America
Peter Gunthorp Managing Director, Research & Analytics

6 Smart beta: 2018 global survey findings from asset owners
Why smart beta Fifty-six percent of all survey respondents are currently evaluating a smart beta index-based strategy, either for an initial allocation or an additional one. Our survey results indicate return enhancement, risk reduction and improved diversification as the most commonly reported objectives for using smart beta. The majority of asset owners continue to report their implementation of smart beta strategies as either strategic in nature, or as a combination of both strategic and tactical. For strategic purposes, separate accounts tend to be the investment vehicle of choice, while ETFs are the most popular vehicle type for tactical use.
Primary objectives
RETURN ENHANCEMENT
RISK REDUCTION
IMPROVE DIVERSIFICATION
Summary of key themes
Smart beta adoption rates globally have reached a record high of 48% in 2018. From a regional perspective, European asset owners maintain the highest rate of smart beta adoption, with 61% of survey respondents in Europe reporting an existing allocation to smart beta. North American asset owners displayed the largest increase in smart beta adoption since our last survey, with 42% reporting an existing allocation in 2018 – up from 37% in 2017.
Smart beta evaluation and adoption
Multi-factor index-based strategies are reported as the most commonly evaluated and the most widely adopted smart beta equity strategies, especially among more recent adopters of smart beta. Allocating to a single multi-factor product is far more common than allocating to multiple individual factor products. Among single factor strategies, value and low volatility persist as the most widely used and evaluated.
Equity smart beta strategies
48% 2018
46% 2017
36% 2016
26% 2015
Global adoption Multi-factor adoption
Smart beta allocation less than 2 years
Smart beta allocation 2 years or more
39%
87%

7Smart beta: 2018 global survey findings from asset owners
Fixed income smart beta strategy adoption rates are up slightly from last year (now 9%) but remain low relative to equity strategies. Twenty-four percent of survey respondents indicate they are currently evaluating or plan to evaluate a fixed income smart beta strategy. However, a lack of documented investment merit, lack of resources to make the evaluation, and limited product choice remain as significant hurdles to both evaluation and adoption.
Fixed income smart beta strategies
Evaluation and application of environmental, social and governance considerations is gaining in popularity, with over half of asset owners implementing or evaluating ESG consideration in their investment strategy. Globally, among those who either have an existing smart beta allocation or plan to evaluate and/or implement one in the near future, 38% anticipate applying ESG considerations to a smart beta strategy.
ESG considerations and smart beta
Outlook We expect sustained growth in smart beta, especially when it comes to multi-factor combination strategies. Satisfaction rates among those already using smart beta remain high, as do reported plans to increase existing allocations. Furthermore, most of those who have not yet adopted smart beta are still evaluating their options thanks to new innovations in smart beta and increased product availability.
Fixed income allocation ESG considerations
Implementing or evaluating ESG in portfolio
53%
Allocated or evaluating
Not allocated or
evaluating33%67%

8 Smart beta: 2018 global survey findings from asset owners
This is the fifth year FTSE Russell has conducted this study, the purpose of which is to measure smart beta market trends and offer insight into how and why asset owners are evaluating and implementing smart beta strategies within their portfolios.
The 2018 survey was conducted in January and February. This year, 185 asset owners participated in the survey. The majority of respondents were located in North America (54%) and Europe (31%). Participation from the Asia Pacific region declined from 19% in 2017 to 11% this year. Given the smaller sample size, our 2018 analysis of regional trends does not include a breakout for Asia Pacific as it has in prior years. Survey responses from asset owners outside of the North America and Europe regions are included in the “total” category in cases where responses are analyzed from a regional perspective.
Organization types represented include government organizations (36%), corporations or private businesses (20%), non-profit organizations or universities (15%), and unions or industry-wide pension schemes (10%). Insurance companies, sovereign wealth funds, healthcare organizations and family offices are represented as well.
Sixty- seven percent of the asset owners who responded manage defined benefit plan assets, 36% manage defined contribution plan assets and 15% manage endowment or foundation assets. Participants also include asset owners with insurance general accounts, sovereign wealth funds and other types of institutional asset owners.
In order to analyze trends by asset owner size, respondents were segmented into tiers by total AUM as follows: those with under $1B in total AUM (20%); those between $1B and $10B in total AUM (39%); and those with over $10B in total AUM (41%). Aggregate AUM of the survey participants is estimated to be over $3.5 trillion.
The distribution of our asset owner sample has shifted from year-to-year across regions and AUM tiers. This can contribute to year-over-year changes in the results.
For the purposes of this survey, “smart beta” is defined as an investment strategy which applies an index-based investment strategy that is not traditionally market cap–weighted (i.e. fundamentally weighted, equal weighted, factor weighted, optimized, etc.). For a sample size of 185, the margin of
error is +/- 10% at a 95% confidence
margin. Throughout the report,
percentages may not total 100 due
to rounding and/or because some
questions allowed for multiple
responses (allowance for multiple
responses is noted as “multi pick” in
each exhibit footer).
Survey background

9Smart beta: 2018 global survey findings from asset owners
AUM tier distribution
48%45%
7%
2014
61%26%
8%5%
2015
31%
54%
11%4%
2018
49%
33%
13%4%
2016
43%
33%
19%
5%
2017
24%
40%
35%
2014
29%
33%
38%
2015
41%
41%
20%
39%
2018
20%
46%
34%
2016
19%
34%
47%
2017
Sample distribution by year for 2014 – 2018
Exhibit 1
Region distribution
●North America●Europe●Asia Pacific●Other
●Under $1B●$1B to $10B●$10B or more
Asia Pacific was not included in 2014

10 Smart beta: 2018 global survey findings from asset owners
11Smart beta: 2018 global survey findings from asset owners
1
Smart beta evaluation and adoption
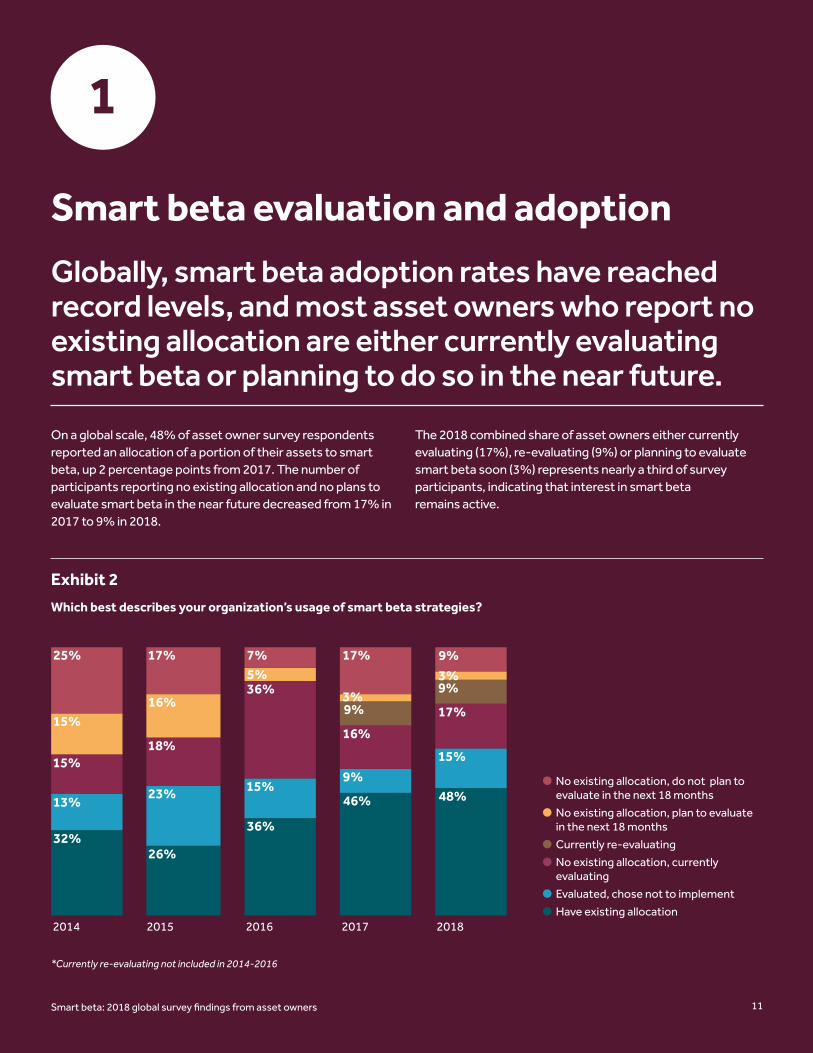
Globally, smart beta adoption rates have reached record levels, and most asset owners who report no existing allocation are either currently evaluating smart beta or planning to do so in the near future.
On a global scale, 48% of asset owner survey respondents reported an allocation of a portion of their assets to smart beta, up 2 percentage points from 2017. The number of participants reporting no existing allocation and no plans to evaluate smart beta in the near future decreased from 17% in 2017 to 9% in 2018.
The 2018 combined share of asset owners either currently evaluating (17%), re-evaluating (9%) or planning to evaluate smart beta soon (3%) represents nearly a third of survey participants, indicating that interest in smart beta remains active.
Exhibit 2
Which best describes your organization’s usage of smart beta strategies?
*Currently re-evaluating not included in 2014-2016
32%26%
36%
46% 48%13%23% 15%
9%15%15%
18%
36%
16%
17%9%
9%
15%16%
5%
3%
3%25% 17% 7% 17% 9%
2014 2015 2016 2017 2018
● No existing allocation, do NOT plan to evaluate in the next 18 months
● No existing allocation, plan to evaluate in the next 18 months
● Currently re-evaluating
● No existing allocation, currently evaluating
● Evaluated, chose not to implement
● Have existing allocation
●No existing allocation, do not plan to evaluate in the next 18 months
●No existing allocation, plan to evaluate in the next 18 months
●Currently re-evaluating
●No existing allocation, currently evaluating
●Evaluated, chose not to implement
●Have existing allocation
12 Smart beta: 2018 global survey findings from asset owners
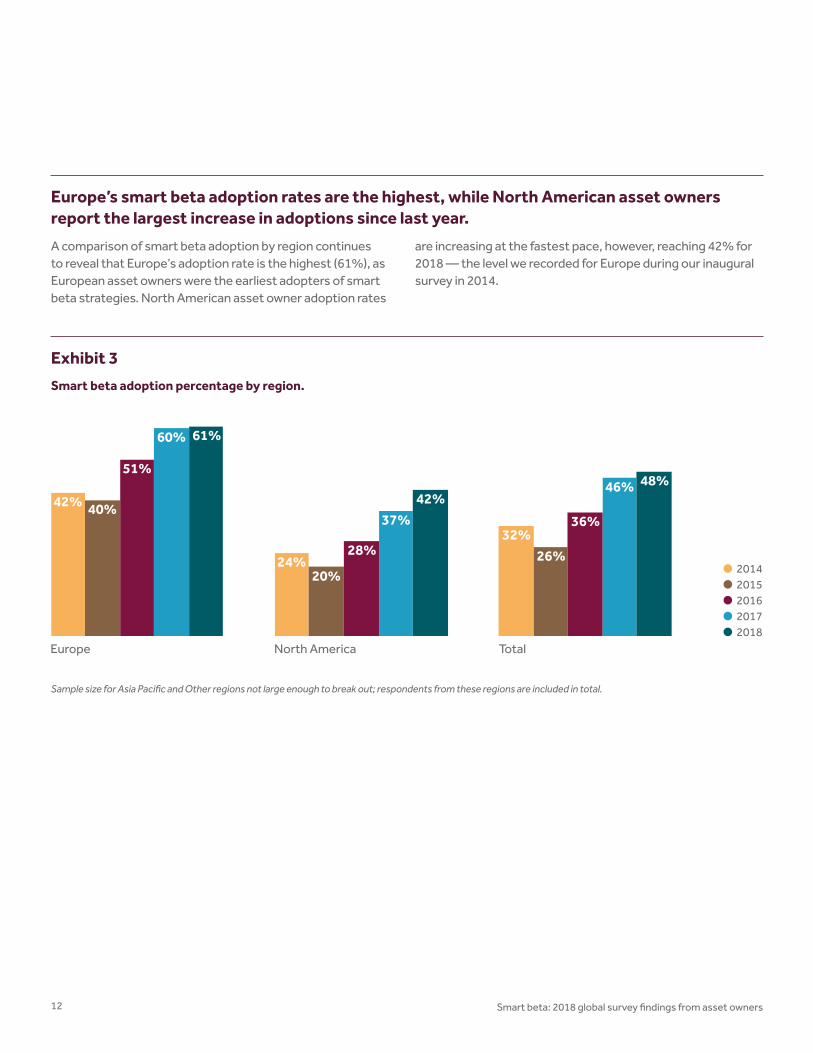
Europe’s smart beta adoption rates are the highest, while North American asset owners report the largest increase in adoptions since last year.
A comparison of smart beta adoption by region continues to reveal that Europe’s adoption rate is the highest (61%), as European asset owners were the earliest adopters of smart beta strategies. North American asset owner adoption rates
are increasing at the fastest pace, however, reaching 42% for 2018 — the level we recorded for Europe during our inaugural survey in 2014.
Exhibit 3
Smart beta adoption percentage by region.
Sample size for Asia Pacific and Other regions not large enough to break out; respondents from these regions are included in total.
42%
24%
40%
20%26%
32%
51%
28%
36%
60%
37%
46%
61%
42%48%
Europe North America Total
●2014●2015●2016●2017●2018

13Smart beta: 2018 global survey findings from asset owners
Five years ago, asset owners with $10B or more AUM had the largest rate of smart beta adoption. Today, the adoption rates are more evenly distributed between small (39%), medium
(43%) and large (56%) asset owners. Survey respondents vary by region and AUM tier each year, but the overall trend shows growth across all three tiers since 2014.
Exhibit 4
Smart beta adoption percentage by asset size.
Asset owners report growth in smart beta adoption rates.
9%
30%
46%
15%21%
42%
26%
32%
46%
19%
57%
50%
39%43%
56%
Under $1B $1B to $10B $10B or more
●2014●2015●2016●2017●2018
14 Smart beta: 2018 global survey findings from asset owners
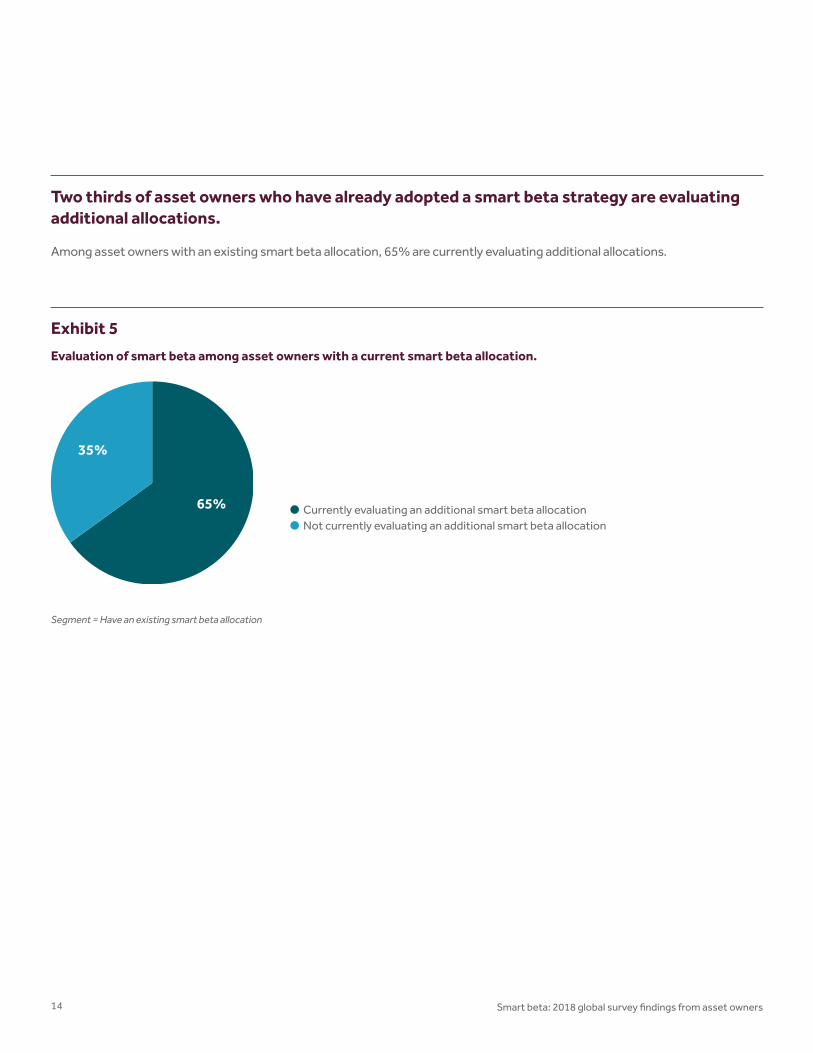
Among asset owners with an existing smart beta allocation, 65% are currently evaluating additional allocations.
Exhibit 5
Evaluation of smart beta among asset owners with a current smart beta allocation.
Segment = Have an existing smart beta allocation
Two thirds of asset owners who have already adopted a smart beta strategy are evaluating additional allocations.
65%
35%
●Currently evaluating an additional smart beta allocation●Not currently evaluating an additional smart beta allocation
15Smart beta: 2018 global survey findings from asset owners
Segment = Evaluated and chose not to implement
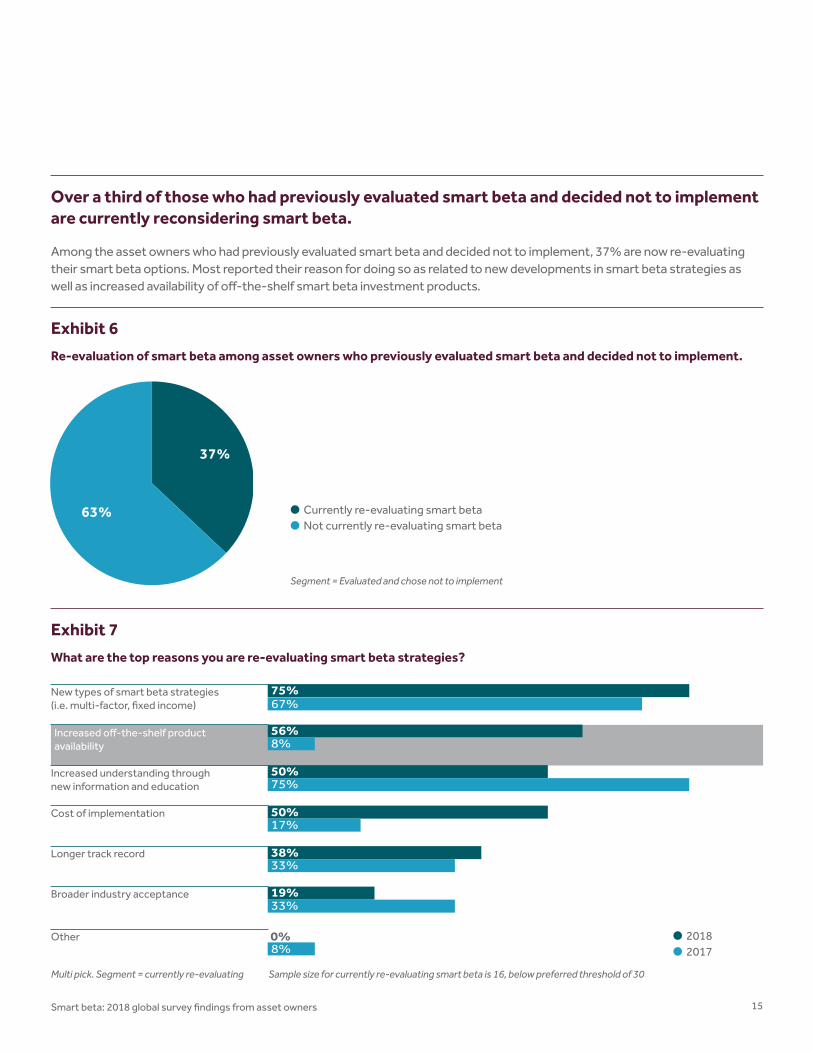
Over a third of those who had previously evaluated smart beta and decided not to implement are currently reconsidering smart beta.
Among the asset owners who had previously evaluated smart beta and decided not to implement, 37% are now re-evaluating their smart beta options. Most reported their reason for doing so as related to new developments in smart beta strategies as well as increased availability of off-the-shelf smart beta investment products.
Exhibit 6
Re-evaluation of smart beta among asset owners who previously evaluated smart beta and decided not to implement.
Exhibit 7
What are the top reasons you are re-evaluating smart beta strategies?
Multi pick. Segment = currently re-evaluating Sample size for currently re-evaluating smart beta is 16, below preferred threshold of 30
37%
63%
75%67%
New types of smart beta strategies (i.e. multi-factor, fixed income)
Increased off-the-shelf product availability
Increased understanding through new information and education
17%
8%56%
50%75%
50%
38%33%
19%33%
8%0%
Cost of implementation
Longer track record
Other
Broader industry acceptance
●2018●2017
●Currently re-evaluating smart beta●Not currently re-evaluating smart beta

16 Smart beta: 2018 global survey findings from asset owners
Globally, among asset owners who have adopted or are evaluating smart beta strategies, roughly one-third view them as traditional active strategies, one-third as traditional passive strategies, and one-third as distinct strategies.
Views vary slightly when broken down by region. The majority of European respondents either view smart beta’s role in their investment process as its own distinct type of strategy (36%) or more like a traditional passive strategy (34%). Their North
American counterparts, however, are more likely to view smart beta’s role as akin to a traditional active (38%) or traditional passive (30%) strategy than classify it a distinct type of strategy.
Exhibit 8
Which best describes how you are evaluating or positioning smart beta’s role in your investments?
25%
38% 36%
34%
30% 30%
36% 25% 27%
6% 8% 7%
Europe North America Total
●Don’t know
●Neither, it is evaluated as a distinct type of strategy
●More like traditional passive strategies
●More like traditional active strategies

17Smart beta: 2018 global survey findings from asset owners
Exhibit 9
Which best describes how you are evaluating or positioning smart beta’s role in your investments?
Segmenting the survey respondents by size indicates that the smallest asset owners (those with under $1B AUM) are the most likely to align smart beta with either traditional active or passive strategies rather than evaluating them as a distinct type of strategy. The largest asset owners (those with
$10B or more AUM) are more inclined than smaller plans to evaluate smart beta as a distinct type of strategy, but most respondents in this group (38%) view smart beta as more like a traditional active strategy.
42%
27%
38% 36%
36%
41%
19%
30%
13%27% 36% 27%
10% 6% 8% 7%
Under $1B $1B to $10B $10B or more Total
●Don’t know
●Neither, it is evaluated as a distinct type of strategy
●More like traditional passive strategies
●More like traditional active strategies

18 Smart beta: 2018 global survey findings from asset owners
Exhibit 9 What percentage of your equity portfolio is invested in smart beta, by region?
2
Why smart beta?
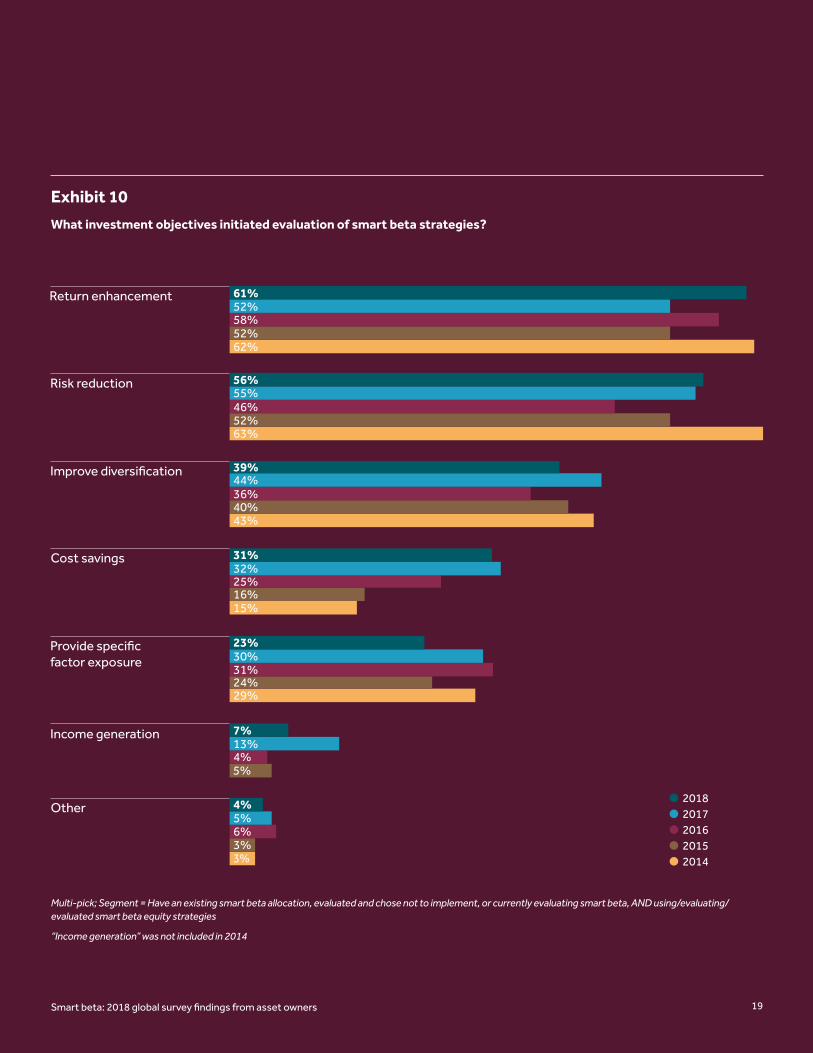
Return enhancement and risk reduction continue as the primary smart beta investment objectives.
For the last five years, return enhancement and risk reduction have prevailed as the top two investment objectives motivating asset owners to evaluate smart beta strategies. Improved diversification and cost savings continue to be commonly cited objectives as well. Targeting specific factor
exposure(s) has experienced a decline over the last three years, and while income generation saw a spike in 2017, only 7% of respondents chose it as a reason for evaluating smart beta in 2018.
19Smart beta: 2018 global survey findings from asset owners
Exhibit 10
What investment objectives initiated evaluation of smart beta strategies?
Multi-pick; Segment = Have an existing smart beta allocation, evaluated and chose not to implement, or currently evaluating smart beta, AND using/evaluating/evaluated smart beta equity strategies
“Income generation” was not included in 2014
3%
29%
15%
43%
63%
62%
3%
5%
24%
16%
40%
52%
52%
6%
4%
31%
25%
36%
46%
58%
5%
13%
30%
32%
44%
55%
52%
4%
7%
23%
31%
39%
56%
61%
Other
Income generation
Provide specific factor exposure
Cost savings
Improve diversification
Risk reduction
Return enhancement
●2018●2017●2016●2015●2014

20 Smart beta: 2018 global survey findings from asset owners
The majority of asset owners report strategic-only or a combination of both strategic and tactical use of smart beta strategies.
Fifty-eight percent of asset owners are allocating (or evaluating) smart beta for strategic (long term) implementation, while 33% cite a combination of strategic and tactical (short-term) implementation. Using smart beta
solely for making tactical adjustments to a portfolio is the least common use reported, but this response has grown slightly in popularity (up from 3% to 7%).
Exhibit 11
For which of the following are you using or evaluating use of smart beta strategies?
Segment = Have an existing smart beta allocation, OR no existing allocation but currently evaluating/re-evaluating smart beta
58%
39%
3% 1%
70%
27%
3%0%
58%
33%
7% 2%
Strategic implementation = long term allocation
Both strategic and tactical implementation
Tactical implementation = short-term adjustment to a portfolio
Other
●2016●2017●2018

21Smart beta: 2018 global survey findings from asset owners
Separate accounts are the preferred vehicle for strategic implementation of smart beta, while ETFs are the most popular choice for tactical implementation. Internal management is the second most preferred vehicle type for
both strategic and tactical implementation. Compared to 2017 (not shown), separate accounts have declined significantly in popularity for tactical implementation (down from 41% in 2017 to 27% in 2018).
Exhibit 12
For strategic/tactical uses of smart beta strategies, which vehicle type do you prefer?
Multi-pick. Segment = Have an existing smart beta allocation, or no existing allocation but currently evaluating/re-evaluating smart beta, AND have or intend to have a strategic/tactical implementation
46%
33%26% 25% 25%
7%
27%33%
51%
16%9%
13%
Separate account
Manage internally
ETF Mutual fund Collective investment trust
Derivatives
●Strategic●Tactical

22 Smart beta: 2018 global survey findings from asset owners
Exhibit 13
What barriers to equity smart beta allocation and/or implementation do you perceive?
Asset owners view lack of awareness and uncertainty as key barriers to smart beta adoption, indicating a need for continued education from smart beta product providers.
Almost half of respondents cite not knowing how to determine the best smart beta strategy (or which combination of strategies) for their portfolio as a barrier to adoption. Many are also concerned with unintended factor biases and/or capacity issues.
Multi-pick
45%
36%33%
22%
18%
11% 11%13%
5%
How to determine the best strategy or combination of strategies for my portfolio
Unintended factor biases
Capacity - i.e., concern that growth in smart beta investing may erode these strategies' future returns
Unintended sector biases
High turnover Security concentration risk
Concern about taking on additional risk
Other Don't know
Multi-pick

Smart beta: 2018 global survey findings from asset ownersSmart beta: 2018 global survey findings from asset owners 23
24 Smart beta: 2018 global survey findings from asset owners
3
Equity smart beta strategies
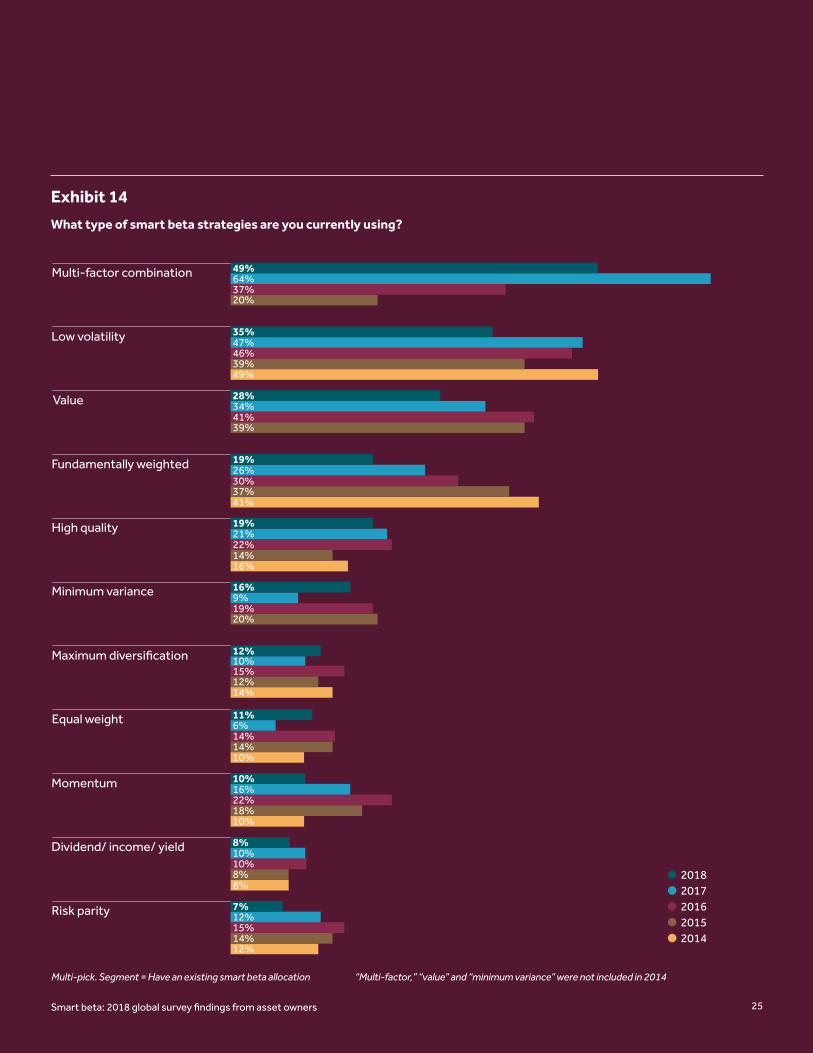
Multi-factor combination strategies remain the most widely used form of smart beta. Among those implementing single-factor strategies, low volatility and value are the most popular.
Multi-factor combination strategies remain the most widely used, but the percentage of survey respondents who reported using a multi-factor combination strategy dipped from 64% in 2017 to 49% in 2018. Low volatility remains the top single factor strategy, followed by value, though levels have declined somewhat for these as well.
Fundamentally weighted strategies continue to have negative growth rates year over year, likely because most recent adopters of smart beta have chosen to implement multi-factor combination strategies rather than single factor strategies (see Exhibit 16).
25Smart beta: 2018 global survey findings from asset owners
Exhibit 14
What type of smart beta strategies are you currently using?
Multi-pick. Segment = Have an existing smart beta allocation “Multi-factor,” “value” and “minimum variance” were not included in 2014
12%
10%
10%
14%
16%
41%
49%
14%
8%8%
18%
14%
12%
20%
14%
37%
39%
39%
20%
15%
10%
22%
14%
15%
19%
22%
30%
41%
46%
37%
12%
10%
16%
6%
10%
9%
21%
26%
34%
47%
64%
7%
8%
10%
11%
12%
16%
19%
19%
28%
35%
49%
Risk parity
Dividend/ income/ yield
Momentum
Equal weight
Maximum diversification
Minimum variance
High quality
Fundamentally weighted
Value
Low volatility
Multi-factor combination
●2018●2017●2016●2015●2014
26 Smart beta: 2018 global survey findings from asset owners
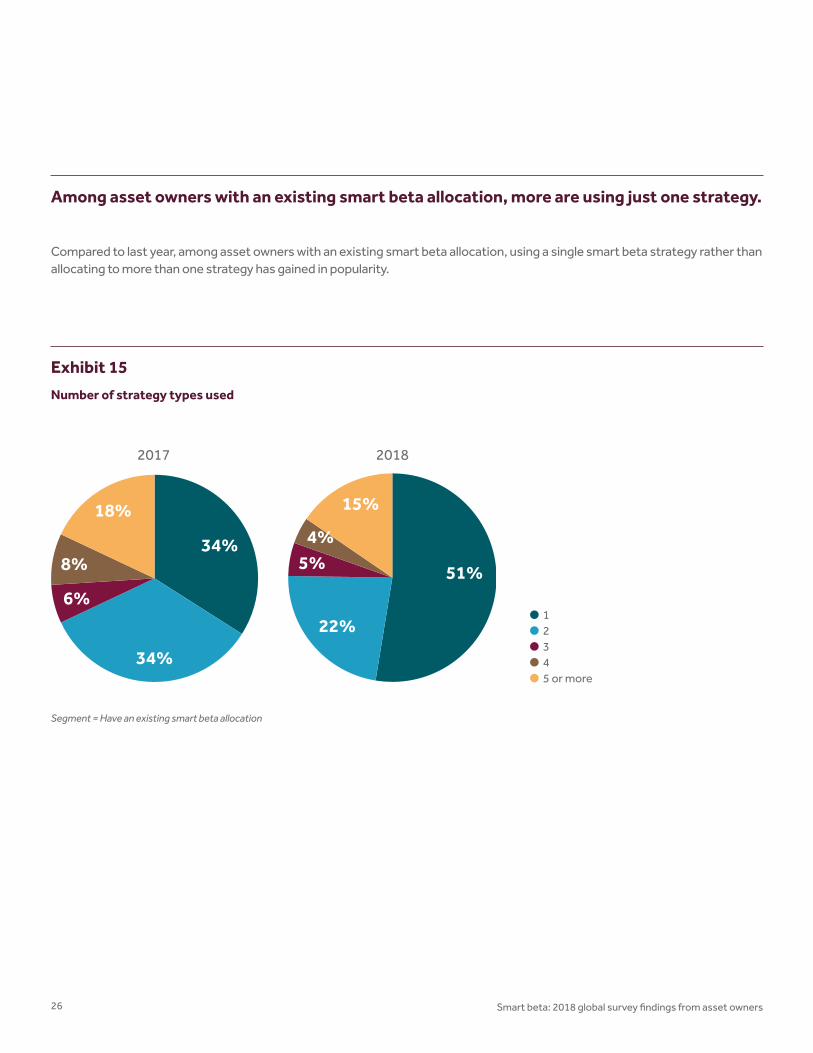
Exhibit 15
Number of strategy types used
Among asset owners with an existing smart beta allocation, more are using just one strategy.
Compared to last year, among asset owners with an existing smart beta allocation, using a single smart beta strategy rather than allocating to more than one strategy has gained in popularity.
Segment = Have an existing smart beta allocation
34%
34%
6%
8%
18%
2017
51%
22%
5%4%
15%
2018
●1●2●3●4●5 or more

27Smart beta: 2018 global survey findings from asset owners
Most recent adopters are using multi-factor combination strategies, while low volatility remains a popular choice among those with longer term smart beta allocations.
Eighty-seven percent of those who have had a smart beta allocation for less than two years reported using a multi-factor combination approach, with low volatility as the second most popular response (20%) among those with newer allocations.
Responses from asset owners who have had a smart beta allocation for more than two years vary — low volatility, multi-factor combinations and value as well as “other strategies” were each listed by at least a third of respondents.
Exhibit 16
What type of smart beta strategies are you currently using?
Multi-pick. Segment = Have an existing smart beta allocation
Other strategies include momentum, risk parity, dividend/income/yield, maximum diversification, minimum variance and equal weight
*Sample size for asset owners with smart beta allocation for less than two years is 15, below the preferred threshold of 30
87%
20%
13%
13%
7%
13%
39%
41%
33%
20%
20%
50%
Multi-factor combination
Low volatility
Fundamentally weighted
High quality
Other strategies
Value
●Have smart beta allocation for less than 2 years
●Have smart beta allocation for 2 years or more
28 Smart beta: 2018 global survey findings from asset owners
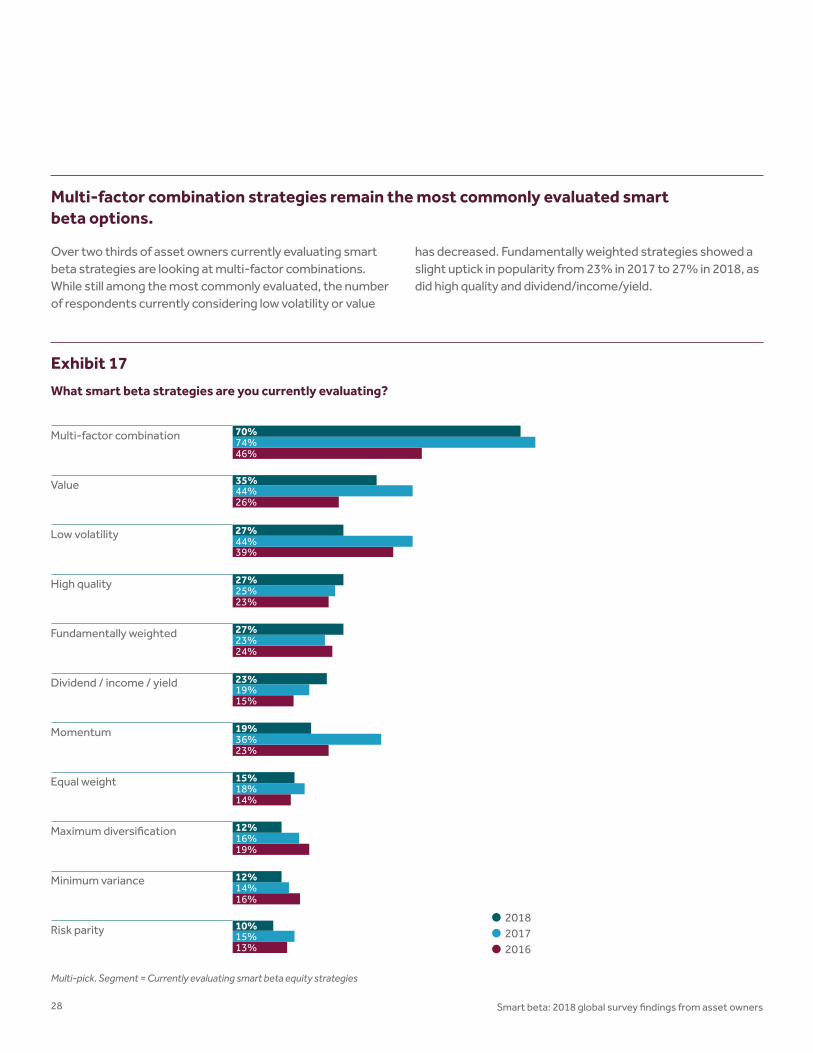
Exhibit 17
What smart beta strategies are you currently evaluating?
Multi-pick. Segment = Currently evaluating smart beta equity strategies
Multi-factor combination strategies remain the most commonly evaluated smart beta options.
Over two thirds of asset owners currently evaluating smart beta strategies are looking at multi-factor combinations. While still among the most commonly evaluated, the number of respondents currently considering low volatility or value
has decreased. Fundamentally weighted strategies showed a slight uptick in popularity from 23% in 2017 to 27% in 2018, as did high quality and dividend/income/yield.
23%25%27%High quality
39%44%27%Low volatility
13%
16%
19%
14%
23%
15%
24%
26%
46%
15%
14%
16%
18%
36%
19%
23%
44%
74%
10%
12%
12%
15%
19%
23%
27%
35%
70%
Risk parity
Minimum variance
Maximum diversification
Equal weight
Momentum
Dividend / income / yield
Fundamentally weighted
Value
Multi-factor combination
●2018●2017●2016
29Smart beta: 2018 global survey findings from asset owners
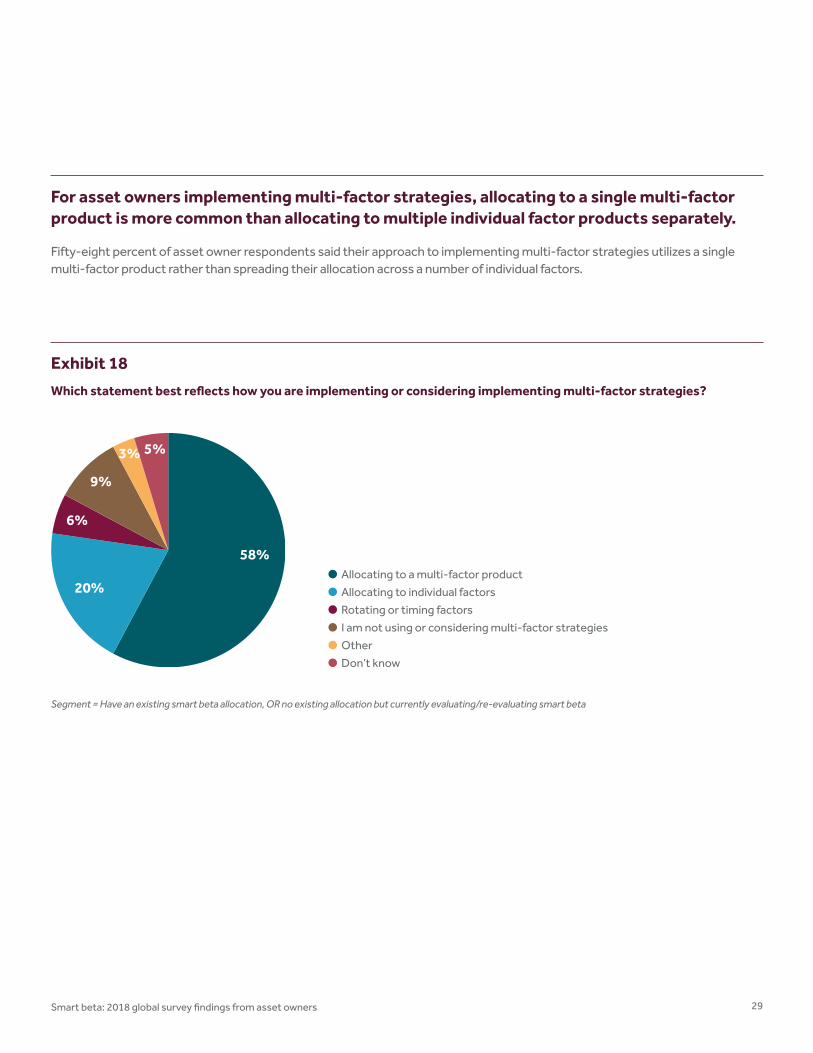
For asset owners implementing multi-factor strategies, allocating to a single multi-factor product is more common than allocating to multiple individual factor products separately.
Fifty-eight percent of asset owner respondents said their approach to implementing multi-factor strategies utilizes a single multi-factor product rather than spreading their allocation across a number of individual factors.
Exhibit 18
Which statement best reflects how you are implementing or considering implementing multi-factor strategies?
Segment = Have an existing smart beta allocation, OR no existing allocation but currently evaluating/re-evaluating smart beta
58%
20%
6%
9%
3% 5%
●Allocating to a multi-factor product
●Allocating to individual factors
●Rotating or timing factors
●I am not using or considering multi-factor strategies
●Other
●Don’t know

30 Smart beta: 2018 global survey findings from asset owners30
The majority of survey respondents do not think it is possible to successfully time factors.
Sixty-one percent of asset owners do not believe factor timing strategies are likely to be successful, while 28% believe it is possible to successfully time factors.
Exhibit 19
Do you think it is possible to successfully time factors?
28%
61%
3%8%
2018
●Don’t know
●Other
●No, I do not believe factor timing strategies are likely to be successful
●Yes, I believe it is possible for factor timing strategies to be successful
Segment = Have an existing smart beta allocation, OR no existing allocation but currently evaluating/re-evaluating smart beta, OR evaluated and chose not to implement

Smart beta: 2018 global survey findings from asset ownersSmart beta: 2018 global survey findings from asset owners 31

32 Smart beta: 2018 global survey findings from asset owners
4
Fixed income smart beta strategies
Fixed income smart beta evaluation and adoption rates are up slightly from last year, but the need for more products and improved awareness persists.
Adoption of fixed income smart beta strategies has occurred among 9% of asset owners surveyed in 2018, up from 7% last year. In addition, 24% are currently evaluating or planning to evaluate fixed income smart beta strategies in the next 18 months, up from 20% last year.
About a quarter of asset owners who were asked why they had not yet evaluated fixed income smart beta strategies said that they did not believe there was merit in the approach,
while 17% indicated lack of resources to make the evaluation as a primary reason. The lack of product choice was another fairly common response (14%), as was not knowing why fixed income smart beta strategies had not yet been evaluated (15%). This year’s responses echo 2017’s notion that there is a lack of education, awareness and corresponding product offering within the fixed income community.
Exhibit 20
What best describes your organization’s usage of fixed income smart beta strategies?
7% 9%11% 12%8% 6%9% 12%
66% 61%
2017 2018
●Have not evaluated fixed income smart beta strategies and have no plans to do so in the next 18 months
●Plan to evaluate fixed income smart beta strategies in the next 18 months, have not previously evaluated
●Previously evaluated fixed income smart beta strategies, not currently evaluating and do not have existing allocation
●Currently evaluating fixed income smart beta strategies, do not have existing allocation
●Have fixed income smart beta allocation

33Smart beta: 2018 global survey findings from asset owners
What are the primary reasons you have not yet evaluated fixed income smart beta strategies?
2017 2018
Do not believe they have investment merit 13% 24%
Lack of investment resources to make the evaluation 23% 17%
Lack of product choice – 14%
Consultant has not recommended this option 15% 13%
Do not believe in passive allocations 17% 9%
AUM is too small for this type of strategy 8% 7%
Other 14% 24%
Don’t know 21% 15%
Exhibit 21
What are the primary reasons you have not yet evaluated fixed income smart beta strategies?
Multi-pick. Segment = Do not have a fixed income smart beta allocation AND have not previously evaluated fixed income smart beta strategies AND are not currently evaluating fixed income smart beta strategies
“Lack of product choice” was not included in 2017

34 Smart beta: 2018 global survey findings from asset owners
35Smart beta: 2018 global survey findings from asset owners
5
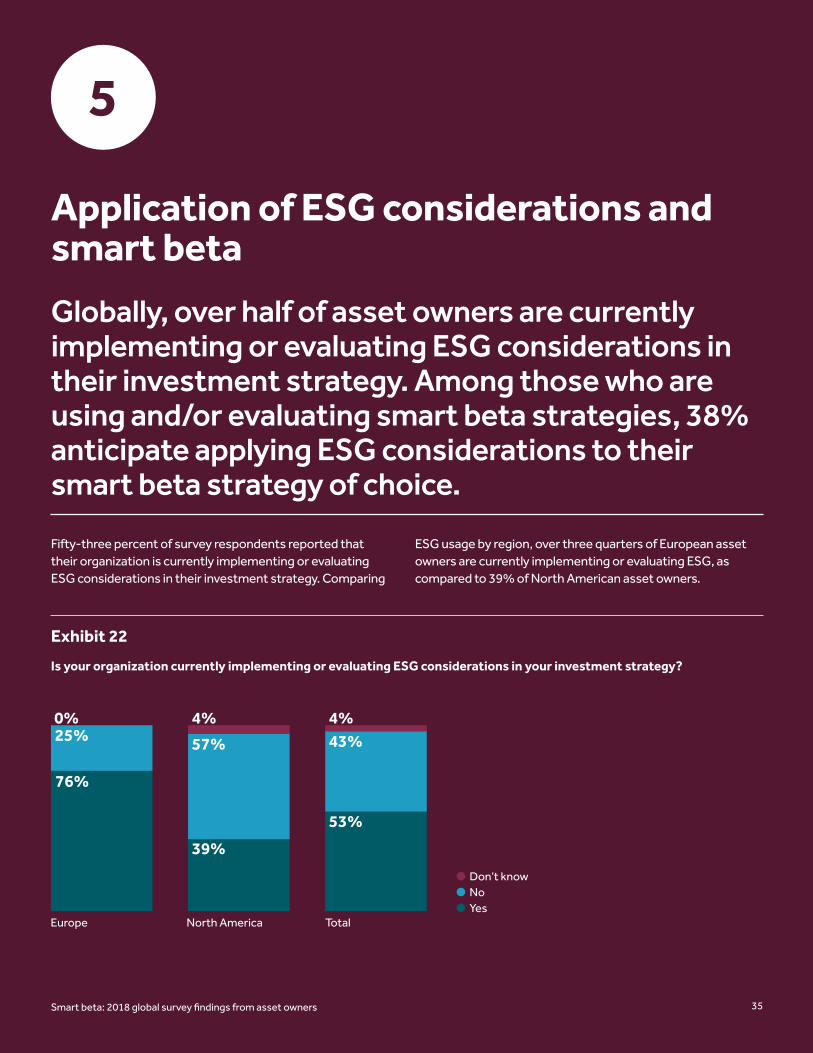
Fifty-three percent of survey respondents reported that their organization is currently implementing or evaluating ESG considerations in their investment strategy. Comparing
ESG usage by region, over three quarters of European asset owners are currently implementing or evaluating ESG, as compared to 39% of North American asset owners.
Exhibit 22
Is your organization currently implementing or evaluating ESG considerations in your investment strategy?
76%
25%
Europe North America Total
39%
57%
4%0%
53%
43%4%
●Don’t know ●No●Yes
Application of ESG considerations and smart beta
Globally, over half of asset owners are currently implementing or evaluating ESG considerations in their investment strategy. Among those who are using and/or evaluating smart beta strategies, 38% anticipate applying ESG considerations to their smart beta strategy of choice.

36 Smart beta: 2018 global survey findings from asset owners
Exhibit 23
Do you anticipate applying ESG considerations to a smart beta strategy?
Among those who either have an existing smart beta allocation or plan to evaluate and/or implement one in the near future, 38% anticipate applying ESG considerations to a smart beta strategy. More asset owners in Europe (55%) report plans to apply ESG considerations to a smart beta strategy than in North America (25%).
Segment = Have a smart beta allocation OR are currently evaluating/re-evaluating smart beta strategies OR are planning to evaluate smart beta strategies in the next 18 months
29%
55%
16%
54%
25%
21%
41%
38%
21%
Europe North America Total
●Don’t know ●No●Yes

37Smart beta: 2018 global survey findings from asset owners
Of those who anticipate applying ESG considerations to a smart beta strategy, 48% said that ESG considerations are applied broadly across their portfolio, meaning the application of ESG to a smart beta allocation would occur by default. A similar number of respondents (42%) said they have chosen to apply (or are considering applying) ESG considerations to a smart beta allocation not by default, but due to the compatibility of these approaches.
Exhibit 24
Which statement best describes the application or evaluation of ESG considerations to smart beta within your organization?
Segment = Anticipate applying ESG considerations to a smart beta strategy
48%42%
8%
2%
●ESG considerations are broadly applied in our portfolio and would be applied to smart beta allocations by default
●We have chosen to apply (or are considering applying) ESG considerations to smart beta due to the compatibility of these approaches
●Other
●Don’t know
38 Smart beta: 2018 global survey findings from asset owners38
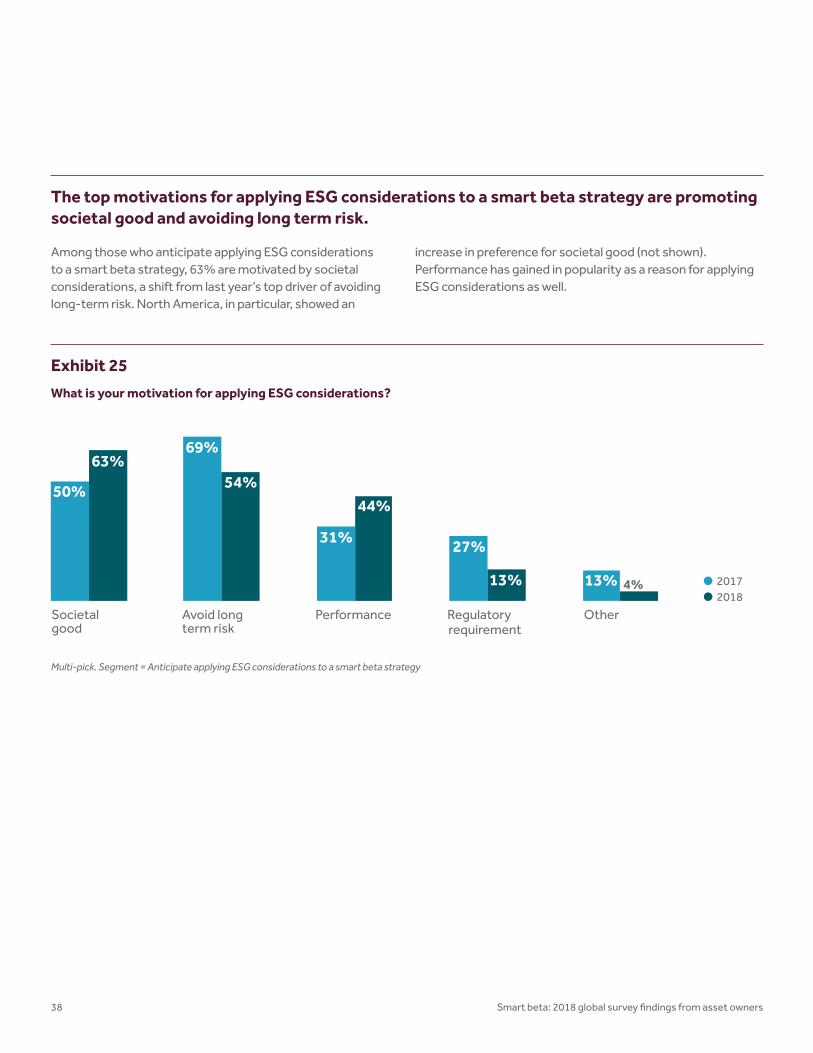
The top motivations for applying ESG considerations to a smart beta strategy are promoting societal good and avoiding long term risk.
Among those who anticipate applying ESG considerations to a smart beta strategy, 63% are motivated by societal considerations, a shift from last year’s top driver of avoiding long-term risk. North America, in particular, showed an
increase in preference for societal good (not shown). Performance has gained in popularity as a reason for applying ESG considerations as well.
Exhibit 25
What is your motivation for applying ESG considerations?
Multi-pick. Segment = Anticipate applying ESG considerations to a smart beta strategy
50%
69%
31% 27%
13%
63%54%
44%
13% 4%
Societal good
Avoid long term risk
Performance Regulatoryrequirement
Other
●2017●2018

Smart beta: 2018 global survey findings from asset ownersSmart beta: 2018 global survey findings from asset owners 39

40 Smart beta: 2018 global survey findings from asset owners

41Smart beta: 2018 global survey findings from asset owners
6
Growth is still occurring in the smart beta space, as approximately 48% of asset owner respondents globally have an existing smart beta allocation, up from a reported 46% in 2017. Sixty five percent of asset owners with an existing
smart beta allocation are currently evaluating an additional allocation, and roughly 60% of those currently evaluating plan to increase their allocation in the next 18 months.
Exhibit 26
What is your outlook for future usage of smart beta in your portfolio in the next 18 months?
Segment = Have an existing smart beta allocation, currently evaluating additional allocation
Outlook
While growth of adoption rates on a global scale may have slowed, it has not stopped. Satisfaction with existing allocations remains high, as do reported plans to increase existing allocations. Evaluation rates in general are higher than ever, and over half of those not currently using smart beta plan to do so in the next 18 months.
76%
19%2% 2%
69%
25%
0% 6%
60%
32%
2% 6%Increase % allocation
Maintain current allocation
Decrease %allocation
Don't know
Section 6
●2016●2017●2018
42 Smart beta: 2018 global survey findings from asset owners
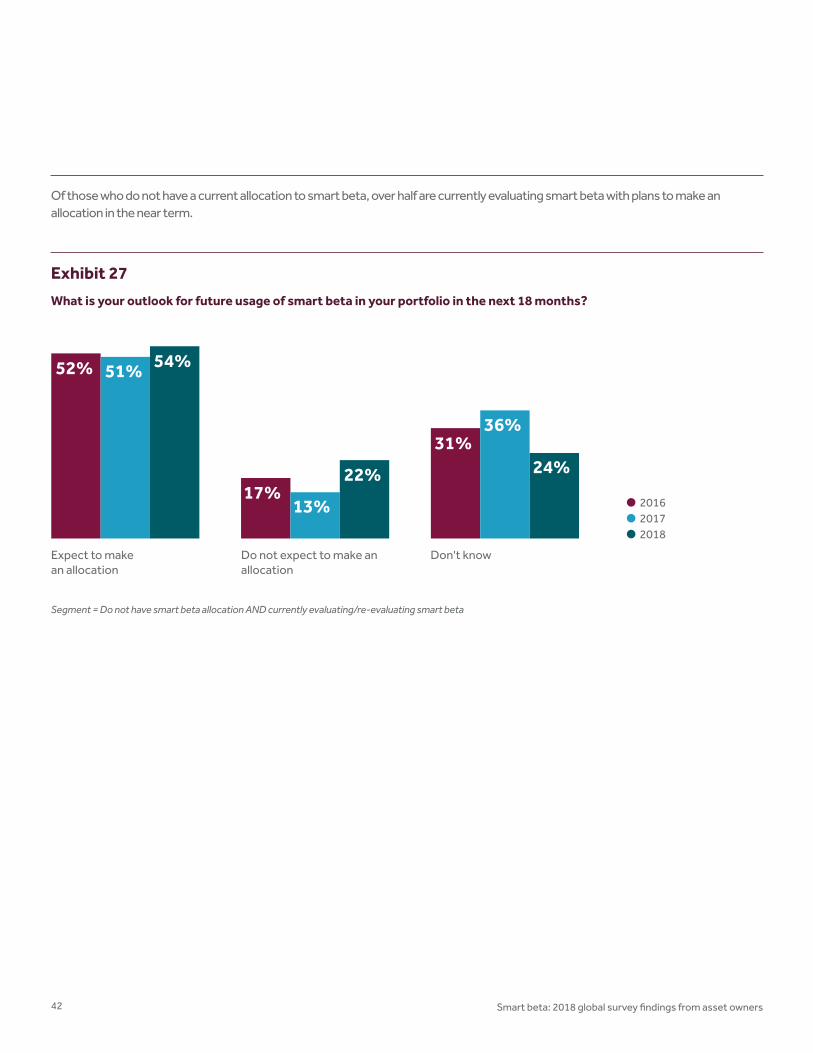
Exhibit 27
What is your outlook for future usage of smart beta in your portfolio in the next 18 months?
Segment = Do not have smart beta allocation AND currently evaluating/re-evaluating smart beta
Of those who do not have a current allocation to smart beta, over half are currently evaluating smart beta with plans to make an allocation in the near term.
52%
17%
31%
51%
13%
36%
54%
22% 24%
Expect to make an allocation
Do not expect to make an allocation
Don't know
●2016●2017●2018

43Smart beta: 2018 global survey findings from asset owners
Segment = Have an existing smart beta allocation
The majority of asset owners remain “satisfied” or “very satisfied” with their smart beta strategies’ ability to deliver on intended outcomes.
In 2018, almost two thirds of asset owners report being either “satisfied” or “very satisfied” with their smart beta strategies’ ability to deliver on intended outcomes, up from just over half who responded as such in 2017. This year we are seeing fewer asset owners providing “very satisfied” ratings.
Not surprisingly, many asset owners continue to state that it is too soon for them to rate their satisfaction levels, as many still have relatively new allocations. Very few asset owners report being dissatisfied with their smart beta strategies.
Exhibit 28
How satisfied are you with your smart beta strategies’ ability to deliver on your intended investment outcome?
27%
2%
9%
43%
18%
14%
1%
11%
53%
21%
20%
2%
26%
34%
17%
21%
3%
14%
53%
9%
Too soon to rate / don't know
Dissatisfied
Neutral
Satisfied
Very satisfied
●2018●2017●2016●2015

44 Smart beta: 2018 global survey findings from asset owners
Conclusion
Our annual survey continues to demonstrate an increase in smart beta adoption rates among asset owners globally, and we expect this growth to sustain. Among those with an existing smart beta allocation, 65% are currently evaluating additional allocations. Additionally 37% of asset owners who had previously evaluated smart beta and decided not to implement are currently re-evaluating their options thanks to new innovations in smart beta strategy development and increased product availability. Multi-factor strategies are reported as the most widely implemented smart beta strategies, particularly among asset owners who have adopted smart beta in the last two years. They are also the most commonly evaluated type of smart beta strategy, so we expect to see continued growth in multi-factor strategy adoption rates.
We also expect to see growth occur in the adoption of strategies that combine ESG considerations with smart beta. Among those who either have an existing smart beta allocation or plan to evaluate and/or implement one in the near future, 38% anticipate applying ESG considerations to a smart beta strategy. We look forward to conducting this survey in the coming years, and we hope that our analysis of the results continues to prove helpful to investors of all types.

45Smart beta: 2018 global survey findings from asset owners
2014 2015 2016 2017 2018
Corporation or private business 46% 23% 23% 26% 20%
Government 25% 22% 24% 23% 36%
Non-profit, university 26% 14% 14% 13% 15%
Union or industry-wide pension scheme 0% 13% 18% 11% 10%
Other 3% 28% 21% 27% 20%
2014 2015 2016 2017 2018
DB 75% 65% 63% 55% 67%
DC 43% 38% 45% 36% 36%
E/F 19% 17% 14% 18% 15%
How long did the evaluation process of smart beta take?
How long have you had a smart beta strategy allocation?
Plan type
Appendix
Organization type
13%
14%
16%
57%49%
35%
11%5%
●Less than one year●1-2 years●2-3 years●3 years or more
●Less than one year●1-2 years●2-3 years●3 years or more
Segment = Have an existing smart beta allocation Segment = Have an existing smart beta allocation

46 Smart beta: 2018 global survey findings from asset owners

© 2018 London Stock Exchange Group plc and its applicable group undertakings (the “LSE Group”). The LSE Group includes (1) FTSE International Limited (“FTSE”), (2) Frank Russell Company (“Russell”), (3) FTSE TMX Global Debt Capital Markets Inc. and FTSE TMX Global Debt Capital Markets Limited (together, “FTSE TMX”), (4) MTSNext Limited (“MTSNext”), (5) Mergent, Inc. (“Mergent”), (6) FTSE Fixed Income LLC (“FTSE FI”) and (7) The Yield Book Inc (“YB”). All rights reserved.
FTSE Russell® is a trading name of FTSE, Russell, FTSE TMX, MTS Next Limited, Mergent, FTSE FI and YB. “FTSE®”, “Russell®”, “FTSE Russell®”, “MTS®”, “FTSE TMX®”, “FTSE4Good®”, “ICB®”, “Mergent®”, “WorldBIG®”, “USBIG®”, “EuroBIG®”, “AusBIG®”, “The Yield Book®”, and all other trademarks and service marks used herein (whether registered or unregistered) are trademarks and/or service marks owned or licensed by the applicable member of the LSE Group or their respective licensors and are owned, or used under licence, by FTSE, Russell, MTSNext, FTSE TMX, Mergent, FTSE FI or YB.
All information is provided for information purposes only. All information and data contained in this publication is obtained by the LSE Group, from sources believed by it to be accurate and reliable. Because of the possibility of human and mechanical error as well as other factors, however, such information and data is provided “as is” without warranty of any kind. No member of the LSE Group nor their respective directors, officers, employees, partners or licensors make any claim, prediction, warranty or representation whatsoever, expressly or impliedly, either as to the accuracy, timeliness, completeness, merchantability of any information or of results to be obtained from the use of the FTSE Russell Products or the fitness or suitability of the FTSE Russell Products for any particular purpose to which they might be put. Any representation of historical data accessible through FTSE Russell Products is provided for information purposes only and is not a reliable indicator of future performance.
No responsibility or liability can be accepted by any member of the LSE Group nor their respective directors, officers, employees, partners or licensors for (a) any loss or damage in whole or in part caused by, resulting from, or relating to any error (negligent or otherwise) or other circumstance involved in procuring, collecting, compiling, interpreting,
analysing, editing, transcribing, transmitting, communicating or delivering any such information or data or from use of this document or links to this document or (b) any direct, indirect, special, consequential or incidental damages whatsoever, even if any member of the LSE Group is advised in advance of the possibility of such damages, resulting from the use of, or inability to use, such information.
No member of the LSE Group nor their respective directors, officers, employees, partners or licensors provide investment advice and nothing contained in this document or accessible through FTSE Russell Products, including statistical data and industry reports, should be taken as constituting financial or investment advice or a financial promotion.
No part of this information may be reproduced, stored in a retrieval system or transmitted in any form or by any means, electronic, mechanical, photocopying, recording or otherwise, without prior written permission of the applicable member of the LSE Group. Use and distribution of the LSE Group data requires a licence from FTSE, Russell, FTSE TMX, MTSNext, Mergent, FTSE FI, YB and/or their respective licensors.
For more information about our indexes, please visit ftserussell.com.

ftserussell.com
About FTSE Russell
FTSE Russell is a leading global index provider creating and managing a wide range of indexes, data and analytic solutions to meet client needs across asset classes, style and strategies. Covering 98% of the investable market, FTSE Russell indexes offer a true picture of global markets, combined with the specialist knowledge gained from developing local benchmarks around the world.
FTSE Russell index expertise and products are used extensively by institutional and retail investors globally. For over 30 years, leading asset owners, asset managers, ETF providers and investment banks have chosen FTSE Russell indexes to benchmark their investment performance and create investment funds, ETFs, structured products and index-based derivatives. FTSE Russell indexes also provide clients with tools for asset allocation, investment strategy analysis and risk management.
A core set of universal principles guides FTSE Russell index design and management: a transparent rules-based methodology is informed by independent committees of leading market participants. FTSE Russell is focused on index innovation and customer partnership applying the highest industry standards and embracing the IOSCO Principles. FTSE Russell is wholly owned by London Stock Exchange Group.
Visit us at ftserussell.com or contact us for more information.
Email [email protected]
EMEA +44 (0) 20 7866 1810
North America +1 877 503 6437
Asia PacificHONG KONG +852 2164 3333TOKYO +81 3 3581 2764SYDNEY +61 (0) 2 8823 3521