smart data pricing (sdp): economic solutions to network ...€¦ · smart data pricing (sdp):...
TRANSCRIPT

Smart Data Pricing (SDP):
Economic Solutions to Network Congestion
Soumya Sen, Carlee Joe-Wong, Sangtae Ha, Mung ChiangPrinceton University
April 11, 2013
1 IntroductionAdvances in Internet technologies have resulted in an unprecedented growth in demand for data. In particu-lar, the demand in the mobile Internet sector is doubling every year [1]. Given the limited wireless spectrumavailability, the rate of growth in the supply of wireless capacity (per dollar of investment) is unlikely tomatch the rate of growth in demand in the long run. Internet Service Providers (ISPs) are therefore turningto new pricing and penalty schemes in an effort to manage the demand on their network, while also match-ing their prices to cost. But changes in pricing and accounting mechanisms, if not done carefully, can havesignificant consequences for the entire network ecosystem. Multiple stakeholders in this ecosystem, includingoperators, consumers, regulators, content providers, hardware and software developers, and architects of net-work technologies, have all been tackling these issues of charging and allocating limited network resources.Even back in 1974, while writing about the future challenges of computer communication networks, LeonardKleinrock [2] noted:
[H]ow does one introduce an equitable charging and accounting scheme in such a mixed networksystem? In fact, the general question of accounting, privacy, security and resource control andallocation are really unsolved questions which require a sophisticated set of tools.
While much progress has been made on developing technical solutions, methods, and tools to address theseissues, continued growth of the network ecosystem requires developing a better understanding of the underly-ing economic and policy perspectives. The broader area of network economics, which deals with the interplaybetween technological and economic factors of networks, is therefore receiving more attention from engineersand researchers today. Economic factors like pricing, costs, incentive mechanisms and externalities1 affectthe adoption outcomes (i.e., success or failure of network technologies) and stability [3–5], influence networkdesign choices [6, 7], and impact service innovation [8]. Conversely, technological limitations and regulatoryconstraints determine which kind of economic models are most suited to analyze a particular network sce-nario. This interplay between technology, economics, and regulatory issues is perhaps most easily observed inthe case of broadband access pricing, for example, in evaluating the merits of “flat-rate” versus “usage-based”pricing or the neutrality of “volume-based” versus “app-based” accounting, etc. In this chapter we discussthe current trends in access pricing among service operators, factors that affect these decisions, analyticalmodels and related considerations. In particular, we observe that Smart Data Pricing2 is likely to emergeas an effective way to cope with increased network congestion. These smarter ways to count and treat datatraffic illustrate three shifts in the principles of network management:
1Network externality is the notion that the cost or value of being a part of a network for an individual user depends onthe number of other users using that network. For example, the value of a network grows as more users adopt and positiveexternalities are realized from being able to communicate with other users on the network. Similarly, when many users start tocontent for limited resources of a bottleneck link of a network, negative externalities from congestion diminish a user’s utilityfrom accessing the network.
2SDP is the broad set of ideas and principles that go beyond the traditional flat-rate or byte-counting models and insteadconsiders pricing as a network management solution.
1

1. Pricing for end-user’s Quality of experience (QoE) and not just byte-counting : Simplepolicies like usage-based pricing (byte-counting) suffers from the disadvantages that users have to paythe same amount per unit of bandwidth consumed irrespective of the congestion levels on the network,and that it fails to account for the fact that different applications have different bandwidth requirementsto attain a certain QoE for the user. SDP should try to match the cost of delivering application-specificdesired QoE requirements of the user to the ISP’s congestion cost at the time of delivery.
2. Application layer behavioral modifications to impact physical layer resource management :Today’s smart devices with their easy to use graphical user interfaces are potential enablers of consumer-specified choice for access quality. Whether done manually or in an automated mode, user’s specificationof their willingness to pay for their desired QoE of different applications can be taken in as inputs at theAPP layer and used to control PHY layer resource allocation and media selection (e.g., WiFi offloadingversus 3G).
3. Smart mobile devices and customer-premise equipments (CPEs) as a part of networkmanagement system : Instead of managing traffic only in the network core, SDP explores ways tomake edge devices (e.g., smart mobile devices and customer-premise equipments like gateways) a partof the network resource allocation and management system. For example, instead of throttling trafficin the network core using the policy charging and rules function (PCRF), the edge devices (e.g., homegateways) themselves could locally regulate demand based on user’s budget, QoE requirements, andnetwork load or available prices.
But before delving any deeper into pricing ideas, let us pause to address some common misconceptionsoften encountered in public discourse. First, many believe that the Internet’s development cost was borneby the United States Government, and hence the taxpayers have already paid for it. In reality, by 1994the National Science Foundation supported less than 10% of the Internet and by 1996 huge commercialinvestments were being made worldwide [9].
Second, users often do not realize that the Internet is not free [9, 10] and think its cost structure is thesame as that of information goods. In contrast to information goods, which tend to have zero marginal costs,3
Internet operators incur considerable network management operation and billing costs. MacKie-Mason andVarian [11] have shown that while the marginal cost of some Internet traffic can be zero because of statisticalmultiplexing, congestion costs can be quite significant. In regard to delivery of bits, It is worthwhile to notethat there are two factors at play:
(a) There is large and growing variance in the QoE requirements of the different types of applications thatconsumers are using today
(b) The network operator’s cost of delivery per bit also has significant variance, ranging from essentiallyzero marginal cost in un-congested times to very high in congested times.
So why not match the right pairs? Most SDP ideas aim to do exactly that, i.e., match the operator’scost of delivering bits to the consumer’s QoE needs for different application types.
Third, users fear that changes in pricing policy will increase their access fees. This need not always bethe case, as one can design incentive mechanisms that reward good behavior (e.g., price discounts in off-peakhours to incentivize shifting of usage demand from peak times). In other words, smarter pricing mechanismscan increase consumer choices by empowering users to take better control of how they spend their monthlybudget (e.g., under time-dependent usage-based pricing [12,13], users have better control over their monthlybills by choosing not only how much they want to consume, but also when they do so). Neither will smarterpricing necessarily lead to provider management overhead or consumer confusion. Smart data pricing is alsosmart in its implementation and in its user interface design, as we will illustrate in later sections and casestudies.
The following questions provide a useful way to think about SDP:
3Marginal cost is the change in the total cost that arises when the quantity produced changes by one unit, e.g., the cost ofadding one more unit of bandwidth.
2

(I) Why do we need SDP? Isn’t network pricing is an untouchable legacy?Section 2 provides an overview of the driving factors behind network congestion, and the challengesthat it poses to various stakeholders of the network ecosystem are discussed in Section 3. We alsodiscuss the rapid evolution in pricing among network operators and highlight in Section 4 how SmartData Pricing ideas will be useful in finding solutions that can work in today’s networks.
(II) Haven’t other fields already used pricing innovations? What are the key SDP ideas relevant to com-munication networks?We provide an overview of Internet pricing ideas in the existing literature in Section 5, including somepricing plans from the electricity and transportation industries that can be applied to broadbandpricing. Section 6 provides an overview of a few examples and analytical models of known pricingmechanisms to illustrate key economic concepts relevant to the SDP literature. We also highlightmany crucial differences between SDP in communication or data networks and pricing innovations inother industries.
(III) Isn’t SDP too complex to implement in the real world?Section 7 provides a case study of a field trial of “day-ahead time-dependent pricing” and discussesthe model, system design, and user interface design considerations for realizing this plan. It serves todemonstrate both the feasibility of creating such SDP plans for real deployment while also pointingout the design issues that should be kept in mind. The discussion highlights the end-to-end nature ofan SDP deployment, which requires developing pricing algorithms, designing an effective interface forcommunicating those prices to users, and implementing an effective system to communicate betweenthe users and ISPs.
(IV) What are the outstanding problems in enabling SDP for the Internet?SDP is an active area of research in the network economics community and a set of 20 questions andfuture directions are provided in Section 8 for researchers and graduate students to explore. Many ofthese research questions have been generated based on the discussions at various industry-academiaforums and workshops on SDP [14,15].
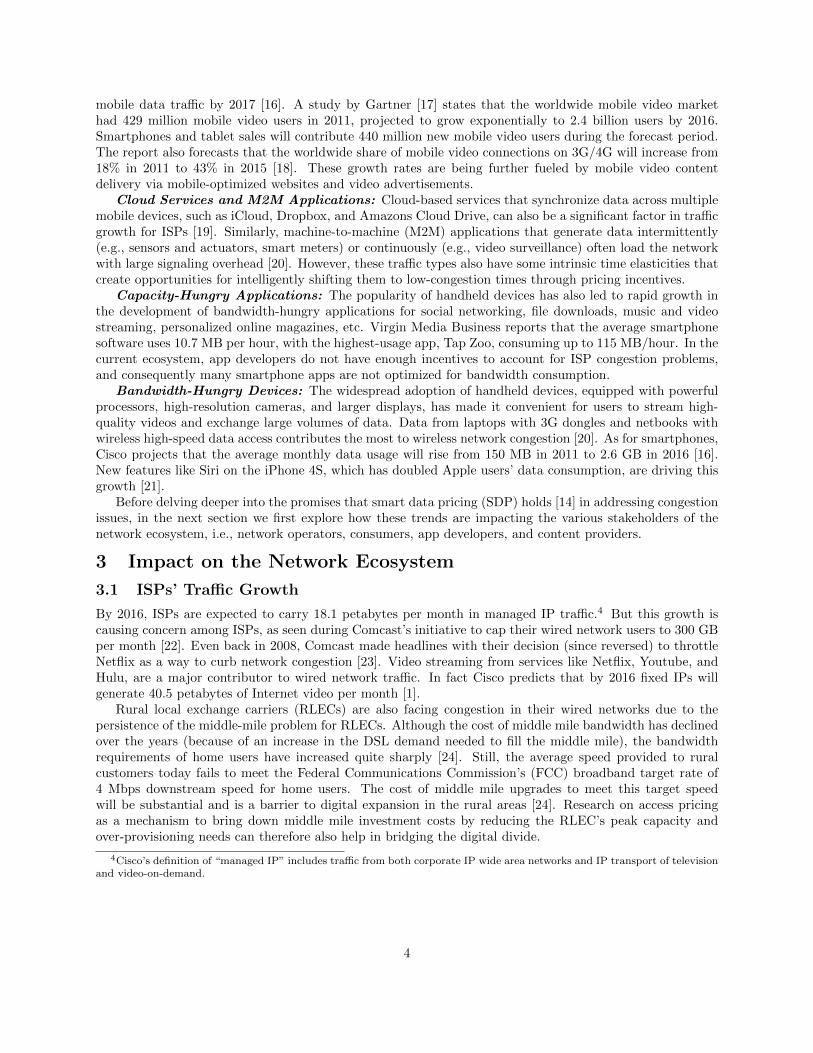
2 Driving Factors of Network CongestionWith mobile devices becoming smarter, smaller, and ubiquitous, consumers are embracing the technologyand driving up the demand for mobile data. According to Cisco’s VNI [16], in 2012, global mobile datatraffic grew more than 70 percent year over year, to 855 petabytes a month. The growth rate varied byregions, with 44% growth in Western Europe, and about 101% in the Middle East and Africa and a 95%growth rate in Asia Pacific. This section identifies some of the key factors that are expected to drive thisgrowth in demand for mobile data (ref. Figure 1).
Mobile Video
Cloud Services
Data-‐Hungry Apps
High-‐Resolu=on Devices
Rapid growth in demand for mobile data
Figure 1: Factors driving the demand for mobile data.
Mobile Videos: Video has been a major contributor to mobile data traffic growth, accounting for 51percent of global mobile data traffic at the end of 2012. It is expected to account for 66 percent of global
3
mobile data traffic by 2017 [16]. A study by Gartner [17] states that the worldwide mobile video markethad 429 million mobile video users in 2011, projected to grow exponentially to 2.4 billion users by 2016.Smartphones and tablet sales will contribute 440 million new mobile video users during the forecast period.The report also forecasts that the worldwide share of mobile video connections on 3G/4G will increase from18% in 2011 to 43% in 2015 [18]. These growth rates are being further fueled by mobile video contentdelivery via mobile-optimized websites and video advertisements.
Cloud Services and M2M Applications: Cloud-based services that synchronize data across multiplemobile devices, such as iCloud, Dropbox, and Amazons Cloud Drive, can also be a significant factor in trafficgrowth for ISPs [19]. Similarly, machine-to-machine (M2M) applications that generate data intermittently(e.g., sensors and actuators, smart meters) or continuously (e.g., video surveillance) often load the networkwith large signaling overhead [20]. However, these traffic types also have some intrinsic time elasticities thatcreate opportunities for intelligently shifting them to low-congestion times through pricing incentives.
Capacity-Hungry Applications: The popularity of handheld devices has also led to rapid growth inthe development of bandwidth-hungry applications for social networking, file downloads, music and videostreaming, personalized online magazines, etc. Virgin Media Business reports that the average smartphonesoftware uses 10.7 MB per hour, with the highest-usage app, Tap Zoo, consuming up to 115 MB/hour. In thecurrent ecosystem, app developers do not have enough incentives to account for ISP congestion problems,and consequently many smartphone apps are not optimized for bandwidth consumption.
Bandwidth-Hungry Devices: The widespread adoption of handheld devices, equipped with powerfulprocessors, high-resolution cameras, and larger displays, has made it convenient for users to stream high-quality videos and exchange large volumes of data. Data from laptops with 3G dongles and netbooks withwireless high-speed data access contributes the most to wireless network congestion [20]. As for smartphones,Cisco projects that the average monthly data usage will rise from 150 MB in 2011 to 2.6 GB in 2016 [16].New features like Siri on the iPhone 4S, which has doubled Apple users’ data consumption, are driving thisgrowth [21].
Before delving deeper into the promises that smart data pricing (SDP) holds [14] in addressing congestionissues, in the next section we first explore how these trends are impacting the various stakeholders of thenetwork ecosystem, i.e., network operators, consumers, app developers, and content providers.
3 Impact on the Network Ecosystem
3.1 ISPs’ Traffic Growth
By 2016, ISPs are expected to carry 18.1 petabytes per month in managed IP traffic.4 But this growth iscausing concern among ISPs, as seen during Comcast’s initiative to cap their wired network users to 300 GBper month [22]. Even back in 2008, Comcast made headlines with their decision (since reversed) to throttleNetflix as a way to curb network congestion [23]. Video streaming from services like Netflix, Youtube, andHulu, are a major contributor to wired network traffic. In fact Cisco predicts that by 2016 fixed IPs willgenerate 40.5 petabytes of Internet video per month [1].
Rural local exchange carriers (RLECs) are also facing congestion in their wired networks due to thepersistence of the middle-mile problem for RLECs. Although the cost of middle mile bandwidth has declinedover the years (because of an increase in the DSL demand needed to fill the middle mile), the bandwidthrequirements of home users have increased quite sharply [24]. Still, the average speed provided to ruralcustomers today fails to meet the Federal Communications Commission’s (FCC) broadband target rate of4 Mbps downstream speed for home users. The cost of middle mile upgrades to meet this target speedwill be substantial and is a barrier to digital expansion in the rural areas [24]. Research on access pricingas a mechanism to bring down middle mile investment costs by reducing the RLEC’s peak capacity andover-provisioning needs can therefore also help in bridging the digital divide.
4Cisco’s definition of “managed IP” includes traffic from both corporate IP wide area networks and IP transport of televisionand video-on-demand.
4

3.2 Consumers’ Cost Increase
Network operators have begun to pass some of their network costs to consumers through various penaltymechanisms (e.g., overage fees) and increasing the cost of Internet subscriptions. For instance, when Verizonannounced in July 2012 that they were offering shared data plans for all new consumers and discontinuingtheir old plans, many consumers ended up with higher monthly bills [25]. To remain within monthly datacaps, consumers are increasingly relying on using usage-tracking and data compression apps (e.g., Onavo,WatchDogPro, DataWiz) [26] that help to avoid overage fees. Such trends are common in many parts ofthe world; in South Africa, for instance, consumers use ISP-provided usage-tracking tools [27] to stay withinthe data caps. Similarly in the U.S., research on in-home Internet usage has shown that many users areconcerned about their wired Internet bills and would welcome applications for tracking their data usage andcontrolling bandwidth rates on in-home wired networks [28, 29]. Empowering users to monitor their datausage and control their spending has led to a new area of research that considers economic incentives andhuman-computer interaction (HCI) aspects in a holistic manner [30].
3.3 Application Developers’ Perspective
Introducing pricing schemes that create a feedback-control loop between the client side device and networkbackend devices requires new mobile applications that will support such functionalities. However, mostmobile platforms in use today (e.g., iOS, Android, and Windows) have different levels of platform openness.The iOS platform for iPhones and iPads has several restrictions: it strictly specifies what kind of applicationscan run in the background and further prevents any access other than the standard application programminginterfaces (APIs). For example, obtaining an individual application’s usage and running a pricing app inthe background are prohibited. By contrast, the Android and Windows platforms allow these features, e.g.,introducing an API to report individual applications’ usage to third-party apps. An interesting direction isto initiate the creation of open APIs between user devices and an ISP’s billing systems. For example, thiscan allow the user devices connected to the ISP’s network to easily fetch current pricing information fromthe network operator, while also allowing the ISP to easily test and deploy new pricing schemes through thestandardized interface.
Wireless ISPs’ current billing systems (including 2G, 3G, and 4G) heavily depend on the RADIUS(Remote Authentication Dial In User Service) protocol, which supports centralized Authentication, Autho-rization, and Accounting (AAA) for users or devices to use a network service [31]. In particular, RADIUSaccounting [32] is well suited to support usage-based pricing, since it can keep track of the usage of indi-vidual sessions belonging to each user. Interim-update messages to each session can be sent periodicallyto update the usage information. However, RADIUS accounting lacks support for dynamic pricing plans,which require time-of-day usage at various time scales5 Therefore, extending these protocols to support newpricing mechanisms, standardizing interfaces, and the creation of open APIs between network operators andapplication developers will be interesting directions for future research in this area.
3.4 Software/Hardware Limitations
Wireless ISPs’ current billing systems (including 2G, 3G, and 4G) heavily depend on the RADIUS (RemoteAuthentication Dial In User Service) protocol, which supports centralized Authentication, Authorization, andAccounting (AAA) for users or devices to use a network service [31]. In particular, RADIUS accounting [32]is well suited to support usage-based pricing, since it can keep track of the usage of individual sessionsbelonging to each user. Interim-update messages to each session can be sent periodically to update theusage information. However, RADIUS accounting lacks support for dynamic pricing plans, which requiretime-of-day usage at various time scales (e.g., hourly, 30 mins or 10 mins).6 Consequently, several protocolsneed to be extended to support these new pricing ideas.
Another interesting direction is the creation of an open API between user devices and an ISP’s billingsystems. The open API will foster innovations in pricing for both consumers and providers. For example,
5Note that interim update messages are sent periodically when a session joins the system, and hence, the time interval forinterim updates should be kept low to support sending time-of-day usage, which may introduce significant control overhead.
6Note that interim update messages are sent periodically when a session joins the system, and hence, the time interval forinterim updates should be kept low to support sending time-of-day usage, which may introduce significant control overhead.
5
the user devices connected to the ISP’s network can easily fetch their pricing, billing, and usage informationfrom the network, and the ISP can also easily test and deploy new pricing schemes through the standardinterface.
3.5 Content Delivery Issues
Any change in access pricing has to be studied in the larger context of Internet’s net-neutrality and openness.These discussions center around the issues of (a) who should pay the price of congestion (i.e., contentproviders or consumers) and (b) how such pricing schemes should be implemented (i.e., time-of-day, app-based bundles, etc.). The major concern with policy change is the possibility of paid prioritization of certaincontent providers’ traffic, price discrimination across consumers, and promoting anti-competitive behavior inbundled offerings of access plus content. While such developments can indeed hurt the network ecosystem,one aspect that should receive more attention is the threat to data usage even under simple usage-basedor tiered data plans. As Internet users become more cautious about their data consumption [33], contentproviders are providing new options to downgrade the quality of experience (QoE) for their users to helpthem save money. For instance, Netflix has started allowing “users to dial down the quality of streamingvideos to avoid hitting bandwidth caps” [34]. Additionally, it is “giving its iPhone customers the option ofturning off cellular access to Netflix completely and instead relying on old-fashioned Wi-Fi to deliver theirmovies and TV shows” [35]. Thus, the ecosystem today is being driven by an attitude of penalizing demandand lessening consumption through content quality degradation.
Network researchers are investigating these issues broadly along two lines of work: (i) opportunisticcontent caching, forwarding, and scheduling, and (ii) budget-aware online video adaptation. Opportunisticcontent delivery involves the smart utilization of unused resources to deliver higher QoE; for example, toalleviate the high cost of bulk data transfers, Marcon et al. [36] proposed utilizing excess bandwidth (e.g.,at times of low network traffic) to transmit low-priority data. Since this data transmission does not requireadditional investment from ISPs, they can offer this service at a discount, relieving data transfer costs forclients. While utilizing excess bandwidth introduces some technical issues (e.g., the potential for resourcefluctuations), a prototype implementation has shown that they are not insurmountable [37]. The secondstream of works on online video adaptation systems, such as Quota Aware Video Adaptation (QAVA) [38],have focused on sustaining a user’s QoE over time by predicting her usage behavior and leveraging thecompressibility of videos to keep the user within the available data quota or her monthly budget. The basicidea here is that the video quality can be degraded by non-noticeable amounts from the beginning of a billingcycle based on the user’s predicted usage so as to avoid a sudden drop in QoE due to throttling or overagepenalties when the monthly quota is exceeded.
3.6 Regulatory Concerns
Pricing in data networks has remained a politically charged issue, particularly for pricing mechanisms thatcan potentially create incentives for price discrimination, non-neutrality, and other anti-competitive behaviorthrough app-based pricing or bundling of access and content. Academics have already cautioned that theongoing debate on network neutrality in the U.S. often overlooks service providers’ need for flexibility inexploring different pricing regimes [39]:
Restricting network providers’ ability to experiment with different protocols may also reduce inno-vation by foreclosing applications and content that depend on a different network architecture andby dampening the price signals needed to stimulate investment in new applications and content.
But faced with the growing problem of network congestion, there has been a monumental shift in theregulatory perspective in the US and other parts of the world. This sentiment was highlighted in FCCChairman J. Genachowski’s 1 December 2010 statement [40], which recognizes “the importance of businessinnovation to promote network investment and efficient use of networks, including measures to match priceto cost.”
6
AT&T starts throttling !unlimited iPhone users !
(July 2011)9!
Verizon introduces shared data plans
with unlimited voice and text !(June 2012)12!
Verizon to eliminate unlimited data plans !
(May 2012)11!
No unlimited plans offered for iPad LTE !
(March 2012)10!
AT&T starts charging a $10/GB overage fee for smartphone data plans !
(June 2010)6!
Comcast moves towards tiered usage-
based billing!(May 2012)5!
AT&T starts throttling wireline users !(April 2011)3!
Comcast caps data at 250 GB (August 2008)2!
Wireless
Wireline Introduction of Data Caps
Verizon eliminates new unlimited smartphone plans !
(July 2011)8!
Elimination of Unlimited Data Plans Introduction of Usage-based penalties
T-Mobile starts data caps and
throttling penalty!(May 2011)7!
AT&T caps U-verse to 250 GB and DSL to 150 GB
with a $10 penalty for each additional 50 GB per month!
(May 2011)4!
Time-Warner trials data
caps in Texas!(June 2008)1!
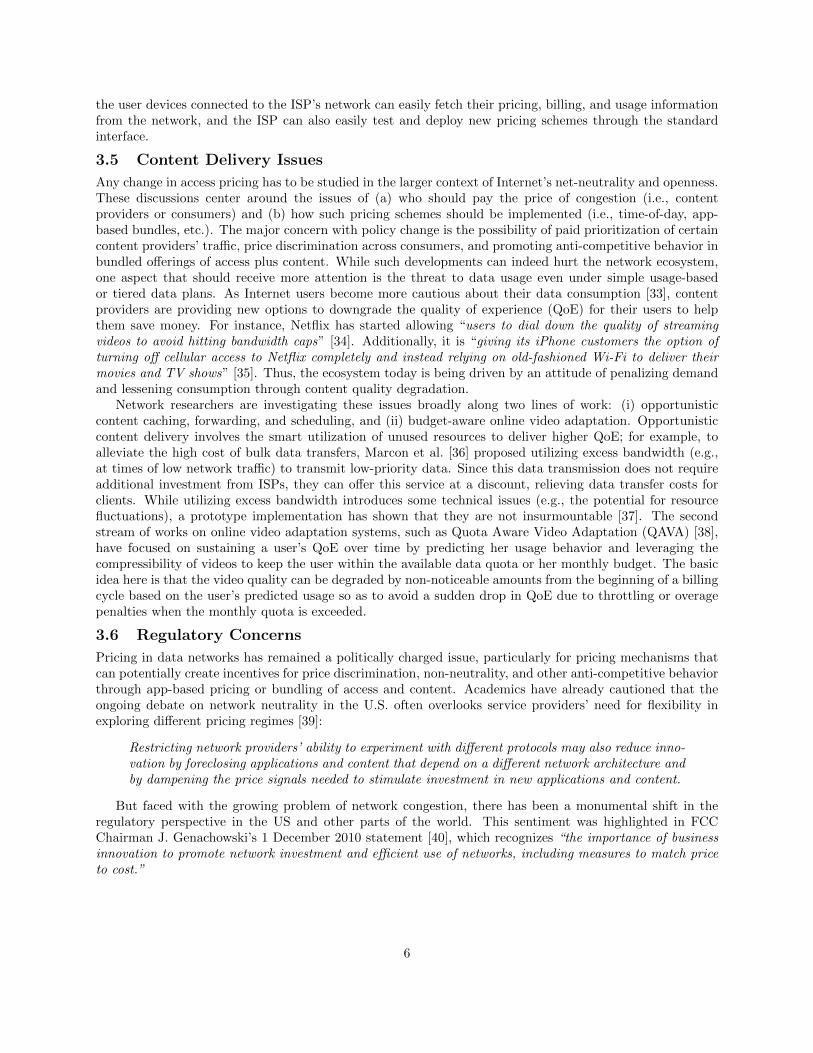
Figure 2: Broadband pricing plans offered by major U.S. ISPs, 2008 - 2012.
4 Smart Data PricingBroadband access pricing and demand control practices have rapidly evolved among U.S. ISPs since 2008, asseen in Figure 2. Over the past few years, ISPs around the world have started to offer innovative pricing plans,including usage-based and app-based pricing to tackle the problem of network congestion [41]. Smart DataPricing (SDP) [15] is an umbrella term for a suite of pricing and policy practices that have been proposed inthe past or are being explored as access pricing options by operators instead of the traditional flat-rate model.Such SDP models can include any or a combination of the following mechanisms, which will be discussedlater in the chapter: (a) Usage-based pricing/metering/throttling/capping, (b) Time/location/congestion-dependent pricing, (c) App based pricing/sponsored access, (d) Paris metro pricing, (e) Quota-aware contentdistribution. SDP does not necessarily need to be an explicit pricing mechanism, it can even be in the formof innovative congestion management tools like WiFi offloading or “fair-throttling7”.
The basic ideas of congestion pricing have received much attention as a research topic both in computernetworks and information systems literature, and are once again getting a fresh look from academics in therecent years. Given the change in the economic and regulatory environment of Internet pricing, it is likelythat some of the ideas will be realized in future data plans. However, research in the design of such smartdata pricing plans should account for some new factors: (i) the growth in traffic with high time-elasticity ofdemand (e.g., downloads, P2P, cloud backup, M2M) and the ability to schedule such traffic to a less congestedtime without user-intervention, (ii) revisit the issue of dividing the elements of a congestion control-feedbackloop between the network backend and the smart end-user devices, (iii) develop new system architecture todeploy these pricing ideas and demonstration of their potential benefits through field trials. In other words,it requires understanding both the economic theory of pricing models as well as the systems engineering andhuman-computer interaction aspects of realizing such data plans.
7Fair throttling involves accounting for user’s usage history of contributing to congestion in determining what share ofavailable bandwidth the user should receive in a congested time.
7

Pricing Policy
Static Pricing
Dynamic Pricing
Paris metro pricing
Token pricing
Reservation-‐based
Expected capacity Cumulus pricing
Congestion-‐based
Proportionally fair
Priority-‐based
(Smart Market)
Effective bandwidth
Auction-‐based
Flat-‐rate (e.g. Shakkotai et al. `08)
Usage-‐based (e.g. Hande et al .`10, Li et al. `09, Walrand et al. `08) (e.g. Odlyzko`99)
(e.g. Cocchi et al. `91, Marbach `04)
(e.g. Delgrossi et al. `99, Parris et al. `92, `99)
Time-‐of-‐day (e.g. Parris et al. `92)
(e.g. Clark `97)
(e.g. Hayel et al. `05)
Application-‐based and sponsored content (e.g. Ericsson Whitepaper`11, Andrews ‘13)
(e.g. Gupta et al. `97)
(e.g. Courcoubetis et al. `98, Kelly et al. `98,)
(e.g. Kelly `94)
(e.g. MacKie-‐Mason `95, Murphy et al., `94, `95)
(e.g. Ganesh et al. `01, Paschalidis et al. `98)
Priority pricing
(e.g. Lee `11)
Day-‐ahead (e.g. Ha et al. ‘12, Joe-‐Wong et al. `11)
Raf\le-‐based (e.g. Loiseau et al. ‘11)
QoS classes
Negotiated contracts
Real-‐time congestion
Tiered
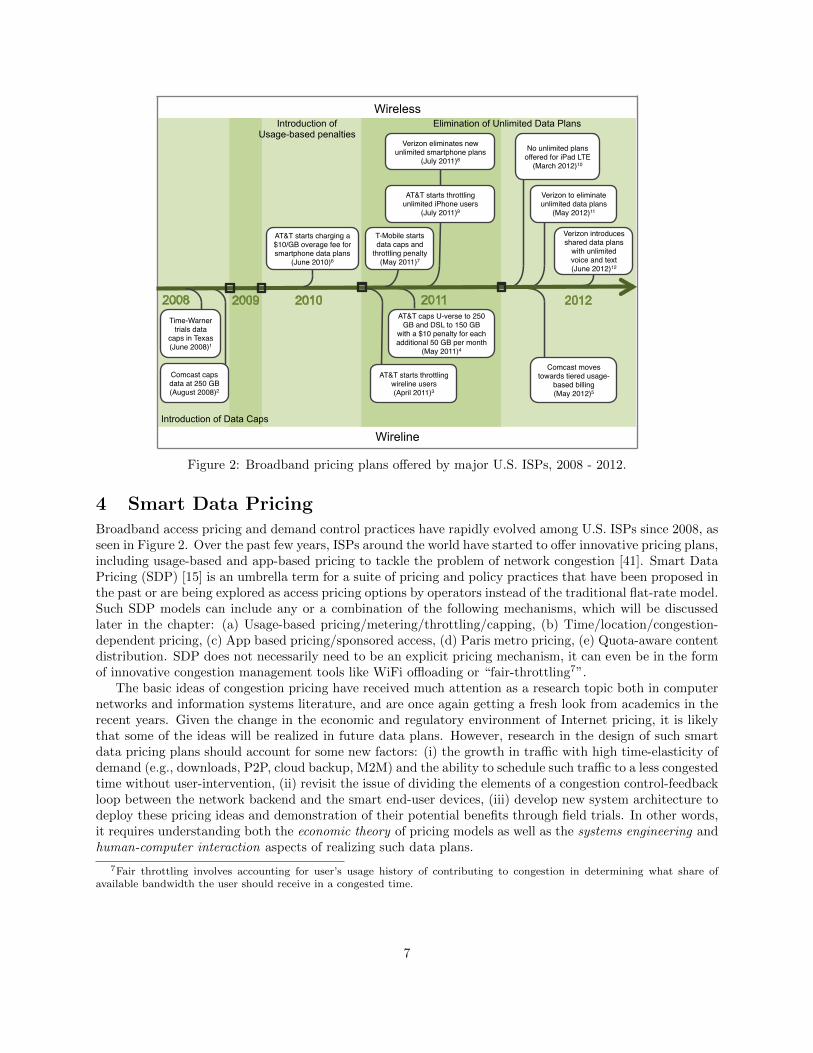
Figure 3: Examples of broadband pricing plans proposed in the research literature.
5 A Review of Smart Data PricingSmart data pricing encompasses a wide variety of different pricing algorithms and proposals. In this section,we briefly discuss some of these ideas, following the taxonomy given in Figure 3. We include a brief overviewof related pricing plans in the electricity and transportation industries, which can help yield insights intothe feasibility of various forms of SDP for data, as well as ideas for new pricing plans. Other, more thoroughreviews may be found in [42–44].
A primary goal of SDP is to creating the right incentives (or price points) for the user to modify theirusage behavior so as to help ISPs with better resource allocation and utilization. But creating these incentivesrequire ISPs to think account for the users’ responses to the prices offered. Of particular relevance is thetimescale associated with the pricing mechanism – do the prices continually change as network load changes?If so, how frequently and by how much?
Static pricing plans are those that change prices on a relatively longer timescale, e.g., months or years,i.e., the offered prices do not vary with immediate changes in the network congestion level. The popularity ofthese plans arises from the certainty they provide to a user’s expected monthly bill. For instance, tiered dataplans with pre-specified rates are prevalent in the United States and several European and Asian ISPs offerusage-based pricing in which users are charged in proportion to their usage volume. But such usage-basedpricing leaves a timescale mismatch: ISP revenue is based on monthly usage, but peak-hour congestiondominates its cost structure (e.g., network provisioning costs increase with the peak-hour traffic). Anotherwell-known pricing plan is time-of-day (ToD) pricing, in which users are charged higher prices during certain“peak” hours of the day. But even with ToD pricing, the hours deemed as “peak” are fixed, which resultsin two challenges. First, traffic peaks arise in different parts of the networks at different times which can behard to predict in advance, and it may end up creating two peaks during the day–one during peak periods,for traffic that cannot wait for several hours for lower-price periods, and another peak during discounted“off-peak” periods for time-insensitive traffic [45]. We discuss several of these existing static pricing plans
8
and proposals in greater detail in Section 5.1.Dynamic pricing takes the ToD idea further in that it does not pre-classify peak and off-peak periods,
instead adjusting prices at a finer timescale or by location in response to the network congestion. How-ever, prices that vary depending on the current network load can be sometimes inconvenient for users.Hence, dynamic pricing variants for SDP, such as automated “smart market” [46, 47], raffle-based pricingloiseau2011incentive, and day-ahead pricing [13], have been proposed to guarantee the prices a day in ad-vance to give users some certainty about the future prices on offer. Each day, new prices are computed fordifferent times (e.g., hours) of the next day, based on predicted congestion levels. A detailed discussion onthese dynamic pricing proposals will be provided in Section 5.2.
5.1 Static Pricing
Due to the fixed nature of their prices, static data plans do not generally allow ISPs to adapt to real-timecongestion conditions. In particular, the ISP cannot prevent or alleviate network congestion at peak timesby manipulating the prices. On the other hand, static pricing tends to be more acceptable to users, asit offers more certainty and is simpler than dynamically changing prices. Indeed, the most basic form ofstatic pricing, flat pricing, is also the most simple for users, though it does not impose any sort of usageincentives [48]. Some other important examples of static pricing include the following:
Usage-based: In its purest form, usage-based pricing charges users in proportion to the amount of datathat they consume, without regard to the type of data (e.g., application) or time of consumption. Theprincipal advantage of such a pricing plan lies in its relative simplicity, though it also imposes a monetarypenalty on heavy (i.e., high-usage) users that can help to reduce congestion [49, 50]. However, usage-basedpricing requires users to keep close track of their usage in order to determine how much they have spent ondata, though such measures are not impossible [51].
Tiered: A more common variant of pure usage-based pricing is tiered pricing, in which users pay a fixedamount of money for a monthly data cap (e.g., $30 for 3GB). This fixed fee covers usage up to the cap, afterwhich users may pay another fixed fee to increase the cap by a discrete amount, e.g., $10 per extra GB.Thus, tiered or capped pricing can be viewed as a discretization of usage-based pricing. Many ISPs haveadopted such a pricing plan or another variant in which the data cap is shared across several devices (i.e., ashared data plan). Like usage-based pricing, tiered pricing is simple for users to understand and penalizesheavy usage.
Quality of Service (QoS) classes: Some static pricing plans offer multiple traffic classes with differentqualities of service (QoS). A simple differentiated pricing plan is Paris metro pricing, which is named afteran actual pricing practice on the Paris metro in the 1900s [52]. In Paris metro pricing, the ISP separatesdata traffic into different logical traffic classes and charges different prices for logically separate traffic classes(i.e., each class is identical to the others in their treatment of data packets). Only users willing to pay ahigher price will adopt this traffic class, which leads to a better QoS due to fewer users. Other researchershave investigated more direct forms of QoS pricing, in which users can indicate their desired QoS in theirpackets and are charged a higher per-byte fee for higher QoS [53,54].
Another form of QoS pricing is token pricing, in which users receive tokens at a fixed rate (e.g., 1 perminute) [55]. Users can then spend these tokens to send some of their traffic at a premium QoS; users canchoose the timing of these premium sessions, e.g., to coincide with their individual priorities and preferences.
Negotiated contracts: In these types of pricing schemes, users pre-negotiate contracts with the ISPregarding the price of sending traffic over the network. The main research question for such contracts is thencharacterizing this user-ISP interaction and both parties’ optimal decisions. For instance, in reservation-based pricing, users specify a monthly budget for data; the ISP can then accept or reject users’ connectionsbased on users’ remaining budget and the real-time network congestion [56–58].
In expected capacity pricing, users similarly negotiate a price in advance based on an “expected” qualityof service (e.g., file transfer time), so that at congested times the ISP can freely allocate network resourcesbased on whether a given packet lies “within” a user’s purchased traffic profile [59]. The goal of this pricingscheme is to “provide additional explicit mechanisms to allow users to specify different service needs, with thepresumption that they will be differentially priced [59].” Expected capacity pricing allows users to explicitlyspecify their service expectation (e.g., file transfer time), while accounting for differences in applications’
9

data volume and delay tolerance. The idea is that by entering into profile contracts for expected capacitywith the operator, different users should receive different shares of network resources when the networkgets congested [44]. One specific proposal to realize this service involved traffic flagging (i.e., each packetis marked as being in or out of the user’s purchased profile, irrespective of network congestion level) bya traffic meter at access points where the user’s traffic enters the network. This is followed by congestionmanagement at the switches and routers where packets marked as out are preferentially dropped duringcongested periods, but are treated in an equal best-effort manner at all other times. The expected capacityis thus not a capacity guarantee from the network to the user, but rather a notion of the capacity that auser expects to be available and a set of mechanisms that allow him or her to obtain a different share of theresource at congested times.
An ISP offers similar contracts under cumulus pricing, but users can re-negotiate the price after passing“cumulus” usage points [60]. Cumulus pricing consist of three stages: specification, monitoring, and negoti-ation. A service provider initially offers a flat-rate contract to the user for a specified period based on theuser’s estimate of resource requirements. During this time the provider monitors the user’s actual usage andprovides periodic feedback to the user (by reporting on “cumulus points” accumulated from their usage) toindicate whether the user has exceeded the specified resource requirements. Once the cumulative score of auser exceeds a predefined threshold, the contract is renegotiated.
App-based and sponsored content: Different applications consume different amounts of data traf-fic (e.g., streaming video consumes much more data than retrieving emails). Some researchers have thusproposed app-based pricing, in which users are charged different rates for different apps [61]. Such pricingplans also include “zero-rated” apps, whose traffic is free for the user. A variant of such pricing schemes is“sponsored content”, in which a third-party (advertiser, content provider, or the ISP itself) “sponsors” somepart of the traffic in return for accessing specific content or at less congested times.
App-based plans have been offered in Europe, largely on a promotional basis. However, app-based pricingpresents technical challenges for ISPs– ISPs need to identify and track how much data each user consumes onspecific applications and involves certain privacy considerations. Moreover, some apps open links in separateapps (e.g., links in Flipboard may open a separate Internet browser), creating confusion among users asto the app to which some traffic belongs, and whether the traffic counts to the sponsored volume or not.Even in academia, sponsored content research is relatively sparse, though a few initial models have beendeveloped [62].
Time-of-day (ToD): ToD pricing charges users different usage-based rates at different times of theday (e.g., peak and off-peak hours) [58]. The free nighttime minutes offered for voice calls by most US ISPsbefore 2013 are one simple of ToD pricing. However, as the peak times and rates are fixed in advance,ToD pricing can end up creating two peaks, one during the “peak” period and one in the “off-peak” period;indeed, this phenomenon was observed in Africa when MTN Uganda offered discounted prices for voice callsmade at night.
ToD pricing for broadband data in practice today are two-period plan with different charging rates at dayand night times. For example, BSNL in India offers unlimited night time (2-8 am) downloads on monthlydata plans of Rs 500 ($10) and above. Other variations of ToD pricing are offered elsewhere; for instance,the European operator Orange has a “Dolphin Plan” for £15 ($23.50 USD) per month that allows unlimitedweb access during a “happy hour” corresponding to users’ morning commute (8-9 am), lunch break (12-1pm), late afternoon break (4-5 pm), or late night (10-11 pm).
5.2 Dynamic Pricing
Dynamic pricing allows prices to be changed in (near) real-time, which unlike static pricing allows an ISPto adjust its prices in response to observed network congestion. However, in doing so the ISP significantlycomplicates its pricing, making it much harder for users to understand. Thus, implementing and offeringdynamic pricing plans requires ISPs to account for human factors that can make real-time changes in pricemore amenable to users. We can divide dynamic pricing plans into four types:
Raffle-based: Under raffle-based pricing, the exact price that users pay is determined after-the-fact, i.e.,in a probabilistic manner that depends on the amount of data consumed by a user [63]. Users have a chanceto receive a monetary reward during congested times if they agree to shift their demand to less-congested
10

Prices
Usage
User Interface Price
Calculation
Network Measurement
User Behavior Estimation
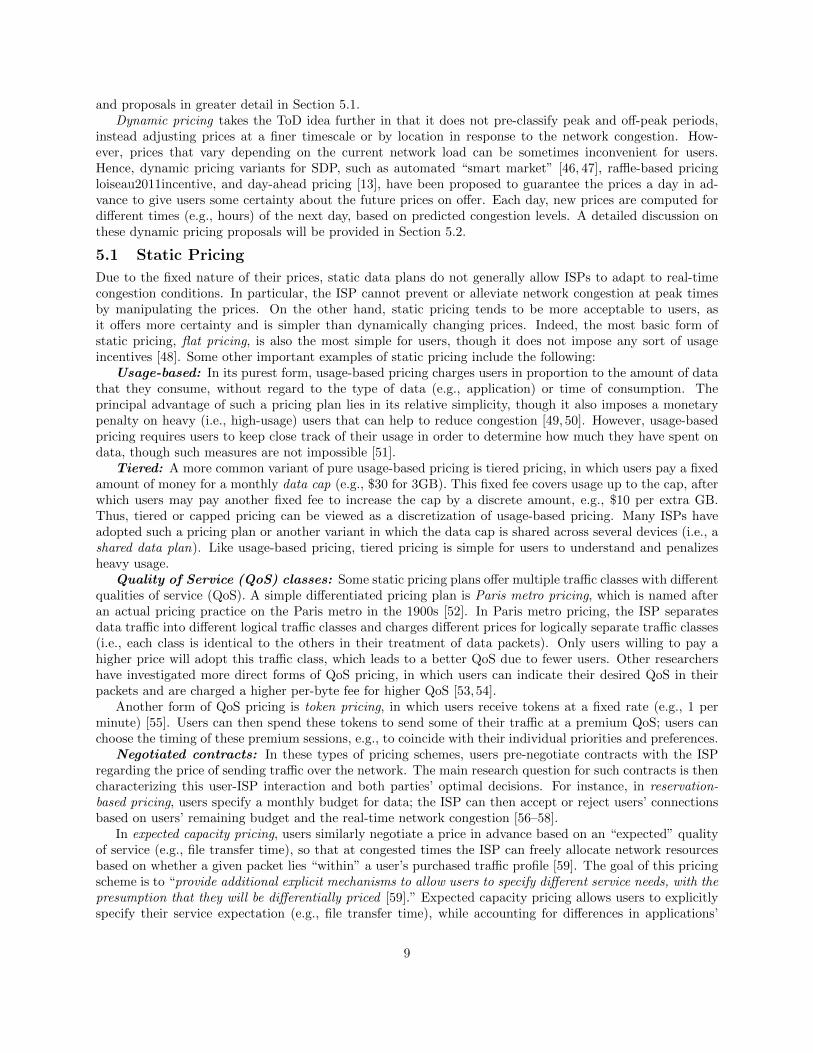
Figure 4: Feedback loop schematic of day-ahead pricing.
times. They are entered into a lottery for a fixed reward, where the probability of winning the lotterydepends on the user’s contribution to the total amount of traffic shifted.
Real-time congestion: When ISPs monitor their network for real-time signs of congestion, they canimmediately increase prices when congestion is observed, and decrease them when the traffic load is relativelylight. Thus, there is a feedback loop between ISPs offering prices and users correspondingly adjusting theirusage [64,65]. This responsive pricing sets prices so as to keep user demand under a certain level; if an ISPfurther chooses the prices so as to optimize a proportional fairness criterion on the amount of bandwidthallocated to different users, we obtain proportional fairness pricing [66, 67]. Many variants of responsivepricing have been proposed in the literature, principally as a congestion control mechanism; in practice, itwould be impractical for users to manually respond to the prices offered for each Internet connection. Hence,automation of the client devices to intelligently adapt their data consumption will be necessary to realizesuch real-time pricing.
Another form of congestion pricing, effective bandwidth pricing, incorporates a form of “QoS” by chargingusers based on their connection’s peak and mean rates [68]. One can also explicitly incorporate different QoSby using priority pricing, in which users can pay less by accepting a longer delay at congested times [69]. Ifthe prices are chosen correctly, the system reaches an equilibrium, in which each user’s packets are processedwithin the delay paid for.
Auction-based: One disadvantage of real-time congestion pricing is that in practice, the iSP must setthe prices (just) before observing user behavior. Since user demand can change with time, the ISP mayend up setting non-optimal prices due to outdated assumptions of user demand. “Smart market” pricingaddresses this slight delay with an auction-like scheme, in which users attach a bid to their packets thatsignifies their willingness to pay [46,47]. ISPs then admit a limited number of packets in descending order ofthe bids so as to limit network congestion. Users are charged the lowest bid admitted, which represents the“cost of congestion.” While smart market pricing allows true real-time pricing, it also requires automatedagents on user devices to make bids as necessary and keep track of the final amount charged.
Day-ahead time-dependent: In an effort to increase user certainty of the prices, ISPs can guaranteetheir time-dependent prices one day in advance, and continue to compute new prices to maintain this slidingone-day window of known prices [13, 70]. Users can then plan their usage in advance, while ISPs can adapttheir estimates of user behavior and usage volume in calculating the prices for subsequent days. Day-aheadpricing thus strikes a balance between user convenience and ISP adaptability. A schematic of the resultingfeedback loop is shown in Figure 4. In the next section, we examine a prototype of day-ahead pricing formobile data in order to illustrate the “end-to-end” nature of an SDP deployment.
11

5.3 Comparison with other Markets: Similarities and Differences
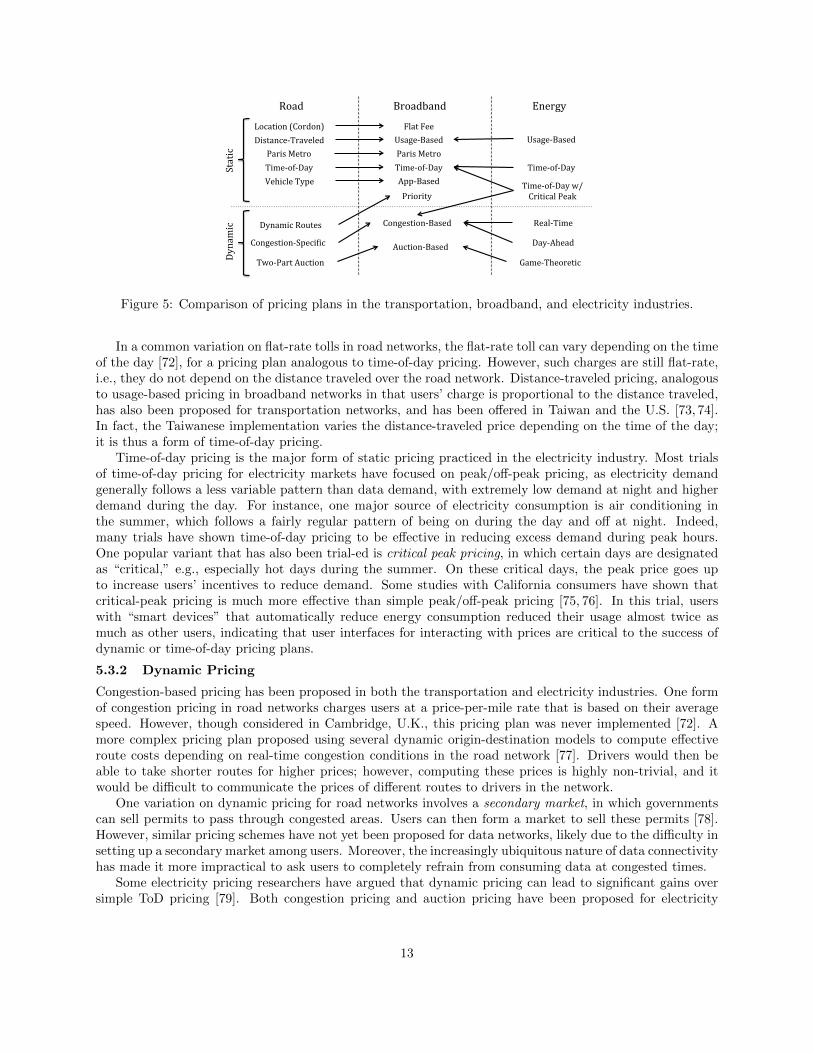
Much like today’s data networks, the electricity and transportation markets have both experienced a capacityshortage over the past decade and have developed new pricing plans to cope with the resulting shortfall.By comparing electricity usage and road traffic to data traffic, we see that these industries are quite similarto data networks, and that their pricing plans may inform SDP for data networks. Indeed, both industriesobserve a highly variable demand throughout the day, allowing for both static and dynamic pricing plansmuch like those proposed for data networks. In particular, time-of-day road tolls have been offered in manytransportation networks, and many electricity utilities have both trial-ed and deployed time-of-day pricing.We give an overview of such pricing plans in this section, with the aim of highlighting the unique challengesposed by refining such pricing plans to accommodate broadband data networks. Figure 5 gives an overviewof the analogies between pricing plans proposed for the transportation, broadband, and electricity industries.
The similarities and differences between these pricing plans reflect the different industries for which theyare designed. In particular, we observe the following distinctions:
1. Real-time communication: User devices on data networks, e.g., smartphones, are capable of real-time communication with the ISP network, for instance if the prices change in real time. But suchreal-time feedback for price (toll) changes in road networks are harder to realize and will requireadditional infrastructural support. However, in electricity markets new smart grid interfaces have beendeveloped that can display real-time prices, but individual devices, e.g., air conditioners or vacuumcleaners, generally cannot interact directly with the provider smart grid and require a smart energycontroller to schedule their energy consumption.
2. Elasticity of demand: Smartphones’ ability to communicate with the ISP network in real time iscomplemented by users’ ability to easily control their usage on individual devices and applications.For instance, a user could simply stop streaming a video if the price increases; such measures couldalso be automated within the device. The users’ decisions will reflect the large variance in the demandelasticity of different types of applications (some of which, such as software downloading, P2P, filebackup may not even require user participation and can be completed in small chunks whenever lowprices are available). In contrast, devices on electricity networks typically consume energy constantlyas long as they are active. There is little opportunity for various devices (e.g., washer, dryer, lights)of completing their activities in an intermittent manner without requiring active user engagement. Inroad networks, the contrast is even more stark; users in the network (e.g., already driving) cannoteasily exit or postpone their activity.
3. Long-term volatility: Most people do not have a concrete idea of how much data they consumeeach month, partly because most data plans charged a flat fee for unlimited access until recently.Moreover, an individual’s data usage can vary greatly from day to day, as relatively casual actions suchas streaming a video can have a large impact on total data consumption. In contrast, most peoplehave a relatively good idea of how much they drive per day, and the distance traveled, and road tollfees. Thus, people may be more able to plan ahead by buying permits (e.g., EZ pass) or carpoolingduring congested hours. In electricity markets, household demand similarly does not vary much fromday to day. Consumption of electricity is largely driven by user needs, rather than the more volatilepreferences that drive demand for Internet data.
5.3.1 Static Pricing
Traditional road pricing has been simple flat-rate cordon pricing, analogous to flat pricing of data. Pricingby vehicle type, analogous to app-based pricing for data, has also been proposed, e.g., charging trucks morethan passenger vehicles [71]. Forms of flat-rate priority pricing have also been implemented, most obviouslyin the Paris metro’s pricing scheme from which data networks’ Paris metro pricing takes its name. High-occupancy vehicle or “carpool” lanes can also been seen as analogous to priority pricing, in that users canself-select to take advantage of less-congested HOV lanes by paying the higher “price” of carpooling withother passengers.
12
Road Broadband Energy
Static
Dynamic
Flat Fee
Congestion-‐Based
Two-‐Part Auction
App-‐Based Time-‐of-‐Day
Priority
Paris Metro Usage-‐Based
Location (Cordon)
Vehicle Type Time-‐of-‐Day Paris Metro
Distance-‐Traveled
Congestion-‐SpeciHic Auction-‐Based
Real-‐Time
Time-‐of-‐Day
Time-‐of-‐Day w/ Critical Peak
Game-‐Theoretic
Dynamic Routes
Usage-‐Based
Day-‐Ahead
Figure 5: Comparison of pricing plans in the transportation, broadband, and electricity industries.
In a common variation on flat-rate tolls in road networks, the flat-rate toll can vary depending on the timeof the day [72], for a pricing plan analogous to time-of-day pricing. However, such charges are still flat-rate,i.e., they do not depend on the distance traveled over the road network. Distance-traveled pricing, analogousto usage-based pricing in broadband networks in that users’ charge is proportional to the distance traveled,has also been proposed for transportation networks, and has been offered in Taiwan and the U.S. [73, 74].In fact, the Taiwanese implementation varies the distance-traveled price depending on the time of the day;it is thus a form of time-of-day pricing.
Time-of-day pricing is the major form of static pricing practiced in the electricity industry. Most trialsof time-of-day pricing for electricity markets have focused on peak/off-peak pricing, as electricity demandgenerally follows a less variable pattern than data demand, with extremely low demand at night and higherdemand during the day. For instance, one major source of electricity consumption is air conditioning inthe summer, which follows a fairly regular pattern of being on during the day and off at night. Indeed,many trials have shown time-of-day pricing to be effective in reducing excess demand during peak hours.One popular variant that has also been trial-ed is critical peak pricing, in which certain days are designatedas “critical,” e.g., especially hot days during the summer. On these critical days, the peak price goes upto increase users’ incentives to reduce demand. Some studies with California consumers have shown thatcritical-peak pricing is much more effective than simple peak/off-peak pricing [75, 76]. In this trial, userswith “smart devices” that automatically reduce energy consumption reduced their usage almost twice asmuch as other users, indicating that user interfaces for interacting with prices are critical to the success ofdynamic or time-of-day pricing plans.
5.3.2 Dynamic Pricing
Congestion-based pricing has been proposed in both the transportation and electricity industries. One formof congestion pricing in road networks charges users at a price-per-mile rate that is based on their averagespeed. However, though considered in Cambridge, U.K., this pricing plan was never implemented [72]. Amore complex pricing plan proposed using several dynamic origin-destination models to compute effectiveroute costs depending on real-time congestion conditions in the road network [77]. Drivers would then beable to take shorter routes for higher prices; however, computing these prices is highly non-trivial, and itwould be difficult to communicate the prices of different routes to drivers in the network.
One variation on dynamic pricing for road networks involves a secondary market, in which governmentscan sell permits to pass through congested areas. Users can then form a market to sell these permits [78].However, similar pricing schemes have not yet been proposed for data networks, likely due to the difficulty insetting up a secondary market among users. Moreover, the increasingly ubiquitous nature of data connectivityhas made it more impractical to ask users to completely refrain from consuming data at congested times.
Some electricity pricing researchers have argued that dynamic pricing can lead to significant gains oversimple ToD pricing [79]. Both congestion pricing and auction pricing have been proposed for electricity
13
markets; however, such works often have a more consumer-focused outlook than do pricing proposals fordata.
In an auction-based electricity market, electricity distributors can make dynamic offers to users (i.e.,households) who respond with real-time electricity purchases. Auction schemes have been proposed thattake into account varying electricity capacity, which can significantly improve market efficiency [80].
Many papers have studied responsive dynamic pricing from a user’s perspective of predicting future pricesand scheduling devices accordingly. A game-theoretic framework can be used to model users’ scheduling ofenergy usage as a cooperative game; if users cooperate, the total demand on a network can then be reduced,enhancing efficiency [81]. Other works propose algorithms to predict prices in advance [82,83] and scheduleuser devices accordingly; users thus try to anticipate electricity providers’ real-time pricing. This priceprediction is not necessary with day-ahead pricing, though day-ahead pricing offers electricity providers lessflexibility [84]. However, such prediction and scheduling algorithms, which have received relatively littleattention for data usage, might help make dynamic congestion pricing for data more amenable to users.
Other papers consider users’ actions in conjunction with the provider’s price determination [85]. Suchapproaches can facilitate a study of social welfare, and may incorporate uncertainty in supply and demand[86–88]. One may also consider a feedback loop between users and an electricity provider, which can yield real-time pricing algorithms analogous to those for dynamic congestion control in data networks [89]. Some workshave also considered appliance-specific models of user demand, analogous to different applications havingdifferent demands for data [90]. A unique feature of these models is the ability to store electricity, e.g., inbatteries, for use in later congested periods. Thus, from the provider’s perspective, the user can effectivelyshift his or her energy consumption to less congested times, even though from the user’s perspective nothinghas been shifted.
6 Economics of SDPGiven the wide variety of SDP pricing algorithms presented in Section 5, a thorough discussion of the theorybehind each one is impractical for a book chapter. In this section, we instead select four representativescenarios to illustrate some of the key economic principles often used in formulating different types of pricingalgorithms. We first consider static pricing on a single link, and then consider both real-time dynamic pricingand day-ahead time-dependent pricing.
6.1 Usage-Based Pricing: A Single Link Example
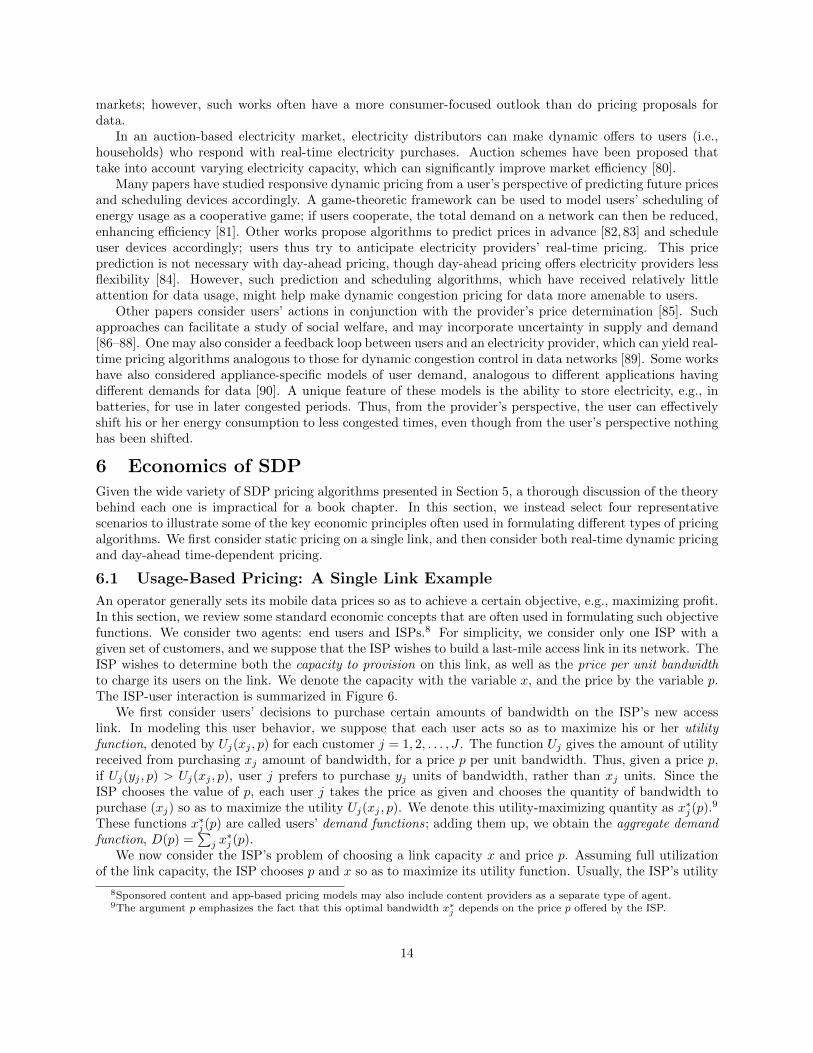
An operator generally sets its mobile data prices so as to achieve a certain objective, e.g., maximizing profit.In this section, we review some standard economic concepts that are often used in formulating such objectivefunctions. We consider two agents: end users and ISPs.8 For simplicity, we consider only one ISP with agiven set of customers, and we suppose that the ISP wishes to build a last-mile access link in its network. TheISP wishes to determine both the capacity to provision on this link, as well as the price per unit bandwidthto charge its users on the link. We denote the capacity with the variable x, and the price by the variable p.The ISP-user interaction is summarized in Figure 6.
We first consider users’ decisions to purchase certain amounts of bandwidth on the ISP’s new accesslink. In modeling this user behavior, we suppose that each user acts so as to maximize his or her utilityfunction, denoted by Uj(xj , p) for each customer j = 1, 2, . . . , J . The function Uj gives the amount of utilityreceived from purchasing xj amount of bandwidth, for a price p per unit bandwidth. Thus, given a price p,if Uj(yj , p) > Uj(xj , p), user j prefers to purchase yj units of bandwidth, rather than xj units. Since theISP chooses the value of p, each user j takes the price as given and chooses the quantity of bandwidth topurchase (xj) so as to maximize the utility Uj(xj , p). We denote this utility-maximizing quantity as x∗j (p).
9
These functions x∗j (p) are called users’ demand functions; adding them up, we obtain the aggregate demandfunction, D(p) =
∑j x∗j (p).
We now consider the ISP’s problem of choosing a link capacity x and price p. Assuming full utilizationof the link capacity, the ISP chooses p and x so as to maximize its utility function. Usually, the ISP’s utility
8Sponsored content and app-based pricing models may also include content providers as a separate type of agent.9The argument p emphasizes the fact that this optimal bandwidth x∗
j depends on the price p offered by the ISP.
14

Pro
fit
x S(p) = x*(p)
Maximize profit px – c(x)
!"#$%&"'(#)$%*"#'
S(p) D(p)
p (price)
x (
ba
nd
wid
th)
p*
x*
Marketplace
Equilibrium
capacity Equilibrium price
Social Welfare
W = p*x* - c(x*) + U1(x*,p*) + ! + UN(x*,p*)
Utilit
y
x x1*(p)
Maximize utility U1(x,p)
Utilit
y
x xN*(p)
Maximize utility UN(x,p)
D(p) !
Users i = 1,!,N
Add demands
+,*%$%*-./'01"#1'
Figure 6: User-ISP interaction in a mobile data marketplace.
is simply its profit, but other functions can be used. We write the ISP profit as px − c(x), where px is theISP revenue and the function c(x) denotes the cost of building a link of capacity x. Given p, the ISP canthen find x∗(p), the optimal link capacity as a function of the price p. We use S(p) = x∗(p) to denote thissupply function.
When the user and ISP are at a market equilibrium, supply equals demand: D(p) = S(p). At such aprice p∗, each user maximizes his or her own utility by purchasing x∗j (p∗) amount of bandwidth, and theISP maximizes its utility by providing just enough capacity x∗ (p∗) =
∑j x∗j (p∗) to support those users’
demands.Having derived the equilibrium price and capacity, we can now analyze properties of this solution. One
of the most common is to compute the social welfare, defined as the sum of the utility received by all usersj and the ISP, i.e., ∑
j
Uj(x∗j , p
∗)+ p∗∑j
x∗j − c
∑j
x∗j
,
where x∗j is understood to be evaluated at the equilibrium price p∗. This social welfare can be divided intotwo portions: the user surplus, or the sum of user utilities, and the ISP surplus, or the utility (here, profit)obtained by the ISP. Depending on the utility functions Ui and the cost function c, the total social welfaremay change, and the users and ISP may receive different portions of the overall social welfare.
Before moving on, we pause to discuss some of the more common extensions of the simple problem above.One is to introduce budget constraints on each user’s utility maximization problem: the user may not wantto spend more than a certain amount Bj , in which case each user j maximizes the utility Uj(xj , p) subjectto the constraint pxj ≤ Bj . We may also consider a situation in which users impose externalities on eachother, i.e., a given user j’s utility is affected by the capacity allocated to other users i 6= j. For instance,there may be a positive externality in which user j’s utility increases as other users send traffic over the linkin order to interact with user j. On the other hand, one could also observe negative externalities, in whichcongestion from other users’ traffic diminishes a particular user’s utility, e.g., by increasing delay.
When solving for the supply function S(p), we assumed that the ISP chose an optimal capacity x∗,given a price p. The equilibrium solution occurs when supply equals demand at the same price p. Yet onecan in fact obtain the same solution using a slightly different route: suppose that the ISP, knowing users’demand functions x∗j (p), calculates its revenue as a function of price to be p
∑x∗j (p) (the price, multiplied
15

by the user demand as a function of price). The ISP can then choose both p and x so as to maximize itsprofit p
∑j x∗j (p) − c(x), subject to the constraint that the link capacity be able to accommodate users’
total demand∑j x∗j , i.e., that x ≥
∑j x∗j . It is easy to see that (assuming the cost c(x) is increasing in
the capacity x), at the optimum, x =∑j x∗j . The ISP then chooses the optimal price p so as to maximize
p∑j x∗j (p)− c
(∑j x∗j (p)
). One can show that the resulting optimal price, which we will call p, is the same
equilibrium price p∗ obtained above: at p, each user j demands x∗j (p), and the ISP chooses its optimalcapacity x∗(p). This is exactly the point at which the supply and demand curves intersect, i.e., p∗.
The above reasoning, in which an ISP chooses a price to offer subject to users’ behavior as a functionof the price chosen, is a simple example of a game between users and ISPs. In such a game, several playersinteract with each other, and each player acts to maximize his or her own utility, which may be influencedby other players’ decisions. For instance, in this scenario, users interact with the ISP by utilizing the accesslink in its network and paying some price. Their decisions on how much capacity to utilize (i.e., choosingx∗j ) are influenced by the ISP’s choice of the price p. This interpretation of the single-link example leads usto next consider some basic principles of game theory in relation to SDP.
6.2 Incentive Compatibility: Game-Theoretic Principles
To illustrate some of the basics of game theory, we again consider the single link example above. The user-ISP interaction in such a scenario is an example of a Stackelberg game, in which one player, the “leader,”makes a decision (e.g., the ISP sets a unit price p for link capacity) and the remaining players, or “followers,”then make their own decisions based on the leader’s actions. In this example, users choose their demandsx∗j (p), given the ISP’s price p. Stackelberg games, which often arise in user-ISP interactions, may be solvedusing backwards induction: first, one computes the followers’ actions as a function of the leader’s decision (inour example, we compute the functions x∗j (p)). The followers’ actions are sometimes called a best responseto the leader. The leader then takes these actions into account and makes his or her own decision (giventhat users’ demands are x∗j (p), the ISP chooses the optimal price p). This decision is then the best responseto the followers.
The backwards induction process leads to a subgame perfect equilibrium in the Stackelberg game: at thisequilibrium, each player is maximizing his or her own utility, and no player has an incentive to change hisor her behavior. To formalize this definition, we will need to first explain the concept of a Nash equilibrium.Consider a general game with n users, each of whom can take an action, e.g., by choosing the value of avariable yj ; j = 1, 2, . . . , n; and suppose that each user j’s utility Vj is a function of all of the yj variables,i.e., Vj = Vj (y1, y2, . . . , yn). Then a set of actions z1, . . . , zn is a Nash equilibrium if Vj (z1, . . . , zj , . . . , zn) ≥Vj (z1, . . . , yj , . . . , zn) for any yj 6= zj . In other words, assuming that all the other players take actions zi,player j’s action zj optimizes its utility Vj .
We may generalize the concept of a Nash equilibrium to a Stackelberg game’s subgame-perfect equilibriumby considering subgames of the Stackelberg game. We do not give the general definition of a subgame here,but it may be understood by envisioning the Stackelberg game as a dynamic game with different levels definedby the time of decision: on the first level, users make their decisions, and on the second, ISPs make theirdecisions. A subgame encompasses a group of players who mutually interact, but do not directly interactwith other players at their level. In our scenario, a subgame would be a combination of users and the ISP.A subgame-perfect equilibrium of the full Stackelberg game is then a set of actions that comprise a Nashequilibrium in each subgame of the full game. It can be shown that any equilibrium found from backwardsinduction is a subgame-perfect equilibrium; one can easily check that this is the case in our example scenario.Nash and subgame-perfect equilibria are considered stable in that once they have been achieved, no userhas an incentive to change their behavior. (Unfortunately, one cannot in general guarantee that such anequilibrium will be achieved in the first place, and a game may have multiple Nash equilibria.)
Another type of game that often arises in SDP is that of competing service providers. For instance,we may have an oligopoly of a few companies who dominate the market for mobile data, e.g., AT&T andVerizon in the United States are the dominant market players. Each of these companies then competes forcustomers (i.e., market share) and revenue with the others. This competition defines their interactions, andeach company can try to make strategic decisions that optimize its market share. Given a mathematical
16
model of the companies’ actions, one can then try to study the corresponding game, e.g., by computingpossible Nash equilibria.
While certainly useful for explicit pricing problems like that considered above, game theory can also beapplied to more general resource allocation problems. To illustrate these uses, we again consider the singlelink example, but we now suppose that the link’s capacity is fixed and that the ISP wishes to allocate thisfixed amount of capacity x among its n users.
If users selfishly maximize their individual utilities (i.e., choose demands x∗j (p)), then the ISP can seta virtual price p to force an allocation in which
∑j x∗j (p) = x, i.e., all of the available capacity is utilized,
and each user maximizes his or her utility. This price is not actually collected by the ISP, but serves as asignal through which the ISP can control users’ demands. However, such an allocation may be unfair: veryprice-sensitive users may be able to afford significantly less capacity than others. Since revenue is no longerinvolved, the ISP can afford to care about other objectives like fairness. Indeed, a vast literature exists onjust such a problem; we will not go into fairness theory here, but we will present one approach inspired bygame theory.
In the Stackelberg game discussed above, users did not cooperate: each user maximized only his or herown utility, subject to the ISP’s offered price. Yet if users do cooperate, they may reach a better decision.We can study this problem by first defining individual users’ utilities Uj(yj); given a capacity amount yj ,each user j derives utility Uj(yj). For instance, users could jointly choose their demands yj , subject tothe capacity constraint
∑j yj ≤ x, so as to maximize an overall utility function U (U1(y1), . . . , Un(yn)).
Depending on the choice of U , of course, one would obtain different allocations y∗j . We use y∗j to denote theyj that jointly maximize U . Nash proposed that the y∗j satisfy the following four axioms:
1. Invariant to affine transformations: For each user j, define the utility function Vj(yj) = αjUj(yj) +βjfor some constants αj > 0, βj . Then the allocation
{z∗j}
maximizing U (V1(z1), . . . , Vn(zj)) satisfies
Vj(z∗j)
= αjUj(y∗j)
+ βj for each user j, where the allocation{y∗j}
maximizes U (U1(y1), . . . , Un(yn)).An affine transformation of the utility functions Uj does not change the utility received at the optimalallocation.
2. Pareto-optimality: An allocation {y∗1 , . . . , y∗n} is Pareto-optimal if for any user j, any feasible allocation{z1, . . . , zn} with Uj(zj) > Uj
(y∗j)
satisfies Ui(zi) < Ui (y∗i ) for some user i. In other words, no usercan be made better off without making another worse off.
3. Independence of irrelevant alternatives: Suppose that U (U1(y1), . . . , Un(yn)) > U (U1(z1), . . . , Un(zn))for two feasible allocations {yj} and {zj}. Then if the problem constraints are relaxed to allow newfeasible allocations, we still have U (U1(y1), . . . , Un(yn)) > U (U1(z1), . . . , Un(zn)).
4. Symmetry: Suppose that {y1, . . . , yn} and {z1, . . . , zn} are feasible capacity allocations with Uj1(yj1) =Uj2(zj2) for some users j1 and j2, Uj2(yj2) = Uj1(zj1), and Uj(yj) = Uj(zj) for all j 6= j1, j2. ThenU (U1(y1), . . . , Un(yn)) = U (z1, . . . , zn). In other words, switching the order of the utilities receiveddoes not change the overall utility U .
An allocation satisfying these four axioms is said to be a Nash bargaining solution. One can show that ifU is taken to be
∏j Uj(yj), then the resulting y∗j is a Nash bargaining solution. Taking the logarithm, we
see that this is equivalent to maximizing∑j log (Uj(yj)). In other words, users choose their demands to
maximize the sum of the logarithms of their utilities Uj . Since the logarithm is sub-linear for large Uj(yj),the optimal allocation
{y∗j}
will penalize large values of Uj relative to smaller ones, yielding a “more equal”
allocation Uj(y∗j)
than simply maximizing the sum of utilities∑j Uj(yj).
6.3 Real-Time Dynamic Pricing
So far, we have focused on pricing and bandwidth allocation of a single access link. However, in realityan ISP’s network does not consist of single bandwidth links: it is, in fact, a network, with multiple nodesand links between them. Data traffic between two nodes, e.g., between a user and a content provider, flowsacross a subset of the network links. Since different links may experience different types of congestion at
17
different times, an ISP may want to adjust the prices charged based on how much congestion is experiencedby a particular user at a given time. It is this philosophy that lies behind dynamic pricing for congestioncontrol.
To illustrate the basic concepts of congestion control, we consider a relatively simple example given inKelly et al.’s seminal paper on the subject [67]. Consider a set of nodes, indexed by n = 1, 2, . . . , N , and aset of links indexed by l = 1, 2, . . . , L that connect different nodes together. We suppose that each node nwishes to communicate with another node, and we use Rn to denote the subset of links traversed by noden’s traffic.10 The ISP’s goal is then to set a traffic rate xn for each node n, such that 1) the total amount oftraffic on any link l lies below link l’s capacity cl, and 2) all users are as satisfied as possible. To accomplishthis, each link can set a unit congestion price for traffic on the link. By prescribing the evolution of theseprices in time, the ISP can satisfy its two objectives in a distributed manner.
We first define a routing matrix to summarize the routes taken by different nodes’ traffic over the network:let R be an L × N matrix, and set Rln = 1 if l ∈ Rn, i.e., node n’s traffic travels over link l, and Rln = 0otherwise. If we concatenate nodes’ traffic rates xn into a vector ~x, we see that ~y = R~x yields a vector oflength L. Each entry yl of ~y equals the total volume of traffic on link l. Letting ~c be an L× 1 vector of thecapacities of each link l, we then have the capacity constraint R~x ≤ ~c: the total amount of traffic on eachlink l cannot exceed the link’s capacity.11 This constraint ensures that the ISP’s first objective is satisfied.
The ISP’s second objective is that each user be “as satisfied as possible.” We define satisfaction bydefining utility functions Un(xn) for each node n; the ISP is then assumed to assign source rates xn so as tomaximize the total sum of utilities,
∑n Un(xn), subject to the constraint R~x ≤ ~c. To solve this problem, we
next make the assumption that each utility function Un is concave. Such an assumption is consistent withthe economic principle of diminishing marginal utility, i.e., that the extra utility received from an additionalunit of bandwidth decreases as the user receives more and more bandwidth. Under this assumption, the ISP’sobjective function
∑n Un(xn) is concave. Since the constraints R~x ≤ ~c are linear, the overall optimization
problem is a convex optimization.We now follow standard optimization theory and introduce a L × 1 vector of Lagrange multipliers ~p,
with each pl corresponding to link l’s capacity constraint in the component-wise inequality R~x ≤ ~c. Thesemultipliers ~p will eventually become the congestion prices set by the links l. The ISP’s optimization problemis then equivalent to solving
min~p≥0
max~x
(N∑n=1
Un(xn) + ~pT (~c−R~x)
). (1)
Solving (1) centrally can be done relatively easily; it is not hard to see that we have the solution
x∗n = U ′n−1
(qn) , p∗l =
{0 if cl − yl > 0
> 0 ifcl − yl = 0,
where we define ~y = R~x and the nth entry of the N × 1 vector ~q = RT ~p equals the sum of the congestionprices for the links traversed by node n’s prices; qn thus represents the total price paid by user n. However,our goal is to develop a distributed solution, in which nodes adjust their rates xn and links adjust their pricespl so as to converge to the optimal solution. The ISP can drive these dynamics with the link prices–i.e.,links change their prices pl, and nodes respond by adjusting their rates xn according to the solution above.An example of a price-driven algorithm is [91]
pl(t+ 1) = [pl(t)− γ (yl(t)− cl)]+ , xn(t+ 1) = U ′n−1
(qn(t+ 1)) , (2)
where the argument t denotes the value of a variable at time t, and we consider discretized times t = 1, 2, . . ..The constant γ > 0 is a stepsize parameter, and the + superscript [α]
+denotes the maximum of a quantity
α and 0.12 We note that each link l evolves its price pl using only the traffic on that link yl(t) and its
10Choosing the optimal routes for each node n is a non-trivial problem in itself; for simplicity, we assume here that all of theroutes Rn are fixed.
11This inequality is to be interpreted component-wise, i.e., each component of the left-hand and right-hand side vectors shouldsatisfy it.
12This modification ensures that the prices are nonnegative.
18
capacity cl, both of which are known without communicating with other nodes or links. Similarly, eachnode n adjusts its rate xn based only its price qn, a quantity that can be carried with node n’s traffic andis known without node n communicating with other nodes or links. One can show that these dynamicsconverge to the optimal prices and rates if the stepsize γ is sufficiently small. Moreover, as user utilities Ujor link capacities cl change over time, following the dynamics (2) will reposition the rates and prices to theirnew optimal values. Thus, real-time dynamic pricing can adapt to network congestion levels and keep ISPtraffic from exceeding the network capacity. We explore some variations on this dynamic pricing model inthe next section.
6.4 Dynamic Time-Dependent Pricing
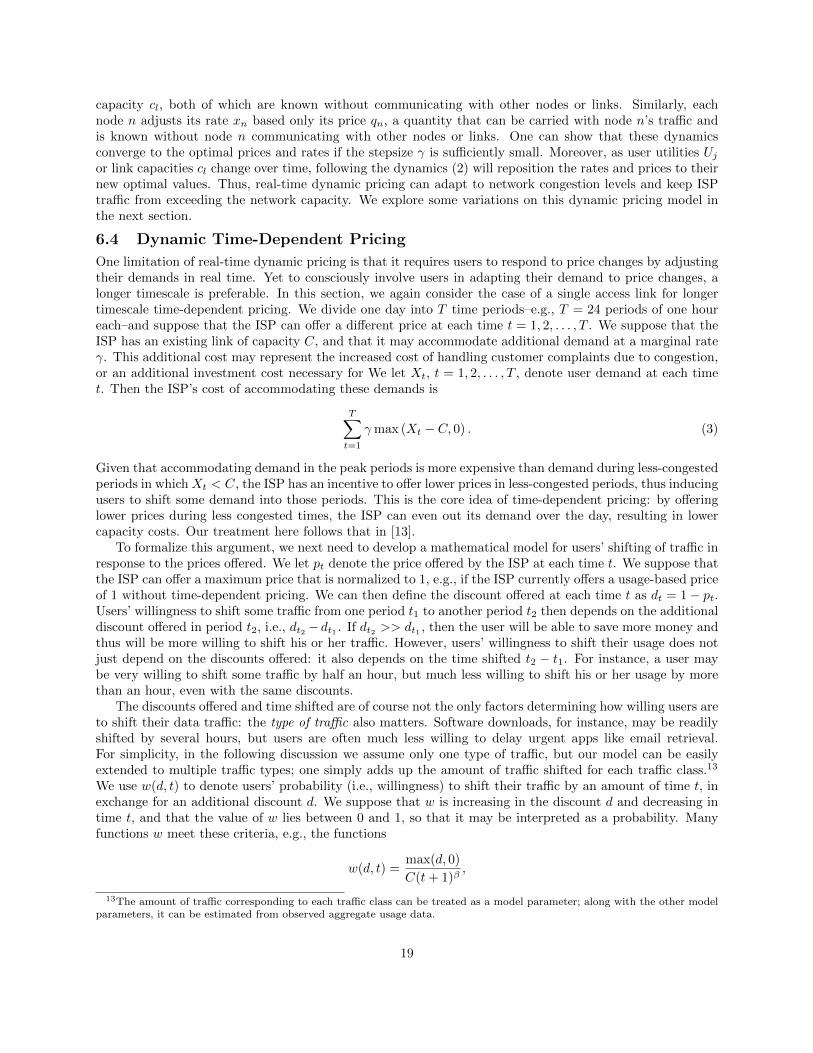
One limitation of real-time dynamic pricing is that it requires users to respond to price changes by adjustingtheir demands in real time. Yet to consciously involve users in adapting their demand to price changes, alonger timescale is preferable. In this section, we again consider the case of a single access link for longertimescale time-dependent pricing. We divide one day into T time periods–e.g., T = 24 periods of one houreach–and suppose that the ISP can offer a different price at each time t = 1, 2, . . . , T . We suppose that theISP has an existing link of capacity C, and that it may accommodate additional demand at a marginal rateγ. This additional cost may represent the increased cost of handling customer complaints due to congestion,or an additional investment cost necessary for We let Xt, t = 1, 2, . . . , T , denote user demand at each timet. Then the ISP’s cost of accommodating these demands is
T∑t=1
γmax (Xt − C, 0) . (3)
Given that accommodating demand in the peak periods is more expensive than demand during less-congestedperiods in whichXt < C, the ISP has an incentive to offer lower prices in less-congested periods, thus inducingusers to shift some demand into those periods. This is the core idea of time-dependent pricing: by offeringlower prices during less congested times, the ISP can even out its demand over the day, resulting in lowercapacity costs. Our treatment here follows that in [13].
To formalize this argument, we next need to develop a mathematical model for users’ shifting of traffic inresponse to the prices offered. We let pt denote the price offered by the ISP at each time t. We suppose thatthe ISP can offer a maximum price that is normalized to 1, e.g., if the ISP currently offers a usage-based priceof 1 without time-dependent pricing. We can then define the discount offered at each time t as dt = 1− pt.Users’ willingness to shift some traffic from one period t1 to another period t2 then depends on the additionaldiscount offered in period t2, i.e., dt2 −dt1 . If dt2 >> dt1 , then the user will be able to save more money andthus will be more willing to shift his or her traffic. However, users’ willingness to shift their usage does notjust depend on the discounts offered: it also depends on the time shifted t2 − t1. For instance, a user maybe very willing to shift some traffic by half an hour, but much less willing to shift his or her usage by morethan an hour, even with the same discounts.
The discounts offered and time shifted are of course not the only factors determining how willing users areto shift their data traffic: the type of traffic also matters. Software downloads, for instance, may be readilyshifted by several hours, but users are often much less willing to delay urgent apps like email retrieval.For simplicity, in the following discussion we assume only one type of traffic, but our model can be easilyextended to multiple traffic types; one simply adds up the amount of traffic shifted for each traffic class.13
We use w(d, t) to denote users’ probability (i.e., willingness) to shift their traffic by an amount of time t, inexchange for an additional discount d. We suppose that w is increasing in the discount d and decreasing intime t, and that the value of w lies between 0 and 1, so that it may be interpreted as a probability. Manyfunctions w meet these criteria, e.g., the functions
w(d, t) =max(d, 0)
C(t+ 1)β,
13The amount of traffic corresponding to each traffic class can be treated as a model parameter; along with the other modelparameters, it can be estimated from observed aggregate usage data.
19

where C is a normalizing factor and β ≥ 0 is a model parameter that controls the rate at which willingnessto shift decreases with the time shifted t. For larger values of β, the willingness to shift decays faster withtime, denoting increased impatience.
Given the functions w, the expected amount of traffic shifted from time t1 to time t2 is
w (dt2 − dt1 , |t2 − t1|T ) ,
where |t2 − t1|T denotes the number of periods between time t2 and period t1, modulo the number of periodsT (e.g., if t2 < t1, then |t2 − t1|T is the number of periods between period t1 and period t2 on the next day).Given an initial amount of traffic Yt in each period t, we calculate that Yt1w (dt2 − dt1 , |t2 − t1|T ) amountof traffic is shifted from time t1 to time t2. The ISP then loses (dt2 − dt1)Yt1w (dt2 − dt1 , |t2 − t1|T ) amountof revenue due to the traffic shifted from time t1 to t2. Some additional revenue is lost from the unshiftedtraffic in each period, for a total revenue loss of
T∑t=1
Ytdt +∑s6=t
Ys (dt − ds)w (dt − ds, |t− s|T )
. (4)
In addition to this revenue loss, offering discounts at some times may induce users to increase their overallusage during those time periods, in a “sales day effect.” The larger the discount offered dt, the larger thisincrease will be. We can model this increase with a power law: given an initial amount of traffic Yt inperiod t, the amount of traffic after a discount dt is offered (neglecting any traffic shifted to other periods)is Yt (1 + dt)
αfor some positive model parameter α. We then have the desirable property that demand does
not change if no discount is offered (dt = 0); if α = 0, the total demand does not depend on the discount atall. The ISP thus earns additional revenue
Yt ((1 + dt)α − 1) (1− dt) (5)
due to this additional demand in period t. We can then add the ISP’s revenue loss from discounts offered(4), less the revenue gain (5) from additional traffic, to the ISP’s cost of capacity (3) to obtain the objectivefunction
T∑t=1
Ytdt − Yt ((1 + dt)α − 1) (1− dt) +
∑s6=t
Ys (dt − ds)w (dt − ds, |t− s|T ) + γmax (Xt − C, 0)
,where the total traffic at each time t is
Xt = Yt (1 + dt)α
+∑s6=t
Ysw (dt − ds, |t− s|T )−∑s 6=t
Ytw (ds − dt, |s− t|T ) .
The first term represents the increase in traffic due to the discount, while the second is the amount of trafficdeferred into period t, and the third term the amount of traffic deferred out of period t. The ISP thenchooses the discounts dt (equivalently, the prices pt = 1 − dt) to minimize its objective function. Undercertain reasonable conditions on α, γ, and w, this is a convex optimization problem, which may be rapidlysolved.
By solving this optimization problem, the ISP can obtain a set of prices for one day; it can then offerday-ahead pricing by running an optimization in each period that determines the optimal discount to offerone day from the current time. Moreover, the ISP can observe the traffic consumed in each period once thesediscounts are offered. Comparing this data to the traffic observed without discounts, the ISP can estimatethe parameters of its user behavior models (i.e., α and w above) from the observed changes in usage, giventhe prices offered. These estimates can be periodically updated and used to calculate new prices, completinga feedback loop (cf. Figure 4) between users and the ISP.
20

7 Engineering of SDP: A Trial StudyWhile pricing algorithms are essential to SDP research, in practice such algorithms must be able to functionwithin an ISP network. In this section, we discuss the design and results of a trial of Section 6.4’s day-aheadtime-dependent pricing (TDP) to highlight some ways in which implementability concerns can influence thedevelopment of pricing algorithms. We examine some important system and user interface design principlesthat were used in developing the prototype of this system, called TUBE, and finally present some trialresults that illustrate how these elements can come together in practice. While some SDP trials have beenconducted in the past, e.g., the Berkeley INDEX project in the 1990s [92], the design of this TUBE pilottrial illustrates the way new factors such as smartphones’ computing capabilities affect SDP’s feasibility.
7.1 Model Considerations
Most forms of dynamic pricing, in which prices must be determined in (near) real-time, require the prices toadapt based on users’ behavior. For instance, users’ perception of the prices offered may change over time,and demographically distinct user populations may react differently to the same set of prices (e.g., teenagersversus businessmen). Offering dynamic pricing thus requires that the ISP first estimate its users’ behaviorand then use this to inform its choice of prices. In the case of time-dependent pricing, such estimates areparticularly important. The basic philosophy of TDP is that by offering lower prices at less congested times,an ISP incentivizes users to shift some of their usage from more expensive, congested times to less congestedtimes. Users’ demand over the day is thus even-ed out, with peak usage decreasing; this decrease in peakusage then reduces ISPs’ need to over-provision capacity for their peak demand. While lower prices wouldeffectively encourage users to shift their demand, thus reducing costs, ISPs would also lose a large amountof revenue if the prices were too low. Moreover, users might shift their usage too much, and end up creatinga new peak period during the discounted times.
In practice, these estimates of user behavior must take into account the available information that theISP can collect from its users. For instance, TUBE’s TDP algorithms, discussed in Section 6.4, use onlyaggregate usage data, that is, the total usage volume on the network at different times, in order to estimateuser behavior and calculate the prices. This approach has the following benefits:
• Scalability: Since only aggregate usage is recorded and used in the algorithms [13], we can scale upthe user behavior and price computations to multiple users and multiple applications. The algorithmcomplexity does not increase with the number of users contributing to the aggregate usage totals.
• User privacy: The amount of traffic that an individual consumes for different applications can besensitive information (e.g., unusually large amounts of streaming video might reveal a movie buff).The TUBE algorithm does not consider application-specific usage, so the ISP need not receive orrecord such sensitive information.
• Utility function estimation: Utility function estimation is usually a hard problem. When temporal con-siderations are involved, it can potentially become even more complicated, as the utility of consumingdata at any given time depends on the prices offered at all times of the day.
• Empirical observations: Instead of using utility functions, we can model users’ willingness to shift theirdemand from one period to another, depending on the time elapsed between these periods and theprice difference. Such usage shifts can be directly observed by comparing the amount used at differenttimes and prices, and the model can then adapt as these observed shifts change over time.
By following these principles, we develop a scalable price calculation and user behavior estimation algorithm(see Section 6.4 and [13] for details) that can be feasibly deployed in a real system.
7.2 System Design
A core feature of SDP, and time-dependent pricing in particular, is that it involves both end users and ISPs.Thus, the system design must have components both on ISP servers and on user devices. Figure 7 shows thisdivision of functionality and the requisite communication channels between the user device and ISP server.In order to make the system practical, we follow three basic principles:
21
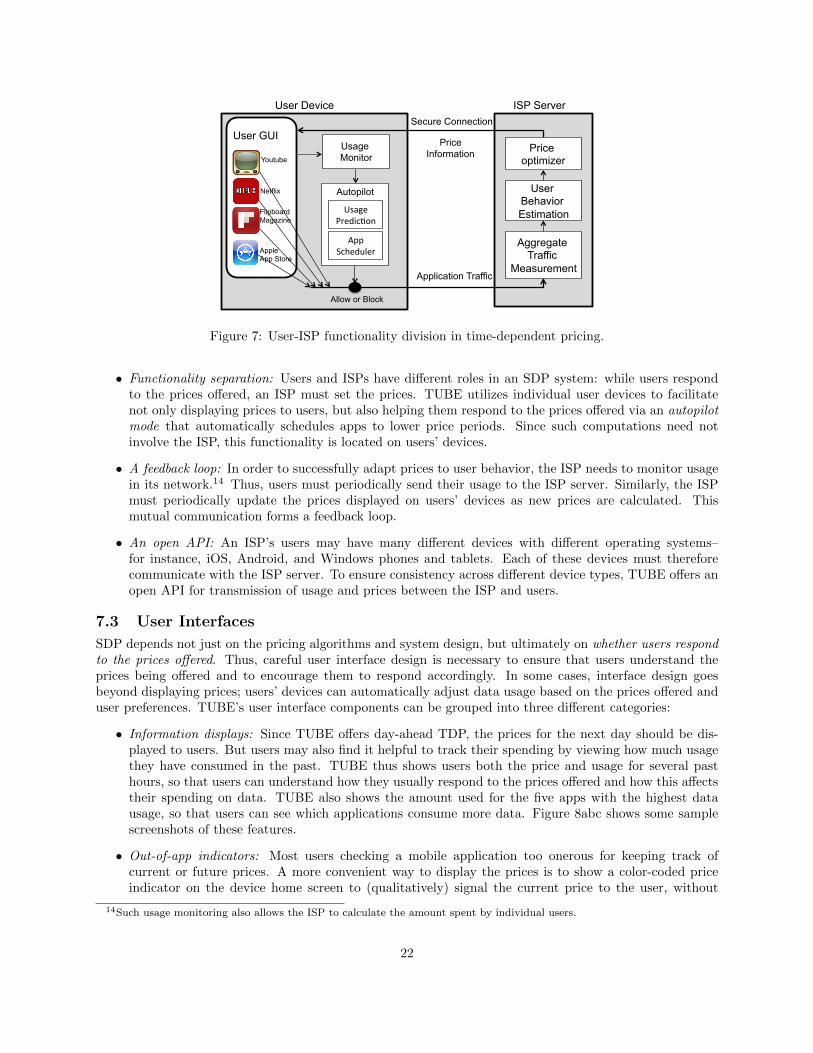
User Device
Autopilot
Youtube
Flipboard Magazine
Netflix
Apple App Store
Usage Monitor
User GUI
ISP Server
Aggregate Traffic
Measurement
Allow or Block
Price Information
Application Traffic
Secure Connection
User Behavior Estimation
Price optimizer
!"#$%&'(%)*+,-.&
/00&1+2%)34%(&
Figure 7: User-ISP functionality division in time-dependent pricing.
• Functionality separation: Users and ISPs have different roles in an SDP system: while users respondto the prices offered, an ISP must set the prices. TUBE utilizes individual user devices to facilitatenot only displaying prices to users, but also helping them respond to the prices offered via an autopilotmode that automatically schedules apps to lower price periods. Since such computations need notinvolve the ISP, this functionality is located on users’ devices.
• A feedback loop: In order to successfully adapt prices to user behavior, the ISP needs to monitor usagein its network.14 Thus, users must periodically send their usage to the ISP server. Similarly, the ISPmust periodically update the prices displayed on users’ devices as new prices are calculated. Thismutual communication forms a feedback loop.
• An open API: An ISP’s users may have many different devices with different operating systems–for instance, iOS, Android, and Windows phones and tablets. Each of these devices must thereforecommunicate with the ISP server. To ensure consistency across different device types, TUBE offers anopen API for transmission of usage and prices between the ISP and users.
7.3 User Interfaces
SDP depends not just on the pricing algorithms and system design, but ultimately on whether users respondto the prices offered. Thus, careful user interface design is necessary to ensure that users understand theprices being offered and to encourage them to respond accordingly. In some cases, interface design goesbeyond displaying prices; users’ devices can automatically adjust data usage based on the prices offered anduser preferences. TUBE’s user interface components can be grouped into three different categories:
• Information displays: Since TUBE offers day-ahead TDP, the prices for the next day should be dis-played to users. But users may also find it helpful to track their spending by viewing how much usagethey have consumed in the past. TUBE thus shows users both the price and usage for several pasthours, so that users can understand how they usually respond to the prices offered and how this affectstheir spending on data. TUBE also shows the amount used for the five apps with the highest datausage, so that users can see which applications consume more data. Figure 8abc shows some samplescreenshots of these features.
• Out-of-app indicators: Most users checking a mobile application too onerous for keeping track ofcurrent or future prices. A more convenient way to display the prices is to show a color-coded priceindicator on the device home screen to (qualitatively) signal the current price to the user, without
14Such usage monitoring also allows the ISP to calculate the amount spent by individual users.
22

(a) Price display. (b) Price and usage. (c) Top 5 applications. (d) App scheduling.
Figure 8: Screenshots of user interfaces for time-dependent pricing. Users can (a) check the prices for next24 hours, (b) view their price and usage history, (c) identify the top 5 apps by bandwidth usage, and (d)schedule their apps at different times of the day.
requiring any special action on the user’s part. Such color-coding can also be helpful for visualizingthe future prices within the app, so that users can quickly decide whether to wait for lower prices.
• Automation: Many users prefer not to manually schedule different applications due to the complicationsinvolved in tracking future prices. TUBE thus offers an autopilot mode that takes into account users’delay sensitivity for different applications and monthly budget to automatically schedule some appsto lower-price times. The autopilot mode utilizes users’ past spending to forecast how much the userwill spend over a month. If this amount exceeds a user’s monthly budget, delay-tolerant apps can bescheduled to lower-price periods; as users’ spending further exceeds their budget, less delay-tolerantapps will be scheduled to lower-price periods. However, such algorithms need to be optimized so as to beas non-intrusive as possible; in user interviews after the TUBE trial, many trial participants expressedconcern over an automated algorithm controlling their data usage [30]. One way to accommodate theseconcerns is to allow users to override the autopilot scheduling and to configure algorithm parameters,e.g., changing the delay tolerances of different apps (Figure 8d).
7.4 Trial Results
Recently, the authors of the present work developed a prototype of the above pricing algorithms, systemcomponents, and user interfaces and trial-ed it with 50 end users [13]. We here present some results from thisTUBE trial, which illustrate both the importance of user interface design and the effectiveness of optimizedTDP.
An initial phase of the TUBE trial offered alternating high (10% discount) and low (40% discount) time-dependent prices in differnet hours. After two weeks of following the high-low-low price pattern, the priceschanged, repeating the pattern of a 9% discount at midnight, followed by 28%, 30%, 28%, 9%, and 30%discounts in subsequent hours. The home screen price indicator was green for discounts over 30%, orangefor 10–29% discounts, and red for discounts below 10%.
Usage in different hours with these pricing patterns can be compared to assess the effect of the indicatorcolor and numerical discount: hours deemed as Type 1 periods offered a 10% discount in the first stage ofthe experiment and 28% discount in the second stage; the indicator remained orange despite this increasein the discount. Type 2 periods offered a 10% (orange) discount in the first stage and 30% (green) discountin the second stage, while Type 3 periods offered a 10% discount in the first and 9% discount in the secondstage of the experiment (the indicator is orange in both periods). Table 1 summarizes the combinations ofdiscounts and colors used in the two stages that characterize each type of period.
23
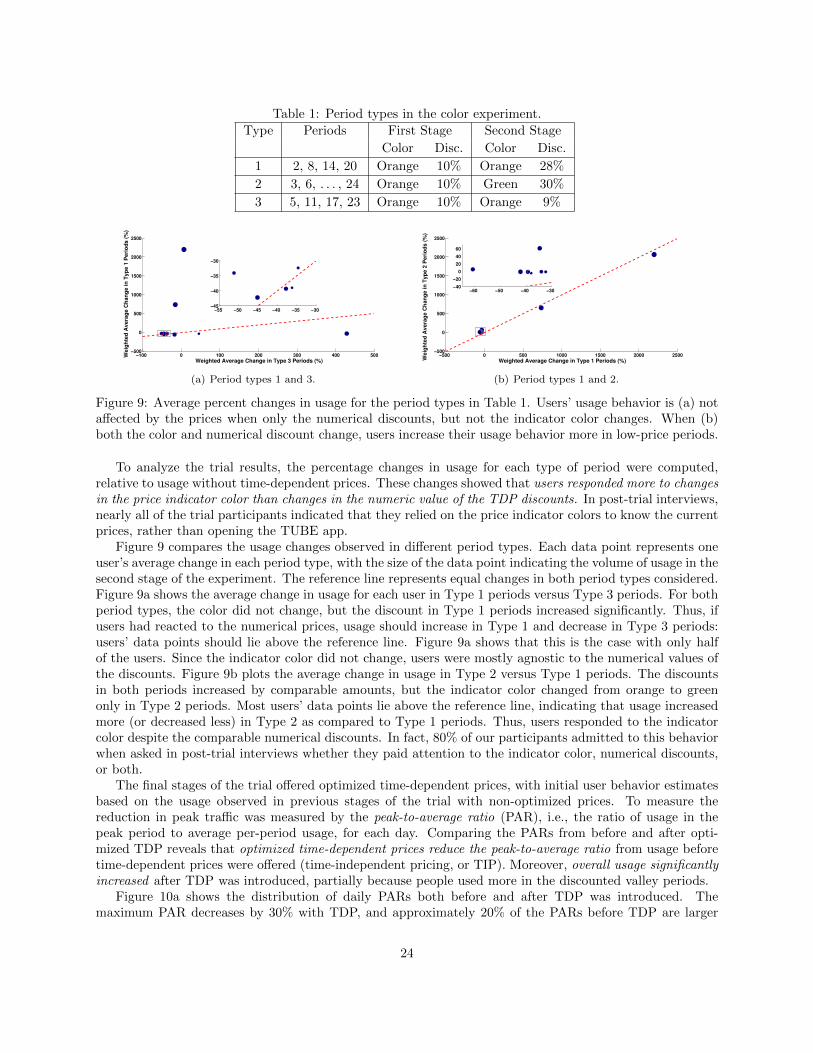
Table 1: Period types in the color experiment.
Type Periods First Stage Second Stage
Color Disc. Color Disc.
1 2, 8, 14, 20 Orange 10% Orange 28%
2 3, 6, . . . , 24 Orange 10% Green 30%
3 5, 11, 17, 23 Orange 10% Orange 9%
−100 0 100 200 300 400 500−500
0
500
1000
1500
2000
2500
Weighted Average Change in Type 3 Periods (%)
Weig
hte
d A
vera
ge C
han
ge in
Typ
e 1
Peri
od
s (
%)
−55 −50 −45 −40 −35 −30−45
−40
−35
−30
(a) Period types 1 and 3.
−500 0 500 1000 1500 2000 2500−500
0
500
1000
1500
2000
2500
Weighted Average Change in Type 1 Periods (%)Weig
hte
d A
vera
ge C
han
ge in
Typ
e 2
Peri
od
s (
%)
−60 −50 −40 −30−40
−20
0
20
40
60
(b) Period types 1 and 2.
Figure 9: Average percent changes in usage for the period types in Table 1. Users’ usage behavior is (a) notaffected by the prices when only the numerical discounts, but not the indicator color changes. When (b)both the color and numerical discount change, users increase their usage behavior more in low-price periods.
To analyze the trial results, the percentage changes in usage for each type of period were computed,relative to usage without time-dependent prices. These changes showed that users responded more to changesin the price indicator color than changes in the numeric value of the TDP discounts. In post-trial interviews,nearly all of the trial participants indicated that they relied on the price indicator colors to know the currentprices, rather than opening the TUBE app.
Figure 9 compares the usage changes observed in different period types. Each data point represents oneuser’s average change in each period type, with the size of the data point indicating the volume of usage in thesecond stage of the experiment. The reference line represents equal changes in both period types considered.Figure 9a shows the average change in usage for each user in Type 1 periods versus Type 3 periods. For bothperiod types, the color did not change, but the discount in Type 1 periods increased significantly. Thus, ifusers had reacted to the numerical prices, usage should increase in Type 1 and decrease in Type 3 periods:users’ data points should lie above the reference line. Figure 9a shows that this is the case with only halfof the users. Since the indicator color did not change, users were mostly agnostic to the numerical values ofthe discounts. Figure 9b plots the average change in usage in Type 2 versus Type 1 periods. The discountsin both periods increased by comparable amounts, but the indicator color changed from orange to greenonly in Type 2 periods. Most users’ data points lie above the reference line, indicating that usage increasedmore (or decreased less) in Type 2 as compared to Type 1 periods. Thus, users responded to the indicatorcolor despite the comparable numerical discounts. In fact, 80% of our participants admitted to this behaviorwhen asked in post-trial interviews whether they paid attention to the indicator color, numerical discounts,or both.
The final stages of the trial offered optimized time-dependent prices, with initial user behavior estimatesbased on the usage observed in previous stages of the trial with non-optimized prices. To measure thereduction in peak traffic was measured by the peak-to-average ratio (PAR), i.e., the ratio of usage in thepeak period to average per-period usage, for each day. Comparing the PARs from before and after opti-mized TDP reveals that optimized time-dependent prices reduce the peak-to-average ratio from usage beforetime-dependent prices were offered (time-independent pricing, or TIP). Moreover, overall usage significantlyincreased after TDP was introduced, partially because people used more in the discounted valley periods.
Figure 10a shows the distribution of daily PARs both before and after TDP was introduced. Themaximum PAR decreases by 30% with TDP, and approximately 20% of the PARs before TDP are larger
24
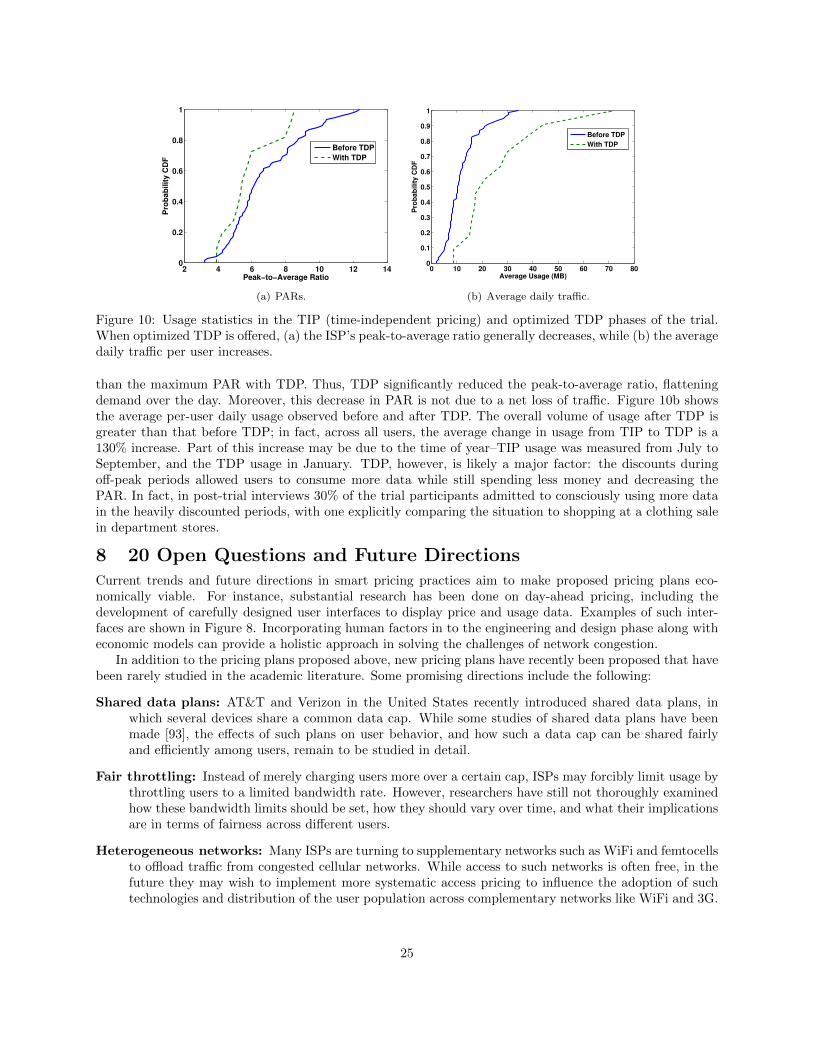
2 4 6 8 10 12 140
0.2
0.4
0.6
0.8
1
Peak−to−Average Ratio
Pro
ba
bil
ity
CD
F
Before TDP
With TDP
(a) PARs.
0 10 20 30 40 50 60 70 800
0.1
0.2
0.3
0.4
0.5
0.6
0.7
0.8
0.9
1
Average Usage (MB)
Pro
bab
ilit
y C
DF
Before TDP
With TDP
(b) Average daily traffic.
Figure 10: Usage statistics in the TIP (time-independent pricing) and optimized TDP phases of the trial.When optimized TDP is offered, (a) the ISP’s peak-to-average ratio generally decreases, while (b) the averagedaily traffic per user increases.
than the maximum PAR with TDP. Thus, TDP significantly reduced the peak-to-average ratio, flatteningdemand over the day. Moreover, this decrease in PAR is not due to a net loss of traffic. Figure 10b showsthe average per-user daily usage observed before and after TDP. The overall volume of usage after TDP isgreater than that before TDP; in fact, across all users, the average change in usage from TIP to TDP is a130% increase. Part of this increase may be due to the time of year–TIP usage was measured from July toSeptember, and the TDP usage in January. TDP, however, is likely a major factor: the discounts duringoff-peak periods allowed users to consume more data while still spending less money and decreasing thePAR. In fact, in post-trial interviews 30% of the trial participants admitted to consciously using more datain the heavily discounted periods, with one explicitly comparing the situation to shopping at a clothing salein department stores.
8 20 Open Questions and Future DirectionsCurrent trends and future directions in smart pricing practices aim to make proposed pricing plans eco-nomically viable. For instance, substantial research has been done on day-ahead pricing, including thedevelopment of carefully designed user interfaces to display price and usage data. Examples of such inter-faces are shown in Figure 8. Incorporating human factors in to the engineering and design phase along witheconomic models can provide a holistic approach in solving the challenges of network congestion.
In addition to the pricing plans proposed above, new pricing plans have recently been proposed that havebeen rarely studied in the academic literature. Some promising directions include the following:
Shared data plans: AT&T and Verizon in the United States recently introduced shared data plans, inwhich several devices share a common data cap. While some studies of shared data plans have beenmade [93], the effects of such plans on user behavior, and how such a data cap can be shared fairlyand efficiently among users, remain to be studied in detail.
Fair throttling: Instead of merely charging users more over a certain cap, ISPs may forcibly limit usage bythrottling users to a limited bandwidth rate. However, researchers have still not thoroughly examinedhow these bandwidth limits should be set, how they should vary over time, and what their implicationsare in terms of fairness across different users.
Heterogeneous networks: Many ISPs are turning to supplementary networks such as WiFi and femtocellsto offload traffic from congested cellular networks. While access to such networks is often free, in thefuture they may wish to implement more systematic access pricing to influence the adoption of suchtechnologies and distribution of the user population across complementary networks like WiFi and 3G.
25

Sponsored content: A major question in pricing is about “whom to charge” for delivering traffic? In atwo-sided pricing model (like in the credit card business) of the Internet, the price of connectivityis shared between content providers (CPs) and end users (EUs). ISPs are just the middle man (orplatform) proving the connectivity between CPs and EUs. A clearing house of data traffic exchangemarket will be a major extension of the existing 1-800 model of phone-call services in the USA, whichcharges the callee rather than the caller. The tradeoffs in the resulting economic benefit betweenCPs and EUs remains to be quantified. Intuitively, end-users’ access prices are subsidized by thirdparty sponsors (e.g., advertisers, content providers etc.) and the ISPs have an additional source ofrevenue. Perhaps more surprisingly, content providers may also stand to gain from two-sided pricingif subsidizing connectivity to end-users translates into a net revenue gain through a larger amountof consumption. However, the gain to content providers depends on the extent to which content-provider payment translates into end-users’ subsidy, and on the demand elasticities of the consumers.The precise gains to the three entities will therefore depend on their respective bargaining powersstemming from their contributions and price sensitivities.
Another special case of sponsored content include zero-rating and 1-800 reverse billing policies fordata traffic. Under zero-rating, an ISP makes certain types of application traffic available to the usersfor free. This kind of policy, although contentious from a net neutrality viewpoint, is a major stepin app-based pricing and has been practiced in some parts of Europe (e.g., Mobistar introduced a‘zero-rated’ plan for Facebook, Twitter, and Netlog). Understanding the impact of such pricing planson the network ecosystem and its neutrality are important active research directions in the area ofnetwork economics.
8.1 Static Pricing
Usage-based static pricing has traditionally been offered by ISPs around the world, and is in some sense thesimplest and least controversial form of SDP. Yet even simple caps on monthly usage require a means tocommunicate those caps to users and, on the ISP side, accounting infrastructure to keep track of users’ re-maining quotas. Pricing plans like token bucket pricing or negotiated contracts require even more interactionwith end users, leading to questions that include:
1. How to enable users use their quota efficiently and keep track of a monthly usage quota?
2. If users choose different QoS levels or times to receive better QoS, e.g., in Paris metro or token bucketpricing, how can they do so without much technical knowledge of what “QoS” means? How can theISP’s infrastructure keep track of users’ choices and offer the appropriate QoS?
3. Without such technical knowledge, how can users negotiate contracts (e.g., cumulus pricing) with ISPs?How can ISPs enforce these contracts?
4. If the ISP offered some form of personalized (e.g., app-based) pricing, how would it measure the usageof different applications for each user? Where in the network should such measurements take place(i.e., client devices or the network core)? From a regulatory perspective, does this violate privacy ornetwork neutrality concerns?
5. How will users share the monthly data quotas imposed by shared data plans among different devices?
8.2 Dynamic Pricing
While static pricing offers some challenges in communicating between ISPs and end users, dynamic pricingintroduces even more complications as the user must be informed of changes in price. Deployment questionsunique to dynamic pricing include:
6. How often should the prices change? Should they change with the network congestion, or should theychange only after a fixed time interval (e.g., one hour)?
26

7. Should users be told the prices in advance? Will they accept or respond to prices that change in realtime?
8. The answer to the previous questions can be more broadly phrased as follows–how can users be ap-propriately informed of the changing prices (e.g., with an app on their mobile devices)? What kind ofdesign is optimal for such an app? Going further, what mechanisms can be developed to help usersadjust their behavior in response to the prices?
9. In the context of mobile data, network bottlenecks are generally highly location-dependent. Shouldthe prices vary by location as well as time? How will this affect users who move from one location toanother?
10. How can the prices be computed efficiently? Should this computation be done online or offline? Whatusage monitoring must take place, and how real time does it need to be?
11. In addition to efficient usage monitoring, how can the ISP anticipate user reactions to the prices soas to set the ”optimal” prices? How can these change over time? Does the measurement processadequately protect user privacy?
12. Should dynamic pricing be coupled to QoS? If so, how?
8.3 Sponsored Content
Sponsored content pricing, in which content providers and advertisers an subsidize users’ spending on data,has not been widely deployed, partially due to the network neutrality implications of content providersubsidies. As a relatively new type of pricing, many questions remain to be answered:
13. What is the preferred mode of “sponsoring” in sponsored content/access, should it be based on in-creasing data cap, monetary discounts, or improved speed (e.g., less throttling)?
14. Will content providers sponsor content on a per-transaction basis? If so, how should these transactionsbe metered, and how much should they charge?
15. How can ISPs measure the cost of each transaction and develop accounting systems to keep track ofcontent providers’ sponsorship?
16. Does the idea of “sponsored content” violate network neutrality? Or can it be structured in a net-neutral way, e.g., sponsoring some data usage but not specifying the application?
8.4 Fair Throttling and Heterogeneous Networks
Other solutions to network congestion that do not explicitly use SDP include fair throttling and deploymentof heterogeneous networks to offload traffic. Fair throttling has not been widely deployed in practice–whilemany ISPs do throttle users that exceed a certain usage cap, such measures are fairly crude and do not takeinto account users’ full profiles. More sophisticated throttling, e.g., Comcast’s throttling of Netflix trafficin 2007, has been controversial. In contrast, many ISPs have begun offering WiFi hotspots, but it remainsunclear how effective they are in relieving congestion on mobile networks. Thus, interesting theoretical andimplementation questions remain for both these types of pricing, including the following:
17. What criteria should the ISP consider when performing “fair” throttling? Does measuring these criteriaviolate user privacy or network neutrality (e.g., throttling based on the usage of specific applicationtypes)?
18. Should users be directly involved in prioritizing different types of traffic in “fair throttling”? Howcan their preferences be incorporated into the throttling algorithm without the act of declaring suchpreferences becoming onerous to the user?
27
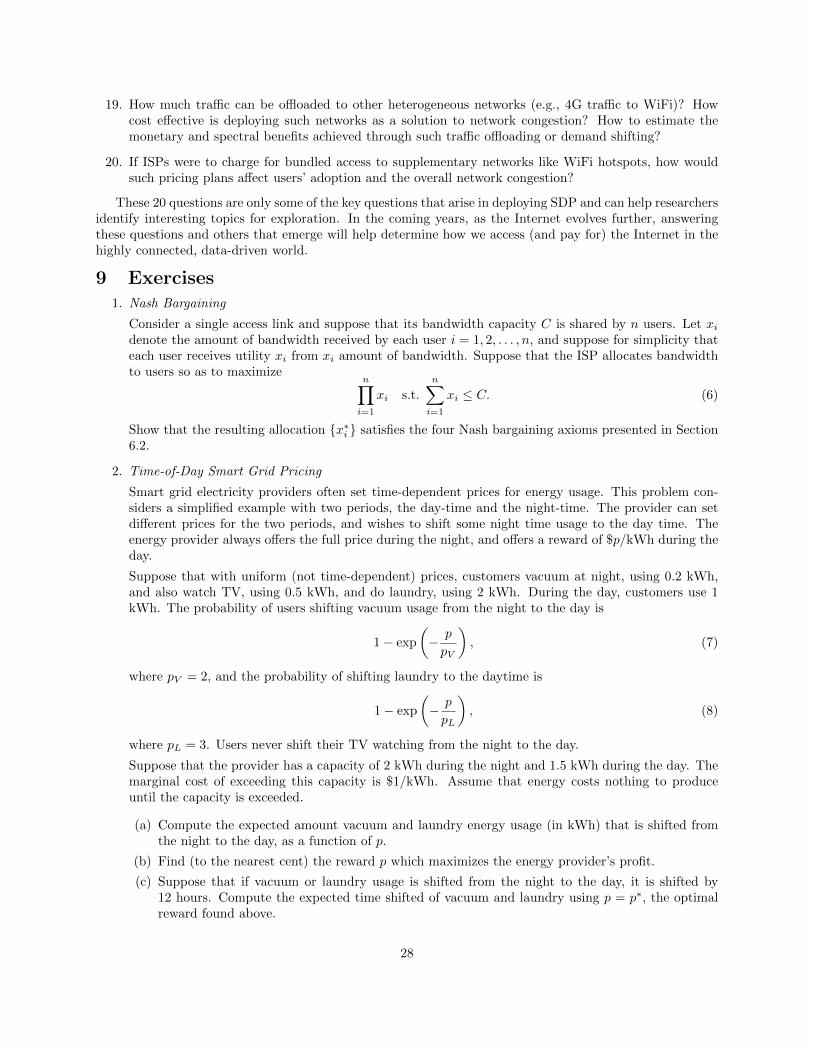
19. How much traffic can be offloaded to other heterogeneous networks (e.g., 4G traffic to WiFi)? Howcost effective is deploying such networks as a solution to network congestion? How to estimate themonetary and spectral benefits achieved through such traffic offloading or demand shifting?
20. If ISPs were to charge for bundled access to supplementary networks like WiFi hotspots, how wouldsuch pricing plans affect users’ adoption and the overall network congestion?
These 20 questions are only some of the key questions that arise in deploying SDP and can help researchersidentify interesting topics for exploration. In the coming years, as the Internet evolves further, answeringthese questions and others that emerge will help determine how we access (and pay for) the Internet in thehighly connected, data-driven world.
9 Exercises1. Nash Bargaining
Consider a single access link and suppose that its bandwidth capacity C is shared by n users. Let xidenote the amount of bandwidth received by each user i = 1, 2, . . . , n, and suppose for simplicity thateach user receives utility xi from xi amount of bandwidth. Suppose that the ISP allocates bandwidthto users so as to maximize
n∏i=1
xi s.t.
n∑i=1
xi ≤ C. (6)
Show that the resulting allocation {x∗i } satisfies the four Nash bargaining axioms presented in Section6.2.
2. Time-of-Day Smart Grid Pricing
Smart grid electricity providers often set time-dependent prices for energy usage. This problem con-siders a simplified example with two periods, the day-time and the night-time. The provider can setdifferent prices for the two periods, and wishes to shift some night time usage to the day time. Theenergy provider always offers the full price during the night, and offers a reward of $p/kWh during theday.
Suppose that with uniform (not time-dependent) prices, customers vacuum at night, using 0.2 kWh,and also watch TV, using 0.5 kWh, and do laundry, using 2 kWh. During the day, customers use 1kWh. The probability of users shifting vacuum usage from the night to the day is
1− exp
(− p
pV
), (7)
where pV = 2, and the probability of shifting laundry to the daytime is
1− exp
(− p
pL
), (8)
where pL = 3. Users never shift their TV watching from the night to the day.
Suppose that the provider has a capacity of 2 kWh during the night and 1.5 kWh during the day. Themarginal cost of exceeding this capacity is $1/kWh. Assume that energy costs nothing to produceuntil the capacity is exceeded.
(a) Compute the expected amount vacuum and laundry energy usage (in kWh) that is shifted fromthe night to the day, as a function of p.
(b) Find (to the nearest cent) the reward p which maximizes the energy provider’s profit.
(c) Suppose that if vacuum or laundry usage is shifted from the night to the day, it is shifted by12 hours. Compute the expected time shifted of vacuum and laundry using p = p∗, the optimalreward found above.
28
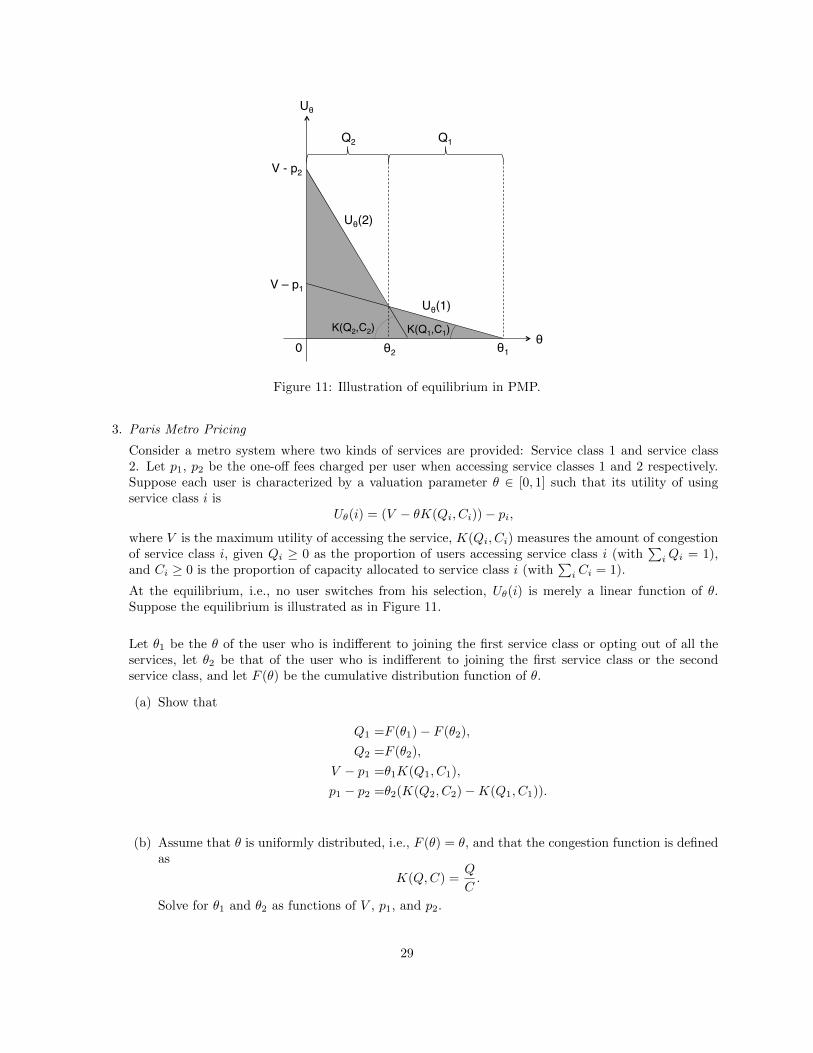
Uθ"
Q2" Q1"
θ"θ2" θ1"
Uθ(1)"
Uθ(2)"
V - p2"
V – p1"
0"K(Q2,C2)" K(Q1,C1)"
Figure 11: Illustration of equilibrium in PMP.
3. Paris Metro Pricing
Consider a metro system where two kinds of services are provided: Service class 1 and service class2. Let p1, p2 be the one-off fees charged per user when accessing service classes 1 and 2 respectively.Suppose each user is characterized by a valuation parameter θ ∈ [0, 1] such that its utility of usingservice class i is
Uθ(i) = (V − θK(Qi, Ci))− pi,
where V is the maximum utility of accessing the service, K(Qi, Ci) measures the amount of congestionof service class i, given Qi ≥ 0 as the proportion of users accessing service class i (with
∑iQi = 1),
and Ci ≥ 0 is the proportion of capacity allocated to service class i (with∑i Ci = 1).
At the equilibrium, i.e., no user switches from his selection, Uθ(i) is merely a linear function of θ.Suppose the equilibrium is illustrated as in Figure 11.
Let θ1 be the θ of the user who is indifferent to joining the first service class or opting out of all theservices, let θ2 be that of the user who is indifferent to joining the first service class or the secondservice class, and let F (θ) be the cumulative distribution function of θ.
(a) Show that
Q1 =F (θ1)− F (θ2),
Q2 =F (θ2),
V − p1 =θ1K(Q1, C1),
p1 − p2 =θ2(K(Q2, C2)−K(Q1, C1)).
(b) Assume that θ is uniformly distributed, i.e., F (θ) = θ, and that the congestion function is definedas
K(Q,C) =Q
C.
Solve for θ1 and θ2 as functions of V , p1, and p2.
29

(Hint: Try p1−p2V−p1 .)
(For details, see C. K. Chau, Q. Wang, and D. M. Chiu, “On the Viability of Paris Metro Pricing forCommunication and Service Networks,” Proc. IEEE INFOCOM, 2010.)
4. Two-Sided Pricing
Suppose an ISP charges a content provider (CP) the usage price hCP and flat price gCP and chargesend user (EU) the usage price hEU and flat price gEU . For simplicity, we assume zero flat prices(gCP = gEU = 0). Let µ be the unit cost of provisioning capacity. The demand functions of the CPand EU, denoted as DCP and DEU respectively, are given as follows:
DEU (hEU ) =
{xEU,max(1− hEU
hEU,max) , if 0 ≤ hEU ≤ hEU,max
0, , if hEU > hEU,max
DCP (hCP ) =
{xCP,max(1− hCP
hCP,max) , if 0 ≤ hCP ≤ hCP,max
0, , if hCP > hCP,max.
The parameters are specified as follows:
hCP,max = 2.0µ,
hEU,max = 1.5µ,
xCP,max = 1.0,
xEU,max = 2.0.
The ISP maximizes its profit by solving the following maximization problem
maximize (hCP + hEU − µ)xsubject to x ≤ min{DCP (hCP ), DEU (hEU )}variables x ≥ 0, hCP ≥ 0, hEU ≥ 0.
(12)
Find the optimal x?, h?CP , h?EU .
5. Monitoring Mobile Data Usage
Many commercial mobile applications have been developed to help users keep track of their mobiledata usage. Some examples include 3GWatchdog Pro (Android), DataWiz (iOS and Android), My-DataManager (Android), and Onavo Count (Android and iOS).
(a) Visit two or three app websites and list their features (e.g., showing usage by application, forecast-ing future usage, alerts when you approach your monthly data quota). Are there any significantdifferences between the apps? Can you identify any consistent differences between iOS and An-droid apps?
(b) What visual elements are used in the app designs? For instance, do the apps use bars or piecharts to represent usage? How are these displays different on different apps?
(c) Based on your answers to the above questions, try to design your own app for tracking mobiledata usage. What screens would you implement? What features would you offer?
30

10 Supplementary MaterialsAs a part of the supplementary reading materials for the chapter, the students are encouraged to refer tothe following materials:
• Slides on Time-dependent Usage-based pricing engineering (TUBE) and shared data pricing.
• Chapter 12 from M. Chiang’s book(http://www.amazon.com/Networked-Life-20-Questions-Answers/dp/1107024943) [94].
• Lecture notes, slides and homework questions on SDP from ELE 381(http://scenic.princeton.edu/network20q/).
• Course videos on SDP (Coursera material available at https://www.coursera.org/course/friendsmoneybytes;videos available at http://www.youtube.com/watch?v=MMl fZypX0w,http://www.youtube.com/watch?v=N2oM0ISs0nY, http://www.youtube.com/watch?v=v uHP4SNKGo,http://www.youtube.com/watch?v=21KlcErIiHc) [95].
• Demo videos related to the DataMi project (http://scenic.princeton.edu/datami/) [96].
• Free iPhone and Android app for usage monitoring (DataWiz)(download links at http://scenic.princeton.edu/datawiz/) [26].
• Research papers, surveys, and white papers from SDP workshops(available at http://scenic.princeton.edu/SDP2012/program.html) [14].
References
[1] Cisco Systems, “Cisco visual networking index: Forecast and methodology, 2011-2016,” May 30 2012.http://tinyurl.com/VNI2012.
[2] L. Kleinrock, “Research areas in computer communications,” Computer Communication Review, vol. 4,July 1974.
[3] S. Sen, Y. Jin, R. Guerin, and K. Hosanagar, “Modeling the dynamics of network technology adoptionand the role of converters,” IEEE/ACM Transactions on Networking, vol. 18, pp. 1793–1805, Dec. 2010.
[4] D. Joseph, N. Shetty, J. Chuang, and I. Stoica, “Modeling the adoption of new network architectures,”in Proceedings of ACM CoNEXT, pp. 5:1–5:12, 2007.
[5] C. Joe-Wong, S. Sen, and S. Ha, “Offering supplementary wireless technologies: Adoption behavior andoffloading benefits,” in Proceedings of IEEE INFOCOM, 2013.
[6] S. Sen, R. Guerin, and K. Hosanagar, “Functionality-rich versus minimalist platforms: a two-sidedmarket analysis,” SIGCOMM Computer Communications Review, vol. 41, pp. 36–43, Oct. 2011.
[7] S. Sen, R. Guerin, and K. Hosanagar, “Shared versus separate networks: the impact of reprovisioning,”in Proceedings of the 2009 workshop on Re-architecting the internet, ReArch ’09, pp. 73–78, 2009.
[8] Z.-L. Zhang, P. Nabipay, A. Odlyzko, and R. Guerin, “Interactions, competition and innovation in aservice-oriented internet: an economic model,” in Proceedings of IEEE INFOCOM, pp. 46–50, 2010.
[9] L. McKnight and J. Bailey, Internet Economics. MIT Press, 1998.
[10] M. Chetty, D. Haslem, A. Baird, U. Ofoha, B. Sumner, and R. Grinter, “Why is my internet slow?:making network speeds visible,” in Proceedings of ACM SIGCHI, pp. 1889–1898, 2011.
[11] J. K. MacKie-Mason and H. R. Varian, “Pricing the Internet,” computational economics, EconWPA,Jan. 1994.
31

[12] S. Sen, C. Joe-Wong, S. Ha, and M. Chiang, “Incentivizing time-shifting of data: A survey of time-dependent pricing for internet access,” IEEE Communications Magazine, November 2012.
[13] S. Ha, S. Sen, C. Joe-Wong, Y. Im, and M. Chiang, “TUBE: Time-dependent pricing for mobile data,”in Proceedings of ACM SIGCOMM, pp. 247–258, ACM, 2012.
[14] Princeton EDGE Lab, “Smart Data Pricing Forum website,” July 31 2012.http://scenic.princeton.edu/SDP2012.
[15] SDP, “Smart Data Pricing Workshop, IEEE INFOCOM,” April 19 2013.
[16] Cisco Systems, “Cisco visual networking index: Global mobile data traffic forecast update, 2012-2017,”February 6 2013. February 6, http://tinyurl.com/VNI2013-mobile.
[17] S. Verma, “Market trends: Worldwide, the state of mobile video, 2012.” Gartner, 2012. February 10.
[18] L. Colombus, “How Google is driving mobile video market growth.” Forbes, August 82012. http://www.forbes.com/sites/louiscolumbus/2012/08/27/how-google-is-driving-mobile-video-market-growth/.
[19] D. Ngo, “iCloud: The hidden cost for the magic, and how to avoid it.” Cnet News, November 72011. http://www.cnet.com/8301-17918 1-57319231-85/icloud-the-hidden-cost-for-the-magic-and-how-to-avoid-it/.
[20] M. El-Sayed, A. Mukhopadhyay, C. Urrutia-Valdes, and Z. J. Zhao, “Mobile data explosion: Monetizingthe opportunity through dynamic policies and QoS pipes,” Bell Labs Technical Journal, vol. 16, no. 2,pp. 79–100, 2011.
[21] J. Browning, “Apple’s Siri doubles iPhone data volumes.” Bloomberg News, January 62012. http://www.bloomberg.com/news/2012-01-06/apple-s-voice-recognition-siri-doubles-iphone-data-volumes.html.
[22] Comcast, “About excessive use of data,” October 2012. September, http://customer.comcast.com/help-and-support/internet/data-usage-what-are-the-different-plans-launching.
[23] P. Key, “Comcast, Level 3, Netflix, the FCC: Busy week for neutrality debate.” Philadelphia BusinessJournal, 2010. December 1.
[24] V. Glass, J. Prinzivalli, and S. Stefanova, “Persistence of middle mile problems for rural exchanges localcarriers.” Smart Data Pricing Workshop Talk, July 2012. http://scenic.princeton.edu/SDP2012/Talks-VictorGlass.pdf.
[25] B. X. Chen, “Shared mobile data plans: Who benefits?.” New York Times, 2012. July 19, Bits Blog.
[26] Princeton EDGE Lab, “DataWiz website,” 2013. http://www.datawizapp.com.
[27] M. Chetty, R. Banks, A. Brush, J. Donner, and R. Grinter, “You’re capped: Understanding the effectsof bandwidth caps on broadband use in the home,” in Proceedings of ACM CHI, pp. 3021–3030, ACM,2012.
[28] M. Chetty, D. Haslem, A. Baird, U. Ofoha, B. Sumner, and R. Grinter, “Why is my Internet slow?:Making network speeds visible,” in Proceedings of ACM CHI, pp. 1889–1898, ACM, 2011.
[29] Locktime Software, “Netlimiter website,” 2012. http://www.netlimiter.com/.
[30] S. Sen, C. Joe-Wong, S. Ha, J. Bawa, and M. Chiang, “When the price is right: Enabling time-dependentpricing of mobile data,” in Proceedings of ACM SIGCHI, ACM, 2013.
32

[31] C. Rigney, S. Willens, A. Rubens, and W. Simpson, “Remote Authentication Dial In User Service(RADIUS).” RFC 2865 (Draft Standard), June 2000. Updated by RFCs 2868, 3575, 5080.
[32] T. Taylor, “Megaco Errata.” RFC 2886 (Historic), Aug. 2000. Obsoleted by RFC 3015.
[33] B. Teitell, “Cellphone overcharges putting a strain on many families.” Boston Globe, 2012. September22.
[34] J. Newman, “Netflix has bandwidth cap sufferers covered.” PC World, June 23 2011. June 23,http://www.pcworld.com/article/230982/Netflix Has Bandwidth Cap Sufferers Covered.html.
[35] K. Fitchard, “New Netflix iOS app capitulates to bandwidth caps.” GigaOm, May 31 2012. May 31,http://gigaom.com/mobile/new-netflix-ios-app-capitulates-to-bandwidth-caps/.
[36] M. Marcon, N. Santos, K. P. Gummadi, N. Laoutaris, P. Rodriguez, and A. Vahdat, “NetEx: Cost-effective bulk data transfers for cloud computing,” tech. rep., Max Planck Institute for Software Systems,2012.
[37] N. Laoutaris, M. Sirivianos, X. Yang, and P. Rodriguez, “Inter-datacenter bulk transfers with net-stitcher,” ACM SIGCOMM Computer Communication Review, vol. 41, no. 4, pp. 74–85, 2011.
[38] J. Chen, A. Ghosh, J. Magutt, and M. Chiang, “QAVA: Quota aware video adaptation,” in Proceedingsof ACM CoNEXT, pp. 121–132, ACM, December 2012.
[39] C. S. Yoo, “Network neutrality, consumers, and innovation,” University of Chicago Legal Forum, vol. 25,p. 179, 2009. U of Penn Law School, Public Law Research Paper No. 08-40.
[40] A. Schatz and S. E. Ante, “FCC chief backs usage-based broadband pricing.” Wall Street Journal, 2010.December 2.
[41] S. Sen, C. Joe-Wong, S. Ha, and M. Chiang, “A survey of broadband data pricing: Past proposals,current plans, and future trends,” arXiv, 2012. http://arxiv.org/abs/1201.4197.
[42] C. Courcoubetis and R. Weber, Pricing Communication Networks: Economics, Technology, and Mod-elling. Wiley, 2003.
[43] S. Sen, C. Joe-Wong, S. Ha, and M. Chiang, “A survey of smart data pricing: Past proposals, currentplans, and future trends,” ACM Computing Surveys, 2013.
[44] D. Songhurst, Charging communication networks: From theory to practice. Elsevier, 1999.
[45] The Economist, “The mother of invention: Network operators in the poor world are cutting costs andincreasing access in innovative ways,” September 24 2009. Special Report, September 24.
[46] J. K. MacKie-Mason, L. Murphy, and J. Murphy, “Responsive pricing in the Internet,” in InternetEconomics (L. W. McKnight and J. P. Bailey, eds.), pp. 279–303, Cambridge, MA: The MIT Press,1997.
[47] J. Murphy and L. Murphy, “Bandwidth allocation by pricing in ATM networks,” IFIP Transactions C:Communications Systems, vol. C-24, pp. 333–351, 1994.
[48] S. Shakkotai, R. Srikant, A. Ozdaglar, and D. Acemoglu, “The price of simplicity,” IEEE Journal onSelected Areas in Communication, vol. 26, no. 7, pp. 1269–1276, 2008.
[49] P. Hande, M. Chiang, R. Calderbank, and J. Zhang, “Pricing under constraints in access networks:Revenue maximization and congestion management,” in Proceedings of IEEE INFOCOM, pp. 1–9,IEEE, 2010.
33

[50] S. Li, J. Huang, and S. Y. R. Li, “Revenue maximization for communication networks with usage-basedpricing,” in Proceedings of IEEE GLOBECOM, pp. 1–6, IEEE, 2009.
[51] J. Walrand, “Economic models of communication networks,” in Performance Modeling and Engineering(Z. Liu and C. H. Xia, eds.), ch. 3, pp. 57–90, New York: Springer Publishing Company, 2008.
[52] A. Odlyzko, “Paris metro pricing for the Internet,” in Proceedings of the 1st ACM Conference onElectronic Commerce, pp. 140–147, ACM, 1999.
[53] R. Cocchi, D. Estrin, S. Shenker, and L. Zhang, “A study of priority pricing in multiple service classnetworks,” ACM SIGCOMM Computer Communication Review, vol. 21, no. 4, pp. 123–130, 1991.
[54] P. Marbach, “Analysis of a static pricing scheme for priority services,” IEEE/ACM Transactions onNetworking, vol. 12, pp. 312–325, March 2004.
[55] D. Lee, J. Mo, J. Walrand, and J. Park, “A token pricing scheme for Internet services,” in Proceedingsof the Seventh ICQT, 2011.
[56] L. Delgrossi and D. Ferrari, “Charging schemes for reservation-based networks,” TelecommunicationSystems, vol. 11, no. 1, pp. 127–137, 1999.
[57] C. Parris, S. Keshav, and D. Ferrari, “A framework for the study of pricing in integrated networks,”tech. rep., Tenet Group, ICSI, UC Berkeley, 1992. TR-92-016.
[58] C. Parris and D. Ferrari, “A resource based pricing policy for real-time channels in a packet-switchingnetwork,” tech. rep., Tenet Group, ICSI, UC Berkeley, 1992. TR-92-018.
[59] D. D. Clark, “Internet cost allocation and pricing,” in Internet Economics (L. W. McKnight and J. P.Bailey, eds.), pp. 215–252, Cambridge, MA: The MIT Press, 1997.
[60] Y. Hayel and B. Tuffin, “A mathematical analysis of the cumulus pricing scheme,” Computer Networks,vol. 47, pp. 907–921, April 2005.
[61] Ericsson, “Differentiated mobile broadband,” January 2011. White Paper,http://www.ericsson.com/res/docs/whitepapers/ differentiated mobile broadband.pdf.
[62] M. Andrews, U. Ozen, M. I. Reiman, and Q. Wang, “Economic models of sponsored content in wirelessnetworks with uncertain demand,” in Proceedings of the Second Smart Data Pricing Workshop, IEEE,2013.
[63] P. Loiseau, G. Schwartz, J. Musacchio, and S. Amin, “Incentive schemes for Internet congestion man-agement: Raffles versus time-of-day pricing,” in Proceedings of the Allerton Conference, pp. 103–110,IEEE, 2011.
[64] A. Ganesh, K. Laevens, and R. Steinberg, “Congestion pricing and user adaptation,” in Proceedings ofIEEE INFOCOM, vol. 2, pp. 959–965, IEEE, 2001.
[65] I. C. Paschalidis and J. N. Tsitsikilis, “Congestion-dependent pricing of network services,” IEEE/ACMTransactions on Networking, vol. 8, pp. 171–184, 1998.
[66] C. Courcoubetis, G. D. Stamoulis, C. Manolakis, and F. P. Kelly, “An intelligent agent for optimizingQoS-for-money in priced ABR connections,” tech. rep., Institute of Computer Science–Foundation forResearch and Technology Hellas and Statistical Laboratory, University of Cambridge, 1998. Preprint.
[67] F. P. Kelly, A. K. Maulloo, and D. K. Tan, “Rate control for communication networks: Shadow prices,proportional fairness and stability,” Journal of the Operational Research Society, vol. 49, no. 3, pp. 237–252, 1998.
34

[68] F. Kelly, “On tariffs, policing, and admissions control for multiservice networks,” Operations ResearchLetters, vol. 15, pp. 1–9, 1994.
[69] A. Gupta, D. Stahl, and A. Whinston, “Priority pricing of integrated services networks,” in InternetEconomics (L. W. McKnight and J. P. Bailey, eds.), pp. 323–352, Cambridge, MA: The MIT Press,1997.
[70] C. Joe-Wong, S. Ha, and M. Chiang, “Time-dependent broadband pricing: Feasibility and benefits,” inProceedings of IEEE ICDCS, pp. 288–298, IEEE, 2011.
[71] U.S. Office of Highway Policy Information, “Toll facilities in the United States,” July 2011. PublicationNo: FHWA-PL-11-032.
[72] J. A. Gomez-Ibanez and K. A. Small, Road pricing for congestion management: a survey of interna-tional practice. Washington, DC: Transportation Research Board, 1994. National Cooperative HighwayResearch Program.
[73] J. Holguin-Veras, M. Cetin, and S. Xia, “A comparative analysis of us toll policy,” TransportationResearch Part A: Policy and Practice, vol. 40, no. 10, pp. 852–871, 2006.
[74] C. Wen and C. Tsai, “Traveler response to electronic tolls by distance traveled and time-of-day,” Journalof the Eastern Asia Society for Transportation Studies, vol. 6, pp. 1804–1817, 2005.
[75] Charles River Associates, “Impact evaluation of the California statewide pricing pilot,” tech. rep.,Charles River Associates, 2005.
[76] K. Herter, “Residential implementation of critical-peak pricing of electricity,” Energy Policy, vol. 35,no. 4, pp. 2121–2130, 2007.
[77] D. Joksimovic, M. C. J. Bliemer, and P. H. L. Bovy, “Dynamic road pricing optimization with heteroge-neous users,” in Proceedings of 45th Congress of the European Regional Science Association, EuropeanRegional Science Association, August 2005.
[78] D. Starkie, “Efficient and politic congestion tolls,” Transportation Research Part A: General, vol. 20,no. 2, pp. 169–173, 1986.
[79] S. Borenstein, “The long-run efficiency of real-time electricity pricing,” The Energy Journal, vol. 26,no. 3, pp. 93–116, 2005.
[80] P. Vytelingum, S. D. Ramchurn, T. D. Voice, A. Rogers, and N. R. Jennings, “Trading agents for thesmart electricity grid,” in Proceedings of the 9th International Conference on Autonomous Agents andMultiagent Systems: Volume 1, pp. 897–904, International Foundation for Autonomous Agents andMultiagent Systems, 2010.
[81] S. Caron and G. Kesidis, “Incentive-based energy consumption scheduling algorithms for the smartgrid,” in First IEEE International Conference on Smart Grid Communications, pp. 391–396, IEEE,2010.
[82] P. Du and N. Lu, “Appliance commitment for household load scheduling,” IEEE Transactions on SmartGrid, vol. 2, pp. 411–419, June 2011.
[83] A. H. Mohsenian-Rad and A. Leon-Garcia, “Optimal residential load control with price prediction inreal-time electricity pricing environments,” IEEE Transactions on Smart Grid, vol. 1, no. 2, pp. 120–133,2010.
[84] C. Joe-Wong, S. Sen, S. Ha, and M. Chiang, “Optimized day-ahead pricing for smart grids with device-specific scheduling flexibility,” IEEE Journal on Selected Areas in Communications, vol. 30, no. 6,pp. 1075–1085, 2012.
35
[85] S. Borenstein, M. Jaske, and A. Rosenfeld, “Dynamic pricing, advanced metering, and demand responsein electricity markets,” tech. rep., Center for the Study of Energy Markets, 2002. Working Paper.
[86] G. Brunekreeft, “Price capping and peak-load pricing in network industries,” Discussion Papers, vol. 73,pp. 1–9, 2000. University of Freiburg, Institute for Transport Economics and Regional Policy.
[87] H. Chao, “Peak load pricing and capacity planning with demand and supply uncertainty,” The BellJournal of Economics, vol. 14, no. 1, pp. 179–190, 1983.
[88] P. Samadi, A. Mohsenian-Rad, R. Schober, V. W. S. Wong, and J. Jatskevich, “Optimal real-time pricingalgorithm based on utility maximization for smart grid,” in First IEEE International Conference onSmart Grid Communications, pp. 415–420, IEEE, 2010.
[89] M. Roozbehani, M. Dahleh, and S. Mitter, “Dynamic pricing and stabilization of supply and demand inmodern electric power grids,” in First IEEE International Conference on Smart Grid Communications,pp. 543–548, IEEE, 2010.
[90] N. Li, L. Chen, and S. Low, “Optimal demand response based on utility maximization in power net-works,” in IEEE Power and Energy Society General Meeting, pp. 1–8, IEEE, 2011.
[91] S. H. Low and D. E. Lapsley, “Optimization flow controli: Basic algorithm and convergence,”IEEE/ACM Transactions on Networking, vol. 7, no. 6, pp. 861–874, 1999.
[92] P. P. Varaiya, R. J. Edell, and H. Chand, “INDEX Project proposal,” 1996.
[93] S. Sen, C. Joe-Wong, and S. Ha, “The economics of shared data plans,” in Proceedings of 22nd AnnualWorkshop on Information Technologies and Systems (WITS), 2012.
[94] M. Chiang, Networked Life: 20 Questions and Answers. Cambridge University Press, 2012.
[95] “Networks: Friends, Money, and Bytes,” September-December 2012.https://www.coursera.org/course/friendsmoneybytes.
[96] Princeton EDGE Lab, “DataMi website,” 2013. http://scenic.princeton.edu/datami.
Author Biographies
Soumya Sen received the B.E. (Hons.) in Electronics and Instrumentation Engineering from BITS-Pilani,India, in 2005, and both the M.S. and Ph.D. in Electrical and Systems Engineering from the University ofPennsylvania in 2008 and 2011, respectively, and did his postdoctoral research at the Princeton University.He is currently an Assistant Professor in the Department of Information & Decision Sciences at the CarlsonSchool of Management of the University of Minnesota. He is a co-organizer of the Smart Data Pricing (SDP)Forum, which promotes industry-academic interaction on broadband pricing research. His research interestsare in Internet economics, communication systems, social networks, and network security. He has publishedseveral research articles in these areas and his work on broadband pricing was a finalist at the 2011 VodafoneWireless Innovation project. He won the Best Paper Award at IEEE INFOCOM 2012.
Carlee Joe-Wong is a graduate student at Princeton University’s Program in Applied and ComputationalMathematics. She received the A.B. degree (magna cum laude) in mathematics from Princeton University in2011. Her research interests include network economics and optimal control theory. Her work on broadbandpricing was a finalist at the 2011 Vodafone Wireless Innovation project, and she received the Best PaperAward at IEEE INFOCOM 2012 for her work on the fairness of multi-resource allocations. In 2011, shereceived the NSF Graduate Research Fellowship and the National Defense Science and Engineering GraduateFellowship.
36

Sangtae Ha is an Associate Research Scholar in the Department of Electrical Engineering at PrincetonUniversity. He led the establishment of the Princeton EDGE Lab and currently serves as its AssociateDirector. He received his Ph.D. in Computer Science from North Carolina State University in 2009 and hasbeen an active contributor to the Linux kernel. During his Ph.D. years, he participated in inventing CUBIC,a new TCP congestion control algorithm. Since 2006, CUBIC has been the default TCP algorithm for Linuxand is currently being used by more than 40% of Internet servers around the world and by several tens ofmillions of Linux users for daily Internet communication. His research interests include pricing, greening,cloud storage, congestion control, peer-to-peer networking, and wireless networks.
Mung Chiang is the Arthur LeGrand Doty Professor of Electrical Engineering at Princeton University,and an affiliated faculty in Applied and Computational Mathematics, and in Computer Science. He receivedhis B.S. (Hons.), M.S., and Ph.D. degrees from Stanford University in 1999, 2000, and 2003, respectively,and was an Assistant Professor 2003-2008, an Associate Professor 2008-2011, and a Professor 2011-2013at Princeton University. His research on networking received the Alan T. Waterman Award (2013), IEEEKiyo Tomiyasu Award (2012), a U.S. Presidential Early Career Award for Scientists and Engineers (2008),several young investigator awards, and a few paper awards including the IEEE INFOCOM Best Paper Award(2012). A recipient of the Technology Review TR35 Award (2007), his inventions have resulted in a fewtechnology transfers and commercializations. In 2009, he founded the Princeton EDGE Lab, supportedin part by an industry consortium, which aims at bridging the theory-practice divide in networking. Heserved as an IEEE Communications Society Distinguished Lecturer in 2012-2013, chaired the foundingsteering committee of the new IEEE Transactions on Network Science and Engineering, and co-chairedthe 2012 US NITRD special workshop on complex engineered networks. He created a new undergraduatecourse: Networks: Friends, Money, and Bytes that lead to an open online offering and a flipped classroomat Princeton. The corresponding textbook: Networked Life: 20 Questions and Answers,” provided theIntegrated and Individualized BookApp (IIB) format, and received the PROSE Award in Engineering andTechnology (2013) from the Association of American Publishers. In 2013, he initiated the online learningplatform, “3 Nights and Done.”
37