smart generation - reap chapter 4... · page 104 by automation tooling systems; ... and incentives...
TRANSCRIPT

Smart GenerationPOWERING ONTARIO WITH RENEWABLE ENERGYSmart GenerationPOWERING ONTARIO WITH RENEWABLE ENERGY

Smart GenerationPOWERING ONTARIO WITH RENEWABLE ENERGY
A summary of this report is available at www.davidsuzuki.org

○ ○ ○ ○ ○ ○ ○ ○ ○ ○ ○ ○ ○ ○ ○ ○ ○ ○ ○ ○ ○ ○ ○ ○ ○ ○ ○ ○ ○ ○ ○ ○ ○ ○ ○ ○ ○ ○ ○ ○ ○ ○ ○ ○ ○ ○ ○ ○ ○ ○ ○ ○ ○ ○ ○ ○ ○ ○ ○ ○
SMART GENERATION: POWERING ONTARIO WITH RENEWABLE ENERGYii
Smart Generation:Powering Ontario With Renewable Energy
© 2004 the David Suzuki Foundation
ISBN 0-9689731-8-3
Canadian Cataloguing in Publication Data for this bookis available through the National Library of Canada
AuthorsJose EtcheverryPaul GipeWilliam KempRoger SamsonMartijn VisBill EggertsonRob McMonagleSarah MarchildonDale Marshall
ReviewersWe would like to thank the following reviewers for their valuable feedback andsuggestions: Greg Allen; Alex Boston; Morag Carter; Phil Jessup; Joyce Maclean;Elliot Mainzer; Roger Peters; Keith Stewart; and Martin Tampier.
AcknowledgementsSpecial thanks to Dominic Ali, Marvin Breyfogle, Jenny Brown, Lyn Brown, Martin Cloutier,Dave Colquhoun, Mark Drisdelle, Shannon Elliot, Serena Etcheverry, John Finch, Lauri Gregg,Claudia Ho Lem, Matt Horne, Robert Hornung, Mike Johnson, Christian Kjaer, Byron Leclair,Paul Lingl, Tamara Nowakowsky, John Owen, Gerald Richardson, Janet Sawin, Sari Sikstrom,Paul Skelhorne, Ana Simeon, Dave Taylor, Claire Viviere, John Wellner, and Duncan Wilcockfor their valuable collaboration.
This project was made possible through generous financialcontributions from numerous individuals and:
David Suzuki Foundation2211 West 4th Ave., Suite 219Vancouver, BCCanada V6K 4S2Email: [email protected]: www.davidsuzuki.orgTel (604) 732-4228Fax (604) 732-0752
Photographs on page 11 by Lauri Gregg; pages 23, 25 by Paul Gipe; page 29 by Dave Colquhoun;pages 37, 39, 42 by William Kemp; page 43 by Byron Leclair; page 62 by Mark Drisdelle; page 77by Martin Cloutier; page 78 by Enwave; page 79 by Marvin Breyfogle and Gerald Richardson; andpage 104 by Automation Tooling Systems; page 110 by U.S. National Renewable Energy Laboratory.
Design and production by Alaris Design
Printed in Canada by Western Printers and Lithographers
Cover printed on Save-A-Tree® Gloss Cover; inside pages printed on Envirographic 100®; bothpapers are 100% recycled, post-consumer waste; process chlorine-free. All inks vegetable-based.

GeneratingGenuine Wealth
iii
Table ofContents
I I N T R O D U C T I O N A N D S U M M A R Y ....................................................................................................................................................................... 1
1. Introduction ........................................................................................................................................................................................................................... 1
2. Ontario’s current electricity situation ................................................................................................................................................... 2
3. Current electricity path threatens Ontario ...................................................................................................................................... 3
4. Clean alternatives for meeting Ontario’s power needs ..................................................................................................... 4
5. The pitfalls of natural gas ...................................................................................................................................................................................... 5
6. Benefits of renewable energy in Ontario ............................................................................................................................................ 6
Wind .............................................................................................................................................................................................................................................. 6
Hydroelectricity ................................................................................................................................................................................................................. 6
Biomass ...................................................................................................................................................................................................................................... 7
Solar ............................................................................................................................................................................................................................................... 7
Geothermal ............................................................................................................................................................................................................................ 7
7. Renewable energy mechanisms (REM) ................................................................................................................................................ 7
Key Source of REM: Germany’s Renewable Energy Feed-In Law ............................................................................ 8
Spain’s REM ......................................................................................................................................................................................................................... 8
Danish REM ......................................................................................................................................................................................................................... 9
Other Countries with REM ................................................................................................................................................................................. 9
8. Conclusion and recommendations ............................................................................................................................................................ 10
I I W I N D P O W E R I N O N TA R I O .......................................................................................................................................................................................... 17
Summary ............................................................................................................................................................................................................................................. 17
1. Background on wind energy .............................................................................................................................................................................. 17
1.1 Worldwide wind development ............................................................................................................................................................... 17
1.2 Wind energy is a mature business ..................................................................................................................................................... 18
1.3 Technical considerations ............................................................................................................................................................................... 18
1.4 Benefits of Wind Energy ................................................................................................................................................................................ 20
2. Ontario’s wind resource: waiting to be discovered ................................................................................................................ 22
2.1 Estimating Ontario’s wind resources .............................................................................................................................................. 23
2.2 Technical resources .............................................................................................................................................................................................. 23
2.3 Practical resource .................................................................................................................................................................................................. 23
2.4 Accessible resource ................................................................................................................................................................................................ 23
2.5 Acceptable resource ............................................................................................................................................................................................. 24

○ ○ ○ ○ ○ ○ ○ ○ ○ ○ ○ ○ ○ ○ ○ ○ ○ ○ ○ ○ ○ ○ ○ ○ ○ ○ ○ ○ ○ ○ ○ ○ ○ ○ ○ ○ ○ ○ ○ ○ ○ ○ ○ ○ ○ ○ ○ ○ ○ ○ ○ ○ ○ ○ ○ ○ ○ ○ ○ ○
SMART GENERATION: POWERING ONTARIO WITH RENEWABLE ENERGYiv
2.6 Ontario’s achievable wind contribution ..................................................................................................................................... 24
2.7 Growth quickens in new markets ....................................................................................................................................................... 24
3. Policies, mechanisms, and incentives to enhance wind power implementation .............................. 25
3.1 Public Utility Regulatory Policies Act ............................................................................................................................................ 25
3.2 Standard offer contracts ................................................................................................................................................................................ 26
3.3 Direct subsidies ....................................................................................................................................................................................................... 26
3.4 Indirect subsidies ................................................................................................................................................................................................... 26
3.5 Renewable portfolio standards .............................................................................................................................................................. 26
3.6 Tendering or bidding systems ................................................................................................................................................................. 27
3.7 Renewable Energy Mechanisms (REM) ..................................................................................................................................... 28
4. Conclusions and further research ............................................................................................................................................................... 28
I I I H Y D R O E L E C T R I C I T Y I N O N TA R I O ................................................................................................................................................................... 33
Summary ............................................................................................................................................................................................................................................. 33
1. Background on hydropower ............................................................................................................................................................................... 33
1.1 Worldwide hydropower development ............................................................................................................................................ 34
1.2 Hydropower is an established business ......................................................................................................................................... 34
1.3 Technical considerations ............................................................................................................................................................................... 35
1.4 Integrating existing hydroelectric facilities with new wind plants ................................................................ 35
1.5 The effect of intermittent generation .............................................................................................................................................. 36
1.6 Benefits of new hydropower development ................................................................................................................................. 37
1.7 Employment ............................................................................................................................................................................................................... 37
1.8 Local economic development ................................................................................................................................................................... 37
2. Ontario’s hydroelectric resources: key foundation of provincial power .................................................... 38
2.1 Estimates of Ontario’s Total Hydroelectric Resources .................................................................................................. 38
2.2 Technical resources .............................................................................................................................................................................................. 38
2.3 Practical resource .................................................................................................................................................................................................. 39
2.4 Accessible resource ................................................................................................................................................................................................ 39
2.5 Acceptable resource ............................................................................................................................................................................................. 39
2.6 Ontario’s achievable potential ............................................................................................................................................................... 39
2.7 Economies of scale for hydropower ................................................................................................................................................... 40
3. Policies, mechanisms, and incentives to enhance the viability of Ontario’shydroelectric power ....................................................................................................................................................................................................... 40
4. Conclusions and further research ............................................................................................................................................................... 41
I V B I O M A S S I N O N TA R I O ........................................................................................................................................................................................................ 45
Summary ............................................................................................................................................................................................................................................. 45
1 Background on biomass .......................................................................................................................................................................................... 45
1.1 Worldwide biomass development ....................................................................................................................................................... 47

○ ○ ○ ○ ○ ○ ○ ○ ○ ○ ○ ○ ○ ○ ○ ○ ○ ○ ○ ○ ○ ○ ○ ○ ○ ○ ○ ○ ○ ○ ○ ○ ○ ○ ○ ○ ○ ○ ○ ○ ○ ○ ○ ○ ○ ○ ○ ○ ○ ○ ○ ○ ○ ○ ○ ○ ○ ○ ○ ○
TABLE OF CONTENTS v
2. Biomass is growing as a competitive energy source in Ontario ............................................................................ 48
2.1 Technology considerations .......................................................................................................................................................................... 48
2.2 Combustion applications for heat ...................................................................................................................................................... 48
2.3 Electricity from biomass ................................................................................................................................................................................ 49
2.4 Anaerobic digestion ............................................................................................................................................................................................ 50
2.5 Economics of power generation from biomass ..................................................................................................................... 50
2.6 Benefits of biomass .............................................................................................................................................................................................. 50
2.7 Employment ............................................................................................................................................................................................................... 50
2.8 Rural development .............................................................................................................................................................................................. 51
3. Ontario’s biomass resource: A growing diversity of supply ....................................................................................... 51
3.1 Forest sector biomass ......................................................................................................................................................................................... 51
3.2 Technical resource estimation ................................................................................................................................................................. 51
3.3 Practical resource estimation ................................................................................................................................................................... 52
3.4 Agriculture ................................................................................................................................................................................................................... 53
3.5 Waste biomass resources from urban areas ............................................................................................................................. 56
4. Overview: the total, technical, and practical resources available ......................................................................... 58
5. Ontario’s achievable biomass contribution .................................................................................................................................... 58
5.1 Achievable contribution (2010–2020) .......................................................................................................................................... 58
5.2 Estimated contribution (2007) ............................................................................................................................................................. 59
5.3 Growth quickens in new markets ....................................................................................................................................................... 60
6. Policies, mechanisms, and incentives to enhance biomass implementation ......................................... 61
7. Conclusions, recommendations and further research ....................................................................................................... 61
Biomass Appendix ................................................................................................................................................................................................................... 63
V G E O T H E R M A L H E A T P U M P S ...................................................................................................................................................................................... 67
Summary ............................................................................................................................................................................................................................................. 67
1. Background ............................................................................................................................................................................................................................. 67
1.1 Costs .................................................................................................................................................................................................................................... 68
1.2 GHP development ............................................................................................................................................................................................... 69
1.3 Technical considerations ............................................................................................................................................................................... 70
1.4 Benefits of GHP ...................................................................................................................................................................................................... 71
1.5 Employment ............................................................................................................................................................................................................... 71
1.6 Economic development .................................................................................................................................................................................. 72
2. Ontario’s GHP resource ........................................................................................................................................................................................... 72
2.1 Growth quickens in new markets ....................................................................................................................................................... 73
3. Mechanisms to encourage GHP .................................................................................................................................................................... 73
4. Recommendations .......................................................................................................................................................................................................... 75
5. Conclusions ............................................................................................................................................................................................................................. 75
GHP Appendix ............................................................................................................................................................................................................................. 76

○ ○ ○ ○ ○ ○ ○ ○ ○ ○ ○ ○ ○ ○ ○ ○ ○ ○ ○ ○ ○ ○ ○ ○ ○ ○ ○ ○ ○ ○ ○ ○ ○ ○ ○ ○ ○ ○ ○ ○ ○ ○ ○ ○ ○ ○ ○ ○ ○ ○ ○ ○ ○ ○ ○ ○ ○ ○ ○ ○
SMART GENERATION: POWERING ONTARIO WITH RENEWABLE ENERGYvi
V I S O L A R E N E R G Y ............................................................................................................................................................................................................................... 81
Summary ............................................................................................................................................................................................................................................. 81
1. Background on solar energy ............................................................................................................................................................................... 82
1.1 Worldwide solar development ................................................................................................................................................................ 83
1.2 Solar energy is a rapidly growing business ............................................................................................................................... 84
1.3 Technical considerations ............................................................................................................................................................................... 84
1.4 Benefits of solar energy ................................................................................................................................................................................... 86
1.5 Employment ............................................................................................................................................................................................................... 86
1.6 Economic development .................................................................................................................................................................................. 88
2. Ontario’s solar resource: waiting to be tapped ............................................................................................................................ 88
2.1 Estimating Ontario’s solar resources ............................................................................................................................................... 88
2.2 Technical resources .............................................................................................................................................................................................. 88
2.3 Practical resource .................................................................................................................................................................................................. 93
2.4 Acceptable resource ............................................................................................................................................................................................. 94
2.5 Ontario’s achievable solar contribution ...................................................................................................................................... 97
2.6 Growth quickens in new markets ....................................................................................................................................................... 98
3. Policies, mechanisms, and incentives to enhance solar power implementation ............................... 98
3.1 Solar electricity (PV) ........................................................................................................................................................................................ 98
3.2 Solar thermal ............................................................................................................................................................................................................. 99
4. Conclusions and further research ................................................................................................................................................................. 103
V I I C O N C L U S I O N ..................................................................................................................................................................................................................................... 109
Summary ............................................................................................................................................................................................................................................. 109
A P P E N D I X : O N TA R I O E N E R G Y P R O F I L E ............................................................................................................................................................. 111
Summary ............................................................................................................................................................................................................................................. 111
1. Present structure of Ontario’s electricity sector ........................................................................................................................ 111
Expected Electricity Price ....................................................................................................................................................................................... 111
2. Heat demand .......................................................................................................................................................................................................................... 112
Residential sector ............................................................................................................................................................................................................. 112
Commercial and institutional sector ........................................................................................................................................................ 112
3. Price of heat ............................................................................................................................................................................................................................. 113
G L O S S A R Y O F K E Y T E R M S ........................................................................................................................................................................................................ 115

GeneratingGenuine Wealth
1
Introduction andSummary1
1. Introduction
Ontario is at an energy crossroads: the province can
either continue to rely on polluting sources to generate
electricity and meet the province’s demands for heating
and cooling, or it can invest in the development of a
reliable and sustainable system based on renewable energy
and efficiency.
The province’s electricity system was originally built
on a renewable foundation: hydropower. However, the
system is currently dominated by large outdated facilities
that burn coal –the most polluting fossil fuel – and by aging
nuclear plants, which are characterized by unresolved
safety issues (e.g. safe disposal of radioactive waste),
chronic underperformance, and massive cost overruns. In
addition, the 2003 blackout illustrated the vulnerability
of the current electricity system, which depends heavily on
large centralized plants overwhelming a fragile electric grid.
Recently, Ontario’s Minister of Energy estimated that
fixing the province’s electricity system will require between
$25 to $40 billion dollars.1
Crucial decisions related to this investment will be made
in the coming months and could perpetuate the problems
of the current system or can instead result in positive
changes that will permanently improve the reliability and
sustainability of the province’s electricity system.
This vast investment presents a unique opportunity
to decrease electricity demand through efficiency
measures, and shift to renewable energy options,
substantially improving the electricity system, increasing
energy security, and benefiting the environment and the
economy. Developing a diversity of local renewable
energy sources throughout the province could help
reduce power losses and increase the reliability and
flexibility of Ontario’s electricity system.
Ontario’s heating needs are now almost all met with
natural gas, and natural gas has been widely promoted
as a potential alternative to coal generation.
Although natural gas may be a cleaner fuel than coal,
its use still impacts air quality and human health, and its
production has significant environmental consequences
in the form of wilderness and habitat destruction.2
Furthermore, the contribution of natural gas
generation to climate change is only slightly less than coal
(on an energy basis).
Finally, a decrease in natural gas reserves has meant a
doubling of its price – with wild price fluctuations – both
of which make it a less attractive and more volatile
alternative for electricity generation than efficiency
strategies and renewable energy.
There is also an opportunity to meet power generation
and heating needs using efficiency measures and renew-
able energy sources instead of natural gas.
To help inform the ongoing decision-making process,
this report summarizes the potential of the most salient
renewable options available in Ontario: wind, hydropower,
biomass, solar, and ground heat.
The report illustrates how the abundant renewable
resources of wind and hydropower can be effectively
integrated in Ontario to provide a cost-effective, reliable,
and clean alternative to conventional generation.
In addition, the report highlights how myriad
renewable energy technologies can be used in rural and
urban communities throughout the province to achieve
a more diverse and reliable electricity system, and also to
light, heat, and cool all types of buildings.

○ ○ ○ ○ ○ ○ ○ ○ ○ ○ ○ ○ ○ ○ ○ ○ ○ ○ ○ ○ ○ ○ ○ ○ ○ ○ ○ ○ ○ ○ ○ ○ ○ ○ ○ ○ ○ ○ ○ ○ ○ ○ ○ ○ ○ ○ ○ ○ ○ ○ ○ ○ ○ ○ ○ ○ ○ ○ ○ ○
SMART GENERATION: POWERING ONTARIO WITH RENEWABLE ENERGY2
The report also identifies key policy mechanisms that
can help Ontario become a North American leader in
renewable energy and thereby achieve a more stable and
reliable electricity system, a cleaner environment, and the
development of a new and vibrant economic engine.
2. Ontario’s current electricitysituation
Large and aging coal and nuclear power plants currently
dominate Ontario’s electricity system.3
TABLE 1
Ontario’s Electricity Mix4
Peak CapacitySource GWh % (MW) % (MW)
Coal 35,098 23 5,865 23 7,285Nuclear 61,040 40 7,140 28 10,720Hydro 33,572 22 6,375 25 7,665Peaking Gas and Oil 12,208 8 3,060 12 4,645Imports 10,682 7 3,060 12Total Demand 152,600 25,500 30,315
Ontario’s generation plants are interconnected to
electricity users by a provincially-owned grid that serves
an area of 640,000 km2. In most locations, generation
plants and electricity users are currently located far away
from each other, which leads to a continuous average
power loss of eight percent as electricity is delivered
(totaling a loss close to 2000 megawatts of peak power).5
In addition to transmission losses, energy is routinely
wasted during electricity generation as both coal and
nuclear plants are inefficient at generating electricity.6
Decades of relying on supply by a narrow and limited
number of large generators, instead of efficiency strategies
and a diverse generation portfolio, has characterized
Ontario’s electricity system. Furthermore, the poor
performance and lackluster safety record of Ontario’s
nuclear facilities has resulted in the current detrimental
dependency on provincial coal generators, and has
created the most costly ongoing financial liability in
Canada’s electricity sector.7
This financial liability has three main components:
accumulated debt accrued until the dissolution of
Ontario Hydro in 1999, additional liabilities accumulated
by Ontario Power Generation from 1999–2003, and
expected and estimated liabilities related to nuclear plant
refurbishments.
The accumulated debt from Ontario Hydro totals
approximately $38.1 billion transferred by the provincial
government to the Ontario Electricity Financial
Corporation upon the restructuring of Ontario’s
electricity sector on April 1, 1999.8
The additional liabilities represent approximately $1
billion (from the return of Pickering A Unit 4 to service
and other nuclear operations) accumulated by Ontario
Hydro’s successor, Ontario Power Generation, between
1999-2003.9
The cost of rebuilding Pickering A, Unit 1 to service
is currently estimated by the government to total
approximately $900 million.10 It is important to note that
when the OPG Review Committee recommended the
Unit 1 re-start in March 2004, the estimate quoted to
complete the project was $500 million.11
Growing concerns about nuclear safety led to a plan
to conduct repairs in Ontario’s nuclear facilities in 1997.12
The total refurbishment costs for Ontario nuclear
generating facilities have recently been estimated to range
between $14.2 to $19.2 billion dollars.13 These significant
costs severely compromise the financial health of
Ontario’s electricity system and should call into question
the viability of any further nuclear power development.
In addition to exacerbating Ontario’s debt, the
required repairs of nuclear facilities increased provincial
dependency on coal plants. As coal burning for electricity
generation grew, air pollution levels consistently
worsened in Ontario. This ongoing problem has become
especially severe in southern Ontario during hot summer
days that favour smog creation.
Growing health concerns about air pollution resulted
in a promise during the 2003 provincial election by the
Ontario Liberal government to phase out coal by 2007.
This election promise was followed in 2004 by provincial
targets to decrease electricity use by 5 percent through
efficiency and conservation by 2007, and by goals to
increase the use of renewable energy to 5 percent of total
energy capacity by 2007 and 10 percent by 2010.
As this report illustrates, these goals represent modest
targets that can be surpassed if clear policies are
implemented to diversify, encourage, and support the
adoption of renewable energy sources throughout the
province.
Further evidence for implementing renewable energy
sources in Ontario was provided in June 2004 by the more
than 4,400 megawatts (MW) of renewable energy bids

○ ○ ○ ○ ○ ○ ○ ○ ○ ○ ○ ○ ○ ○ ○ ○ ○ ○ ○ ○ ○ ○ ○ ○ ○ ○ ○ ○ ○ ○ ○ ○ ○ ○ ○ ○ ○ ○ ○ ○ ○ ○ ○ ○ ○ ○ ○ ○ ○ ○ ○ ○ ○ ○ ○ ○ ○ ○ ○ ○
I INTRODUCTION AND SUMMARY 3
submitted as part of the government’s request for
proposals to develop 300 MW of renewable energy.14
Currently hydroelectric facilities represent the main
use of renewable energy in Ontario. However, most of
these hydroelectric plants are not representative of the
low-impact renewable technologies available today
(e.g. wind turbines, small hydro facilities, landfill gas, solar
photovoltaic).
Presently new renewable technologies are almost absent
in Ontario’s electricity generation mix. As an example
consider wind turbines, which currently represent about
15 MW of installed capacity in Ontario. In stark contrast
Germany, with a surface area about one-third the size of
Ontario, had by the end of 2003 14,609 MW of installed
wind capacity (and in 2003 alone installed 2645 MW of
wind capacity).15
Although low-impact renewable energy currently
represents only two percent of the global share of energy
use, renewable sources such as wind power and solar
photovoltaic are growing at impressive exponential rates
and faster than any other energy sources in the world.
A further indication of the growing importance of
the renewable energy sector is the fact that in 2003 about
$26.9 billion –the equivalent of one-sixth of all the global
investment in power generation equipment – was spent
on renewable energy development.16
3. Current electricity paththreatens Ontario
Ontario’s current dependency on coal for electricity
generation regularly compromises public health and
environmental quality in Ontario.
Severe smog alerts have come to characterize Ontario’s
summer season, and the burning of coal for electricity
generation represents a primary source of local air
pollution.17
Furthermore, a report released in 2004 by the North
American Commission for Environmental Cooperation
shows that the province’s largest coal plant, Nanticoke, is
responsible for eight percent of all of Canada’s reported
toxic air emissions.18
Several recent studies have linked air pollution
exposure with negative health consequences, including
cardiovascular, respiratory, developmental impairments
and lung cancer.19 For several years the Ontario Medical
Association (OMA) has highlighted the acute health
effects associated with fine particulate matter and
ground-level ozone in Ontario, which cost over $1 billion
per year in direct costs for hospital admissions, emergency
room visits and absenteeism.20
The OMA has noted that these estimates do not reflect
the costs associated with medication or visits to doctors’
offices. Quantification of these costs entails significant
ethical dilemmas; nevertheless, data published by the
OMA indicates that the pain, suffering, and loss of life
associated with air pollution costs Ontario citizens
another $9 billion per year.21
In addition to their direct contribution to air
pollution, the latest government figures indicate that coal
plants also produce about 17 percent of all the greenhouse
gas (GHG) emissions of Ontario – an amount compar-
able to the GHG emissions of all of Ontario’s automobiles
and light-duty trucks combined.22
Scientists worldwide agree that GHG emissions from
the burning of fossil fuels, such as coal, oil, and natural
gas are the key contributors to climate change.23
In recognition of the severity of the challenges posed
by climate change, the federal government ratified the Kyoto
Protocol in 2002, which commits Canada to reduce its
GHG emissions by 6 percent per year (from 1990 levels)
by 2012. This commitment entails reducing annual green-
house gas (GHG) emissions by 240 megatonnes (MT).24
Replacing coal generation with a combination of
renewable energy and efficiency measures would enable
Ontario to reduce air pollution and significantly reduce
its share of GHG emissions, and thereby help Canada
fulfill its international obligations.25 Efforts to implement
such strategies should be explicitly supported at the national
level as part of Canada’s Kyoto implementation plan.
Furthermore, the synergistic benefits of such federal
and provincial collaboration are highlighted by evidence
from European jurisdictions, which suggests that a
proportion of the implementation costs of Kyoto policies
can be recuperated by reduced costs of air pollution.26
A recently signed memorandum of understanding
between Ontario and the federal government constitutes
a first step towards developing and implementing a new
set of collaborative policy measures to ensure that
renewable energy sources and efficiency strategies are
developed to their fullest potential.
The public health and environmental costs of burning
coal (e.g. air pollution, emission of GHGs), and of relying
on nuclear power are significant (e.g. safely disposing of

○ ○ ○ ○ ○ ○ ○ ○ ○ ○ ○ ○ ○ ○ ○ ○ ○ ○ ○ ○ ○ ○ ○ ○ ○ ○ ○ ○ ○ ○ ○ ○ ○ ○ ○ ○ ○ ○ ○ ○ ○ ○ ○ ○ ○ ○ ○ ○ ○ ○ ○ ○ ○ ○ ○ ○ ○ ○ ○ ○
SMART GENERATION: POWERING ONTARIO WITH RENEWABLE ENERGY4
radioactive waste), but are not yet accounted in any way
in the pricing of electricity.
In addition, the price of electricity generated from
burning coal is also artificially lowered through the
favourable federal income tax treatment of coal mining.27
In the case of nuclear power, a viable solution for
nuclear waste disposal still remains as an unanswered and
costly question. Consider that the Auditor General of
Canada noted almost ten years ago that a long-term
solution for high-level radioactive waste was estimated
by Atomic Energy of Canada Limited to cost $9 billion
(in 1991 dollars).28
Additionally, instead of reflecting its environmental
and social costs, the price of nuclear energy has been
artificially lowered for decades through at least $6 billion
of direct federal government subsidies that have existed
since 1946 (in the 1987–1999 period, federal spending
on nuclear technology totaled about $2 billion).29
The fact that significant costs are largely ignored but
are still paid through public funds (e.g. provincial health
care budgets) greatly distorts the real price of coal and
nuclear electricity.
If all the environmental and social costs and existing
government subsidies for coal and nuclear power were
taken into account, renewable energy sources would not
require any special support to compete.30
However, since efforts to reflect these costs and
subsidies in electricity prices have not been conducted
and are not yet planned, policy measures are required to
level the playing field.
4. Clean alternatives for meetingOntario’s power needs
Several recent studies have analyzed the huge potential
for reducing electricity use in Ontario through efficiency
and conservation.31
These studies highlight two important facts for policy-
makers: the bulk of all investments in energy efficiency
can be paid through the expected energy savings; and
just as with renewable energy development, energy
efficiency investments can result in important local
economic benefits (such as employment creation).32
It must be recognized that only a few measures, such
as peak reductions achieved through demand response
measures by large electricity users, can be implemented
as single concerted efforts.33 Almost all the other strategies
to achieve the efficiency gains summarized in Table 2 will
require an integrated set of policies and initiatives
covering a broad spectrum of activities and products.
Clear evidence already exists in North America
showing what can be accomplished in Ontario through
TABLE 2
Energy Efficiency Potential in Ontario34
2010 2015 2020Peak Capacity Peak Capacity Peak Capacity
GWh (MW) (MW) GWh (MW) (MW) GWh (MW) (MW)
IMO Forecast 164,000 27,800 172,000 28,742 180,000 30,079Demand Reductions-Efficiency/ (26,867) (4,510) (53,002) (8,898) (73,499) (12,339)CogenerationAdditional Load Shifting (2,329) (1,984) (1,774)On-Site Solar Roofs Program (876) (250) 330 (1752) (500) 670 (2,628) (750) 1,000Grid Demand 136,257 20,711 117,246 17,360 103,873 15,216Existing Nuclear 51,246 5,994 9,000 22,776 2,664 4,000Existing Hydro 33,572 6,375 7,665 33,572 6,375 7,665 33,572 6,375 7,665Existing Peaking Gas and Replaced Oil 12,208 3,060 4,645 12,208 3,060 4,645 12,208 3,060 4,645Wind 7,884 1,317 3,000 13,140 2,196 5,000 18,396 3,074 7,000New Hydro 4,380 600 1,000 6,570 900 1,500 8,760 1,200 2,000Biomass 3,504 234 500 4,205 281 600 5,606 375 800New CCNG Base Load 23,915 3,570 4,200 25,054 3,740 4,400 25,623 3,825 4,500
Total Supply 136,709 21,150 30,010 117,525 19,216 27,810 104,165 17,909 26,610Contingency 452 440 278 1,856 292 2,693
○ ○ ○ ○ ○ ○ ○ ○ ○ ○ ○ ○ ○ ○ ○ ○ ○ ○ ○ ○ ○ ○ ○ ○ ○ ○ ○ ○ ○ ○ ○ ○ ○ ○ ○ ○ ○ ○ ○ ○ ○ ○ ○ ○ ○ ○ ○ ○ ○ ○ ○ ○ ○ ○ ○ ○ ○ ○ ○ ○
I INTRODUCTION AND SUMMARY 5
efficiency strategies. A noteworthy example is the state of
California, which has already reduced peak power demand
by 20% or 10,000 MW over the past 20 years by relying
on efficiency standards (for buildings and appliances) and
utility demand side management programs.35
In early 2004, the Pembina Institute released a study
that showed that electricity consumption and peak
demand could be reduced to 30% below 2004 levels by
2020 through a series of energy efficiency and demand
reduction policies. These policies would include
equipment efficiency standards and codes, demand-side
management incentives to utilities, a small public benefits
charge to finance energy efficiency, and efforts to fast track
efficiency improvements. The study also showed that the
cost to Ontario consumers to achieve these goals would
be less than adding new supply facilities, and that no new
technologies would be required – just the most efficient
that are commercially available today.
The Pembina study also looked at how the remaining
demand for electricity might be met through a combina-
tion of renewable energy and natural gas – eliminating
both coal and nuclear energy sources by 2020. This work
confirmed similar research carried out by Torrie Smith
in 2003.36
Both the Pembina Institute and Torrie Smith studies
used available data on renewable resource potential.
This report was commissioned to obtain a better
assessment of Ontario’s renewable electricity potential
and also estimate the thermal contribution that these
resources could provide.
5. The pitfalls of natural gas
Natural gas has been widely promoted as a potential
alternative to coal generation, and as the primary source
of heat for buildings and industrial processes.
Although natural gas may be a cleaner fuel than coal,
its use still impacts air quality and human health, and its
production has significant environmental consequences
in the form of wilderness and habitat destruction.37
Furthermore, the contribution of natural gas
generation to climate change is only slightly less than coal
(on an energy basis).
Finally, a decrease in natural gas reserves has meant a
doubling of its price – with wild price fluctuations – both
of which make it a less attractive and more volatile
alternative for electricity generation than efficiency
strategies and renewable energy.
Contrary to its clean image, natural gas contributes
to climate change. Although burning natural gas produces
fewer greenhouse gas emissions than coal or oil (25–40%
lower, per unit of generated electricity), natural gas still
creates emissions when it is produced, processed, and
transported.38
Further, there are two significant unresolved issues
related to the economic costs of increasing reliance on
electricity generation from natural gas: price increases
and price fluctuations.
Many energy experts are predicting that natural gas
prices have established a new equilibrium at $3.50-$4.00
per thousand cubic feet (Mcf), compared to the $2/Mcf
mark around which North American gas prices fluctuated
over most of the 1980s and 1990s.39 The reason is that
continued growth in gas-fired electricity in North
America – driven by U.S. demand – is not matched by
proven reserves of natural gas.40
Canada is the largest source of natural gas for the U.S.,
but Canada’s reserves are dwindling. Based on proven
reserves and 2002 production figures, Canada has only
nine years of production unless new reserves are
discovered.41 In the long run, increased supply will not
be able to match demand. Already, Canada’s natural gas
production is expected to decline by 3% between 2002
and 2005 because “many of the new fields coming on-
stream are small and quickly depleted.”42 This reality will
keep natural gas prices high in North America, and may
potentially increase them further.
In the past, Canadian natural gas consumers –
including electricity providers – have been economically
buffered from U.S. demand as limited pipeline capacity
has meant that natural gas consumers north of the border
have not had to compete with the massive U.S. appetite
for natural gas. However, this buffer is quickly disappear-
ing. The Alliance Pipeline (B.C. to Illinois), the Maritimes
& Northeast Pipeline (Nova Scotia to Massachusetts), and
others have meant that more of Canada’s natural gas
production now gets burned in the U.S. than in Canada.
Ironically, increased capacity pushes up the price
Canadians pay for Canadian natural gas.43
The second price concern relates to the fluctuation in
natural gas prices. Like all commodities, natural gas
undergoes constant changes in its price. This is especially
of concern for electricity utilities with significant amounts
of gas-fired power.
Natural gas prices and electricity prices influence each
other. When natural gas prices go up, the cost and price

○ ○ ○ ○ ○ ○ ○ ○ ○ ○ ○ ○ ○ ○ ○ ○ ○ ○ ○ ○ ○ ○ ○ ○ ○ ○ ○ ○ ○ ○ ○ ○ ○ ○ ○ ○ ○ ○ ○ ○ ○ ○ ○ ○ ○ ○ ○ ○ ○ ○ ○ ○ ○ ○ ○ ○ ○ ○ ○ ○
SMART GENERATION: POWERING ONTARIO WITH RENEWABLE ENERGY6
of electricity goes up, and vice versa.44 Gas-fired power
generators have options to decrease the risk of gas price
volatility, but these instruments come at a premium.45 In
other words, volatility can be contained, but only by
pushing up the price of natural gas even further.
Finally, the option of using natural gas as a “transition
fuel” also poses risks. That is because the pipelines
required to transport natural gas from its source to power
plants are expensive. High pipeline costs have to be spread
out by building several gas-fired power plants that last a
generation or more.46
Instead of committing to such problematic transition,
Ontario can emulate the development path of world
leaders such as Germany, Spain, and Japan and actively
develop the best available renewable technologies.
6. Benefits of renewable energyin Ontario
Ontario enjoys a unique comparative advantage due to its
abundant and diverse renewable energy sources, which can
be used to provide a clean and reliable supply of electricity.
In addition to electricity generation, a variety of
renewable energy sources are highly viable to provide
heating and cooling (space conditioning) for Ontario’s
residential, commercial and institutional buildings. Solar,
biomass, and geothermal technologies are better
alternatives to the massive use of electricity and fossil fuels
(e.g. natural gas, oil and propane) currently employed in
space conditioning applications.
Renewable technologies represent safe energy choices,
which help protect human health and ecosystems, provide
economic and energy security, are easy to put in place
and create more jobs than fossil-based generation and
nuclear plants.
Wind and solar PV facilities can be built in modular
steps (e.g. extra turbines can be added or removed to
match electricity demand), do not have fuel costs, and
can be implemented faster that any other generation
option currently available. Wind plants can be built in
just one year, which enables developers to respond more
accurately to electricity use projections and short-term
changes in demand.47
Renewable energy technologies can also be installed
as smaller power units along the grid and also directly
where electricity is used (a concept known as ‘distributed
generation’), an approach that allows reducing the capital
costs and losses of transmission and distribution inherent
to centrally generated power.48 These costs combined can
total up to half of delivered power costs.49 Distributed
generation leads to a more stable and secure electricity
than the current system based on centralized utilities.
Renewable energy sources represent the biggest source
of job creation amongst all power generation options as
documented by a comprehensive study released in 2004
by researchers from the University of California.50
Because of their greater potential for creating
employment, renewable energy policies represent a key
tool for community economic development. For example,
it is estimated that wind energy projects can support rural
communities by providing tax revenues and jobs for rural
municipalities and new sources of lease income for rural
landowners ($2,500–$5,000 a year per turbine).51
Ontario enjoys the additional benefits of possessing
a skilled labour force and an advanced industrial base
that, with the right policies, can become a solid
foundation to develop the abundant renewable energy
resources available throughout the province. This report
examines five sources of renewable energy: wind,
hydroelectricity, biomass, solar and geothermal.
W I N DWind is the fastest growing source of energy in the world,
but Ontario is lagging behind. There is great potential
for large-scale wind power generation in the province.
The technically achievable wind resource in Southern
Ontario is 86 terawatts-hour (TWh) annually, or about
58% of current provincial consumption.
Based on European experience, especially that of
Germany and Spain, Ontario could install as much as
8,000 MW of wind-generating capacity by 2012. A fleet
of wind turbines representing an installed capacity of
8,000 MW could generate 14 TWh annually, or about
10% of current consumption.
Using the same assumptions as a recent economic
impact study of Quebec’s 1,000 MW tender for wind-
generating capacity, 8,000 MW of wind capacity installed
in Ontario could produce nearly $14 billion in economic
activity and 97,000 person-years of employment.52
H Y D R O E L E C T R I C I T YAlthough wind power is an intermittent resource,
management techniques can be enacted so that during
times of low wind availability, Ontario’s proposed
8,000 MW of wind turbines could be backed up by a

○ ○ ○ ○ ○ ○ ○ ○ ○ ○ ○ ○ ○ ○ ○ ○ ○ ○ ○ ○ ○ ○ ○ ○ ○ ○ ○ ○ ○ ○ ○ ○ ○ ○ ○ ○ ○ ○ ○ ○ ○ ○ ○ ○ ○ ○ ○ ○ ○ ○ ○ ○ ○ ○ ○ ○ ○ ○ ○ ○
I INTRODUCTION AND SUMMARY 7
portion of the existing provincial hydroelectric facilities
that have water reservoir capacity. Coupling wind power
with hydroelectricity is a key strategy to ensure the
province has a significant and stable source of renewable
electricity when needed.
Furthermore, if coordination measures are imple-
mented to ensure that hydroelectric facilities collaborate
with wind power producers, renewable energy can then
be used effectively to manage electricity peaks. This
innovative integration strategy is currently used in the
state of Oregon and provides a viable and practical
solution to manage the intermittent nature of renewable
resources such as wind.53
The province also has an additional 1,000 MW
available from small, low-impact hydropower develop-
ment and potential hydroelectric refurbishments, capable
of generating about 5.7 TWh per year.
B I O M A S SOntario can develop 2,450 MW of power generation
using a variety of biomass sources, which can generate
14.7 TWh per year, provide a new source of income for
the province’s forestry and agricultural sectors, and help
deal effectively with their residues. In addition to
electricity generation, biomass sources can generate
114 petajoules (PJ) of green heat that can be used to
displace electricity and fossil fuels currently used for
residential and commercial space heating.
S O L A RSurveys of the world’s solar photovoltaic (PV) market
consistently show that growth rates of 30% or more have
become an established trend. These high growth rates are
leading to a general continuing downward trend in grid-
connected PV system prices. Markets for solar water and
space heating are also increasing at impressive rates of
about 26% per year.
If supportive policies for solar energy are imple-
mented in Ontario the province could install 1,263 MW
of PV systems; 800,000 solar domestic hot water systems;
120,000 solar pool heaters; solar passive design in 420,000
new homes; 2,000 000 m2 of commercial and institutional
solar hot water systems; and 825,000 m2␣ solar air
ventilation systems. The combined energy output of these
solar systems has the technically feasible potential of
supplying by 2025 the equivalent power that coal
provided in 1999, or about half the electricity generated
by all of Ontario’s nuclear power plants.
G E O T H E R M A LGeothermal heat pumps (GHP) are the most cost-
effective option to provide space conditioning (heating
and cooling) in Ontario. GHP can be widely used to provide
heating and cooling for all new residential and commercial
buildings in the province. Ontario could install by 2010,
125,000 residential GHP systems that would provide
space conditioning needs (heating and cooling) and save
the equivalent of 2,148,400 MWh per year (7.7 PJ). By
2020, the province can install 341,000 residential GHP
systems that would provide space conditioning and save
the equivalent of 5,777,200 MWh a year (20.8 PJ).
A basic premise of this report is that energy efficiency
and conservation strategies are the most logical comple-
ment to the widespread use of renewable energy sources.
Aggressive energy efficiency measures are essential to
ensure that Ontario becomes proficient at obtaining more
energy services from lower electricity supply.
7. Renewable energy mechanisms(REM)
The current policy initiatives intended to support
renewable energy at the provincial and federal level (e.g.
provincial renewable portfolio standard and net
metering; existing federal incentives such as the wind
power producer incentive and the renewable energy
deployment initiative) are not adequate to achieve the
high rates of adoption of renewable energy that are
possible and necessary in Ontario. A detailed analysis
regarding the shortcomings of these existing policy
mechanisms is provided in subsequent chapters, in
relation to each specific renewable energy technology.
Countries such as Germany, Spain, and Japan are
leading the world in the adoption of renewable energy
and provide clear examples of what can be quickly
achieved if the right policy mechanisms are in place.
Their leadership and success is based on a set of
common factors: very active political commitment for
renewable energy; supportive education initiatives for
R&D and public awareness; strong incentive systems to
achieve widespread public participation; and implemen-
tation of an effective policy path based on the use of
renewable energy mechanisms (REMs).
The concept of REMs is simple: they allow the
connection of renewables to the grid and they specify
the price paid for renewable generation in the form of

○ ○ ○ ○ ○ ○ ○ ○ ○ ○ ○ ○ ○ ○ ○ ○ ○ ○ ○ ○ ○ ○ ○ ○ ○ ○ ○ ○ ○ ○ ○ ○ ○ ○ ○ ○ ○ ○ ○ ○ ○ ○ ○ ○ ○ ○ ○ ○ ○ ○ ○ ○ ○ ○ ○ ○ ○ ○ ○ ○
SMART GENERATION: POWERING ONTARIO WITH RENEWABLE ENERGY8
fixed-price contracts. Through an inclusive public policy
debate, legislative assemblies determine the premium to
be paid for every kilowatt-hour generated from different
renewable technologies.
As such, these premiums represent informed,
politically negotiated decisions as opposed to politically
determined quotas that limit the amount of renewables
to be implemented.
Germany, without particularly favourable wind or
solar resources, has become the world leader in wind
installations and is only second to Japan in solar
photovoltaic. Germany currently has over 14,600 MW
of installed wind capacity, and in 2003 alone installed
2,645 MW of wind turbines (by comparison the U.K.,
which has one of the best wind regimes around, has only
a total of about 649 MW of wind turbines).54
K E Y S O U R C E O F R E M : G E R M A N Y ’ SR E N E WA B L E E N E R G Y F E E D - I N L A WGermany has become a world leader in renewable energy
by implementing a sophisticated renewable energy law
(referred here as REM) that has eliminated two of the
most important obstacles inhibiting renewable energy
development: the ability to connect to the grid, and
market uncertainty. The law provides firm prices for an
extended period of time to warrant the financial risk of
investment – and to ensure market adoption of a variety
of renewable options.
One of the first forms of REM originated in 1991,
when Germany’s conservative government introduced a
law requiring utilities across the country to pay 90% of
their annual average retail rate for purchases from
clean energy sources such as wind turbines. The law,
encompassing only a few paragraphs, resulted in an
explosion of wind-generated electricity and has
positioned Germany as a world leader in renewable
energy applications.
In July 2004, the German parliament replaced
previous versions of its ‘feed-in law’ with a new
Renewables Act. The act is intended to increase the total
contribution of renewable energy to Germany’s electricity
supply, from 5% to at least 12.5% by 2010 and at least
20% by the year 2020. This is equivalent to renewable
portfolio standard (RPS) targets of 12.5% and 20%.
However, the mechanism designed to reach targets uses
a more sophisticated approach than that in the original
feed-in law or that of the renewable portfolio standards
(RPS) currently used in Canada and the United States.
Rather than setting the premium as a percentage of
retail rates, the specific premium for each technology was
chosen after parliamentary debate informed by technical
reports from the German Wind Energy Institute and the
Institute for Solar Energy Research. As an example of the
practical outcomes of this debate, consider that German
parliamentarians chose higher premiums for less windy
sites to encourage development in low wind areas of
central Germany. Their intent was to disperse wind
turbines across the landscape, rather than concentrating
huge installations only in the windiest locales. This
strategy reduces location problems and potential land-
use conflicts, and better integrates the turbines into the
electricity network.
By carefully targeting the premiums to be paid for
wind and other renewables, Germany’s REM law aims to
diversify the use of a variety of renewable energy tech-
nologies, and achieve sustained market transformations.
The renewable premiums are revisited twice a year to
monitor how the program is meeting Germany’s
objectives, and premiums are then adjusted accordingly.
New premiums were adopted in the spring of 2004.55
The revised feed law also spells out, for the first time,
how to calculate the costs for grid connection and for any
necessary reinforcement of the distribution system. The
new law then equitably apportions these costs to both
parties: the system owners and the grid operator. The law
also increases the transparency of how these costs are
determined, by allowing system owners to use third-party
consultants and contractors with access to all pertinent
technical information to advise them whether the fees
are fair.56
No other renewable energy support mechanism in the
world has produced more renewable energy than the
German REM.
S PA I N ’ S R E MSpain offers two programs: a fixed premium for projects
less than 50 MW, or a bonus payment on top of the
wholesale price. Nearly all of Spain’s wind projects have
been built using the fixed-premium mechanism. Spain,
a nation of 40 million inhabitants, now closely rivals the
United States in total installed wind capacity. Since 1999
Spain has installed nearly 1,000 MW of new capacity
annually, often much more, and by the end of 2003 had
over 6,200 MW of installed wind capacity. Spain’s REM,

○ ○ ○ ○ ○ ○ ○ ○ ○ ○ ○ ○ ○ ○ ○ ○ ○ ○ ○ ○ ○ ○ ○ ○ ○ ○ ○ ○ ○ ○ ○ ○ ○ ○ ○ ○ ○ ○ ○ ○ ○ ○ ○ ○ ○ ○ ○ ○ ○ ○ ○ ○ ○ ○ ○ ○ ○ ○ ○ ○
I INTRODUCTION AND SUMMARY 9
and its policy – not unlike the provincial policy of
Quebec – of encouraging domestic manufacturing,
has created a dynamic market with two indigenous
manufacturers, Gamesa Eolica and Ecotecnia, as well as
a host of Spanish affiliates of Northern European
manufacturers. Spanish manufacturer Gamesa Eolica’s
strong position in the competitive Spanish market has
enabled it to begin exporting to the United States.
D A N I S H R E MThe Danish parliament created the Danish REM system
to encourage individual action toward meeting their
energy and environmental policy. For two decades,
Danish energy policy enabled farmers, businesses, and
homeowners to install wind turbines, which they owned
outright, or in which they owned a share. Danish law
permitted inter-connection of wind turbines with the
grid and specified the premium that would be paid for
their production.
The Danish REM system provided a stable domestic
market for Danish wind turbine manufacturers. The
program was so successful that Danish manufacturers are
now leaders in the technology and Danish wind turbines
are exported around the world. Today, Denmark produces
nearly 20% of its electricity with wind energy.
The REM program was scrapped in the early 2000s in
favor of a certificate trading system. The poor results from
the trading system recently led to the abandonment of the
program and the country may re-install an REM system.
O T H E R C O U N T R I E S W I T H R E MIn total there are nine countries in Europe and South
America using renewable energy mechanisms as the
principal mechanism to support renewables (Austria,
Brazil, France, Germany, Greece, Luxembourg, Portugal,
Spain, and the Netherlands). Countries that have recently
adopted REMs include Austria and the Netherlands. Like
Denmark, the Netherlands had switched from REM to a
certificate trading system in the early 2000s, but they then
reintroduced REM in 2004. Two more European coun-
tries are considering REMs: Italy for solar-electric systems,
and the Czech Republic for wind and solar energy.
REMs are more egalitarian than almost any other sup-
port mechanism, enabling communities, cooperatives, and
farmers as well as commercial renewable energy developers
to participate in the rapid expansion of renewable capacity.
The fixed-premium contracts under REM reduce
price volatility from utility purchases in the spot market,
helping to ensure price stability.
REMs can also be an integral part of a conservation
culture by instilling in consumers and the market the
necessity of paying for value. Renewable energy has a
higher value because of its environmental, social, and tech-
nical benefits and therefore its price should reflect this.
TABLE 3
Ontario’s renewable energy potential for electricity and thermal applications
Installed capacity Electricity generation (GWh/Year) Thermal contribution PJ/Year
Wind 8,000 MW (2012) 14,000Hydroelectric (low-impact) 1,000 MW (2020) 5,700Biomass:Electricity 2,450 MW (2010–2020) 14,700Thermal 114Geothermal heat pumps 125,000 systems (2010) 7.7
341,000 systems (2020) 20.8Solar:Photovoltaic (PV) electricity 1263 MW (2025) 1,263Thermal 800,000 SDHW (2025) 9.6
120,000 SPH (2025) 6.6420,000 new homes with SPD (2025) 85.7
2,000 000 m2 of C & I SHW (2025) 4.0825,000 m2␣ SAV (2025) 7.2
Note.SDHW = solar domestic hot water systemsSPH = solar pool heatersSPD = solar passive designC & I SHW = commercial and institutional solar hot waterSAV = solar air ventilation.

○ ○ ○ ○ ○ ○ ○ ○ ○ ○ ○ ○ ○ ○ ○ ○ ○ ○ ○ ○ ○ ○ ○ ○ ○ ○ ○ ○ ○ ○ ○ ○ ○ ○ ○ ○ ○ ○ ○ ○ ○ ○ ○ ○ ○ ○ ○ ○ ○ ○ ○ ○ ○ ○ ○ ○ ○ ○ ○ ○
SMART GENERATION: POWERING ONTARIO WITH RENEWABLE ENERGY10
8. Conclusion andrecommendations
The current government approach to deploy renewable
energy in Ontario entails the high risk that only the most
profitable sites (e.g. areas with the highest wind speeds)
will be developed, and that only a few renewable energy
technologies will be used (e.g. large wind and hydro-
electric facilities, landfill gas).
Clear policies are required to ensure that all the
renewable energy sources that exist throughout the
province are fully tapped in a sustained and stable
manner. Furthermore, smart policies are also needed to
develop favourable conditions so a wide variety of
participants and local organizations can actively engage
in the implementation of large-scale and distributed
generation systems in rural and urban areas.
The accumulated experience from the six countries
leading in the worldwide adoption of renewable energy
is clear: success is achieved through conscious policy
decisions that create increasing demand for renewable
energy technologies, ensure favourable access to the
electricity grid at fair prices, facilitate low cost financing,
provide tax incentives and smart subsidies, legislate
standards, support education initiatives, and encourage
active stakeholder participation.57
All the estimates about resource and technical
potential of various renewable energy technologies are
estimates based on the best available information from
peer-reviewed journals, government and industry data
from Ontario and other jurisdictions. While these figures
are well-informed general estimates, they are not a
substitute for more comprehensive analysis of the
provincial renewable energy potential, and its associated
economic and health benefits. The federal and provincial
government should collaborate to conduct such analysis
as soon as possible.
To develop Ontario’s full potential of renewable
energy and to ensure that the multiple benefits
of renewable energy (e.g. job creation, industrial develop-
ment opportunities) favours local communities, this
report provides the following policy recommendations:
1. Expand the mandate of the proposed Conserva-tion Bureau (hereafter referred as SustainableEnergy Bureau) to include development ofdistributed renewable energy sources such ason-site solar, geothermal heat pumps, andbiomass digesters.
2. Position the proposed Sustainable Energy Bureaucentrally in the machinery of the OPA so thatconservation, efficiency and renewable energy –the very essence of a robust electricity system –are the priorities that shape the entire agendaof the OPA. Whether this Sustainable EnergyBureau has its own board or an advisory body,it must have the authority and practical toolsto influence the operation of the entireelectricity system.
3. Mainstream grid scale renewables so that they areprioritized by the Ontario Power Authority (OPA).
4. Enact and negotiate stable, renewable energymechanisms (REM) to provide specific electricitygeneration (kWh) payments for each renewableenergy option (taking into account projectlocation, market share, and level of tech-nological development), and to establish andfacilitate the right for renewable energy generators(REG) to connect into the electricity grid.
5. Implement a stable funding mechanism tofinance the activities of the SustainableEnergy Bureau.58
6. Consolidate federal support to implement aprovincial education strategy to train and certifyrenewable energy specialists and installers,quantify and map all renewable resourcesavailable in the province, increase publicawareness on renewable energy potentialand support programs.
7. Collaborate with the federal government in theestablishment of a provincial revolving loanfund to provide interest-free loans to installdistributed generation systems in farms, residencesand businesses throughout the province.
8. Initiate a process with the federal government toquantify the environmental and social costs of allforms of electricity generation and delivery sothese costs can be included into the price ofeach electricity option to better informinvestment comparisons.
9. Develop a collaborative process with the largestprovincial users of electricity (e.g. auto and steelmanufacturers, mining companies) to establish arational system to deal with electricity peak use.
10. To stimulate market transformation, direct alllevels of government (provincial and municipal)to use their procurement capacity to purchase

○ ○ ○ ○ ○ ○ ○ ○ ○ ○ ○ ○ ○ ○ ○ ○ ○ ○ ○ ○ ○ ○ ○ ○ ○ ○ ○ ○ ○ ○ ○ ○ ○ ○ ○ ○ ○ ○ ○ ○ ○ ○ ○ ○ ○ ○ ○ ○ ○ ○ ○ ○ ○ ○ ○ ○ ○ ○ ○ ○
I INTRODUCTION AND SUMMARY 11
their electricity needs from renewable energysources, and to ensure that any new government-funded building incorporates renewable energytechnologies for heating and cooling purposes.This strategy should be financed through newfederal-provincial collaborations and shouldstart by working with large government usersof electricity such as the Toronto TransitCommission to purchase all their electricityfrom renewable energy sources (as is alreadydone through Calgary Transit’s initiative “Ridethe Wind”).
As this study illustrates, Ontario has abundant
opportunities to use electricity more efficiently, and an
immense variety of renewable sources to satisfy its current
and future power needs. Furthermore, with its industrial
infrastructure and skilled workforce, the province has all
the elements needed to replace its aging electricity system
with a variety of sustainable options.
The next chapters of this report illustrate the vast
opportunities for implementing efficiency and renewable
energy strategies available in Ontario and present
additional policy mechanisms to tap into these significant
opportunities.
I N D U S T R Y J U M P S O NC O N S E R VAT I O N B A N D W A G O N
Falconbridge, a large Toronto-based mining company,has a network of energy managers identifying howthe company can save consumption costs year round.
Falconbridge’s corporate goal is to reduce energyintensity by one percent per year by 2005 based on1990 levels.
During the summer, Falconbridge shuts down itsSudbury and Trimmings smelters for maintenance andvacation – a plan that has been in place for severalyears.
The shutdown is timed in an effort to avoid thehigh-energy demand and high-cost electricity periodsof the summer months. In this way, the company isbetter able to meet its energy cost budgets andreduces the potential impact of brownouts and
blackouts should the provincial electricity systembecome overloaded.
During the summer, crews continue to take oreout of the ground but stockpile it so that Falcon-bridge’s metallurgical plants can operate at fullcapacity for the remainder of the year.
To further control energy use, Falconbridge’sSudbury Mines/Mills Energy Management Teamcreated a tool that displays daily energy consumptionin its various forms. These “daily consumption reports”help lower energy use. For example, jobs that are nottime-sensitive, such as the hoisting of materials, canbe shifted to hours with lower electricity rates. Thereports also help identify waste, such as undergroundequipment running when not needed, and the use ofexcess compressed air.

○ ○ ○ ○ ○ ○ ○ ○ ○ ○ ○ ○ ○ ○ ○ ○ ○ ○ ○ ○ ○ ○ ○ ○ ○ ○ ○ ○ ○ ○ ○ ○ ○ ○ ○ ○ ○ ○ ○ ○ ○ ○ ○ ○ ○ ○ ○ ○ ○ ○ ○ ○ ○ ○ ○ ○ ○ ○ ○ ○
SMART GENERATION: POWERING ONTARIO WITH RENEWABLE ENERGY12
I N T R O D U C T I O N N O T E S percent is lost as waste heat); see NRCan. (2004). EnergyEfficiency Trends in Canada. Ottawa: NRCan. Available athttp://oee.nrcan.gc.ca/neud/dpa/data_e/Trends04/chapter_8.cfm
7 These liabilities include construction cost overruns as wellas cost overruns for repairs. For example, the Darlingtonnuclear plant rose from an original estimate of $3.95 billionin 1978 to a final actual cost of $14.4 billion. For moredetails see Appendix 2 of Winfield, M.S., Horne, M.,McClenaghan, T. and Peters, R. (2004). Power for theFuture: Towards a Sustainable Electricity System forOntario. Calgary: Pembina Institute for AppropriateDevelopment and Canadian Environmental LawAssociation, available at www.pembina.org. The repairsof Pickering Unit 4 were estimated in 1999 to cost $457million and were expected to be completed by mid 2001,the actual costs totaled $1.25 billion and were completedby September 2003; for more details see Epp, J, Barnes, P.and Jeffrey, R. (2003). Report of the Pickering “A” ReviewPanel. Available at www.energy.gov.on.ca/english/pdf/pickering_report_dec2003_en.pdf
8 Ontario Electricity Financial Corporation. (2003). 2003Annual Report Ontario Electricity Financial Corpora-tion. Toronto: OEFC. Available at http://www.oefc.on.ca/pdf/oefc_ar_2003_e.pdf
9 OPG income before income taxes for 1999–2003 was(amounts in millions of dollars and amounts inbrackets indicate liability): Pickering A unit 4 return toservice ($1571), other nuclear operations ($1,571), fossiland hydro operations ($50), electricity markets $1,672,other factors $442; for more details see Ontario PowerGeneration financial reports available at www.opg.com/ir/reports.asp
10 See Ministry of Energy press release (July 7, 2004): “OntarioGovernment Restarts Pickering Unit To Increase ElectricitySupply” available at www.energy.gov.on.ca
11 See page 49 of Manley, J., Epp, J., Godsoe, P. (2004).Transforming Ontario’s Power Generation Company:Report from the Committee to Review Ontario PowerGeneration. Available at www.energy.gov.on.ca/index.cfm?fuseaction=electricity.reports_opgreview
12 According to Winfield et al. (op. cit. note 4, pp.2 and 48)a 1997 Ontario Hydro report titled: “Report to ManagementIIPA/SSFI Evaluation Findings and Recommendations”prompted Ontario Hydro to adopt its Nuclear AssetOptimization Plan (NAOP), which led to the repairs offour units at Pickering A and three units at Bruce B.
13 See page 30 of Winfield et al. (2004) op.cit. note 4.14 See Ministry of Energy (June 24, 2004) press release:
“McGuinty Government Sparks Interest In GreenElectricity ” available at www.energy.gov.on.ca. On April28, the government initiated a Request for Proposals(RFP) for 300 megawatts of renewable electricity toidentify interested proponents. For more details seewww.ontarioelectricityrfp.ca
15 Ontario’s wind figures reproduced from Canadian Wind
1 In speech delivered at the Empire Club, Minister Duncanstated that Ontario faces an energy crisis and that “itneeds to refurbish, rebuild, replace or conserve 25,000MW of generating capacity by the year 2020 to meetgrowing demand while replacing polluting coal firedgeneration. That represents 80 percent of Ontario’scurrent generating capacity and would require aninvestment of $25 to $40 billion”. For more details seeMinistry of Energy press release (April 15, 2004):“New Vision For Electricity Sector Will Mean NewSupply, Increased Conservation, Stable Prices” availableat www.energy.gov.on.ca/index.cfm?fuseaction=english.news
2 It is a fact that natural gas-fired power plants emitlower levels of sulphur dioxide and nitrogen oxidesthan coal-fired plants. However, these lower emissionsremain a concern, since they contribute to acid rainand ground level ozone, both of which can damageforests and agricultural crops. Ground level ozone(commonly called smog) has also been linked to arange of respiratory illnesses. More recently, groundlevel ozone has been linked to the development ofchildhood asthma, the “most common chronic disease”among children. See National Institute of EnvironmentalHealth Sciences. (2002). Multi-Sports in Ozone MayRaise Asthma Risk. Press Release (January 31, 2002available at www.niehs.nih.gov). Possibly more troublingare the emissions of fine particulates from gas-fired powerplants. Though particulate emissions are about one-tenthwhat they are for coal power, the U.S. EnvironmentalProtection Agency estimates that 77% of particulatesfrom natural gas plant are of a dangerously small size.
3 The government of Ontario intends to retire the follow-ing coal plants by 2007 (year of installation): Lambton(1969), Nanticoke (1972), Lakeview (1962), ThunderBay (1963 & 1982), Atikokan (1985). Ontario’s nuclearplants will all have to be retired by 2018 (year ofinstallation): Pickering A (1971–1973), Pickering B(1983–1986), Bruce A (1976), Bruce B (1984), Darling-ton (1992–1993).
4 Reproduced from Table 1.1 page 3 of: Winfield, M.S.,Horne, M., McClenaghan, T. and Peters, R. (2004). Powerfor the Future: Towards a Sustainable Electricity System forOntario. Calgary: Pembina Institute for AppropriateDevelopment and Canadian Environmental LawAssociation, available at www.pembina.org
5 This amounts to approximately 2,000 MW of capacity;the equivalent of the entire Pickering A nuclear generatingstation or enough energy to power 1,000,000 Ontariohomes.
6 The average efficiency of generating infrastructure rangesbetween 30–40 percent. That is, only 30–40 percent ofthe potential energy in the original fuel source (coal, gas,etc.) is actually converted to electricity (the other 60–70

○ ○ ○ ○ ○ ○ ○ ○ ○ ○ ○ ○ ○ ○ ○ ○ ○ ○ ○ ○ ○ ○ ○ ○ ○ ○ ○ ○ ○ ○ ○ ○ ○ ○ ○ ○ ○ ○ ○ ○ ○ ○ ○ ○ ○ ○ ○ ○ ○ ○ ○ ○ ○ ○ ○ ○ ○ ○ ○ ○
I INTRODUCTION AND SUMMARY 13
Energy Association (www.canwea.ca/en/CanadianWindFarms.html), and German figures reproduced fromEuropean Wind Energy Association (www.ewea.org).
16 Sawin, J.L. (2004). Mainstreaming Renewable Energy inthe 21st Century. Washington D.C.: Worldwatch Insti-tute. Available at www.worldwatch.org
17 For more details see page 20 of Ontario Clean AirAlliance. (2004). Phasing Out Coal: Six Month ProgressReport. Toronto: OCAA. Available at www.cleanairalliance.org
18 Commission for Environmental Cooperation. (2004).Taking Stock 2001: North American Pollutant Releases andTransfers. Montreal: CEC. Available at www.cec.org/files/PDF/POLLUTANTS/TS2001-Report_en.pdf
19 For a summary of key epidemiological studies see page110 of Somers, C.M., McCarry, B.E., Malek, F, andQuinn, J.S. (2004). Reduction of Particulate AirPollution Lowers the Risk of Heritable Mutations inMice. Science, 304 (May 14), 1008–1010.
20 Ontario Medical Association (2001). Ontario’s Air:Years of Stagnation. Toronto: OMA. Available at www.oma.org
21 Ibid see page 6.22 According to Ontario Power Generation, in 2001 Ontario’s
five coal plants emitted 35.1 megatonnes (Mt) of CO2.
See page 52 of Ontario Power Generation, TowardsSustainable Development: 2001 Progress Report, availableat www.opg.com/envComm/SED2001Report.pdf.According to the latest published government figures,Ontario’s total 2001 greenhouse gas emissions where 201Mt C02eq (in 2001 all the automobiles and light-dutytrucks used in Ontario emitted close to 35.5 Mt). Fordetails see p.186 of Olsen, K. et al. (2003). Canada’sGreenhouse Gas Inventory 1990–2001. Ottawa: Green-house Gas Division, Environment Canada. Available at:www.ec.gc.ca/pdb/ghg
23 See IPCC. (2001). Climate Change 2001: The ScientificBasis. Contribution of Working Group I to the ThirdAssessment Report of the Intergovernmental Panel onClimate Change [Houghton, J.T.,Y. Ding, D.J. Griggs, M.Noguer, P.J. van der Linden, X. Dai, K. Maskell, and C.A.Johnson (eds.)]. Cambridge: Cambridge University Press.Available at www.ipcc.ch
24 Government of Canada. (2003). Climate Change Plan forCanada. Available at www.climatechange.gc.ca./plan_for_canada/
25 For details see Stewart, K. (2003). Ontario and Kyoto.Ottawa: Climate Action Network. Available at www.climateactionnetwork.ca/resources.html
26 For example see: European Environment Agency. (2004).Exploring the Ancillary Benefits of the Kyoto Protocol forAir Pollution in Europe. Copenhagen: EEA. Available at:http://reports.eea.eu.int/technical_report_2004_93/en
27 For details see sections 3.69, 3.71 and Appendix C inCommissioner of the Environment and SustainableDevelopment. (2000). Government Support for Energy
Investment. Ottawa: Office of the Auditor General.Available at: www.oag-bvg.gc.ca/domino/reports.nsf/html/c003ce.html
28 “Atomic Energy of Canada Limited estimated, based onthe results of this program, that the cost of finding asite and constructing, operating and closing a HLWdisposal facility for five million bundles of used fuel isabout $9 billion (in 1991 dollars). This estimateincludes ongoing research and development onpotential sites but excludes costs of monitoring theenvironment around the facility.” See chapter 3, FederalRadioactive Waste Management, in Office of theAuditor General. (1995). 1995 Report of the AuditorGeneral of Canada. Ottawa: Office of the AuditorGeneral. Available at: www.oag-bvg.gc.ca/domino/reports.nsf/html/9503ce.html#0.2.NJDBJ2.9FBMWI.A4RLQE.W4
29 See Commissioner of the Environment and SustainableDevelopment. (2000). Op.cit. endnote 24 exhibits 3.33and exhibit 3.4.
30 One of the few reports to incorporate environmentalcosts to the price of power in Ontario was conducted in1997 and resulted in a generation price for coal power of10 cents per kWh and for nuclear power of 15 cents perkWh. See Argue, D. (1997). A Review of the Economic Costof Power in Ontario. Available at www.newenergy.org/costofpower_report.html. Note that these figures arewithin the range of a recent evaluation, conducted bySawin op.cit note 13, which incorporated environmentaland health costs into the cost of electricity generationusing European and U.S. data. Sawin’s calculationsresulted in a generation price for coal power of 9–29cents per kWh and for nuclear power 13–19 cents perkWh (Sawin’s original figures where converted from U.S.currency using a conversion rate of $1 U.S. = $0.76 CAD)
31 See for example Winfield op.cit. note 4 and Torrie, R. andParfett, R. (2003). Phasing Out Nuclear Power in Canada:Toward Sustainable Energy Futures. Ottawa: Campaignfor Nuclear Phaseout. Available at www.cnp.ca
32 Winfield et al. (2004, p.37, op. cit note 4) state thatcapital investments of $18.2 billion over the 2005–2020period would be required to achieve the efficiency gainsdescribed by their research and that 96% of these costswould be recovered by consumers through the energysavings resulting from that investment.
33 For example, peak reductions achieved throughdemand response measures by large electricity users.Estimates developed for the IMO indicate that up to10% of Ontario’s peak demand could be shifted throughdemand response measures (DRM). About 2 percent ofthe province’s customers (e.g. mining firms, steel and carmanufactures) use about 50 percent of Ontario’s powerso DRM can be organized between the government andthis group of large power users to improve provincialpower use and to achieve industrial production gains.See Winfield, op.cit. note 4 and Bloom, R. (2004).

○ ○ ○ ○ ○ ○ ○ ○ ○ ○ ○ ○ ○ ○ ○ ○ ○ ○ ○ ○ ○ ○ ○ ○ ○ ○ ○ ○ ○ ○ ○ ○ ○ ○ ○ ○ ○ ○ ○ ○ ○ ○ ○ ○ ○ ○ ○ ○ ○ ○ ○ ○ ○ ○ ○ ○ ○ ○ ○ ○
SMART GENERATION: POWERING ONTARIO WITH RENEWABLE ENERGY14
Corporations keep their cool on power: As temperaturesrise, big consumers plan no changes to production,Globe and Mail (June 29, 2004).
34 Reproduced from table 5.10 Winfield et al. (2004) op.citnote 4.
35 Bachrach, D., M. Ardema, and A. Leupp. Energy EfficiencyLeadership in California: Preventing the Next Crisis. (SanFrancisco: Natural Resources Defense Council, 2002).The full report is available at: www.nrdc.org/air/energy/eecal/eecal.pdf
36 See Winfield et al. (2004) op. cit. note 5 and Torrie andParfett (2003) op.cit. note 31.
37 See note 2.38 Lechtenbohmer, S., Fischedick, M., Dienst, C. and Hanke,
T. (2003). GHG-Emissions of the Natural Gas Life CycleCompared to other Fossil Fuels (in Europe). Proceedingsfrom the 3rd International Methane and Nitrous OxideMitigation Conference, Nov. 17–21. Beijing, China:Wuppertal Institute.
39 See, for example Energy Information Administration.2003. “Annual Energy Outlook 2003.” Electronic databaseaccessed on April 1, 2004 at http://www.eia.doe.gov/bookshelf/brochures/aeo2003/AEOBrochure.html.
40 The U.S. added 67,000MW of gas-fired power between1980 and 1999, and an additional 111,000MW of poweris projected by 2007 in the western North America gridalone. Foley, D., Herzog, S. and Scott, G. (2001). BritishColumbia at the Crossroads: Clean Energy or MorePollution? Vancouver: David Suzuki Foundation.
41 Energy Information Administration. 2004. “CountryAnalysis Briefs: Canada.” Electronic database accessed onApril 14, 2004 at www.eia.doe.gov/emeu/cabs/canada.html
42 Ibid.43 See page 13 of Wilson, F. (2001). Who’s making money
on natural gas prices? What should government do?Vancouver: Canadian Centre for Policy Alternatives.
44 In 2000, several events brought about an eleven-foldincrease in the price of wholesale electricity, which droveup natural gas prices to record levels. True, an ill-conceived deregulation plan in California was a keyreason for the increase. But with more and more juris-dictions taking the deregulation route, electricity prices –and, by extension, natural gas prices – may continue tofluctuate for Canadian utilities relying increasingly ongas-fired power. In fact, price volatility has continued,even well after the California debacle. For more detailssee p.4 of Bolinger, M., Wiser, R. and Golove, W. (2004).Accounting for Fuel Price Risk When Comparing Renew-able to Gas-Fired Generation: The Role of Forward NaturalGas Prices. Berkeley: Lawrence Berkeley NationalLaboratory.
45 Ibid. p. 6–8.46 For example, building a natural gas pipeline to Vancouver
Island would require three new large gas-fired plants,doubling BC Hydro’s greenhouse gas emissions. Formore details see Jaccard, M. (2002). Gas pipeline a
project deserving real public debate. Vancouver Sun,January 3.
47 One-year construction estimate based on page 6 ofCanadian Wind Energy Association. (2004). Submissionby the Canadian Wind Energy Association to the Federal/Provincial/Territorial Council of Energy Ministers’ MeetingJuly 19, 2004/Iqualuit, Nunavut. Available at www.canwea.org Combined cycle natural gas plants can bebuilt in about two years (for example see Ford, A. (2001).Simulation Scenarios for the Western Electricity Market:Paper for the California Energy Commission Workshopon Alternative Market Structures for California. Availableat: www.wsu.edu/~forda/bbust.html).
48 Further benefits of this approach include: modularity,short lead time, fuel diversity and reduced price volatility,load-growth insurance and load matching, reliability andresilience, local and community choice and control,avoided emissions and environmental impacts. SeeDunn, S. (2002). Micropower: New variable in theEnergy-Environment-Security Equation, Bulletin ofScience, Technology and Society, 22 (2), 72–86.
49 Beck, F. and Martinot, E. (in print). Renewable EnergyPolicies and Barriers. Available at www.martinot.info/re_publications.htm
50 Kammen, D.M., Kapadia, K, and M. Fripp (2004) PuttingRenewables to Work: How Many Jobs Can the CleanEnergy Industry Generate? RAEL Report, University ofCalifornia, Berkeley. Available at http://ist-socrates.berkeley.edu/~rael/renewables.jobs.pdf
51 Canadian Wind Energy Association op.cit note 47.52 Hélimax. (2004). Étude sur L’Évaluation du Potentiel
Éolien, de son Prix de Revient et des Retombees Écono-miques Pouvent en Déouler au Québec, Dossier R-3526-2004. Montreal: Hélimax. Available at http://www.helimax.com/dossier_r35262004.pdf. For 1,000 MW:6.7 person-years/$1 million; 121.5 person-years/TWh foroperation. For 4,000 MW: 7.7 person-years/$1 million;107.9 person-years/TWh. Note: it is not explained in thetext why there would be more people employed perdollar invested at 4,000 MW than 1,000. Assuming4,000 MW installed at the rate of 1,000 MW/yr andoperating for 25 years, the German employment valueswould produce about 97,000 person-years, versus theHelimax’s estimate of 78,000 person-years.
53 The Bonneville Power Authority currently offers twosystems to support wind power using hydroelectricity:a network wind integration service and a storage andshaping service; for details see www.bpa.gov/Power/PGC/Wind/wind.html
54 See graphic 2 press release of European Wind EnergyAssociation (March 10, 2004): “Record euro $8 Billion ofwind power installed globally in 2003” available atwww.ewea.org/04media/press.asp
55 REMs in the new EEG cover wind, solar photovoltaic inseveral different applications, hydro plants of varioussizes, several forms of biomass, and geothermal plants of

○ ○ ○ ○ ○ ○ ○ ○ ○ ○ ○ ○ ○ ○ ○ ○ ○ ○ ○ ○ ○ ○ ○ ○ ○ ○ ○ ○ ○ ○ ○ ○ ○ ○ ○ ○ ○ ○ ○ ○ ○ ○ ○ ○ ○ ○ ○ ○ ○ ○ ○ ○ ○ ○ ○ ○ ○ ○ ○ ○
I INTRODUCTION AND SUMMARY 15
various sizes. For the actual mechanisms see http://www.ontario-sea.org/REMs/GermanREMs2004.xls
56 For an explanation of how the German mechanismscame into effect and how they are applied see WilsonRickerson, German Renewable Energy Feed In TariffsPolicy Overview, http://www.ontario-sea.org/REMs/REMsRickerson.html
57 For the past decade six countries: Denmark, Germany,India, Japan, Spain and the United States have achieved80 percent of the world’s wind and solar installationthrough policy mechanisms that address these factors(Sawin, op.cit. note 16).
58 Some viable options for stable funding include: develop-ing a public benefit fund based on a 0.3 cent surcharge ineach kWh sold in the province; levying a carbon tax onelectricity generated by fossil fuels (as it is done in theNetherlands). For more information on the fundingalternatives currently used in the U.S. see www.cleanenergystates.org/Funds/

GeneratingGenuine Wealth
17
Wind Powerin Ontario2
Summary
Worldwide experience shows that by investing
in and developing wind power, Ontario will help create a
more stable and reliable electricity system, a cleaner en-
vironment and new economic opportunities.
There is no comprehensive wind resource assessment
of Ontario. New digital maps are being prepared, but they
were not ready in time for this study. However, using
accepted estimating techniques and the performance of
wind turbines operating in similar wind regimes in
Germany, a significant wind resource has been identified.
The technically achievable wind resource in Southern
Ontario is 86 TWh annually, or about 58% of current
provincial consumption.
Based on European experience, especially that of
Germany and Spain, Ontario could install as much as
8,000 MW of wind-generating capacity by 2012. This is
more ambitious than the tender by Quebec for 1,000 MW
of wind capacity, but it is in line with the pace of current
European development. This fleet of wind could generate
14 TWh annually, or about 10% of current consumption.
Using the same assumptions as a recent economic
impact study of Quebec’s 1,000 MW tender for wind-
generating capacity, 8,000 MW of wind capacity installed
in Ontario could produce nearly $14 billion in economic
activity and 97,000 person-years of employment.
Despite a modest wind resource, Germany is the
world’s wind energy powerhouse. Wind turbines in
Germany are capable of generating more than 28 TWh
per year, the equivalent of nearly one-fifth of Ontario’s
current electricity consumption. Germany has a dynamic
and competitive market for wind energy because of its
renewable energy mechanisms. These mechanisms
eliminated two of the most important obstacles inhibiting
wind development: the ability to connect to the grid, and
a firm premium for an extended period of time to warrant
the financial risk of investment.
German renewable mechanisms pay one price for
wind turbines in windy areas, and higher prices for
turbines located at less windy sites. This is intended to
avoid the concentration of wind turbines in only the
windiest locales and ensure that wind turbines are
distributed across the country.
Currently there are no renewable mechanisms in
Ontario and the province has launched a tendering
system instead of renewable mechanisms. Analysis of
existing experience shows that tendering systems have not
succeeded in creating dynamic markets.
1. Background on wind energy1
Wind energy is one of the most successful of the new
renewable technologies developed during the latter part
of the 20th century. From humble beginnings as the darling
of backyard tinkerers and anti-nuclear activists in
Denmark in the late 1970s, Danish technology leapt the
Atlantic and fueled the great California “wind rush” of
the early 1980s.2 Though not without its technological
and commercial setbacks, the wind industry has continued
to grow and prosper over the intervening two decades.
1 . 1 WORLDWIDE WIND DEVELOPMENT 3
At the end of 2003 there were 40,000 megawatts (MW) of
commercial wind-generating capacity operating world-
wide, some three-quarters of that in continental Europe.4

○ ○ ○ ○ ○ ○ ○ ○ ○ ○ ○ ○ ○ ○ ○ ○ ○ ○ ○ ○ ○ ○ ○ ○ ○ ○ ○ ○ ○ ○ ○ ○ ○ ○ ○ ○ ○ ○ ○ ○ ○ ○ ○ ○ ○ ○ ○ ○ ○ ○ ○ ○ ○ ○ ○ ○ ○ ○ ○ ○
SMART GENERATION: POWERING ONTARIO WITH RENEWABLE ENERGY18
FIGURE 1 World wind capacity. Wind energy is growing rapidlyworldwide with most of the growth taking place in Europe.About three-quarters of the world’s wind generating capacityhas been installed in the densely populated countries ofcontinental Europe, notably Germany, Spain, and Denmark.Despite its size, wealth, and early start in wind energy, the U.S.accounts for less than one-fifth of the world’s wind capacity.
By contrast, North America with a much greater land
mass and a lower population density than Europe,
accounts for less than one-fifth of total world wind
capacity. Nearly 8,000 MW of new wind capacity was
installed in 2003 alone.
Nearly 300 MW were installed offshore in 2002
(equivalent to almost all of Canada’s installed capacity).
Most of that was in Denmark, but there were some 20
MW installed off the Dutch and the Swedish coasts.
Altogether, offshore installations accounted for 3% of the
world market in 2002. By 2007 offshore wind is expected
to account for 14% of the world’s new wind capacity.5
The technological and commercial development of
offshore wind projects in Danish, British, Irish and
German territorial waters may have a profound effect on
wind development in Ontario. With the province’s 1,500
km of shoreline along the Great Lakes and the shallow
waters offshore, there is significant potential for
development in this area. Typically, offshore projects are
more expensive to develop than sites on land. However,
the greater unobstructed winds available offshore and the
reduced turbulence over water combine to produce greater
yields than found on land nearby. In addition, the
province already owns all rights for development offshore
which can greatly facilitate offshore wind installation.
1 . 2 W I N D E N E R G Y I S AM AT U R E B U S I N E S S
Wind energy has become a multi-billion dollar industry.
In 2003, total revenues from the sale of wind-generated
electricity, wind turbines, towers, and development
services reached nearly $28 billion.
The Canadian Wind Energy Association (CANWEA)
estimates that installing 1 MW of wind power in Ontario
currently costs $1.5 million.6 The largest project installed
to date is the 9 MW array of five turbines at the Bruce
nuclear plant; however, no data is publicly available on
the actual cost of the project. The German wind energy
association reports average installed costs across the
German wind sector of $1.9 million per installed MW of
wind power.7
The cost of installed wind generation has dropped
remarkably during the past two decades partly by
economies-of-scale as the turbines have become larger,
and partly by learning how to build, install, and operate
wind turbines more effectively.
In the 1990s, the cost for of turbines fell by nearly
20% for every doubling of the number of wind turbines
manufactured.8 During the late 1990s, the production of
commercial-scale wind turbines doubled almost every
three years.
1 . 3 T E C H N I C A L C O N S I D E R AT I O N S
1 . 3 . 1 I N T E G R AT I O N
Some utilities have been reluctant to consider wind energy
as a significant new source of generation because of
concerns about the quality of the power produced, the
difficulty of regulating wind’s variable generation, and
confusion about the true value to the utility of wind
generation. Some utilities worry that wind energy,
because it is intermittent, is “unreliable” and is not able
to provide firm capacity.
On the surface, it appears that a resource that cannot
be controlled at will threatens the reliability of an
integrated electric utility. Fortunately, a better under-
standing of wind technology is overcoming the concern
about wind energy’s intermittency – what to do when
the wind stops blowing. Although wind power technology
has surpassed institutional knowledge, the idea lingers.
74%
17%
8%
CANADA 1%
WORLD WIND CAPACITY 2003~ 40,000 MW
EUROPE
U.S.A.
ASIA

○ ○ ○ ○ ○ ○ ○ ○ ○ ○ ○ ○ ○ ○ ○ ○ ○ ○ ○ ○ ○ ○ ○ ○ ○ ○ ○ ○ ○ ○ ○ ○ ○ ○ ○ ○ ○ ○ ○ ○ ○ ○ ○ ○ ○ ○ ○ ○ ○ ○ ○ ○ ○ ○ ○ ○ ○ ○ ○ ○
I I WIND POWER IN ONTARIO 19
That is, according to conventional wisdom, utilities would
still need the same amount of generating capacity with
or without wind power plants, because the wind is
intermittent, or it is sometimes unavailable when most
needed.
1 . 3 . 2 C A PAC I T Y C R E D I T
Although wind turbines may be idle due to a lack of wind
at times of a utility’s peak demand, there is a statistical
probability that they will be available, especially if there
are multiple wind turbines dispersed geographically
across a region. In this, wind turbines are no different
from conventional power plants. No generating plant
operates 100% of the time, and no power plant is 100%
dependable during peak loads.
The work of engineers on both sides of the Atlantic
has refuted the notion that wind energy cannot supply
some degree of dependable power.9 The question
becomes not if there is any capacity value in wind energy,
but what is its value in offsetting the construction of
conventional capacity.
Utilities traditionally have viewed wind energy solely
as a fuel saver.10 Each kilowatt-hour generated by a wind
turbine offsets a kilowatt-hour that would have been
otherwise generated. But in some cases, the capacity value
of wind energy to a utility is equal to that of the fuel it
offsets.11
Moreover, in some locales there is a good fit between
the wind resource and the load. One study for Pacific
Gas & Electric Company found an exceptional match
between the wind resource in California’s Solano county
and demand justified a capacity credit nearing that of a
conventional fossil plant based on a loss of load analysis.
Using the same analysis, the utility found a lesser, but
not insignificant, value for the Altamont Pass. The
capacity credit for the Altamont Pass was found to be
surprisingly similar to the area-wide capacity factor.12
In a recent report the California Energy Commission
examined the capacity value of several sources, including
wind energy. The report concluded that the capacity
credit for wind energy is significantly lower than
conventional resources, “but shows that wind can help
reduce system risk. . .the wind capacity credit values are
consistent with what we would find for a conventional
unit with a very high forced outage rate of about 75%.”13
European studies have found that up to 20% of demand
could be supplied by wind energy without changes to the
existing transmission and regulation system.14
1 . 3 . 3 P E N E T R AT I O N
There are several regions of northern Europe where
existing wind generation exceeds 20% of supply annually.
Wind supplies nearly 20% of Danish electricity
and during windy winter months the contribution is
even higher. In some coastal states of Germany,
wind’s contribution exceeds 20% and in the county of
Ostfriesland, wind accounts for more than half of annual
supply. In some areas of Europe, wind turbines are net
exporters of electricity.
1 . 3 . 4 S E A S O NA L M AT C H W I T H LOA D
There is good seasonal and diurnal match between wind
and load in Ontario. Peak seasonal winds occur in winter
during the heating season, and in mid afternoons during
the summer cooling season. Winter winds are further
complemented by the substantial increase in air density
of colder air.15 Seasonal wind resources are predictable
enough to make seasonal commitments for displacement
of fossil fuels. That is, system planners can, with some
degree of reliability, plan seasonal dispatching that
includes wind energy.
1 . 3 . 5 C O M PAT I B I L I T Y W I T HH Y D RO E L E C T R I C S TO R AG E
Wind turbines installed in a modest wind regime such as
Ontario will be operating above the cut-in wind speed
(i.e. the speed at which wind turbines first start generating
electricity), and producing some amount of electricity
for more than 6,000 hours per year. At Ontario’s more
energetic sites, wind turbines will be in operation more
than 7,000 hours per year.16
Wind, like hydropower, is subject to the vagaries of
climate. However, seldom is there a poor wind and a poor
hydro year simultaneously. Wind energy is seen as
complementary to hydro-electricity systems with some
storage. During periods of peak wind and low demand,
wind offsets hydroelectric generation and water can be
stored behind the dam for release during periods of
higher demand.17
Wind energy is a local resource, not subject to supply
interruptions or depletion. Further, wind energy offers
stable long-term prices because there are no fuel costs.
Ontario has a long tradition of using hydroelectric
generation and planners intuitively understand the
benefits of local control of an indigenous resource.
Chapter three elaborates in detail how to take
advantage of this potential.

○ ○ ○ ○ ○ ○ ○ ○ ○ ○ ○ ○ ○ ○ ○ ○ ○ ○ ○ ○ ○ ○ ○ ○ ○ ○ ○ ○ ○ ○ ○ ○ ○ ○ ○ ○ ○ ○ ○ ○ ○ ○ ○ ○ ○ ○ ○ ○ ○ ○ ○ ○ ○ ○ ○ ○ ○ ○ ○ ○
SMART GENERATION: POWERING ONTARIO WITH RENEWABLE ENERGY20
1 . 4 B E N E F I T S O F W I N D E N E R G Y
The benefits of using wind for electricity generation are
numerous.18 Wind energy creates new jobs, offsets
emissions from fossil-fired power plants, offsets external
costs, provides net positive energy balance, stimulates new
economic development, notably in rural areas, enhances
security of electricity supply, and provides electricity price
security. Analysis of all of these benefits is beyond the
scope of this chapter and therefore we concentrate here
solely on job creation and economic development.19
1 . 4 . 1 E M P LOY M E N T
Ontario is the industrial center of Canada and has the
infrastructure and the skilled workforce needed for
manufacturing wind turbines, towers, and their electrical
components. Towers are a feasible near-term product for
Ontario domestic manufacturing. Towers can account for
one-fifth of the installed cost and constitute a good fit
with Ontario’s steel industry. However, if adequate
policy mechanisms are not implemented, provincial
employment from developing Ontario’s wind resource
will be affected by competition within the North
American market.
Quebec has announced an interest in a 1,000 MW tend-
ering program to develop wind energy in the province.
While not as aggressive as the development program
suggested here (8,000 MW in Ontario by 2012), Quebec
is wooing manufacturers to locate in the province.
To visualize the employment potential consider that
Germany has currently over 45,000 people working in
its wind industry (37,000 direct and indirect manu-
facturing jobs in the German wind industry and another
8,000 additional jobs servicing wind turbines).
Taking the German employment experience, and the
accelerated development of wind energy in Europe, it is
possible to forecast the potential effects on job creation
in Ontario. Assuming that installed costs will likely be
lower in Canada than in Germany, the employment effect
per megawatt of capacity will potentially be lower than
in Europe as well.
Nevertheless, it is possible to estimate the number of
people that would be directly and indirectly employed in
the manufacturing sector by a build-out that begins
modestly at 300 MW in the first year, reaches 1,000 MW
per year within five years, and peaks at 2,500 MW in the
eighth year. If Ontario’s wind development evolves like
Germany’s and Spain’s, there could be nearly 100,000
person-years of cumulative employment by 2012. For
comparison purposes this figure can be converted into
total jobs per MW by averaging this type of employment
over the life of the wind facilities.20
A recent study of the economic impact of developing
wind energy in Quebec used estimates of the jobs created
by manufacturing and installing wind turbines quite
similar to those used here. The Quebec study examined
job creation over the 25-year life of a wind project and
TABLE 1
Potential Employment Creation from Ontario’s Wind Development (person-years)
(Derived from Experience in Germany)
$CAD $CAD Manufacturing ServiceMW Installed MW Cumulative Installed Cost Operations Cost Jobs (4) Jobs (5) Total
Phase 1 (1)2005 300 300 450,000,000 16,200,000 3,150 162 3,3122006 500 800 750,000,000 43,200,000 5,250 432 5,6822007 500 1300 750,000,000 70,200,000 5,250 702 5,9522008 700 2000 1,050,000,000 108,000,000 7,350 1,080 8,430
Phase 2 (2)2009 1000 3000 1,500,000,000 162,000,000 10,500 1,620 12,1202010 1000 4000 1,500,000,000 216,000,000 10,500 2,160 12,660
Phase 3 (3)2011 1500 5500 2,250,000,000 297,000,000 15,750 2,970 18,7202012 2500 8000 3,750,000,000 432,000,000 26,250 4,320 30,570
Person-years 84,000 13,446 97,446NOTES(1). 2,000 MW installed within 4 years.(2). 4,000 MW total installed capacity within 6 years.(3). 8,000 MW total installed capacity within 8 years.(4). 7 jobs/$ million CAD, $1,500 CAD/kW(5). 10 jobs/$ million CAD, $54 CAD/kW

○ ○ ○ ○ ○ ○ ○ ○ ○ ○ ○ ○ ○ ○ ○ ○ ○ ○ ○ ○ ○ ○ ○ ○ ○ ○ ○ ○ ○ ○ ○ ○ ○ ○ ○ ○ ○ ○ ○ ○ ○ ○ ○ ○ ○ ○ ○ ○ ○ ○ ○ ○ ○ ○ ○ ○ ○ ○ ○ ○
I I WIND POWER IN ONTARIO 21
thus encompasses a much longer time frame than used
in our analysis.21
Comparing our projections with those of the Quebec
study for 4,000 MW over 25 years, our estimates are
somewhat higher, but not overly so considering the range
of uncertainties.22
1 . 4 . 2 E C O N O M I C D E V E L O P M E N T
Direct and indirect economic benefits: Helimax’s
study examined the economic results from a commercial
wind development program and estimated the value
added for manufacturing, installation, and operation of
1,000 MW of wind capacity for 25 years. The study
estimated that there were $590 million in direct benefits
to the Quebec economy if a major portion of the wind
turbines and their components were sourced in Quebec.
There were an additional $800 million in indirect benefits
and the program created another $280 million in
economic activity for a total of $1.7 billion in economic
benefits over the life of the project.23
Using the Helimax assumptions, installing 8,000 MW
in Ontario in a phased program by 2012 could generate
nearly $14 billion in economic activity in the province.
Helimax’s most important caveat was the assumption that
50% to 60% of the value added in building the 1,000 MW
was sourced in Quebec.
If both Quebec and Ontario aggressively develop wind
energy, they will compete for wind turbine manufacturers
and their suppliers (towers, for example) to locate in their
respective province. The majority of manufacturing jobs
will most likely go to the province that the industry
believes has the most serious and long-lasting commitment
to installing a significant amount of capacity. Ontario is
a new and potentially very large market that can lure
manufacturers to the province. It is not yet too late to act.
Quebec appears to be seeking one manufacturer for a
limited potential market of 1,000 MW over a period of
several years. The manufacturer selected will expect to
also sell into other provinces and into the U.S. market to
make up for the quota-driven Quebec market. By using
a quota and tendering system, Quebec sends a signal that
it is not seeking a dynamic market of suppliers, but a
captive manufacturer who will provide a certain number
of jobs in a depressed region.
Ontario can choose to create a dynamic market served
by several manufacturers located in the province if there
are no limits on the capacity installed annually, that is,
by not setting quotas through the Request for Proposal
or tendering process. By creating a market that has the
potential to exceed 300 MW, 500 MW, or even 1,000 MW
per year, Ontario can lure European manufacturers to
the province where they can compete to win greater shares
of an expanding market. Such a competitive market
provides more jobs more quickly than through tendering
to one or two captive suppliers.
Co-location: Wind turbines can co-locate with most
existing land uses. Thus, wind turbines offer landowners,
whether rural or urban, commercial or industrial, an
opportunity to produce a new cash stream on their
property. The wind turbine installed at Exhibition Place
by the Toronto Renewable Co-op and Toronto Hydro was
the first in North America to demonstrate that wind
energy can be located within urban areas. There are many
such examples in Europe, including Copenhagen, the
capital of Denmark.24
Far more significant, however, is the opportunity to
use wind turbines in rural Ontario where they can co-
exist with crops or pasture.
Rural economic development: Wind turbines have
provided a new cash crop for farmers in Denmark and in
Germany and states such as Iowa and Minnesota. They
can do the same for farmers in Ontario.
Wind energy can benefit farmers in two ways. Farmers
can lease their land to a wind developer, or farmers can
install, own, and operate the wind turbines themselves.
Under existing Ontario policy, farmers and small
landowners in general are discouraged from supplying
electricity to the province.25
Leasing: Royalties on land leased to commercial wind
developers offer farmers the lowest risk means for
benefiting from wind energy. The developer bears almost
all of the business risk.26 Farmers can continue doing what
they do best – farming. They leave wind development to
the wind developers.
Wind leases offer farmers less rewards than if farmers
owned the wind turbine directly. Royalties on land leases
range from 2% on gross revenues to as high as 5% during
the first ten years, up to 6% during the second ten years,
and as high as 8% during the third decade.27 Royalties
can accrue on all gross revenues and not solely on the
sale of electricity. Some projects sell their green benefits
for almost as much as they sell their kilowatt-hours of
electricity. Developers may also offer signing options of
up to $1,000 and installation bonuses of $2,500 /MW.

○ ○ ○ ○ ○ ○ ○ ○ ○ ○ ○ ○ ○ ○ ○ ○ ○ ○ ○ ○ ○ ○ ○ ○ ○ ○ ○ ○ ○ ○ ○ ○ ○ ○ ○ ○ ○ ○ ○ ○ ○ ○ ○ ○ ○ ○ ○ ○ ○ ○ ○ ○ ○ ○ ○ ○ ○ ○ ○ ○
SMART GENERATION: POWERING ONTARIO WITH RENEWABLE ENERGY22
Depending upon the price per kWh and the amount
generated, a leaseholder could receive $2,500 to $13,000 per
MW per year. During the twenty-year life of a wind turbine,
farmers with a 1-MW turbine on their land could earn
from $50,000 to $250,000 per MW of installed capacity.28
A 1-MW turbine would require an area clear of other
wind turbines of about 28 hectares. That is, if there were
more than one wind turbine, each would occupy an area
of open space that permits unhindered access to the wind.
However, each turbine uses only 1% to 5% of the land
occupied for roads, substations, and ancillary structures.
Owning: When farmers or landowners own a turbine
they bear all risk themselves, including technical risk,
wind risk, and political risk.29 However, all profit then
accrues to the farmers or landowners.
If farmers own their own 1-MW turbine and they
received $0.075 to $0.1 per kWh generated, they could
earn $100,000 to $225,000 per year in net revenues in
Ontario. Once the debt is retired, from ten to fifteen years,
the farmer could expect to earn $500,000 to more than
$2 million during the twenty-year life of the turbine.
While not risk-free, wind turbines have the potential
to more than double farm income for those farmers
capable of taking advantage of the opportunity. And all
wealth generated by farmer-owned, or locally-owned
wind turbines flows from Ontario electricity consumers
directly to provincial communities.
Consider a hypothetical case where one-half of
Ontario farmers installed one 1-MW wind turbine. The
27,000 MW installed could generate about one-third of
Ontario’s current consumption. Using the assumptions
above, these wind turbines could pump from $3.5 to $4.5
billion through Ontario’s rural economy.
Some 30% of Ontario farms have sufficient land area
for two 1-MW turbines. Another one-third of Ontario
farms have enough surface area for four 1-M turbines.
There are 1,000 farms in Ontario with a working area of
approximately 400 hectares. Each farm of this size could,
in theory, absorb ten 1-MW turbines for 10,000 MW of
capacity. The benefits from wind energy for rural Ontario
are potentially quite significant.
2. Ontario’s wind resource:waiting to be discovered
At the time of writing there were no detailed maps of
Ontario’s wind resource. However, modern digital maps
using existing wind data and computer simulation are
being prepared, and the Canadian unified mesoscale wind
energy atlas prepared by Environment Canada will be
released in the fall of 2004.
Early mapping of regional wind resources was based
on informed extrapolation of airport data typically
measured below 10 metres (m) up to 50, 80 or 100 m
above the ground. Much of the wind data available in
North America, prior to wind development, was from
airport meteorological stations. Data from these stations
is often suspect, because the measurements are made on
short masts, and are typically unrepre-sentative of what
wind turbines would encounter at 50 to 100 m above
ground level.
Modern wind turbines use extremely tall towers. The
1.8 MW wind turbines operating in Ontario are at a hub
height of nearly 80 m. Towers more than 100 m tall
are not uncommon in Europe. Tall towers elevate
wind turbines well above the effects of trees, buildings,
and other obstructions that retard the flow at meteoro-
logical stations on short masts. The tall towers experience
a much better wind resource than airport meteorological
stations, and often do much better than projected using
standard methods of estimating increases in wind speed
with height above the ground.
Another source of wind data are meteorological
stations. However, the reliability of this data is compromised
by the fact that many Canadian meteorological stations
are specifically located for agricultural measurements,
particularly precipitation, and therefore they are
deliberately located in areas where precipitation
measurements are not disturbed by winds.
Detailed wind resource assessments conducted over
a period of years are imperative to identify areas with the
best wind resources.30
Contrary to classic economic geography, wind energy
development is only indirectly related to the wind
resource. Much of the world’s wind development has
taken place in regions of only modest wind resources.
The location, pace, and amount of wind energy
development is more directly a function of government
policy and incentive mechanisms, than wind resource.
This assertion is best illustrated by the contrast between
Germany and Great Britain. Germany, by international
standards, has a modest wind resource. Britain, on the
other hand, has one of the world’s best. Yet in 2003 there
were more than 14,000 MW of wind-generating capacity
operating in Germany and only 650 MW in Britain.

○ ○ ○ ○ ○ ○ ○ ○ ○ ○ ○ ○ ○ ○ ○ ○ ○ ○ ○ ○ ○ ○ ○ ○ ○ ○ ○ ○ ○ ○ ○ ○ ○ ○ ○ ○ ○ ○ ○ ○ ○ ○ ○ ○ ○ ○ ○ ○ ○ ○ ○ ○ ○ ○ ○ ○ ○ ○ ○ ○
I I WIND POWER IN ONTARIO 23
While the early expansion of wind energy in the windy
mountain passes of California and along the windswept
coastline of Denmark may seem to contradict the
previous statement, because they followed traditional
development patterns, this is not the case upon close
examination. During the early 1980s, a period of
rapid expansion of wind energy in California and
Denmark, both locations provided a supportive political
environment – and most importantly – mechanisms that
guaranteed a favourable fixed premium for the wind-
generated electricity. With the fixed premium, and in the
case of California, with substantial tax subsidies in hand,
developers could easily obtain the capital needed to
develop large wind projects, leading to the California
“wind rush” that lasted from 1981 through 1985.
Denmark followed a different development pattern than
California. In Denmark wind turbines were installed singly
or in small clusters rather than in large wind power plants.
Like California’s developers, Danish farmers and coopera-
tives were able to find financing for their purchase of wind
turbines because of the guaranteed premium and the ability
to offset environmental taxes on fossil-fired generation.
2 . 1 E S T I M AT I N G O N TA R I O ’ S W I N DR E S O U R C E S
T O TA L R E S O U R C E
Even by North American standards, Ontario has a huge
surface area of about one million km2. Assuming a modest
average wind resource of 5 m/s, there is 14,000 TWh of
wind energy coursing across the province every year
(Ontario currently uses about 150 TWh of electricity
annually).31
2 . 2 T E C H N I C A L R E S O U R C E SThe theoretical maximum amount of wind energy that
can be extracted from the wind, is 8,000 TWh. In actual
operation, most wind turbines deliver far less for a host
of reasons, including the interference of one wind turbine
with another in a geometric array. Assuming a very open
spacing between turbines of eight diameters across the
wind by ten diameters downwind (8 RD x 10 RD), there
is technically 5,000 TWh available per year across the
entire province.
2 . 3 P R A C T I C A L R E S O U R C EOntario’s population and electrical load are concentrated
in the southern portion of the province. Partly as a result,
the transmission system is also concentrated in southern
Ontario. The Canadian Wind Energy Association
TABLE 2
Wind resource potential in Ontario
TWh/yr % of 2001 Demand6
Total Resource1 14,000 9524%Technical Resource Betz Limit 8,000 5442%Technical Resource2 5,000 3401%Practical Resource3 1,500 1020%Accessible Resource4 90 61%Acceptable Resource5 45 31%
1. 5 m/s @ hub height, 100 m2 land area/m2 rotor swept area, province wide.2. 00 kWh/m2/year annual specific yield.3. Southern Ontario only @ 500 kWh/m2/year annual specific yield.4. One 1-MW turbine per farm; 55,000 farms in Ontario; 600 kWh/m2/year annual
specific yield; 2,800 m2.5. 1/2 the Accessible Resource.6. 147 TWh/yr in 2001 total Ontario consumption.
FIGURE 2 Renewable energy mechanisms (REMs) are essential toenable farmers to benefit directly from wind developments.
estimates that there are 300,000 km2 within reach of the
existing transmission system, roughly corresponding to
southern Ontario.32 For comparison, southern Ontario
is about the same size as Germany, yet with about one-
sixth the population density.
Limiting the practical wind resource to southern
Ontario only, and using the same assumptions on spacing
and wind resource as that for the entire province, there is
the potential for 1,500 TWh or 10 times the province’s
2001 electricity consumption.
2 . 4 A C C E S S I B L E R E S O U R C EWithout digital data for roads, buildings, parks, wildlife
sanctuaries, airports, military bases, First Nations, and
other areas where wind development may be prohibited,
it is difficult to estimate how much accessible wind
resource exists in southern Ontario. However, it is possible
to use farmland as a representative surrogate for culturally
and politically accessible land areas where wind energy
may be permitted.
Farmland represents a working landscape where
farmers and the public accept the use of structures and

○ ○ ○ ○ ○ ○ ○ ○ ○ ○ ○ ○ ○ ○ ○ ○ ○ ○ ○ ○ ○ ○ ○ ○ ○ ○ ○ ○ ○ ○ ○ ○ ○ ○ ○ ○ ○ ○ ○ ○ ○ ○ ○ ○ ○ ○ ○ ○ ○ ○ ○ ○ ○ ○ ○ ○ ○ ○ ○ ○
SMART GENERATION: POWERING ONTARIO WITH RENEWABLE ENERGY24
mechanical devices on the land. Farmers and the public
also expect that farmland will be “tilled” in some manner
that requires breaking the soil, growing crops, and
harvesting. Farmland is thus not a static landscape. There
are seasonal cycles of activity, which reach a peak in spring
and fall. Wind turbines are already a common rural
feature in many European nations such as Germany,
Denmark, and the Netherlands.
Ontario’s Ministry of Agriculture and Food lists 85,000
farm operators in the province; however, the Ontario
Federation of Agriculture estimates there are only 55,000
individual farms. By definition, these farms are all accessible
by road and farm equipment. They may not be accessible
to transmission lines of sufficient capacity, but they are
all likely served by a distribution line of some capacity.
For illustrative purposes, if every farm installed one
1-megawatt wind turbine with a rotor 60 metres in
diameter, and there was a slightly more robust wind
resource than that province wide, farming the wind in
this manner could generate 90 TWh per year, or nearly
two-thirds of the province’s consumption.
2 . 5 A C C E P TA B L E R E S O U R C EFarmers once relied upon wind turbines for irrigation
and are again making wind turbines a commonplace
feature of the agricultural landscape. One need only travel
to Denmark to see how distributed wind turbines have
become an integral part of the rural Danish landscape.
It is safe to assume that many of Ontario’s farms are
not suited for wind development, and that some farmers
may not want wind turbines on their property. Further-
more, land use policies may preclude large areas of
farmland from consideration.
Again, for illustrative purposes only, assuming that
one-half of Ontario’s farms could install one 1-MW
turbine, or about 27,500 MW, there is still the potential
to deliver 45 TWh per year or about one-third of Ontario’s
total consumption.
Of note is a comparison of this crude technique with
data results from a 1991 study of Ontario’s wind potential.
Examining actual wind data for meteorological stations
in southern Ontario, the study tallied the amount of
developable land area in each of several wind classes after
excluding a portion in each for potential land use
conflicts. The study concluded that there was sufficient
land area to potentially develop a total of 24,000 MW.33
A recent review of this 1991 study using current
methods found the main conclusions to still be valid.34
2 . 6 O N TA R I O ’ S A C H I E VA B L E W I N DC O N T R I B U T I O N
There are several ways to estimate what wind capacity is
realistically achievable in the province. One method looks
at jurisdictions elsewhere and what they have achieved;
while another method examines the pace at which others
are adding new wind generating capacity. First consider
the case of Germany’s Ostfriesland county and then that
of Germany as a whole.
In 2002 there was 540 MW of wind capacity operating
in the county of Ostfriesland in Germany’s northern state
of Niedersachsen. Ostfriesland has a surface area of 3,300
km2, about one percent that of Germany, and somewhat
less than one percent of the surface area of southern
Ontario.35
Wind development in Ostfriesland continues to
expand. The installed capacity will continue to increase
for the foreseeable future, but at a more modest pace than
in the 1990s. Even so, the capacity installed in 2002 is a
good marker for comparison.
If southern Ontario, with almost 100 times the surface
area, were to install as much wind capacity as Ostfriesland
in 2002, there would be nearly 50,000 MW of new wind
generation in the province. Even assuming a conservative
annual specific yield of 600 kWh/m2/year for such an extensive
fleet, wind turbines in Ontario of the density now found
in Ostfriesland could generate nearly 90 TWh or slightly
less than 60% of total electricity consumption in Ontario.
In 2003, the 15,000 wind turbines operating in
Germany were expected to produce 18.6 TWh (for
comparison, about 15 commercial-scale turbines were
operating in Ontario in 2003.)
As in the case of Ostfriesland, Germany continues to
develop wind energy. Industry analysts expect Germany
to reach 20,000 MW by 2006. If the German offshore
market develops as expected, Germany could reach 30,000
MW of wind capacity by 2012.
If Ontario were able to install a similar size fleet of
wind turbines delivering the same amount of generation
as that of Germany in 2003, wind turbines in the province
would produce 18.6 TWh per year or 13% of the
province’s electricity use.
2 . 7 G R O W T H Q U I C K E N S I NN E W M A R K E T S
Ontario has limited experience with wind energy. There
are many obstacles to rapid deployment. Nevertheless,
experience in Europe indicates that markets new to wind
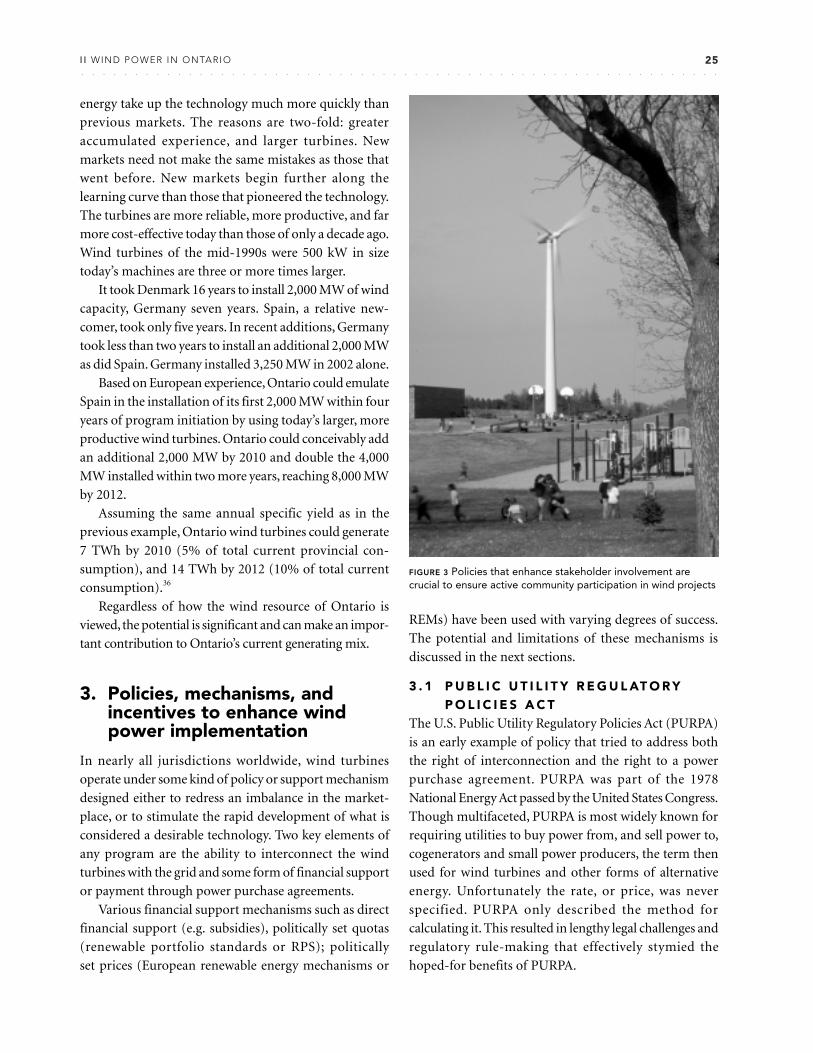
○ ○ ○ ○ ○ ○ ○ ○ ○ ○ ○ ○ ○ ○ ○ ○ ○ ○ ○ ○ ○ ○ ○ ○ ○ ○ ○ ○ ○ ○ ○ ○ ○ ○ ○ ○ ○ ○ ○ ○ ○ ○ ○ ○ ○ ○ ○ ○ ○ ○ ○ ○ ○ ○ ○ ○ ○ ○ ○ ○
I I WIND POWER IN ONTARIO 25
energy take up the technology much more quickly than
previous markets. The reasons are two-fold: greater
accumulated experience, and larger turbines. New
markets need not make the same mistakes as those that
went before. New markets begin further along the
learning curve than those that pioneered the technology.
The turbines are more reliable, more productive, and far
more cost-effective today than those of only a decade ago.
Wind turbines of the mid-1990s were 500 kW in size
today’s machines are three or more times larger.
It took Denmark 16 years to install 2,000 MW of wind
capacity, Germany seven years. Spain, a relative new-
comer, took only five years. In recent additions, Germany
took less than two years to install an additional 2,000 MW
as did Spain. Germany installed 3,250 MW in 2002 alone.
Based on European experience, Ontario could emulate
Spain in the installation of its first 2,000 MW within four
years of program initiation by using today’s larger, more
productive wind turbines. Ontario could conceivably add
an additional 2,000 MW by 2010 and double the 4,000
MW installed within two more years, reaching 8,000 MW
by 2012.
Assuming the same annual specific yield as in the
previous example, Ontario wind turbines could generate
7 TWh by 2010 (5% of total current provincial con-
sumption), and 14 TWh by 2012 (10% of total current
consumption).36
Regardless of how the wind resource of Ontario is
viewed, the potential is significant and can make an impor-
tant contribution to Ontario’s current generating mix.
3. Policies, mechanisms, andincentives to enhance windpower implementation
In nearly all jurisdictions worldwide, wind turbines
operate under some kind of policy or support mechanism
designed either to redress an imbalance in the market-
place, or to stimulate the rapid development of what is
considered a desirable technology. Two key elements of
any program are the ability to interconnect the wind
turbines with the grid and some form of financial support
or payment through power purchase agreements.
Various financial support mechanisms such as direct
financial support (e.g. subsidies), politically set quotas
(renewable portfolio standards or RPS); politically
set prices (European renewable energy mechanisms or
REMs) have been used with varying degrees of success.
The potential and limitations of these mechanisms is
discussed in the next sections.
3 . 1 P U B L I C U T I L I T Y R E G U L AT O R YP O L I C I E S A C T
The U.S. Public Utility Regulatory Policies Act (PURPA)
is an early example of policy that tried to address both
the right of interconnection and the right to a power
purchase agreement. PURPA was part of the 1978
National Energy Act passed by the United States Congress.
Though multifaceted, PURPA is most widely known for
requiring utilities to buy power from, and sell power to,
cogenerators and small power producers, the term then
used for wind turbines and other forms of alternative
energy. Unfortunately the rate, or price, was never
specified. PURPA only described the method for
calculating it. This resulted in lengthy legal challenges and
regulatory rule-making that effectively stymied the
hoped-for benefits of PURPA.
FIGURE 3 Policies that enhance stakeholder involvement arecrucial to ensure active community participation in wind projects

○ ○ ○ ○ ○ ○ ○ ○ ○ ○ ○ ○ ○ ○ ○ ○ ○ ○ ○ ○ ○ ○ ○ ○ ○ ○ ○ ○ ○ ○ ○ ○ ○ ○ ○ ○ ○ ○ ○ ○ ○ ○ ○ ○ ○ ○ ○ ○ ○ ○ ○ ○ ○ ○ ○ ○ ○ ○ ○ ○
SMART GENERATION: POWERING ONTARIO WITH RENEWABLE ENERGY26
3 . 2 S TA N D A R D O F F E R C O N T R A C T S
Wind turbines are capital-intensive, long-lived forms of
generation with no fuel costs. As such, investors and banks
need to be assured that there is a market for the wind-
generated electricity at a predictable price to justify the
technical, meteorological, and political risks they assume
when financing a wind project of any size.37
While a few wind turbines had been installed under
PURPA in the United States, there was no large-scale wind
development until the California Public Utility Commis-
sion (PUC) used its power to authorize standard contracts
between developers of alternative energy and private
electric utilities.38 Some standard contracts offered spot-
market prices.39 One, Standard Offer No. 4 (S.O.4),
offered fixed prices for a fixed number of years.
Unfortunately, the PUC placed a limit on how long the
new S.O.4 contracts would be offered, resulting in a rush
of applications and attendant speculation. Nevertheless,
the S.O.4 contracts, coupled with lucrative tax subsidies,
resulted in the development of 1,500 MW of wind-
generating capacity that produces about 3 TWh year; 1%
of California supply, or the equivalent to 2% of Ontario’s
demand. And these wind turbines have been doing so
for nearly two decades.
3 . 3 D I R E C T S U B S I D I E S
Direct subsidies based on the amount of generating
capacity installed were the mechanism of choice in the
Netherlands and the United States during the 1970s and
early 1980s. These subsidies were widely abused, provided
little incentive to generate electricity, and did little to
encourage development of the technology.40
Subsequently, the United States adopted a federal
Production Tax Credit (PTC) in 1992. The PTC is a credit
against federal tax liabilities and in its present form is
not transferable, that is, it cannot be passed through to
limited partners. The equity owners must have the tax
liability to take advantage of the credit. Thus, the PTC is
useful only to the largest companies in the United States.
Moreover, the PTC has a sunset provision and its
expiration and eventual Congressional reinstatement
have led to numerous “boom and bust” cycles in the U.S.
wind industry.
There is an associated subsidy for publicly owned utilities
in the United States, but the subsidy is subject to annual
Congressional appropriations and is often oversubscribed.
Neither program has led to a stable domestic market
for wind energy.
The Wind Power Production Incentive (WPPI) is the
Canadian federal equivalent of the PTC. WPPI is lower
in value than the PTC but is more egalitarian. Unlike the
PTC, WPPI is a payment, not a tax credit. As such, WPPI
is a more direct mechanism than the PTC. Unfortunately,
use of WPPI triggers federal environmental review,
increasing the cost, complexity, and length of time needed
to develop a project, even if only one turbine is involved.
WPPI was implemented in 2002 and has a program
life through 2007. Unlike the PTC, Canada’s WPPI has a
1,000 MW limit or cap and would therefore be of limited
use for a large wind deployment in Ontario.
The subsidy was initially set at 1.2 cents per kilowatt-
hour (¢/kWh), but was designed to drop to 1.0 ¢/kWh for
the period of March 31, 2003 to March 31, 2006, and will
fall to 0.8 ¢/kWh for the period March 31, 2006 to March
31, 2007 (when the program is scheduled to expire). Like
the PTC, WPPI payments continue for the first ten years
of a project’s life.41
3 . 4 I N D I R E C T S U B S I D I E SDeductions from taxable income are another popular
incentive in North America. Canada’s Renewable
Conservation Expense (CRCE) and accelerated deprecia-
tion through Class 43.1 of the Canadian tax code have
both been used to reduce the tax liability of investors in
wind turbines installed in Ontario. CRCE allows 100%
deduction of first year expenses for non-tangible items
such as reports and studies.42 More valuable are Class 43.1
deductions; one-third of the declining balance of project
costs, including equipment.43 Like WPPI, these are more
egalitarian in that the deductions can be passed through
to individual investors or limited partners.
3 . 5 R E N E WA B L E P O R T F O L I OS TA N D A R D S
In their simplest form, renewable portfolio standards
(RPS) require that a percentage of electricity be supplied
by renewable sources. As such, they are a politically-
determined quota for the amount of renewables on a
system. They are often coupled with a trading system.
RPS and tradable certificates are similar to cap and trade
mechanisms for air pollution abatement and have been
used in several countries as electricity market liberali-
zation swept the globe during the mid-1990s.44
In the trading system, each utility receives a credit or
certificate for a specified amount of renewables. Utilities
that fail to meet the RPS quota are fined. The value of the
fines determines the upper value of the tradable certificates.

○ ○ ○ ○ ○ ○ ○ ○ ○ ○ ○ ○ ○ ○ ○ ○ ○ ○ ○ ○ ○ ○ ○ ○ ○ ○ ○ ○ ○ ○ ○ ○ ○ ○ ○ ○ ○ ○ ○ ○ ○ ○ ○ ○ ○ ○ ○ ○ ○ ○ ○ ○ ○ ○ ○ ○ ○ ○ ○ ○
I I WIND POWER IN ONTARIO 27
Owners of the credits can trade among themselves.
Some utilities may not add any renewable capacity,
instead buying the credits they need from those who do.
According to theory, this results in more renewables being
installed in areas where the renewables are most suited.
In some jurisdictions, the fines (sometimes euphemisti-
cally described as “alternative compliance payments”)
enable a utility to pay into a fund in lieu of its renewables
obligation. The funds collected are then distributed by
some public agency to provide “public goods” or “system
benefits” that may not otherwise occur.
Renewable portfolio standards combined with trading
have been used with varying degrees of success in Great
Britain, Australia, Sweden, and in several U.S. states.
Many proponents of RPS programs emphasize the
renewables obligation, or target, and do not specify the
mechanism for reaching that target.45
3 . 6 T E N D E R I N G O R B I D D I N GS Y S T E M S
Often associated with RPS programs are cumbersome
tendering systems requiring prospective renewable energy
providers to bid against each other for the right to a
purchase power agreement or long-term contract. Often
the bids are scored most heavily on price, and little value
is placed on renewable energy’s other attributes (e.g.
regional development, employment creation, increased
grid stability).
This focus on price alone is unfortunately the current
direction taken by the provincial government in its Request
for Proposal (RFP) to build 300 MW of new renewables.
Tendering demands a heavy administrative burden,
is time consuming, and costs participants dearly. A key
problem of tendering systems is that they reduce the
diversity of the participants, and lead to ownership
concentration in the wind industry as only the largest
enterprises can gain the economies of scale needed to
compete on price alone, and risk losing the costs of
participating in a bid.
Another serious problem is that tendering systems
greatly favour development concentration in the windiest
areas, which can have detrimental implications in relation
to planning, public opinion and acceptance of projects.
From a systems integration point of view, this tendering
system also decreases the advantage of having wind
developments located over a large geographical spread
(which reduces fluctuations in electricity production).46
In Britain a tender system known as the Non-Fossil
Fuel Obligation completely failed due to gaming of the
system by winners of project bids, lack of penalties for
failing to install promised projects, and lack of adequate
planning procedures.47 The dismal failure of this tender
system led the British government to abandon the model
in favour of a trading system.
In the United States, the PTC is used to lower the bids
submitted under RPS programs. However, because the
PTC is useful only to those with a significant tax liability,
there is no opportunity for small projects, community-
owned projects, or farmer-initiated projects to compete
with commercial wind developers and non-regulated
subsidiaries of the electric utilities themselves. In the
United States, nearly half of all new wind capacity
installed in the past four years has been developed by the
non-regulated subsidiary of Florida Power & Light.
In the U.S., competitive bidding systems and the
unpredictable nature of the PTC have not provided a
stable domestic market for wind energy as evidenced by
the lack of domestic wind turbine manufacturers.
Currently, only GE Wind has a manufacturing presence
in the United States.48
To illustrate the unstable nature of the U.S. market,
installed wind capacity declined 30 MW in 1997 from a
total of 1,600 MW, nearly all in California. Then 600 MW
were installed in 1999, the second great wind boom in
the United States. The following year only 70 MW was
installed. 2001 was another boom year with 1,700 MW
installed, followed by only 400 MW in 2002. In 2003
another wind rush was on to complete projects before
the PTC expired, resulting in another 1,700 MW.
No manufacturer can predict with any degree of
certainty what the market for wind turbines in the United
States will be from one year to the next. As a consequence,
few can justify the investment in manufacturing assets
when the utilization of those assets is so uncertain.
It is instructive to note that despite the installations
in 2001 and 2003 that of the 6,400 MW in wind capacity
operating in the United States at the end of 2003, nearly
one-fourth had been installed under fixed price contracts
written in California during the early 1980s.
The experience with the PTC and competitive bidding
systems in North America and the resulting ‘boom and
bust’ cycles contrasts sharply with that of Germany and
Spain. There a manufacturing base is well-established, a
skilled workforce and education networks exist to train
wind researchers, developers, and installers, and this is all
actively supported by a dynamic and competitive market.

○ ○ ○ ○ ○ ○ ○ ○ ○ ○ ○ ○ ○ ○ ○ ○ ○ ○ ○ ○ ○ ○ ○ ○ ○ ○ ○ ○ ○ ○ ○ ○ ○ ○ ○ ○ ○ ○ ○ ○ ○ ○ ○ ○ ○ ○ ○ ○ ○ ○ ○ ○ ○ ○ ○ ○ ○ ○ ○ ○
SMART GENERATION: POWERING ONTARIO WITH RENEWABLE ENERGY28
3 . 7 R E N E WA B L E E N E R G Y M E C H A N I S M( R E M )
Countries leading in the renewable energy sector have
followed a different path than certificate trading and
tendering, a path not unlike that of California during the
early 1980s. These leaders have used Renewable Energy
Mechanisms (REMs) instead.
As explained in the introductory chapter, REMs
evolved from the original electricity feed-in laws enacted
by Denmark and Germany.
REMs facilitate the interconnection of wind turbines
with the electric-utility network and at the same time
specify how much the wind turbine owners are paid for
their electricity.49
The REM systems currently in place in Germany and
Spain are the single most successful mechanism for
stimulating the rapid development of wind turbines.
During the years that Denmark relied on REMs, the
resulting stable markets helped local wind turbine
manufacturers to become world leaders in the technology.
Through the mid 1990s, Denmark’s 2,100 wind
cooperatives accounted for one-half of the nation’s total
installed wind capacity. Some 100,000 Danish house-
holds, or nearly 5% percent of the population, own a stake
in a cooperatively-owned wind turbine. Furthermore,
farmers own many of the remainder turbines.
As a legacy of its experience with REMs, 20% of all
the electricity used in Denmark today is generated using
wind turbines.
REMs are more egalitarian than almost any other
support mechanism, enabling communities, cooperatives,
and farmers, as well as commercial wind power developers,
to participate in the rapid expansion of renewable
capacity. Renewable mechanisms offer opportunity to
many players, and offer farmers a potentially new cash
crop – wind-generated electricity. Moreover, REMs create
a dynamic market, which is essential to encourage
domestic manufacturing.
The fixed-price contracts under REMs also reduce
price volatility from utility purchases in the spot market,
helping to ensure price stability.
4. Conclusions and furtherresearch
Ontario has a significant wind resource. What is needed
is the political will to implement the technology. Wind
energy could deliver as much as one-third of Ontario’s
present supply. Near term, wind energy could contribute
nearly 10% of current supply by 2012 if political
commitment toward renewable energy is expressed and
new policy mechanisms are put in place quickly to make
this happen. The mechanism most likely to succeed in
stimulating rapid deployment of wind energy in Ontario
is renewable energy mechanisms similar to those used so
successfully in Germany.
Issues that additional research may help clarify
include: how best large amounts of new renewable
capacity can be integrated into the Ontario network, and
more detailed mapping of the province’s onshore and
offshore wind resources and zones of exclusion.
There is little need for additional research into the
technology of wind turbines themselves. Wind turbines
FIGURE 4 Despite the size of its market and its initial lead inwind development, the United States has fallen far behind themeteoric rise of German wind development. Germany leadsthe world in wind development as a direct result of its renewableenergy mechanisms. Similarly, Spain, which also uses renewableenergy mechanisms, now rivals the United States. Canada is stilltrying to find its way forward.
No other renewable energy support mechanism has
produced more renewable energy than the original
German feed-in laws and the subsequent introduction
of REMs. There were more than 14,000 MW of wind-
generating capacity operating in Germany at the end of
2003. This is a fleet capable of producing 18.6 TWh
annually, the equivalent of more than 10% of Ontario’s
current electricity use.
The fixed-price, long-term contracts that result from
REM have spawned in Germany and Spain dynamic
markets with several wind turbine manufacturers, and a
host of suppliers.

○ ○ ○ ○ ○ ○ ○ ○ ○ ○ ○ ○ ○ ○ ○ ○ ○ ○ ○ ○ ○ ○ ○ ○ ○ ○ ○ ○ ○ ○ ○ ○ ○ ○ ○ ○ ○ ○ ○ ○ ○ ○ ○ ○ ○ ○ ○ ○ ○ ○ ○ ○ ○ ○ ○ ○ ○ ○ ○ ○
I I WIND POWER IN ONTARIO 29
are sufficiently advanced and large-scale deployment can
begin immediately. However, questions remain about a
programmatic wind assessment, which would be valuable
for identifying public concerns as well as to identify areas
where wind energy is not suited. A programmatic
environmental assessment would examine the effects
from phased development and from full build-out of
Ontario’s wind potential. This would obviate today’s
piecemeal approach that places a burden on wind projects
of any size, while offering little overall perspective on wind
energy’s cumulative effects.50
Likewise, there may be other social and technical issues
of concern that while studied elsewhere – often at length
– Ontario may well want to evaluate under provin-
cial conditions such as: public perception of wind
development, noise propagation, and visual intrusion.
The resource analysis used in this report is based on
the experience of wind development in several leading
countries, notably Germany.
However, it would be valuable to identify southern
Ontario’s wind resource on a one-kilometre by one-
kilometre grid overlaid with zones of exclusion for roads,
villages, parks, wildlife sanctuaries, military bases and
over flight zones, and unique natural features. From this
a far more accurate picture of Ontario’s wind potential
can be identified. Although such analysis is beyond the
scope of this report it must be emphasized that there is
no need to wait for such a study before beginning
commitments for large-scale wind deployment to make
a significant contribution to Ontario’s energy future.
R I D I N G T H E W I N D I N C A L G A R Y
Calgary, Alberta, is home to the first public light railtransit system in North America powered by wind-generated electricity.
The fleet of 116 trains, which run along more than38 kilometres of track and 36 stations, are all poweredby 12 windmills located in southern Alberta. Thepower generated by the windmills is sent to the mainpower grid.
By using wind power to run the trains, the city ofCalgary reduces carbon dioxide emissions by 26,000tonnes each year – equivalent to eliminating7.5 million vehicle trips in Calgary each year.
In 2001, Calgary Transit partnered with ENMAX
and Vision Quest Windelectric to develop a programcalled “Ride the Wind!” that uses wind-generatedelectricity to power its C-Trains.
Since its inception in 1981, the C-Train hasincreasingly become a popular mode of transportationfor Calgarians. More than 200,000 people ride the C-Train every weekday – representing a 93 percentincrease in ridership since 1995.
The downtown area is a free fare zone in which itis free to ride the LRT, however a fare must be paid ifyou are traveling outside the downtown area.␣ Rushhour service has a five-minute frequency and off-peakservice is reduced to 15-minute service.␣

○ ○ ○ ○ ○ ○ ○ ○ ○ ○ ○ ○ ○ ○ ○ ○ ○ ○ ○ ○ ○ ○ ○ ○ ○ ○ ○ ○ ○ ○ ○ ○ ○ ○ ○ ○ ○ ○ ○ ○ ○ ○ ○ ○ ○ ○ ○ ○ ○ ○ ○ ○ ○ ○ ○ ○ ○ ○ ○ ○
SMART GENERATION: POWERING ONTARIO WITH RENEWABLE ENERGY30
W I N D C H A P T E R N OT E S
1 The role of small or household-size wind turbines inOntario is not discussed here. For information on smalland household-size wind turbines and how they are usedsee Gipe, P. (2004). Wind Power: Renewable Energy forHome, Farm, and Business, White River Junction,Vermont: Chelsea Green Publishing. Readers interestedin understanding more about wind power are encour-aged to examine the “guided tour” of the Danish WindIndustry Association at www.windpower.org
2 Gipe, P. (1995). Wind Energy Comes of Age. New York:John Wiley & Sons.
3 All statistics presented here are derived from numeroussources, including but not limited to national tradeassociations and BTM-Consult’s Wind Market Updates,published annually, and the author’s own records.Amidst the growing politicization – and commoditi-zation – of statistical information on the wind industry,BTM-Consult’s reports are the reference source forindependent data on the development of wind energyworldwide.
4 Note that analysts track the industry’s growth usinginstalled power in MW, simply because it is the easiestnumber to gather as each turbine is nominally rated bythe size of the generator it carries. The amount ofelectricity that a wind turbine produces is directly relatedto the wind resource and the area swept by the windturbine’s rotor, and only indirectly by the size of thegenerator.
5 BTM-Consult (2003). World Market Update. Available at:www.btm.dk
6 Robert Hornung, CANWEA, personal communication7 Bundesverband Windenergie, Arbeitsplatzstatistik der
Windenergie-Branche für das Jahr 2003, Osnabrück,Germany, background information, 18.02.2004, citesDeutsches Windenergie Institut (DEWI).
8 Sørensen, M. (1997). Learning curve: how are new energytechnology costs reduced over time? Report of IEAWorkshop: Energy Technology Availability to MitigateFuture Greenhouse Gas Emissions. Paris: InternationalEnergy Agency. See also Ackermann, T. Söder, L. (2000).Wind energy technology and current status: a review.Renewable and Sustainable Energy Reviews, 4, 315–374.
9 See EWEA. (2000). Proceedings of the EWEA Wind Powerfor the 21st Century Conference, Kassel, Germany espe-cially papers from Schleswag AG, a utility with probablythe largest penetration of wind energy in the world.
10 For example, according to page 48 of Electricity Conser-vation & Supply Task Force. (2004). Tough Choices,Addressing Ontario’s Power Needs: Final Report to theMinister. Available at www.energy.gov.on.ca/english/pdf/electricity/TaskForceReport.pdf “Intermittent generatorscan be valuable as a source of energy for load displace-ment, but their inherent unpredictability does not allowthem to be used for baseload or peaking purposes.”
11 See chapter 17 ‘System Integration’ by E. Bossanyi inFreris, L. (1990). Wind Energy Conversion Systems.London: Prentice Hall.
12 Smith, D. (1990). Wind energy resource potential and thehourly fit of wind energy to utility loads in NorthernCalifornia. In Proceedings of Windpower 90, the AnnualConference of the American Wind Energy Association.Washington, DC: AWEA,
13 Kirby, B., Milligan, M., Makarov, Y. Hawkins, D., Jackson,K. and Shiu, H. (2003). California Renewables PortfolioStandard Renewable Generation Integration Cost Analysis.Report prepared for the California Energy Commissionand the California Public Utilities Commission. Availableat: http://cwec.ucdavis.edu/rpsintegration/RPS_Int_Cost_PhaseI_pubrev1a.pdf
14 Giebel, G., Gylling, N. and Czisch, G. (2003). Effects ofLarge-Scale Distribution of Wind Energy in and aroundEurope. Report Available at: http://www.iset.uni-kassel.de/abt/w3-w/projekte/Risoe200305.pdf
15 Cold winter air contains as much as 15% more energythan that at a standard temperature of 15° C.
16 These are not “full-load hours” as used in Europe todescribe productivity, merely the number of hours whenthe wind turbine is generating electricity and not ameasure of how many hours the turbine operates at fullrated capacity.
17 According to Page 57 of Electricity Conservation & SupplyTask Force. (2004) op.cit. note 10: “One option thatcould be attractive is the banking of power with Quebecor Manitoba, allowing those markets to store water andgenerate more power when it has higher value.”
18 According to Page 50 of Electricity Conservation &Supply Task Force. (2004) op.cit. note 10: The advantagesof using wind power include: speed of installation (6months to a year after permitting is complete), no fuelcost, stable generation cost, and a strong correlation toelectricity requirements (installations produce morepower in winter and during the day).
19 For more information about the additional benefits ofwind energy see note 1.
20 Using this calculation (described in page 6 of Kammen,D.M., Kapadia, K, and M. Fripp (2004) Putting Renew-ables to Work: How Many Jobs Can the Clean EnergyIndustry Generate? RAEL Report, University of Cali-fornia, Berkeley. Available at http://ist-socrates.berkeley.edu/~rael/renewables.jobs.pdf) The person-yearsestimate can be divided by the average life of the windfacilities (e.g. 20 years) resulting in 5,000 jobs for 8,000MW of wind turbines
21 Helimax. (2004). Étude sur L’Évaluation du PotentielÉolien, de son Prix de Revient et des Retombees Écono-miques Pouvent en Déouler au Québec, Dossier R-3526-2004. Montreal: Hélimax. Available at: http://www.helimax.com/dossier_r35262004.pdf For 1,000 MW: 6.7person-years/$1 million; 121.5 person-years/TWh foroperation. For 4,000 MW: 7.7 person-years/$1 million;

○ ○ ○ ○ ○ ○ ○ ○ ○ ○ ○ ○ ○ ○ ○ ○ ○ ○ ○ ○ ○ ○ ○ ○ ○ ○ ○ ○ ○ ○ ○ ○ ○ ○ ○ ○ ○ ○ ○ ○ ○ ○ ○ ○ ○ ○ ○ ○ ○ ○ ○ ○ ○ ○ ○ ○ ○ ○ ○ ○
I I WIND POWER IN ONTARIO 31
107.9 person-years/TWh. It’s not clear from the text whythere would be more people employed per dollarinvested at 4,000 MW than 1,000.
22 Assuming 4,000 MW installed at the rate of 1,000 MW/yr and operating for 25 years, the German employmentvalues would produce about 97,000 person-years, versusthe estimate of 78,000 person-years by Helimax (2004)op.cit. note 20.
23 Ibid.24 See Gipe, P. (2004) op.cit. note 1.25 While legally permitted to do so, the requirements are so
onerous, the process so complex, and the payment fortheir electricity so meager that it is impractical.
26 Farmers bear the risk that the developer may not succeedin winning a bid to supply power to the province, lockingup the farmer’s land for a period of time. Worse, thedeveloper may “flip” the lease and sell the rights toanother firm not party to the original transaction.
27 5% value from personal communication with Germanwind development engineer Henning Holst; 4%, 6%, 8%per succeeding decade from Texas Land Commission,Indian Mesa project, as reported by the Alternative EnergyInstitute, West Texas A&M University, Canyon, Texas.3.8% for the first 15 years, 5.4% after from a prospectusfor a Bürgerbeteiligung in the German state of Baden-Württemburg. Ontario offers vary from 2% to 2.75%.
28 The 1-MW turbine is used here only to illustrate thepotential. Many wind turbines today are larger.
29 Political risk is not insignificant in Ontario. Pioneeringwind turbines installed at great expense under pastpolicies initiatives have been stranded by politicalchanges in the province. Recurrence of that problem willhurt financing of future projects.
30 The best example for the necessity for such studies isBuffalo Ridge, Minnesota. In national wind resourcestudies the area of Buffalo Ridge, a gentle rise in thesouthwestern corner of the state between the drainagesof the Mississippi and Missouri Rivers, was classed asonly a modest resource. The state of Minnesota con-ducted a decade-long wind resource assessment and inso doing discovered a powerful, but overlooked, windresource. Today there is 550 MW of wind capacityoperating in the vicinity of Buffalo Ridge.
31 The common practice in the electric utility industry is torepresent generating capacity in megawatts (MW). Whilethis nomenclature is useful when comparing similarsources of generation or for the amount of instantaneouscapacity needed to meet demand, it is less so whendescribing potential resources and especially intermittentresources without energy storage, such as run-of-the-river hydroelectric and wind generation. As a result,Ontario’s potential wind resource is described in terms ofenergy in TWh and not MW.
32 Ontario Wind Power Task Force. (2001). Industry Reportand Recommendations. Available at www.newenergy.org/Wind_Power_Task_Force_Report,_February_2002.pdf.
33 The study estimated that the wind resource could be usedto generate about 18 TWh of electricity annually (thesignificantly lower generation estimate is due to the factthat the study used 1991 wind turbines). The study wascarried out by R. Lynette and Associates for public hearingson the Ontario Hydro 25-Year Demand/Supply Plan of1991 and it used a sophisticated approach to estimate theacceptable potential for wind energy in the province.
34 This estimate uses data and an analytic approach providedby Jim Salmon, Zephyr North, Burlington, Ontario.
35 Note that analysts track the industry’s growth usinginstalled power in MW, simply because it is the easiestnumber to gather as each turbine is nominally rated bythe size of the generator it carries. The amount of electri-city that a wind turbine produces is directly related to thewind resource and the area swept by the wind turbine’srotor, and only indirectly by the size of the generator.
36 Calculation assumes a capacity factor of 20%.37 In arguing the case for nuclear power, the Supply Task
Force noted its capital intensive nature and as a resultnuclear’s need for fixed-price contracts. “Long-termsupply contracts provide the best mechanism forensuring price stability” see Electricity Conservation &Supply Task Force (2004) op.cit. note 10.
38 For an exciting account of leaked documents, powerpolitics, and how California became the one-time hotbedof renewable energy development see Roe, D. (1984).Dynamos and Virgins. New York: Random House.
39 All the companies that opted for this contract wentbankrupt within a few years.
40 For more details see Gipe (1995) op.cit. note 2.41 Tampier, M. (2004). Background Document for the Green
Power Workshop Series, Toronto: Pollution Probe andSummerhill Group.
42 Ibid.43 Ibid.44 For a discussion of the pros and cons of politically-
determined amounts and politically- determined pricessee pages 18–23 of Hvelplund, F. (2001). Political Prices orPolitical Quantities? A Comparison of Renewable EnergySupport Systems. Osnabrück, Germany: New Energy.Available at http://www.ontario-sea.org/REMs/EFLFredeHvelplundBerlin 2002.pdf. Hvelplund’s book examinesthis topic in more detail. See Hvelplund, F. (2001).Renewable Energy Governance Systems: A Comparison ofthe “Political Price-/Amount Market” Model with the“Political Quota-/Certificate Price Market” System (TheGerman and Danish cases). Aalborg University: Institutefor development and Planning.
45 Wiser, R., Porter, K., Bolinger, M. (2002). ComparingState Portfolio Standards and System-Benefits ChargesUnder Restructuring. Berkeley: Lawrence BerkeleyNational Laboratory. Wiser has written extensively onRenewable Portfolio Standards and his work, and that ofMark Bolinger are available on the LBNL web site, http://eetd.lbl.gov/ea/EMS/cases/

○ ○ ○ ○ ○ ○ ○ ○ ○ ○ ○ ○ ○ ○ ○ ○ ○ ○ ○ ○ ○ ○ ○ ○ ○ ○ ○ ○ ○ ○ ○ ○ ○ ○ ○ ○ ○ ○ ○ ○ ○ ○ ○ ○ ○ ○ ○ ○ ○ ○ ○ ○ ○ ○ ○ ○ ○ ○ ○ ○
SMART GENERATION: POWERING ONTARIO WITH RENEWABLE ENERGY32
46 Kjaer, C. (2004). Support Mechanisms. Brussels: EuropeanWind Energy Association. Available at www.ewea.org/documents/supportmech.pdf
47 ibid.48 GE Wind also manufactures wind turbines in Germany.49 For detailed information on REM see www.ontario-
sea.org/REMs/REMsList.html50 Using the federal Wind Power Production Incentive
triggers a federal environmental assessment for a projectas small as one turbine. Similarly, Ontario’s currenttrigger for a provincial environmental assessment is 2MW. Many wind turbines today are 2 MW or larger.

GeneratingGenuine Wealth
33
3
Summary
Hydroelectric facilities provide a clean and
low-cost source of energy that meets more than a quar-
ter of Ontario’s electricity requirements.
Ontario’s hydroelectric industry currently generates
$1.7 billion in annual energy production and supports
3,600 jobs. Plant operators invest approximately $250
million in operating and maintenance budgets and
contribute $140 million annually in water royalties to the
government.
The past decade has seen a small increase in the
number of hydropower development projects in the
province, with only 150 MW of new capacity being
installed as a direct result of $400 million in long-term
capital investment.
Ontario has over 2,000 potential hydropower sites, of
which only 200 have been developed. Ontario has the option
of developing and refurbishing an additional 1,000 MW
of small-scale and low-impact hydroelectric sites.
Using a conservative estimate for job creation, this
additional hydroelectric potential could increase current
employment in the hydroelectric sector by about 7%
(accounting for an additional 240 jobs in the province).
Although this estimate indicates that the technology
has a lower employment creation potential than other
renewable options, many new hydroelectric facilities can
be located in parts of Ontario currently facing economic
hardship and chronic underemployment. Small, low-
impact hydroelectric facilities in particular are especially
well-suited for community development purposes
because they can create employment, increase economic
activity and protect local energy security. Renewable
energy mechanisms can be tailored to facilitate the
development of these facilities.
Ontario’s existing hydroelectric facilities have ample
potential to also support the 8,000 MW of wind facilities
recommended for development by this study. The
province’s installed dispatchable and storage-based
hydroelectric facilities have many times the capacity
to support and help integrate the proposed wind
development.
Integrating significant wind resources into Ontario’s
electrical system is not constrained by technological
challenges. Although detailed technical assessments need
to be conducted, the key obstacles are political and
financial in nature. What is needed is cooperation
between existing hydroelectric facilities and new wind
facilities, and political will to create a financially
acceptable operating platform.
1. Background on hydropower
The transition from the age of steam to a modern
electrical society has deep roots in Ontario. Starting in
the late 19th century, hydroelectric generation powered
Ontario’s economic engine and helped develop one of
the wealthiest regions in North America.
As technology evolved, cities and towns located near
suitable sources of waterpower quickly traded in their
water wheels for hydraulic turbines. In 1883, Ottawa was
one the first cities in North America to light its streets
using renewable energy from the Ottawa River.
With the advent of alternating current and transformer
technologies, high-voltage transmission lines were
developed. This allowed energy to be transmitted over long
distances, a necessity when considering that suitable hy-
draulic resources are rarely located near urban load areas.
From these early beginnings, Canada has grown to
become one of the leading hydropower producers in the
Hydroelectricityin Ontario

○ ○ ○ ○ ○ ○ ○ ○ ○ ○ ○ ○ ○ ○ ○ ○ ○ ○ ○ ○ ○ ○ ○ ○ ○ ○ ○ ○ ○ ○ ○ ○ ○ ○ ○ ○ ○ ○ ○ ○ ○ ○ ○ ○ ○ ○ ○ ○ ○ ○ ○ ○ ○ ○ ○ ○ ○ ○ ○ ○
SMART GENERATION: POWERING ONTARIO WITH RENEWABLE ENERGY34
world. Today, Canada has about 450 hydroelectric plants,
representing a total installed capacity of 67,000 MW,
which provide 60% of the Canadian electrical supply mix.
At the end of 2003, Canada had an additional 2,400 MW
of additional capacity under construction, 600 MW of
refurbishment projects, and more than 6,200 MW of
hydroelectric development in the planning stages.
Although Canada is a major developer of hydropower,
what is not usually specified is how much of this
renewable energy technology is low-impact environ-
mental technology.
Large hydroelectric facilities require costly, custom,
detailed engineering programs and environmental
assessments due to the physical size of the plants and the
environmental damage resulting from reservoir flooding,
sedimentation, destruction of fish and wildlife habitats
and concerns about greenhouse gas emissions.1
Small-scale hydroelectric development requires
comparatively little physical space while only occasionally
causing more local ecosystem damage than natural
flooding, drought, and erosion rates present prior to plant
commissioning. Many negative environmental impacts
can be avoided by good design, involvement of local
landowners and appropriate construction and operating
practices.
The Canadian Environmental Choice Program offers
Ecologo Certification for qualifying renewable, environ-
mentally low-impact electrical generators and can be used
as a guide to minimize the environmental damage of a
hydroelectric development.2
At the end of 2003, there were 224 small hydro plants
operating in Canada with a total installed capacity of
996 MW. An additional 53 MW of capacity are now under
construction or in the late planning stages.
Ontario’s 50 river systems provide the energy to power
8,150 MW of installed hydroelectric capacity.3 Ontario
Power Generation (OPG) owns the vast majority of this
capacity, controlling 36 large-scale facilities with an
installed capacity of 6,796 MW. In addition, OPG owns
a further 29 EcoLogo certified green power sites with a
capacity of 125 MW.4 The remaining 1,229 MW of
hydroelectric capacity are provided by Non Utility
Generators (NUGs).
According to OPG statistics, low-impact hydro
accounted for approximately 95% of its 2002 green power
generation, providing approximately 700 gigawatt hours
of electricity (sufficient to supply the annual needs of
about 60,000 Ontario homes).
1 . 1 W O R L D W I D E H Y D R O P O W E RD E V E L O P M E N T
Hydropower generates about 17% of the world’s
electricity; however, due to the fact that most countries
use different definitions for determining small hydro-
electric facilities it is not feasible to provide a definitive
estimate of the total world installed capacity of small-
scale hydropower.5
Nevertheless, country-specific information is readily
available and indicates that countries in all continents are
stepping up their deployment of small-hydro facilities.6
1 . 2 H Y D R O P O W E R I S A NE S TA B L I S H E D B U S I N E S S
Hydropower accounts for nearly $1.7 billion in annual
energy production in the province. Water leases total
more than $140 million a year, the largest single source
of natural resource-based income paid to the province.
Outlining a specific range of capital costs is difficult
due to the site-specific nature of projects. Nevertheless,
private developers indicate an average range of $1.5 to
$3.0 million per MW of installed capacity.7
Sites that do not require long penstocks or canals,
roads or bridges can have a large effect on first-time costs
(costs that are not directly related to the capital necessary
for power production). Under favourable conditions,
systems may be installed for as little as $1,000 per kW.8
In the past decade, the development of 150 MW of
hydropower capacity in Ontario resulted from an
investment of $400 million or $2,670 per kW capacity.9
Small projects have similar assessment and engineer-
ing issues to large projects, but small developers often
have lower overhead costs. Additionally, run-of-river
systems do not require large reservoirs or catchment
structures, driving first-time costs downward.
FIGURE 1 Canada’s electric power generation (2002)Source: Statistics Canada

○ ○ ○ ○ ○ ○ ○ ○ ○ ○ ○ ○ ○ ○ ○ ○ ○ ○ ○ ○ ○ ○ ○ ○ ○ ○ ○ ○ ○ ○ ○ ○ ○ ○ ○ ○ ○ ○ ○ ○ ○ ○ ○ ○ ○ ○ ○ ○ ○ ○ ○ ○ ○ ○ ○ ○ ○ ○ ○ ○
I I I HYDROELECTRICITY IN ONTARIO 35
From an income statement point of view, small
developers appear to stand on equal ground with their
large project counterparts. Industry figures indicate that
EcoLogo certified sites can generate power with a suitable
return on investment in the $55 to $65 per MWh range,
which is comparable to new large-scale projects.
1 . 3 T E C H N I C A L C O N S I D E R AT I O N SWell-planned hydro generation sites are designed to use
as much of the flowing water as possible, without harming
the local ecosystem.
Seasonal variations in water flow may prevent a site
from running continuously or at its rated capacity
(nameplate rating). The ratio of actual yearly energy
production to total potential energy production, given
the nameplate rating of a power plant, creates a de-rating
coefficient for the station known as the capacity factor.
The capacity factor for sites in Ontario varies widely and
sites with reservoirs operate at higher capacity factors
than run-of-river units.
Established hydroelectric sites with significant
reservoir capacity can store water and provide dispatch-
able energy, which may be utilized to provide electricity
during peak use times and also to offset the intermittent
nature of other renewable resources (in essence acting as
a large battery that can be turned on and off as needed).
These latter sites are known as peaking plants, resulting
from their inherent flexibility of supply.
Run-of-river hydroelectric sites do not have significant
reservoir capacity and therefore have lower capacity
factors than sites with reservoir storage. These plants have
two key constraints: first, the hydroelectric site must be
operated continuously at or near maximum output
coincident with available water resources (i.e. as a
baseload facility); and second, plant capacity must be
overbuilt to compensate for the lack of reservoir. Baseload
plants are not dispatchable, operating with lower
economic value than dispatchable, peaking facilities,
although at a greater value than intermittent supplies.
Capacity sustainability is a concern when peaking
hydroelectric generation is operated extensively (for
example, as a result of high electricity demand in hot,
dry periods or in response to pressure to sell energy
during a lucrative spot market). If this operating mode
continues over a period of time, storage water levels may
prove insufficient to meet generation demand. The
province is susceptible to this energy constraint as a quarter
of total electricity use depends on hydroelectricity.
Hydroelectricity generation can be divided into four
broad categories: micro, mini, small, and large-scale.
Micro and mini-scale units are used in individual
applications and small communities. Small hydro systems
feed baseload (generally non-dispatchable) electricity
into the distribution or transmission grid. They are
designed to capture the energy of flowing water directly,
without the need for water impoundment and large dams.
Large hydro requires the construction of large dams and
reservoir areas, which store potential energy and provide
valuable dispatchability.
There is no international consensus on the definition
of small hydropower and many countries use turbine or
station capacity as the defining measure.10
Small hydro facilities can be connected to either the
high-voltage transmission system or a local distribution
system. Connecting these smaller renewable generators
to the distribution grid does not result in significant
impacts to the electricity system.
However, Ontario’s interconnection rules to the
distribution system are not harmonized, resulting in a mix
of confusing rules and regulations throughout the province.
Harmonizing these rules is an essential step to
facilitate the implementation of new small hydroelectric
facilities. In addition, the development of simplified
protection and interconnection norms should also be
provincial priorities to enhance the widespread adoption
of these systems.
1 . 4 I N T E G R AT I N G E X I S T I N GH Y D R O E L E C T R I C FA C I L I T I E SW I T H N E W W I N D P L A N T S
Wind energy and some other forms of renewable energy
are intermittent, to some extent predictable, but
nonetheless variable over time. In this regard, wind energy
is not unlike run-of-the-river hydroelectric or solar
photovoltaic systems where their generation responds to
the flow and natural cycle of the resource.
Studies in the United States and Canada have shown
that the coordination between wind generation and
electric utilities can be beneficial to both. The addition
of wind generation to an electric utility can improve the
economic performance of the electric utility system when
operated in a coordinated manner.11
The addition of wind power facilities to regional
electricity networks can be facilitated by releasing the
storage of hydroelectric reservoirs during peak demand
times, which maximizes the value of the hydro resource

○ ○ ○ ○ ○ ○ ○ ○ ○ ○ ○ ○ ○ ○ ○ ○ ○ ○ ○ ○ ○ ○ ○ ○ ○ ○ ○ ○ ○ ○ ○ ○ ○ ○ ○ ○ ○ ○ ○ ○ ○ ○ ○ ○ ○ ○ ○ ○ ○ ○ ○ ○ ○ ○ ○ ○ ○ ○ ○ ○
SMART GENERATION: POWERING ONTARIO WITH RENEWABLE ENERGY36
that may have otherwise been released earlier to meet
average demand.
In essence, the grid operator can use available hydro
storage as a ‘battery’ that allows for accumulation of water
when there is an excess of wind-generated electricity, and
to release this stored water to produce electricity when it
is most needed.
A study examining the relatively small network
serving Vermont found that it was possible to add a large
amount of wind generating capacity because of good
regional ties with Hydro Québec and Vermont’s
neighbours in the New England Power Pool (NEPool).12
Modeling conducted for the study determined that
the integrated system could absorb a penetration of 58%
wind within Vermont (i.e. 810 MW of wind in Vermont’s
1,400 MW system). The model assumed that the network
was operated optimally to absorb as much intermittent
wind capacity as possible. The study concluded that the
integration of wind energy with hydroelectric generation
can improve the management of the hydro reservoirs,
increasing the value of wind generation, and the
availability of hydroelectric storage.
Further elaboration of the relationship between a high
concentration of wind generation in Vermont and its
integration with Hydro Québec’s network calculated that
operating the two synergistically increased the value of
wind energy by more than one-fifth above the price wind
energy would command on the NEPool system.13
These studies illustrate how to resolve a common
misperception that wind-generating capacity requires an
equivalent amount of capacity in reserve as a backup. In
fact the intermittent nature of wind energy is simply
another uncertainty that the pool’s elasticity can handle.
At first glance it often appears that an equivalent
amount of fast-response, or on-demand generation must
be available to back up intermittent resources, such as when
winds are light or variable. This observation has unfortu-
nately become a common and widely-entrenched mistake.
Studies and operating experience from utilities in the
U.S. indicate that the amount of reserve capacity required
to integrate an incremental 1,000 MW of wind generation
can be as little as 100 MW (or 10% of nameplate
capacity).14
It must be emphasized that this figure has a consider-
able range. Therefore, the province needs to instruct
provincial system operators, wind and hydroelectric
researchers, and energy analysts to conduct a detailed
study to determine and clarify how large-scale wind
generation can interact with the unique characteristics
of Ontario’s hydroelectric system.
Although Ontario needs to develop its own estimate
of wind-hydro integration using province-specific
planning methods, the aforementioned figure provides
indication that large-scale wind integration can be achieved
at relatively small cost, especially for hydro systems with
flexible reserves and considerable surplus capacity.
Integration of intermittent renewables with dispatch-
able hydroelectric storage in essence creates a synergistic
relationship between the two, for example, by increasing
the capacity value of wind resources.
1 . 5 T H E E F F E C T O F I N T E R M I T T E N TG E N E R AT I O N
Grid operators must constantly balance supply and
demand on the system in real-time. They have limited
day-to-day control over demand, which is determined
by their customers, although there are ways to signifi-
cantly influence this overtime through support for energy
management and demand side management programs.
Therefore, system operators have traditionally focused
on controlling supply – adding or removing generating
capacity as required.
There are special challenges facing electricity system
operators who want to balance power from intermittent
sources like wind, where they can’t decide how much
power will be added, and when, but have to accept what
the prevailing winds bring them. Yet these challenges can,
and have, been met in jurisdictions with significant wind
power integrated into the system. It is worth noting that
there are also challenges with nuclear power, which can
require days or weeks to be brought on–line.
In order to smooth out the variability of wind and
other intermittent supply sources, dispatchable generat-
ing plants are required. Hydroelectric generation facilities
provide a means of varying their energy output on a
moment-by-moment basis, effectively “filling in” the dips
from intermittent sources such as wind energy. Excess
dispatchable generation must also be present in order to
absorb energy, (i.e. by reducing energy production)
should wind generation production exceed instantaneous
system demand.
The Bonneville Power Administration (BPA) in the
U.S. Pacific Northwest, for example, is currently offering
a number of services that offer proper management of
the above issues by using its hydroelectric dispatchable
capacity for wind regulation purposes. BPA uses the

○ ○ ○ ○ ○ ○ ○ ○ ○ ○ ○ ○ ○ ○ ○ ○ ○ ○ ○ ○ ○ ○ ○ ○ ○ ○ ○ ○ ○ ○ ○ ○ ○ ○ ○ ○ ○ ○ ○ ○ ○ ○ ○ ○ ○ ○ ○ ○ ○ ○ ○ ○ ○ ○ ○ ○ ○ ○ ○ ○
I I I HYDROELECTRICITY IN ONTARIO 37
flexibility of the Federal Columbia River Power System
to integrate wind energy on behalf of other utilities with
an interest in purchasing wind power.15
1 . 6 B E N E F I T S O F N E W H Y D R O P O W E RD E V E L O P M E N T
The costs and benefits of large hydroelectric projects have
been well documented.16 However, the potential benefits
of small-scale hydro are usually less understood.
Hydropower development in many cases involves
undeveloped sites on rivers (or existing dams without
turbines) that are not necessarily near the load, which
implies that grid extensions will be required to transmit
the power over some distance. Therefore, this chapter
concentrates on the potential of developing a multitude
of smaller hydroelectric sites (which require lower voltage
transmission lines than large hydroelectric plants) and
refurbishment of existing sites.
Large hydroelectric systems require connection to the
high-voltage grid, which is extremely expensive.17 Small
hydro systems may be connected to either the low-voltage
or medium-voltage distribution system, or may be
connected to the high-voltage transmission system
located a distance away (that is, the generating station
may transmit a medium voltage and be stepped up upon
arrival to a sub-station).
Small hydroelectric plants can generate the majority
of power needed for consumption at local sites. For
example, the Abitibi Consolidated pulp and paper mill
in Fort Frances, Ontario has a dozen 2 MW small hydro
generators which feed the mill first and the local
community secondly without the need for a high-voltage
transmission system. The design and placement of the
distribution/transmission system is site specific.
Furthermore, large centralized generation facilities
concentrate investment in one area. Decentralized
generation of the same capacity over many sites
distributes investment on a more democratic basis and
can lead to employment gains and local development.
1 . 7 E M P L O Y M E N TOntario has approximately 200 operating hydropower
facilities, of which half are located south of the French
and Mattawa rivers. The northern half of these stations
are situated in areas that support forestry and mining
operations; key contributors to the economies of
northern communities.
The operation and maintenance of these facilities
directly employ 1,600 people and provide indirect
support to a further 2,000 people. Ontario’s 60 hydro-
power producers invest approximately $250 million
annually in support of these facilities.
Using a conservative employment estimate, develop-
ment of 1,000 MW of small-scale and low-impact
hydroelectric sites in Ontario could result in an estimated
increase of 240 jobs in the province.18
In addition to jobs directly related to generation and
support, an unknown number of spin-off jobs could be
created. These new jobs could be created from combining
hybrid renewable/fossil fuel systems for remote com-
munities, developing advanced software and hardware
systems to integrate hydro and wind, and other
supporting technologies.
1 . 8 L O C A L E C O N O M I C D E V E L O P M E N TMany new hydroelectric facilities can be located in areas
that suffer from under-employment and could be a source
for new skilled full-time plant operation and maintenance
jobs. In addition, approximately 15 to 20% of project
capital is spent in the site development area.
FIGURE 2 Environmentally low-impact hydro sites require carefulsite planning and deployment. The Appleton, Ontario Ecologo-certified plant owned by Canadian Hydro Developers is a run-of-river, 1,350 kW site comprising 2 propeller and 1 Kaplan turbine.Construction was intended to blend into the surroundingresidential area by keeping the powerhouse low to the upstreamview, preventing obstruction of the historicmill ruins.
Furthermore, for remote or northern communities,
the economic and environmental benefits of new
hydropower development can be significant. Approxi-
mately 300 Canadian northern and First Nations
communities currently rely on decentralized diesel
generation, a source of greenhouse gas emissions. Diesel
fuel is an expensive commodity that must be shipped over
long distances, often covering environmentally-sensitive
areas. The risk of spillage due to accident or leakage is

○ ○ ○ ○ ○ ○ ○ ○ ○ ○ ○ ○ ○ ○ ○ ○ ○ ○ ○ ○ ○ ○ ○ ○ ○ ○ ○ ○ ○ ○ ○ ○ ○ ○ ○ ○ ○ ○ ○ ○ ○ ○ ○ ○ ○ ○ ○ ○ ○ ○ ○ ○ ○ ○ ○ ○ ○ ○ ○ ○
SMART GENERATION: POWERING ONTARIO WITH RENEWABLE ENERGY38
considerable. In areas where sufficient hydraulic resources
are available, complete removal of diesel generation is
possible. In areas with less favourable resources, hybrid
systems that combine the operation of diesel generators
and small hydro plants can be used to reduce fuel costs
and emissions.
2. Ontario’s hydroelectricresources: key foundationof provincial power
Ontario is blessed with a large number of lakes and rivers,
which at first glance should provide an unlimited amount
of hydroelectric generating capacity. However, for a given
site to be technically viable, it must have sufficient flow
and hydraulic head or vertical drop. During the first half
of the 20th century, Ontario Hydro developed the majority
of these accessible sites, leaving aside those with less than
ideal development potential. Nevertheless, our analysis
indicates that significant hydroelectric potential exists
from refurbishing existing hydroelectric facilities and
new sites.
2 . 1 E S T I M AT E S O F O N TA R I O ’ S T O TA LH Y D R O E L E C T R I C R E S O U R C E S
The Canadian Hydropower Association (CHA) estimates
that Ontario’s total additional hydroelectric potential is
more than 5,000 MW.19
The Ontario Waterpower Association (OWA) has
estimated that Ontario’s hydroelectric potential totals
from 1,200 to 2,000 MW (from re-development,
upgrades, and new development).20
Surveys conducted over the past 20 years indicate that
Ontario has approximately 2,190 feasible sites for
development. Unfortunately, two major site assessments
conducted for the Ontario Ministry of Natural Resources
(MNR) and the International Energy Agency (IEA),
concur on the number of sites, but differ greatly on their
capacity. For example, the MNR database indicates a total
potential resource of 6,046 MW while the IEA database,
which focuses on small hydro (<30MW), provides a total
of 2,193 MW. 21
Given the large number of sites and limited hydro-
logical survey data, estimates are subject to considerable
error. For example, consider that the MNR database
indicates that Freighters Dam on Ahmic Lake is tabulated
with a 750 kW capacity rating but has in reality zero head
and flow.
While these compilations may be of limited use for
determining actual site capacities, the database does
provide prospective developers with geographical
coordinates for locating potential development sites.22
Pivotal research conducted in 1990 by Ontario Hydro
remains today as a unique and crucial source for an
overview of the hydroelectric resources available in
Ontario.23 That research placed Ontario’s total theoretical
hydroelectric potential at 19,900 MW. Deducting existing
developed capacity from that theoretical potential would
indicate that a maximum of 12,400 MW remains as
undeveloped potential.
TABLE 1
Ontario’s potential hydro resource
Source Estimated resource potential (MW)
M.N.R. 6,046I.E.A. 2,193 (small hydro only)Ontario Hydro 12,400CHA > 5,000OWA 1,200–2000
Note:MNR is Ministry of Natural ResourcesIEA is International Energy AgencyCHA is Canadian Hydropower AssociationOWA is Ontario Waterpower Association
As Table 1 indicates, there are significant discrepancies
between available data sources, which clearly suggests that
a new collaborative research effort between the provincial
government and the hydroelectric industry is imperative
to identify and clarify Ontario’s hydroelectric resources.
Until such research is conducted, the data presented in
this report must be considered as a preliminary and rough
attempt to quantify Ontario’s hydroelectric resource.
The wide discrepancy between the Ontario Hydro
estimate and those of MNR, IEA, and CHA clearly suggest
that deductions for several constraints have to be factored
into the Ontario Hydro data. A variety of social, economic
and environmental considerations influence the viability
of potential hydropower deployment in the province. The
next sections analyze the impact of these variables in
Ontario Hydro’s estimate of hydroelectric potential.
2 . 2 T E C H N I C A L R E S O U R C E SThe potential exists to upgrade existing sites, which
includes improved turbine runner and generator
technologies. There have been no definitive studies
completed on this potential, although the Ontario
Waterpower Association (OWA) estimates that there is
potential for 1,350 MW of increased capacity.24

○ ○ ○ ○ ○ ○ ○ ○ ○ ○ ○ ○ ○ ○ ○ ○ ○ ○ ○ ○ ○ ○ ○ ○ ○ ○ ○ ○ ○ ○ ○ ○ ○ ○ ○ ○ ○ ○ ○ ○ ○ ○ ○ ○ ○ ○ ○ ○ ○ ○ ○ ○ ○ ○ ○ ○ ○ ○ ○ ○
I I I HYDROELECTRICITY IN ONTARIO 39
Numerous other sites totaling 1,784 MW capacity are
excluded from Ontario Hydro’s total resource estimation
because they lack adequate data regarding soil structure,
hydrology, and environmental impact information.
2 . 3 P R A C T I C A L R E S O U R C EAlthough there is no shortage of sites that could be
developed, many of these are in Ontario’s far north: the
Albany and Attawapiskat Rivers which flow into James
Bay, and the Winisk and Severn flowing into Hudson Bay.
Complicating matters is the flat terrain of this region, which
possesses few rapids or falls of significant magnitude,
necessitating large dams which would cause extensive
flooding of virgin territory. Furthermore, these dams
could result in displacement of First Nations com-
munities and destruction of ecosystems in the watershed
areas. Therefore, it is estimated that 5,000 MW of capacity
must be discounted from this study for these reasons.
Other site upgrades considered suitable for develop-
ment include four facilities on the Ottawa River: Chats
Falls, Chenaux, Des Joachims and Otto Holden. Such
updates would add 796 MW of peaking capacity, while
generating only 0.33 TWh of energy per year. Concerns
about poor peaking and energy characteristics coupled with
fluctuations in water flow on the Ottawa River led us to
exclude this capacity from the current resource estimation.
2 . 4 A C C E S S I B L E R E S O U R C EThe creation of 53 new provincial parks in 1988 prevented
development of ten large hydropower sites, with a
capacity of 694 MW. This constraint is a public policy
issue that could be reversed or modified to allow site
development. In the interim, this capacity must be
discounted from this study.
An indication of potential change in this area came
in early April 2004 when Provincial Natural Resources
Minister David Ramsay stated in a press release that the
government will open up Crown land so companies can
build wind farms and small water-powered electricity
plants.25
Accessibility plays a factor in the development of
remote sites, where economics and infrastructure develop-
ment, such as roads or grid extensions, are essential
considerations. However, there are currently no recorded
economic data on accessibility on which to base an assess-
ment. Government and industry as part of the resource
assessment recommended above should also undertake
a cooperative study reviewing the impact of these issues.
2 . 5 A C C E P TA B L E R E S O U R C E
Allowing for constraints in the Ontario Hydro data results
in a resource potential of 4,126 MW, which is comparable
to the Canadian Hydropower Association estimate of
“greater than 5,000 MW” and the Ministry of Natural
Resources study of 6,046 MW. However, of this capacity
range only approximately 1,000 MW are available for
small, low-impact hydropower development and
refurbishments. It must be emphasized that the
International Energy Agency resource estimate is based
on small hydro sites, and provides a resource level of 2,193
MW. The range of these estimates indicates the need for
a more detailed provincial assessment to clarify the
potential for low-impact hydropower development.
2 . 6 ONTARIO’S ACHIEVABLE POTENTIAL
One of the few existing sources to estimate the timelines
involved in implementing provincial hydroelectric
development is Ontario Hydro’s 1990 Demand Supply
Plan.26 The Ontario Hydro plan comprised 18 sites, which
included nine new sites, three redevelopments and six exten-
sions totaling 2,935 MW of installed capacity. The plan
called for development to bring on new capacity in 2000
and complete the program implementation in 2016.
Using Ontario’s Hydro’s hydroelectric plan as a
benchmark and project timeline of what could be
achieved in Ontario if significant provincial impetus is
placed on hydroelectric development, it is possible to
construct a very conservative estimate of what can be
achieved between 2004 and 2020.
FIGURE 3 Repair and refurbishment of older hydro generatingplants is a viable opportunity for non-utility generators in theprovince. This plant, constructed in 1906 and located in Galetta,Ontario, was originally developed with 2 x 400 kW synchronousgenerators. Upgrading the turbines and maximizing waterresources has doubled plant capacity from 800 kW to 1,600 kW.(Courtesy of Canadian Hydro Developers and PowerbaseAutomation Systems Inc.)

○ ○ ○ ○ ○ ○ ○ ○ ○ ○ ○ ○ ○ ○ ○ ○ ○ ○ ○ ○ ○ ○ ○ ○ ○ ○ ○ ○ ○ ○ ○ ○ ○ ○ ○ ○ ○ ○ ○ ○ ○ ○ ○ ○ ○ ○ ○ ○ ○ ○ ○ ○ ○ ○ ○ ○ ○ ○ ○ ○
SMART GENERATION: POWERING ONTARIO WITH RENEWABLE ENERGY40
Under favourable governmental and contractual
conditions, it is reasonable to assume that non-utility
generators could develop, upgrade or refurbish at least
1,000 MW of existing or new small-hydro capacity over
the same study period.
2 . 7 E C O N O M I E S O F S C A L E F O RH Y D R O P O W E R
The dynamics of economies of scale are not nearly as
favourable for hydro development projects as compared
to other renewable technologies. For example, develop-
ment of multi-unit wind farms benefit from advantages
in economy of scale by amortizing first time design,
environmental assessment, engineering and infra-
structure costs. Although multi-unit hydroelectric
cascade systems may offer some economies of scale,
hydropower projects tend to almost always be one-off
developments, which do not benefit from the advantages
of economies of scale.
3. Policies, mechanisms, andincentives to enhance theviability of Ontario’shydroelectric power
A key first step to ensure that hydroelectric development
occurs in an environmentally-sound, cost-effective, and
sustained manner in Ontario, is that a collaborative study
of all provincial hydro development sites be undertaken
by government and industry to identify resources using
a common methodology suitable to all industry developers.
Since accessibility plays a crucial factor in the economic
profile of remote sites, elements such as roads and grid
extensions need to be considered as part of the analysis.
The proposed assessment should also determine if
existing flood control or other non-hydroelectric
generating dams already present in the province could
be upgraded to allow electrical generation.
Connecting smaller renewable generators to the
distribution grid does not result in significant impacts
and instead can improve the reliability of the province’s
electricity system. However, the process regulating
connections requires province-wide harmonization and
studies regarding simplified protection and inter-
connection standards.
Cost and access to the electrical transmission and
distribution systems are major potential impediments to
all renewable energy technologies including hydroelectric
developments. The existing generator-pay approach to
new transmission facilities represents a significant barrier
that can curtail hydroelectric development. It is
recommended that a portion of transmission revenues
be applied to upgraded transmission facilities to help
renewable energy resources meet supply objectives.
Another key step to ensure that renewable sources are
TABLE 2
Estimated contributions – hydroelectric generation
Cumulative capacity in-service (MW)Year (refurbishment & small hydro)
2004 02005 02006 02007 712008 1552009 2602010 (mid Kyoto) 4352011 5222012 5502013 5802014 5912015 6492016 7982017 8532018 8892019 9462020 1,000
Note.Table 2 does not include the Niagara Tunnel project. The timeline assumesenvironmental and regulatory assessments completed to allow first projects on line byDecember 31, 2007.
FIGURE 4 Existing flood and flow control dams dot the provincialcountryside without providing any of the benefits of hydroelec-tric generation. Low-cost, siphon-operated turbines may beinstalled with a minimum of infrastructure or visual degradationat the site. Units such as the model depicted above are perfectlysuited for owner-operated systems located on farms and otherrural properties where electrical distribution is within proximity.(Courtesy Mavel Industries)

○ ○ ○ ○ ○ ○ ○ ○ ○ ○ ○ ○ ○ ○ ○ ○ ○ ○ ○ ○ ○ ○ ○ ○ ○ ○ ○ ○ ○ ○ ○ ○ ○ ○ ○ ○ ○ ○ ○ ○ ○ ○ ○ ○ ○ ○ ○ ○ ○ ○ ○ ○ ○ ○ ○ ○ ○ ○ ○ ○
I I I HYDROELECTRICITY IN ONTARIO 41
developed to their full potential is to implement a
provincial strategy to ensure that existing facilities with
hydroelectric storage can be used to increase the benefits
from both wind and hydroelectric generation.
The new Ontario Power Authority should commission
the Ontario Energy Board and the new Independent
Electricity System Operator to evaluate the integration of
varying amounts of intermittent renewables with Ontario’s
hydroelectric system to determine how best to coordinate
operation among these renewable resources.
A critical factor for the successful implementation of
new and upgraded low-impact hydro is the establishment
of clear directives within all levels of government
confirming renewable energy as “core business.”
The implementation of a Renewable Energy Bureau,
with a mandate to foster clean energy initiatives and
practical mechanisms to ensure that these programs are
confirmed within all ministries, is essential to ensure that
all forms of renewable energy development, including
hydropower, are sustained in the province.
Renewable energy mechanisms (REM) are a useful
tool that can be tailored by the province to enable local
communities, First Nations, cooperatives, and commer-
cial hydroelectric developers to develop hydroelectric
projects.
The fixed-price contracts under renewable mechanisms
can be specifically designed to stimulate specific types of
hydroelectric developments, which may offer multiple
benefits for local communities and the province (e.g. low-
impact electricity production, employment creation,
community economic development, enhanced local
supply security). Furthermore, renewable mechanisms
can be designed to ensure that a wide diversity of
hydroelectric initiatives are developed, and that the
mechanisms act as an incentive to refurbish or develop
remote sites.
4. Conclusions and furtherresearch
Hydroelectric facilities have an historic tradition of
powering provincial development, and today continue
to provide a low-cost source of electricity that satisfies
more than a quarter of Ontario’s electricity needs.
The analysis presented here indicates that an
additional 1,000 MW of small, low-impact hydro and
refurbishments could be available in Ontario (not
including the Niagara Tunnel project).27 These figures are
considered preliminary estimates that need to be clarified
by a detailed collaborative research study that should be
conducted as soon as possible by the province and the
hydropower industry.28
REMs can be used as a tailored tool to ensure that the
most socially and environmentally-desirable hydro-
electric projects are developed in Ontario.
Hydroelectricity can play a crucial synergistic role to
facilitate the expansion of intermittent renewable
resources such as wind in Ontario. Studies and operating
experience from utilities in the U.S. indicate that the
amount of reserve capacity required to integrate an
incremental 1,000 MW of wind generation can be as little
as 100 MW (or 10% of renewable nameplate capacity).

○ ○ ○ ○ ○ ○ ○ ○ ○ ○ ○ ○ ○ ○ ○ ○ ○ ○ ○ ○ ○ ○ ○ ○ ○ ○ ○ ○ ○ ○ ○ ○ ○ ○ ○ ○ ○ ○ ○ ○ ○ ○ ○ ○ ○ ○ ○ ○ ○ ○ ○ ○ ○ ○ ○ ○ ○ ○ ○ ○
SMART GENERATION: POWERING ONTARIO WITH RENEWABLE ENERGY42
S M A L L H Y D R O P R O J E C T I N Q U E B E CA F A M I LY A F FA I R
The Blanche River in Gatineau, Quebec, is a pristinelocation for canoeing and fishing, as well as generatinghydroelectricity.
On the river’s edge sits a small hydro station ownedby father and son Guy and Stephane Laplante. Thestation is located on an abandoned Hydro Quebecgenerating site and has been carefully designed toblend with the surroundings and minimize the impacton the natural environment.
The small hydro generating facility delivers energy(0.5 megawatts) to the Hydro Quebec electrical gridunder a 20-year purchase agreement.
A 1981 fire destroyed the previous facility ownedby Hydro Quebec. Guy Laplante approached Hydro
Quebec and purchased the site in 1991. The site wascommissioned for operation in the winter of 1998. Bykeeping their capital and operating costs to aminimum, the Laplantes expect an average return oninvestment of between eight and 10 percent.
A double-wheel Francis turbine receives waterfrom the head intake structure, which is located aboveand behind the building. Water flows through a buriedsupply pipe prior to entering the turbine, whereuponit strikes the “runner blade” assembly. Water pressureimparts a torque on the runner blade, causing thedrive shaft to turn. The rotating drive shaft in turncauses the generator’s rotor to spin, developingelectricity for transmission to the electrical grid.

○ ○ ○ ○ ○ ○ ○ ○ ○ ○ ○ ○ ○ ○ ○ ○ ○ ○ ○ ○ ○ ○ ○ ○ ○ ○ ○ ○ ○ ○ ○ ○ ○ ○ ○ ○ ○ ○ ○ ○ ○ ○ ○ ○ ○ ○ ○ ○ ○ ○ ○ ○ ○ ○ ○ ○ ○ ○ ○ ○
I I I HYDROELECTRICITY IN ONTARIO 43
H Y D R O P O W E R S F I R S T N AT I O N SC O M M U N I T Y
A small hydro station in northern Ontario is doing alot more than just generating electricity. It’s helpinglocal First Nations build a thriving community.
The Pic River First Nation, a small Ojibway commun-ity located between Thunder Bay and Sault Ste. Marie,has part ownership in two hydro stations. By sellingpower from the hydro stations to the Ontario grid, theband has generated more than $1 million in profits.
Income from the hydro station has helped the bandfinance a women’s crisis centre, a youth centre, arecreation centre, cable television, and high-speedInternet services.
Pic River First Nation first became involved in smallhydro development when Chief Roy Michano wasinvited to sit on a review committee for a proposedhydro development located on Black River, fivekilometres east of the community. The Ontariogovernment had identified the site as one withpotential for small hydro and was entertainingproposals for development. Rather than take a passiverole on the review committee, Chief Michano optedfor a more assertive role, choosing to bid for the rightto develop the station.
The decision to involve the community in hydrodevelopment was based on the band’s desire tobenefit from this significant economic opportunity. Aswell, generating power from small-hydro was a goodmatch with the First Nation’s view on environmentalstewardship.
The Black River generating station opened in 1992.It is a 13.5-megawatt run-of-the-river design, whichminimizes the impact on the environment. The poweris sold back to Ontario Hydro through a fixed-price,50-year contract at 6.3 cents per kilowatt-hour.
Experience gained with the Black River hydrodevelopment has allowed the First Nations communityto gradually build capacity and play an increasing rolein the development and management of subsequenthydro ventures. The First Nation has rolled theirexperience into two other significant run-of-the-riverhydro stations.
The Twin Falls Generating Station, a 5.0-megawattstation located on the Kagiano River, and the UmbataFalls Hydro Project, a 23-megawatt station locatedon the White River are the First Nation’s most recentdevelopments.

○ ○ ○ ○ ○ ○ ○ ○ ○ ○ ○ ○ ○ ○ ○ ○ ○ ○ ○ ○ ○ ○ ○ ○ ○ ○ ○ ○ ○ ○ ○ ○ ○ ○ ○ ○ ○ ○ ○ ○ ○ ○ ○ ○ ○ ○ ○ ○ ○ ○ ○ ○ ○ ○ ○ ○ ○ ○ ○ ○
SMART GENERATION: POWERING ONTARIO WITH RENEWABLE ENERGY44
H Y D R O E L E C T R I C C H A P T E R N OT E S
1 For a detailed overview of the significant problemsassociated with large-scale hydro developments seewww.irn.org/programs/greenhouse/
2 For more details see the electricity generation section ofwww.environmentalchoice.ca
3 See Ontario Waterpower Association website www.owa.ca4 Ontario Power Generation website see Operations/
Hydroelectric Generation www.opg.com5 Source of world production of electricity estimate:
International Energy Agency www.iea.org/Textbase/stats/electricityresult.asp
6 For country specific information see www.small-hydro.com7 Personal telephone interview with Mr. R. Keating,
President of Canadian Hydro Developers (May 14, 2004).8 Information derived from Ontario Waterpower Associa-
tion, “Responsible Industry Facts” www.owa.ca and fromsurveys of member hydropower developers.
9 Ibid.10 For more details see the International Small Hydro Atlas
at www.small-hydro.com11 Krau, S., Lafrance, G., Saulnier, B., Cohen, J. (2003). Inte-
grating the Energy Markets in North America: ConditionsHelping Large-scale Integration of Wind Power? Inproceedings of 23rd Annual North American Conferenceof AMEE/USAEE/IAEE, Mexico City, Mexico. http://www.iaee.org/documents/NUIAEEMexico_v2.pdf
12 William, C., Saulnier, B. and Cohen, J. (2002). Assessmentof the impact of wind power penetration on the Vermontelectricity grid, Technical Reference 1 of 3. Montreal:Hydro Québec, Institut de Recherche.
13 Ibid.14 Hirst, E. (2002). Integrating Wind Energy with the BPA
Power System: Preliminary Study. Power Portland: BusinessLine, Bonneville Power Administration. Available atwww.ehirst.com/PDF/BPAWindIntegration.pdf
15 For more details see on BPA’s wind integration servicessee www.bpa.gov/Power/PGC/Wind/wind.shtml
16 For example see the comprehensive report “Dams andDevelopment: A New Framework for Decision Making”authored by the World Commission on Dams available atwww.dams.org
17 Low-voltage systems are by comparison very inexpensive,adding approximately $50,000 per km compared to anorder of magnitude (or more) for a high-voltage trans-mission line.
18 We use a conservative estimate because it is expected thatpotential employment gains will be limited by the factthat some of the additional capacity will be achievedthrough upgrading existing facilities. Additionally, newsites have a high level of automation, allowing automaticand remote control from existing monitoring facilities,further reducing new labour requirements.
19 See page 52 of Canadian Hydropower association.
(2003). Current and planned hydro development inCanada. Hydropower & Dams, issue two, 50–52. Availableat www.canhydropower.org/hydro_e/p_news_2.htm
20 See Table 2 in Appendix 2 (New Wind Power andWaterpower Potential) of Boileau, D., Estill, G., Norris, P.(2002). Generating Investment in Ontario: Final Reportof the Renewable Energy Task Team. Available at www.canwea.ca/downloads/en/PDFS/Investing_in_Ontario_Final_dec_11_2002.pdf
21 Ministry of Natural Resources Waterpower Site Inventory(Excel Spreadsheet) www.owa.ca/policy.html InternationalEnergy Agency, Small Hydro Database www.smallhydro.com
22 See Ministry of Natural Resources Waterpower SiteInventory (Excel Spreadsheet) www.owa.ca/policy.html
23 Ontario Hydro. (1990). Providing the Balance of Power:Ontario Hydro’s Plan to Serve Customers’ Electricity Needs:Demand/Supply Plan Report. Toronto: Ontario Hydro
24 See Ontario Waterpower Association website section“Responsible Industry” at www.owa.ca
25 See Canadian Press article by Livingston, G. (2004).Ontario must build more electricity capacity to deal withshortfall, IMO says. Available at www.greatlakesdirectory.org/on/040104_great_lakes.htm
26 Ontario Hydro op.cit. note 31 see Chapter 12, TheHydraulic Plan.
27 According to the Ministry of Energy, the Niagara Tunnelproject “will increase the amount of water flowing toexisting turbines at the Sir Adam Beck GeneratingStation to produce an additional 1.6 terawatt-hours ofclean, renewable electricity per year – enough power tomeet the annual needs of 160,000 homes, or a city twicethe size of Niagara Falls.” See Ministry of Energy pressrelease (June 25, 2004): “McGuinty Government GivesGreen Light to Expand Electricity Generation at NiagaraFalls” available at www.energy.gov.on.ca/index.cfm?fuseaction=english.news
28 It is worth noting that research conducted in 2002 byBoileau et al. (2002) concluded that about 1200 to 2000MW of hydroelectric capacity is available in Ontariofrom known new development sites, re-developments atexisting facilities, upgrades (re-powering and efficiencyimprovements) and additional new development. SeeBoileau, D., Estill, G., Norris, P. (2002). GeneratingInvestment in Ontario: Final Report of the RenewableEnergy Task Team. Available at www.canwea.ca/downloads/en/PDFS/Investing_in_Ontario_Final_dec_11_2002.pdf Although the figures quoted on Boileau etal. (2002) are in the same order of magnitude of thoseprovided in this report the key point remains that there issignificant variability in all the available estimates ofOntario’s hydroelectric potential. A detailed collaborativestudy is required to clarify the potential and to provide atimeline and guidelines for implementation.

GeneratingGenuine Wealth
45
4
Summary
Biomass is a renewable source of energy that has
the potential for significant expansion. Ontario can join
a number of progressive industrial nations in Europe that
have chosen biomass as a major part of their sustainable
energy strategy.
Defined as any organic matter of vegetable or animal
origin, biomass provides energy to Ontario today in the
form of wood chips, pellets, firewood, and landfill gas.
New forms of environmentally-friendly biomass sources
are also being developed including high-yielding energy
crops, crop residues, and biogas.
While there are some forms of biomass that can have
significant negative environmental and health impli-
cations stringent standards can ensure a truly sustainable
use of this renewable resource.
The biggest advantages of biomass sources are that
they can be stored and used when needed, and can be
used for a multiplicity of applications including heat,
electricity or liquid fuel. Biomass can provide a constant,
non-fluctuating supply of energy.
A total energy resource of 288 PJ of biomass can be
developed in Ontario.
Between 2010–2020, biomass could supply 53 PJ (or
14.7 TWh) of power generation and 169 PJ for heat
applications. This amount of biomass power generation
is equivalent to an installed capacity of 2,450 MW. If
supportive policies are implemented by 2007 biomass
could be supplying 9.1 PJ (2.5 TWh) of electricity, which
corresponds with a generating capacity of 426 MW.
Our analysis indicates that Ontario could use biomass
for heat related energy applications, displacing the use
of heating oil, natural gas, propane and electricity. It is
becoming increasingly uneconomical to use high-grade
forms of energy for this application. A total of 160 PJ of
new bioenergy resources could be developed in Ontario
with 130 PJ of energy from the agricultural sector (mainly
from energy crops), 20 PJ of forest sector residue and 10
PJ from the urban waste recovery sector.
Ontario currently uses about 57 PJ of electricity in
the residential sector for space and hot water heating. Bio-
mass energy can help displace this load and significantly
reduce peak winter loading problems on the electrical grid,
and reduce the overall need for power in the province.
As heating oil, natural gas, propane and electricity
continue to increase in price; a major biomass heat
industry can develop in Ontario without any significant
level of subsidies. Research and development support
for energy crops and creative financing schemes for
the installation of residential stoves and boilers and
district heating systems can help this opportunity to be
more quickly realized. This is a high priority for
developing the biomass sector as it offers a lower cost
option than green power incentives. The use of electricity,
heating oil and propane in heat-related energy appli-
cations could be dramatically reduced in the province.
Developing biomass uses will improve Ontario’s trade
balance, increase employment, support rural develop-
ment, reduce greenhouse gas emissions, strengthen
electricity security, and help in the transition away from
coal and nuclear power.
1 . 0 B A C K G R O U N D O N B I O M A S SThe term ‘biomass’ refers to forestry and agricultural
products, residues from agriculture (including plant and
animal substances), as well as the biodegradable fraction
of industrial and municipal waste. Biomass is derived
from a large number of products and residues (e.g. straw,
sawdust, bark, and manure).
Biomass inOntario

○ ○ ○ ○ ○ ○ ○ ○ ○ ○ ○ ○ ○ ○ ○ ○ ○ ○ ○ ○ ○ ○ ○ ○ ○ ○ ○ ○ ○ ○ ○ ○ ○ ○ ○ ○ ○ ○ ○ ○ ○ ○ ○ ○ ○ ○ ○ ○ ○ ○ ○ ○ ○ ○ ○ ○ ○ ○ ○ ○
SMART GENERATION: POWERING ONTARIO WITH RENEWABLE ENERGY4 6
The supply of all biomass types is determined by
physical availability, competing uses, and logistical
considerations. Biomass conversion systems have been
developed to process a variety of biomass types (e.g.
combustion of straw, gasification of wood, and anaerobic
digestion of manure) and are at different levels of
technological maturity. All biomass technologies have
their own specific technical and economic characteristics,
which are further described in section 2.
The demand for biomass is primarily determined by
the demand for heat, electricity, and transport fuels and
the costs and convenience associated with competing
energy forms that are also meeting this demand. However,
environmental and public health considerations and the
reliability of the energy supply also play a key role in
determining the suitability of biomass sources as
replacements for fossil fuels and nuclear energy.
Therefore, the analysis of biomass sources in this
chapter also includes discussions on emissions, biodiver-
sity, soil quality, competing uses, and the energy
requirements to process biomass into economical and
convenient energy forms for consumers.
The forestry sector generates by-products that can be
readily converted to energy with presently-available
technologies. Most of Ontario’s forest sector biomass is a
product of the industrial utilization of sawlogs and is
already being recovered for energy. However there is some
potential for expanded use of bark and sawdust. There is
also a need for energy efficiency projects to enable greater
energy recovery from the biomass being utilized by the
forest products industry. Some bioenergy advocates are
also interested in significantly expanding the use of forest
thinnings and recovering more biomass from the forest
floor during harvest operations. It should be recognized
however that forest productivity is fundamentally
dependent on adequate amounts of residual biomass left
during harvesting operations to maintain forest nutrient
and carbon cycling processes and to prevent soil erosion.
Another strategy to expand the impact of forest biomass
is to install more efficient combustion appliances in
households and commercial buildings. The technology
for burning woody biomass (including sawdust, pellets,
wood chips and logs) has matured significantly.
Consumers can now benefit from technological advances
in equipment to provide them with more economical,
reliable, convenient and clean burning energy sources
from the forest sector.
The resource potential in Ontario for expanding the
biomass energy industry from agriculture is large.
Growing dedicated energy crops, such as switchgrass and
reed canarygrass to produce energy could be a major new
industry for Ontario’s agricultural sector that could help
control rising energy costs in rural areas. Perennial grasses
act as solar energy capturing feedstocks, and are more
efficient and more environmentally benign than the
production of annual grains and oilseeds, which require
tillage and moderate to high levels of fossil fuel-based
energy inputs. The agricultural sector also generates
products such as straw and stalks that could be used for
energy purposes. However, these crop residues also play
TABLE 1
Sources of Biomass and their potential energy products
Supply sector Type Examples Energy product a
Forestry Forestry by-products & wood industry Fuelwood, sawdust, bark, black liquor H, P, CHPfrom pulping operations
Agriculture Lignocellulosic agricultural residues Straw, stalks, and milling residues from H, CHPcorn and oat processing
Lignocellulosic energy crops Switchgrass, reed canarygrass, short H, CHProtation forestry
Livestock manure Liquid swine and dairy manure H, P, CHPOilseeds and starch energy crops Corn, winter wheat, barley, oats, canola H, T
and soybeansUrban organic wastes Residues from food industry Shells, husks, pulp, used frying oil H, P, CHP, T
Waste wood Construction wood, demolition wood H, P, CHPBiodegradable municipal waste Kitchen and garden waste (KGW), organic H, P, CHP
municipal wasteBiodegradable landfill waste Landfill gas PSewage sludge Sewage gas H, P, CHP
Notea H= heat, P=power (electricity), CHP= combined heat & power, T= transport fuel (biodiesel, ethanol)

○ ○ ○ ○ ○ ○ ○ ○ ○ ○ ○ ○ ○ ○ ○ ○ ○ ○ ○ ○ ○ ○ ○ ○ ○ ○ ○ ○ ○ ○ ○ ○ ○ ○ ○ ○ ○ ○ ○ ○ ○ ○ ○ ○ ○ ○ ○ ○ ○ ○ ○ ○ ○ ○ ○ ○ ○ ○ ○ ○
IV B IOMASS IN ONTARIO 4 7
an important role in maintaining soil fertility and
preventing soil erosion on farmlands, and they also have
other commercial uses. From a technical point of view
of use, biomass derived from agricultural sources has
historically proven more complex to use than wood
residues, which has delayed development of this sector.
Agricultural biomass sources generally have higher ash
content, and higher potassium and chlorine contents.
These features add difficulty in the combustion process
due to the formation of clinkers (i.e. incombustible
residues) in boilers, causing complications in their
operation, and resulting in increased maintenance
requirements. However, a growing number of companies
have assessed these inherent quality problems with
agricultural biomass and bark, and are now introducing
efficient combustion technology into the marketplace for
these feedstocks. Several Canadian manufacturers are
producing sophisticated new stoves that can effectively
burn switchgrass, crop residue and bark pellets as well as
corn and cereal grains.
Ontario is also a major livestock producing province
and the utilization of manure in Ontario for energy could
help other environmental needs. Manure use in biogas
systems reduces methane emissions and odours, and
helps protect drinking water quality.
Biomass resources can also be recovered from
consumers, municipalities and industries that are largely
located in urban areas. This includes waste wood leftover
from construction and demolition projects, and urban
organic wastes that are potentially recoverable from
households. The food industry also generates residues
from several agricultural products that can be considered
for energy use (e.g. waste vegetable oil). Landfill gas systems
can also significantly reduce the emission of methane, a
harmful greenhouse gas, and enable electricity production.
Greater awareness needs to be developed among
Ontario consumers in the area of relative efficiencies of
the various bioenergy transformation pathways for
converting biomass into useful and economical energy
forms that can most effectively displace fossil fuels. In
Ontario at present, heat and electricity are the main uses
for biomass energy. Biomass can also be used for the
production of transport fuels such as ethanol and
biodiesel. However, conversion of biomass into liquid
fuels for transportation appears limited in Ontario from
both an economic and environmental standpoint.
The production of annual grains and oilseeds for
conversion into liquid fuels is generally an inefficient way
to utilize farmland to capture soil radiation compared to
other energy farming options. Conversion of these
commodities into liquid fuels causes significant loss of
the original energy from the feedstock. In the case of
biomass conversion into ethanol, significant inputs of
fossil fuels are required, which results in a modest net
energy gain that is finally captured in the corn field. Much
more effective fossil fuel substitution can be made when
annual grain crops (or oilseeds) are directly combusted
to displace heating oil and natural gas. It is increasingly
recognized that conversion of annual grains and oilseeds
to liquid fuels is the least desirable energy transformation
pathway and requires significant subsidization by the
taxpayer to create an industry. For example, in using
Ontario farmland to produce energy, the net energy gain
from a corn field to ethanol fuel cycle (21.4 GJ/ha)
represents only a seventh of the net energy gain in the
switchgrass field to pellet heat fuel cycle (163.1 GJ/ha). 1
Both the ethanol and pellets are energy carriers that can
be used to displace oil on a near equivalent energy
substitution basis.
Cellulosic ethanol derived from crop residues has
much more potential as an environmentally-friendly
energy conversion pathway for bio-fuel production.
However, Ontario has higher costs associated with the
production of this biomass than Canada’s western
provinces or tropical countries such as Brazil because of
higher land costs. The ease of transport of an energy-
dense commodity such as ethanol provides only a limited
opportunity for Ontario to have any comparative
advantage in developing this industry.
In Ontario, there are greater opportunities to use
farmland to produce heat and power from biomass, which
is addressed below in more detail.
1 . 1 W O R L D W I D E B I O M A S SD E V E L O P M E N T
Two of the leading biomass-consuming countries in the
industrialized world are Finland and Sweden. Biomass
supplied 19.4% of Finland’s total primary energy supply
and 7.9% of its fuel mix in district heating. In Sweden,
biomass accounted for 15% of total primary energy supply
and 53% of the fuel mix in district heating.2 A key lesson
from Finland and Sweden has been the usefulness of strong
and stable incentives to develop their biomass markets.3
For modern biomass technologies to become a
sustainable energy generation strategy, several environ-
mental considerations need to be addressed. For example,

○ ○ ○ ○ ○ ○ ○ ○ ○ ○ ○ ○ ○ ○ ○ ○ ○ ○ ○ ○ ○ ○ ○ ○ ○ ○ ○ ○ ○ ○ ○ ○ ○ ○ ○ ○ ○ ○ ○ ○ ○ ○ ○ ○ ○ ○ ○ ○ ○ ○ ○ ○ ○ ○ ○ ○ ○ ○ ○ ○
SMART GENERATION: POWERING ONTARIO WITH RENEWABLE ENERGY4 8
if agricultural and forestry residues are being considered
for energy purposes, existing uses of these resources need
to be evaluated to avoid compromising ecological cycles.
Large monoculture plantations for energy crops should
be avoided in favour of planting a variety of species in
the landscape as monocultures decrease biodiversity and
increase vulnerability to pests and diseases. When
considering species selection for energy crops and
plantations, it is important to favour moderate to high-
yielding plants that require low-inputs of fossil fuel-derived
energy inputs and pesticides, as well as low to moderate
water requirements. The land base for sustainable bioenergy
production from energy grasses and trees should mainly
be comprised of marginal lands to ensure that compe-
tition with food production is not compromised.4 As well,
there is a need to ensure that clean combustion
technologies are introduced into the marketplace.
Biomass combustion can be a significant source of air
pollution and a health concern in densely populated areas.
More communities are looking at controlling the use of
fuelwood-burning household appliances to help reduce
the particulate load that deteriorates ambient air quality.
District heating systems and pellet burning appliances
can greatly reduce poor air quality incidents associated
with fuelwood burning for heating using wood stoves.
An emerging international strategy that is showing
promise is the development of densified biomass for heat
and power production. The main advantages of densified
fuel pellets, cubes, and briquettes include ease of handling,
transport and improved combustion efficiencies due to
better control over the combustion process.
Canada is now exporting more than 100,000 tonnes
of pellets made from sawdust and other wood processing
residues into Northern Europe. 5 The global trade in solid
and liquid biofuels will see new trading markets emerge
for biofuels and for equipment and technology to develop
this new industry. The economics of Ontario’s emerging
bioenergy industry will undoubtedly be affected in the
future by external factors such as the importation of
ethanol or foreign-made biomass boilers.
2. Biomass is growing as acompetitive energy sourcein Ontario
The use of biomass is becoming an increasingly attractive
heating option, particularly as it can displace expensive
high-grade energy forms like propane, heating oil,
electricity or natural gas. As these commodities rise in
price, interest in biomass energies will continue to increase.
The advancement of technologies is also helping develop
the biomass industry as equipment becomes more
efficient and convenient to use. The forest products
industry has also identified biomass as a strategic
opportunity to control their energy costs as fossil fuel
prices rise, and to meet their greenhouse gas mitigation
requirements under the Kyoto protocol.6
2 . 1 T E C H N O L O G Y C O N S I D E R AT I O N SThere are various technologies to convert biomass into
heat, electricity and combined heat and power. Combustion
is the most common approach. Biomass combustion
systems range, in order of capacity, from domestic heating
to district heating and from electricity generation to co-
generation with existing power plants. There are
significant opportunities of expanding the use of biomass
in residential, commercial and industrial applications.
2 . 2 C O M B U S T I O N A P P L I C AT I O N SF O R H E AT
Biomass has a long history of use for heating Ontario
homes. While many rural citizens continue to use locally-
available firewood to provide their winter heat, the
majority of consumers have switched to more convenient
heating systems such as natural gas, oil and electricity.
Biomass provides approximately 5.5% of the space
heating in Ontario. No significant hot water heating is
done by biomass in the residential sector (see Table 2 in
Ontario Energy Appendix).
The market is increasingly dominated by natural gas
with modest declines in electricity use and significant
declines in heating oil in the past 10 years. The residential
heat energy industry represents an enormous energy
market for biofuel products. Based on 2002 consumption
levels and the cost of sourcing fuels from Figure 1, the annual
expenditure by consumers on heating (not including
capital costs of equipment) are estimated at $5.55 billion
CDN annually in Ontario. The breakdown of the main
expenditures is $3.43 billion on natural gas, $1.58 billion
on electricity, and $457 million on heating oil.
One important new strategy to increase the con-
venience and accessibility of biomass heating fuels is densi-
fication of biomass material. Biomass is bulky, and both
the forest and farm are often quite distant from energy con-
sumers. There are many advantages to densified fuel pellets:

○ ○ ○ ○ ○ ○ ○ ○ ○ ○ ○ ○ ○ ○ ○ ○ ○ ○ ○ ○ ○ ○ ○ ○ ○ ○ ○ ○ ○ ○ ○ ○ ○ ○ ○ ○ ○ ○ ○ ○ ○ ○ ○ ○ ○ ○ ○ ○ ○ ○ ○ ○ ○ ○ ○ ○ ○ ○ ○ ○
IV B IOMASS IN ONTARIO 4 9
leftovers obtained after processing trees for lumber and
other wood products. At a pellet mill, the material is dried,
compressed, and formed into pellets. In British Columbia,
an association of pellet fuel manufacturers is active in
producing pellets for the North American and European
markets. An estimated 10,000 Ontario homes now have
pellet stoves. 7 Pellet boilers are just beginning to be marketed
in the province. The annual savings for switchgrass pellet
heating systems vs. electrical, oil, and natural gas heating
are 58%, 36%, and 16%, respectively.
Another way of making biomass heating more
convenient to energy consumers is through the use of
district heating systems, where hundreds of homes can
be provided with heat in the form of hot water distributed
through underground pipelines. In northern Europe and
China, district heating is widely being used to improve
convenience for consumers and to save energy and costs
compared to the installation of individual boilers for
households. There is significant potential for the
development of biomass district heating systems and
pellet boilers and stoves in Ontario.
The development of 160 PJ of new energy from the
biomass sector could have significant impact on the
residential sector by helping address Ontario’s power
problems. The residential sector consumes about 32%
of Ontario’s electricity supply with 55.9 PJ being used
for space and hot water heating.8 Peak winter loading
problems are mainly caused by the residential heating
sector. With 160 PJ of new biomass energy available in
Ontario, the province could halve its use of electricity in
space and hot water heating applications in households
using biofuels. This savings of 28 PJ of electrical energy
could be achieved with 37 PJ (assuming a conversion
efficiency of 75% in a district heating system and pellet
boilers and stoves) of the 160 PJ biomass resource. In a
different scenario, where the status quo of electrical
heating in Ontario is maintained at current levels and
biopower is used to replace coal in power generation, 93
PJ of biomass would be required to replace the 28 PJ of
electricity (assuming a 30% conversion efficiency). Use
of biomass for heating in the residential sector to displace
electrical heating is a strategic opportunity for the
province to encourage.9
2 . 3 E L E C T R I C I T Y F R O M B I O M A S S
Generating electricity with solid biomass typically takes
place with the help of a steam generation system. Steam
FIGURE 1 Estimated annual fuel costs for residential heatingoptions in Ontario.Note:Assumptions: energy values and conversion efficiencies of electricity 0.0036GJ/ kWhand 100%, heating oil, 0.0387 GJ/l and 82%, natural gas 0.03723 m3 and 85%, corn15.8 GJ/tonne and 85%, wood pellets 18.7 GJ/tonne and 85%, switchgrass pellets18.1 and 85%. Fossil fuel energy prices from Ontario Ministry of Energy (http://www.energy.gov.on.ca/index.cfm?fuseaction=conservation.guide13) and www.energyshop.com. Natural gas also has an annual delivery charge of $120/yr/household.
• The amount of dust and waste produced is minimized
• The fuel is free-flowing, which facilitates ease of
material handling
• The energy density is increased, easing storage and
reducing transportation costs
• Uniformity of size and control of flow permits
more efficient combustion control
Home heating with “pellet boiler systems” is popular
with consumers in Sweden, Austria and Germany. These
systems operate like conventional central heating systems
and are completely automatic. The boilers are fed wood
pellets made mainly of sawdust, shavings, and other
0
500
1000
1500
2000
2500
3000

○ ○ ○ ○ ○ ○ ○ ○ ○ ○ ○ ○ ○ ○ ○ ○ ○ ○ ○ ○ ○ ○ ○ ○ ○ ○ ○ ○ ○ ○ ○ ○ ○ ○ ○ ○ ○ ○ ○ ○ ○ ○ ○ ○ ○ ○ ○ ○ ○ ○ ○ ○ ○ ○ ○ ○ ○ ○ ○ ○
SMART GENERATION: POWERING ONTARIO WITH RENEWABLE ENERGY5 0
systems are generally too expensive for very small-scale
applications, and most district systems are therefore heat-
only systems.
Compared to large electricity plants, which have an
electric efficiency of 30–40%, combined heat and power
systems (CHP) have a low electric efficiency of 20–30%.
However, CHP systems can produce both electricity and
heat, which results in a total efficiency of 60–90%. An
important characteristic of CHP plants is that they have
to be located near the consumer of heat, which is often a
district heating network or a factory using process heat.10
Biomass integrated gasification/combined cycle
(BIGCC) systems combine flexible fuel characteristics
and high electrical efficiency. Electrical conversion
efficiencies of 40–55% are possible at a scale of about 30
MW. Demonstration projects are under way in several
countries and for various gasification concepts.11
2 . 4 A N A E R O B I C D I G E S T I O NAnother way to produce gas for power is through
anaerobic digestion. This process is the biological
degradation of organic material in the absence of
oxygen.12 This process results in the production of biogas,
a valuable (energy containing) product. Biogas is a
mixture of several gases and vapors, mainly methane and
carbon dioxide. Methane also is the main component in
natural gas and contains the bulk energy value of biogas.
Biogas is a reasonably clean fuel, which can be used in a
gas engine or turbine to generate electricity.13
Anaerobic digestion of manure for electricity
generation is currently applied on a large scale in Germany
where about 1,500 farm-scale digesters have been installed.14
The electricity generated is sold to the grid, and the heat
is used for farm and barn heating. The digested manure
can then be used as fertilizer on farmland, as with manure
that is not digested. Research in Denmark and the
Netherlands shows that digested manure has equal or
better fertilizing potential than ordinary manure.
Manure digestion for electricity generation is success-
ful in Germany because of the implementation of renewable
energy mechanisms targeted for this application, making
the country a world leader on this technology.15
The same anaerobic digestion process that produces
biogas in animal manure and wastewater treatment
digesters occurs naturally underground in landfills. Most
landfill gas results from the decomposition of cellulose
contained in municipal and industrial solid waste. Unlike
animal-controlled anaerobic digestion with manure, the
digestion occurring in landfills is an uncontrolled process
of biomass decay. The result is that landfills emit methane
into the atmosphere (a harmful greenhouse gas with 21
times the heat trapping ability of carbon dioxide). To
avoid this problem, the European Union has taken the
initiative to make landfill gas capture mandatory (as
Ontario also has done for new landfills). In many
situations, the collection of landfill gas and its conversion
to electricity-using gas engines is profitable, and such
systems are becoming more widespread.16
2 . 5 E C O N O M I C S O F P O W E RG E N E R AT I O N F R O M B I O M A S S
A recent overview of estimated costs for electricity
generation using biomass in Canada concluded that
biomass co-combustion (i.e. burning biomass with coal)
costs about 7¢ per kWh, landfill gas 6–7¢ per kWh, and
biomass combustion 5.5–11¢ per kWh.17
However, a more detailed analysis of these costs reveals
that landfill gas and co-combustion costs are closer to
4.5¢ and 6¢ per kWh respectively. Other options such as
large combined heat and power (CHP) are more
expensive and cost about 11¢ per kWh, and farm-based
anaerobic digestion systems, which are generally applied
at a relatively smaller scale, cost about 17¢ per kWh (for
details see Biomass Appendix). Although the costs of
anaerobic digestion are currently higher than other
biomass technologies, it represents an option that can be
relatively easy to implement because of its small scale,
the current availability of manure, and the demand for
heat at the farm level.
2 . 6 B E N E F I T S O F B I O M A S SIf broad environmental considerations and guidelines are
implemented, biomass can become a reliable source of
heat and electricity generation in Ontario. Biomass can
also help cut the province’s greenhouse gas emissions as
it can displace fossil fuels such as oil and coal. Further-
more, electricity generation from landfill gas is an
effective strategy to minimize methane emissions from
municipal solid waste. Development of biomass sources
can also lead to significant job creation and contribute
to rural development.
2 . 7 E M P L O Y M E N TEmployment figures from Germany indicate that more
than 50,000 people are employed in the biomass sector

○ ○ ○ ○ ○ ○ ○ ○ ○ ○ ○ ○ ○ ○ ○ ○ ○ ○ ○ ○ ○ ○ ○ ○ ○ ○ ○ ○ ○ ○ ○ ○ ○ ○ ○ ○ ○ ○ ○ ○ ○ ○ ○ ○ ○ ○ ○ ○ ○ ○ ○ ○ ○ ○ ○ ○ ○ ○ ○ ○
IV B IOMASS IN ONTARIO 5 1
(by comparison about 40,000 are employed in Germany’s
powerful wind industry).18
Recent employment estimates suggest that biomass
projects require a range of 10–42 personnel per each 100
GWh/year (i.e. 10 staff if biomass is collected from forestry
residues, 36 staff if biomass originates from agricultural
wastes, and 42 if biomass is obtained from energy crops).19
Extrapolation of these employment figures to Ontario
indicate that by 2007 between 250 to 1,050 persons could
be employed in the biomass power sector, and that by
2020 biomass employment could range from 1,470 to
6,174 jobs (these estimates refer only to potential
employment related to biomass electricity generation).20
Although these estimates provide only a crude initial
estimate of the potential employment benefits, it is clear
that the potential economic gains especially for rural areas
are quite tremendous. Nevertheless, more detailed,
context-specific, analysis is needed to determine the
actual employment potential of increasing biomass use
in Ontario for electricity and heat applications.
2 . 8 R U R A L D E V E L O P M E N TBiomass resources can be especially appealing to Ontario’s
farmers, who are currently facing significant economic
hardship. Recent estimates by Agriculture and Agri-Food
Canada indicate drastic decreases in Ontario’s farm
income due to the compounding detrimental effects
stemming from loss of U.S. markets and the increase in
value of the Canadian dollar.21
If environmental safeguards are implemented to
ensure that biomass sources are developed and employed
in a sustainable way, an expansion of biomass use for
energy purposes holds significant potential to provide
improved and more stable income levels for farmers and
to strengthen local communities. For example, it appears
higher farm income receipts could be derived from
perennial grasses such as switchgrass than producing beef
cattle on marginal farmlands.
As well, manure can be efficiently collected on farms
to generate heat and electricity. This strategy can also help
minimize the pollution of local water bodies by
generating a valuable fertilizer that poses much less risk
to human health than liquid manure applications to
farmland. Water pollution from untreated manure
remains a serious challenge affecting many communities
in rural Ontario, a problem that has gained increased
attention after the Walkerton tragedy.22
3. Ontario’s biomass resource: Agrowing diversity of supply
Ontario has a variety of potential biomass resources
available from forestry, agricultural, industrial food
residues, and waste sources. The next section evaluates
the potential of the three main biomass resource sectors
in Ontario.
For each type of biomass the total, technical and
practical resources available are estimated using the
following definitions:
• The total resource is the energy content of the total
quantity of biomass that is potentially available, not
taking into account environmental, technical and
logistical considerations.
• The technical resource is the total resource potentially
available, limited by the current technical ability to
extract energy from these sources. It is related to the
quantity of biomass that could be obtained in an
environmentally- sustainable way with help of state-
of-the-art technologies. Within a timeframe of 10–20
years it should be possible to develop the resource.
• The practical resource is the technical resource,
additionally limited by basic practical incompati-
bilities such as competing uses of the resource.
3 . 1 F O R E S T S E C T O R B I O M A S SIn Ontario, an area of 58 million hectares (ha) is covered
with forests, of which 42.2 million ha (73%) is timber
productive (class II) forest and 15.8 million ha (27%) is
timber non-productive forest.23 The average biomass
density of productive class II forest in Ontario is 87
tonnes/ha. Therefore, in total, about 3.7 billion tonnes
of wood biomass is stocked in productive class II forests.24
The timber non-productive forests of Ontario consist
of open muskeg, treed muskeg, rock, protection forest
and brush and alder with varying biomass densities. Using
the average stand density of the Boreal shield of 6 tonnes/
ha, the total biomass contained in unproductive forest is
95 million tonnes, which is approximately 25% of the
biomass stocked in timber productive forests. Moreover,
these forests are often reserved and protected from
harvesting, as they are extremely slow to regenerate.
3 . 2 TECHNICAL RESOURCE EST IMATIONOnly a small portion of the total stock of wood biomass
is available for use on an annual basis as energy. Some

○ ○ ○ ○ ○ ○ ○ ○ ○ ○ ○ ○ ○ ○ ○ ○ ○ ○ ○ ○ ○ ○ ○ ○ ○ ○ ○ ○ ○ ○ ○ ○ ○ ○ ○ ○ ○ ○ ○ ○ ○ ○ ○ ○ ○ ○ ○ ○ ○ ○ ○ ○ ○ ○ ○ ○ ○ ○ ○ ○
SMART GENERATION: POWERING ONTARIO WITH RENEWABLE ENERGY5 2
areas are economically unfeasible to harvest and some
areas are protected for ecological purposes. The
merchantable volume of roundwood harvested on
provincial and private lands in Ontario in 2001 is
summarized in Table 2.
TABLE 2
Net merchantable volume of roundwood harvested onprovincial and private lands in Ontario 1999–200225
Volume Massa Energy contentb
Year (1000 m3) (ktonnes) (PJ)
1998 24,126 10,133 1821999 24,814 10,422 1882000 28,118 11,810 2132001 29,099 12,222 2202002 26,319 11,054 1995-year average 26,495 11,128 200
Notea Assuming an average solid dry density of 420 kg/m3b Assuming a net calorific value of 18 GJ/tonne
Roundwood is defined as sections of tree stem, with
or without bark. It includes logs, bolts, pulpwood, posts,
pilings, and other products in the subcategory known as
industrial roundwood. It also includes fuelwood and
firewood, which are harvested in fairly modest volumes.
However, the total quantity of harvested biomass is
actually higher, as branches, foliage and (part of the) bark
are not included in the statistics. The proportion of total
biomass to roundwood differs per type of tree and can
vary regionally.26 In this study however, an approximate
estimation is made based on the numbers in Figure 2.
In sustainably-managed forests, branches and foliage
are left in the forest for maintaining the carbon and
nutrient cycling process and to provide habitat for the
animals in the forest. Clear guidelines for sustainable
forestry have been established by the Forest Stewardship
Council, which also provides a certification system to
ensure that forests are well managed.28
Bark is usually removed centrally, and except for local
energy generation it is hardly used for other purposes.
Most modern wood processing industries use some the
energy contained in bark, for on-site energy generation.
Special bark combustion systems are developed for this
purpose. The technical potential of this resource if it was
used exclusively for energy in Ontario is 229 PJ, consisting
of roundwood (200 PJ, Table 2) and bark (29 PJ, Table 3).
3 . 3 P R A C T I C A L R E S O U R C EE S T I M AT I O N
While the technical resource estimation is based on
statistics about the supply of wood, the practical resource
consists of residual products from the paper and pulp
industry, the timber industry and wood used in
households. Stem wood is generally judged to be too
expensive for energy purposes because of competition
with the higher-value fibre products industries.
B A R K
At the time of harvest, most of the bark is removed
together with the harvested stem. All 29 PJ (Table 3) of
bark can be regarded as the practical resource. Bark is
considered the main new incremental biomass resource
from the forest sector that can be developed in Ontario.
Some of the bark resource, however, is already utilized
internally for energy in the forest products industry.
B L AC K L I Q U O R A N D WA S T E WO O D U S E I NT H E P U L P A N D PA P E R I N D U S T RY
Black liquor refers to the residual aqueous mixture of
lignin, organic chemicals and inorganic chemicals
recovered after pulping of wood through the Kraft
pulping process. In the case of softwood trees, 27–28 %
is lignin. The dry solid content of black liquor depends
on the evaporator system in the mill, but is typically
within the range of 65% to 75%. Its gross and net calorific
values are 14.3 and 12.4 GJ/tonne, respectively. In
traditional Kraft pulp mills, the black liquor is burned in
a chemical recovering boiler, enabling recovery of the
inorganic pulping chemicals and conversion of the
organic components into thermal energy in the form ofFIGURE 2 Approximate distribution of above stump biomass (%on dry basis)27

○ ○ ○ ○ ○ ○ ○ ○ ○ ○ ○ ○ ○ ○ ○ ○ ○ ○ ○ ○ ○ ○ ○ ○ ○ ○ ○ ○ ○ ○ ○ ○ ○ ○ ○ ○ ○ ○ ○ ○ ○ ○ ○ ○ ○ ○ ○ ○ ○ ○ ○ ○ ○ ○ ○ ○ ○ ○ ○ ○
IV B IOMASS IN ONTARIO 5 3
steam.29 From the viewpoint of sustainability, it is essential
to utilize the generated thermal energy in an efficient
manner. Natural Resources Canada (NRCan) indicates
that the paper and pulp industry uses 83 PJ of energy per
year from wood waste and pulping liquor, providing more
than 50% of the energy demand in this sector.30 However,
the share between wood waste and pulping liquor is not
currently available in NRCan’s online database.
S AW D U S T AVA I L A B I L I T Y F R O M T H E S O L I DWO O D P R O D U C T S I N D U S T RY
The lumber, panel and veneer manufacturing industries
consume the logs and bolts mentioned in Table 3. It is
estimated that in the Ontario sawmill industry, 1.53
million tonnes of wood residues are produced, of which
1.08 million tonnes are already used, and 0.45 million
tonnes are still unused.31 Assuming that these residues
consist of 50% bark and 50% sawdust, then it is estimated
that 0.76 million tonnes of sawdust are produced. This
corresponds with a practical resource of 13.7 PJ of
sawdust, of which 70% is used and 30% is projected to
be unused. The sawdust that is currently utilized is for
heat generation applications and is burnt directly or
manufactured into wood pellets for commercial sale in
Ontario. There are also is significant volumes of wood
residues used in the wood processing industry. Shavings
are also widely used as bedding in the livestock and
poultry industry. The used and unused sawdust are
considered part of the practical resource.
W O O D F U E L F O R R E S I D E N T I A L U S E
NRCan indicates that in 2001 in Ontario, 16.7 PJ of wood
was used in the residential sector.32 Most of this fuel is
cut in forests but some is also slabwood from the forest
products industry. It should be regarded as part of the
practical resource. There could be some potential for
increased use of wood fuel from forest thinnings in the
future if energy prices and wood prices rise to help
support the high labour cost of this activity.
T O TA L F R O M T H E F O R E S T S E C TO R
The total practical energy potential from the forestry
sector is identified as 142 PJ annually (see Table 3). It is
estimated that 20 PJ of this is new incremental energy
from the forest sector that is not currently developed,
mainly consisting of bark.
3 . 4 A G R I C U LT U R EThe agriculture industry offers major potential for
expansion of the bioenergy industry in Ontario. Unlike
the forest industry, only limited amounts of biomass have
to date been developed. Four types of biomass can be
produced from agriculture: grains and oilseeds, energy
crops, agricultural residues, and livestock manure. This
section will discuss these various biomass options and
the overall opportunity to best collect and store solar
radiation using crops on Ontario farmland.
TABLE 3
Practical resource from the forestry sector33
Resource PJ
Bark 29Spent liquor and wood waste 83Sawdust 13.7Wood fuels for residential use 16.7Total 142
The use of annual grains and oilseeds for energy has
been widely encouraged by commodity groups in Canada
as a means to strengthen demand for these commodities
and improve prices. In terms of a system to capture and
store solar radiation with energy crop farming, Figure 3
compares the relative efficiencies of present-day Ontario
field crops with a bioenergy crop planted for energy. The
net energy gain is determined by comparing the total
energy production (yield x energy content) and
subtracting the energy inputs required for crop
production. From Figure 3 it can be seen that there is a
fundamental advantage to the use of perennial grasses
like switchgrass as energy crops. When densified through
pressing and used in modern biofuel combustion
appliances, switchgrass pellets can be used as the same
energy end-use efficiencies as modern heating oil and
natural gas heating appliances. From a fossil fuel
displacement and greenhouse gas mitigation standpoint,
perennial energy crops represent Ontario’s best land-use
strategy for developing a major biofuel industry.
E N E R G Y C R O P FA R M I N G
There are 3.6 million ha of Ontario farmland managed
for crops and forage production (Table 4). Approximately
one-third of Ontario’s farmland is in forage crop
production for the ruminant livestock industry. It may
be economically advantageous for several reasons for
Ontario farmers currently involved in the ruminant
livestock industry to diversify a significant portion of their
forage lands into the production of perennial grasses
(such as switchgrass or reed canary grass) for energy
production. It would let Ontario farmers take advantage

○ ○ ○ ○ ○ ○ ○ ○ ○ ○ ○ ○ ○ ○ ○ ○ ○ ○ ○ ○ ○ ○ ○ ○ ○ ○ ○ ○ ○ ○ ○ ○ ○ ○ ○ ○ ○ ○ ○ ○ ○ ○ ○ ○ ○ ○ ○ ○ ○ ○ ○ ○ ○ ○ ○ ○ ○ ○ ○ ○
SMART GENERATION: POWERING ONTARIO WITH RENEWABLE ENERGY5 4
of the increasing value of biomass in the province.
Biomass in Ontario is increasingly scarce as greenhouse
operators and other large heat energy users switch away
from natural gas and other heating systems. Consumers
in Ontario face higher energy costs for natural gas and
electricity than provinces in Western Canada and
consequently can pay higher prices for biomass fuels.
While densified biomass can be transported by rail, it is
likely that local production of biomass in Ontario can
compete with the costs of importing densified fuels into
the province from Western Canada.
With Ontario having 620,000 ha available for biofuel
production and assuming a 9 tonne per hectare yield, a
total of 5.58 million tonnes of biomass could be grown
annually in the province. Assuming this biomass contains
18.5 GJ/tonne, a total of 103 PJ of energy could be
produced. This would be approximately six times the
energy production potential of crop residues in the
province. This energy production base would result from
the conversion of approximately 1/6 of Ontario’s total
farmland into energy crops. The land base would consist
mainly of land currently dedicated to the beef industry
and to land under cultivation of grain crops, such as oats
and barley, in marginal areas that are bringing relatively
low profitability to Ontario farmers. Switchgrass and reed
canarygrass would be the main initial scale-up species
for southern and northern Ontario respectively. Research
in Quebec and in South Dakota has also identified prairie
cordgrass as a promising warm season grass bioenergy
crop that has higher yield potential than switchgrass and
is also better adapted to poorly drained soils and areas
with cooler nighttime temperatures.34 The main advantage
of using warm season or C4 grasses is that they convert
solar radiation 40% more efficiently than cool season
species and they use only half as much water for every
tonne of biomass produced. Other potential perennial
energy crop species in Ontario include the warm season
perennial grass species of big bluestem, indiangrass and
miscanthus, and short rotation forestry and windbreak
species including willow, poplar, black locust, alder and
indigo bush.
It will take time to establish a supporting infra-
structure and to develop experience in energy crop
production amongst farmers. As a rough estimate, it is
TABLE 4
Potential land base available in Ontario for biofuel production from grasses
Location Land use categories Total acreage Percentage converted Estimated biofuel(millions ha) to biofuels acreage (millions ha)
Ontario Annual crops 2.35 10% 0.23Hay 0.93 30% 0.28Seeded pasture 0.35 30% 0.11
Total 0.62
FIGURE 3 Solar Energy collection and fossil fuel energy require-ments of Ontario crops, in giga-joules (GJ) per hectare (forsources see Biomass Appendix)
0
50
100
150
200

○ ○ ○ ○ ○ ○ ○ ○ ○ ○ ○ ○ ○ ○ ○ ○ ○ ○ ○ ○ ○ ○ ○ ○ ○ ○ ○ ○ ○ ○ ○ ○ ○ ○ ○ ○ ○ ○ ○ ○ ○ ○ ○ ○ ○ ○ ○ ○ ○ ○ ○ ○ ○ ○ ○ ○ ○ ○ ○ ○
IV B IOMASS IN ONTARIO 5 5
assumed that 20% of the required land resource base
could be planted within four years, which corresponds
to 120,000 ha and 20 PJ of primary energy. After 10 years,
the total practical resource of 103 PJ could be achieved.
After 2015 there would be an annual expansion of 1–1.5%
in the resource base with the ongoing introduction
of improved energy crop cultivars and production
technologies.
A G R I C U LT U R A L R E S I D U E S
Cereal straws and corn stover are the major potential
biomass residues as sources for energy generation.35 The
theoretical, technical and practical resources from
agricultural residues in Ontario were calculated using a
study on available residues on the basis of crop statistics
and crop-to-residue ratios.36
Not included in this analysis is the potential for crop
residue generated from commodity milling. In Ontario,
oat hulls and fibres from corn milling can also be
considered a small but important additional crop energy
resource for utilization, as they are already concentrated
and available at an affordable price.
TABLE 5
Energy potential of selected field crop residues inOntario (PJ/year)a
Total Technical Practicalresource resource resource
(PJ) (PJ) (PJ)
Winter wheat 21 14 5Spring wheat 3 2 1Oats 1 1 0Barley 8 6 2Rye 1 1 0Mixed grains 5 4 1Grain corn 73 36 7Total 113 6 4 1 7
Notea Based on Table 6 and an average lower heating value of 18 GJ/tonne.
The total resource (113 PJ) shows the energy content
of all straw that is produced yearly from the relevant
agricultural field crops in Ontario (Table 5). It is
important to note that a part of these residues must be
left on the field to maintain soil quality. Sustainable
removal rates depend on many factors, including soil
type, slope of the land, soil fertility levels, crop rotation
systems, tillage, cutting height, crop yield, weather and
wind patterns. Using a removal rate of 60–75% for winter
wheat and 70–75% for other cereals, it is estimated that
64 PJ of energy is available. 37 The practical resource
(948,000 tonnes or 17 PJ) is estimated by taking into
account the alternative uses of the residues (e.g. animal
fodder, straw for livestock bedding, mushroom production
etc.), and the difficulty in harvesting corn stalks. In addi-
tion, the agricultural sector can provide significant amounts
of energy from spoiled, mouldy and low quality grains,
and from by-products of grain milling (especially corn
and oat milling). It is estimated that 275,000 tonnes of grains
and grain milling residues, which is 5% of the 5.5 million
tonnes of grains produced in Ontario, could be available
for bioenergy applications. Assuming this biomass has an
average energy content of 18 GJ/tonne, it would provide
an additional 5.0 PJ of energy annually to Ontario.
L I V E S TO C K M A N U R E
The yearly quantity of manure available in Ontario is
estimated by using data on animal stock and manure
production per animal. Table 7 shows the resulting energy
potentials that were estimated on the basis of calculations
on manure availability in Ontario as provided in Table 8.
The use of liquid manure sources as energy is desirable
from an environmental standpoint as this is the major
source of methane and odour emissions from Ontario
agriculture and a risk to water quality.
The total resource of 45.1 PJ is equivalent to the energy
content of the manure (Table 8). Wet manure of pigs and
cows is suitable for anaerobic digestion.38 The technical
resource of 18.7 PJ represents the energy that can be
gained with anaerobic digestion. Because biodigestion of
chicken and turkey manure is more complex, these
resources are not considered as part of the practical
potential. Poultry litter, commonly containing wood
shavings, can be converted to energy through direct
combustion for heat. However this energy conversion
pathway is not considered viable for Ontario because
from an environmental standpoint, combustion of
nutrient rich poultry manure in Ontario should be
avoided. Combustion of this material can be a significant
source of NOx pollution as it generally contains more
than 3% nitrogen. This manure is also a relatively rich
source of nitrogen and nutrients and can be used as an
organic source of nitrogen (N) to displace the use of
inorganic N fertilizer forms (such as urea or anhydrous
ammonia) in crop production. Most regions in Ontario
have a significant cash crop farming land base available for
recycling of manure from neighbouring poultry farms.
The availability factor in Table 7 shows how much ma-

○ ○ ○ ○ ○ ○ ○ ○ ○ ○ ○ ○ ○ ○ ○ ○ ○ ○ ○ ○ ○ ○ ○ ○ ○ ○ ○ ○ ○ ○ ○ ○ ○ ○ ○ ○ ○ ○ ○ ○ ○ ○ ○ ○ ○ ○ ○ ○ ○ ○ ○ ○ ○ ○ ○ ○ ○ ○ ○ ○
SMART GENERATION: POWERING ONTARIO WITH RENEWABLE ENERGY5 6
nure is released centrally that can be collected and used in
an efficient way. The resulting practical resource is 4.9 PJ.
3 . 5 W A S T E B I O M A S S R E S O U R C E SF R O M U R B A N A R E A S
There are five major types of biomass in the waste sector
that are predominantly from urban areas and which can
be utilized for energy: waste wood, food residues,
biodegradable municipal residues, landfill gas and sewage.
These will be discussed in the section below.
F O O D I N D U S T RY
In the food industry, considerable quantities of organic
materials are produced from a great variety of processes.
In the agri-food industry, many vegetable residues are
currently valued as animal fodder. Slaughterhouse waste
is another potential source of energy. However, public
perception is generally negative towards the utilization
of such residues. Used frying oil is a vegetable product,
which is less problematic from the view of public
perception. It forms a source of energy that can be utilized
for heat and electricity generation or processed further
into biodiesel (methylesters). A recent study estimated that
in Ontario, 70 million litres of yellow grease is produced
corresponding to an energy potential of 2.3␣ PJ (Table 9).39
Identifying all relevant residues is beyond the scope
of the present study; however, it is anticipated that the
theoretical and practical resources may exceed 50 and
10 PJ, respectively. The practical resource is currently
estimated by the used frying oil, which has an energy value
of 2.3 PJ.
W A S T E WO O D
Waste wood consists of construction and demolition
wood and forms a popular feedstock for biomass power
plants. Emission controls are very important because
TABLE 6
Calculation of the availability of agricultural residue in Ontario in 2001
Share oftechnical
Residue to Share of resourceProduct crop ratioc Total theoretical potential Technicale practical Practical
Area a yieldb (for theoretical resourced available for resource available for resourcef
(x1000 ha) (tonnes/ha) potential) (ktonnes) technical resource (ktonnes) potential (ktonnes )
Winter wheat 218.5 4.1 1.3 1165 0.68 792 0.35 277Spring wheat 46.5 2.9 1.3 175 0.72 126 0.35 44Oats 28.3 2.1 1.3 77 0.72 56 0.35 19Barley 109.3 3.2 1.3 455 0.72 327 0.35 115Rye 24.3 2.2 1.3 69 0.72 50 0.35 18Mixed grains 68.8 3.1 1.3 277 0.72 200 0.35 70Buckwheat 1.6 1.7 1.3 4 0.72 3 0.35 1Grain corn 777 5.2 1 4040 0.5 2020 0.2 404Total (ktonnes) 6263 3574 948Notea Derived from various information sources stated in Helwig et al. (2002), Agricultural biomass residue inventories and conversion systems for energy production in eastern
Canada. 2002, Resource Efficient Agricultural Production (REAP): Ste. Anne de Bellevue, Quebec.b Data related to 2001.c Average yield 1997–2001.d The total resource equal to the total quantity of residues that is released.e The technical resource takes into account ecological sustainability; for instance a quarter of the cereal straw has to be left on the field.f In order to estimate the practical resource, the share of straw that is needed for animal fodder and other purposes is deducted from the technical resource.
TABLE 7
Energy potential of livestock manure in Ontario (PJ/year)
Total Technical Practicalresource a resource b Availability resource
Manure (PJ/year) (PJ/year) factorc (PJ/year)
Pigs 11.9 5.9 50% 3.0Dairy cows 14.3 5.5 12.5% 0.7Beef cows 5.9 2.3 25% 0.6Calves, steers 6.6 2.5 25% 0.6and heifersChicken (Layer) 2.3 0.9 0% 0.0Chicken (Broiler) 2.8 1.1 0% 0.0Turkeys 1.4 0.5 0% 0.0Total 45.1 18.7 4.9
Notea The total resource shows the energy that is contained in the manure, assuming a
higher heating value of 14 GJ/tonne, and an ash content of 30%.b The technical resource shows the energy that can be extracted from the manure,
making use of the assumed conversion routes as indicated in the last column. It iscalculated that pig manure digestion results in 6.98 GJ/tonne dry manure, cattledigestion in 5.34 GJ/tonne. For the others also 5.34 GJ/tonne were assumed.
c It is assumed that only manure that is released in stables can be collected forenergy use. The shown availability factors are first estimates based upon existingexperience with manure digestion. It would require detailed research beyond thescope of this study to verify these factors.
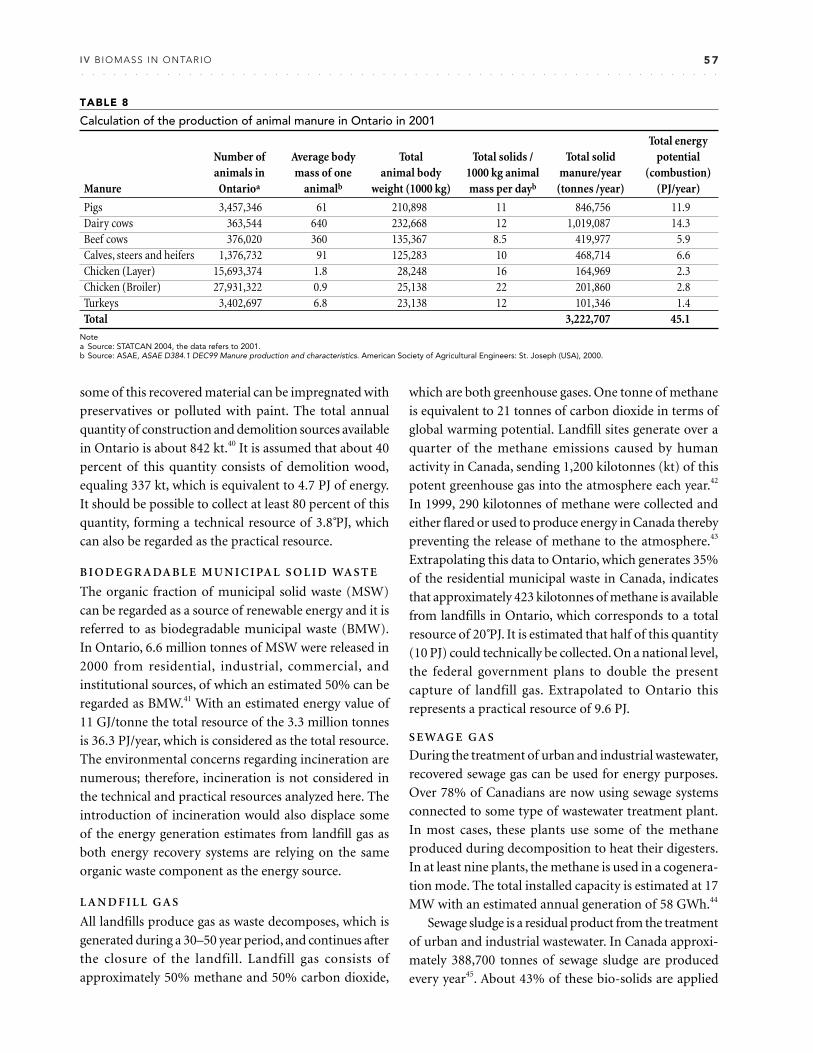
○ ○ ○ ○ ○ ○ ○ ○ ○ ○ ○ ○ ○ ○ ○ ○ ○ ○ ○ ○ ○ ○ ○ ○ ○ ○ ○ ○ ○ ○ ○ ○ ○ ○ ○ ○ ○ ○ ○ ○ ○ ○ ○ ○ ○ ○ ○ ○ ○ ○ ○ ○ ○ ○ ○ ○ ○ ○ ○ ○
IV B IOMASS IN ONTARIO 5 7
some of this recovered material can be impregnated with
preservatives or polluted with paint. The total annual
quantity of construction and demolition sources available
in Ontario is about 842 kt.40 It is assumed that about 40
percent of this quantity consists of demolition wood,
equaling 337 kt, which is equivalent to 4.7 PJ of energy.
It should be possible to collect at least 80 percent of this
quantity, forming a technical resource of 3.8␣ PJ, which
can also be regarded as the practical resource.
B I O D E G R A DA B L E M U N I C I PA L S O L I D WA S T E
The organic fraction of municipal solid waste (MSW)
can be regarded as a source of renewable energy and it is
referred to as biodegradable municipal waste (BMW).
In Ontario, 6.6 million tonnes of MSW were released in
2000 from residential, industrial, commercial, and
institutional sources, of which an estimated 50% can be
regarded as BMW.41 With an estimated energy value of
11 GJ/tonne the total resource of the 3.3 million tonnes
is 36.3 PJ/year, which is considered as the total resource.
The environmental concerns regarding incineration are
numerous; therefore, incineration is not considered in
the technical and practical resources analyzed here. The
introduction of incineration would also displace some
of the energy generation estimates from landfill gas as
both energy recovery systems are relying on the same
organic waste component as the energy source.
L A N D F I L L G A S
All landfills produce gas as waste decomposes, which is
generated during a 30–50 year period, and continues after
the closure of the landfill. Landfill gas consists of
approximately 50% methane and 50% carbon dioxide,
which are both greenhouse gases. One tonne of methane
is equivalent to 21 tonnes of carbon dioxide in terms of
global warming potential. Landfill sites generate over a
quarter of the methane emissions caused by human
activity in Canada, sending 1,200 kilotonnes (kt) of this
potent greenhouse gas into the atmosphere each year.42
In 1999, 290 kilotonnes of methane were collected and
either flared or used to produce energy in Canada thereby
preventing the release of methane to the atmosphere.43
Extrapolating this data to Ontario, which generates 35%
of the residential municipal waste in Canada, indicates
that approximately 423 kilotonnes of methane is available
from landfills in Ontario, which corresponds to a total
resource of 20␣ PJ. It is estimated that half of this quantity
(10 PJ) could technically be collected. On a national level,
the federal government plans to double the present
capture of landfill gas. Extrapolated to Ontario this
represents a practical resource of 9.6 PJ.
S E WAG E G A S
During the treatment of urban and industrial wastewater,
recovered sewage gas can be used for energy purposes.
Over 78% of Canadians are now using sewage systems
connected to some type of wastewater treatment plant.
In most cases, these plants use some of the methane
produced during decomposition to heat their digesters.
In at least nine plants, the methane is used in a cogenera-
tion mode. The total installed capacity is estimated at 17
MW with an estimated annual generation of 58 GWh.44
Sewage sludge is a residual product from the treatment
of urban and industrial wastewater. In Canada approxi-
mately 388,700 tonnes of sewage sludge are produced
every year45. About 43% of these bio-solids are applied
TABLE 8
Calculation of the production of animal manure in Ontario in 2001
Total energyNumber of Average body Total Total solids / Total solid potentialanimals in mass of one animal body 1000 kg animal manure/year (combustion)
Manure Ontarioa animalb weight (1000 kg) mass per dayb (tonnes /year) (PJ/year)
Pigs 3,457,346 61 210,898 11 846,756 11.9Dairy cows 363,544 640 232,668 12 1,019,087 14.3Beef cows 376,020 360 135,367 8.5 419,977 5.9Calves, steers and heifers 1,376,732 91 125,283 10 468,714 6.6Chicken (Layer) 15,693,374 1.8 28,248 16 164,969 2.3Chicken (Broiler) 27,931,322 0.9 25,138 22 201,860 2.8Turkeys 3,402,697 6.8 23,138 12 101,346 1.4Total 3,222,707 45.1
Notea Source: STATCAN 2004, the data refers to 2001.b Source: ASAE, ASAE D384.1 DEC99 Manure production and characteristics. American Society of Agricultural Engineers: St. Joseph (USA), 2000.

○ ○ ○ ○ ○ ○ ○ ○ ○ ○ ○ ○ ○ ○ ○ ○ ○ ○ ○ ○ ○ ○ ○ ○ ○ ○ ○ ○ ○ ○ ○ ○ ○ ○ ○ ○ ○ ○ ○ ○ ○ ○ ○ ○ ○ ○ ○ ○ ○ ○ ○ ○ ○ ○ ○ ○ ○ ○ ○ ○
SMART GENERATION: POWERING ONTARIO WITH RENEWABLE ENERGY5 8
to land, 47% are incinerated and 4% are sent to landfill.
Because of the high moisture content, combustion
generally takes place without net energy recovery.
No data was found on the potential energy captured
in sewage gas from wastewater treatment. However,
assuming 35% of Canada’s sewage sludge and gas are
released in Ontario, and assuming that one tonne of
sewage sludge indicates a quantity of 6␣ GJ of energy from
the sewage gas, the total resource of sewage gas is 0.8 PJ.
The technical and practical resources are estimated at 0.6
and 0.4 PJ, respectively.
4. Overview: the total, technical,and practical resources available
Table 9 summarizes the total, technical and practical
biomass resource in Ontario expressed in PJ (the total
resource is equal to 848.5 PJ of primary energy).
The total resource represents the total quantity of bio-
mass that is potentially available, not taking into account
environmental, technical and logistical considerations.
The technical potential, representing the quantity of
biomass that could be obtained in an environmentally-
sustainable way with the help of state-of-the-art
technologies, is estimated at 445 PJ of primary energy.
The practical potential does not take into account
financial constraints, such as low heat and electricity
prices, or high technology costs. However, it does take
into account avoiding conflicts with existing uses of
biomass. The practical potential of 288 PJ shows the
resource that could be practically realized within a
timeframe of 10 years. Of this resource, approximately
142 PJ would come from the forest sector while 130 PJ
would come from the agricultural sector and 16 PJ from
the waste recovery sector from urban areas. The estimates
of incremental bioenergy would be 20 PJ from the forest
sector, 130 PJ from the agricultural sector and 10 PJ from
the urban waste sector, for a total of 160 PJ.
5. Ontario’s achievable biomasscontribution
The contribution of biomass to the energy supply is
divided into a short-term and long-term component. The
long-term contribution is referred as the “achievable
contribution,” and the short-term contribution is referred
as the “estimated contribution”.
• The achievable contribution shows the amount of
bio-energy that can be generated within 10–20 years
with present and promising new technologies and
with substantial financial incentives using the
biomass types and volumes indicated as the
practical resource.
• The estimated contribution shows the amount of
bio-energy that can be generated within four years
with present technologies and with modest
financial incentives using the biomass types and
volumes indicated as the practical resource.
5 . 1 A C H I E VA B L E C O N T R I B U T I O N( 2 0 1 0 – 2 0 2 0 )
Table 10 shows the achievable contribution, utilizing the
practical resource with the most efficient technologies.
For power generation combined heat and power systems
are used as the preferred technology.
The achievable contribution consists of 14.7 TWh
(53 PJ) of electricity and 169 PJ of heat, in total 69.0 TWh
(222 PJ) of secondary energy. About 14.7 TWh of
TABLE 9
Overview of the resource availability of biomass inOntario (PJ, primary energy)
Supply Total Technical Practicalsector Type resource resource resource
Forestry Spent liquor 377 229 83a
and waste woodBark 29Fuel wood 16.7Sawdust 13.7Subtotal 142.4
Agriculture Energy crops 103 103 103Field crop residues 113 64 17Grains and grain 99 5.0 5.0milling residuesLivestock manure 45 19 4.8Subtotal 129.8
Organic waste Landfill gas 20 10 9.6Waste wood 4.7 4.7 3.8Residues from 50 10 2.3food industrySewage sludge 0.8 0.6 0.4Biodegradable 36 0 0municipal wasteSubtotal 16.1
Total 848.5 445.3 288.3Note:a This resource estimate from NRCan appears somewhat high given the energy
content of black liquor. It may include imported wood, recycled paper, and apossible double counting of some of the bark and sawdust component indicatedunder the forestry sector. This figure requires further analysis.

○ ○ ○ ○ ○ ○ ○ ○ ○ ○ ○ ○ ○ ○ ○ ○ ○ ○ ○ ○ ○ ○ ○ ○ ○ ○ ○ ○ ○ ○ ○ ○ ○ ○ ○ ○ ○ ○ ○ ○ ○ ○ ○ ○ ○ ○ ○ ○ ○ ○ ○ ○ ○ ○ ○ ○ ○ ○ ○ ○
IV B IOMASS IN ONTARIO 5 9
electricity can be generated, which corresponds with a
generating capacity equivalent to 2,450 MW. In this
scenario, 47.0 TWh (169 PJ) of heat is also produced,
part of which could displace large amounts of grid power
by substituting for electrical heating in residential
applications. About 288 PJ of biomass is utilized. It
corresponds roughly with 16.1 million tonnes of biomass
per year. This resource can be obtained and utilized in a
sustainable way, but care should be taken to meet all
conditions of environmentally-sound production.
5 . 2 E S T I M AT E D C O N T R I B U T I O N ( 2 0 0 7 )The estimated contribution takes into account present
use of bio-energy, market conditions and financial/
economic factors, and could be realized in 2007. The
following assumptions have been made:
• The present use of waste wood and black liquor is
estimated at 83 PJ. Note that the black liquor is
combusted not only for heat production, but
primarily for recovery of chemicals dissolved in
the liquor. Therefore, it is not known whether in
the present situation all heat produced in this sector
is used efficiently, or partly wasted. However, for the
determination of the estimated contribution it is
assumed that 15% CHP and 85% heat generation
is applied, and that all resulting heat and electricity
can be used in the process.
• CHP is a relatively expensive application. It is
assumed that 85% of the bark is combusted for heat
production and that 15% is used for CHP.
• 16.7 PJ of wood fuels is presently used in households.
It is expected that this situation will not change.
• Sawdust is sold on the Ontario market for heat
production and burned as sawdust or wood pellets.
• About 50% of the available straw type agricultural
residues are used for heat generation, replacing
electricity, heating oil and propane. Collection and
pre-treatment systems have to be implemented,
which will take time.
• About 10% of the potential for energy crops is
developed mainly for domestic heat production,
replacing mainly electricity, heating oil, propane
and natural gas. It is assumed that production is
low in the initial years, as some time is needed for
establishment of energy crops and to introduce
densification and combustion equipment.
• 20% of the practical resource of manure is utilized
for CHP production, assuming that the relatively
TABLE 10
Overview of achievable contribution of biomass in Ontario (PJ)
Practical resource Utilization Used biomass Power HeatSupply sector Type PJ prim % PJ prim Application PJsec PJfuel
Forestry Bark 29 50% 14.5 H 12.350% 14.5 CHPa 4.4 6.5
Spent liquor and 83 100% 83 CHP 24.9 37.4waste woodSawdust 13.7 100% 13.7 Hb (wood pellets) 11.6Fuel wood 16.7 100% 16.7 H 14.2
Agriculture Agricultural residues 17 50% 8.5 H 7.250% 8.5 CHP 2.6 3.8
Energy crops 103 50% 51.5 H 43.850% 51.5 CHP 15.5 23.2
Grains and Milling 5.0 100% 5.0 H 4.3residuesLivestock Manure 4.8 100% 4.8 CHP (anaerobic digestion)c 1.4 2.2
Organic waste Residues from food 2.3 100% 2.3 CHP 0.7 1.0industryWaste wood 3.8 100% 3.8 CHP 1.1 1.7Landfill gas 9.6 100% 9.6 P 2.4Sewage sludge 0.4 100% 0.4 CHP (anaerobic digestion)c 0.1 0.2
Total 288.3 288.3 53.0 169.4Total – TWh 14.7
Notea CHP with an anticipated net electric and thermal efficiency of 30 and 45%, respectively.b Heat applications have an assumed thermal efficiency of 85%, indicating an optimal match with the heat demand.c Anaerobic digestion has an assumed net electric and thermal efficiency of 20 and 30%, respectively.

○ ○ ○ ○ ○ ○ ○ ○ ○ ○ ○ ○ ○ ○ ○ ○ ○ ○ ○ ○ ○ ○ ○ ○ ○ ○ ○ ○ ○ ○ ○ ○ ○ ○ ○ ○ ○ ○ ○ ○ ○ ○ ○ ○ ○ ○ ○ ○ ○ ○ ○ ○ ○ ○ ○ ○ ○ ○ ○ ○
SMART GENERATION: POWERING ONTARIO WITH RENEWABLE ENERGY6 0
expensive technology is applied at the most suitable
sites (i.e. those with a high heat demand and
abundant manure supply).
• Used frying oil (food industry) can be co-
combusted in natural gas heated power plants.
• Waste wood can be combusted for CHP pro-
duction. The costs of the plant could be financed
from fees for waste disposal; it is also assumed that
highly efficient environmental control technology is
applied to meet strict emissions limits.
• Presently, landfill gas is partly utilized, and the low
electricity generating costs of 0.04 $/kWh suggest
that it is financially feasible to utilize the potential
of 9.6 PJ primary energy optimally.
• Biodegradable municipal waste is only used for
landfill gas production.
The estimated contribution is presented in Table 11
and indicates that about 2.5 TWh (9.1 PJ) of electricity
can be achieved, which corresponds with a generating
capacity of 426 MW.
More electricity generating capacity can be installed
if a financial incentive of 4 cents per kWh is available to
make large biomass CHP production financially feasible.
In total, 113.7 PJ of heat is generated, of which 74 PJ
(65%) with black liquor, wood waste and bark to be used
as process heat, and 40 PJ (35%) with other biomass
(wood fuels and pellets from sawdust, agricultural
residues and energy crops) to be used for heating in the
residential and commercial sectors (see Ontario Energy
Appendix for a description of these sectors).
With the 40 PJ of non-process heat, a major reduction
in the use of electricity heating oil and propane could be
achieved given the favourable economics of biomass heat
substitution for these commodities at current prices.
5 . 3 GROWTH QUICKENS IN NEW MARKETSAs sales of biomass systems, such as pellet stoves and
boilers increase, reductions in prices can be achieved
through economies of production. Other biomass systems
can achieve faster market penetration rates if stable invest-
ment support mechanisms are provided in conjunction
with clear guidelines for systems performance (to
decrease the complexity of permitting processes).
TABLE 11
Overview of estimated contribution of biomass in Ontario (PJ)
Practical resource Utilization Used biomass Power HeatSupply sector Type PJ prim % PJ prim Application PJsec PJfuel
Forestry Bark 29 50% 14.5 H 12.3Forestry Bark 29 85% 24.7 H 17.3
15% 4.4 CHPa 1.3 2.0Spent liquor and 83 85% 70.6 H 49.4waste wood
15% 12.5 CHP 3.8 5.6Sawdust 13.7 100% 13.7 Hb (wood pellets) 9.6Fuel wood 16.7 100% 16.7 H 11.7
Agriculture Agricultural residues 17 50% 8.5 H 6.0Energy crops 103 10% 10.3 H 7.2Grains and Milling 5.0 100% 5.0 H 3.5residuesLivestock Manure 4.8 20% 1.0 CHP (anaerobic digestion) 0.3 0.4
Organic waste Residues from food 2.3 70% 1.6 P (co-combus-tion)c 0.6industryWaste wood 3.8 50% 1.9 CHP 0.6 0.9Landfill gas 9.6 100% 9.6 P 2.4Sewage sludge 0.4 100% 0.4 CHP (anaerobic digestion) 0.1 0.2
Total 288.3 180.9 9.1 113.7Total – TWh 2.5
Note.a CHP with an anticipated net electric and thermal efficiency of 30 and 45%, respectively.b Heat applications have an assumed thermal efficiency of 70%.c Co-combustion of used frying oil is possible in a natural gas or oil fired electricity plant with an estimated efficiency of 40%.

○ ○ ○ ○ ○ ○ ○ ○ ○ ○ ○ ○ ○ ○ ○ ○ ○ ○ ○ ○ ○ ○ ○ ○ ○ ○ ○ ○ ○ ○ ○ ○ ○ ○ ○ ○ ○ ○ ○ ○ ○ ○ ○ ○ ○ ○ ○ ○ ○ ○ ○ ○ ○ ○ ○ ○ ○ ○ ○ ○
IV B IOMASS IN ONTARIO 6 1
6. Policies, mechanisms, andincentives to enhancebiomass implementation
The implementation of biomass resources, as all other
renewable energy sources, requires stable investment
conditions. These conditions can be established through
renewable energy mechanisms, which can be specifically
tailored to increase market penetration of the most
promising biomass technologies. This strategy is currently
being used in Germany to support the development
of anaerobic digestion of farm manure. Through this
strategy, Germany has achieved the highest market
penetration of that technology in Europe, while other
European countries that have a similar resource base but
lack renewable energy mechanisms (e.g. United King-
dom) have not achieved positive results.46
Adoption rates for smaller biomass systems for heat
generation only (e.g. pellet stoves and boilers) will
increase if supporting mechanisms are facilitated. The
province should secure support from the federal
government to establish a revolving loan system to
provide low interest loans to enable home and business
owners currently relying on electric heat, oil, natural gas
and propane to purchase these new biomass appliances.
Provincial and federal cooperation in this area constitutes
a natural fit under common efforts to decrease green-
house gas emissions and sustainable cities agendas.
Through the use of renewable energy mechanisms and
a revolving loan system to support biomass heating
systems, Ontario can establish a stable biomass market
that will enable farmers and forestry operators to profit
from their residues, energy crops and biomass products.
Municipalities also need to provide leadership in helping
develop district-heating systems to support their forest
and agricultural resource-based communities.
The development of an integral biomass action plan
to address issues such as financial incentives, public
awareness, technology development, permits and
procedures is essential for accelerating the development
of biomass.
7. Conclusions, recommendationsand further research
Analysis of Ontario’s biomass potential shows that a total
capacity of 426␣ MW of biomass-generated electricity
could exist in Ontario by 2007 and 2,450 MW between
2010-2020. This capacity is higher than estimated in two
recent studies. The report Power to the Future estimates
that in 2020 the equivalent of 800 MW of biomass
capacity can be installed in Ontario.47 The report Tough
Choices estimates that new biomass energy could provide
the equivalent of an additional 1,700 MW of power.48
The difference in results can be explained by the fact
that in this study, the biomass resource was investigated
in more detail by covering several sectors that could
supply additional biomass. In this report, the agricultural
sector was identified as having the potential to create a
large new energy supply that could make a significant
contribution to Ontario’s energy supply.
Provincial biomass resources and contributions were
estimated with the best information presently available.
However, the province needs to develop a model that
incorporates economic effects of different resource-
technology combinations in detail to derive accurate
financial support instruments and detailed policy
development.
The province will also benefit from commissioning
follow-up studies to accurately estimate the quantities
of residues from the forestry sector and its related
industries, an area where not much information is
currently available in Ontario.
Finally, in the pulp and paper industry significant
amounts of biomass are currently used and it would be
quite useful to investigate whether the biomass is utilized
efficiently, and to determine if further optimization is
possible, for instance by the introduction of CHP-plants
for black liquor and bark.
Through follow-up studies, the province will achieve
a comprehensive scenario covering all relevant biomass
options and their pertinent caveats, which constitutes an
essential step to formulate sustainable transition paths.

○ ○ ○ ○ ○ ○ ○ ○ ○ ○ ○ ○ ○ ○ ○ ○ ○ ○ ○ ○ ○ ○ ○ ○ ○ ○ ○ ○ ○ ○ ○ ○ ○ ○ ○ ○ ○ ○ ○ ○ ○ ○ ○ ○ ○ ○ ○ ○ ○ ○ ○ ○ ○ ○ ○ ○ ○ ○ ○ ○
SMART GENERATION: POWERING ONTARIO WITH RENEWABLE ENERGY6 2
Q U E B E C C O M PA N Y T U R N S B I O M A S SI N T O E N E R G Y
A new form of renewable energy that turns fastgrowing grasses into a low-cost, environmentally-friendly means of heat energy is changing the ruralenergy market in Quebec.
Dell-Point Technologies of Blainville, Quebec, hasdesigned a biomass fuel in the form of pellets madefrom switchgrass. Dell-Point tested various agriculturalbiofuels for producing pellets. It found switchgrass tobe the most economical as it lowered processing costsby being easier to pellet and required minimal dryingcompared to wood. Pelleted switchgrass burns at thesame efficiency as oil in a high efficiency oil furnace.
The pellets are burned in stoves, much like a woodor gas stove. Most pellet stoves are vented through awall as compared to their wood counterpart. A hopperon the back of the stove can hold up to 60 pounds offuel, which is then automatically fed to the combustionchamber, according to how much heat is required.Pellet fuel is easier to load and store than wood andhas a much longer burning cycle. The pellet stovesare equipped with blowers that force hot air into theroom through a heat exchanger located on the frontof the stove.
The technology reduces space heating costs by50 percent or more. Switchgrass pellets are only halfthe cost of conventional fuels for farmers.

○ ○ ○ ○ ○ ○ ○ ○ ○ ○ ○ ○ ○ ○ ○ ○ ○ ○ ○ ○ ○ ○ ○ ○ ○ ○ ○ ○ ○ ○ ○ ○ ○ ○ ○ ○ ○ ○ ○ ○ ○ ○ ○ ○ ○ ○ ○ ○ ○ ○ ○ ○ ○ ○ ○ ○ ○ ○ ○ ○
IV B IOMASS IN ONTARIO 6 3
Biomass Appendix
Table 1 shows an estimate of the costs of landfill gas
utilization, and co-combustion which total 4.5 and 6
cents/kWh. The cost of the landfill gas is set at zero as it
is assumed that the owner of the landfill site receives a
waste disposal fee. Options such as CHP-combustion are
TABLE 1
Costs of electricity generation with biomass
Co-combustion Large CHP- Anaerobic digestionwith coal combustion Landfill gas (manure)
Capacity MWe 50 30 1 0.04Investment costs $/kWe 500 3,000 1,750 8,000Operational time hours/year 7,500 7,500 7,000 6,500Energy content GJ/ton 15 15 – –Fuel costs $/ton 90 90 0 0Fuel costs $/GJ 6 6 – –Electric efficiency % 40% 30% 25% 20.0%Thermal efficiency % 0% 45% 0% 30%Electricity production MWhe 375,000 225,000 7,000 260Saleable heat production GJ 0 1,215,000 0 1,404Lifetime on investment years 10 10 10 10Discount rate % 8% 8% 8% 8%Total investment $ 25,000,000 90,000,000 1,750,000 320,000Annual capital costs $ 3,725,737 13,412,654 260,802 47,689Annual O&M costs $ 260,802 938,886 26,080 4,769(7-10% of ann. capital costs)Biomass costs $ 20,250,000 16,200,000 0 0Total production costs $ 24,236,539 30,551,540 286,882 52,458Production costs electricity(excl. sale of heat) $/kWh 0.065 0.136 0.041 0.202Sales price heat $/GJ – 9 – 9Income from sold heat $ – 10,935,000 – 12,636Production costs electricity $/kWh 0.065 0.087 0.041 0.153(incl. sale of heat)
more expensive (11 cents/kWh). Because anaerobic
digestion is generally applied at a relatively small scale its
cost is estimated at 17 cents/kWh which although makes
it a more expensive option, but one that can be more
easily implemented because of its small scale, the
availability of manure, and demand for heat at farm level.
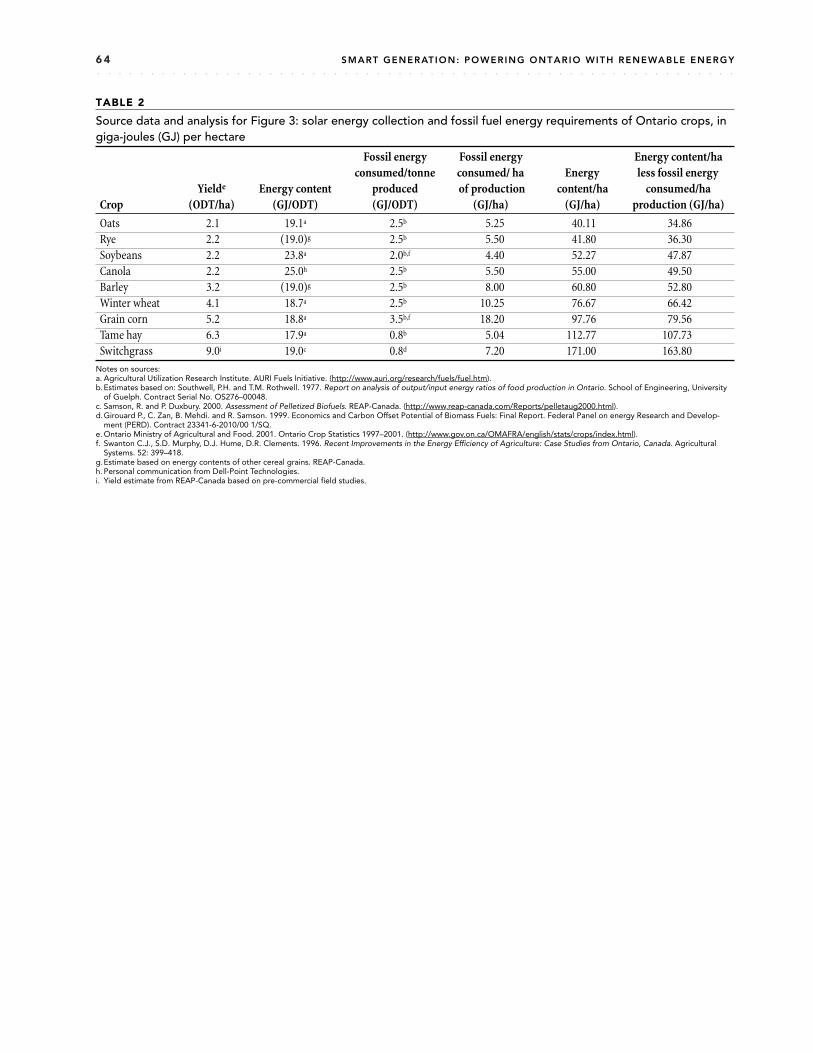
○ ○ ○ ○ ○ ○ ○ ○ ○ ○ ○ ○ ○ ○ ○ ○ ○ ○ ○ ○ ○ ○ ○ ○ ○ ○ ○ ○ ○ ○ ○ ○ ○ ○ ○ ○ ○ ○ ○ ○ ○ ○ ○ ○ ○ ○ ○ ○ ○ ○ ○ ○ ○ ○ ○ ○ ○ ○ ○ ○
SMART GENERATION: POWERING ONTARIO WITH RENEWABLE ENERGY6 4
TABLE 2
Source data and analysis for Figure 3: solar energy collection and fossil fuel energy requirements of Ontario crops, ingiga-joules (GJ) per hectare
Fossil energy Fossil energy Energy content/haconsumed/tonne consumed/ ha Energy less fossil energy
Yielde Energy content produced of production content/ha consumed/haCrop (ODT/ha) (GJ/ODT) (GJ/ODT) (GJ/ha) (GJ/ha) production (GJ/ha)
Oats 2.1 19.1a 2.5b 5.25 40.11 34.86Rye 2.2 (19.0)g 2.5b 5.50 41.80 36.30Soybeans 2.2 23.8a 2.0b,f 4.40 52.27 47.87Canola 2.2 25.0h 2.5b 5.50 55.00 49.50Barley 3.2 (19.0)g 2.5b 8.00 60.80 52.80Winter wheat 4.1 18.7a 2.5b 10.25 76.67 66.42Grain corn 5.2 18.8a 3.5b,f 18.20 97.76 79.56Tame hay 6.3 17.9a 0.8b 5.04 112.77 107.73Switchgrass 9.0i 19.0c 0.8d 7.20 171.00 163.80
Notes on sources:a. Agricultural Utilization Research Institute. AURI Fuels Initiative. (http://www.auri.org/research/fuels/fuel.htm).b.Estimates based on: Southwell, P.H. and T.M. Rothwell. 1977. Report on analysis of output/input energy ratios of food production in Ontario. School of Engineering, University
of Guelph. Contract Serial No. OS276–00048.c. Samson, R. and P. Duxbury. 2000. Assessment of Pelletized Biofuels. REAP-Canada. (http://www.reap-canada.com/Reports/pelletaug2000.html).d.Girouard P., C. Zan, B. Mehdi. and R. Samson. 1999. Economics and Carbon Offset Potential of Biomass Fuels: Final Report. Federal Panel on energy Research and Develop-
ment (PERD). Contract 23341-6-2010/00 1/SQ.e. Ontario Ministry of Agricultural and Food. 2001. Ontario Crop Statistics 1997–2001. (http://www.gov.on.ca/OMAFRA/english/stats/crops/index.html).f. Swanton C.J., S.D. Murphy, D.J. Hume, D.R. Clements. 1996. Recent Improvements in the Energy Efficiency of Agriculture: Case Studies from Ontario, Canada. Agricultural
Systems. 52: 399–418.g.Estimate based on energy contents of other cereal grains. REAP-Canada.h. Personal communication from Dell-Point Technologies.i. Yield estimate from REAP-Canada based on pre-commercial field studies.

○ ○ ○ ○ ○ ○ ○ ○ ○ ○ ○ ○ ○ ○ ○ ○ ○ ○ ○ ○ ○ ○ ○ ○ ○ ○ ○ ○ ○ ○ ○ ○ ○ ○ ○ ○ ○ ○ ○ ○ ○ ○ ○ ○ ○ ○ ○ ○ ○ ○ ○ ○ ○ ○ ○ ○ ○ ○ ○ ○
IV B IOMASS IN ONTARIO 6 5
B I O M A S S C H A P T E R N O T E S
1 Samson R., M. Drisdelle, L. Mulkins, C. Lapointe, and P.Duxbury. (2000a). The Use of Switchgrass Biofuel Pelletsas a Greenhouse Gas Offset Strategy. Bioenergy 2000.Buffalo, New York: bioenergy 2000. Available at: http:/www.reap-canada.com/Reports/bioenergy2000Aug2.html
2 All figures are for 2001 and are from Ericsson, K.,Huttunen, S., Nilsson, J. and Svenningsson, P. (2004).Bioenergy policy and market development in Finlandand Sweden. Energy Policy, 32 (15), 1707–1721.
3 Ibid.4 Sims, R., Richards, K. (2004). Bioenergy for the global
community. Renewable Energy World, 7 (1), 8–133.5 Jannasch, R., R. Samson, A. De Maio and T. Helwig.
(2001). Switchgrass Fuel Pellet Production in EasternOntario: A Market Study. REAP-Canada Final Reportto CANADAPT and the Agricultural AdaptationCouncil of Ontario. Ottawa: REAP-Canada.
6 Turkenburg et al. (2001). World Energy Assessment: Energyand the Challenge of Sustainability. New York: UNDP.
7 Jannasch et al. (2001) op.cit. note 5.8 Source: Natural Resources Canada, Office of Energy
Efficiency available online at: http://oee1.nrcan.gc.ca/Neud/dpa/trends_res_on.cfm
9 A series of case studies and backgrounders on the differ-ent types of biomass heating systems found in Ontarioand in other provinces are available on the NaturalResources Canada web site. They include reports on:
• Residential Wood heatinghttp://canren.gc.ca/prod_serv/index.asp?CaId=103&PgId=576
• Wood Chip Heating systems for farms and smallcommercial applicationshttp://www.canren.gc.ca/prod_serv/index.asp?CaId=130&PgId=729
http://www.canren.gc.ca/prod_serv/index.asp?CaId=162&PgId=860
http://www.canren.gc.ca/renew_ene/index.asp?CaId=47&PgId=738
• District heating systemshttp://canren.gc.ca/prod_serv/index.asp?CaId=184&PgId=1091
http://www.canren.gc.ca/renew_ene/index.asp?CaId=47&PgId=975
http://www.canren.gc.ca/renew_ene/index.asp?CaId=47&PgId=956
http://www.districtenergy.org/CHP_Case_Studies/University_of_Iowa.pdf
10 A cogeneration case study can be found at: http://www.canren.gc.ca/renew_ene/index.asp?CaId=47&PgId=1194
11 The first generation of BIGCC systems shows high unit
capital costs. Depending on the scale, prices are in therange of $4,000–7,000 per kW, but cost reductionpotential is considerable -capital costs might come downto $1,500–2,800 per kW.
12 Anaerobic digestion also takes place in the treatmentof urban and industrial waste waters. Sewage gas isrecovered as part of the process, which can be used forenergy purposes. Usually the recovered heat is used atthe treatment plants. More background informationcan be found at: http://www.canren.gc.ca/prod_serv/index.asp?CaId=170&PgId=970
13 Biogas production occurs naturally, amongst others inswamps and lakes when conditions are right. In a tankor container conditions can be created to optimize biogasproduction from manure and organic materials. Biogasproduction also takes place in landfills. The biogas isthen usually called landfill gas.
14 See page 126 of Tijmensen, M., van den Broek, R. (2004).Clean power from farm waste: international experienceswith anaerobic digestion of farm manure. RenewableEnergy World, 7 (2), 124–131.
15 Ibid.16 A NRCan case study on landfill gas can be found at:
http://www.canren.gc.ca/renew_ene/index.asp?CaId=47&PgId=1121
17 Tampier, M. (2002). Promoting Green Power in Canada,Green Power Policies: A Look Across Borders. Toronto:Pollution Probe. Available at www.pollutionprobe.org/Reports/greenpower.pdf
18 Von Hammerstein. (2004). Facing the future: what newpolicy will mean for wind in Germany. RenewableEnergy World, 7 (3), 88–97.
19 See Sims, R. (2003). Bioenergy to mitigate for climatechange and meet the needs of society, the economy andthe environment. Mitigation and Adaptation Strategiesfor Global Change, 8 (4), 349–370 and Sims and Richards(2004) op.cit note 4.
20 This chapter estimates that Ontario could generate 2,500GWh/year by 2007 and 14,700 GWh/year by 2020 frombiomass sources.
21 Agriculture and Agri-Food Canada’s February 2004Forecast – Farm Cash Receipts, Expenses and Incomefor 2002 and 2003 available at www.agr.gc.ca/spb/fiap-dpraa/publications/frcstprev/forcst03_e.php
22 The Walkerton Inquiry revealed that the key physicalsource of contamination behind the Walkerton tragedywas manure that had been spread on a farm near adrinking well; the manure was contaminated withE.coli bacteria and Campylobacter strains, whichunfortunately became the source of a deadly humanoutbreak of E.coli in the Town of Walkerton in 2000.O’Connor, D. (2002). Report of the Walkerton Inquiry.Toronto: Ontario Ministry of the Attorney General.
23 Lowe et al. (1996). Penner et al. (1997) provide estimatesto derive the total (woody) biomass resource from

○ ○ ○ ○ ○ ○ ○ ○ ○ ○ ○ ○ ○ ○ ○ ○ ○ ○ ○ ○ ○ ○ ○ ○ ○ ○ ○ ○ ○ ○ ○ ○ ○ ○ ○ ○ ○ ○ ○ ○ ○ ○ ○ ○ ○ ○ ○ ○ ○ ○ ○ ○ ○ ○ ○ ○ ○ ○ ○ ○
SMART GENERATION: POWERING ONTARIO WITH RENEWABLE ENERGY6 6
numbers of timber productive wood and distinguishtwo productivity classes of forest. Productivity class I isforestland incapable of producing a merchantable stand.Productivity class II is forestland capable of producing amerchantable stand within a reasonable length of time,and can be related to Canada’s Forest Inventory. See:Lowe, J.J., K. Power, and S.L. Gray, (1996). Canada’sForest Inventory 1991: the 1994 version. An addendum toCanada’s forest inventory 1991. CFS Information reportBC-X-362E. Victoria: Canadian Forest Service. Penner,M., et al. (1997). Canada’s Forest Biomass Resources:Deriving estimates from Canada’s Forest Inventory,Victoria: Pacific Forestry Centre.
24 Derived with help of average biomass density (87 t/ha) andtimber productive area (42.2 mln ha) as stated in Penneret al. (1997) and Lowe et al. (1996) op.cit. note 23.
25 Source: National forest database program http://www.nfdp.ccfm.org/
26 These factors are investigated in detail in Penner et al.(1997) op.cit note 23.
27 Courtesy of BTG28 For more details see www.fsc.org29 Other technologies like black liquor gasification are
described in Tam, P., et al., Forest sector table: assessmentof gasification technologies and prospects for their com-mercial application. 1999, Forest Sector Table NationalClimate Change Process: Richmond, B.C. Black liquorcan lead to emissions of dioxins and furans (dioxins areknown carcinogens). For more information see Uloth, V.van Heek, R. (2002). Dioxin and Furan Emission Factorsfor Combustion Operations in Pulp Mills, ReportPrepared for Environment Canada. PAPRICAN: PrinceGeorge, BC. Available at: www.ec.gc.ca/pdb/npri/2002guidance Emission_Factor_Report_for_Combustion_Ops_in_Pulp_Mills.pdf
30 Natural Resources Canada, Office of Energy Efficiency,Historical Databases – February 2003, retrieved May 2004from http://oee1.nrcan.gc.ca/Neud/dpa/comprehensive_tables/
31 Hatton, T. (1999). Canada’s Wood Residues, a profile ofcurrent surplus and regional concentrations. CanadianForest Service, Industry, Economics and ProgramsBranch. Available at www.nccp.ca/NCCP/pdf/Canada’s_Wood_Residues.pdf
32 Natural Resources Canada, Office of Energy Efficiency,Historical Databases – February 2003, retrieved May 2004from http://oee1.nrcan.gc.ca/Neud/dpa/comprehensive_tables/
33 Table derived using: Tam, P., et al. (1999). Forest sectortable: assessment of gasification technologies and prospectsfor their commercial application. Richmond: Forest SectorTable National Climate Change Process; National forestdatabase programme http://www.nfdp.ccfm.org; andNatural resources Canada, Office of Energy Efficiency,Historical Databases – February 2003, retrieved May 2004
from http://oee1.nrcan.gc.ca/Neud/dpa/comprehensive_tables/
34 Madakadze C, Coulman BE, McElroy AR, Stewart KAand Smith DL. (1998). Evaluation of selected warmseason grasses for biomass production in a short seasonarea. Bio Resource Technol, 65, 1–12. Arvid Boe, SouthDakota State University, personal communication.
35 Corn stover are the stalks and leaves and cobs of the cornplant.
36 Helwig, T., et al. (2002). Agricultural biomass residueinventories and conversion systems for energy production inEastern Canada. Ste. Anne de Bellevue, Quebec: ResourceEfficient Agricultural Production (REAP).
37 Ibid.38 Germany and Denmark have accumulated significant
experience with anaerobic digestion. Digested manurecan be used as fertilizer avoiding the loss of importantnutrients. Although the manure of chickens and turkeysis suitable for combustion and gasification using emissioncontrols (as it is done in the Netherlands and the UnitedKingdom), its incineration prevents its application as afertilizer.
39 Tampier, M., E. Bibeau, and P.A. Beauchemin. (2003).Identifying environmentally preferable uses for biomassresources, draft stage 1 report: identification of feedstock-to-product threads. North Vancouver, B.C: Envirochemservices Inc.
40 Source: Statistics Canada: Disposal of waste by source, byprovinces and territories available at: www.statcan.ca/english/Pgdb/envi25a.htm
41 Ibid.42 See Environment Canada’s online article: ‘Harnessing the
Power of Landfill Gas’. Available at http://www.ec.gc.ca/science/sandemay99/article1_e.html
43 Pneumaticos, S. (2003). Renewable Energy in Canada,Status Report 2002. Renewable Ottawa: NRCan. Availableat www2.nrcan.gc.ca/es/oerd/english/View.asp?x=700
44 Ibid.45 Tampier et al. (2003) op. cit. note 39.46 Although the U.K. has a comparable manure production
to Germany’s, it currently has only a few demonstrationplants (both countries have two of the largest manureproduction rates of western Europe); see Tijmensen andvan der Broek (2004) op.cit. Note 14.
47 This estimation is based on the following information:100 MWe of generating capacity could be providedthrough landfill gas recovery; between 200 and 500 MWeof capacity might be provided through the use ofmethane from anaerobic digestion of various wastestreams; and the remaining needed capacity could beprovided by combustion of agricultural and wood waste.
48 It is stated that biomass energy is generated primarilyfrom burning waste products such as landfill gas, woodchips from forestry operations and animal waste. Thenumber is not further justified.
GeneratingGenuine Wealth
67
5
Summary
Geothermal heat pumps are the most cost-effec-
tive option to provide space heating and cooling in Ontario.
The implementation of geothermal heat pumps is a
key strategy to displace electricity use and fossil fuels
currently used for heating and cooling in residential and
institutional/commercial buildings.
By displacing electricity use and fossil fuels, the
technology represents a very cost-effective greenhouse gas
mitigation strategy.
Geothermal heat pumps can be used across the
province and are especially attractive for new buildings.
Manitoba Hydro has become a Canadian leader in
deploying geothermal heat pumps, and provides an
exemplary implementation template for Ontario.
The province should use its procurement ability to
purchase geothermal heat pumps for provincial and
municipal buildings to facilitate a market transformation
in the institutional/commercial building sector.
The federal and provincial governments should
collaborate, as part of their climate change mitigation
efforts, to implement a revolving loan system to provide
access to interest-free loans for the purchase of
geothermal heat pumps.
1. Background
Geothermal heat pumps are one of the least-understood
renewable energy options in Ontario partly because the
technology (once installed) is out of sight, and partly
because the industry interchangeably uses for the same
concept a variety of terms: earth energy, GeoExchange,
and ground-source heat pump.
Geothermal heat pumps are the most energy-efficient,
cost-effective, and environmentally- friendly home
heating and cooling systems available.1 Heat pump
technology works by moving heat out of, or back into
the earth. Geothermal units are connected to the earth
through pipes buried under a lawn, landscaped area, or
even the building itself.
For this chapter, the term ‘geothermal heat pump’
(GHP) will be used to refer to ground-coupled heat
exchangers that extract the stored energy readily available
from the soil to meet all the needs for space heating,
cooling and water heating (potable, service or pre-heat)
of residential, institutional, commercial, and industrial
buildings in the province.2
Of the solar radiation that reaches the earth, NASA
estimates that more than half is absorbed into the near-
surface land and water. GHP taps into this heat source
below the frost line and ‘upgrades’ the temperature in a
compressor before it is delivered as hot air or hot water.
The secret to this technology is to collect small ‘packets’
of solar heat available from the soil, and to concentrate
this thermal energy for use within a building’s space.
This transfer of solar heat from the earth is achieved
through the use of ground loops that can be installed in
one of two basic configurations:3
• An ‘open loop’ that takes water from an aquifer, well
or lake directly to a compressor, which extracts two
to four degrees Celsius (oC ) of thermal heat (or
adds, in cooling mode) before the water is returned
to its source4;
• A ‘closed loop’ that circulates a diluted antifreeze
through a pipe to absorb heat from the surrounding
soil. The pipe is laid horizontally or, if the available
Geothermal HeatPumps

○ ○ ○ ○ ○ ○ ○ ○ ○ ○ ○ ○ ○ ○ ○ ○ ○ ○ ○ ○ ○ ○ ○ ○ ○ ○ ○ ○ ○ ○ ○ ○ ○ ○ ○ ○ ○ ○ ○ ○ ○ ○ ○ ○ ○ ○ ○ ○ ○ ○ ○ ○ ○ ○ ○ ○ ○ ○ ○ ○
SMART GENERATION: POWERING ONTARIO WITH RENEWABLE ENERGY68
footprint is small, a ‘coiled’ loop is used to increase
surface area for thermal transfer or, if land is very
limited, vertical boreholes are drilled to transfer
heat from deeper soil.
For cooling, the system is reversed, and heat from the
building is transferred into the antifreeze or water for
rejection into the outside ‘heat sink,’ in the same manner
as a refrigerator takes heat from food and transfers it into
a kitchen.
The amount of solar heat that is absorbed into the
earth can be calculated by solar incidence charts. The
ability of the soil to transfer this heat to the pipe (or its
ability to absorb heat in cooling mode) can be assessed
by a thermal conductivity analysis of the soil in which
the pipe is buried.
During winter, the temperature of the earth’s
subsurface is warmer than average ambient (outdoor) air
temperature, and cooler during summer. Below the frost
line (average depth of 1.2 m across most of southern
Ontario), the relatively constant temperature of the earth
is close to the long-term mean annual ambient tempera-
ture, i.e.: 4° to 12° C throughout the year. Space
conditioning systems in Toronto are designed to meet
temperatures of –17.1° C in winter and 28.8° C in
summer, and GHPs use this temperature differential to
provide heating and cooling.
GHPs require electricity to power three system
components: a circulating pump for the fluid in the loop;
a compressor to execute the heat exchange process; and a
distribution system for the hot air or radiant water.
Overall efficiency is determined by a coefficient of
performance (COP), which measures the amount of heat
energy delivered to the space, divided by the electricity
needed to operate the components. A COP of 3.0 means
that 3 kW of usable thermal heat energy is transferred
from the soil for every 1 kW of electricity consumed by
components, for a net energy ‘saving’ of 2 kW.5
A variation of GHP technology is called Direct
Expansion (DX), which uses copper pipe to circulate a
refrigerant, rather than a liquid antifreeze. DX technology
has a higher thermal transfer, but is a more expensive
option and creates environmental concerns because it
relies on a refrigerant buried in the earth.
The Canadian Standard Association accepted a stan-
dard in 2001 (CSA C4480), which regulates design and
installation of both residential and commercial systems.
This standard has a section on ‘underground thermal
energy storage’ to govern the use of caverns or aquifers
to enhance heat transfer by use of a storage source/sink.
GHP is a ‘distributed resource,’ as it relies on energy
that is sourced at or near the point of consumption. It does
not require a centralized distribution system (e.g. natural
gas pipeline) and its ability to reduce total power
consumption (compared with electric heating/cooling)
reduces transmission infrastructure and reduces grid
congestion.
1 . 1 C O S T S
The cost to install GHP systems is difficult to estimate
because each site is specific, but this section will assume
a residential ‘high-average’ total installed retail price of
$20,000 for a new 2,000 ft2 house in a Toronto or Ottawa
subdivision, in a system designed to meet 100% of heating
and cooling loads for space and domestic water.6 Of this
price, one-quarter ($5,000) is attributed to internal
components (heat exchanger, compressor, fans, pumps,
water desuperheater, etc) and the balance ($15,000) for
excavation and installation of the outside loop. The GHP
industry notes that installed prices can range from
$10,000 to $23,000, depending on the type of soil and
many other factors.7
In 1993, the Ontario Ministry of Environment and
Energy estimated that GHP with a COP of 2.7 in a
detached 2,000 ft2 home in Toronto would cost $6,000 to
$12,000 to install, and cost $790 a year for heating and
cooling, and another $160 for water heating. It estimates
the cost of heating with electric resistance would be
$1,820 plus $490 for water heating.8
Manitoba Hydro offers a GHP loan of $15,000 for
installed systems and estimates the cost of a new system
in a 2,000-ft2 home at $15,900 to $18,000, compared with
$6,700 for electric baseboards; in a retrofit, GHP would cost
FIGURE 1 Residential GHP system
○ ○ ○ ○ ○ ○ ○ ○ ○ ○ ○ ○ ○ ○ ○ ○ ○ ○ ○ ○ ○ ○ ○ ○ ○ ○ ○ ○ ○ ○ ○ ○ ○ ○ ○ ○ ○ ○ ○ ○ ○ ○ ○ ○ ○ ○ ○ ○ ○ ○ ○ ○ ○ ○ ○ ○ ○ ○ ○ ○
V GEOTHERMAL HEAT PUMPS 69
$11,400 to $16,500.9 Annual space heating costs would be
$400 compared with $1,001 for an electric furnace or electric
baseboards, and $1,253 for a conventional (60% efficiency)
gas furnace and $1,670 for a conventional oil furnace.10
The cost to install a GHP system in ICI facilities is
difficult to estimate because building and occupant load
profiles entail several distinct parameters. Analysis by
Marbek (1999) found a low of $35,800 for a curling rink to
a high of $756,336 for a seniors complex, both in Toronto.11
As far back as 1995, Natural Resources Canada
estimated that in a detached home in Toronto it would
cost $285 to $480 a year to operate an open loop GHP
and $295 to $525 for a closed loop system (heating only)
compared with $740 to $1,295 for an electric furnace.12
Using a 2004 cost comparison, Aquila Networks (now
Fortis BC) estimates that a new single-family detached
2,000 ft2 house in central British Columbia would require
20,000 kWh a year of heating/cooling, which would cost
$530 a year from a GHP system, $1,244 from electric base-
board and $1,100 from mid-efficiency (78%) natural gas.
Hot water would cost $142 with a GHP system, $293 with
electricity and $273 with natural gas (for four occupants).13
In his budget of April 2004, Manitoba’s Finance Mini-
ster said GHP could reduce heating costs by $400 to $800
a year compared with natural gas, and by $600 compared
with all electric heating.14 Manitoba Hydro supports the
technology because it reduces local electricity use and
therefore facilitates exports of electricity at high profit,
while gas ratepayers avoid costly extensions of infra-
structure into less-populated areas.
Manitoba Hydro has increased its marketing and
communications support for GHP, including provision
of attractive incentives and on-bill financing, and the
province has negotiated federal incentives.
The Manitoba geothermal industry last year achieved
a 40% growth rate. Manitoba is now first in Canada in
total installations of GHPs, representing 30% of total new
Canadian installations last year. GHP units are also being
installed widely in commercial buildings, arenas, schools
and other public buildings.
GHP is the least expensive source for thermal energy,
based on an index of competing heating fuels, according
to the Geo-Heat Center in Oregon.15 GHP would cost
$5.86 per million Btu of useful heating, compared with
$7.14 for natural gas, $9.06 for fuel oil, $9.54 for air-source
heat pump, $15.85 for propane and $20.51 for electric
resistance heat.
1 . 2 G H P D E V E L O P M E N TThe International Energy Agency’s Heat Pump Centre
estimates that there are 500,000 GHPs currently installed
around the world, with an estimated 45,000 new units
added each year.16 Its June 2004 newsletter reports on
2003 sales in three European countries:17
• The Swedish Heat Pump Association says that
48,806 heat pumps were installed (not including
25,000 air-to-air systems), of which GHP sales
increased 15% to a total of 31,586 units;
• Germany reports that the market for heating-only
heat pumps increased by 17% over 2002, with 9,745
space heating and 3,776 DHW systems sold;
• Sales in Norway were 55,000 units compared with
21,300 in 2002 and 6,300 in 2001, the majority of
which were air-to-air systems. The Ministry of
Petroleum & Energy provided a 20% subsidy for
heat pumps, which result in 17,000 GHP systems
in 2003.
GHP became popular in the United States because it
could provide an alternative cooling technology to electric
air conditioning. In a 1993 report, the Environmental
Protection Agency noted that GHP was the best choice
of five technology options for heating/cooling in all
locations because it offered the lowest annual operating
costs and lowest annualized costs, and was best for cutting
greenhouse gas emissions.18 That report led to the
investment of $50 million (US) by governments and
utilities (both private and public), and currently there
are at least 21 states with financial incentives for GHP
installations in the U.S.
The World Energy Council estimates that Canada had
an installed capacity equivalent to 377,600 kW of low-
temperature geothermal19 in 2001, but there is no data
available from the federal20 or Ontario21 governments for
either existing capacity or thermal output from GHP.
The Earth Energy Society of Canada estimates that
35,000 systems have been installed across Canada, of which
30,000 are residential and the balance are institutional/
commercial buildings. Its ‘best guess’ for Ontario’s
installations is 8,500 residential and 500 institutional/
commercial building systems.22
Under a residential installation program funded by
Ontario Hydro from 1990 to 1993, the Canadian Earth
Energy Association administered the installation of 6,749
residential units in areas not served by natural gas.23

○ ○ ○ ○ ○ ○ ○ ○ ○ ○ ○ ○ ○ ○ ○ ○ ○ ○ ○ ○ ○ ○ ○ ○ ○ ○ ○ ○ ○ ○ ○ ○ ○ ○ ○ ○ ○ ○ ○ ○ ○ ○ ○ ○ ○ ○ ○ ○ ○ ○ ○ ○ ○ ○ ○ ○ ○ ○ ○ ○
SMART GENERATION: POWERING ONTARIO WITH RENEWABLE ENERGY70
Currently, Fortis BC (formerly Aquila/West Kootenay
Power) offers a rebate for residential and institutional/
commercial building installations of GHP, and Manitoba
Hydro offers a low-interest financing program for
installations.
Some notable GHP facilities in Ontario include the
University of Ontario Institute of Technology (one of the
largest GHP installations on the continent); the new Parks
Canada centre in Hamilton (the first in North America
to use GHP with concrete piles); the Trustcan Realty office
in downtown Toronto (the building was constructed
above the boreholes to save land); Carleton University’s
aquifer thermal energy storage system; municipal water
treatment facilities in Sudbury; and the Shadow Ridge
subdivision near Ottawa that uses only GHP.
1 . 3 T E C H N I C A L C O N S I D E R AT I O N S
GHPs currently provide only space heating, space cooling
and water heating. Models are under development to
include refrigeration as part of the cycle. In addition to
heating and cooling buildings, some of GHP’s more
unusual applications include crop drying, ice rink
freezing, and road de-icing.
To assess the potential capacity for GHP in Ontario,
the RETScreen software was used to model two basic
building configurations.24 A basic model examined a
residence with 185 m2 (2,000 ft2) of floor space and GHP
with minimum efficiency installed in heavy damp soil
(representative of most of southern Ontario); and a
commercial building of 9,290 m2 (100,000 ft2) using
vertical boreholes on a low-efficiency unit in the same
soil. Details are provided in the GHP Appendix.
To assess the potential contribution under a more
mature market scenario, an advanced model increased
insulation levels and upgraded heat pump efficiency,
while the soil conductivity classification was increased
one level.
Compared with a ‘basic’ Toronto/Ottawa residence
that is heated and cooled by electricity, GHP can reduce
power consumption by 59%29, which increases to 73%
under an ‘advanced’ scenario30 and 80% when an ‘advanced’
GHP home is compared with a current ‘basic’ unit.31
GHP is classified as an ‘electric’ heating technology
because it requires electricity to power its components.
The above model assumes that GHP will displace
buildings with all electric heating and cooling, but it
TABLE 1
GHP residential energy savings (annual kWh for spaceheating & cooling)
Energy GHP GHPdemand25 consumption26 ‘saving’
Basic residenceToronto
– heating 15,900 6,900 9,000– cooling 13,600 5,000 8,600
Ottawa– heating 20,100 8,700 11,400– cooling 11,000 4,300 6,700
Annual average27 30,300 12,500 17,850Advanced residenceToronto
– heating 8,100 2,500 5,600– cooling 15,000 3,500 11,500
Ottawa– heating 10,400 3,100 7,300– cooling 12,300 3,100 9,200
Annual average 22,900 6,100 16,800NOTE: these data are for space heating and space cooling only, and do not reflectwater heating, which accounts for 21% of residential energy consumption in Ontario.28
GHP can provide 100% of domestic hot water load with a minor increase in run-time.
TABLE 2
Institutional / Commercial / Industrial (ICI) EnergySavings (annual kWh for space heating & cooling)
Energy GHP GHPdemand consumption ‘saving’
Basic ICIToronto
– heating 448,000 208,000 240,000– cooling 838,300 234,300 604,000
Ottawa– heating 515,200 232,800 282,400– cooling 685,200 194,700 500,500
Annual average 1,243,300 434,900 813,400Advanced ICIToronto
– heating 461,600 157,000 304,600– cooling 570,300 109,000 461,300
Ottawa– heating 567,700 185,200 382,500– cooling 464,700 88,900 375,800
Annual average 1,032,100 270,000 762,100
should be noted that annual demand for electricity will
increase if GHP is used to displace natural gas. However,
each ‘basic’ residence would avoid combustion of 1,685
m2 to 3,064 m2 of natural gas each year. 32

○ ○ ○ ○ ○ ○ ○ ○ ○ ○ ○ ○ ○ ○ ○ ○ ○ ○ ○ ○ ○ ○ ○ ○ ○ ○ ○ ○ ○ ○ ○ ○ ○ ○ ○ ○ ○ ○ ○ ○ ○ ○ ○ ○ ○ ○ ○ ○ ○ ○ ○ ○ ○ ○ ○ ○ ○ ○ ○ ○
V GEOTHERMAL HEAT PUMPS 71
1 . 4 B E N E F I T S O F G H P
E C O N O M I C B E N E F I T S
Geothermal energy is the cheapest option for space
heating and cooling.33 Operating and maintenance costs
in institutional/commercial buildings are lower than any
other space conditioning option.34 In the residential
sector, GHP can reduce space-conditioning costs
compared with conventional heating and cooling options,
and it can stabilize both conditioning costs and increase
security of supply. 35 Low-grade thermal heat is less
expensive per delivered energy unit than high-grade
electricity, and the technology can meet heating and
cooling demand with a more appropriate source of
energy. In addition, GHP can complement utility demand
curves and allow peak loads to be reduced by serving as a
base-load supply. By eliminating the need for natural gas
for space and water heating, fossil fuel reserves can be
diverted to applications with a higher commercial value
such as centralized electricity generation, production of
hydrogen or for the export market.
E N V I R O N M E N TA L
Compared with electric heating and cooling, GHP
can reduce greenhouse gas emissions by up to 75%
(depending on the fuel used for generation, when
displacing carbon-based fuels the reductions are at the
highest level).
D I S T R I B U T E D R E S O U R C E
By reducing the need for high-capacity transmission
towers and reducing congestion on the grid, geothermal
energy works well in non-urban areas that lack a physical
connection to a natural gas pipeline.
D E S I G N
GHP allows removal of roof-top chillers and boiling
towers on institutional/commercial buildings, thereby
reducing design constraints and allowing architects to
increase the aesthetic appeal of a building. Once installed,
both exterior and interior sections are invisible,
eliminating any opposition to the technology on the basis
of aesthetics.36 The use of decentralized heat pumps
minimizes the space required for a mechanical room and
increases the percentage of usable space in a building.
The technology is also well adapted for use in a ‘net zero
energy’ building (for more details about net zero energy
buildings see the solar power chapter).
D U R A B I L I T Y & S A F E T Y
Locating electro-mechanical components inside the
building will minimize degradation from exposure to
harsh weather conditions, while a buried loop experiences
minimal degradation. The absence of exposed equipment
reduces the risk of intentional or accidental damage, and
the lack of combustion eliminates the need for on-site
fuel storage and associated risk of explosion. The relatively
stable run times of GHP reduces start-up pressures and
other negative impacts on system life.
C O M F O R T
The CSA standard requires acoustic insulation to ensure
that there is virtually no noise from a system, and the
absence of setback thermostats avoids the need for
temperature reductions at night. The higher airflow of
low-temperature air increases occupant comfort by
reducing draughts, and GHP provides greater control
over interior humidity and eliminates concerns over
indoor air quality.
1 . 5 E M P L O Y M E N TCurrently, there are less than 15 companies in Canada
involved exclusively in GHP. The balance includes
HVAC (heating, ventilation, and air conditioning)
companies that offer the technology as an option to
conventional heating and cooling equipment. Of the 15,
five are manufacturers or distributors, three are design
firms and seven are installing contractor companies,
with a total employment of 35 people.37 Also, the
equivalent of 50 person-years exist among ‘part-time’
contractors.38
Under the three-year Ontario Hydro program that
resulted in the installation of 6,750 GHP units, the total
number of registered contractors during that period was
less than 300, of which half would have been involved on
a ‘full-time’ basis for the duration of the program. At peak,
it is estimated that each registered contractor had
assistance from four additional workers (drillers, backhoe
operators, etc).
Manitoba Hydro concludes that each 1,000 GHP
residential installations result in $15 million in
construction-related activity and over 150 jobs.39
Extrapolating these job creation figures to Ontario, where
125,000 GHP home systems could be installed, results in
18,750 jobs by 2007. By 2020, the installation of 341,000
GHP systems could result in up to 51,150 jobs.

○ ○ ○ ○ ○ ○ ○ ○ ○ ○ ○ ○ ○ ○ ○ ○ ○ ○ ○ ○ ○ ○ ○ ○ ○ ○ ○ ○ ○ ○ ○ ○ ○ ○ ○ ○ ○ ○ ○ ○ ○ ○ ○ ○ ○ ○ ○ ○ ○ ○ ○ ○ ○ ○ ○ ○ ○ ○ ○ ○
SMART GENERATION: POWERING ONTARIO WITH RENEWABLE ENERGY72
These estimates provide a good general indication of
the employment potential of this technology in Ontario.
It is emphasized that a follow-up study is required to
determine more precisely the economic co-benefits of
GHP for the province.
1 . 6 E C O N O M I C D E V E L O P M E N TThe majority of GHP cost is the labour to install the loop,
which maximizes the local benefits of each installation
(unlike natural gas where the bulk of the economic
activity is transferred outside of the province). In a
residential system, three-quarters of the total pre-tax price
is allocated to loop configuration, design, trenching,
fusing, purging, backfilling and permits (the polyethylene
pipe is the only ‘hard cost’), with the balance of cost for
all interior components (hardware, wiring, distribution,
etc). In institutional/commercial buildings the exterior
portion is approximately two-thirds of total cost, which
reflects the economies of scale on loop installation and
the higher relative number of heat pumps. These averages
exclude any retrofit work.
All labour is assumed to be local and, when combined
with up to one-third of equipment costs (distributor and
dealer markups, components manufactured in Canada,
etc), means that 80% to 85% of the total system cost is
classified as ‘local content’. The level would be higher for
domestically-manufactured heat pumps, which currently
comprise less than 10% of sales. Loop trenching requires
a backhoe operator (or a qualified well driller for vertical
loops), while a trained contractor can fuse the pipe.
Excluding design and supervision, only general skills are
required for a residential installation.
Under the above scenario, an average $20,000
residential system would contribute $16,000 to $17,000
to the local economy (excluding $3,000 in PST/GST). The
Ontario budget tabled in May 2004 announced the
intention to remove GHP from retail sales tax, to place it
on an equal footing with solar thermal systems, which
were exempted in 2003.
2. Ontario’s GHP resourceEighty percent of Ontario’s population lives in the urban
band along the Great Lakes, and almost half reside in the
Golden Horseshoe. According to Statistics Canada, the
province has one of the highest-growing populations in
Canada, and the number of households is forecast to grow
from 4.2 million in 1991 to 5.6 million by 2016.40
End use applications for thermal space heating, space
cooling and water heating constitute 52%, 21% and 3.4%
(respectively) of residential and 48.6%, 5.3% and 10.1%
of commercial energy consumption in Ontario.41 This
total of 720 PJ can be met by GHP (representing 38% of
the national total of 1,906 PJ consumed in the same end
use applications).42
The environmental impact in the residential sector
(excluding consumption of electricity) was 14.1
megatonnes of greenhouse gas emissions from space
heating and 4.4 MT from water heating in the residential
sector, 10.9 MT from space heating, 1.2 MT from water
heating, and 0.4 MT from space cooling in the institu-
tional/commercial buildings market.43
In Ontario in 2003, there were 85,180 residential
housing starts, of which 70,250 were in the top ten Census
Metropolitan Areas (CMA) and 14,900 elsewhere in the
province.44
There are few technical constraints to the adoption
of GHP in new buildings, either in the residential or
institutional/commercial buildings sector. It is a fully
‘dispatchable’ distributed resource that can provide
energy at any time of day, and performance can be
enhanced with thermal storage.45 The constraints in the
retrofit market relate to the need for renovations to
accommodate a loop or a distribution system.
The CSA standard stipulates separation distances
within loop designs to ensure that one pipe does not ‘steal’
heat from the collection area of a neighbouring pipe, and
it provides guidance to avoid septic tanks, utility line
setbacks, and other parameters to ensure proper design
and installation in residential or commercial sites.
While a GHP unit can be installed almost anywhere
in a building, it is not effective to install a loop under an
existing building or under existing infrastructure such
as roads. However, it is very practical to install loops prior
to construction of buildings or roads. Installation and
pumping costs, as well as thermal losses, become
significant when a loop is installed more than 250 m from
the load, with GHP systems designed to be as close as
possible to the load centre.
Due to difficulties in assessing conversion costs for
the existing stock of 4.4 million dwellings in Ontario, this
paper examines the impact of installing GHP only in new
construction, under the ‘advanced’ scenario. It will assume
an average of 75,000 new housing starts a year, of which
80% are located in metropolitan areas (i.e.: 60,000 a year

○ ○ ○ ○ ○ ○ ○ ○ ○ ○ ○ ○ ○ ○ ○ ○ ○ ○ ○ ○ ○ ○ ○ ○ ○ ○ ○ ○ ○ ○ ○ ○ ○ ○ ○ ○ ○ ○ ○ ○ ○ ○ ○ ○ ○ ○ ○ ○ ○ ○ ○ ○ ○ ○ ○ ○ ○ ○ ○ ○
V GEOTHERMAL HEAT PUMPS 73
in metropolitan and 15,000 in ‘rural’ areas).46 It also
assumes a total of 1% of existing stock will convert to GHP
over the same period, for a total of 44,000 ‘basic’ units.
Under this scenario, the impact of installing GHP in
10% of metropolitan units and 50% of rural units is
illustrated below:
TABLE 3
Residential Housing Starts (single-family detachedhomes only)
EnergyInstallations Consumption savings
per year (000 kWh/year) (000 kWh/year)
Metropolitan 6,000 36,600 100,800Rural 7,500 45,750 126,000Existing stock 44,000 550,000 787,600
NoteIt is assumed that most metropolitan homes are heated by natural gas but all arecooled through electric air conditioners; it is also assumed that GHP could satisfy 10%of that market. It is assumed that much of the rural homes are not on the gas line andare heated with electricity, oil or propane and that GHP could satisfy 50% of thatmarket. It is also assumed that as homes become more thermally efficient, heatingload drops, but air conditioning load continues to climb.
By 2010, 125,000 homes with GHP could be installed
in Ontario and their total electrical consumption for
space conditioning and water heating would be 1,044,100
MWh. However, these buildings would save the thermal
equivalent of 2,148,400 MWh each year (or 7.7 PJ). This
projection is for residential space conditioning only, and
does not reflect the reduction for domestic hot water or
the impact from large-scale institutional/commercial
building installations.
Using the same parameters, by 2020 Ontario could have
341,000 residences with GHPs, and their total consump-
tion of electricity for space conditioning load would be
2,361,700 MWh. However, these facilities would save the
thermal equivalent of 5,777,200 MWh a year (or 20.8 PJ).
Based on the estimate of 3,064 m2 of annual
consumption of natural gas, the displacement of gas
combustion in 2010 would be 383 million cubic metres
(m3) and more than 1 billion m3 by 2020.47
2 . 1 G R O W T H Q U I C K E N S I N N E WM A R K E T S
There are no empirical models to suggest how retail
installed prices would be affected by volume installations,
but the installation cost estimates provided by Manitoba
Hydro (which has the highest per-capita installation rate
in the country) indicates that a hypothetical total of
$20,000 could decline to $17,000 (15%) with increased
demand. Anecdotal comments from contractors estimate
that, if sales volume doubled, cost reductions could be:
– 20% for components (heat pump, transfer fluid,
pipe) due to volume purchase;
– 10% for design due to economies of scale and
increased speed;
– 25% for installation (horizontal or vertical) due to
economies of scale, reduced travel time, improved
rates from drillers, etc.
It is possible that average residential system costs could
drop by 20% to 25% under an increased volume scenario.
A comprehensive report that analyzed Canadian
installations included a sensitivity analysis to assess the
impact of rising natural gas and oil prices on the relative
cost of GHP, and found that the latter improves its price
advantage against conventional space conditioning
technologies.48
3. Mechanisms to encourage GHP
A number of broad-based fiscal, monetary and regulatory
measures are required to advance the understanding and
acceptance of GHP in Ontario, in both the residential
and institutional/commercial building sectors.
Among these, the province must work with federal
government officials to develop a method to quantify the
energy contribution from GHP in order to enhance its
perceived value to the marketplace. It must also request
an extension of the eligibility for Class 43.1 accelerated
capital cost allowance for GHP installations, and work
with federal agencies to facilitate a process under which
GHG emission reductions from GHP can be aggregated
into a trading pool for credit under the Kyoto Protocol.49
The impact of promoting a non-commercial energy
source was evident in 1999, when the U.S. Energy
Information Administration was estimating total
consumption of renewable energies in that country at
3.9 quadrillion (1015) British Thermal Units (Btu), mainly
from hydro, geothermal electric, wind, solar PV and
biomass at electric utilities. An analysis by the Canadian
Association for Renewable Energies noted that the data
did not include 2.6 quadrillion from GHP, wood stoves,
solar water heaters and off-grid wind turbines, solar
panels and small hydro facilities, and its intervention
prompted EIA to amend its reporting to increase the
contribution of renewables by two-thirds. 50 There is

○ ○ ○ ○ ○ ○ ○ ○ ○ ○ ○ ○ ○ ○ ○ ○ ○ ○ ○ ○ ○ ○ ○ ○ ○ ○ ○ ○ ○ ○ ○ ○ ○ ○ ○ ○ ○ ○ ○ ○ ○ ○ ○ ○ ○ ○ ○ ○ ○ ○ ○ ○ ○ ○ ○ ○ ○ ○ ○ ○
SMART GENERATION: POWERING ONTARIO WITH RENEWABLE ENERGY74
reason to believe that the energy contribution from other
renewable heat technologies (specifically GHP) also
suffers from significant under-estimation in Canada due
to its lack of market quantification.
The province must make every effort, in consultation
with the federal government and industry, to define the
parameters for GHP (and all renewable heat technolo-
gies) to provide a context within renewable energy supply
and demand.
It is critical for the province to compile data on the
past, present and future installed capacity for the
technology in various end use applications, so the
economic and environmental impacts can be quantified.
In addition, the province must undertake a ‘level playing
field’ assessment of policies pertaining to GHP, similar
to the 1992 study by Finance Canada that concluded there
was economic discrimination against green heat
technologies and which led to the creation of the federal
Renewable Energy Deployment Initiative (REDI) in an
effort to reduce that discrimination.51
GHP is used heavily in Europe for district heating and
cooling systems, in both residential and institutional/
commercial buildings. District energy is still a low priority
in Canada, but this promising niche should be developed.
A study of the barriers to understanding and
acceptance of green heat technologies in general, and
GHP in particular, must be undertaken to identify the
market niches where this viable technology is most
economically and environmentally beneficial.
In addition, any measures that would facilitate the
future consideration and adoption of GHP should be
considered (e.g. require that new building projects
conduct and file a soil conductivity analysis to identify
high-efficiency soils for future conversions, pre-install
ground loops in residential subdivisions to allow future
conversions).
The Ontario Building Code should also be amended
to require that new home construction accommodate
future installation of GHP, including adequate space for
oversized heating ducts, adequate location of new homes
to allow future installation of ground loops, and reliance
on CSA C448 for the design and installation of all systems.

○ ○ ○ ○ ○ ○ ○ ○ ○ ○ ○ ○ ○ ○ ○ ○ ○ ○ ○ ○ ○ ○ ○ ○ ○ ○ ○ ○ ○ ○ ○ ○ ○ ○ ○ ○ ○ ○ ○ ○ ○ ○ ○ ○ ○ ○ ○ ○ ○ ○ ○ ○ ○ ○ ○ ○ ○ ○ ○ ○
V GEOTHERMAL HEAT PUMPS 75
4. Recommendations
To achieve the many benefits that GHP development can
generate for the province the Government of Ontario
should:
i. Use its procurement ability to source 20% of the
space conditioning and water-heating load in all
facilities under its control from GHP by 2010, as
part of a green heat procurement program. This
level should rise to 50% by 2025 and is aimed at
effecting a market transformation in the
institutional/commercial building sector. In order
to achieve this level, it is expected that almost all
new public buildings would incorporate GHP
technology, combined with the highest penetration
possible for cost-effective retrofits when those
buildings need upgrading or refurbishment.
ii. Enact legislation to require that 20% of space
conditioning and water heating in all municipal
facilities come from GHP by 2010 and 50% by
2025. Municipal officials would identify the most
appropriate facilities assuming that new public
buildings would receive priority attention for
GHP installation.
iii. Direct the Ontario Energy Board to require all
distributors of space conditioning and water
heating fuels to source 10% of their sales within
Census Metropolitan Areas and 50% in all other
areas from GHP by 2010; 50% and 75%
respectively by 2025. Introduction of a ‘system
benefit charge’ on all thermal energy customers
could offset any first-cost premium.
iv. As part of Kyoto commitments to reduce
greenhouse gas emissions, collaborate with the
federal government to establish a revolving loan
system for the financing of ten-year interest-free
loans for the installation of GHP, both for interior
components and exterior loop, in both residential
and institutional/commercial buildings. This
measure is estimated at $1,000 per year (residential)
and should be covered by a special ‘green fund’
that provides a declining level of support and a
clear exit strategy.
v. Enact regulations to highlight GHP as the default
space conditioning technology in regions not served
by natural gas pipeline to minimize the need to
install distribution infrastructure for fossil fuels.
5. Conclusions
Every effort should be made to exploit GHP and other
renewable heat technologies on both economic and
environmental bases.
Without a high-level commitment from regulators
that GHP is a preferred option for space conditioning,
and without an assured minimal market, the technology
will continue to experience market disadvantages when
competing with subsidized conventional energy options.
Finally, the provincial government needs to help the
GHP industry complete existing plans for training,
accreditation and warranty coverage of GHP installations
in both residential and institutional/commercial
buildings sectors to ensure the sustainable development
of this promising renewable energy option.

○ ○ ○ ○ ○ ○ ○ ○ ○ ○ ○ ○ ○ ○ ○ ○ ○ ○ ○ ○ ○ ○ ○ ○ ○ ○ ○ ○ ○ ○ ○ ○ ○ ○ ○ ○ ○ ○ ○ ○ ○ ○ ○ ○ ○ ○ ○ ○ ○ ○ ○ ○ ○ ○ ○ ○ ○ ○ ○ ○
SMART GENERATION: POWERING ONTARIO WITH RENEWABLE ENERGY76
GHP Appendix
A) The need for space conditioning is determined by
Heating Degree Days (HDD) and Cooling Degree
Days (CDD) at any location, based on a balance
point of 18° and insulation levels of the building
and occupant factors.
– Toronto (43.7 N latitude) has 3,644 HDD and
346 CDD (Environment Canada 150-year
average). Design is –17.1° for heating and 28.8°for cooling.
– Ottawa (45.3 N) has 4,606 HDD and 242 CDD.
Design is –21.4° for heating and 27.6° for cooling.
B) Four scenarios:
1) 185 m2 (2,000 ft2) home in Toronto, medium
insulation, 2-storey, full basement, air
conditioning, minimal efficiency (2.8 COP)
heat pump, standard spacing of horizontal
loop configuration, heavy damp soil.
2) same home in Ottawa
3) 9,290 m2 (100,000 ft2) commercial building in
Toronto, medium insulation, five-storey,
standard windows, daytime occupancy,
moderate equipment and lights, minimal
efficiency heat pump, vertical boreholes,
standard loop configuration, heavy damp soil.
4) same building in Ottawa.
R E T S C R E E N O U T P U T:1) Toronto residence:
–Design heat load of 8.8 kW and 9.9 kW for cooling.
–GHP requires 255 m pipe in 128 m trench,
footprint of 311 m2.
–System consumes 6.9 MWh of electricity for
heating and 5.0 MWh for cooling loads, to allow
GHP to deliver 15.9 MWh and 13.6 MWh
equivalent heating/cooling.
2) Ottawa residence:
– Design heat load is 9.9 kW and 9.4 kW cooling.
– GHP requires 306 m pipe in 153 m trench,
footprint of 373 m2.
– System consumes 8.7 MWh heating and 20.1
MWh cooling, GHP delivers 4.3 MWh and 11.0
MWh.
3) Toronto commercial:
– Design heat load is 212.2 kW and 599.5 kW
cooling load.
– GHP requires 15,341 m borehole, footprint of
4,466 m2.
– System consumes 208.0 MWh heating and
234.3 MWh cooling, while GHP delivers 448.0
MWh and 838.3 MWh.
4) Ottawa commercial:
– Design heat load is 234.9 kW and 574.2 kW
cooling load.
– GHP requires 14,051 m borehole, footprint of
4,086 m2.
– System consumes 232.8 MWh heating and
194.7 MWh cooling, GHP delivers 515.2 MWh
and 695.2 MWh.
The following parameters were changed in the
RETScreen model:
• Residence: increase insulation levels to high from
medium, upgrade loops to vertical boreholes from
horizontal, upgrade heat pump COP to 4.0 from 2.8,
upgrade loop to very compact from standard, upgrade
soil conductivity to light rock from damp heavy.
• Commercial: increase insulation levels to high, COP
4.0 heat pumps, loop bed was very compact, usage
of equipment and lights was reduced to light from
moderate, and soil conductivity was light rock.
1) Advanced Toronto residence:
– Heat load drops to 5.8 kW and 9.3 kW for
cooling.
– GHP requires 92 m borehole, footprint of 5 m2.
– System consumes 2.5 MWh heating and 8.1
MWh cooling, GHP delivers 3.5 MWh and 15.0
MWh from earth.
2) Advanced Ottawa residence:
– Heat load is 6.6 kW and 8.9 kW for cooling.
– GHP requires 174 m borehole, footprint of 5 m2.
– System consumes 3.1 MWh for heating and
10.4 MWh for cooling, while GHP delivers 3.1
MWh and 12.3 MWh.
3) Advanced Toronto commercial:
– Heat load is 262.3 kW and 458.0 kW cooling
load.
– GHP requires 7,180.7 m borehole, footprint of
332 m2.
– System consumes 157.0 MWh for heating and
109.0 MWh for cooling, while GHP delivers
461.6 MWh and 570.3 MWh.

○ ○ ○ ○ ○ ○ ○ ○ ○ ○ ○ ○ ○ ○ ○ ○ ○ ○ ○ ○ ○ ○ ○ ○ ○ ○ ○ ○ ○ ○ ○ ○ ○ ○ ○ ○ ○ ○ ○ ○ ○ ○ ○ ○ ○ ○ ○ ○ ○ ○ ○ ○ ○ ○ ○ ○ ○ ○ ○ ○
V GEOTHERMAL HEAT PUMPS 77
4) Advanced Ottawa commercial:
– Heat load is 3.5.4 kW and 433.1 kW cooling
load.
– GHP requires 9,470 m borehole, footprint of
439 m2.
– System consumes 185.2 MWh for heating and
88.9 MWh for cooling, while GHP delivers
567.7 MWh and 464.7 MWh.
The RETScreen models indicate that an ‘advanced’
residence that combines higher thermal building
efficiency with superior GHP, will reduce space con-
ditioning load compared with an ‘average’ residence by
23% (30 to 23) and by 17% (1,248 to 1,032) in an
institutional/commercial building. This improvement in
both the demand and the supply sides means that a GHP
system would consume 50% less electricity (12 to 6) to
deliver full space conditioning in a home and 38% less
(435 to 270) in an institutional and commercial building.
The same residence was modeled in two northern
centres for comparison:
• Thunder Bay (48.4 N): heating load was 11.7 kW
(27.4 MWh) and 9.3 kW cooling (9.7 MWh),
requiring 387 m of loop pipe in 193 m trench and a
footprint of 472 m2. System consumes 11.7 MWh to
deliver 27.4 MWh from GHP, and consumes 4.0
MWh to deliver 9.7 MWh from GHP cooling.
• Big Trout Lake (53.8 N): heating load was 13.2 kW
(35.1 MWh) and 8.2 kW cooling (5.7 MWh),
requiring 463 m of pipe in 231 m trench and
footprint of 564 m2. System consumes 14.8 MWh to
deliver 35.1 MWh GHP heating, and consumes 2.9
MWh to deliver 5.7 MWh in GHP cooling.
G E O T H E R M A L E N E R G Y I S H O T I NM A N I T O B A
Manitoba is leading Canada in total installations ofGHPs, representing 30 percent of total new Canadianinstallations last year. Geothermal heat pumps are oneof the most energy efficient, environmentally-responsible home heating and cooling systemsavailable. Heat pump technology works by movingheat out of or back into the earth. Geothermal unitsare connected to the earth through pipe buried underyour lawn or landscaped area.
Manitoba Hydro currently offers home-owners aloan of up to $15,000 to install a geothermal heat pumpwhen building a new home or replacing an oldheating system. Manitoba Hydro, workingclosely with the International Ground SourceHeat Pump Association, has sponsored installercertification courses in order to build the marketinfrastructure in Manitoba. In fact, the numberof IGSHPA certified installers in Manitoba hasincreased by 130% over the last year.
One of the initiatives currently beingexplored by the Province of Manitoba, the Cityof Winnipeg and Manitoba Hydro is the potentialfor a 100 percent geothermal new homedevelopment in Winnipeg – Waverley West;which if implemented would be the largestgeothermal housing development in Canada.
The energy savings achieved by install-ing ageothermal heat pump system are considerable.Manitoba Hydro has found that geothermal heatpumps can reduce annual heating bills by $400 to $800compared to natural gas; by $600 compared to electricheating; and by $700 to $1,800 compared to heatingoil and propane based on rates as of May 1, 2004.
According to Manitoba Hydro, each geothermalhome reduces carbon dioxide emissions by 9 tonnesand each commercial unit by 34 tonnes. Each 1,000residential installations results in $15 million inconstruction-related activity and over 150 jobs

○ ○ ○ ○ ○ ○ ○ ○ ○ ○ ○ ○ ○ ○ ○ ○ ○ ○ ○ ○ ○ ○ ○ ○ ○ ○ ○ ○ ○ ○ ○ ○ ○ ○ ○ ○ ○ ○ ○ ○ ○ ○ ○ ○ ○ ○ ○ ○ ○ ○ ○ ○ ○ ○ ○ ○ ○ ○ ○ ○
SMART GENERATION: POWERING ONTARIO WITH RENEWABLE ENERGY78
T O R O N T O O F F I C E T O W E R S C O O L E DB Y L A K E O N TA R I O
More than 100 office towers in downtown Torontoare using an alternative source of air conditioning –cold water from Lake Ontario.
Enwave District Heating is bringing “deep watercooling” to Toronto, making it the largest lake sourcecooling system in the world. The deep lake coolingproject takes cold water from Lake Ontario and drawsit into a downtown pumping station. From there,through a series of heat transfers, the cold lake wateris used instead of electricity to air condition buildingsalong the Enwave network.
Three pipes extend five kilometres out into LakeOntario, reaching a depth of 83 metres below thelake surface. The pipes draw near-freezing water tocool downtown office buildings. The water is then
transferred to the city’s water treatment system andbecomes safe drinking water.
The Air Canada Centre, the Metro ConventionCentre, the Steam Whistle Brewing Company, theRoyal Bank Tower and the offices at 1 University Ave.are just some of the buildings using deep lake water-cooling.
This cooling process requires less energy andreduces electricity use by up to 75 percent less thanconventional cooling. According to Enwave, emissionsfrom coal-fired electricity will be reduced by more than40,000 tonnes. The lake water-cooling systemeliminates the need for conventional, on-sitemechanical air conditioners that consume electricityand rely on CFC refrigerants. The project is expectedto save 30 million kWh a year and free 35 megawattsof capacity from the provincial grid.

○ ○ ○ ○ ○ ○ ○ ○ ○ ○ ○ ○ ○ ○ ○ ○ ○ ○ ○ ○ ○ ○ ○ ○ ○ ○ ○ ○ ○ ○ ○ ○ ○ ○ ○ ○ ○ ○ ○ ○ ○ ○ ○ ○ ○ ○ ○ ○ ○ ○ ○ ○ ○ ○ ○ ○ ○ ○ ○ ○
V GEOTHERMAL HEAT PUMPS 79
Vancouver complex is hot stuffGeothermal energy heats and cools thousands ofbuildings worldwide, including a large apartmentand business complex in the heart of Vancouver, B.C.
The mixed-use, four-storey building doesn’t usefossil fuels for heating or cooling. Geothermalenergy provides heat and hot water for thecomplex, which includes a combination of retailstores, offices and apartments.
During the complex’s construction, buildersdrilled 46 holes 100 metres into the ground. Insidethe holes run a series of closed-loop plastic pipesfilled with water. The water flows through the pipes,absorbing heat from the earth. The warm liquid ispiped to a heat pump in the building. The pumpreleases the heat, which is circulated as warm airby electric fans. In the summer, the process isreversed, with the system pulling heat out of thebuilding and distributing it back into the earth.
Initial costs to install the geothermal energysystem were higher, but it paid for itself after justthree years. The system is highly efficient. For everywatt of electricity used, the system provides threeto four watts of heating or cooling power. Thatreduces operating costs by 50 to 75 percent overconventional systems. Other cost savings comefrom maintenance of the simple system, which hasfewer mechanical components.
G E O T H E R M A L C H A P T E R N O T E S
1 See Union of the Electricity Industry and InternationalUnion for Electricity Applications. (2004). Electricity formore Efficiency: Electric Technologies & their EnergySavings Potential. Brussels: EURELECTRIC. Available atwww.eurelectric.org/PublicDoc.asp?ID=27573 and alsoCaneta Research. (1999). Global Warming Impacts ofGround-Source Heat Pumps Compared to other HeatingCooling Systems. Ottawa: NRCan Renewable & ElectricalEnergy Division. Available at www.geo-exchange.ca/en/newsroom_reports.html
2 This chapter will not address air-source heat pumps(which extract latent heat from ambient air and offerlimited capacity when outside air temperatures are belowfreezing), nor internal loop heat pumps (which employthe same compressor technology as GHPGHPGHP butrely on roof-top chillers or boiling towers as their heatsource / heat sink), nor direct-use geothermal (such ashot springs in Banff or Iceland), nor the generation ofelectricity from deep geothermal boreholes (such as theSouth Meagher site in B.C.). The last two technologieshave no available resource in Ontario.
3 Illustrations for five configurations are available at http://www.canren.gc.ca/school/index.asp?CaId=180&PgId=1001
4 A general industry guideline is that a body of water with2,000-m2 surface area and a depth of 3 m hold sufficientthermal heat for an average-sized home.
5 The minimum COP allowed in Canada is 2.8, with mostmodels claiming a COP of 3.5 to 4.0 and, in some hybridapplications, reaching a non-certified COP of 7.0.Performance is rated under CSA 13256 (approved in1998) based on an ISO standard, while models ratedunder the earlier CSA standard C446 or the U.S. ARIequivalents are accepted in Ontario
6 Each building (residential or institutional and commercial)must calculate its heat loss prior to determining itsconditioning load, and the seven-step soil classification canhave a 4:1 differential on the amount of loop required forthe same building envelope due to soil conductivity (whichwould increase the cost of loop installation accordingly).
7 See Earth Energy Society of Canada (2001) at http://www.earthenergy.ca/saving.html
8 See Office of Energy Efficiency. (2000). Home Heating &Cooling: A Consumer’s Guide. Ottawa: NRCan. Availableat: http://oee.nrcan.gc.ca/publications/infosource/pub/home/M91-2-41-2002E.pdf
9 See Manitoba Hydro’s price comparisons http://www.hydro.mb.ca/saving_with_ps/home_heating_comparisons.pdf
10 Based on retail power rates of 5.16¢/kWh and a seasonalCOP of 2.5.
11 Marbek Resource Consultants (1999). Ground SourceHeat Pump Market Development Strategy. Ottawa: NRCan.
12 See Office of Energy Efficiency. (2000) op. cit. note 8.13 Calculation details available from Earth Energy Society
of Canada (www.EarthEnergy.ca)

○ ○ ○ ○ ○ ○ ○ ○ ○ ○ ○ ○ ○ ○ ○ ○ ○ ○ ○ ○ ○ ○ ○ ○ ○ ○ ○ ○ ○ ○ ○ ○ ○ ○ ○ ○ ○ ○ ○ ○ ○ ○ ○ ○ ○ ○ ○ ○ ○ ○ ○ ○ ○ ○ ○ ○ ○ ○ ○ ○
SMART GENERATION: POWERING ONTARIO WITH RENEWABLE ENERGY80
14 See page A50 of budget paper titled “The Economy” inManitoba Finance. (2004).The 2004 Manitoba Budget Papers.Available at www.gov.mb.ca/finance/budget04/papers
15 See Information Survival Kit for the Prospective Geo-thermal Heat Pump Owner, published by Geo-HeatCenter, April 2004, viewable at http://geoheat.oit.edu/ghp/faq/faq02.htm Fuel costs are quoted at US$0.07/kWh for electricity, $1.05/gallon for fuel oil, $1.20/gallonfor propane, $0.60/therm for natural gas, with a house ina “moderately cold climate.” Savings do not includeDHW heating and space cooling.
16 IEA. (2002). Closed Loop Ground-Coupled Heat Pumps:Informative Fact Sheet. Available at: http://www.heatpumpcentre.org/publ/HPCOrder/ViewDocument.aspx?RapportId=14
17 See IEA Heat Pump Centre Newsletter (volume 22,number 2, 2004). Available at: http://www.heatpumpcentre.org/Home/Newsletter_N22.02.pdf
18 The publication, Environmental Protection Agency.(1993). Space Conditioning: The Next Frontier, analyzedseveral space conditioning technologies (GHP tech-nologies, air-source technologies, oil, and natural gassystems) in six regions of the U.S. and identified GHP asthe top choice for heating and cooling in all locations,with the lowest annual operating costs and lowestannualized costs in all locations (except Portland), andbest option for GHG mitigation.
19 ‘Low temperature geothermal’ can refer to either GHP ordirect use geothermal, but not to generating capacity.
20 Since June 2002, the Canadian Association for RenewableEnergies has tried to obtain data from the federalgovernment on renewable energy in Canada; see http://renewables.ca/atip.html. Access to Information requestsindicate that no data are available at the federal level.
21 Select Committee on Alternative Fuel Sources, LegislativeAssembly of Ontario, Final Report, 3rd Session, 37th
Parliament, page 8. There are no data provided on GHPcapacity or forecasts.
22 Between 1995 and 2003, there were at least four separateattempts to compile data from manufacturers, includingthe use of double-blind surveys. The refusal to providedata is attributed to competitive issues between the smallnumbers of manufacturers operating in Canada.
23 The program involved a $2,000 rebate for homes thatinstalled a certified GHP unit from a registered contractortrained by the CEEA; the rebate was not provided to home-owners who could access natural gas service and wasintended to stem the customer base that was convertingto natural gas for heating while leaving the utility withplug load. Termination of the rebate was perceived bymany consumers as a failure of the technology, and salesin Ontario declined for a number of years.
24 RETScreen was developed in 1998 by NRCan’s CANMETEnergy Diversification Research Laboratory to evaluateenergy performance, cost and financial viability ofimplementing renewable energy technologies. As of
March 2004, NRCan says there are 41,500 users in 196countries. See www.RETScreen.net
25 Energy required to heat and cool the facility (excludingwater heating) over a one-year period.
26 Electricity required for one year to operate the GHPsystem in heating and cooling modes, to provide thesame level of heating and cooling.
27 Total electricity for heating and cooling over one year,averaged between Toronto and Ottawa.
28 Comprehensive Energy Use Database, 2002, published byNRCan, viewable at http://oee.nrcan.gc.ca/neud/dpa/comprehensive_tables/index.cfm?text=N&printview=N
29 See GHP Appendix: 12,500 MWh versus 30,300 MWh.30 See GHP Appendix: 6,100 MWh versus 22,900 MWh.31 See GHP Appendix: 6,100 MWh versus 30,300 MWh.32 Using estimates based on Enbridge Gas Distribution billing.33 EPA (1993) op.cit. note 19 Marbek (1999) op.cit note 11.34 Marbek (1999) op.cit. note 11.35 Based on a COP of 4.0.36 See http://IMBY.org; In My Back Yard.37 Estimate compiled by Earth Energy Society of Canada.38 Ibid.39 Martin Cloutier, Manitoba Hydro (September 2004),
personal communication.40 Ontario Ministry of Finance, Population Projections.41 Comprehensive Energy Use Database (2002) NRCan,
http://oee.nrcan.gc.ca/neud/dpa/comprehensive_tables/index.cfm?text=N&printview=N
42 Comprehensive Energy Use Database (2002) NRCan,http://oee.nrcan.gc.ca/neud/dpa/comprehensive_tables/index.cfm?text=N&printview=N
43 Ibid.44 See Housing Market Indicators, Ontario, 1990–2002 in
Canadian Mortgage and Housing Corporation. (2003).Canadian Housing Observer. Ottawa: CMHC. Availableat www.cmhc-schl.gc.ca/en/cahoob/index.cfm
45 Energy is provided on demand; it is not conditional onexternal storage or reliant on weather patterns.
46 CMHC (2003) op.cit note 44.47 Enbridge op. cit. note 32.48 Marbek (1999) op. cit. note 11. The report analyzed 135
scenarios in 12 building segments (elementary school,high school, seniors complex, high-tech facility, curlingrink, hockey arena, mid-size hotel, motel, suburbanoffice, high-rise condominium, retail strip mall, resi-dential subdivision) at sites in Toronto, Montreal,Winnipeg, Vancouver, Moncton and Kamloops.
49 A process to aggregate GHG credits from residentialGHP systems was developed by the Earth Energy Societyof Canada in 2002.
50 For details see Environmental News Network. (July 13,1999). DOE renewable energy reports questioned. Availableonline at www.enn.com/news/enn-stories/1999/07/071399/renew_4310.asp
51 For details about REDI see http://www.canren.gc.ca/programs/
GeneratingGenuine Wealth
81
6
Summary
Solar energy can be used in Ontario to generate
pollution-free electricity and heat for residential, insti-
tutional, industrial, and commercial applications.
The most promising solar technologies in the short
term are those that capture the sun’s rays to heat indoor
spaces or water, thereby replacing fossil fuels or nuclear
energy that would have been used in these applications.
These relatively simple and low-maintenance technolo-
gies can provide elegant, clean solutions to some of our
energy needs.
Solar energy currently provides 8% of the average
Canadian home’s heating requirements (in the form
of sunlight entering through windows). This proportion
of ‘solar thermal’ energy (converting sunlight into heat)
could be easily increased to 22% with minor changes
in community planning, building design, and higher
standards.
Solar thermal energy can also provide 40–50% of
residential hot water heating and 15% of commercial hot
water heating requirements at a cost below the current
price of electrically heating water (at the equivalent of
8.4 cents per kilowatt hour), while 39% of pools can be
heated using solar thermal panels. Solar walls in new
construction can replace other energy sources for space
heating at the equivalent of 2 cents per kWh.
Achieving the province’s solar thermal potential will
require a mix of regulatory changes (e.g. building codes,
zoning by-laws), marketing support programs to raise
public awareness and inform builders on solar thermal
options, and tax changes to actively promote solar
thermal technologies.
Solar photovoltaic (PV) systems, which convert sun-
light into electricity, are currently less cost-competitive
but have the advantage of generating clean, reliable power
on site at the time of peak usage. It also has no moving
parts so requires little maintenance and the fuel is free.
By implementing the policy measures proposed in this
chapter, Ontario could capture one-half of the technical
potential for solar thermal and photovoltaic technologies,
providing as much energy in 2025 as coal did in 1999.
Japan and Germany are two countries with relatively
modest solar resources but have nevertheless quickly
become world leaders in solar photovoltaic (PV) technology.
The experience of these leaders clearly illustrate that
strong solar markets can be quickly established if
supportive policy measures that focus on the use of
gradually declining subsidies, strong government R&D,
and active market penetration are implemented.
Germany has become a world leader in solar PV
through the enactment of its renewable energy mechan-
isms (REMs) law that guarantees stable payment for each
kWh of PV-generated electricity, and grid access for
PV owners.
Southern Ontario has some of the best solar potential
in Canada and the province can support a significant
expansion of PV and solar thermal technologies by
implementing REMs and other key supporting initiatives
that address existing financial, technical, and educational
barriers.
The solar industry worldwide has been growing at
double-digit rates, and Ontario is in a unique position
of benefiting from this well-established trend. By
supporting its burgeoning solar industry, Ontario can
obtain reliable energy (without fuel costs), a cleaner
environment, and strong job creation.
This chapter identifies the potential applications for
solar technology in Ontario; it also reviews recent
developments and policies in other countries, and
SolarEnergy

○ ○ ○ ○ ○ ○ ○ ○ ○ ○ ○ ○ ○ ○ ○ ○ ○ ○ ○ ○ ○ ○ ○ ○ ○ ○ ○ ○ ○ ○ ○ ○ ○ ○ ○ ○ ○ ○ ○ ○ ○ ○ ○ ○ ○ ○ ○ ○ ○ ○ ○ ○ ○ ○ ○ ○ ○ ○ ○ ○
SMART GENERATION: POWERING ONTARIO WITH RENEWABLE ENERGY82
proposes a series of policy initiatives that would greatly
increase the contribution of solar energy in Ontario over
the next 15 years.
1. Background on solar energy
While there have been assessments on the potential of
individual solar technologies carried out in the past
(mainly in the 1980s and early 1990s), there has not been
a comprehensive assessment of solar potential in Canada
or its provinces.1 In part this is due to a flawed, but widely
held, assumption that solar has low potential for making
a significant impact on the energy needs of Canada. In
addition, the fact that the three main solar technologies
(photovoltaic, thermal, and passive) include a variety of
niche markets makes an overall assessment difficult.
Solar energy is almost exclusively an on-site generator
of energy. As such, its implementation represents a major
paradigm shift away from central power plant generation.
While solar energy is often considered an option for
the future, right now 8% of the average Canadian home’s
heating requirements are supplied by the solar energy that
flows naturally into homes through south facing
windows. By proper community planning and only
minor alterations in new house design and construction
this share could easily be increased.
While there are many widespread misunderstandings
surrounding solar energy, one of the most prevalent is
that Ontario does not receive sufficient sunlight to
provide a practical power source. In reality, Ontario has
a greater solar resource than many of the current solar
leaders (Japan and Germany). Toronto, in fact, has a better
summer solar resource than the city of Miami, Florida.
Solar energy can be used to generate electricity using
solar photovoltaic (PV) systems and can also be harnessed
for thermal applications (e.g. space and water heating,
which displaces electricity and/or fossil fuels currently
used for those purposes).
PV systems are currently widely used to provide power
in remote areas (e.g. for telecommunications systems,
navigational signals, off-grid applications), and their use
for grid-connected electricity generation is growing
rapidly in a number of jurisdictions such as: Germany,
Japan, and the state of California. As the price of PV
systems drop, the potential to meet Ontario’s electricity
needs will be significant.
Solar thermal applications can be used to satisfy space
conditioning and hot water needs. For example, building
owners in Ontario can reduce their hot water energy bills
by 40–50%, by installing a solar water heater.3 Solar hot
water systems can be installed in almost every kind of
building, from a single suburban home to a condo-
minium or apartment building. Plus, if the cost of a solar
hot water system (SHW) is calculated over the life
expectancy of the system (using the same methods that
utilities employ to estimate the cost of the electricity they
supply to consumers), then solar thermal is one of the
cheapest ways to generate heat available today.
Commercial and industrial buildings can use cladding
designed to collect the sun’s heat for heating and cooling
purposes with virtually no additional material costs.
Buildings can also be designed with day lighting
principles (thereby significantly reducing the need for
artificial illumination and its associated electricity use).
Roofing shingles and glass can be made of photovoltaic
(PV) materials that generate electricity. Many of these
solar systems can be used instead of existing construction
materials and can contribute significantly to the entire
lifetime energy needs of a building.
However, as a result of a pervasive and widespread
focus on electricity generation, solar thermal systems are
FIGURE 1 Solar Radiation in Miami and Toronto2

○ ○ ○ ○ ○ ○ ○ ○ ○ ○ ○ ○ ○ ○ ○ ○ ○ ○ ○ ○ ○ ○ ○ ○ ○ ○ ○ ○ ○ ○ ○ ○ ○ ○ ○ ○ ○ ○ ○ ○ ○ ○ ○ ○ ○ ○ ○ ○ ○ ○ ○ ○ ○ ○ ○ ○ ○ ○ ○ ○
VI SOLAR ENERGY 83
often not considered when energy issues are discussed.
Furthermore, solar thermal applications are also not
generally addressed under discussions of energy conser-
vation (in such cases they are often excluded because they
are widely considered as a “generator of energy”).
Although often overlooked, solar energy can be an
important local energy solution in Ontario that can
supply clean and reliable electricity and heat – without
any fuel costs. Solar energy has an important role in
reducing our dependency on polluting fossil fuels and
unreliable nuclear energy.
1 . 1 WORLDWIDE SOLAR DEVELOPMENT
The world market for photovoltaic (PV) systems has been
growing at 30% annually for the past five years.4
In 2003, production of PV cells and modules reached
the highest-ever level at 744 MW, which represents a
32.4% increase over the 2002 production figure of 562 MW.5
In Japan, PV cell and module production increased
45% during 2003, and in Europe there was a 43% increase
in PV production.6
The bulk of the 2003 PV production was used for grid-
connected installations in the leading solar markets of
Japan (200 MW) and Germany (120 MW).
Japan was a minor PV player in the early 1990s but
through a combination of supportive policies and active
public education, the country rose to become the world’s
largest producer and user in less than a decade. By relying
on renewable energy mechanisms, low-interest loans,
comprehensive education programs, rebates for grid-
connected residential systems, and government procure-
ment, Japan has now three times as much PV capacity as
the entire United States.7
Germany’s impressive success in wind power has also
been replicated in its PV sector. Second only to Japan’s
PV market, Germany’s PV installations have grown at an
average annual rate of nearly 49% since 1992 and reached
417 MW of installed capacity, mostly on-grid, at the end
of 2003.8 Germany’s PV success is the result of two key
policies: a) feed-in laws that guarantee a fixed price for
any power fed into the grid from a renewable source
(referred here as renewable energy mechanisms), and
b) a government initiative that provides low-interest loans
to purchase PV systems (the ‘100,000 solar roofs
programme’).9
Japan and Germany are two countries that have
modest solar resources but have nevertheless become
world leaders in PV technology. Their success is based
on the fact that they both share a long-term commitment
to advancing renewable energy and have implemented
effective and consistent policies focused on the use of
gradually declining subsidies, strong government R&D,
and active market penetration.
Canada is lagging significantly behind other indus-
trialized nations in the deployment of PV. Canada has an
installed PV capacity of 0.28 watts per capita, which is only
28% of the IEA average (1.0 watt per capita) and is consider-
ably behind the world leaders of Japan (3.6 watts per
capita) and Germany (2.4 watts per capita).10 Figure 2 shows
the 2001 installed PV capacity in a number of countries.
FIGURE 2 PV installed capacity (2001)
At the end of 2001 a total of 100 million square metres
(m2) of solar thermal collectors were installed in 26 IEA
member countries, with about 71% of collectors in use
for hot water and space heating, 28% for heating
swimming pools, and 2% for drying agricultural products
and space heating.11
Germany is the leading solar thermal market in
Europe and in 2003 installed about 80,000 systems
(720,000 m2 of glazed collectors).12 These systems are

○ ○ ○ ○ ○ ○ ○ ○ ○ ○ ○ ○ ○ ○ ○ ○ ○ ○ ○ ○ ○ ○ ○ ○ ○ ○ ○ ○ ○ ○ ○ ○ ○ ○ ○ ○ ○ ○ ○ ○ ○ ○ ○ ○ ○ ○ ○ ○ ○ ○ ○ ○ ○ ○ ○ ○ ○ ○ ○ ○
SMART GENERATION: POWERING ONTARIO WITH RENEWABLE ENERGY84
currently promoted by the German government through
a market incentive program that provides a subsidy of
$180 per m2 of collector surface area. However, the
German government and industry are collaborating to
replace this program with a new law that would provide
a payment for every equivalent kWh of heat generated
by renewable energies (this system is inspired by the REM
currently in place for PV electricity generation).13
1 . 2 S O L A R E N E R G Y I S A R A P I D LYG R O W I N G B U S I N E S S
The market for solar worldwide is expanding rapidly with
impressive growth rates that are comparable to those of
the personal computer and cell phone industries in the
boom markets of the 1980–90s.14 PV markets globally
are now worth US $3.5 billion a year and are expected to
grow to US $28 billion by 2012.
In Canada, solar markets are in a very early develop-
ment stage and the current national PV market is more
similar to those of low-income nations where the majority
of installations (>95%) are for off-grid applications. The
trend within industrialized nations is for an increasing
proportion of PV sales (currently >80%) for grid-
connected applications supported by market-enhancing
government programs and proactive policies.
Natural Resources Canada (NRCan) has conducted
an annual survey of the PV market in Canada since 1996,
which shows annual double-digit growth. As the market
is exceedingly small and diverse it is unlikely that the
survey, with the limited resources dedicated to it, captures
all sales in Canada. The need for accurate data will become
more acute as the PV industry begins to expand rapidly
into the grid-connected market. Unfortunately, the
NRCan survey does not provide provincial breakdowns
of sales. The Canadian Solar Industry Association
(CanSIA) estimates Ontario’s current installed capacity
and annual sales as shown in the Table below.
TABLE 1
Estimated grid connected PV sales in Ontario in peak kW(KWp)
Installed (2001) Sales (2003)
Residential Existing homes 50 20BIPV 5 8
Commercial Rooftop 50 20BIPV n/a 20
Total 105 68Electricity KWh 105,000
Note.The maximum possible output of a PV system operating under standard conditions isdefined as its peak output, and is measured in watts or kilowatts and can beexpressed as Wp (watt, peak) or kWp. BIPV = Building Integrated Photovoltaic.
PV generation calculation assumes that during peak sun hours a location can receive1000 W/m2 per hour and that the average in Canada is about 4 hours of peak sun perday (i.e. 4000 Wh/m2/day); therefore, in a year (365 days) = 1460 hrs of peak sun(1,460,000 Wh/m2/year). Thus, 1 watt of PV will produce about 1,460 watt-hours ofenergy. However, there are system and operational losses (e.g. inverters, batteries,and line loss), which will reduce the total that can be delivered to the grid to about80% (hence we assume 1,168 watt-hours); therefore, we can express the finalcalculation as 1 watt of PV = 1000 watt hours (or 1 kWh) per year.
1 . 3 T E C H N I C A L C O N S I D E R AT I O N SSolar technologies can be used to generate electricity, and
also to satisfy residential and commercial heating, cooling,
and illumination needs which helps to displace electricity
and fossil fuels currently used for those purposes.
P H O TOVO LTA I C
Electricity can be obtained by the use of photovoltaic (PV)
systems, which rely on sunlight (photons) to generate an
electric current.15 This chapter considers four applications
for grid-connected PV systems in Ontario: residential
rooftop (existing homes); residential roof Building Inte-
grated PV (BIPV) for new homes; commercial/institutional
rooftop PV; and façade BIPV for new commercial buildings.
FIGURE 3 Rooftop PV and facade building integrated PV (BIPV)

○ ○ ○ ○ ○ ○ ○ ○ ○ ○ ○ ○ ○ ○ ○ ○ ○ ○ ○ ○ ○ ○ ○ ○ ○ ○ ○ ○ ○ ○ ○ ○ ○ ○ ○ ○ ○ ○ ○ ○ ○ ○ ○ ○ ○ ○ ○ ○ ○ ○ ○ ○ ○ ○ ○ ○ ○ ○ ○ ○
VI SOLAR ENERGY 85
S O L A R A I R V E N T I L AT I O N
Ontario is home to a company that is the world leader in
manufacturing solar air ventilation (SAV) systems. However,
most of the company’s sales are international, and
Ontario lags behind in the use of this technology when
compared to other provinces and countries. SAV is a simple
technology that can have great positive impacts on the
space heating needs of commercial and industrial
buildings. In existing buildings it can be retrofitted over
existing walls, while in new construction SAV systems can
actually take the place of a conventional wall. In terms of
electricity, Solarwall (the trade name for solar air ventilation
systems) can save about 556 kWh per square meter (m2)
per year in Ontario. In terms of peak capacity, each m2 of
Solarwall panels can generate the equivalent of over 500
watts or 0.5 kW of thermal energy when the sun is shining.
FIGURE 4 Solar air ventilation system (SAV)
Solar air ventilation systems are a competitive energy
source now – providing clean energy at the equivalent of
less than two cents per kWh if amortized over six years
in new construction (where it replaces a metal wall).
Installation costs are similar to the cost of a brick wall in
new construction and thus the net cost for the energy it
produces is zero.
S O L A R WAT E R H E AT I N G
Solar hot water collectors (like PV modules) have a
capacity factor of 10–15% due to the fact that the sun doesn’t
shine all the time; i.e., a 1.5 kWp (1,500 Wp) solar ther-
mal collector will deliver on average about 150 to 225 W of
equivalent thermal power.
On an energy basis, the cost of solar thermal energy
ranges between four to seven cents per kWh over the
system’s 20-year life expectancy. Solar hot water systems
have a 20–25 year life expectancy during which the system
does not require much attention (i.e. limited repairs and
maintenance). 16
FIGURE 5 Solar domestic hot water (SDHW) system
Policy makers often ignore the issue of swimming pool
heating as they consider it to be an insignificant market.
However, an average heated outdoor residential swim-
ming pool in Ontario will consume as much energy (40–
50 GJ) over the summer swimming season as a typical
house uses for space heating during an entire year. In
Ontario there are an estimated 130,000 pools that are
heated using natural gas and electricity – consuming 4.8
PJ (or the equivalent of 1,330 GWh) of non-renewable
energy per year (2001).17
Solar water heating is relatively simple to integrate
into a swimming pool’s water filtering and circulation
system. Pool water is pumped through the solar collectors
using the pool’s existing pump on sunny days while a
bypass valve, operated manually or with a temperature-
controlled solenoid valve, will bypass the solar collectors
during the night or during cloudy weather.
FIGURE 6 Solar pool heating system

○ ○ ○ ○ ○ ○ ○ ○ ○ ○ ○ ○ ○ ○ ○ ○ ○ ○ ○ ○ ○ ○ ○ ○ ○ ○ ○ ○ ○ ○ ○ ○ ○ ○ ○ ○ ○ ○ ○ ○ ○ ○ ○ ○ ○ ○ ○ ○ ○ ○ ○ ○ ○ ○ ○ ○ ○ ○ ○ ○
SMART GENERATION: POWERING ONTARIO WITH RENEWABLE ENERGY86
O N S I T E S O L A R G E N E R AT I O N :N E T Z E R O E N E R G Y H O M E
Solar technologies are most effective when installed on
the building in which the energy is to be used, as this
approach eliminates land-use competition issues, avoids
the construction of stand-alone support structures and
reduces problems of energy delivery (e.g. delivery costs
and transmission losses). Furthermore, solar energy is
unique and readily available as an on-site source of energy.
As such, one of its greatest impacts will be at the home
level, as various solar technologies can be combined to
significantly reduce the need for outside energy. While
an average house in Ontario used 116 GJ of outside energy
annually in 2001 – this figure could be reduced to less
than 50 GJ when solar energy usage is maximized and
integrated with energy efficiency measures.
P A S S I V E S O L A R
Passive solar is mainly a design concept rather than a
specific product. The contribution of passive solar design
to space heating needs is a matter of arranging and using
the various components of a building to gain and utilize
net solar heat and light to achieve optimal effect. The
energy balance of solar gains and losses through the
building components provides the “net” energy. Properly
designed homes can increase the sun’s energy contri-
bution for space heating and lighting loads, as well as
reducing energy losses and cooling needs.
1 . 4 B E N E F I T S O F S O L A R E N E R G YThe use of solar energy for electricity generation and for
thermal applications provides unique opportunities to
minimize dependency on imported fossil fuels and
nuclear energy.
Solar technologies such as PV are highly modular (i.e.
can be easily adapted to meet changing energy needs)
and can be used in grid-connected and stand-alone
applications. PV systems can also be combined with other
renewable energy systems (e.g. wind turbines, small
hydro) to implement hybrid electricity systems that are
increasingly used in difficult-to-access areas to displace
cumbersome diesel generation.18
Solar technologies provide clean and reliable energy
services without fuel costs. They can be used in all types
of buildings and for commercial purposes (e.g. car
washes, laundry facilities, and recreation facilities such
as swimming pools and water parks).
Solar thermal technologies can help reduce the total
energy bill of Ontarians and reduce their greenhouse gas
emissions. For example, water heating represents about
20% of the average Canadian home total energy bill and
results in an average of two tonnes of CO2 emissions per
water heater.19 Solar water heaters can reduce the
electricity or fossil fuels usually used for water heating
by 40–50%. New solar systems can provide water heating
at the equivalent of about five cents per kWh (competitive
with electricity and natural gas prices).20
The development and implementation of solar
technologies can also result in employment gains and new
export products (as shown by the activities of key
innovative Ontario-based solar companies).
1 . 5 E M P L O Y M E N T
Information on the job potential of the various solar
technologies in Ontario is sketchy, at best, and there has
been little empirical analysis of the current or potential
size of the solar industry.
Employment creation analysis is further complicated
by the diverse nature of the solar industries.
Passive solar is the largest single segment of the solar
technologies in regard to actual energy generation;
however, it is rarely acknowledged as an energy source
and the jobs in this field tend to be included under general
construction trades and window manufacturers. There-
fore, the employment potential of solar passive options
is not discussed in detail in this chapter.
Currently, the majority of solar manufacturing jobs
in Canada are for products exported outside of Canada.
Canada’s four main solar manufacturers Conserval (solar
air ventilation), Xantrex (inverters for PV), Thermo
Dynamics (solar hot water collectors, and most recentlyFIGURE 7 Passive solar design

○ ○ ○ ○ ○ ○ ○ ○ ○ ○ ○ ○ ○ ○ ○ ○ ○ ○ ○ ○ ○ ○ ○ ○ ○ ○ ○ ○ ○ ○ ○ ○ ○ ○ ○ ○ ○ ○ ○ ○ ○ ○ ○ ○ ○ ○ ○ ○ ○ ○ ○ ○ ○ ○ ○ ○ ○ ○ ○ ○
VI SOLAR ENERGY 87
– Spheral Solar (PV modules) are focused on export
markets with about 50–75% of their products being
exported.21 These firms are leaders in the solar industry
internationally; however, the main reason for their high
export ratios is because of the lack of a Canadian market
for their products.
Employment in the solar sector tends to fall into manu-
facturing, installation, operations and maintenance.22
There are a wide variety of other indirect jobs
associated with solar including the manufacturing of
balance of system components, which for the technologies
considered in this chapter include:
• PV system (batteries, inverters, mounting hardware)
• Solar hot water (pumps, plumbing, controls,
mounting hardware, heat exchangers, water tanks)
• Solar pool heating (plumbing)
• Solar air ventilation (fabrication of metal, including
ductwork and ventilation equipment)
• General: glass manufacturing, metal framing,
control electronics, software.
As the solar installed capacity in Canada is still small,
the number of jobs in the solar operations and mainte-
nance sector is currently insignificant. As solar systems
are installed on buildings and there is no technical
operator (such as required by a wind farm or a
hydroelectric facility), there is a need for firms to provide
periodic maintenance. As deployment of solar technolo-
gies increase and the installed base expands, this sector
will begin to contribute a significant number of jobs.
Currently, there is a lack of employment statistics on
the solar industry in Canada and, unlike other OECD
nations, there is no ongoing annual survey that tracks
employment trends.
Nevertheless, a number of employment estimates exist
and indicate that the Canadian PV industry currently
provides between 600–1,000 jobs, and that the solar
thermal industry supports about 180 jobs.23
At the moment the solar industry in Canada is very
underdeveloped and few economies of scale are in place.
Most manufacturing plants are operating at well under
their capacities (25–33% is a figure often quoted), and
installers are not working continually in implementing
solar systems.24 Therefore, the estimates provided here
of jobs per installation in the solar industry might be
higher than the actual jobs achieved if a much greater
level of deployment was to develop.
E M P LOY M E N T P O T E N T I A L O FP H O TOVO LTA I C ( P V )
The PV sector is expected to contribute to the creation
of over two million jobs worldwide in 2020, mainly in
small and medium sized firms.25 However, analysis of the
pertinent literature reveals a lack of consensus in
methodologies and on job creation per MW of PV
installed (i.e. a range of 13–185 jobs per MW installed).26
Due to the wide range of available estimates this chapter
uses a figure of 35 jobs per MW of PV installed annually.
E M P LOY M E N T P O T E N T I A L O FS O L A R WAT E R H E AT I N G
CanSIA estimates that six jobs can be created per 1,000
m2 of solar hot water collectors installed not including
maintenance personnel.
Canadian data for solar pool heating is not readily
available, however, CanSIA estimates that for each 1,000
systems installed annually, 12 installation jobs and 1.6
maintenance jobs are created (these figures do not include
any employment creation related to manufacturing).
E M P LOY M E N T P O T E N T I A L O FS O L A R A I R V E N T I L AT I O N
Canadian figures are not readily available on the job
creation potential for the solar air ventilation industry.
Nevertheless, extrapolation of the present size of the
industry versus new annual installations can provide a
rough estimate of the magnitude of potential job creation.
According to Industry Canada, in 2003 there were 60
jobs and about 4,000 m2 of solar air ventilation systems
installed (manufacturer estimate). This would roughly
translate to about 15 jobs per 1,000 m2 of installed solar
air ventilation systems (which is a very high employment
estimation when compared to other solar technologies).
Therefore, a preliminary estimate of five jobs per 1,000 m2
is used, and it is emphasized that further research is
required to derive a more accurate estimate.
O N TA R I O ’ S S O L A R J O B M A R K E T
Life expectancies of most solar technologies exceed 25
years, which is greater than the time frame considered in
this study. However, as the market ages, there will be a
growing need for system replacement, which will increase
the job market. Solar pool heating – which has a typical
life expectancy of 15–20 years will begin to see a
significant replacement market develop during the next
20 years. However, this is not considered in the estimates
used here.

○ ○ ○ ○ ○ ○ ○ ○ ○ ○ ○ ○ ○ ○ ○ ○ ○ ○ ○ ○ ○ ○ ○ ○ ○ ○ ○ ○ ○ ○ ○ ○ ○ ○ ○ ○ ○ ○ ○ ○ ○ ○ ○ ○ ○ ○ ○ ○ ○ ○ ○ ○ ○ ○ ○ ○ ○ ○ ○ ○
SMART GENERATION: POWERING ONTARIO WITH RENEWABLE ENERGY88
Table 2 provides a tentative estimate of the job
potential in the manufacturing and installation segments
based on projected annual sales provided by the Canadian
Solar Industries Association. No figures are provided for
jobs created in maintenance and operation (except for
solar pool heating).
1 . 6 E C O N O M I C D E V E L O P M E N TAs of 2003, the annual Canadian PV module market
totaled 1.67 MW per year and the Canadian PV industry
generated revenues of about $100 million.27 The industry
is currently focused on off-grid applications and exports
due to the absence of strong grid-connected markets.
Even in the near absence of domestic markets, Ontario is
currently home to leading solar companies, which are
ready to increase their activities if supportive provincial
policies are enacted to ensure rapid and sustained
implementation of solar technologies.
2. Ontario’s solar resource:waiting to be tapped
2 . 1 E S T I M AT I N G O N TA R I O ’ S S O L A RR E S O U R C E S
As is the case with almost all of the renewable energy
resources discussed in this report, Ontario’s solar
resources have not yet been thoroughly analyzed and
information regarding the provincial solar resource is patchy
at best, and not readily available. The resource estimations
provided below are a preliminary attempt that indicates
the magnitude of what can be achieved with solar energy
in Ontario. Since local topographical features (including
trees and existing buildings) can significantly affect the
amount of solar radiation received in a specific area, this
effort needs to be complemented by a detailed provincial
analysis of solar resources at the community level.
The solar resource in Canada is generally very good
and compares favourably with other regions of the
world.28 Within Canada, southern Ontario has one of the
best national annual mean solar radiation regimes and,
as Figure 1 illustrates, cities such as Toronto receive a very
favourable solar resource (especially during summer,
when key peaks of electricity demand occur).29
The next sub-sections look at the possible contri-
bution that solar energy could provide in Ontario, using
assumptions of roof availability for each solar application.
These assumptions are then applied to projections of
housing and building stock in 2025.
2 . 2 T E C H N I C A L R E S O U R C E SSolar systems (PV and thermal) are generally most
effective when installed on buildings that can use solar
energy (either as electricity and/or heat) on site. This
strategy minimizes land-use conflicts and the need for
construction of stand-alone support structures, while
reducing energy delivery problems (e.g. need for grid
expansions and associated energy transmission losses).
To estimate the total building area available for
installing solar systems it is essential to determine the
appropriate surfaces and roof types that are available in
Ontario to implement solar systems.30
By analyzing the Ontario resale home market it is
possible to develop an estimate of the proportion of
surfaces and roof types in Ontario. This data is used in
Table 3 to define an “average” solar system for residential
applications.
TABLE 2
Potential solar job creation in Ontario by 2025
Jobs Market Size in 2025Technology Per unit Units Jobs in 2025
PV 35 1 MW Annual sales 135 MW 4,725Total installed 1,232 MW Not available
Solar air ventilation 5 1,000 m2 Annual sales 825,000 m2 4,125Total installed 3,600,000 m2 Not available
Solar pool 12 1,000 systems Annual sales 7,000 Systems 841.6 1,000 systems Total installed 121,000 Systems 194
Solar hot water 6 1,000 m2 Annual sales 1,719,000 m2 10,314Total 19,442

○ ○ ○ ○ ○ ○ ○ ○ ○ ○ ○ ○ ○ ○ ○ ○ ○ ○ ○ ○ ○ ○ ○ ○ ○ ○ ○ ○ ○ ○ ○ ○ ○ ○ ○ ○ ○ ○ ○ ○ ○ ○ ○ ○ ○ ○ ○ ○ ○ ○ ○ ○ ○ ○ ○ ○ ○ ○ ○ ○
VI SOLAR ENERGY 89
TABLE 3
Solar technology area requirements for residentialapplications
Solar systemTechnology System size surface area (m2)
Passive solar To provide 33% of 7space heating load
PV 3 kW array 20Solar DHW 2 collector system 6Solar pool heating 50% of pool surface area 26
– average pool of 16'x32'
The data of Table 3 is used to consider the available
space on each roof type, considering its potential for
shading, which is then compared to the size requirements
for each solar application. Table 4 illustrates the results
of this calculation and assumes that new construction
(beginning in 2008) uses good solar orientation design
and that favourable legislation protecting solar access is
in place.
TABLE 4
Estimate of housing stock available for solar applications
Technology System sizing Current (2001) 2025
Passive With optimum 12% 23%solar exposure
PV 3 kW Array 47% 51%Solar DHW For single family 63% 77%
dwellingsSolar pool heating For average 39% 39%
swimming pool
Considering provincial data on floor area and the
number of building stories it is possible to derive
estimates of Ontario’s available roof space on commercial
and institutional buildings. 31 This calculation indicates that
by 2000 there were approximately 44 million m2 of roof
space on commercial and institutional buildings in Ontario.
By extrapolating historical building growth rates in
Ontario it is possible to estimate that the building roof
area in 2025 could increase to as high as 67 million m2.32
T E C H N I C A L P OT E N T I A L F O RP H O TOVO LTA I C S Y S T E M S
Residential PV: Based on historical housing construc-
tion data, it is estimated that the number of houses in
Ontario could grow to over 5,000,000 units by 2025.33
Currently, about 1,400,000 homes in Ontario (47%
of all homes) have the potential to install a 3 kWp solar
PV array that combined could supply 17% of the
residential plug load demand in Ontario.34
Based on no improvements to homes’ orientation or
solar exposure it is possible to estimate that by 2025
almost 2,400,000 homes would have the technical
potential to install a 3 kWp PV array, and that the total
technical potential would be 7,100 MW or 7,100 GWh.
With proper legislation solving solar access and house
orientation issues, the number of feasible roofs for 3 kW
PV arrays for new homes could rise from the current 46%
to 62% by 2025, thereby increasing the total housing
stock’s potential to 51% of all homes. This could increase
the technical potential for PV-generated electricity by
11% to 7,900 MW (7,900 GWh) in 2025.
Commercial & institutional rooftop PV: It is assumed
that 50% of commercial/institutional buildings currently
have the potential for supporting PV systems on their
roofs. It is important to note here that there is an overlap
of the space requirements between PV and solar hot water
systems. As the deployment of these two technologies
TABLE 5
Residential grid connected PV current technically feasible potential (2001)
Single detached Semi attached Row Total
Number of housing units 2,456,925 263,875 307,665 3,028,465Feasible sites 44% 52% 57% 47%Number of feasible sites 1,081,047 137,215 175,369 1,393,631Solar array size (kW) 3 3 3Technically feasible (MW) 3,243 412 526 4,181Annual energy (GWh) 3,243 412 526 4,181Percent of total demand 17%

○ ○ ○ ○ ○ ○ ○ ○ ○ ○ ○ ○ ○ ○ ○ ○ ○ ○ ○ ○ ○ ○ ○ ○ ○ ○ ○ ○ ○ ○ ○ ○ ○ ○ ○ ○ ○ ○ ○ ○ ○ ○ ○ ○ ○ ○ ○ ○ ○ ○ ○ ○ ○ ○ ○ ○ ○ ○ ○ ○
SMART GENERATION: POWERING ONTARIO WITH RENEWABLE ENERGY90
increases significantly there will be competition for roof
space between the technologies.
Furthermore, it is also assumed that only 60% of the
eligible roof space for solar systems is available for
installations of PV as space is already taken up by HVAC
equipment, roof access for window cleaners, and the
spacing required between solar arrays to prevent array
shading. As part of the technical resource calculations it
is also assumed that PV modules will improve their
performance efficiency slightly during the period
considered (i.e. increase from 129 to 142 watts per m2).
Taking these numbers into consideration, it is estimated
that the technically feasible potential of commercial
rooftops in 2025 is 4,046 MW (or 4,046 GWh annually).
Commercial and institutional facade BIPV: Data on
the fraction of wall area with adequate solar insolation
for a wall mounted PV is derived from a European
Commission report and data from German cities.35
Applying this data, it is estimated that an average of 8%
of building wall space has the potential for solar PV. A
lower capacity fraction (0.61 kWh/watt vs. 1.0 kWh/watt)
is used due to the reduced insolation on a vertical wall
versus a sloped roof.
TABLE 7
Commercial rooftop PV – technically feasible potential(2000 & 2025)
Year 2000 2025
Total number of buildings 52,182 78,368Feasible sites 50% 50%Number of feasible buildings 26,091 39,184Roof area (m2) 44,878,716 67,399,524Average roof area (m2) 860 860Available roof area 60% 60%PV array tilt aspect (45o vs. flat) 141% 141%Average array area available (m2) 728 728PV efficiency (watt/m2) 129 142Average array size (kW) 94 103Total power (MW) 2,449 4,046Annual energy produced (GWh) 2,449 4,046
TABLE 8
Commercial/institutional building facade BIPV (2025)
2000 2008 2025
No. of buildings 52,182 59,434 78,368Wall area (m2) 1,797,476,509 2,047,295,229 2,699,477,007Increase in wall area 652,181,779Fraction of facade available for BIPV 25%Fraction of façade with adequate solar irradiation 8%Façade available for PV (m2) 13,043,636PV efficiency (watt/m2) 142Total power (MW) 1,852Annual energy output (kWh/watt) 0.61Annual energy produced (GWh) 1,121
TABLE 6
Residential grid connected PV technical potential in 2025
Single detached Semi attached Row Total
Housing units – to 2008 2,730,349 312,466 382,809 3,425,624Feasible sites 44% 52% 57% 46%Subtotal – feasible housing units 1,201,354 162,482 218,201 1,582,037Housing units– built – 2008–2025 1,133,586 250,533 283,752 1,667,871Feasible sites 59% 65% 75% 62%Subtotal – feasible housing units 668,816 162,846 212,814 1,044,476Total Number of Feasible Housing Units 1,870,169 325,329 431,015 2,626,513Solar Array Size (kW) 3 3 3Technically Feasible (MW) 5,611 976 1,293 7,880Annual Energy (GWh) 5,611 976 1,293 7,880

○ ○ ○ ○ ○ ○ ○ ○ ○ ○ ○ ○ ○ ○ ○ ○ ○ ○ ○ ○ ○ ○ ○ ○ ○ ○ ○ ○ ○ ○ ○ ○ ○ ○ ○ ○ ○ ○ ○ ○ ○ ○ ○ ○ ○ ○ ○ ○ ○ ○ ○ ○ ○ ○ ○ ○ ○ ○ ○ ○
VI SOLAR ENERGY 91
Table 9 illustrates that the total technically feasible poten-
tial for PV in Ontario by 2025 is equivalent to 13,778 MW.
TABLE 9
Ontario’s grid connected PV technically feasible poten-tial (2025)
Building type Capacity (MW) Energy (GWh)
Residential rooftops 7,880 7,880Commercial rooftops 4,046 4,046Commercial façade BIPV 1,852 1,120(new buildings)TOTAL 13,778 13,046
T E C H N I C A L P OT E N T I A L F O RS O L A R A I R V E N T I L AT I O N
The current markets for solar air ventilation are primarily
in the commercial/institutional and industrial markets
where large volumes of fresh air are required. These two
markets are analyzed separately due to the different
methods used to report energy use.
Solar Air Ventilation (SAV) for commercial/insti-tutional buildings: This chapter considers the potential
only for new construction occurring between 2008–2025.
By displacing costs associated to new construction with
SAV, the economics improve dramatically and it is
assumed that this market will develop faster than the
retrofit market. Limiting the study to new construction
will underestimate the technically feasible potential
considerably. However, the numbers will more closely
reflect the market potential. Projections on the amount
of new wall area through to 2025 were based on historical
data of buildings, average number of floors, and floor
area in commercial/institutional buildings.36
It is assumed that about 8% of walls on all new
buildings have the potential of using SAV; however it is
estimated that only 10% of those walls are available for
solar air ventilation systems (the remainder being used
for windows, doors, or shaded). This would indicate that
the technically feasible potential would be about 0.8% of
all wall space. Assuming that the necessary mechanisms
to reduce the barriers to this technology are introduced
by 2008 then this would equate to 650,000,000 m2 of
potential wall space and an annual energy output of 10
PJ by 2025 in commercial buildings.
Solar air ventilation for industrial buildings:Estimating the technically feasible potential for industrial
buildings is difficult because building size data is not
readily available. Furthermore, available energy usage data
is not separated between different building loads (such
as process energy and operational building energy needs).
Therefore, it is estimated here that if changes in building
orientation are introduced after 2008 then the sites where
solar can be used could increase from 25% to 50%.38 It is
estimated that SAV has the technical potential to supply
3.95 PJ in the industrial segment by 2025.
TABLE 10
Technical potential of commercial solar air ventilation inOntario by 2025
2000 2008 2025
No. of buildings 52,182 59,434 78,368Wall area (m2) 1,797,476,509 2,047,295,229 2,699,477,007Increase in wall area 652,181,779Fraction of façade with 8%adequate solar irradiationFraction of façade 10%available for solar airventilationFaçade available for solar (m2) 5,217,454Energy output @ 2 GJ/m2 (PJ)37 10
TABLE 11
Current industrial SAV technical potential in Ontario
Feasible Fuel (PJ) Solar (PJ)
Electrical 3.75% 6.34 0.24Gas 3.75% 18.05 0.68Total 24.39 0.91
Total technically feasible potential for Solar AirVentilation (SAV): It is estimated that the technically feasible
potential for SAV in Ontario for new buildings (built after
2008) can be 14 PJ. However, the market considered in this
study represents only about 24% of all non-residential
buildings, and thus the total technical potential could be
in the range of 56 PJ (15,500 equivalent GWh). However,
we have used the lower number (14 PJ) in this chapter.
TE C H N I C A L P O T E N T I A L F O RS O L A R H O T W AT E R ( S H W )
Technical estimates are broken down according to
residential, commercial, and swimming pool sectors.
Residential solar water heating: It is estimated that
2,228,000 residences in Ontario could use solar energy
for heating water. This total could rise to 4,737,000
housing units by 2025 with proper house planning and
adequate solar access legislation in place.39

○ ○ ○ ○ ○ ○ ○ ○ ○ ○ ○ ○ ○ ○ ○ ○ ○ ○ ○ ○ ○ ○ ○ ○ ○ ○ ○ ○ ○ ○ ○ ○ ○ ○ ○ ○ ○ ○ ○ ○ ○ ○ ○ ○ ○ ○ ○ ○ ○ ○ ○ ○ ○ ○ ○ ○ ○ ○ ○ ○
SMART GENERATION: POWERING ONTARIO WITH RENEWABLE ENERGY92
Table 13 summarizes Ontario’s total residential hot
water use by dwelling type.
TABLE 13
Ontario’s residential hot water usage (2001)40
Single Mobiledetached Attached Apartments homes Total
2001 (PJ) 61.7 16.5 30.3 0.8 109.2
Currently 63% of Ontario’s single detached homes
have the technical potential to install a solar water heater.
The average total amount of hot water that can be
supplied using solar currently is about 42% in Ontario.41
The technically feasible potential of SDHW in 2025
relates, to a large amount, to how buildings will be built.
If new homes are installed using current practices (i.e.
no consideration to building orientation as it relates to
southern exposure or seasonal cycles) then technically
feasible potential in 2025 will be 37.1 PJ.
If housing units are oriented correctly to take
advantage of available solar resources and solar access
legislation is enacted to ensure maximum use and
unimpaired access to solar resources, then the potential
rises from 63% of single detached homes to 77% and the
technically feasible potential rises to 56.4 PJ by 2025.
TABLE 14
Solar domestic hot water (SDHW) technically feasiblepotential (2001)
Single Mobiledetached Attached Apartments homes Total
Feasible sites 63% 65% 27% 0%Solar fraction 42% 42% 42% 42%Technically 26% 27% 11% 0%feasibleAnnual solar 16.3 4.5 3.4 0.0 24.2energy (PJ)
TABLE 15
SDHW technically feasible potential (2025) – with planning
Single Mobiledetached Attached Apartments homes Total
Feasible sites 77% 90% 37% 0%Solar fraction 50% 50% 50% 50%Technically 39% 45% 19% 0%feasibleAnnual solar 35.1 15.6 5.7 0.0 56.4energy (PJ)
Commercial Solar Hot Water (SHW): In 2001 the
commercial sector used about 24.8 PJ for its hot water
needs. Natural gas was used to provide close to 95% of the
energy needed to heat water in this sector (oil and electri-
city provided the remainder). The estimated number of
commercial sites where it is technically feasible to use solar
water heating and the potential of solar is listed in the
Table below.42 As most commercial buildings have flat
roofs and are multi-storey (implying low shading issues),
then the fraction of technically feasible sites is not expected
to increase significantly through to 2025. Solar water heating
has the technical potential to provide 8.8 PJ of the hot
water needs of the commercial building segment by 2025.
It should be noted that there is a very high potential
for commercial solar water heating in specific market
segments, most specifically hot water intensive industries
such as food processing, because installed costs are lower
and energy consumption can be very high. More research
is required into this market segment to highlight
opportunities.
S O L A R H E AT I N G O F S W I M M I N G P O O L S
It is estimated that the pool market in Ontario will grow
from 207,000 (1998) to 415,500 by 2025 and that 59% of
pools will continue to be heated (10% from solar). Based
on the present market and business-as-usual scenario,
TABLE 12
SDHW technical feasible percentage of homes
Single detached Attached Apartments (low-rise) Total
2001 Number of housing units 2,456,925 571,540 1,166,475 4,194,940Feasible sites 63% 65% 27% 53%Potential no. of solar units 1,547,863 371,501 309,116 2,228,480
2025 no planning Number of housing units 3,863,935 1,229,560 1,772,427 6,865,922Feasible sites 63% 65% 27% 54%Potential no. of solar units 2,434,279 799,214 478,555 3,712,048
2025 w legislation Number of housing units 3,863,935 1,229,560 1,772,427 6,865,922Feasible sites 77% 90% 37% 69%Potential no. of solar units 2,975,230 1,106,604 655,798 4,737,632

○ ○ ○ ○ ○ ○ ○ ○ ○ ○ ○ ○ ○ ○ ○ ○ ○ ○ ○ ○ ○ ○ ○ ○ ○ ○ ○ ○ ○ ○ ○ ○ ○ ○ ○ ○ ○ ○ ○ ○ ○ ○ ○ ○ ○ ○ ○ ○ ○ ○ ○ ○ ○ ○ ○ ○ ○ ○ ○ ○
VI SOLAR ENERGY 93
pools that are heated using solar energy could grow from
the current 22,500 (2001) to 41,500 pools in 2025.
Currently it is estimated that there are over 22,000
pools in Ontario that are solar heated and it is estimated
that a further 43,000 pools could potentially use solar heat-
ing with a savings of 2.6 PJ of conventional energy sources.
Based on these figures it is estimated that 39% of pools
have the potential of using solar energy, which indicates
a technically feasible market of 120,000 pool installations
by 2025.
P A S S I V E S O L A R D E S I G N ( P S D )
The technically feasible residential potential of PSD in
Ontario is 145 PJ annually by the year 2025, based on
estimates for new house construction in Ontario and on
the feasibility of using solar energy in buildings.
Passive solar energy can play a significant factor in
reducing the energy demand in large buildings. However,
it is beyond the scope of this chapter to cover this wide
topic. There is a lack of current Canadian studies available
TABLE 16
Commercial solar water heating potential
Annual solar Annual solar2001 Technically Typical solar Technically energy (2001) energy (2025)
Building type PJ feasible sites fraction feasible PJ PJ
Schools 2.5 60% 42% 25.2% 0.63 0.92Health care institutions 4.9 60% 42% 25.2% 1.23 3.92Religious institutions 0.8 60% 42% 25.2% 0.20 0.24Other institutions 2.0 40% 42% 16.8% 0.34 0.86Offices 5.1 0% 42% 0.0% – –Retail organizations 2.7 5% 42% 2.1% 0.06 0.10Hotels and restaurants 4.5 40% 42% 16.8% 0.76 2.17Recreational facilities 1.8 40% 42% 16.8% 0.30 0.48Warehouses 0.6 40% 42% 16.8% 0.10 0.12Total 24.8 3.62 8.8
in this area and a proper study should be conducted to
identify the potential and possible mechanisms on how
solar can contribute more to this building sector. The few
existing Canadian reports on this topic indicate that solar
daylighting provides over 25% of the lighting energy
required in large buildings (daylighting refers to the use
of natural light to illuminate buildings rather than relying
on artificial lights powered by electricity).44 The
contribution can be increased to 30–70% where
daylighting designs are used, and this is an important
solar option as lighting loads can account for 10–20% of
electricity use in large buildings. 45
2 . 3 P R A C T I C A L R E S O U R C EAlthough Ontario’s technical solar potential is very large,
its development is constrained by a number of physical
factors, and by what is considered a financially viable
market share.
No recent studies have been done in Canada on levels
of market share as they relate to payback for renewable
TABLE 17
Current (2001) potential for solar pool heating in Ontario43
Resistance Natural Heating Heat Electricityheater gas/propane oil pump (res & heat pumps) Total
Energy supplied by source 3% 39% 0% 6% 9%No. of pools 7,196 87,700 – 14,167 21,363 109,063Energy supplied by source (PJ) 0.3 3.9 – 0.6 0.9 4.8Heater efficiency 100.0% 67.5% 100.0% 100%Energy consumed (PJ/year) 0.3 5.7 0.6 0.9Feasible sites for solar 39% 39% 39% 39%No. of pools with solar potential 2,806 34,203 5,525 8,332 42,535Energy savings (PJ/year) 0.1 2.2 0.2 0.4 2.6Energy savings (GWh/year) 34 620 68 102

○ ○ ○ ○ ○ ○ ○ ○ ○ ○ ○ ○ ○ ○ ○ ○ ○ ○ ○ ○ ○ ○ ○ ○ ○ ○ ○ ○ ○ ○ ○ ○ ○ ○ ○ ○ ○ ○ ○ ○ ○ ○ ○ ○ ○ ○ ○ ○ ○ ○ ○ ○ ○ ○ ○ ○ ○ ○ ○ ○
SMART GENERATION: POWERING ONTARIO WITH RENEWABLE ENERGY94
energy systems. However, it is reasonable to assume that
a significant shift in public attitudes may have occurred
since the late 1980s when the last report on this issue was
done.46 Therefore, it is recommended that the province
initiate a study of this issue as soon as possible.
For the remaining resource estimations of this chapter
the payback acceptance curve that was developed in 1989
by Synergic Resources Corporation was used due to the
lack of a more current model. The figure below shows
the percentage of buyers that would purchase an energy-
saving device for the residential, industrial, commercial
and institutional markets. It is important to emphasize
that currently there is essentially no market demand for
products with greater than a seven to eight-year payback
(except by innovators).47
While institutions and governments often claim to
accept longer paybacks than industry, tight budgets and
capital spending limitations cause only the most cost-
effective measures to be implemented unless the
purchases are legislated.
Manufacturing capacity: Manufacturing plant capacity
can be a limiting factor when large sales growth is
experienced, as it may take a year or more to build new
capacity. Therefore, industrial planning and innovation
needs to be actively fostered and supported by all levels
of government.
Expansion of the workforce: Training of the workforce
can have a major limiting effect to growth. Solar
technologies require labour with special training to
ensure that systems are properly designed and installed,
and that they operate at optimum performance. Current
initiatives such as the Renewable Energy Program of the
Association of Canadian Community Colleges provide a
valuable example of the type of programs that need to
be augmented and designed for the secondary and post-
secondary systems.48
Access to working capital: The solar industry in Canada
currently consists of small firms. Small businesses
historically have a difficult time accessing capital. Solar
businesses represent unknown territory for most
investors, and therefore have an extremely difficult time
raising capital at favourable terms. This problem
represents a major limit to how fast the solar industry
can grow and to be addressed (for example, through
education initiatives and active industry-government
collaborations).
Access to finance and performance incentives:Although some solar technologies are already cost-
competitive in Ontario when initial costs are accounted
over the life of the system (e.g. solar water heaters, solar
ventilation), others are still not (e.g. grid-connected PV).
Access to finance at attractive interest rates (for example
through interest-free or low-interest revolving loans) is
essential to enable sustained and large-scale adoption of
solar systems, and needs to be coupled with renewable
energy mechanisms that allow system owners to receive
an adequate payment for each kWh of excess power that
their systems produce.
2 . 4 A C C E P TA B L E R E S O U R C E
P H O TOVO LTA I C ( P V )
It is impossible to accurately predict what constitutes an
acceptable market potential of PV in Ontario by 2025
without a prediction of electricity prices and PV cost
reductions, which are beyond the scope of this chapter.
PV is currently not in the same situation as the other
0
20
40
60
80
100
FIGURE 8 Technology acceptance based on payback
Deployment estimates for solar technologies are based
on these curves (with reference to the technical potential
of each solar segment).
In addition, it needs to be considered that a small
industry may be able to sustain double or even triple digit
growth for short periods of time (five years or less) when
the market penetration is extremely small. Moving from
sales of 100 units to 300 units is easier to accomplish than
a sales increase from 100,000 to 300,000 though the
growth rate is still the same. For the analysis of resource
potential, it is estimated that the short-term sustainable
growth of the solar industry is 50% annually.
This estimate assumes that the crucial issues outlined
below will be addressed by policy-makers to thereby achieve
the solar development potential summarized here.

○ ○ ○ ○ ○ ○ ○ ○ ○ ○ ○ ○ ○ ○ ○ ○ ○ ○ ○ ○ ○ ○ ○ ○ ○ ○ ○ ○ ○ ○ ○ ○ ○ ○ ○ ○ ○ ○ ○ ○ ○ ○ ○ ○ ○ ○ ○ ○ ○ ○ ○ ○ ○ ○ ○ ○ ○ ○ ○ ○
VI SOLAR ENERGY 95
solar technologies discussed here, which have payback
periods ranging from 1–10 years, and that have as a main
barrier the financing of systems over a medium (10-year)
time frame.
Nevertheless, it can be safely assumed that PV’s growth
potential is increasing each year as electricity prices grow
and its installation costs are reduced.
The charts below illustrate two potential scenarios.
Scenario 1 assumes that PV prices continue to drop by
5% annually (historical average), electricity prices in
Ontario increase by 4% annually with a starting price of
$0.08 per kWh, and that solar is amortized over 20 years.
In this scenario PV achieves the cost of utility supplied
electricity by 2024.
electricity increases faster (middle of day prices are 50–
100% higher than the rates currently billed) then the cost
crossover point could occur considerably sooner.49
The estimate on potential solar markets in 2025 are
based on the following:
• An early adopters program funded by REM;
• A provincial Net Zero Energy Homes initiative for
new homes;
• A BIPV program on government buildings
and schools.
With an “Accelerated PV Price Drop” scenario with a
cost crossover occurring in around 2015, it is estimated
that 1,263 MW of PV, generating 1,263 GWh, could be
installed on the electrical grid by 2025 with government
support for REMs.
This estimate is comparable to the one suggested by a
recent Pembina Institute/Canadian Environmental Law
Association report (1,000 MW by 2020).50
As the cost crossover point is approached, the issue
of deployment growth becomes one of financing the
installation costs (similar to the current situation faced
by solar domestic hot water systems), rather than that of
the economics of electricity generation from PV.
In addition there are significant industry barriers,
including limits to an industry’s sustainable growth that
must also be addressed before higher PV installation
TABLE 18
PV in Ontario – the market potential (2025)
Early adopters program 1,000 homes a year for 10 years 10,000 homes 30 MW 30 GWhNZEH initiative 2% incremental growth rate of 420,000 homes 1,232 MW 1,232 GWh
new home constructionBIPV demonstration 100 kW per year for 10 years 1 MW 0.6 GWhTotal installed 1,263 MW 1,263 GWh
FIGURE 9 PV cost crossover in Ontario (Scenario 1)
The second scenario uses the cost of electricity at peak
times (assumes 50% above the average). Solar PV
produces electricity during peak times, and the benefits
and savings will be greater if this is taken into con-
sideration. In this scenario the cost of solar is amortized
over 30 years (most PV modules have a 25-year warranty
with a minimum life expectancy exceeding 40 years). In
this scenario the crossover point of solar PV occurs 9 years
earlier, in 2015.
If prices were to drop quickly to $5.50 per watt
installed (currently they are in the range of $10/watt
installed) as has been suggested, or as the peak cost of
FIGURE 10 PV cost crossover in Ontario (Scenario 2)

○ ○ ○ ○ ○ ○ ○ ○ ○ ○ ○ ○ ○ ○ ○ ○ ○ ○ ○ ○ ○ ○ ○ ○ ○ ○ ○ ○ ○ ○ ○ ○ ○ ○ ○ ○ ○ ○ ○ ○ ○ ○ ○ ○ ○ ○ ○ ○ ○ ○ ○ ○ ○ ○ ○ ○ ○ ○ ○ ○
SMART GENERATION: POWERING ONTARIO WITH RENEWABLE ENERGY96
numbers are achievable. The province needs to prepare itself
for the wide introduction of PV on the grid and therefore
it is critical that the provincial government initiates a
number of programs to increase the solar industry’s capacity
to handle rapid growth, and to educate policy and
decision makers on the multiple environmental and social
benefits of PV and its significant expansion potential.
S O L A R A I R V E N T I L AT I O N ( S AV )
Assuming the current annual growth rate of 6.5% for
SAV would mean that the industry would supply 0.31 PJ
of energy by 2025.
Under an accelerated scenario, considering the market
potential for solar air ventilation systems by 2025, it is
assumed that a key caveat is the amount of growth that
the SAV industry can maintain over an extended time
frame. Therefore, it is estimated as an annual growth of
50%, starting in 2008 for five years, and then an annual
growth of 30% thereafter.
TABLE 19
The market potential of SAV in Ontario
Businessas usual Accelerated Increase
Annual growth rate 6.50% 30–50%Annual installed in 2025 (m2) 9,000 825,000 816,000Total installed by 2025 (m2) 156,000 3,586,000 3,430,000Annual sales (2025) $19.5M $363M $343MCost reductions (annual) 0% 1%
In the accelerated scenario it is projected that an
additional 816,000 m2 of solar air ventilation systems
could be installed annually by 2025 in commercial and
industrial buildings in Ontario – this represents the
manufacturing capacity that already currently exists in
Ontario. Although current manufacturing capacity is
focused to satisfy foreign demand, it is estimated that the
industry could manage the expected growth in produc-
tion. The availability of a trained workforce is not
considered to be a barrier as workers can be drawn from
the existing construction industry. By increasing the sales
to the accelerated scenario it is estimated that the SAV
industry could reduce costs by an average of 1% annually
due to economies of scale.
By 2025 the commercial and industrial solar air
ventilation potential in the accelerated growth scenario
would contribute over 7.17 PJ (or the equivalent of 1,991
GWh per year). This solar contribution represents about
50% of the technical potential in this market segment.
S O L A R H O T W AT E R ( S H W )
Two scenarios are considered in this section. The first is
based on a business-as-usual scenario that assumes an
annual growth rate of 10% for the current SHW market.
The accelerated scenario assumes that a financing
program is in place with a pilot program initiated in 2005
(700 systems in two years), which is then followed by
annual sales growth of 50% a year (achieving 5,000 system
installations annually by 2011) for five years and then
growing at current typical international growth rates of
30% over the remaining period (2012–2025).
It is assumed that growth limitations are not relevant
in the SHW industry because there is current capacity in
Canada to manufacture over 40,000 residential systems
annually and the Canadian domestic market is very small
compared to international markets.51
Based on the accelerated adoption scenario, it is
estimated that over 800,000 solar residential hot water
systems could be installed in Ontario by 2025 and a
further 2,000,000 m2 of solar collectors could be installed
for commercial systems.
TABLE 20
SHW market potential (2025)
Businessas usual Accelerated
Total Installed m2 53,000 6,800,000Energy (PJ) 0.103 13.57Energy (eGWh) 29 3,772
Residential m2 35,000 4,800,000Systems 5,800 800,000Energy (PJ) 0.070 9.600
Commercial m2 1,655 2,000,000Energy (PJ) 0.033 3.969
System Cost in 2025 $3,500 $2,290Total Sales (2005–2025) $31M $2,990M
S O L A R H E AT I N G O F S W I M M I N G P O O L S
While this is a mature market that does not require
government support to continue growing at the same rate
as new pool installations – it remains stuck with about a
10% market share for pool heaters. The main impediment
to increasing sales in this market is the lack of customer
familiarity with the product (i.e. insufficient marketing),
a reluctance of pool installers to sell solar systems due to
the perceived complexity of the installation (i.e. lack of
information) and the higher initial investment that is
required for solar systems versus heaters that use non-
renewable energy sources (payback acceptance curve).

○ ○ ○ ○ ○ ○ ○ ○ ○ ○ ○ ○ ○ ○ ○ ○ ○ ○ ○ ○ ○ ○ ○ ○ ○ ○ ○ ○ ○ ○ ○ ○ ○ ○ ○ ○ ○ ○ ○ ○ ○ ○ ○ ○ ○ ○ ○ ○ ○ ○ ○ ○ ○ ○ ○ ○ ○ ○ ○ ○
VI SOLAR ENERGY 97
Removing marketing and education barriers could
improve the market share to 45% based on a three-year
payback acceptance curve for solar pool heaters.
If a financing mechanism was introduced to reduce
payback time to one year, the market share could increase
to close to 100% of its technically feasible market. This
would improve the market for solar pool heating from
the business-as-usual scenario of 41,000 systems installed,
to 120,000 systems by 2025 – representing 29% of all
pools and 49% of all heaters. A large market share in the
heater market is viable as solar heaters do not in all cases
replace an existing heater (e.g. the original heater can be
still be used to back up the solar system).
TABLE 21
The market potential for solar pool heating by 2025
By 2025 Business Acceleratedas usual growth
Installed 41,000 systems 120,000 systemsIncrease 16,500 systems 95,500 systemsSales (2005–2025) $65M $390MEnergy produced in 2025 1.9 PJ 6.6 PJ
No major industry growth barriers exist, as the
Ontario market size is still small and the labour force
could be drawn from the pool industry and summer
students. An accreditation program for the companies
who would install under the proposed incentive program
summarized in Table 24 would ensure that installations
are done properly.
P A S S I V E S O L A R D E S I G N ( P S D )
By improving the building stock of new homes in Ontario
starting in 2008, it would be possible to achieve a market
potential for residential PSD in Ontario by the year 2025
of 86 PJ (or the equivalent of 23,800 GWh) annually. To
visualize the potential of this contribution, consider that
in 2001 Ontario’s total load of space heating required
about 299 PJ of energy, which was provided predomi-
nantly by natural gas.52
2 . 5 O N TA R I O ’ S A C H I E VA B L E S O L A RC O N T R I B U T I O N
O N TA R I O ’ S S O L A R P O T E N T I A L I N 2 0 1 0
As the solar market and the solar industry in Canada is
so small, significant growth must occur before solar
technologies begin to make a significant impact. If the
initiatives recommended in this chapter are implemented
by 2008 then the impact of solar technologies by 2010
will still be at an incipient stage. However, the compound
double-digit growth that solar technologies have
consistently experienced will allow the solar sector to be
a significant source of Ontario’s energy by 2025.
TABLE 22
Solar energy use in Ontario (2010)
Application Solar total (PJ) Total solar systems
ResidentialSolar DHW 0.11 9,500 systemsSwimming pools 1.50 35,000 systemsPV on homes 0.24 25,000 systemsPassive solar heating 29.00 22,000 homesCommercial & InstitutionalSolar hot water 0.04 20,000 m2
PV on roof tops 0.001 300 kWBIPV facades 0.0007 300 kWIndustrial & CommercialSolar air ventilation 0.17 83,000 m2
TotalTotal energy (PJ) 31.06Total energy (GWh) 8,628
O N TA R I O ’ S S O L A R P O T E N T I A L I N 2 0 2 5
Solar energy has the technically feasible potential of
supplying 21% of the energy in the market segments
reported on this study by 2025. Half of this technical
potential could be achieved if the initiatives discussed in
this chapter are implemented. At this level of adoption,
solar energy would provide as much energy in 2025 as
coal did in 1999, or about half the electricity generated
by all of Ontario’s nuclear power plants.
TABLE 23
The market potential for solar by 2025
Application Solar total (PJ) Total solar systems
ResidentialSolar DHW 9.60 800,000 systemsSwimming pools 6.60 120,000 systemsPV on homes 4.54 430,000 systemsPassive solar heating 85.67 420,000 homesCommercial & InstitutionalSolar hot water 3.97 2,000,000 m2
PV on roof tops 0.004 1000 kWBIPV facades 0.002 1000 kWIndustrial & CommercialSolar air ventilation 7.17 825,000 m2
TotalTotal energy (PJ) 117.56Total energy (GWh) 32,656
○ ○ ○ ○ ○ ○ ○ ○ ○ ○ ○ ○ ○ ○ ○ ○ ○ ○ ○ ○ ○ ○ ○ ○ ○ ○ ○ ○ ○ ○ ○ ○ ○ ○ ○ ○ ○ ○ ○ ○ ○ ○ ○ ○ ○ ○ ○ ○ ○ ○ ○ ○ ○ ○ ○ ○ ○ ○ ○ ○
SMART GENERATION: POWERING ONTARIO WITH RENEWABLE ENERGY98
2 . 6 G R O W T H Q U I C K E N S I NN E W M A R K E T S
Surveys of the world’s PV market consistently show that
growth rates of 30% or more have become an established
trend.53 These high growth rates are leading to a general
continuing downward trend in grid-connected PV system
prices.54 Analysis of the long-term outlook for the leading
PV markets of Japan, Germany, and California shows that
these markets will continue to grow.55
The quick rise and sustained buoyancy of the German
and Japanese markets are a direct result of government
implementation of supportive market transformation
policies. Germany’s PV leadership in Europe is a direct
consequence of the implementation of its sophisticated
renewable energy feed-in law, which mandates that
utilities connect PV systems to the electric grid and that
they purchase electricity at fixed minimum prices.
In addition to this key policy strategy, Germany and
Japan have implemented initiatives to provide access to
system finance (“solar roofs” programs), and compre-
hensive education programs that act synergistically to
creative active solar PV markets.56
Markets for solar water and space heating are also
increasing at impressive rates and provide examples of
what can be achieved in Ontario. For example, between
2000 and 2001 these markets grew by 26% per year, while
the market of solar swimming pool heating grew by
23%.57 All solar thermal systems installed by the end of
2001 generated the equivalent of 41,795 GWh (150,463
TJ), which corresponds to an oil equivalent of 6.7 billion
litres, and helped to avoid the annual emission of 18.2
million tonnes of CO2.58
Solar thermal markets are currently dominated by
China’s domestic demand (which has an ambitious
national target of 65 million m2 of solar collectors by 2005
in its 10th Five Year Plan) and by Germany, which has
achieved a ten-fold market expansion since 1991.
Germany currently offers generous market incentives for
thermal systems and is exploring the potential of adapting
its feed-in laws to the solar thermal sector. Other market
success stories include Israel, which 20 years ago
introduced legislation requiring new buildings to place
solar thermal systems on their roofs and can boast today
that 80% of all its residential buildings are now equipped
with solar water heaters.59
3. Policies, mechanisms, andincentives to enhance solarpower implementation
3 . 1 S O L A R E L E C T R I C I T Y ( P V )While all the solar thermal technologies discussed in this
chapter are cost-effective and ready for wide deployment
in Ontario, there are still significant barriers surrounding
the use of PV in grid-connected applications. Govern-
ment involvement is essential to facilitate dismantling key
barriers such as inadequate price incentives, poor access
to finance, and limited public awareness, which are actively
preventing the widespread use of PV in the province.
More specifically, residential and commercial
customer participation in the implementation of grid-
connected PV in Ontario are hampered by:60
• Cumbersome access to the grid for owners of
PV systems;
• Lack of guaranteed premiums for PV-generated
electricity;
• Very limited provincial awareness on the current
options available for using PV and PV’s numerous
financial and non-financial benefits;
• Technological availability and high initial cost;
• Poor financing rates and terms.
Many of these issues can be addressed through strong
program design. However, to maximize provincial
participation it is necessary to have effective policy
mechanisms that go beyond the net-metering approach
currently used in North America. The fact is that without
other financial incentives, net metering is not enough to
increase market penetration as the experience of
California and Texas clearly illustrates.61
The successful PV programs of the two world leaders
on this technology, Japan and Germany, clearly illustrate
the effectiveness of innovative policy mechanisms such
as feed-in laws (referred here as renewable energy
mechanisms or REMs), and the importance of a
combination of other supportive initiatives to overcome
barriers (government support of public education, R&D,
training, access to finance).
REMs have two essential components: stable and
carefully calculated payments for each kWh of PV-
generated electricity (which are regularly reviewed to

○ ○ ○ ○ ○ ○ ○ ○ ○ ○ ○ ○ ○ ○ ○ ○ ○ ○ ○ ○ ○ ○ ○ ○ ○ ○ ○ ○ ○ ○ ○ ○ ○ ○ ○ ○ ○ ○ ○ ○ ○ ○ ○ ○ ○ ○ ○ ○ ○ ○ ○ ○ ○ ○ ○ ○ ○ ○ ○ ○
VI SOLAR ENERGY 99
ensure market development), and the right to connect to
the electricity grid.
The design and implementation of REMs in Ontario
needs to be supported by a provincial PV Deployment
Program that addresses the following issues:
E D U C AT I O N A N D C O M M U N I C AT I O N
• Renewable energy education programs to build
demand for distributed renewables and increase the
public interest in PV;
• Effective tracking and monitoring of program
initiatives to identify and correct barriers to the
wider use of PV.
T E C H N I C A L I S S U E S
• Clear and simple interconnection standards that are
uniform across Ontario and compatible with those
in other provinces;62
• Support for equipment suppliers by facilitating
testing and certification by a standards testing
agency (such as CSA or Measurements Canada),
and by listing in a directory of certified suppliers.
F I N A N C I N G I S S U E S
• Development of favourable financing mechanisms
for customers purchasing distributed renewable
energy systems (e.g. a federal-provincial interest-free
revolving loan system to facilitate purchase of PV
systems);
• Simplified and standardized contracts for potential
PV implementers.
An action plan for mainstreaming PV in Ontario
should focus on a number of separate, yet interdependent
initiatives:
• An early adopters program (for existing homes);
• A net-zero energy home initiative (for new homes);
• A Building Integrated PV (BIPV) demonstration
program using government buildings to showcase
the technology and stimulate learning by doing;
• Solar access legislation including zoning and
building code strategies to protect solar access and
to prepare new homes for PV retrofits (so new
homes can be solar-ready even if systems are not
implemented at the time of construction);
• A PV financing program (e.g. a federal provincially-
sponsored revolving program to provide interest
free loans);
• A public awareness education program.
3 . 2 S O L A R T H E R M A L
S O L A R A I R V E N T I L AT I O N ( S AV )
Currently there are three main barriers to the greater
deployment of SAV systems in Ontario:
• Lack of knowledge about the product and its
features and benefits (including a reluctance of the
design community to specify solar heating);
• A payback period of four to six years (for new
construction), which reduces the potential market
to under 20% of potential buyers using the payback
acceptance curve;
• Owners of commercial buildings are usually not the
energy consumers and there is little incentive for
owners to install energy saving equipment as the
energy bills are passed directly on to the tenants.
If these barriers were eliminated, then the market for
solar air ventilation would achieve the accelerated
scenario by 2025.
Support initiatives for SAV would include solar access
legislation, solar-ready standards and codes for new build-
ings, solar certification and listing in an ad-hoc directory,
tax incentives, and solar procurement by government.
More details are provided on these initiatives below.
S O L A R H O T W AT E R ( S H W )
Currently there are three main barriers to the greater
deployment of solar hot water systems in Ontario:
• Lack of knowledge of the product, its current
features, and numerous benefits.
• Current payback periods of 7–15 years, which reduce
the potential market to under 5% of potential buyers.
• For commercial systems the owners of commercial
buildings are usually not the energy consumers and
there is little incentive for them to install energy
saving equipment as the energy bills are passed to
the tenants.
If these three main barriers were eliminated then the
market for solar hot water systems would achieve the
accelerated scenario by 2025.

○ ○ ○ ○ ○ ○ ○ ○ ○ ○ ○ ○ ○ ○ ○ ○ ○ ○ ○ ○ ○ ○ ○ ○ ○ ○ ○ ○ ○ ○ ○ ○ ○ ○ ○ ○ ○ ○ ○ ○ ○ ○ ○ ○ ○ ○ ○ ○ ○ ○ ○ ○ ○ ○ ○ ○ ○ ○ ○ ○
SMART GENERATION: POWERING ONTARIO WITH RENEWABLE ENERGY100
Support initiatives for SHW would include solar
access legislation, solar-ready standards and codes for new
buildings, solar certification and directory, tax incentives,
expanded tax write-offs, promotion of SWH as part of a
zero-energy home program, and solar procurement by
government. More details are provided below.
S O L A R P O O L H E AT I N G ( S P H )
The primary barriers to wider deployment of solar pool
heating relate to a lack of coordinated marketing and the
need for system financing.
While this market’s energy needs can be considered
as a relatively small fraction of Ontario’s total energy
needs, the solar contribution of this market can be quite
significant (with the equivalent of potential savings of
1,330 GWh annually by 2025).
A government program for solar installations in this
segment can have high synergistic potential to increase
residential and commercial hot water markets and can
be rapidly deployed. It would also send a strong message
to Ontario residents about the government’s commi-
tment to developing solar technologies.
Support for SPH would include solar access legisla-
tion, solar certification and listing in an ad-hoc directory,
special promotion programs, and tax incentives. More
details are provided below.
P A S S I V E S O L A R ( P S )
Many of the initiatives for increasing the deployment of
passive solar to reach maximum market potential by 2025
relate to policy and legislation. Passive solar is cost-
effective now, as it is mainly a design issue with no
significant materials costs. The main barriers to a wider
use of the technology in Ontario include:
• Lack of information on its potential;
• Lack of demonstrations throughout Ontario;
• Builders have no incentive to build houses with a
high solar fraction, as there is no market demand at
the moment nor legislation to ensure the maximum
possible use of PS design;
• Buildings do not have dedicated access to the solar
resource (as right to light and building orientation
issues are not protected by legislation).
Support initiatives for PS would include solar access
legislation, solar certification and directory, promotion
of PS as part of a zero-energy home program, tax credits
for advanced windows, and solar procurement by
government. More details are provided below.
I M P L E M E N T I N G S O L A R I N I T I AT I V E SI N O N TA R I O
The remainder of this section summarizes 14 initiatives
TABLE 24
Summary of policy initiatives to increase solar energy use in Ontario
Technology Program typeInitiative SHW SPH SAV PV PS L M S T
i. Solar access legislation X X X X X Xii. AREM marketing X X X X
iii. Solar ready X X Xiv. Solar financing program X X X Xv. Solar certification & performance directory X X X X
vi. PV early adopters program X Xvii. Expanding corporate income tax write-off X X X
viii. Setting a minimum solar fraction in the building code X Xix. Improve commercial building codes X X Xx. Expansion of existing tax incentives to solar heat X X X
xi. Removal of RST from high energy efficiency windows X Xxii. Solar pool initiative X X X X X
xiii. Solar on government buildings X X X Xxiv. Net Zero Energy Home Initiative X X X X X X
Note:Technology Program TypeSHW – Solar Hot Water L – LegislationSPH – Solar Pool Heating M – MarketingSAV – Solar Air Ventilation S – SupportPV – Photovoltaic T – Tax ChangesPS – Passive Solar

○ ○ ○ ○ ○ ○ ○ ○ ○ ○ ○ ○ ○ ○ ○ ○ ○ ○ ○ ○ ○ ○ ○ ○ ○ ○ ○ ○ ○ ○ ○ ○ ○ ○ ○ ○ ○ ○ ○ ○ ○ ○ ○ ○ ○ ○ ○ ○ ○ ○ ○ ○ ○ ○ ○ ○ ○ ○ ○ ○
VI SOLAR ENERGY 101
recommended for developing Ontario’s solar sector, and
greatly increasing the province’s use of all solar technolo-
gies. These initiatives can also complement existing
federal programs such as the Renewable Energy Deploy-
ment Initiative (REDI) of Natural Resources Canada.63
i. Solar access legislation: Although the use of PV and
solar thermal systems is still rather limited, the time is
fast approaching when these technologies will be within
the reach of most households in Ontario. To maximize
the use of these technologies, provincial and municipal
governments should consider how to safeguard solar
access for future use and for situations where new
building construction obstructs an existing solar system
(thereby reducing energy generation). These issues are
critical to all solar technologies and can significantly
improve the technical potential on new homes.
Currently, existing zoning and various covenants are
instead creating barriers to the use of solar energy by putting
restrictions on the few systems that can be installed on
houses and other buildings. In a number of documented
cases homeowners are now not allowed to install SDHW
systems on roofs, and many municipalities ban the most
basic of solar collectors – i.e. an outdoor clothesline.64
The area of solar legislation and right to sun-light has
lagged far behind the development of solar technologies.
The legal protection of solar access would be a first step
in promoting an increased use of solar energy and would
demonstrate government support for the technology.
ii. Advanced Renewable Tariffs (REMs) – legislationand marketing: A new provincial act or legislation
setting up REMs should be introduced as soon as possible,
to ensure large-scale renewable energy deployment in
Ontario and to support the implementation of solar PV.
Participation in the REMs system will be influenced
by a number of issues:
• Consumer awareness of REMs, and of financial and
non-financial benefits of renewable energy;
• Technology availability and cost;
• Financing rates and terms;
• Ease of implementation;
• The incentive of REMs payments.
To maximize widespread provincial participation in
REMs it will be necessary to have more than just
legislation. Many of these issues can be addressed through
good program design, education campaigns, and good
marketing.
iii. Solar ready: preparing homes for solar tech-nologies: Currently new residential housing units are not
being built with their potential for solar being considered
or designed for upgrading. By preparing a house during
the construction phase for later solar energy use, there
can be significant cost savings. As well, solar systems will
be better incorporated and more aesthetically pleasing.
A “solar-ready” standard needs to be developed and
marketed to builders with the intent of integrating it into
the building code or high performance housing codes.
iv. Solar financing: paying from solar savings: While
the Canadian market for solar technologies continues to
expand faster than the use of conventional energy sources,
having to pay for a solar system in one lump sum puts a
damper on most consumers’ purchasing enthusiasm, and
also restricts the system size that people can afford.
Car dealers would sell few cars if customers were
expected to pay the full sticker price in one payment. How
can it be expected that a large number of consumers will
buy a solar system without favourable financing? If solar
is to be marketed effectively it must be financed by an
agency, which, for tax and investment reasons, is prepared
to take a ten-year investment horizon – thus effecting a
lowering of monthly payments below the value of the
monthly savings.
There are many international examples of solar
financing programs. The German and Japanese solar roof
programs provide valuable templates.65 The aim of such
initiatives is to simplify investment by individuals and
small and medium companies and to bring the monthly
payments of the solar system down below the monthly
energy savings. In this case the payback on solar systems
is immediate and the consumer payback acceptance curve
approaches 100%.
Low interest loans at less than market rates reduce
loan payments and generation costs. This incentive, already
used in a number of countries, takes the form of an interest
rate “buy down”, which allows lenders to offer solar loans
at a reduced interest rate and reduces the overall cost.66
The incentive applied as an interest rate subsidy is a
small share of the total financing, with a lender having to
provide most of the capital. Price distortion is minimal
as the program subsidizes the financing cost and not the
capital cost. The level of total incentive provided through
an interest rate subsidy is much less than with other
approaches and can overcome the major barrier of
payback acceptance.

○ ○ ○ ○ ○ ○ ○ ○ ○ ○ ○ ○ ○ ○ ○ ○ ○ ○ ○ ○ ○ ○ ○ ○ ○ ○ ○ ○ ○ ○ ○ ○ ○ ○ ○ ○ ○ ○ ○ ○ ○ ○ ○ ○ ○ ○ ○ ○ ○ ○ ○ ○ ○ ○ ○ ○ ○ ○ ○ ○
SMART GENERATION: POWERING ONTARIO WITH RENEWABLE ENERGY102
This financing mechanism can be carried out through
a number of different agencies or financing models
including solar banks, solar mortgages, solar leasing or
solar energy service companies (ESCOs). Appropriate
delivery agents would include utilities, conventional
banks, and ESCOs.
However, because there is a lack of an existing example
of this mechanism in Canada, it is unlikely that a private
financing firm would undertake solar financing without
an underwriting of the risks. Government could provide
a “risk subsidy” in the range of 30–50% above standard
interest rates to change this situation.67
A solar financing initiative run by a government
agency would allow this mechanism to enter the market
place and increase confidence in solar technologies. Solar
financing would then slowly evolve onto a number of
potential private financing agencies including utilities
and banks.
v. Solar certification and performance directoryprogram: A number of institutional barriers exist to the
wider deployment of solar domestic hot water (SDHW)
systems in Ontario. Many of these relate to a lack of codes,
standards and guidelines, and to a lack of knowledge on
the part of decision-makers. As a direct result, there have
been recent examples in Canada where building permits
have been denied for the installation of SDHW systems68,
homes in which SDHW systems have been installed are
denied insurance coverage and insurance policies
threatened to be cancelled, and water heater rental
organizations have stated that they will void service
contracts if a SDHW system is installed onto the
customers’ rented water heater.69
Before solar domestic hot water systems begin to be
deployed on a large scale in Ontario these barriers must
be removed. It is expected that there will be an updated
CSA certification available for SDHW systems in place
by the fall 2004. However the solar manufacturing firms
in Canada are small and with the current low sales volume
in Canada, it is not expected that many firms would
submit their systems for testing and certification without
government financial support.
vi. PV early adopters program: PV-generated electricity
is not yet an economically viable alternative to con-
ventional electrical generation – the payback for
individual customers currently exceeds 25 years. Yet the
PV industry in Canada is, each year, increasing its sales
into the grid connected markets, and these sales cannot
be explained by using a conventional payback acceptance
curve. These sales in fact represent an “early adopter”
market. While this market is small, it should be nurtured,
as it is essential for public familiarization with the
technology, and for industry to prepare for mass
deployment in the future.
The program proposed would include:70
• PV systems to be installed over a 10-year period
(1,000 per year);
• Systems that would average 3kW;
• Favourable REMs that would be guaranteed for 20-
year period from date of installation;
• Program would last 20 years.
vii. Expanding the 100% corporate income tax write-off for electrical generation: Currently there is a
proposed 100% provincial corporate income tax write-
off for the cost of assets used to generate electricity from
renewable energy sources. Solar heating is currently not
eligible for the write-off. This write-off should be
expanded to include renewables that generate heating and
cooling.
viii. Setting a minimum solar fraction in the build-ing code: Currently, while the Ontario Building Code
mandates certain minimum levels of energy efficiency
in house construction, it does not set standards for solar
fraction. With the advent of simple computer simulations
on home energy demands it is possible for builders to
determine a building’s solar fraction.
It is recommended that a minimum solar fraction for
all new homes be set at 25% as a requirement in the
Building Code.
ix. Improve commercial building codes: Commercial
Building Codes should also be improved to include the
requirements for on-site energy generation using PV and
minimum fractions of solar thermal. There are no
commercial building sites in Ontario that could not use
active solar technologies if the building is designed and
sited for solar use during the building design stage.
x. Expansion of existing tax incentives to solar heat:Currently there are a variety of tax incentives available,
or being implemented, that are targeted for either
residential renewable systems (electricity and heat) or
corporations (for electricity produced from renewable
energy sources). However, solar air ventilation systems
are excluded. By expanding existing tax incentives to

○ ○ ○ ○ ○ ○ ○ ○ ○ ○ ○ ○ ○ ○ ○ ○ ○ ○ ○ ○ ○ ○ ○ ○ ○ ○ ○ ○ ○ ○ ○ ○ ○ ○ ○ ○ ○ ○ ○ ○ ○ ○ ○ ○ ○ ○ ○ ○ ○ ○ ○ ○ ○ ○ ○ ○ ○ ○ ○ ○
VI SOLAR ENERGY 103
include solar heat, the payback for systems will become
more attractive for commercial energy consumers.
Currently there is an RST rebate for the purchase of
qualifying building materials incorporated into com-
mercial facilities to generate electricity from renewable
energy or energy from deep lake water-cooling facilities.
Commercial applications using solar heating are currently
not eligible. By amending this limitation to include
renewables that generate heat energy, the price difference
between a solar air ventilation wall and a metal wall will
be reduced to about 15% and would make the installation
of solar air ventilation cheaper than a brick wall.
xi. Removal of RST from high efficiency windows:The principle of tax shifting has already been partially
initiated in Ontario by the removal of retail sales tax
(RST) from solar equipment and hybrid cars.
The principle of tax shifting should be expanded to
include removal of RST on high efficiency windows (these
windows can make a significant effect on lowering the
heating needs of a home). Like other solar products the
RST should be removed from solar windows to promote
their contribution of energy to Ontario’s energy mix.
xii. Solar pool initiative: Swimming pools are considered
by many as a luxury item and the use of conventional
energy sources such as electricity and natural gas for their
heating entails environmental problems. Today there are
more than 100,000 pools in Ontario that are heated using
natural gas or electricity. Various jurisdictions in Europe
and the U.S. have limited the used of conventional heaters
for swimming pools.71
A combination of a 20% tax on pool heaters using
a non-renewable energy source (natural gas and
electricity) and a loan program with an interest rate
subsidy for solar pool heaters would reduce the costs of
solar systems to under a 2-year payback. Increased
taxation on pool heaters using non-renewable energy
sources would be in place permanently while the loan
program (with five-year terms) could be in place for 10
years starting in 2005. It is estimated that the pool heater
tax would raise $27 million over the 10-year period and
these funds could be directed to fund solar programs
around Ontario.
A long-term, local, focused marketing program is
proposed that would run in conjunction with the
proposed tax on pool heaters that use non-renewable
sources. NRCan marketing in Vancouver, Niagara Falls,
and Montreal illustrated their effectiveness.72
xiii. Solar on government buildings: This program
would target the deployment of PV systems on govern-
ment buildings and schools with the target of installing
100 kW per year on high profile buildings. The purpose
is to expose architects and builders to the potential of using
PV as a building material. BIPV can be cost-competitive
much faster than rooftop PV as it displaces conventional
building materials. If the cladding material it displaces is
expensive (i.e. granite or architectural glass curtain walls)
then PV can be competitive in a short timeframe.
xiv. Net Zero Energy Home (NZEH) initiative: By
removing the GST and PST for a limited time from new
NZEH homes, the cost of a NZEH would be equal to a
conventional home.
The target would be to have all new homes built by
2030 to integrate on-site energy generation using PV, solar
hot water, passive, and other technologies. The target by
2025 would be to have 40,000 new homes a year installed
with SDHW.
4. Conclusions and further research
Ontario has a unique opportunity to take advantage of
its solar resources for the generation of clean and reliable
electricity and heat. Solar technologies allow the
generation of electricity and heat unhindered by volatile
fuel costs. They also represent a growing industry able to
generate large numbers of good quality jobs.
Ontario could join leading jurisdictions in grid-
connected PV by designing and enacting renewable
energy mechanisms (REMs) to provide stable prices for
electricity generated by PV systems and to ensure the right
to interconnection of these systems to the province’s grid.
REMs are a key policy strategy that needs to be
complemented by a series of strategic solar initiatives
(summarized in Table 24), which will enable the province
to address effectively existing financial, education, and
public awareness barriers currently hampering the
deployment of solar technologies in Ontario.
It should be noted that many of the incentives identified
for solar systems would not be needed if the environ-
mental and public health costs of conventional energy
sources were included in their price or if the current sub-
sidies to the fossil fuel and nuclear sectors were phased out.
Further research is required to quantify and regularly
update the environmental, social, and grid infrastructure
costs of current forms of electricity generation. This is

○ ○ ○ ○ ○ ○ ○ ○ ○ ○ ○ ○ ○ ○ ○ ○ ○ ○ ○ ○ ○ ○ ○ ○ ○ ○ ○ ○ ○ ○ ○ ○ ○ ○ ○ ○ ○ ○ ○ ○ ○ ○ ○ ○ ○ ○ ○ ○ ○ ○ ○ ○ ○ ○ ○ ○ ○ ○ ○ ○
SMART GENERATION: POWERING ONTARIO WITH RENEWABLE ENERGY104
an essential step to ensure more accurate price compari-
sons between distributed generation options, such as PV,
and fossil fuel and nuclear-generated electricity. In
addition, a detailed analysis of the total available surface
to install solar systems (similar to that currently underway
to map wind resources) needs to be commissioned to
increase public awareness and to facilitate market
participation.
S O L A R P L A N T A B O O S T T OO N TA R I O ’ S E C O N O M Y
A major solar cell manufacturing plant in southwesternOntario is helping put Canada on the map as a leaderin renewable energy.
Cambridge, Ontario, is home to Canada’s first full-scale solar cell manufacturing plant, which opened inJune 2004. Automation Tooling Systems (ATS) expectsits 193,000 square foot facility will soon will beproducing revolutionary new photovoltaic technologyin commercial quantities.
Not only will it expand Canada’s presence in theglobal photovoltaic marketplace, the plant will alsocreate 200 jobs and the investment of more than $100million in the Canadian economy by the end of 2005.
Currently, the primary markets of this solarmanufacturer are international. Changes in the publicpolicy environment could establish significantdomestic opportunities for this and other Ontario-based solar industries.
ATS expects its solar technology will accelerate
the adoption of solar energy by consumer andcommercial users – and open new mainstreamapplications because it can be manufactured cost-effectively. The resulting solar cells are pliable,lightweight, durable, and can be produced in a varietyof colours that suit seamless integration withtraditional building materials.
The solar cells use silicon to convert sunlight intoelectricity. This new technology incorporatesthousands of tiny silicon spheres, bonded betweenthin flexible aluminumfoil substrates to formsolar cells. Developedin Canada using Can-adian engineeringand scientific expertise, the technology is consideredto be major breakthrough for the estimated $3.4billion global solar photovoltaic industry.
The Cambridge facility will produce 20 megawattsper year, capable of providing electricity for one yearfor 6,000 homes.

○ ○ ○ ○ ○ ○ ○ ○ ○ ○ ○ ○ ○ ○ ○ ○ ○ ○ ○ ○ ○ ○ ○ ○ ○ ○ ○ ○ ○ ○ ○ ○ ○ ○ ○ ○ ○ ○ ○ ○ ○ ○ ○ ○ ○ ○ ○ ○ ○ ○ ○ ○ ○ ○ ○ ○ ○ ○ ○ ○
VI SOLAR ENERGY 105
G E R M A N C I T Y A S O L A R S U C C E S S
Freiburg is considered the solar capital of Germany.Solar panels are commonly found on homes, hotels,sports arenas, schools, businesses and institutes inthis city of 200,000 people.
Home to hundreds of environment-relatedcompanies, Freiburg is the envy of urban areasattempting to capitalize on the green energyboom.
Freiburg is host to Solar Fabrik, Germany’slargest manufacturer of installation-ready solarmodules. Solar Fabrik operates a zero emissionsfactory, Europe’s first CO2-neutral productionfacility for solar modules. The facility uses acombination of solar panels and solar design toachieve zero emissions.
Freiburg, a university city, is also home toEurope’s largest solar energy research instituteand Germany’s first emission-free hotel.
C H I C A G O : A G R E E N L E A D E R
In 2001, the city of Chicago launched an aggressivecampaign to make it the most environmentallyfriendly city in the world. In just three years, thecity has become a clean energy leader by bringingrenewable and efficient energy to government,homes and businesses.
Chicago set a goal to purchase 20 percent ofits municipal power from renewable energy by 2006– it has already reached 15 percent and expects tohit the 20 percent target two years ahead ofschedule. Chicago is now one of the largest non-utility purchasers of renewable energy in the U.S.It expects to cut energy costs by a total of $260million by 2010.
The city has also launched a program thatprovides various incentives to help city residentsbuy and improve historic bungalows. The programoffers loans, energy conservation grants, freearchitectural assistance, and streamlined permitsto anyone who purchases a bungalow for upgrad-ing. In addition, the city supplies vouchers forenergy-efficient appliances and matching grants forefficient windows, doors and insulation.
The city is supporting transformations to largemanufacturers such as metal casters, chemicalproducers and sweets manufacturers. Each year,Chicago chooses one industry and helps it toimprove energy use, prevent pollution and prospereconomically. The goal is to achieve energy savingsof 10 to 25 percent for each company.

○ ○ ○ ○ ○ ○ ○ ○ ○ ○ ○ ○ ○ ○ ○ ○ ○ ○ ○ ○ ○ ○ ○ ○ ○ ○ ○ ○ ○ ○ ○ ○ ○ ○ ○ ○ ○ ○ ○ ○ ○ ○ ○ ○ ○ ○ ○ ○ ○ ○ ○ ○ ○ ○ ○ ○ ○ ○ ○ ○
SMART GENERATION: POWERING ONTARIO WITH RENEWABLE ENERGY106
S O L A R C H A P T E R N O T E S
1 Although there are a few provincial studies that focus onspecific solar technologies studies; for example see:Smiley, E. (2002). Green Energy Study for BritishColumbia Phase 2: Mainland Building IntegratedPhotovoltaic Solar and Small-Scale Wind. Burnaby:BCIT Technology Centre. Available at http://www.bchydro.com/rx_files/environment/environment3929.pdf
2 Chart supplied by Doug McClenahan, NRCan –presentation at CanSIA Forum – 2002.
3 Natural Resources Canada. (2000). A Buyer’s Guide toSolar Water Heating Systems. Ottawa: NRCan. Availableat www.canren.gc.ca/app/filerepository/AC5201041AFA42A1BFD51EA128F787CF.pdf
4 Ciorba, U., Pauli, F., Menna, P. (2004). Technical andeconomical analysis of an induced demand in thephotovoltaic sector. Energy Policy, 32 (8), 949–960.
5 Maycock, P. (2004). PV market update. Renewable EnergyWorld, 7 (4), 86–101.
6 Ibid (note that all decimal figures were rounded up).7 Sawin, J.L. (2004). Mainstreaming Renewable Energy in
the 21st Century. Washington DC: Worldwatch Institute.Available at www.worldwatch.org, also see Makower, J.,Pernick, R., Friendly, A. (2003). Solar OpportunityAssessment Report. Washington, DC: Solar CatalystGroup. Available at www.solarcatalyst.com
8 Ibid. Sawin 2004.9 Maycock (2004) op.cit. Note 5. These two key factors,
guaranteed REMs for 20 years and long-term financingprograms, have helped Germany to become a worldleader in PV.
10 International Energy Agency Photovoltaic Power SystemsProgramme. (2002). Trends in Photovoltaic Applications:Survey report of selected IEA countries between 1992 and2002. Available at www.iea-pvps.org
11 Weiss, W., Bergman, I. and Faninger, G. (2004) SolarHeating Worldwide: Markets and Contribution toEnergy Supply. Gleisdorf, Austria: IEA Solar Heating &Cooling Programme. Available at www.iea-shc.org/welcome/welcome_page.htm
12 See Stryi-Hipp, G. Germany’s case study in Weiss, W.(2004). Solar heating systems: status and recent develop-ments. Renewable Energy World, 7 (4), 214–225.
13 Ibid. The act currently under design, known as theRegenerative Heating Act, would operate as Germany’sRenewable Energy Act by placing a levy on conventionalheating sources (primarily oil and gas), and use theproceeds from the levy to pay a premium for every kWhof heat generated by renewable sources.
14 Market demand for solar PV has been growing at a rateof 30–40% per year for the past five years and couldapproach 50% growth in 2004 through demand in theboom markets of Japan, Germany and since 2000California for details see Eckhart, M. (2004). Growth
Markets for PV: PV market outlook is bullish. RenewableEnergy World, 7 (4), 191–195.
15 For more details about PV technology see www.iea-pvps.org
16 Peuser, K., Remmers, H., Schnauss, M. (2002). SolarThermal Systems: Successful Planning and Construction.Berlin: Solarpraxis.
17 Natural Resources Canada. (1999). Potential for SolarHeating of Outdoor Residential Pools to 2020. Ottawa:NRCan.
18 For more details on hybrid systems see CANMET’shybrid info publications at http://cetc-varennes.nrcan.gc.ca/en/er_re/pva_sapv/p_p.html
19 Natural Resources Canada. (2002). Renewable Energy inCanada: Status Report. Ottawa: NRCan. Available athttp://www2.nrcan.gc.ca/es/oerd/english/View.asp?x=700
20 See Islam, M., Fartaj, A. Ting, D. (2004). Current utili-zation and future prospects of emerging renewableenergy applications in Canada. Renewable and Sustain-able Energy Reviews, 8 (6) 493–519.
21 Personal communications with Xantrex, TDL, SSP, andConserval, 2003–2004.
22 For more information on the job skills required for therenewable and details on the job areas directly connectedto the solar industry see Peartree Solutions. (2003).Situation Analysis of the Knowledge, Competencies, andSkill Requirements of Jobs in Renewable Energy Tech-nologies in Canada. Ottawa: Industry Canada.
23 According to Peartree Solutions (2003) employmentestimates: PV industry = 1,000 jobs; solar water industry= 120 jobs; and solar air industry = 60 jobs. According toNRCan, the Canadian PV industry generated revenues of$100 million and employed approximately 615 people in2003, for more details see Ayoub, J. and Dignard Bailey, L.(2003). Photovoltaic Technology Status and Prospects:Canadian Annual Report 2003. Ottawa: Natural ResourcesCanada. Available at http://cetc-varennes.nrcan.gc.ca/en/er_re/pva_sapv/p_p.html
24 Discussions with TDL, Enerworks, Solcan, Conserval inFebruary, 2004
25 Industry Canada. (2003). Unleashing the Potential of On-Grid PV in Canada: An Action Plan to make PV an integralComponent of Canada’s Energy Future. Ottawa: IndustryCanada. Available at www.cansia.ca/canreports.htm
26 The range of recent estimates of PV employment (perMW of PV) indicate: 82 jobs (from note 50); 35.5 jobs(*Clean Edge); 30 (*REEP); 184.6 (*CAL SEIA); 13–32(*Massachusetts Institute of Technology); 36.6 (*Vermont)for units of measure and information for all afore-mentioned sources indicated by the sign * see Weissman,J. (2004). Interstate Renewable Energy Council WorkingMemo: Workforce Development Labor Forecasts & JobTrends for the Solar and Renewable Energy Industries.Latham, New York: Interstate Renewable Energy Council.Available at http://www.irecusa.org/ Also see Kammen,

○ ○ ○ ○ ○ ○ ○ ○ ○ ○ ○ ○ ○ ○ ○ ○ ○ ○ ○ ○ ○ ○ ○ ○ ○ ○ ○ ○ ○ ○ ○ ○ ○ ○ ○ ○ ○ ○ ○ ○ ○ ○ ○ ○ ○ ○ ○ ○ ○ ○ ○ ○ ○ ○ ○ ○ ○ ○ ○ ○
VI SOLAR ENERGY 107
D. Kapadia, K and Fripp, M. (2004). Putting Renewablesto Work: How Many Jobs Can the Clean Energy IndustryGenerate? Berkeley: University of California, Renewableand Appropriate Energy Laboratory. Available at http://ist-socrates.berkeley.edu/~rael/
27 Ayoub and Dignard Bailey (2003) op.cit note 23.28 See Islam et al. (2004) op. cit. note 20.29 For more details see NRCan’s solar radiation atlas
available at http://atlas.gc.ca/site/english/maps/archives/5thedition/environment/climate/mcr4076
30 PV Build Cool, www.pvcoolbuild.com, EuropeanCommission (under the 5th Framework, contract No.NNE5/2000/115) provides definitions of appropriatebuilding surfaces which include:• Flat Roofs: The definition of a flat roof used is a roof
with an angle of between 0o–15o. These surfaces willrequire a support rack to maximize yearly energyproduction andproper liquid flow for active systems, and special
measures need to be taken to insure watertightconstruction.
• Pitched Roofs: These are defined as roofs between 15o–75o. A support rack may be required in some applicationsto maximize energy production, however, this type ofsurface is the easiest to install on for small systems. Systemscan be surface-mounted, integrated, or rack-mounted.
• Façades: A façade is defined as construction between75o–115o. System types could include closed façade(curtain walls) that are not part of the main constructionof the building but forms a protective skin on theoutside (i.e. windows, see-through PV modules), andopen façade (rain screens) that is an open system thatis mounted to the front of the façade.
31 Based on data from: Natural Resources Canada. (2004).Energy Use Data Handbook 1990 to 2002. Availableonline at http://oee.nrcan.gc.ca/neud/dpa/home.cfm?PrintView=N&Text=N
32 Ibid.33 See Housing Market Indicators, Ontario, 1990–2002 in
Canadian Mortgage and Housing Corporation. (2003).Canadian Housing Observer. Ottawa: CMHC. Availableat www.cmhc-schl.gc.ca/en/cahoob/index.cfm
34 See Natural Resources Canada (2004) op.cit. note 31.35 EnerCity Guide – Draft; European Commission.36 See Natural Resources Canada (2004) op.cit. note 31.37 Estimate on energy production provided by John
Hollick, Conserval Engineering, May 26, 2004.38 The calculations presented here rely on the same
methodology as a 1993 NRCan report (the most currenton this topic), which estimated that 3.75% of air ventila-tion heating needs could technically be provided by SAVsee NRCan (1993). Solar Heating in Canada to the Year2020. Ottawa: NRCan.
39 Ontario, and most of Canada, had a body of commonlaw in place to ensure homeowners’ right to the sunlightfalling on their property until the early 1900s when these
laws were abolished due to pressure exerted by housingdevelopers (see Planning Measures to Safeguard SolarAccess for Buildings in Ottawa”; Discussion PaperCD164–6, City of Ottawa Community DevelopmentDepartment, 1981). In the U.S., many state solar accesslaws were enacted in the late 1970s. These laws usuallyinclude both covenant restrictions and solar easementprovisions. The states’ covenant restrictions preventplanning and zoning authorities from prohibiting orunreasonably restricting the use of solar energy. Solaraccess laws have been implemented in California,Colorado, Hawaii, Indiana, Massachusetts, Minnesota,Montana, Nebraska, Nevada, New Mexico, New York,Utah, Wisconsin, and Wyoming for more details see NewZealand Energy Efficiency & Conservation Authority &Solar Industries Association of New Zealand. (2002).Review of Overseas Initiatives that have been taken toIncrease the Uptake of Solar Water Heating. Available atwww.solarindustries.org.nz/documents/overseas_initiatives.pdf
40 See Natural Resources Canada (2004) op.cit. note 31.41 See Natural Resources Canada (2000) op.cit. note 3.42 Based on Natural Resources Canada (2004) op.cit. note 31.43 See Natural Resources Canada (1999) op.cit note 17 –
data prorated to 2001 which is being used here as thebase year.
44 Natural Resources Canada. (1989). Passive Solar Potentialin Commercial Buildings: Four Case Studies. Ottawa:NRCan.
45 Energy Research Group. (1994). Daylighting in Buildings.Dublin: School of Architecture, University College Dublin.Available at www.cordis.lu/opet/src/thrm029.htm
46 Referenced in Natural Resources Canada. (1993). ActiveSolar Heating in Canada to the Year 2010. Ottawa: NRCan.
47 The term ‘innovators’ is used to note a certain percentageof individuals will purchase a new product or technologyregardless of the economics. These innovators currentlyaccount for a significant proportion of solar customers.There has not been a study done in Canada to determinethe percentage of Canadians that could be consideredpotential innovators of solar – this is the current marketfor solar technologies until existing barriers are removed.
48 For more details about this innovative educationalprogram see Renewable Energy Program of the Associa-tion of Canadian Community Colleges at www.accc.ca/english/services/renewable_energy_links.cfm
49 Projections supplied by Spheral Solar Products, May 2004.50 See Winfield, M.S., Horne, M., McClenaghan, T. and Peters,
R. (2004). Power for the Future: Towards a SustainableElectricity System for Ontario. Calgary: Pembina Institutefor Appropriate Development, and Canadian Environ-mental Law Association available at www.pembina.org
51 Personal communication with Enerworks and Thermo-Dynamics, May 2004.
52 See Natural Resources Canada (2004) op.cit. note 31.53 See Maycock (2004) op.cit. note 5.

○ ○ ○ ○ ○ ○ ○ ○ ○ ○ ○ ○ ○ ○ ○ ○ ○ ○ ○ ○ ○ ○ ○ ○ ○ ○ ○ ○ ○ ○ ○ ○ ○ ○ ○ ○ ○ ○ ○ ○ ○ ○ ○ ○ ○ ○ ○ ○ ○ ○ ○ ○ ○ ○ ○ ○ ○ ○ ○ ○
SMART GENERATION: POWERING ONTARIO WITH RENEWABLE ENERGY108
54 For specific country figures see the system prices sectionof the International Energy Agency’s Photovoltaic PowerSystems Programme at www.oja-services.nl/iea-pvps/topics/i_costs.htm
55 Eckhart (2004) op.cit note 14.56 See Sawin, J. (2004). National Policy Instruments: Policy
Lessons for the Advancement and Diffusion of RenewableEnergy Technologies Around the World. Bonn: Secretariatof the International Conference for Renewable Energies.Available at www.renewables2004.de/pdf/tbp/TBP03-policies.pdf
57 Weiss and Faninger (2004) op.cit. note 11.58 Ibid.59 See Weiss and Faninger (2004, p.222) op.cit. note 11.60 Some of these issues have been previously analyzed in
Pape, A. (1999). Clean Power at Home. Vancouver: TheDavid Suzuki Foundation.
61 Net Metering is usually understood as measuring theelectricity used in a building versus the electricitygenerated using a renewable energy system. This calculationresults in a ‘net’ energy total from which an electricity billis calculated. Sawin (2004, p.6) op.cit note 56 observesthat California and Texas did not achieve positive resultsfrom net metering for wind power or PV, and onlyachieved positive results until other incentives wereadded to the mix. Although her research indicates thatnet metering might have greater impact if privategenerators were to receive time-of-use rates for theelectricity the generate the fact remains that feed-in lawshave been successfully used to make countries such asGermany into world leaders in renewable energytechnologies such as PV.
62 For more information about a national initiative todevelop and implement a Canadian guideline for theinterconnection of small, distributed power sources seeMicroPower Connect’s web site at www.micropower-connect.org
63 For more details about REDI see http://www2.nrcan.gc.ca/es/erb/erb/english/view.asp?x=455
64 Discussions with Peter Sajko, Thermodynamics Ltd inMay 2004 – situation in NS.
65 See Sawin (2004) op. cit. note 56.66 New Zealand’s government program provides subsidies
for those customers who take out a loan for solardomestic water system and the subsidy is equal to theinterest rate for the first year for more details see SolarIndustries Association of New Zealand at www.solarindustries.org.nz. In the US the states of California(SMUD), Idaho, Iowa, Nebraska, Oregon, Virginia, andTexas all have financing programs in place with lowinterest loans backed by the government or utilities (seeNZ Energy Efficiency & Conservation Authority and NZSolar Industries Association (2002). Review of OverseasInitiatives that Have Been Taken to Increase the Uptake ofSolar Water Heating. Available at www.solarindustries.org.nz/info_solar.html#pub). India has over 100,000such loans outstanding for solar water heating systemsand this mechanism has now been introduced into thePV market and has already funded approximately 18,000solar electric homes see Painuly, J. Usher, E. (2004).Got finance? A model to develop the PV market in SouthIndia. Renewable Energy World, 7 (1), 86–93.
67 Canadian Solar Industries Association. (1983). ThirdParty Financing of Solar Energy Systems – Phase 1 Report.Ottawa: CanSIA.
68 Presentation at the CanSIA 2003 forum, November 2003– City of Ottawa is currently not allowing the installationof any solar DHW system which is not CSA certifiedhowever the testing procedure for the standard is not inplace yet.
69 Discussions with George Hay, May 200470 A similar system is suggested by Rowlands, I. (in press).
Envisaging feed-in tariffs for solar photovoltaic electricity:European lessons for Canada. Forthcoming in Energy Policy.
71 Discussions with Joe Thwaites, Taylor Munro Energy,and Dan Takahashi, Enersol.
72 NRCan ran small focused marketing programs in theearly 2000s in Vancouver, Niagara Falls and Montreal,and there was a significant increase in public awarenessin these regions. As the programs were extremely limited(one year long) and no monitoring of sales was done it isimpossible to judge the success of the programs. However,industry members in the areas where the programsoccurred have stated that it did have a positive impact ontheir sales over the following year (discussions with JoeThwaites, Taylor Munro Energy Systems, May 2004).

GeneratingGenuine Wealth
109
7
After years of neglect, Ontario is in a unique
position to transform its power system in a truly
sustainable manner. Renewable energy and conservation
will help protect the environment and public health while
strengthening the economy, creating a brighter and better
future for Ontario. Investing in renewable energy sources
will give Ontario the most reliable electricity system, cost-
effective power, cleaner air, and new jobs.
For example, in terms of jobs, if the renewable energy
options summarized in Table 3 of the introduction are
fully implemented by 2010, Ontario could have 25,000
people working in the renewable energy sector. By 2020
this sector could employ 77,000.1
The most sustainable path forward for Ontario is
investment in energy efficiency, the creation of a conser-
vation culture, and strong support for renewable energy.
Taking advantage of these opportunities will require
effective policy decisions that: create stable demand for
renewable energy technologies; ensure favourable access
to the electricity grid at fair prices; facilitate low-cost
financing; provide tax incentives; legislate standards;
support education initiatives; and encourage active
stakeholder participation.
Effective policies will also help ensure the province’s
renewable sources are tapped in a sustained and stable
manner, positioning Ontario as a North American leader
in renewable energy.
All forms of electricity in Ontario have been or are
currently subsidized. The playing field, however, is very
unequal. If direct and indirect subsidies to conventional
sources of electricity were removed, and the immense
environmental and public health costs associated with
fossil fuel and nuclear energy were included, renewable
energy would not require the degree of support
outlined in this report. Even with the modest subsidies
recommended, renewable energy is the most cost-
effective, reliable, sustainable solution to Ontario’s
electricity crisis.
Currently, Ontario is relying on polluting coal-fired
power plants and aging nuclear plants. It’s an unsustain-
able combination – coal plants contribute to southern
Ontario’s poor air quality and summer smog, while
nuclear plants are plagued with unresolved safety issues,
chronic underperformance, and massive cost overruns.
The large scale adoption of natural gas electricity plants
is plagued with problems: dwindling domestic supply,
price volatility and greenhouse gas emissions. Moreover,
all of these centralized plants exacerbate the problems of
Ontario’s expensive and increasingly fragile transmission
grid. Getting out of this crisis is not possible with the
same type of thinking that led us into it.
Because of their distributed nature, renewable energy
technologies offer the most reliable, stable, and cost
effective options for new energy. It is time for Ontario’s
priorities to change.
So far, the province has set a modest goal to have 2,700
megawatts of renewable energy generation by 2010
(about 10 per cent of Ontario’s current total installed
capacity). Smart Generation: Powering Ontario with
Renewable Energy shows that the province can achieve a
much larger target.
Smart Generation urges Ontario’s decision makers to
develop five sources of renewable energy – wind, hydro-
electricity, biomass, geothermal, and solar – while creating
a strong focus on conservation and energy efficiency.
In light of the Ontario government’s promise to shut
down the province’s coal-fired power plants by 2007, the
need for sustainable alternatives has never been greater.
Conclusion

○ ○ ○ ○ ○ ○ ○ ○ ○ ○ ○ ○ ○ ○ ○ ○ ○ ○ ○ ○ ○ ○ ○ ○ ○ ○ ○ ○ ○ ○ ○ ○ ○ ○ ○ ○ ○ ○ ○ ○ ○ ○ ○ ○ ○ ○ ○ ○ ○ ○ ○ ○ ○ ○ ○ ○ ○ ○ ○ ○
SMART GENERATION: POWERING ONTARIO WITH RENEWABLE ENERGY110
Confronting the serious public health consequences
of coal-fired utilities creates an unparalleled opportunity
to dramatically reduce the province’s and the country’s
greenhouse gas emissions, addressing the most urgent
crisis confronting humanity in the 21st century – climate
change. Phasing out coal with conservation, efficiency,
and renewable energy would reduce greenhouse gas
emissions by about 38.4 megatonnes from 2000 levels.2
This reduction represents 16 percent of Canada’s Kyoto
target.3
As illustrated throughout this report renewable energy
options are already here and they are working with great
success in countries as diverse as Germany, Spain, and
Japan. Ontario has a lot of catching up to do. But it can
be done.
Ontarians can continue to take the province down
the unsustainable road of boosting supply by continuing
to finance highly centralized, polluting and volatile
sources such as natural gas or nuclear power, or can
instead take a sharp turn towards investing in a healthier,
reliable, and locally based electricity system.
C O N C LU S I O N N O T E S
1 In this report it is estimated that the renewable energysector could lead to the following employment creation:
• Wind: 100,000 person-years of cumulative employmentby 2012
• Hydro: 240 jobs by 2020• Biomass: 1472-6,181 jobs by 2010-2020• GHP: 18,750 jobs by 2010 and 51,150 jobs by 2020• Solar: 19,442 jobs by 2025
To calculate total employment by 2010 we converted thewind estimate of person-years to total jobs per MW byaveraging this type of employment over the life of thewind facilities as described in page 6 of Kammen, D.M.,Kapadia, K, and M. Fripp (2004) Putting Renewables toWork: How Many Jobs Can the Clean Energy IndustryGenerate? RAEL Report, University of California,Berkeley. Available at http://ist-socrates.berkeley.edu/~rael/renewables.jobs.pdf Following this approach, theperson-years estimate is then divided by the average lifeof the wind facilities (i.e. 20 years) resulting in 5,000 jobsfor 8,000 MW of wind turbines. For these calculations weare assuming that the estimated solar jobs will increaselinearly from 2005 to 2025, i.e. 19,442/20=972 jobs peryear; however, we do not include any solar jobs in the2010 calculation to provide a more conservative estimate.
2 Stewart, K. (2003). Ontario and Kyoto. Ottawa: ClimateAction Network. Available at www.climateactionnetwork.ca/resources.html
3 Canada’s Kyoto commitment entails reducing annualgreenhouse gas (GHG) emissions by 240 megatonnes(MT) see Government of Canada. (2003). ClimateChange Plan for Canada. Available at www.climatechange.gc.ca./plan_for_canada/
Wind turbines, biomass and several other forms of renew-able energy can create new sources of income for farmersand generate good quality jobs throughout Ontario, whileproviding a reliable local supply of energy.

GeneratingGenuine Wealth
111
Summary
Renewable energy can be used for the production of
electricity, and for residential, commercial, and industrial
building space conditioning (heating, cooling, and hot
water). This appendix presents a brief overview of the
demand for power and space conditioning in Ontario.
1. Present structure of Ontario’selectricity sector
The past five years have been a period of extraordinary
change and upheaval in Ontario’s institutions and policies
related to electricity. Competitive retail and wholesale
electricity markets were introduced in May 2002. In
response to public concerns over the sudden increases in
electricity prices, the government terminated the
competitive retail electricity market in November 2002,
and introduced a fixed electricity production price of 4.3
cents/kWh. This fixed price was abandoned as of April 1,
2004 going to 4.7 cents/kWh for the first 750 kWh and
5.5 ¢/kWh for use above that level, a positive step to
encourage conservation.
Ontario’s total installed generation capacity is close
to 30,000 megawatts (MW). The bulk of Ontario’s
installed power capacity is owned by Ontario Power
generation (OPG). As of September 2003, OPG had a
total in-service installed capacity of 22,733 MW (nuclear
facilities = 6,103 MW; coal and oil powered stations =
9,700 MW; hydroelectric stations = 6,796 MW; low-
impact hydroelectric facilities = 134 MW).1 In addition,
Bruce Power controls nuclear reactors with a total
installed capacity of 6,660 MW.2
In 2003 Ontario’s electricity demand totaled 152
terawatt-hours (TWh).3
The present fuel supply mix for electricity production
is shown in Figure 1.
Appendix: OntarioEnergy Profile
FIGURE 1 The current supply mix in Ontario4
E X P E C T E D E L E C T R I C I T Y P R I C EThe report Power for the Future shows an Ontario
Electricity sales price forecast prepared by Natural
Resources Canada.5 The report authors consider these
expectations reasonable for Ontario.

○ ○ ○ ○ ○ ○ ○ ○ ○ ○ ○ ○ ○ ○ ○ ○ ○ ○ ○ ○ ○ ○ ○ ○ ○ ○ ○ ○ ○ ○ ○ ○ ○ ○ ○ ○ ○ ○ ○ ○ ○ ○ ○ ○ ○ ○ ○ ○ ○ ○ ○ ○ ○ ○ ○ ○ ○ ○ ○ ○
SMART GENERATION: POWERING ONTARIO WITH RENEWABLE ENERGY112
TABLE 1
Ontario’s electricity sales price forecast (cents/kWh),2000–20206
2000 2005 2010 2015 2020
Commercial 8.30 8.50 9.22 9.98 10.79Industrial 6.30 5.38 5.83 6.31 6.82Residential 10.00 10.24 11.11 12.03 13.00
While until April 1, 2004, the residential price for
production was 4.3 cents per kWh, once other fixed and
variable charges were added; the effective consumer price
in Ontario is about 10 cents per kWh.7 This price excludes
the immense environmental and public health costs of
the current energy mix, and it also does not include
subsidies to nuclear and fossil power.
2. Heat demand
Contrary to electricity, heat cannot be transported at a
long distance. The end-use and the location of the end
user are important factors estimating the possibilities for
renewable energy. In this section, the heat demand of
relevant sectors is analysed with help of statistic informa-
tion available from the Historical Database of Natural
Resources Canada, Office of Energy Efficiency (available at
http://oee1.nrcan.gc.ca/Neud/dpa/comprehensive_tables/)
R E S I D E N T I A L S E C T O RTable 2 shows the secondary energy use of the 4.4 million
households in Ontario. It is interesting to observe that
space heating and water heating account for 58% and 21%
of the domestic energy demand, respectively. The energy
share of cooling is only 2.5% of the total energy demand,
but will be an important factor during summer peaks of
electricity use.
TABLE 2
Total secondary energy use in the residential sector in2001 in Ontario, by energy source (PJ)8
Total Space Water SpaceShare (%) heating heating cooling Other
Electricity 159.9 31% 34.7 22.5 13 89.7Natural gas 302.3 59% 216.1 83.8 – 2.4Heating oil 29.1 6% 26.8 2.3 – 0.0Propane 4.1 1% 3.4 0.6 – 0.1Othera) 0.0 0% 0.0 0.0 – 0.0Wood 16.7 3% 16.7 0.0 – 0.0Total 512.1 100% 297.7 109.2 13 92.2
a) “Other” includes coal and steam
The possibility of using renewable energy systems
depends on the type of building. Table 3 shows that most
heat demand for space heating arises from single detached
houses.
TABLE 3
Secondary energy use of space & water heating in theresidential sector, by type of building (PJ)9
Space heating Water heating
Single detached 222.0 61.7Single attached 36.0 16.5Apartments 37.8 30.3Mobile homes 2.0 0.8Total 297.8 109.3
C O M M E R C I A L A N DI N S T I T U T I O N A L S E C T O RThe commercial and institutional sector consists of
diverse types. Figure 2 shows that offices use 47% of the
energy used in this sector. Public institutions, such as
schools, are often suitable for renewable energy
demonstration programs.
In Table 4 the division of energy demand into energy
sources is shown. Natural gas is a major energy carrier,
providing about 53% of the commercial and institutional
energy demand.
As in the domestic sector, space heating is the domi-
nant energy application with respect to final energy use
(see Table 3).
FIGURE 2 Total secondary energy use in the commercial andinstitutional sector by type of building (PJ) in Ontario (2001)10

○ ○ ○ ○ ○ ○ ○ ○ ○ ○ ○ ○ ○ ○ ○ ○ ○ ○ ○ ○ ○ ○ ○ ○ ○ ○ ○ ○ ○ ○ ○ ○ ○ ○ ○ ○ ○ ○ ○ ○ ○ ○ ○ ○ ○ ○ ○ ○ ○ ○ ○ ○ ○ ○ ○ ○ ○ ○ ○ ○
APPENDIX : ONTARIO ENERGY PROFILE 113
TABLE 4
Secondary energy use in the commercial and institutionalsector by energy source in Ontario in 2001 (PJ)11
Total Offices Schools
Electricity 164.9 74.1 7.4Natural gas 226.6 104.7 26.2Light fuel oil and kerosene 17.2 8.0 2.0Heavy fuel oil 7.5 3.7 0.6Propane 7.5 3.7 0.9Othera) 0.3 0.2 0.0Total 424.0 194.4 37.1
a) “Other” includes coal and steam.
TABLE 5
Secondary energy use in the commercial and institutionalsector by end use in Ontario in 2001 (PJ)12
Total Offices Schools
Space heating 224.5 111.0 27.3Water heating 24.8 5.1 2.5Auxiliary equipment 34.4 17.8 0.6Auxiliary motors 43.1 15.2 2.3Lighting 61.7 32.0 3.2Space cooling 33.0 13.4 1.2Street lighting 2.6 – –Total 424.1 194.5 37.1
TABLE 6
Secondary energy use in Ontario’s industry by energy source in 2001 (PJ)14
Total Paper and pulp industry Cement industry Iron and steel industry
Electricity 161.9 33.1 3.3 22.7Natural gas 289.9 34.0 1.3 48.1Light fuel oil, diesel fuel oil and kerosene 27.0 0.7 0.0 0.4Heavy fuel oil 33.8 6.7 1.4 7.2Still gas and petroleum coke 85.5 0.0 5.7 0.0LPG and gas plant NGL 3.1 0.0 0.0 0.0Coal, coke and coke oven gas 139.9 0.6 16.7 119.8Wood waste and pulping liquor 83.0 83.0 0.0 0.0Othera) 15.7 2.5 4.0 0.0Total 839.8 160.6 32.4 198.2
a) “Other” includes steam and waste fuels.
FIGURE 3 Secondary energy use in Ontario’s industry by subsector in 2001 (PJ)13
3. Price of heat
Natural gas is the dominant conventional energy source
for heat applications. About 59% of the household energy
demand is supplied by natural gas. Heating oil and
propane provide 6% and 1% of the secondary energy
demand in the residential sector, respectively, presumably
at locations with no connection to the natural gas
network, which creates an opportunity for renewable
energy heating.
If pollution and health costs are totally ignored,
natural gas is currently the cheapest option for heating
but these prices are expected to rise in the future (see
below). Heating oil (15.2 $/GJ) and propane (21.7 $/GJ)
are more expensive. Heating with electricity is the most
expensive The costs of heating equipment should also be
taken into account.
At the wholesale level, natural gas supply prices
throughout North America are determined by the
dynamics of supply and demand. These prices fluctuate
constantly. Short-term prices are particularly volatile
owing to factors such as the weather, which can affect
not only demand but also supply. It is observed that in
2003 prices of 7 $/GJ were paid for natural gas. In the
longer-term, gas prices are affected by population and
economic growth, the prices of substitutes such as fuel
oil, and by environmental policies. For example, greater

○ ○ ○ ○ ○ ○ ○ ○ ○ ○ ○ ○ ○ ○ ○ ○ ○ ○ ○ ○ ○ ○ ○ ○ ○ ○ ○ ○ ○ ○ ○ ○ ○ ○ ○ ○ ○ ○ ○ ○ ○ ○ ○ ○ ○ ○ ○ ○ ○ ○ ○ ○ ○ ○ ○ ○ ○ ○ ○ ○
SMART GENERATION: POWERING ONTARIO WITH RENEWABLE ENERGY114
demand for gas as a preferred fuel for electricity genera-
tion has resulted in higher gas prices.
The price that utilities have to pay for gas supply is
determined in a competitive wholesale market. As long
as the OEB is satisfied that the utility’s purchasing strategy
is appropriate, it is allowed to recover its gas costs by
means of the supply charge billed to users who buy their
gas supply from the utility. 15
TABLE 7
Ontario’s natural gas price forecast ($/GJ), 2000–202016
2000 2005 2010 2015 2020
Commercial 5.25 5.79 6.41 6.97 7.61Industrial 3.61 3.97 4.40 4.76 5.18Residential 6.37 7.01 7.76 8.46 9.25
The natural gas price forecast summarized in Table 7
shows steadily growing natural gas prices for all sectors.
A P P E N D I X N O T E S
1 See OPG “systems at a glance” at www.opg.com/ops/systems.asp OPG also owns wind-powered facilitiestotaling 2.4 MW see Canadian Wind Energy Association“Canada’s installed capacity” at www.canwea.ca/en/CanadianWindFarms.html
2 For more details see Bruce A and Bruce B at www.candu.org/brucepower.html
3 See “demand overview” at www.theimo.com/imoweb/media/md_demand.asp
4 Source: Electricity Conservation & Supply Task Force.(2004). Tough Choices, Addressing Ontario’s Power Needs:Final Report to the Minister. The report is available atwww.energy.gov.on.ca/english/pdf/electricity/TaskForceReport.pdf
5 Analysis and Modelling Group. (2000). Canada’s Emis-sions Outlook: An Update. Ottawa: National ClimateChange Process.
6 Source: p.14 of Winfield, M.S., Horne, M., McClenaghan,T. and Peters, R. (2004). Power for the Future: Towards aSustainable Electricity System for Ontario. Calgary:Pembina Institute for Appropriate Development andCanadian Environmental Law Association, available atwww.pembina.org.
7 For more details see www.theimo.com/imoweb/siteShared/other_charges.asp?sid=ic.
8 Source: Natural Resources Canada, Office of EnergyEfficiency available online at: http://oee1.nrcan.gc.ca/Neud/dpa/comprehensive_tables/
9 Ibid.10 op.cit. note 8.11 op.cit. note 8.12 op.cit. note 8.13 op.cit. note 8.14 op.cit. note 8.15 The Ontario Energy Board (OEB) sets the rates that
Enbridge Consumers Gas, Union Gas and NaturalResource Gas can charge for selling, distributing,transporting and storing gas.
16 Source: p.14 of Winfield et al. (2004), op.cit. note 6.

GeneratingGenuine Wealth
115
BASE LOAD The minimum continuous load over a
period time.
CAPACITY The maximum continuous power output of
a given generating facility. Individual generator or
station capacity is commonly rated in kilowatts
(kW) or megawatts (MW).
CAPACITY CREDIT The capacity rating multiplied by an
“availability factor” which reflects the availability
of the generating source to be on-line when
required. The capacity credit is a measure of the
amount of dependable, dispatchable capacity that
a system operator can rely on from an individual
generating station.
CAPACITY FACTOR The ratio of actual expected energy
production to total potential energy production,
given the nameplate rating of a power plant.
CAPACITY RATING The nameplate (maximum) capacity
of a generating source multiplied by the average
time the generating source is available to generate
power. For renewable energy generators such as
wind turbines, the capacity rating is primarily
determined by the wind resource available in a
given area.
CONSERVATION (OF ENERGY) Any activity, program or
technology that reduces the amount of energy
consumed. Turning off lights when leaving a
room or installing a high-efficiency appliance
which consumes less energy than the unit it
replaces are examples of conservation.
DEMAND SIDE MANAGEMENT Any action or program
that reduces current uses of energy.
DISPATCHABLE GENERATION An electrical generation
source that is capable of automatically, or through
remote control, adjusting its output in response to
real-time load conditions of the grid.
Glossary ofKey Terms
ENERGY EFFICIENCY The amount of energy used by an
apparatus or process to complete a given task.
GIGAWATT-HOUR (GWH) Power unit equal to one
million kilowatt-hours. In 2003 Ontario’s electri-
city demand was approximately 416 GWh per day.
GRID (DISTRIBUTION) A network of medium and low-
voltage power lines interconnecting the grid
transmission system with industrial, commercial
and residential load customers.
GRID (TRANSMISSION) A network of high-voltage,
long-distance power lines interconnecting
generating facilities with distant electrical
distribution systems.
HEADPOND The upstream catchment area or run-of-
river water feed supplying the hydropower station.
Head refers to the vertical drop through which
water must fall before expending its energy on the
turbine blades. A comparison of similar sites, with
one having higher head will produce more energy.
A hydropower site with water storage in the
catchment area can produce peak energy at a rate
higher than can be supplied by water inflows. A
run-of-river site can generate peak energy equal to
the maximum instantaneous inflow of water.
HERITAGE GENERATING ASSETS Government-owned
power generating assets which are sufficiently old
as to have their capital costs depreciated to zero.
Heritage generating assets produce electrical
power at the lowest rates, which skews public
perception when comparing energy costs of new,
capital intensive facilities.
I.M.O. The (Ontario) Independent Electricity Market
Operator is a non-profit, regulated corporation
established by the electricity act that sets forth
terms and operating conditions of the wholesale

○ ○ ○ ○ ○ ○ ○ ○ ○ ○ ○ ○ ○ ○ ○ ○ ○ ○ ○ ○ ○ ○ ○ ○ ○ ○ ○ ○ ○ ○ ○ ○ ○ ○ ○ ○ ○ ○ ○ ○ ○ ○ ○ ○ ○ ○ ○ ○ ○ ○ ○ ○ ○ ○ ○ ○ ○ ○ ○ ○
SMART GENERATION: POWERING ONTARIO WITH RENEWABLE ENERGY116
electricity market and management of the high-
voltage transmission grid. The IMO is expected to
be replaced through new legislation.
INTERMITTENT POWER SOURCE An electrical genera-
tion unit whose output changes due to variability
of the input energy source.
KILOWATT (KW) 1,000 watts of power. The capacity of a
small kettle, iron or hairdryer.
KILOWATT-HOUR (KWH) The amount of electrical
energy produced or consumed when one kilowatt
of power is used for one hour. For example, ten
100-watt light bulbs burning for one hour would
consume one KWh of energy.
LOSSES (TRANSMISSION SYSTEM) The energy that is lost
as heat due to electrical resistance in a given
length of transmission system. In Ontario
approximately 8% of all electricity generated is
lost due to transmission system resistance.
LOAD The amount of electrical power that is
instantaneously required at any given part of the
electrical system.
MEGAWATT (MW) Power unit equal to one million
watts. Current wind turbines range in size from
~1–5 MW each.
MEGAWATT-HOUR The amount of energy produced or
used when one megawatt of power is consumed
for one hour. As energy is the product of power
and time, one megawatt-hour of energy would
also be produced if a generating station were to
deliver 500 kWh for two hours.
OFF-PEAK PERIOD The period of time (whether
considered daily, seasonally or yearly) when
energy use is below its maximum level.
PEAK-USE PERIOD The opposite of off-peak period.
PEAKING CAPACITY An electrical generator that is
typically used only to meet the energy
requirements of peak or high-demand periods.
Peak generation is normally provided by
hydroelectric or gas turbine generators.
PETAJOULE A petajoule (PJ) is equivalent to 1015 joules.
The joule is the official standard unit of energy.
1 million tonnes of coal equivalent = approximately
28 PJ (assuming 100% conversion efficiency), and
7.3 million barrels of oil = approximately 42 PJ
(assuming 100% conversion efficiency).
WHEELING The act of transmitting blocks of energy on
the high-voltage transmission system between a
generation source and load.
2211 West 4th Avenue, Suite 219Vancouver, BC, Canada v6k 4s2www.davidsuzuki.orgTel (604) 732–4228Fax (604) 732–0752
The David Suzuki Foundation works through science and education to protect the diversity
of nature and our quality of life, now and for future generations. We seek the best research
to provide innovative solutions that will help build a clean, competitive economy that does
not threaten the natural services that support all life.
Printed on 100% recycled Save-A-Tree paper using vegetable-based inks
Front cover photograph by Paul Gipe
Design by Alaris Design
Printed in Canada by Western Printers & Lithographers
OOntario is at a critical energy crossroads. The province’s
decision makers are about to choose how Ontario will
produce and use electricity in the coming decades.
The choices they make will profoundly affect all Ontarians. They
can either take the province down the same road of boosting supply
to meet increasing demand or forge a new path towards a more
sustainable electricity system with renewable energy and conservation.
Smart Generation: Powering Ontario With Renewable Energy,
urges Ontario’s decision makers to develop the province’s abundant
renewable sources of energy while creating a new focus on
conservation. In return, Ontario will get a more reliable, cost-effective
electricity system, cleaner air, more jobs, and the development of
a new and vibrant economic engine.
Smart Generation summarizes the potential of five sources of
renewable energy for Ontario: wind, hydropower, biomass, geothermal
and solar. It also makes key policy recommendations on how to rebuild
the province’s power system with these sources of energy.
OCTOBER 2004