smart grid & system planning - ieeeewh.ieee.org/cmte/pspic/pspi committee full meeting minutes...
TRANSCRIPT

Power System Planning & Implementation Committee
Pittsburgh, PAJuly 23, 2008
Smart Grid & System Planning

Page 2
Agenda Introduction of attendees & signupApproval of GM2007 Meeting MinutesCommittee officers re-alignmentTechnical Council & Editorial Board mattersSome selected issues
Smart Grid Carbon FootprintTest Systems for Smart Grid
Issues for the industryEnergy Supply WG (Jian Yang)Transmission WG (Paola Bresesti)Distribution WG (Bob Fletcher)Customer Service WG (Hahn Tram)Asset Management WG (Dave Egan)
Develop programs for PSCE at Seattle, March 15-18, 2009GM2009 at Calgary, July 26-30, 2009T&D Expo at New Orleans, April 19-22, 2010
Adjourn

Page 3
PSPI Committee
ML Chan, Chair
Transmission System WG
Paola Bresesti (pending)
Distribution System WG
Bob Fletcher
Customer Services WG
Hahn Tram
Asset Mgmt. WG
Dave Egan
Energy Supply WG
Jian Yang
Liaison to Energy Policy Development Coord. Comm. – Anil Pahwa (New one?)
Liaison to Wind Power Coord. Comm. – Zhao Xu
Liaison to Emerging Technologies Coord. Comm – Fran LiSecretary
Veronika Rabl (pending)
Vice Chair/TCPC
Anil Pahwa
Liaison to Technical Committee Advisory Board Member – Lina Bertling
Liaison to PSCE Comm. – Anil Pahwa
Liaison to Intelligent Grid Coordinating
Comm. – Fran Li
Revised after GM2008

Page 4
Organization Alignment
New Vice Chair and TCPC – Anil Pahwa to replace Richard BrownEnergy Policy Development Coordinating Committee –with Anil Pahwa being the Vice Chair, will need a replacement for him on this liaison; still pendingSecretary – Kevin Jones to considerWeb support for Committee – will approach Secretary to do that; more of content management because IEEE has a webmaster with standard templates for Committee websites

Page 5
Technical Council Matters
Get Combo sessions for each Committee and WG
Joint Committee Working Meeting at Southeast
Smart Grid Coordinating Committee
Standards need to work with IEC for Dual Logo
T&D Show at Spring; GM in late July; PSCE in early Spring

Page 6
Editorial Board Meeting
TPWRS has about 37% acceptance rate with over 1200 papers a year to be reviewed
Achieves >90% for completed review within 2 months or so
New Manuscript Central v4 ready

Page 7
Smart Grid
Enterprise Network
Load Management (Demand-Side Management)
Asset Management
Energy Management System
Inventory and Track facilities and Equipment
Outage and Workforce Management
Pinpoints problems, locates equipment, dispatches crews
Graphical Information System
Load analysis and forecasting
Intelligent Network Agent
Gather data, makes decisions about local switching and controls functions and communicates with
control centers
Power System
Market Operations
Distribution/Substation Automation
Remotely monitors and controls operations formally done
manually at substations and feeders Power System Monitoring and Control
Monitoring: Up-to-the-second displays of conditions, Control: Automates operations to allow centralized control Wide-Area Management System (WAMS)Dynamic Thermal Circuit Rating
Integrated Enterprise Software Custom-built applications: accounting,
billing and customer service, etc...

Page 8
Smart Grid Test Distribution System
Laboratory test system to evaluate impacts of SG applications
Standard evaluation system
CIGRE has developed such systems
Need to work with Rick Roberts and also Distribution Feeder TF (Tom McDermmot)
Should it be our project? Yes, Distribution WG will work with Tom McDermott and Lina Bertling. Perhaps the WG should adopt the CIGRE’s work by Prof. Kai Strunz and define the requirements of such a Test Smart Grid System. The Distribution WG will pass the info to Lina since she is also chairing another Task Force in another Committee on test feeders. A sample list of requirements for such a test system is in Appendix A – the Distribution WG talking point slide deck.

Page 9
Carbon Footprint
Carbon trading involving refurnishing deforestation; global trade of carbon rights; not just best control technologies
Every utility operation should have carbon footprint implications
SG integrates renewable, PHEV, DG and DR; closer to load; system efficiency being promoted
We reviewed a presentation by Veronika Rabl on estimating the cost of carbon footprint reduction. The presentation is attached in Appendix B below.

Page 10
Programs Decided
Energy Supply WG will deliver a tutorial “How to do basic supply and generation planning under Smart Grid?”. A full day session, with the first half being theory-focus, and the second focusing on case studies involving Smart Grid, Demand Response and Wind Integration. Planned for GM2009.Distribution WG will deliver ½ day panel session entitled “Smart Distribution Planning for Smart Grid”. Several WG members have agreed to be on the panel. For GM2009.Asset Management WG will deliver a WG paper in a combo meeting presenting PAS 55, and has also indentified some important issues: (For GM2009)
NERC compliance standardsRegulatory agencies determine how utilities spend money on AMNeed to move towards risk-based maintenance
AM WG also considering an enterprise IT system paper for AM, to be coordinated by Charles Ensendal for GM2009.

Page 11
Programs decided in GM2008WG PSCE, Seattle, March,
2009GM2009, Calgary, July, 2009
T&D Show, New Orleans, April 2010
Energy Supply Full day (Mike Henderson) Tutorial:”How to conduct system planning with SG”; includes updates of DR, JCSP, Smart Grid, Wind with case studies in the afternoon
Distribution WG Panel Session: Smart Plan for Smart Grid (Bob Fletcher)
Asset Management WG
panel session on PAS 55 (Dave Egan)
SG & Enterprise IT System (Charles Ensandal)
Transmission WG Transmission Planning integrated with Wind Generation (Ali Chowdhury)
Customer Service WG

Page 12
Translated into Requirements
More visibility to the distribution systemIEDs, AMI meters, “inexpensive” PMUs
State estimators
More local intelligence control of the systemCommunications infrastructure (e.g., PTP)
Ability to communicate/interoperate devices
Condition-based maintenance
Optimal utilization of infrastructure capacity
DGs, storage & renewable forming micro-grids
PHEVs; interface with Home Area Networks (HAN)
PQ concern

Page 13
What is Smart Grid?
Smart Grid is a vision for electric utilities: Utilities, and consumers will accrue values through the convergence of power delivery and information technologies to achieve improved reliability, reduced O&M costs, avoidance of new capacity, and increased customer satisfaction.
Applied to G, T, D and customer sectors by leveraging computer and communications infrastructure and technologies
SG is not a set pf shrink-wrapped solutions; the set and scope are unique to each utility, in the context of traditional capacity engineering and planning

Page 14
Smart Grid at Generation System
Real-time heat rate calculation modules
Continuous emission monitoring systems
Continuous asset condition monitoring systems for CBM
Integration of intermittent renewable resources with energy storage technologies

Page 15
Smart Grid at Transmission Systems
PMUs to provide time synchronized data on system dynamics
Wide Area Protection System (WAPS) for improved system reliability
FACTS to optimize the utilization of capacity
Substation automation involving IEDs for protection and condition monitoring
Closer integration in planning with distribution system planning

Page 16
Smart Grid at Distribution Systems
Feeder Automation
Fuse Clearing via fast curves
Remote monitoring of FCIs
Real-time incipient fault prediction
Integrated volt/var control
Feeder & Sub Peak Load Management
Equipment Condition Monitoring
Distribution SCADA or DMS

Page 17
Smart Grid at Distribution Systems (cont’d)
Substation AutomationData concentrators
Use of IEDs and Data Concentrators
Equipment Condition Monitoring with non-operational data
Micro-grid management involving DGs, Renewable and PHEVs

Page 18
Smart Grid at Customers
AMI SystemAMR
Outage detection
Remote Service Connect/Disconnects
Integrate DR resources (e.g., smart thermostats)
Customer Portal Systems for energy management

Minutes from the Last GM2007 Meeting
(To remind Committee members as to what we have decided in GM2007 at Tampa, Florida)
Page 20
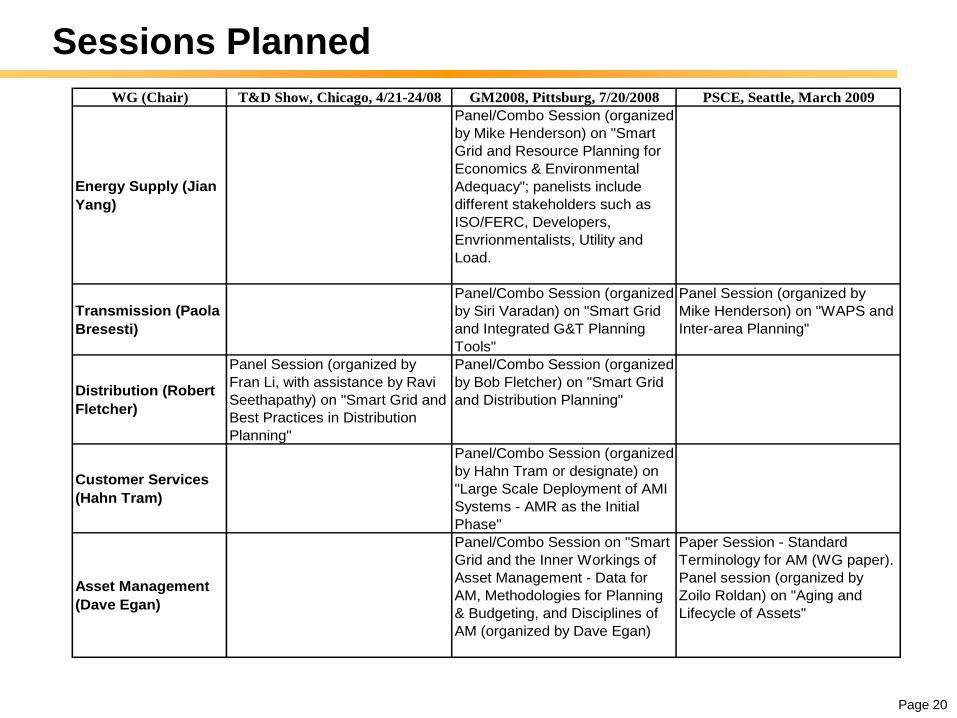
Sessions PlannedWG (Chair) T&D Show, Chicago, 4/21-24/08 GM2008, Pittsburg, 7/20/2008 PSCE, Seattle, March 2009
Energy Supply (Jian Yang)
Panel/Combo Session (organized by Mike Henderson) on "Smart Grid and Resource Planning for Economics & Environmental Adequacy"; panelists include different stakeholders such as ISO/FERC, Developers, Envrionmentalists, Utility and Load.
Transmission (Paola Bresesti)
Panel/Combo Session (organized by Siri Varadan) on "Smart Grid and Integrated G&T Planning Tools"
Panel Session (organized by Mike Henderson) on "WAPS and Inter-area Planning"
Distribution (Robert Fletcher)
Panel Session (organized by Fran Li, with assistance by Ravi Seethapathy) on "Smart Grid and Best Practices in Distribution Planning"
Panel/Combo Session (organized by Bob Fletcher) on "Smart Grid and Distribution Planning"
Customer Services (Hahn Tram)
Panel/Combo Session (organized by Hahn Tram or designate) on "Large Scale Deployment of AMI Systems - AMR as the Initial Phase"
Asset Management (Dave Egan)
Panel/Combo Session on "Smart Grid and the Inner Workings of Asset Management - Data for AM, Methodologies for Planning & Budgeting, and Disciplines of AM (organized by Dave Egan)
Paper Session - Standard Terminology for AM (WG paper). Panel session (organized by Zoilo Roldan) on "Aging and Lifecycle of Assets"

Page 21
Asset Management WG Perspectives
Three major issues for AMData needed for AM
Methodology for budgeting and planning
Disciplines required by AM
Standard terminologies for AM to be developed
How does AMI enable AMCommunications media afforded by AMI
Requires data mining engines
What is “asset”? Power delivery asset and information asset?Communications equipment
T&D equipment
Controllers

Page 22
Asset Management WG Perspectives (cont’d)
Aging asset and lifecycle perspective for asset
Root-cause analyses of asset failures
Smart Grid and the enterprise IT to make it happen
Resource requirements to implement AM initiatives

Page 23
Distribution System Planning WG Perspectives
Distribution system planning in the context of Smart Grid requires “smart planning” – how to expand “smartly”
What does the future distribution infrastructure look like? Sensor, controllers and processors proliferation; from data to information to control actions
What are the new “loads”? DGs, DRs, renewable...
Need for small area load forecasts that can capture DGs, DRs, etc.

Page 24
Distribution System Planning WG Perspectives (cont’d)
Major issues for incorporating Smart GridModeling and simulation tools (e.g., wind generators models thatcapture governor controls)
Planning guidelines and standards
Push for greater efficiency (e.g., reduce losses)
More push for real-time analyses and planning
MV and LV to be considered as one system for planning

Page 25
Transmission Planning WG Perspective
Siri Varadan presented a methodology for risk assessment in transmission planning in BPA (Appendix 3). It points out a methodology for capturing risks in planning under Smart Grid.
Paola Bresesti, Chair of Transmission WG, prepared a set of transmission planning issues under Smart Grid (Appendix 4) though she could not make the conference. That provided platform for discussion of issues below.
Risk and uncertainties come in different forms – “size of the energy resource lumps”, how controllable/curtailable/dispatchable are the supply resources; how to quantify risks?

Page 26
Transmission Planning WG Perspective (cont’d)
Education of the public is an integral element of transmission planning
Need for an “Integrated G&T Planning Tool”, a TEAM approach; in Canadian market, <10 MW DGs are not on the radar screen, but they should be.
How to quantify the benefitsCompetition (e.g., market power impacts)
Reliability
Sustainability (Is that as simple as CO2 reduction or should it be a holistic environmental approach? Or should energy efficiency adopt an elemental approach – starting from the transformation of the original chemical elements to kWh? )

Page 27
Transmission Planning WG Perspective (cont’d)
How to model the “load”, which is a resource, especially when DGs and renewable are present
Impacts of Smart technologies (work with T&D Committee’s WG1505)
PMUs
Wide Area Protection Systems
FACTS

Page 28
Energy Supply WG Perspectives
Resource Adequacy is a major issueEconomics vs Reliability vs Environment
Site selection (optimization of multiple resource concerns –water, gas, transmission) and Total Energy Planning, not just electric planning
Free ridership issue in transmission upgrades
Interconnection queue vs inequity
Coal/IGCC/GHG vs CO2
Nuclear – permits and cost issues
Wind – intermittency a concern to system dispatch
Solar – cost
Gas (CCGT)
Blackstart, AGC, Reactive Power and SR

Page 29
Energy Supply WG Perspectives (cont’d)
Another major issue relates to the MarketMarket design & impacts (e.g., LMP vs zonal, DA market, capacity market); need to encourage DG and renewable proliferation
Emission market
Deregulation vs Re-regulation
Bidding strategy
Merchant vs contracts

Page 30
Energy Supply WG Perspectives (cont’d)
Another major set of issues relates to DGs & DRsEmergency generators needed for blackstarts if to be truly “self healing” grid
Island and micro-grid operations
Size of units
Degree of dispatchability for DGs
DR as a viable resource; may need to remove rate freeze for DR to be truly viable; policy issue with AMI system investment
Fuel cells; could be a mobile load

Appendix A

Appendix B

11
Appendix A Planning for Smart Grids
Robert H. Fletcher, PhD, P.E.
Principal Electrical Planning Engineer Snohomish Public Utility District
Snohomish County Everett, WA
July 23, 2008
Appendix AAppendix A Planning for Smart GridsPlanning for Smart Grids
Robert H. Fletcher, PhD, P.E.
Principal Electrical Planning Engineer Snohomish Public Utility DistrictPublic Utility District
Snohomish County Snohomish County Everett, WAEverett, WA
July 23, 2008July 23, 2008

22
OverviewWhat is the Smart Grid Vision
What is role of Distribution Planning
Why are Smart Grids needed
What will the Smart Grid look like
What new distribution Planning tools are needed
The Distribution
System

33
A Vision of the T&D Future
Innovation
ChangeReliability
Quality
Choice

44
Accessibility of a wide variety of renewable resources and demand responsesDistribution system and customer flexibilityEnhanced reliability, power quality, and system self healing
New technology value added products and services that empowers the customerEconomic best value through innovation and efficient energy managementAsset Management and Utilization Optimization
Sustainable Energy Development
Smart Grids will Support and Enable:

55
What is Your Image of the T&D Future?
You can’t predict the future but you can plan for it
Global, Digital, Mobile, Virtual, and Personal
Role of Distribution Planning

66
Identify customer service, system reliability, and environmental expectationsProvide consumer end-use and system-use forecastsProvide engineering system assessments using electric facility steady state and operational/dynamic models
Assure that the year to year distribution additions have a good chance of reaching their planned economic lifeConsider economics, reliability, power quality, safety, new technologies, and public acceptance when planningIdentify right of way and land requirements for future expansion of substations and linesRecommend electric system design and operational guidelines
Role of Distribution Planning

77
Why Smart Grids are NeededDistribution System Deficiencies
– Little flexibility and intelligence– End of useful life– End-use load variations– Little visibility– Legacy Network – Efficiency
Consumer Cost of Service IssuesEnvironmental Issues
New Technology Advancements– Transportation– Advanced metering– Power electronics– Changing End-use Loads (nonlinear)– Communication networks
Higher Cost of Energy ResourcesDispersed Generation

88
What will Smart Grids look likeLow cost sensors and smart meters Low cost sensors and smart meters
Distributed information and intelligence Distributed information and intelligence
Smart systems and controlsSmart systems and controls
Distributed energy resourcesDistributed energy resources
High temperature superconducting materialsHigh temperature superconducting materials
High efficiency transformersHigh efficiency transformers
Improved fault limiting devices Improved fault limiting devices

99
What will Smart Grids look likeElectricity storage devicesElectricity storage devices
Power electronics (switches and controllers) Power electronics (switches and controllers)
Customer smart appliancesCustomer smart appliances
Communication system infrastructuresCommunication system infrastructures
Distribution substation automation and controlDistribution substation automation and control
Improved fault locating and predictionImproved fault locating and prediction
Improved Protection and fault isolationImproved Protection and fault isolation

1010
What are the Distribution Planning Tools
Needed for Smart Grid Planning?

1111
1. Enhanced Distribution System modeling 1. Enhanced Distribution System modeling and simulationand simulation
8760 hour consumer load profile simulation for voltage and reliability
Dispersed generation and control modeling with bi-directional flows
Customer end-use appliance and demand response modeling
Value based predictive reliability and system operation modeling
Near real time, short term, and long range planning modeling
System protection, stability, demand response, load control modeling
Modeling of both primary and secondary distribution systems
Three phase bi-directional closed network power flow modeling
Probability applications for normal and contingency operation modeling
Data interfaces with GIS and customer information systems

1212
2. Expanded Distribution system design and 2. Expanded Distribution system design and operational guidelinesoperational guidelines
Substation power transformer loading higher utilization factors
Distribution transformer loading higher utilization factors
Distribution circuit loading higher utilization factors
Automated system isolation and load restoration practices
System voltage and Power Quality control procedures
Distribution generation connection and control guidelines
Customer metering interface and communication guidelines
New equipment design specifications and application guidelines
Distribution substation automation planning guidelines

1313
3. Greater emphasis on system efficiency, 3. Greater emphasis on system efficiency, cost allocation, and loss reductioncost allocation, and loss reduction
Value based assessments, financial risk, and cost optimization
Power quality, reactive load, and voltage management
Green circuit low loss initiatives
Conservation voltage regulation implantation
Conductor economic optimization applications
Transformer sizing and loss optimization analysis
Distribution system customer total cost of service minimization
Optimization of equipment control settings

1414
4. Expanded distribution small area load 4. Expanded distribution small area load forecast capabilityforecast capability
Prediction of consumer load profile and load characteristic uses
Coordination of land use designations and long range build out plans
Population and jobs, local area commerce, consumer characteristics
Stochastic methods applied to generation proliferation and demand response
Stochastic methods applied for distribution line loading and expansion models
Cost of future energy resource mix
Longer range and distribution strategic planning time frame

Estimating Cost of
COCO22 MITIGATIONMITIGATION
Veronika A. RablVeronika A. RablPrincipal
Vision & ResultsWashington, DC

2
ObjectiveObjective
Estimate mitigation costs and potential reductions
in the near term, ~ next 10 years(results for US, but similar for the same
technologies in other industrialized countries)
Derive abatement supply curve, including uncertainties

3
MethodologyMethodology
Literature ReviewWe reviewed about 250 studies. Of these about 25 were studied closely and used for our calculationsUnits: tCO2 = metric ton of CO2
Normalized data to consistent assumptionsEIA baselineinput parameters include uncertainty range

4
Methodology, cont.Methodology, cont.
Societal Perspectiveconstant currency and social discount rate (generally 5%). Taxes are not included
Fuel Costsvehicle sector $1.50/gallon of gasoline and of diesel fuel, without taxes. Natural gas $5.0/MBTU ($4.74/GJ) and for coal $1.3/MBTU ($1.23/GJ).

5
Methodology, cont.Methodology, cont.
For direct emissions we consider only CO2 For fuel production upstream emissions are important:
upstream impacts via LCA (life cycle assessment)including CH4 and N2O as CO2 equivalent
Carbon capture and sequestration (CCS)include a nominal cost for transport and storage
$6.7 (+2.3/-2.5)/tCO2 captured

6
Potential ReductionsPotential Reductions
Sector Total emissions
Near term reductions
MtCO2/yr MtCO2/yr % of total
Power 2,619 358 14% Industry 755 14.1 2% Vehicles 745 33.6 5% Buildings 2,553 40 2% Total 6,672 446 7%

7
LimitationsLimitations
Power: good coverage Buildings and industry: fair coverage (not all costs for 5%, lack of data)Vehicles: only cars and light trucks:
conventional -> hybrid or diesel,gasoline -> corn ethanol, diesel -> biodiesel

8
CostsCosts$/tCO2 in
-300 -200 -100 0 100 200 300 400
Power Generation
Industry
Light duty vehicles
Buildings
Compare to damage cost estimates: roughly $25/tCO2 ($5 - 125/tCO2)

9
Power GenerationPower Generation
Power
149
49
-5
-13
-28
-38
33
23
67
35
24
-45
-11
16
169
24
-200 -100 0 100 200
PC with CCS replaces PC
BIGCC replaces PC
IGCC replaces PC
IGCC with CCS replaces PC
IGCC with CCS replaces IGCC
NGCC with CCS replaces NGCC
Nuclear replaces NGCC
Retire installed NGCCs and substitute nuclear
Wind replaces NGCC
Retire installed NGCCs and substitute wind
Nuclear replaces PC
Retire installed PC's and substitute nuclear
Retire installed PC's and substitute wind
Retire installed PCs and substitute NGCC
Retrofit existing PCs for 10% biomass feed
PV replaces NGCC and peaking gas turbine
$/tCO2 avoided

10
IndustryIndustry
Industry
20
42
64
15
26
70
26
19
56
67
30
23
56
52
133
-200 -100 0 100 200
NH3 production: Post combustion CCS by amine flue gasscrubbing
NH3 for fertilizer production: CCS
Cement: Replace clinker by fly ash or furnace slag
Cement: Replace semi-wet kilns by wet kilns or useprecalciners
Cement: Convert wet to dry kilns
Cement: CCS
H2 production: capture from concentrated exhaust
H2 production: Post combustion capture
H2 production: Production by Ionic Transfer Membrane
Iron/Steel: CCS
Nat. gas purification: Capture and storage
Oil Refining: CCS
Oil Refining: Oxyfuel combustion (cryogenic O2)
Oil Refining: Oxyfuel combustion (ITM)
Oil Refining: Non combustion use of fossil fuels (hydrogenproduction)
$/tCO2 avoided

11
BuildingsBuildings
Buildings-22
110
-22
-54
-4
-47
-32
-34
7
-200 -100 0 100 200
High efficiency residential furnace air handlers for 10% of sales
All new TVs Energy Star compliant
All new clothes washers Energy Star compliant
All new dishwashers Energy Star compliant
All residential incandescent lamp replacements are compactfluorescents
All new refrigerators Energy Star compliant
Replace windows by high performance windows
Replace window air conditioners by high efficiency units
All products purchased by government facilities have highestefficiency
$/tCO2 avoided

12
VehiclesVehicles
Vehicles108
220
435
244
-200 -100 0 100 200 300 400 500
Diesel replaces gasoline engine
HEV replaces gasoline LDV
Corn-ethanol replaces gasoline
Biodiesel replaces diesel fuel
$/tCO2 avoided

13
SensitivitySensitivityto vehicle priceto vehicle price
Conventional LDV -> HEV
0
100
200
300
400
500
0 0.5 1 1.5x/xbase
$/t CO
increm. vehicle cost varies
fuel cost saving varies
Conventional LDV -> Diesel LDV
0100200300400500600700800
0 0.5 1 1.5x/xbase
$/t CO
increm. vehicle cost varies
fuel cost saving varies
xbase fuel cost, $/gal increm. vehicle cost, $ HEV 1.5 4200 Diesel 1.5 4600

14
SensitivitySensitivityto fuel costto fuel cost
Replace Gasoline -> Ethanol
-100
0
100
200
300
0 0.5 1 1.5x/x base
Gasoline@xbase=1.5$/gal.eq
Ethanol@xbase=1.8$/gal.eq
Replace Diesel -> Biodiesel
0
100
200
300
400
500
0 0.5 1 1.5x/xbase
Diesel@xbase=1.5$/gal.eq
Biodiesel@xbase=3$/gal.eq

15
Supply curveSupply curve
0 100 200 300 400 500
-100
0
100
200
300
400
Mt CO2 / yr
$ / t CO2
Sector Total emissions
Near term reductions
MtCO2/yr MtCO2/yr % of total
Power 2,619 358 14% Industry 755 14.1 2% Vehicles 745 33.6 5% Buildings 2,553 40 2% Total 6,672 446 7%
But note: Long term supply curve is much lower(learning and progress)

16
AuthorsAuthors
Ari Rabl (correspondent)Ecole des Mines, Paris
Veronika A. RablVision and Results, Washington, DC
Joseph V. SpadaroEcole des Mines, Paris
Jan F. KreiderUniversity of Colorado and K&A, LLC