smart spending - transitchicago.com · union contracts provided for a 3.0 percent wage rate...
TRANSCRIPT

Smart Spending:
Steering Through
the Econom
ic Slow
Dow
n
President’s 2009 Budget Recommendations

Chicago Transit BoardCarole L. Brown, ChairmanAppointed by: Mayor, City of Chicago
Susan A. Leonis, Vice ChairmanAppointed by: Governor, State of Illinois
Henry T. Chandler, Jr.Appointed by: Mayor, City of Chicago
Cynthia A. PanayotovichAppointed by: Governor, State of Illinois
Charles E. RobinsonAppointed by: Mayor, City of Chicago
Alejandro SilvaAppointed by: Mayor, City of Chicago
Sheila NixAppointed by: Governor, State of Illinois
Ron Huberman, President
www.transitchicago.com1-888-YOUR CTA
Carole L. Brown Chairman

Table of Contents
CTA Organization Chart………………………………………………………………………..2 Letter from the President……………………………………………………………………….3 Executive Summary…………………………………………………………………………….4 Operating Budget Performance
2008 Operating Budget Performance Summary………………………………………….7
2008 Amended Operating Budget Schedule………………………………………....10
President’s 2009 Proposed Operating Budget
President’s 2009 Proposed Operating Budget Summary………………………...........11
President’s 2009 Proposed Operating Budget Schedule…………………………..…..20
President’s 2010 – 2011 Proposed Operating Financial Plan
President’s 2010 – 2011 Proposed Operating Financial Plan Summary………….....21
President’s 2010 – 2011 Proposed Operating Financial Plan Schedule………….….24
2009 – 2013 Capital Improvement Plan & Program
Introduction………………………………………………………………………………....25
Sources of Funds………………………………………………………………………......29
Uses of Funds………………………………………………………………………………31
Detailed Capital Improvement Project Descriptions…………………………...............39
Appendices…………………………………………………………………………………….45
- 1 -

Organization Chart
Chicago Transit Authority
Board of Directors
Office of the Inspector General
Treasurer
Office of the President
Office of the Chief Operating Officer
Operations Support
Public Affairs
Finance
Government Affairs &
Affirmative Action
Human Resources
Purchasing & Warehousing
LN08008 Org Chart
Safety
Security
Facilities
Performance Management
General Counsel
Power & Way
Office of the ChiefInfo Officer
Revenue & Marketing
Planning & Development
Customer Communications
Transit Operations
Bus Operations
Rail Operations
Mechanical - Bus
Mechanical - Rail
- 2 -

- 3 -
- 3 -

Executive Summary
- 4 -
The Chicago Transit Authority (CTA) and the Chicagoland region as a whole experienced an historic year in 2008. After months of a dedicated effort to create fiscal stability for the Authority, the Illinois General Assembly in January passed a landmark funding package (P.A. 95-0708) for mass transit in Northeastern Illinois, increasing financial support for the region’s public transit providers and creating long-term financial stability for the CTA’s pension and retiree health plans. This financial assurance has enabled the CTA to embark upon a series of initiatives to improve the overall customer experience, while ensuring that the benefits provided to its 10,500 employees are viable and affordable for the long term. In 2008 the CTA continued to invest in its system to improve service for customers, operate more efficiently and incorporate new technologies. By focusing resources on key projects such as slow-zone removal, system cleanliness, the acquisition of new rolling stock and an increase in on-time performance, the CTA was able to provide better and more reliable service to its customers. Undoubtedly, this commitment to customer satisfaction is one factor in the significant ridership increases experienced in 2008, the greatest growth that the CTA has seen in almost thirty-five years. Performance management was a core aspect of CTA decision making in 2008. All departments established performance measures and goals that set standards for every employee, and held managers strictly accountable for the performance of their departments. This ensured that the company as a whole was focused on the customer. But there were also unexpected challenges in 2008 that impacted this year’s budget and will continue to influence the budget for 2009. A slowing economy and higher prices for fuel, power and materials put pressure on CTA resources. Although the State legislation brought welcome funding for the region, revenues were lower than expected due to the sluggish economy. Likewise, the unanticipated free ride programs reduced projected fare revenues at the same time that the $32 million annual reduced-fare subsidy was eliminated in the last half of 2008 and the first half of 2009. Although new State funding mechanisms are in place, anticipated revenues will not achieve desired levels until the economy improves. In addition, the cost of many commodities and utilities are expected to continue growing in the years ahead. These factors are exacerbated by the lack of a State capital program, which adversely affects the CTA’s bottom line. Without designated capital resources to replace aging equipment and infrastructure, the CTA has to devote additional operating funds to make necessary maintenance and repairs. Since the cost to repair outdated equipment is more expensive in the long run than replacing it, this is the least cost-effective way to maintain a system. The President’s 2009 proposed budget was developed based on the following principle: The CTA must make smart – albeit difficult – financial choices to steer its way smoothly through this economic slowdown. In response, the budget process has focused on understanding the value derived for every dollar spent. The performance management approach was incorporated into the budget process and each department developed its budget based on key performance targets and financial metrics. In these difficult times, the CTA decided early on that savings must be accomplished without reducing any service.
- 4 -

Executive Summary
- 5 -
This process drove the CTA to innovate and reorganize departments to achieve a significant reduction in managerial, support and administrative costs. The President’s 2009 proposed budget described in this book is the culmination of this process. In closing, this budget reflects the CTA’s continued commitment to improving service. In 2009 the issues that are most important to its customers continue to be at the forefront of the CTA’s priorities: safety, better communications, slow zone removal, bus-bunching management, increased cleanliness and better on-time performance.
- 5 -

- 6 -
This page is left intentionally blank.
- 6 -

2008 Operating Budget
- 7 -
INTRODUCTION The 2008 State funding package increased the percentage of State sales tax dedicated to mass transit and gave authority to the City of Chicago to increase the Real Estate Transfer Tax (RETT) to support the CTA. The legislation also provided for long-term pension reforms that will increase the funded ratio of the CTA’s pension to 90% by 2059.
Despite the potential increase from new revenue sources, their dependence on the state of the regional economy rendered them less productive in 2008. At the same time, inflationary pressure on commodities and utilities resulted in substantial increases in the CTA’s operating costs. For example, 2008 fuel costs are on track to increase 24.0 percent from 2007 to 2008, and material costs, especially those related to heavy maintenance and construction grew 25.0 percent during the same period. In addition, three free ride programs were introduced without funding offsets, resulting in a combined estimated revenue loss in 2008 of $30 million. As a result of higher operating costs and revenue erosion, the CTA had to amend its budget in July 2008. An amendment that was approved by the RTA, the CTA’s oversight board. The amendments, coupled with spending cutbacks, will allow the CTA to meet its 2008 financial obligations. RIDERSHIP The CTA projects that it will have record growth in system-wide ridership in 2008. Ridership for 2008, including rail-to-rail platform transfers, is forecast to be 524.3 million trips, which is 24.8 million trips higher (4.9%) than 2007. The gains in ridership occurred on both the bus and rail system. Bus ridership in 2008 is projected to be 327.8 million trips, which is 18.5 million (5.8%) higher than 2007. Bus ridership growth occurred during both peak and off-peak hours. Weekday ridership increased approximately 6.0 percent, while Saturday and Sunday ridership increased 11.0 percent and 12.0 percent, respectively. Rail ridership is estimated to be 196.6 million, which is 6.3 million (3.3%) higher than 2007. Rail ridership growth also occurred both on weekdays and weekends, with average weekday growth averaging nearly 4.0 percent, Saturday nearly 3.0 percent and Sunday 3.3 percent over 2007. Unfortunately, the increased farebox revenue associated with the increased number of riders does not substantially offset the increased operating costs that the CTA continues to experience in 2008. OPERATING EXPENSES Operating expenses for 2008 are estimated to be $1.209 billion, which is $116.0 million more than 2007 actual expenditures. The 2008 labor expense is projected to be $884.7 million, which is $99.8 million (12.7 percent) higher than 2007 actual labor costs. The higher labor expense resulted from higher wage rates, increased pension contributions and higher health care expenses. In January 2008, the CTA’s union contracts provided for a 3.0 percent wage rate increase for both 2007 and 2008. The CTA also approved two 3.0 percent pay increases for non-union employees, which was intended to offset the additional 6.0 percent employee contribution required by the new 2008 pension and retiree healthcare legislation.
- 7 -

2008 Operating Budget
- 8 -
That same pension and retiree healthcare legislation also increased the CTA’s contribution to the pension fund from 6.0 percent to 12.0 percent. In 2008, material expenses are forecast to be $89.5 million, which is $5.3 million higher than 2007 actual expenses. The primary cost driver for this increase is from materials necessary to maintain and repair the aging rail car and bus fleet. This is a direct result of inadequate capital funding required to replace bus and rail cars that are beyond their useful life, and to overhaul
vehicles at their quarter and mid-life intervals. The CTA has leveraged future federal funding to replace 19-year-old buses by entering into leases. By the end of 2008, all of the buses acquired in 1991 will be retired, which will help mitigate increases in material costs. The cost of other materials, such as steel, and asphalt, which are required to maintain the CTA’s multiple facilities, also increased significantly in 2008. Spiraling fuel prices led the way to a significant decrease in consumption of gasoline by consumers and a shift of riders to mass transit. Although this shifting of ridership is generally viewed as a windfall for public transportation agencies, the revenue impacts of these ridership gains did not offset the higher fuel expense for the CTA. Fuel costs for the revenue fleet are forecast to be $91.1 million for 2008, an increase of $19.9 million (27.6 percent) over 2007. Fuel consumption is forecast to be 25.6 million gallons and is slightly higher than 2007. The 2008 amended budget assumed an average price of $3.52 per gallon, which is $0.70 per gallon (24.6 percent) more than the prior year’s actual average price. For 2008, the cost of electric power for the rail system is forecast to be $38.3 million, which is higher than the prior year’s actual cost by $9.8 million (34.0 percent). At the end of May 2008, the CTA’s new electric power contract commenced, containing a 0.25 percent rate increase. Provision for injuries and damages represents expenses for claims and litigation for incidents that occur on CTA property or with CTA vehicles. The 2008 forecast for this cost is $14.0 million and matches the 2008 amended budget, but is $11.0 million lower than 2007 due to an amendment to the 2008 budget that shifted $11.0 million in reserve fund surplus to offset the increase in operating costs. Full-year security expenses funded by the CTA are estimated to be $32.4 million in 2008, as opposed to $31.4 million last year. Security services are provided by the Chicago, Evanston and Oak Park Police Departments and through contracts with private security firms. The Public Transportation Unit of the Chicago Police Department provides dedicated services to CTA customers at an estimated cost of $22.0 million, paid for by the City of Chicago. This amounts to a combined total security budget of over $54.4 million for the CTA system.
2008 Forecast System-Generated Revenue
Local Government Contributions
1%
All Other Revenue2%
Reduced Fare Funding
6%
Advertising, Charter &
Concessions5%
Investment Income
1%
Fares & Passes85%
- 8 -

2008 Operating Budget
- 9 -
The 2008 “other expenses” category includes funds allocated for utilities, maintenance and repair, advertising, commissions, consulting, insurance, overhead allocated to capital work, and other general expenses. The year-end forecast for these services is $59.6 million. OPERATING REVENUES System-Generated Revenues System-generated revenues are projected to be $548.1 million and exceed the prior year’s actual revenues by $2.2 million (0.4 percent.) Fare revenue increased by $6.2 million as a result of ridership growth. However, CTA experienced erosion in its average fare due to mandated free ride programs. The average fare paid in 2008, including cross platform transfers, is projected to be $0.89, or $.026 lower than the 2007 actual results. The reduced-fare subsidy is the State of Illinois’ reimbursement to the CTA, Metra and Pace for discounted fares to seniors, people with disabilities and students. Revenue from the reduced-fare reimbursement is projected to be $32.0 million and is $1.3 million less than the prior year. The reduced-fare reimbursement for the State fiscal year starting in July of 2008 was eliminated. The 2008 forecast contemplates the restoration of this revenue. Advertising, charter, and concessions revenues in 2008 are projected to be $28.2 million, which is $5.0 million more than the prior year’s actual revenue and results from higher revenue from concessions and advertising. Investment income is estimated to be $5.6 million, which is $4.6 million (50.0 percent) lower than 2007 actual income. This is primarily due to lower investable cash balances. Statutory required contributions of $5.0 million are on par with budget. The Regional Transportation Authority Act requires the City of Chicago and Cook County to contribute $3.0 million and $2.0 million, respectively, towards CTA operations each year. Other revenues, which include parking fees, sale of real estate and rentals, are projected to be $10.6 million, which is $6.0 million lower than the prior year. In 2008, CTA outsourced its real estate management functions which will result in significant increases in 2009 revenue from real estate related activities such as concessions, rentals and sale of property. Public Funding The public funding required to meet CTA’s 2008 operational costs is $661.5 million. This funding is composed of sales tax and discretionary funding from the 1983 Regional
TOTAL REVENUE2008
Forecast(IN THOUSANDS $)
Fares and Passes 466,707Reduced Fare Subsidy 32,000Advertising, Charter and Concessions 28,200Investment Income 5,600Contributions From Local Governments 5,000All Other Revenue 10,600
Total System Generated Revenue 548,107Public Funding through RTA 641,533Transfer from Capital 20,000
Total Public Funding 661,533Total 2008 Revenue 1,209,640Total 2008 Expense 1,209,640
2008 Funding Gap 0
- 9 -

2008 Operating Budget
- 10 -
Transportation Authority Act, new funding from the 2008 legislation, the prior years’ positive budget variance and preventive maintenance funds, as detailed in the table below. The CTA amended its budget in July 2008 to recognize $20.0 million in capital funding and $20.0 million from the prior years’ positive budget variance. Amended Operating Budget Schedule
(In Thousands)Amended
Budget Forecast (Unfav)/Fav (Unfav)/Fav2008 2008 Variance % Variance
Operating Expenses
Labor $ 876,350 $ 884,683 $ (8,333) (1.0) %Material 92,430 89,469 2,961 3.2 %Fuel 89,919 91,095 (1,176) (1.3) %Power 35,330 38,326 (2,996) (8.5) %Provision for Injuries and Damages 14,000 14,000 - - %Purchase of Security Services 33,600 32,442 1,158 3.4 %Other Services 68,011 59,625 8,386 12.3 %
Total Operating Expenses $ 1,209,640 $ 1,209,640 $ 0 0.0% %
System Generated Revenue
Fares and Passes $ 463,467 $ 466,707 $ 3,240 0.7 %Reduced Fare Subsidy 32,300 32,000 (300) (0.9) %Advertising, Charter & Concessions 28,000 28,200 200 0.7 %Investment Income 6,340 5,600 (740) (11.7) %Statutory Required Contributions 5,000 5,000 - - %All Other Revenue 13,000 10,600 (2,400) (18.5) %
Total System Generated Revenue $ 548,107 $ 548,107 $ - - %
Public Funding Required for Operations $ 661,553 $ 661,553 $ - - %
Capital- Preventative Maintenance 20,000 20,000 - - %Prior Year Positive Balance 20,000 20,000 - - %Public Funding Available through RTA 485,400 485,400 Additional Public Funding 136,432 136,432 - - %
Total Funding $ 661,832 $ 661,832 $ - - %
Recovery Ratio* 49.30% 51.00% 1.70% 0.3 %
Required Recovery Ratio 52.00% 52.00% - - %
Fund Balance $ 299 $ 299 $ - - %
*Recovery ratio is calculated by dividing System Generated Revenues over Operating Expense. The calculation includes, In-kind revenues and expenses for security provided by the City of Chicago, excludes security expense and includes some grant revenues.
- 10 -

President’s 2009 Proposed Operating Budget
- 11 -
INTRODUCTION This summary assesses the region’s current financial landscape, the underlying assumptions used and the solutions proposed within in the President’s proposed 2009 operating budget. The current fiscal forecast indicates that the nation and the region are facing a sluggish economic outlook. This means that the challenges facing the CTA in 2008 are likely to endure in 2009, creating higher costs and lower revenues than are anticipated to provide the CTA’s service.
One of the most significant challenges is the higher price of diesel fuel. The CTA also faces higher costs for electric power and materials in general, raising overall operating costs. Despite the inflationary pressure on the CTA’s essential commodities, the President’s 2009 proposed budget sharpens the Authority’s focus on providing on-time, clean, safe, courteous and efficient service. The CTA will concentrate on making existing services more efficient, and will implement a more fluid scheduling system that can adjust to meet passenger demand when travel patterns and rider behaviors change.
Another key priority in the President’s 2009 proposed budget is the continued use of new technologies that track CTA vehicles to provide valuable arrival information for customers, as well as provide performance data for managers. The Authority will also move forward with new hybrid technologies on articulated buses that achieve both fuel and labor efficiency because they move more customers with the same fixed resources. Lastly, the performance management team will continue to work with departments throughout the CTA to optimize productivity and ensure the best use of limited resources. In order to continue providing the best possible service and to focus on these priorities, the CTA undertook several belt-tightening measures throughout the year to reduce costs associated with the management and administration of the Authority. Among other things, it implemented a new performance-based budget process that examined the activities of each organizational unit to understand which could be made more efficient, reduced or eliminated. The process was
Chicago RegionUltra Low Sulphur Diesel Prices
2.00
2.50
3.00
3.50
4.00
4.50
5.00
Feb-07Apr-0
7
Jun-07
Aug-07
Oct-07
Dec-07
Feb-08Apr-0
8
Jun-08
Aug-08
Dol
lars
per
Gal
lon
T rac tion Power Unit C os t Per K ilowatt Hour
$0.06
$0.08
$0.10
$0.12
Jan-07 May-07 Sep-07 Jan-08 May-08 Sep-08 Jan-09 May-09
- 11 -

President’s 2009 Proposed Operating Budget
- 12 -
guided by two key principles: first, that safety would not be compromised and second, that service would remain the same as last year. Quality service was the central focus for all departments. Unfortunately, belt tightening alone will not result in a balanced budget. The President’s 2009 proposed budget includes an across-the-board fare increase, to begin in January 2009. Under this proposal, cash fares would be raised by $0.25 and pass fares will be raised by 20.0 percent. It is important to note that this is the first time that pass fares will increase since 1998, and, adjusting for inflation, the price will still remain below 1998 levels. The CTA proposes to keep reduced fares the same so that the most vulnerable riders will not be affected. Fortunately, ridership continues to grow, helping to maintain strong revenue at the farebox. The President’s proposed 2009 budget commits to maintaining 2008 service levels to meet the increased demand. On the revenue side, one of the requirements of the State legislation was that senior citizens be allowed to ride free, when previously they paid half of the full fare. The Chicago City Council added, as a condition for granting a portion of the Real Estate Transfer Tax, the requirement that disabled veterans and military personnel ride for free. These policies are estimated to reduce the CTA’s revenues by approximately $30 million per year. The impact of this revenue erosion was further exacerbated by the loss of the annual reduced-fare subsidy, equaling $32.2 million per year. The President’s 2009 proposed budget assumes that the CTA will receive $723.3 million in public funding. It also assumes that any capital funding legislation that may pass in FY 2009 will not provide any additional funds until FY 2010. As a result, no new capital funding is included in the 2009 proposed budget. Finally, the President’s 2009 proposed budget assumes that the State reduced-fare subsidy will not be available for the first half of 2009, but will resume for the second half of the year. Despite the lack of a new capital program, the CTA will continue to take steps to improve its infrastructure and increase customer satisfaction. For example, the Authority has leveraged future federal funds to lease, rather than purchase, new buses, which are critical to renewing the fleet. While these lease costs show up as a new cost in the operating budget, a newer fleet is central to the CTA’s goal of providing higher quality service to its customers. The lease costs of new buses are also offset with savings in fuel and labor in bus maintenance. In addition, several previously funded capital projects are expected to be completed in 2009, including the renovation of the Red, Purple and Yellow Line’s Howard Terminal and the Brown Line Capacity Expansion Project. As these are completed, customers will enjoy modern facilities and restored travel speeds when they use the CTA. It is expected that the completion of these considerable construction projects will contribute to rail ridership growth in 2009.
- 12 -

President’s 2009 Proposed Operating Budget
- 13 -
RIDERSHIP The CTA estimates a system-wide ridership at 517.8 million, a 0.12 percent decline, when compared to the amended 2008 budget. This ridership decline is expected to result from the performance of the economy, which is expected to continue to be sluggish, and the proposed fare increase. Bus ridership is expected to be 309.5 million in 2009, 6.6 percent lower than the 2008 amended budget. Rail ridership is expected to be 208.3 million in 2009, 8.1 percent higher than the 2008 amended budget. While current ridership projections anticipate a 0.12 percent decrease in 2009, systemwide ridership is expected to begin a positive growth trajectory again in 2010 and remain positive in the years to come. 2009 BUDGET OVERVIEW The President’s 2009 proposed operating budget is $1.324 billion, which is $115 million (9.5 percent) more than the 2008 amended budget. The 2009 proposed budget includes labor savings from staff reductions, but does not reduce total vehicle service hours. Reduced staff hours will occur in areas that do not directly affect the customer experience. Labor Expenses: 2009 labor expenses are estimated to be $890.6 million and constitute approximately 67.0 percent of the CTA’s operating budget. 2009 is the third of a five-year union agreement between the CTA and its labor unions that provides predictable but modest increases in labor costs. Although total labor costs are higher in 2009, the budgeted labor costs reflect reductions in administrative, management and support staff. The overall headcount for the President’s 2009 operating proposed budget is 396 positions fewer than the 2008 amended budget. This represents 210 fewer administrative positions Authority-wide and 186 fewer maintenance and facilities operations positions. In addition, there is a 135 position equivalent reduction for bus and rail (STO) operators. The reduction in bus and rail (STO) operations is primarily composed of track flagmen, Customer Assistants and towermen associated with construction projects. As a result of the decreased construction activity planned for 2009, fewer of these positions were required. Material Expenses: The President’s 2009 proposal budgets material costs at $94.8 million, which is $5.3 million more than the 2008 amended budget and $22.5 million higher than the
2009 Operating Expenses
Other10%
Injuries2%
Security3%
Pow er3%Fuel
8%
Material7%
Labor67%
- 13 -

President’s 2009 Proposed Operating Budget
- 14 -
Authority’s initial 2008 budget of $72.3 million. Although service levels will remain the same, the challenges of maintaining an aging bus and rail fleet will result in higher replacement costs for major fleet components, such as doors, brakes and wheels. The CTA expects that the purchase of 1,050 new buses over the last two years will help to stem the steep increase in bus maintenance costs, but expects little relief on the rail side, where currently 55% of the CTA rail car fleet are beyond the Federal Transit Administration’s (FTA) useful life recommendation. Fuel Expenses: Total diesel fuel costs for 2009 are expected to be $102.8 million, $11.7 million more than 2008’s amended budgeted amount and $54.4 million more than the CTA’s original 2008 budget. Going forward, the CTA will seek to reduce fuel costs by employing more fuel efficient technologies such as hybrid engines. The President’s 2009 proposed budget estimates the cost of electric power for revenue equipment at $40 million, which is 13.0 percent higher than the 2008 amended budget. Provision for Injuries and Damages: The 2009 proposed funding for injuries and damages is $30 million, reflecting an increase of $16 million from the 2008 amended budget but consistent with the original 2008 projection. Purchase of Security Services: Security services include 24-hour patrol services provided by the Chicago, Evanston, and Oak Park Police Departments and contracts with private firms for guard and canine security. The 2009 proposed cost of security services is estimated to be $33.4 million, which is $1 million more than the 2008 budget. This increase is only $1 million due to investments in new surveillance cameras and sensors for the rail system. In addition to the services contracted by the CTA, the City of Chicago provides $22 million in services from the Chicago Police Department’s Public Transportation Section at no charge to the CTA. Other Expenses: These expenses are proposed in the 2009 budget to be $132.8 million, an increase of $64.8 million over the 2008 amended budget. This category includes, but is not limited to, utilities for CTA facilities, advertising and marketing expenses, equipment and software maintenance, accounting, engineering, legal and other consulting services, banking fees, and commissions for the sale of fare media. The budget also reflects provision for a reserve for injuries and damages. The greatest increase in this category is the $31.5 million in Pension Obligation Bond (POB) interest required by the 2008 legislation that enabled the CTA to issue bonds to regain long-term solvency in its pension funds. As indicated in the above chart, CTA’s total obligation for POB interest in 2009 is 131.4 million, a portion of which is capitalized and paid from bond proceeds. As a result of the sale of the Bonds, CTA’s pension plan is now 80% funded. In 2010
Pension Obligation Bond Debt Service
131.4 131.4 131.4141.4
156.6
2009 2010 2011 2012 2013
Dol
lars
in M
illio
ns
- 14 -

President’s 2009 Proposed Operating Budget
- 15 -
the POB debt service will increase to over $100 million and will continue to rise in the following years. The debt service requirement will add to CTA’s expenses. OPERATING REVENUES The CTA has two main revenue categories: system-generated revenues and public funding. System-Generated Revenues: System-generated revenues include fares and passes, reduced-fare reimbursement, advertising, investment income, statutorily-required cash contributions, and other miscellaneous revenues. In 2009, system-generated revenue is projected to be $601.2 million, representing a $53.3 million (9.7 percent) increase over the amended 2008 budget. The growth in estimated system-generated revenue is due to the proposed fare increase, revenue from the sale of excess property, increased advertising revenue, and other new revenue initiatives. Service & Fares: Fares were last increased in January of 2006 from $1.75 to $2.00 for cash bus fares and for transit card rail rides. Other fares, including passes, did not increase. If CTA’s fares were adjusted for inflation as tracked through the Consumer Price Index (CPI) over the last 10 years, CTA current pass fares cost less than they did 10 years ago. Since 1988, CTA’s costs have risen significantly, particularly the costs of fuel, electricity and materials. In January 2006, CTA paid an average of $2.20 per gallon for ultra low sulfur diesel fuel. In July 2008, the average price of one gallon of fuel was $4.50, an increase of more than 100%. Similarly, in 2006 the CTA paid $23 million for electricity to power its rail system and in 2009 will pay $39.9 million, a 73% increase. To offset rising costs and lost revenue, the CTA has aggressively reduced costs, particularly in administrative functions. Other transit systems across the country (as well as other industries which depend on fuel such as airlines and trucking) are facing increased costs primarily due to the cost of fuel. In response, many transit systems have raised fares within the past year, or are proposing to raise fares in 2009. Despite rising costs and the revenue erosion brought on by the weak economy, the President’s 2009 proposed budget recommends no cuts in overall service levels. Demand for the CTA’s bus and rail services continue to grow and the CTA will focus on continuing to provide current levels of service to our customers as they deal with the economic downturn.
TOTAL REVENUE2009
BUDGET(IN THOUSANDS $)
Fares and Passes 519,213Reduced Fare Funding 16,100Advertising, Charter and Concessions 40,500Investment Income 6,300Contributions From Local Governments 5,000All Other Revenue 14,100
Total System-Generated Revenue 601,213Public Funding through RTA 655,800Real Estate Transfer Tax 67,500
Total Public Funding 723,300
- 15 -

President’s 2009 Proposed Operating Budget
- 16 -
Consequently, and in order to comply with the balanced budget requirement, the President’s 2009 proposed budget recommends an across-the-board increase in fares. Cash fares on the bus system will increase from $2.00 to $2.25, a 12.5% increase. For customers using a full fare transit card, the bus fare will also rise a quarter from $1.75 to $2.00. Rail customers will similarly see fares rise from $2.00 to $2.25. The President’s 2009 proposed budget calls for elimination of the 10% bonus for customers purchasing $20 or more in pay-per-use value to a Chicago Card or Chicago Card Plus. Currently, customers who purchase $20 receive $22 in value added to the card resulting in a discount relative to other fare media. Chicago Card and Chicago Card Plus customers will continue to benefit from the convenience of faster boarding and fare protection in the event of a lost or stolen card. The President’s 2009 proposed budget also recommends a 20.0 percent increase in pass prices, which have remained level for the past 10 years. The 2009 proposed budget would also eliminate the 2-Day and 5-Day visitor passes. Collectively they represent less than 1% of passes sold, and their elimination will result in a cost savings to the Authority. Even with these increases, the cost of riding CTA using passes, adjusting for inflation, is lower than it was in 1998. Given how much the costs of other modes of transportation have increased during that period, the CTA remains one of the best values in the region.
- 16 -

President’s 2009 Proposed Operating Budget
- 17 -
CTA FARE TYPESCURRENT
FARE STRUCTURE(EFFECTIVE 1/1/2006)
PROPOSED FARE STRUCTURE
(EFFECTIVE 1/1/2009)
Full Fare Transit Card (TC) Bus $1.75 $2.00 Full Fare TC Rail $2.00 $2.25 Full Fare Chicago Card (CC) Bus $1.75 $2.00 Full Fare CC Rail $1.75 $2.25 Full Fare Cash (bus only) $2.00 $2.25
TC or CC Transfer 1 $0.25 $0.25
Chicago Card Bonus 2 10% Eliminated1-Day Pass $5.00 $6.00 2-Day Visitor Pass $9.00 Eliminated3-Day Visitor Pass $12.00 $15.00 5-Day Visitor Pass $18.00 Eliminated7-Day Pass $20.00 $24.00 Full Fare 30-Day Pass $75.00 $90.00
U-Pass 3 - 20% Increase
Reduced Fare 4 TC or CC $0.85 UnchangedReduced Fare Cash (bus only) $1.00 UnchangedReduced Fare TC or CC Transfer $0.15 UnchangedReduced Fare 30-Day Pass $35.00 Unchanged
1 Transfer fare allows two additional rides within two hours of the first boarding2 For every $20 purchase of pay-per-use fares, $22 of value is added to the card3 Available through participating universities only; price change effective 2009 Fall Term4 Reduced fares offered to eligible customers only
Fares and Passes: Revenue from fares and passes is estimated to be $519.2 million in 2009. This represents a growth of $52.5 million (11 percent) over the 2008 amended budget. The growth in fare and pass revenues is tied to a higher average fare which is forecast to increase from $.89 per ride to $1.00 per ride as a result of the proposed fare increase. Reduced-Fare Funding: The CTA provides approximately 42.9 million reduced fare trips to qualified students and people with disabilities. Additionally, the CTA is expected to provide 22.1 million free rides to registered seniors, active military and disabled veterans. The State of Illinois has customarily reimbursed these reduced fares by about $32 million per year; however the funding was eliminated in mid-2008 leaving a budgetary shortfall. The CTA is working with
Recommended Fare Structure for 2009
- 17 -
its sister agencies and the RTA to restore the funding and for purposes of this budget has assumed that the funding will resume for the latter half of 2009.

President’s 2009 Proposed Operating Budget
- 18 -
Advertising, Charter, and Concessions: Revenue in this category includes advertisements on buses, trains and stations, income from concessions and other non-farebox revenue. In 2009, revenues for this category are estimated to be $40.5 million. This is up from the 2008 amended budget due to increased revenues from vehicle and platform advertising and billboard sales. Additionally, in 2008 the CTA signed a contract for external real estate services including the marketing of concession space and the implementation of transit-oriented developments. That contract is expected to yield results in the 2009 calendar year. A newly organized group within the CTA will focus explicitly on revenue creation in 2009. Investment Income: Investment income is budgeted at $6.3 million in the proposed budget. This is $4.4 million less than the 2008 forecast, but is equal to the 2008 amended budget. The decrease over forecasted levels is due to lower projected cash balances and lower rates of return. Statutory Required Contributions: Statutorily-required cash contributions are budgeted in the President’s 2009 proposal at $5.0 million, unchanged from the 2008 budget. The Regional Transportation Authority Act requires the City of Chicago to contribute $3.0 million, and Cook County to contribute $2.0 million each year toward CTA operations. These required cash contributions are in addition to other cash and in-kind contributions from the City of Chicago and Cook County. The Chicago Police Department’s Public Transportation Section provides more than $22.0 million of security services to the CTA while Cook County provides $3.5 million of in-kind service through the Sheriff’s Work Alternative Program (SWAP). Under the SWAP program, non-violent offenders in Cook County supplement existing CTA employees to clean bus turnarounds and garages. All Other Revenue: This category includes operating grants from the FTA, parking charges, rental revenue, and third-party contractor reimbursements and filming fees. Other revenues are projected to be $14.0 million in 2009, $1.0 million more than was budgeted in 2008. PUBLIC FUNDING Public funding that’s available for CTA operations is determined by the funding mark issued by the RTA, which is based on the RTA’s revenue projection for the year. All of the public funding for operations received by the CTA, Metra and Pace is provided by the RTA and currently consists of two principal sources: (1) the RTA sales tax and (2) the State of Illinois’ Public Transportation Fund, which is disbursed by the RTA. The RTA sales tax is the primary source of CTA public funding. Of the original 1.0 percent RTA sales tax authorized in 1983, the CTA receives 100.0 percent of the taxes collected in the City of Chicago and 30.0 percent of those collected in suburban Cook County, after the RTA retains its 15.0 percent share. In 2008, this totaled $303 million for CTA. Of the 0.25 percent sales tax increment authorized by the 2008 legislation, the CTA receives 48.0 percent of what remains after allocations are made to Pace for the ADA Paratransit Fund and the Suburban Community Mobility Fund, and to the RTA for its Innovation, Coordination and Enhancement Fund (ICE). In 2008, these three funds received $130 million, leaving approximately $120 million to fund Service Board operations. Therefore, CTA’s 2008 portion was $57 million. Finally, in 2008, the CTA received discretionary operating
- 18 -

President’s 2009 Proposed Operating Budget
- 19 -
funding of $198.1 million to satisfy the public funding commitment embedded in the CTA’s recovery ratio goal. (For a graphic representation of this funding source breakdown, see APPENDIX A 2). In 2009, public funding through the RTA and the State will total $655.8 million, an increase of $97 million over the 2008 amended budget. Based on an estimate from the City of Chicago’s Office of Budget and Management, the CTA expects to receive $67.5 million from the Real Estate Transfer Tax in 2009. In 2008, the CTA transferred capital funds to reduce the public funding gap, deferring bus and rail car overhauls. In 2009, however, the CTA does not have the option of using capital funds to balance the operating budget because there is no unencumbered funding left in the capital budget. Instead, greater cost cutting measures and a proposed fare increase are used to close the budget gap. Recovery Ratio: As calculated by the RTA, the recovery ratio requires CTA’s system-generated revenues to cover 50.0 percent of projected expenditures for 2009. The proposed operating system budget estimates the recovery ratio at 52.7 percent. This estimate takes into account allowable exclusions including Pension Obligation Bond (POB) debt service, passenger security, in-kind services provided by the Chicago Police Department and the same level of grant-funded revenues included in the 2008 budget. Performance Goals and Metrics: The President’s 2009 proposed operating budget is directly linked to performance management goals for each business unit within the CTA. (See Appendix A-1 for a detailed discussion of specific metrics and goals.) Each department has set goals tied to its operating budget. Departments will be assessed throughout the year and managers will continue to be held accountable for both budget adherence and meeting performance goals.
- 19 -

President’s 2009 Proposed Operating Budget
- 20 -
President’s 2009 Proposed Operating Budget Schedule
(In Thousands)Amended Proposed
Actual Budget Forecast Budget2007 2008 2008 2009
Operating Expenses
Labor $ 784,841 $ 876,350 $ 884,683 $ 890,623Material 84,178 92,430 89,469 94,763Fuel 71,181 89,919 91,095 102,852Power 28,141 35,330 38,326 39,944Provision for Injuries and Damages 25,000 14,000 14,000 30,000Purchase of Security Services 31,363 33,600 32,442 33,441Other Services 69,465 68,011 59,625 132,790
Total Operating Expenses $ 1,094,169 $ 1,209,640 $ 1,209,640 $ 1,324,413
System Generated Revenue
Fares and Passes $ 457,299 $ 463,467 $ 466,707 $ 519,213Reduced Fare Subsidy 33,308 32,300 32,000 16,100Advertising, Charter & Concessions 23,164 28,000 28,200 40,500Investment Income 10,495 6,340 5,600 6,300Statutory Required Contributions 5,000 5,000 5,000 5,000All Other Revenue 16,654 13,000 10,600 14,000
Total System Generated Revenue $ 545,920 $ 548,107 $ 548,107 $ 601,113
Public Funding Required for Operations $ 548,249 $ 661,533 $ 661,533 $ 723,300
Capital- Preventative Maintenance - 20,000 20,000 - Prior Year Positive Balance 0 20,000 20,000 - Public Funding Available through RTA 548,249 485,400 485,400 723,000 Additional Public Funding 0 136,432 136,432 0
Total Funding $ 548,249 $ 661,832 $ 661,832 $ 723,000
Recovery Ratio* 53.09% 49.30% 51.00% 52.70%
Required Recovery Ratio 53.00% 52.00% 52.00% 50.00%
Fund Balance $ 0 $ 299 $ 299 $ -
Budgeted Budgeted Forecasted Budgeted Positions Positions Positions Positions
2007 2008 2008 2009
TOTAL CTA WITHOUT STO 5,302 5,233 5,143 5,001
Bus STO Positions** 4,274 4,346 4,346 4,341 Rail STO Positions** 1,331 1,288 1,288 1,158
TOTAL CTA 10,907 10,867 10,777 10,500
*Recovery ratio is calculated by dividing System Generated Revenues over Operating Expense. The calculation includes in-kind revenues and expenses for security provided by the City of Chicago, excludes security expense and includes some grant revenues.**STO Full Time Equivalents
- 20 -

President’s 2010-2011 Proposed Operating Financial Plan INTRODUCTION
The CTA’s long-term ability to continue to operate depends on its ability to provide quality, reliable service with the operating resources available and to secure increased capital funding to allow for the replacement of obsolete infrastructure. Steps to manage operations and control costs are described in the President’s Proposed 2009 Operating Budget. Specifically, carefully controlling labor, contract and material costs and increasing fares will balance the operating budget. It is anticipated that these actions will provide sufficient resources for CTA operations for the next three years. OPERATING EXPENSES The President’s proposed operating expenses are $1.389 billion and $1.477 billion respectively for 2010 and 2011. Labor: Labor expenses, which account for approximately three-fourths of the CTA’s total operating expenses, are composed of wages, health care, pension, worker’s compensation, and payroll taxes for social security (FICA). In terms of wage costs, all three years within the Financial Plan are under the existing union contracts. Hence, labor rates for the bulk of the labor force are predictable. Per the labor agreement, the annual escalation rate increases from 3 percent in the first three years to 3.5 percent for the last two years. One unknown regarding the labor contract is the future wage rates for craft employees. Their wage rates are set by the prevailing wage for the region, which is determined each year. Pension costs are determined by the schedule of repayment for the Pension Obligation Bond (POB). This expense is supported by the Real Estate Transfer Tax (RETT), but due to the generally sluggish economy, there have been fewer real estate transactions than projected and RETT revenues may not be adequate to cover costs. Health care contributions by employees have been frozen by the current contract, which means that the CTA has had to shoulder the burden of increased health care premiums. The CTA has participated in joint contracting with the City of Chicago and other sister agencies to try to achieve the best bulk health insurance rates possible, but all agencies are subject to the general trend of steadily increasing annual health care premiums. Materials: The price of materials used to maintain the CTA’s bus and rail fleets, rail tracks, facilities, stations and fare revenue equipment has been increasing. The CTA continues to seek ways to contain materials costs through supply chain improvements. The CTA projects materials costs to increase to $ 96.7 million in 2010 and $ 98.6 million in 2011. Energy: This proposed financial plan estimates 2010 fuel costs at $112.1 million and 2011 fuel costs to be $115.5 million.
- 21 -

President’s 2010-2011 Proposed Operating Financial Plan Electric: In 2010, the CTA projects power costs to equal $41.9 million, an increase of 5 percent from the President’s proposed 2009 budget. In 2011, the CTA projects an additional increase of 2 percent, bringing power costs to $42.8 million. Provision for Injuries and Damages: Funding for injuries and damages expenses in 2010 and 2011 are expected to mirror the proposed 2009 budget level of $30 million with slight increases. Purchase of Security Services: For the Plan years, the CTA estimates security expenses will increase by 4.0 percent in both years, bringing the cost of security to $35.1 million in 2010 and $35.8 million in 2011. Other Expenses: Other expenses include Pension Obligation Bond (POB) interest, utilities, advertising, equipment, software maintenance, accounting, engineering, legal and other consulting services, banking fees and commissions, and interest on the pension obligation bond. The total value of other expenses is projected to be $146.1 million in 2010 and $149.9 million in 2011. OPERATING REVENUE System-Generated Revenues Fares and Passes: Over the longer-term, ridership is expected to trend upward despite the proposed fare increase because of the continuation of expected high gasoline prices. The increased revenues resulting from the fare increase will continue to provide greater resources for operations. Reduced-Fare Funding: For future years, the CTA is assuming that the reduced-fare funding will be restored to its full level of approximately $32 million annually. Advertising, Charter and Concessions: The CTA has intensified its efforts to produce revenue from areas other than the farebox. A new organizational unit combines the functions of marketing and advertising, real estate, and planning and development, to ensure customer satisfaction and to explore innovative ways to raise revenue. Accordingly, revenues in these areas are expected to increase to $41.7 million in 2010 and $58.4 million in 2011 from $23.2 million actual in 2007. Investment Income: As in 2009, investment income is expected to be lower than historical levels because of reduced cash on hand under tighter operating conditions. This situation will be mitigated by higher interest rates expected over the next several years. Accordingly, investment income is expected to be $11.7 million and $12.3 million in 2010 and 2011 respectively.
- 22 -

President’s 2010-2011 Proposed Operating Financial Plan Statutory Required Contributions: Revenues in this category are forecast to be $5 million per year, the same as 2009. The Regional Transportation Authority Act requires that the City of Chicago contribute $3 million annually and Cook County contribute $2 million annually to CTA operations. Other Revenues: Revenues in this category include $14.0 million in 2010 and $14.2 million in 2011 and include parking fees, revenue from rental properties, third-party contractor reimbursements, fees from filming and other miscellaneous revenues. Public Funding Public funding through the RTA statutory formula is estimated to be $749.7 million in 2010 and $787.2 million in 2011. The CTA will receive $723.3 in 2009. Recovery Ratio: The Regional Transportation Authority Act requires the region to fund 50.0 percent of its expenses through revenues generated by the RTA and its three Service Boards. The RTA has set a required recovery ratio target of 50.0 percent for CTA. The RTA assigns each Service Board recovery ratio targets when it issues the funding marks required by the Act. The budgets submitted by each Service Board must be balanced and meet the required recovery ratio to be approved by the RTA. The recovery ratio measures the percentage of expenses that a Service Board must pay against revenues that it generates. System-generated revenues, operating expenses and certain statutory exclusions are used in the calculation. The CTA’s estimated recovery ratios in 2010 and 2011 are 52.2 percent and 53.4 percent, respectively, just over the requirement. The CTA, Metra and Pace together have a higher system-generated fare recovery ratio than almost every other metropolitan region in the United States, even when accounting for different methodologies used in calculating the ratios. While other regions have strived to increase cost efficiency, they have prioritized ridership growth and new revenues to support transit growth instead of a specific measure like recovery ratio. As with transit funding in general, the region needs to evaluate the effect of the mandated recovery ratio on its ability to effectively use enhanced neighborhood public transit services to fight congestion, improve air quality, and increase regional economic competitiveness. Accounting Notes: The CTA’s ongoing operations are accounted for on a proprietary fund basis. Operations are financed and operated similarly to a private business, where the intent is that the costs of providing services to the public should be recovered through user charges. The full accrual accounting method is used, recording revenues when earned and expenses when incurred.
- 23 -

President’s 2010-2011 Proposed Operating Financial Plan President’s 2010-2011 Proposed Operating Financial Plan Schedule (In Thousands)
AmendedActual Budget Forecast Plan Plan Plan
2007 2008 2008 2009 2010 2011
Operating Expenses
Labor $ 784,841 $ 876,350 $ 884,683 $ 890,623 $ 926,248 $ 1,003,000Material 84,178 92,430 89,469 94,763 96,658 98,591Fuel 71,181 89,919 91,095 102,852 112,109 115,472Power 28,141 35,330 38,326 39,944 41,941 42,780Provision for Injuries and Damages 25,000 14,000 14,000 30,000 30,600 31,212Purchase of Security Services 31,363 33,600 32,442 33,441 35,113 35,815Other Services 69,465 68,011 59,625 132,790 146,069 149,900
Total Operating Expenses $ 1,094,169 $ 1,209,640 $ 1,209,640 $ 1,324,413 $ 1,388,738 $ 1,476,770
System Generated Revenue
Fares and Passes $ 457,299 $ 463,467 $ 466,707 $ 519,213 $ 553,812 $ 565,841Reduced Fare Subsidy 33,308 32,300 32,000 16,100 32,300 32,300Advertising, Charter & Concessions 23,164 28,000 28,200 40,500 41,715 58,401Investment Income 10,495 6,340 5,600 6,300 11,700 12,285Statutory Required Contributions 5,000 5,000 5,000 5,000 5,000 5,000All Other Revenue 16,654 13,000 10,600 14,000 14,420 14,853
Total System Generated Revenue $ 545,920 $ 548,107 $ 548,107 $ 601,113 $ 658,947 $ 688,680
Public Funding Required for Operations $ 548,249 $ 661,533 $ 661,533 $ 723,300 $ 749,700 $ 787,185
Capital- Preventative Maintenance - 20,000 20,000 - - - Prior Year Positive Balance 0 20,000 20,000 - - - Public Funding Available through RTA 548,249 485,400 485,400 723,000 749,700 787,185Additional Public Funding 0 136,432 136,432 0 0 0
Total Funding $ 548,249 $ 661,832 $ 661,832 $ 723,000 $ 749,700 $ 787,185
Recovery Ratio* 53.09% 49.30% 51.00% 52.70% 53.10% 53.40%
Required Recovery Ratio 53.00% 52.00% 52.00% 50.00% 50.00% 50.00%
Fund Balance $ 0 $ 299 $ 299 $ - $ - $ -
*Recovery ratio is calculated by dividing System Generated Revenues over Operating Expense. The calculation includes in-kind revenues and expenses for security provided by the City of Chicago, excludes security expense and includes some grant revenues.
- 24 -

President’s 2009-2013 Proposed Capital Improvement Program INTRODUCTION This proposed 2009-2013 Capital Improvement Program (CIP) identifies and targets available capital funds toward key capital renewal and improvement needs of the CTA system. Substantial and consistent investment in capital infrastructure has a positive effect on the CTA’s operating budget. Capital infrastructure in a state of good repair leads to reduced maintenance costs, greater operating efficiency and improved customer satisfaction. The program is funded from four sources:
• Federal Transit Administration (FTA) • Regional Transportation Authority (RTA) • State of Illinois (IDOT) • Capital Bonds (CTA)
These sources provide funding to cover projects contained in the typical CTA five-year capital program. The 2009-2013 capital program includes a projection of $300 million each year during 2010-2013 from a successor to the Illinois FIRST program. The RTA has requested CTA to anticipate that a State capital funding program will be in place by 2010. This proposed CIP totals $3 billion, with $2.9 billion in projects to eliminate slow zones, renew the CTA assets, overhaul and replace the fleet, and bring the system to a state of good repair. In addition $40 million is programmed for the completion of the Brown Line Capacity Expansion Project, a vital system expansion. To alleviate an operating budget shortfall, the 2008 capital program funded $20 million of capital eligible activities in the operating budget. This amount is in addition to capital funds diverted in previous years. As a vital part of steering through the economic slow down, the 2009-2013 program does not propose to divert scarce capital funds to balance the operating budget. The transfer of capital funds to operating would cause additional critical projects necessary for continued progress toward a state of good repair to be delayed or cancelled.
Funding identified in this CIP will only partially meet the CTA’s needs to bring its system to a state of good repair. An estimated $6.8 billion remains unfunded during the five-year period of this CIP. This is an increase over the $6.3 billion shown in the 2008-2012 program due to the continued aging of assets and the lack of a new State capital program. Although a proposed new State funding source is projected to begin in 2010, projects which may be funded with these capital dollars remain a part of the CTA’s unfunded need until a State program is passed and funds are appropriated. The CTA has undertaken a thorough and systematic evaluation of the additional funding needed to reach a state of good repair. Vital projects affecting the quality of service such as track and track bed renewal, fleet replacement, replacement of subway ventilation systems, viaduct renewal, and rail station upgrades remain unfunded. As long as such projects remain unfunded, customers will experience slow zones and service delays as well as lower overall service quality. In addition, to meet the needs of future growth in the region, the CTA needs $4.3 billion for expansion projects such as the Circle Line, and the Red, Orange, and Yellow Line extensions. Maintaining the existing bus and rail system is a top
- 25 -

President’s 2009-2013 Proposed Capital Improvement Program priority; however it is also important to improve the connectivity and usefulness of the system by adding strategic connections and line extensions. As the bus and rail system operates more efficiently, the population of the entire Chicago region will benefit. CTA State of Good Repair Standards The CTA’s goal is not merely to replace equipment and facilities in-kind, but to replace existing systems, where appropriate, with current, modern technology. The CTA has based its state of good repair estimates on the following industry replacement and rehabilitation standards: • Rail lines should be free of slow zones, and should have reliable signal systems. • Buses should be rehabbed at six years and replaced at twelve years. • Railcars should be rehabbed at quarter- and mid-life intervals, and replaced
at 25 years. • Rail stations should be comfortable and secure, and replaced or rehabbed
at 40 years. • Service management systems should be modern and reliable. • Maintenance facilities should be replaced at 40 years (or 70 years if rehabbed). Until the CTA reaches a state of good repair, it will continue to face slow zones, periodic service interruptions, and increased operating and maintenance costs due to deferring capital projects. Meeting and maintaining these standards improves the comfort and reliability of the services the CTA provides its customers, and reduces operating and maintenance costs for the CTA. Prudent investment strategies address both visible signs of system aging, such as station roofs in disrepair, and less visible signs such as leaking tunnels and overburdened power and communication systems. The proposed CIP strives to maintain a balance between investing in upgrades to existing infrastructure and responding to service needs that are visible to our customers. Given the advanced age of many of the CTA assets and the limited resources available for capital needs, the proposed projects are crucial in the maintenance of current service and providing for needed strategic service expansion. However, given the current constraints on capital funding, it is harder to achieve this balance each year. If additional State capital funding is made available in future years, achieving this goal will become possible.
Elimination of Slow Zones a Top Priority Red Line Subway Ties Completed Blue Line (Addison to O’Hare) December 2008 Loop Ties December 2008 Brown Line December 2008 Red Line (North) Summer 2009
- 26 -

President’s 2009-2013 Proposed Capital Improvement Program Unfunded Capital Need The CTA continuously examines the condition of its capital assets by updating cost estimates, project schedules and asset conditions. The result is an annual reevaluation of the level of infrastructure investment needed to allow the CTA to continue to provide safe and reliable service to help meet the region’s growing transit needs. Illinois FIRST took the CTA from funding only 19% of its capital need in 1999 to funding nearly 60% by 2004, which allowed the CTA to make significant progress in improving its capital infrastructure. With the expiration of Illinois FIRST in 2004, State capital funds were no longer available to match Federal programs, resulting in an increased, unfunded need. The CTA’s FY 2005-09 capital budget noted $5.1 billion in total state of good repair need, with $2.9 billion funded and $2.2 billion unfunded. This 2009 – 2013 CIP projects $8.6 billion of total state of good repair need with $3 billion funded and $5.6 billion unfunded. However $1.2 billion of that funding is only a projection, dependent upon authorization of a replacement to Illinois FIRST. The CTA classifies projects supported by these marks as unfunded until positive action by the legislature on a State capital plan. Therefore CTA’s unfunded need is $6.8 billion. Thus, the portion of the CTA’s need which will be funded has dropped from 57% to 20%. Each year that funds are not available for the CTA to fully address its capital needs, its asset base ages further, increasing the cost to bring it to a state of good repair and increasing the operating costs required to maintain the aging infrastructure. Each year some asset classes which were previously in a state of good repair fall into further disrepair. In 1998, only 150 of the CTA’s 1,190 rail cars were considered past their useful lives. Today 659 rail cars have reached 25 years and should be replaced. By 2013, 982 rail cars will have reached the end of their useful lives. Procurements funded in the FY 2009-2013 CIP will replace only 350 of those cars.
1999Funded
19%
Unfunded81%
2005
Unfunded43%
Funded57%
2009
Unfunded80%
Funded20%
Funded vs. Unfunded
- 27 -

President’s 2009-2013 Proposed Capital Improvement Program A Renewed State Capital Program is Essential The Federal funds available under a successor to SAFETEA-LU will require approximately $344 million in non-Federal matching funds to fully utilize the Federal formula funds. Additional funds will also be required to match Federal New Starts funds for new lines and extensions of existing lines. With the expiration of Illinois FIRST in 2004, non-Federal funds are no longer available to match these Federal programs, except for the Brown Line Capacity Expansion Project, which is fully funded. In rating a New Start project, FTA considers the level of commitment of local funds prior to entering into a Full Funding Grant Agreement (FFGA). Without a reliable source of State capital funding, the CTA is not likely to receive a favorable rating, necessary for Federal funding. The loss of this funding has resulted in the delay of several critical infrastructure investments. Projects slowed or delayed include: track and tie replacement, bus midlife overhauls, bus replacements, railcar midlife overhauls, rail car replacement, signal upgrades, station renovation, and rehabilitation of elevators and escalators. In the past, State capital funds have provided the required match to access Federal funds. This reduction has also seriously impacted the CTA’s ability to reach a state of good repair on its capital infrastructure. The Federal transportation program is regularly re-authorized and even when an authorization expires, Congress continues to appropriate funds until a new program is created. Like the Federal program, State road funds continue to be appropriated by the legislature. Unlike the Federal program, when a State transit program expires (as with Illinois FIRST), all transit funding is stopped. This start and stop approach makes it much more difficult to plan and implement transit capital projects. Most transit projects are, by their nature, multi-year projects which require multi-year commitments of funds. The Downward Spiral of Disinvestment
Thanks to Illinois FIRST, TEA 21, and SAFETEA-LU, the CTA made progress in rebuilding its infrastructure and preventing further system deterioration. The CTA must continue to maintain and upgrade its capital assets to preclude movement toward a state of disinvestment. Disinvestment is characterized by lagging capital investment resulting in system disintegration and trip delays which lead to deteriorating service quality. Consequently, customers leave the system and the financial base begins to erode. This spiral, once engaged, is difficult to reverse. Operating Budget Impact of Capital Program Projects Much of the CTA’s investment in capital projects has a positive impact on the operating budget. However, CTA has been transferring funds from capital project use into the operating budget to meet operating revenue shortfalls. This practice, while providing for continued transit operations, has a negative impact on the long term ability to continue transit service. In 2007, the CTA transferred $53.4 million of capital funding programmed for bus and rail car overhaul activities into the operating budget. Investment in vehicle overhaul programs provides a significant operating savings over time, ensuring continued service quality, on-time performance, reliability
- 28 -

President’s 2009-2013 Proposed Capital Improvement Program and customer comfort. Deferring these overhaul activities will mean that components are not replaced in a scheduled campaign, but through a series of failure-based trips to the maintenance shop. The cost to the operating budget over time is expected to far exceed the value of the transfer. The result will be a balanced operating budget in the short term but a higher operating cost to maintain the same service level in the future. Not performing bus and rail car overhauls which were scheduled to be done with capital funding in FY 2007 will add $.750 million to the operating budget in 2008 and $42.2 million to the operating budget in 2009. Sources of Funds The funding levels used in preparing the proposed 2009-2013 CIP reflect the capital resources available to the CTA from the FTA and through the RTA. These include $1.4 billion from Federal sources, $1.2 billion from a renewed State capital program, $325 million from CTA Bonds, and $105 million from the RTA. Over $30 million of Federal funds are “New Start” funds, the final funding segment of the Brown Line Expansion project under the Full Funding Grant Agreement (FFGA). Total projected available funding is $3 billion. A summary of this funding is presented in the following figure. The Federal funds reflect the passage of a successor to SAFETEA-LU, reauthorizing Federal funding beyond 2009. The State funds project a successor to Illinois FIRST beginning in 2010. The following table details the funding sources supporting this program.
Preliminary FY 2009-2013Capital Improvement Program Funding Sources
(thousands of dollars)
JARC$3,472
5307 Formula $768,100
New State Funding $1,200,000
Homeland Security $32,500
CMAQ$19,772
5309 New Start $30,474
5309 Rail$525,400
RTA - ICE $3,177
CTA Other $4,415
CTA Bond $325,000
Transfer Capital $101,765
Total = $3.0 Billion
- 29 -

President’s 2009-2013 Proposed Capital Improvement Program
Uses of Funds - CIP Goals and Objectives With the RTA capital program marks as a foundation, the President has developed a proposed program of capital projects for the 2009–2013 Capital Improvement Program that commits the organization to the following goals and objectives: • Eliminate slow zones in subways and throughout the system • Fund periodic fleet overhaul programs and regular replacement of both
bus and rail fleets • Upgrade rail stations for CTA customers • Invest in technology to improve operational and management efficiency
As gas prices and congestion in the Chicago area reach historic levels, public transit becomes an even more attractive option to the traveling public. A weak economy and higher motor fuel prices contributed to ridership gains in 2008. Without adequate capital investment, the CTA system will not be able to effectively serve transit customers in the region. Investment in vital public infrastructure projects provides jobs, creates and supports economic growth, and helps ensure the future vitality of the region. Even for people who never use public transportation, relieving congestion is an important goal. As ridership continues to increase, capital infrastructure becomes increasingly important to providing high-quality transit services. The 2009-2013 proposed CIP provides some of the funding necessary to address the CTA’s customers’ concerns over the next five years.
NEW FUNDS 2009 2010 2011 2012 2013 TOTAL
Sec.3 (5309) Fixed Guideway 97,000$ 100,900$ 104,900$ 109,100$ 113,500$ 525,400$ Sec.3 (5309) New Start 30,474$ -$ -$ -$ -$ 30,474$ Sec. 9 (5307) CMAQ 3,772$ 4,000$ 4,000$ 4,000$ 4,000$ 19,772$ JARC 3,472$ -$ -$ -$ -$ 3,472$ Homeland Security (D of J ) 6,500$ 6,500$ 6,500$ 6,500$ 6,500$ 32,500$ Sec.9 (5307) Formula 141,800$ 147,500$ 153,400$ 159,500$ 165,900$ 768,100$
Total Federal 283,018$ 258,900$ 268,800$ 279,100$ 289,900$ 1,379,718$
CTA Bonds -$ 150,000$ 175,000$ -$ -$ 325,000$ New State Funding -$ 300,000$ 300,000$ 300,000$ 300,000$ 1,200,000$ RTA - (ICE) Funds 3,177$ -$ -$ -$ -$ 3,177$ CTA Other 4,415$ -$ -$ -$ -$ 4,415$ Transfer Capital 20,353$ 20,353$ 20,353$ 20,353$ 20,353$ 101,765$
Total Local 27,945$ 470,353$ 495,353$ 320,353$ 320,353$ 1,634,357$
Total Available Funds 310,963$ 729,253$ 764,153$ 599,453$ 610,253$ 3,014,075$
CHICAGO TRANSIT AUTHORITYFY 2009- 2013 CIP FIVE YEAR PROGRAM MARKS
(thousands of dollars)
- 30 -

President’s 2009-2013 Proposed Capital Improvement Program Uses of Funds – Program Summary The following figure shows the proposed 2009-2013 Capital Improvement Program by general category of asset improved or replaced. The table on the following page lists each project in the proposed program. A detailed description of each project can be found following this narrative in the section headed Detail Capital Improvement Program Project Descriptions. Fourteen projects comprise the CTA’s proposed 2009-2013 capital program. Each project is evaluated in an annual review process based on the CTA’s customers’ needs. Evaluation criteria include customer and employee safety, reductions to travel time, increased customer comfort and convenience, system security, impact on system reliability, compliance with regulations and community impact. Rail system projects receive a significantly larger proportion of the proposed capital program funding due to the need to maintain an exclusive right-of-way and the fact that the CTA buses operate on streets maintained by other units of government. The capital projects proposed for 2009-2013 and beyond are intended to address the CTA’s most pressing needs for the bus and rail system, customer facilities and system-wide support network, as constrained by the level of projected funding.
Proposed FY 2009-2013Capital Improvement Program
(thousands of dollars)
Rail System Projects
$1,788,629
Bus System Projects
$530,714
Systemw ide Projects
$694,734
Total = $3.0 Billion
- 31 -

President’s 2009-2013 Proposed Capital Improvement Program
Proposed FY 2009-2013 Capital Program in thousands5 Year Project
Proj # Title Funded 2009 2010-2013 Funding Outyear TotalBus Projects
Rolling Stock021.803 Perform Bus Maintenance Activities 5,088$ 9,274$ 20,353$ 29,627$ 25,441$ 60,157$ 021.806 Perform Mid-Life Bus Overhaul 63,691 10,500 159,833 170,333 116,100 350,124 031.054 Replace Buses 341,709 - 330,754 330,754 530,273 1,202,736
Sub-Total 19,774 510,940 530,714 1,613,017 Rail Projects
Acquisitions & Extensions194.115 Expand Capacity - Brown Line 487,572 42,339 - 42,339 - 529,910
Sub-Total 42,339 - 42,339 529,910
P/W Electric, Signal, Comm.121.500 Replace/Upgrade Power Distribution and Signals 306,466 19,603 67,000 86,603 42,241 435,311
Sub-Total 19,603 67,000 86,603 435,311
P/W Track & Structure171.133 Repair Track and Structure Defects 5,401 9,844 21,603 31,447 27,004 63,852 181.500 Infrastructure Safety & Renewal Program 265,737 - 561,915 561,915 24,612 852,264
Sub-Total 9,844 583,518 593,362 916,116
Rolling Stock022.903 Perform Rail Car Overhaul & Mid-Life Rehabilitation 109,760 20,669 467,547 488,216 657,584 1,255,560 022.906 Perform Rail Car Maintenance Activities 5,960 10,863 23,839 34,701 29,798 70,459 132.056 Purchase Rail Cars 128,678 78,527 464,880 543,408 - 672,086
Sub-Total 110,059 956,266 1,066,325 1,998,105 Systemwide Projects
Miscellaneous150.028 Implement Security & Communication Projects 100,366 6,500 26,000 32,500 - 132,866 308.002 Bond Repayment, Interest Cost, & Finance Cost 170,482 74,702 423,664 498,366 1,270,967 1,939,815 400.500 CMAQ, JARC, UWP & ICE Projects 3,830 14,837 16,000 30,837 - 34,667
Sub-Total 96,039 465,664 561,703 2,107,348
Support Facilities & Equip.073.500 Improve Facilities - Systemwide 68,504 13,307 119,724 133,031 484,258 685,792
Sub-Total 13,307 119,724 133,031 685,792
Capital Project Total 310,965$ 2,703,112$ 3,014,077$
- 32 -

President’s 2009-2013 Proposed Capital Improvement Program The Rail System The CTA’s rail system consists of approximately 1,190 rail cars, traveling over 224.1 miles of track, making approximately 2,413 train trips on eight routes and 144 stations on a typical weekday. The rail system provides 620,000 rides each weekday; customers depend on the CTA’s rail system to deliver them to their destinations quickly and safely. To meet customer expectations, the CTA must coordinate the efforts of thousands of employees working together to deliver on-time, clean, safe and friendly service.
Slow Zone Reduction The CTA has committed to an aggressive slow zone rehabilitation schedule. As the rail structure ages and as ties, track, and fasteners deteriorate, the CTA imposes a slow zone to reduce operating speed over sections of the railroad. This is an interim measure which insures safety until the necessary repair work can be done. The lack of reliable capital funding delays needed construction activity and results in the expansion of the self-imposed slow zones. Recently, the CTA has directed efforts at slow zones. The Red Line Subway slow zones between Clark/Division and Roosevelt were eliminated. Track upgrades between Clark/Division and the north end of the Red Line Subway continues and will be complete by the end of 2008. Work on the extensive slow zone on the O’Hare branch of the Blue Line between Addison and O’Hare will be accomplished with a target completion of December 2008. As of October, 2008 slow zones on CTA’s rail system have been reduced to 9.1 percent. A total of 141,577 feet of slow zones have been removed from a high point of 22.3 percent (263,526 feet). While these are considerable achievements, the rest of the CTA’s track and ties are continuing to age. The remaining ties in the subways are past their useful life and will need replacement soon. The result will be additional slow zones imposed as a safety measure. This will ensure that customers are conveyed safely, but at much slower speeds. A consistent and reliable source of capital funding is necessary to prevent this from happening.
CTA’s infrastructure continues to age –
parts are more than 100 years old
1892-1920 Elevated rail system
Archer and 77th Street Garages, South Shop and West Shops
1940-1960
State and Dearborn Subways, Blue Line-Congress Branch,
North Park and Forest Glen Garages
1969-1970 Red Line-Dan Ryan Branch,
Blue Line-O’Hare Branch (to Jefferson Park)
1983-1984
Blue Line-O’Hare Branch (to O’Hare)
1993 Orange Line to Midway
- 33 -

President’s 2009-2013 Proposed Capital Improvement Program The proposed CIP schedules $9.8 million in FY 2009 for fixing right-of-way, ties, track and structure to reduce slow zone imposition and maintain operating speeds based on the continuous assessment of vital assets and maintaining service standards. In addition to track and ties, the structural steel elements used to support the CTA’s elevated track will be rehabilitated in locations throughout the system. An additional $583.5 million is budgeted during 2010-2013 to continue systematic rehabilitation of the CTA right-of-way. This is far short of the funding needed during this five year period.
Rehabilitation and Capacity Enhancement of Brown Line The CTA’s largest capital construction project, to expand capacity on the Brown (Ravenswood) Line, is programmed for $42.3 million in 2009 in addition to $488 million previously programmed. The FY 2009 Budget will complete funding of the project for a total budget $530 million. This project is expected to be completed in December 2009, on time and within budget. Signal Systems and Traction Power Train movement through the Loop is controlled by a pair of signal towers at the southeast corner (Tower 12) and at the northeast corner (Tower 18). The Loop signals upgrade project is under way to upgrade the train control and track interlocking on this busy part of the CTA rail system. Train control will also be enhanced on both the Lake Street and Wells Street bridges reducing unavoidable delays during seasonal bridge lifts and improving service and operational flexibility on the Green, Brown, Orange, Purple and Pink Lines. Continuation of signal upgrade and replacement for the Blue Line is also funded in the five-year CIP. This project, which began in 2006, will replace the entire signal system in the Dearborn Subway, on the Congress (Forest Park) Branch and on a portion of the O’Hare Branch. Funding of $19.6 million is included in the proposed CIP for Blue Line signals. These upgrades will replace systems that are beyond their useful life, some of which were installed during the initial subway system construction during the 1950s. CTA customers will benefit from smoother train operation, reduced travel times and greater reliability.
Rail Rolling Stock The proposed five-year CIP allocates $543.4 million for the purchase of rail cars that will replace the aging 2200- and 2400-Series fleet and provide additional cars to meet service requirements for the Brown Line Capacity Expansion Project. The average age of the 2200-Series cars are 38.3 years and the 2400-Series cars are 30.3 years. Both have already exceeded their expected service life. The average car in the CTA rail fleet is over 24 years of age in 2008 and approximately 46 percent of the fleet exceeds the 25-year FTA standard life of a rapid transit car.
The CTA has 406 Railcars currently on order. These vehicles are scheduled for
delivery between 2010 - 2012. They will replace rail cars placed into service in
1969 and 1978. They represent the first new
railcars for the CTA in over 15 years.
- 34 -

President’s 2009-2013 Proposed Capital Improvement Program The proposed 2009-2013 capital program sets aside $488.2 million in projected funding during the next five years for the systematic maintenance and upgrade of the CTA’s rail fleet. Without an aggressive maintenance program, many more rail cars would fail in service causing an inconvenience for customers and increasing operating costs. The rail overhaul program helps ensure that the CTA’s rail fleet remains in a state of good repair for providing a better ride quality for customers. The Rail Car Overhaul program reduces operating costs and enhances reliability. Without quarter-life and mid-life overhauls, rail vehicle maintenance costs would be three times the current levels, averaged over the expected twenty-five year life of each car. The Bus System The CTA currently operates a fleet of approximately 2,100 buses, which make over 25,366 weekday trips on 153 routes, providing almost 1.031 million rides on a typical weekday. Each customer who boards a bus at one of 11,833 bus stops located throughout the CTA service area expects reliable service that is safe, clean, on-time, courteous and efficient. The backbone of the bus system is the bus fleet. The system’s success depends on the CTA’s ability to renew, maintain and operate its bus fleet. Bus Rolling Stock Providing new buses reinforces the CTA’s commitment to quality bus service. Through September 2008, CTA received 850 standard 40 foot New Flyer buses. These vehicles are air-conditioned and fully accessible; they represent the continued delivery of a 1,050 bus order which will be completed in spring of 2009. Beginning in the fall of 2008, the CTA will also be placing new articulated hybrid buses in the fleet with the completion of the 150 bus order occurring in the summer of 2009. These 60-foot buses will provide greatly needed capacity on heavily trafficked routes. The entire CTA bus fleet is ADA accessible and air-conditioned. In April of 2008, the CTA was selected by the United States Department of Transportation as the recipient of $153 million in Congestion Reduction Demonstration funding. Planning for the implementation of Bus Rapid Transit is currently under way in partnership with the City of Chicago Over the next five years, the CTA plans to spend over $331 million on purchases of low-floor, fully accessible, air-conditioned buses.
- 35 -

President’s 2009-2013 Proposed Capital Improvement Program
The bus vehicle overhaul program continues to improve service through regular replacement of major mechanical components subject to extensive wear. In 2008, the Flexible 6000 Series buses were completed and the overhaul of the Nova 6400 series began. If there is a State capital program, the CTA will invest over $170 million in the five year CIP to maintain the fleet in a state of good repair which will reduce operating costs and improve service. Unscheduled maintenance - required by the failure of a bus in service - disrupts operations, inconveniences customers and increases operating costs. Bus mid-life overhaul activities are programmed for $10.5 million in 2009 and $160 million during the period 2010-2013. With overhauls, the fleet will demonstrate increased reliability and fewer instances of expensive breakdown-based repair. To effectively manage service delivery and provide reliable information to customers, the CTA must have vehicle location information available to operations personnel in real time. The Bus Tracker project has improved data communication between buses and the Control Center and on-street supervision. It has also enhanced centralized control functions, and is also providing useful information to customers.
Systemwide Improvements
System Security Enhancements
Security assessments have identified priority investments needed to harden the CTA system against terrorist threats. Projects including improved passenger public address systems, improved lighting and security cameras reflect a commitment to safety and security for customers and employees. Using funds provided by the Department of Homeland Security as well as other funds, the CTA has implemented a number of security projects. An ongoing fiber optic installation project is upgrading the communications backbone throughout the system. Stations are also being outfitted with cameras to provide a comprehensive view of the transit system to the CTA Control Center, and through redundant fiber optic links to Chicago’s 911 Center. The CTA’s new rail cars will be equipped with enhanced security features, including digital video cameras and recorders. Train control systems, communications infrastructure and access control, funded in the five-year program, contribute to a safe environment for all. However, much remains unfunded and the CTA will continue to pursue additional funding to meet these critical needs. The CIP proposes to spend $6.5 million for security and communications projects in 2009 and an additional $26 million in 2010-2013.
Hybrid Buses During 2006 and 2007, the CTA received and placed into service 20 standard 40’ diesel/electric hybrid
buses as a demonstration project. The results were
positive, with low operating costs and high
reliability. As a result CTA has ordered more hybrids.
The delivery of 150 60’ articulated hybrid buses will begin in the fall of
2008, and delivery will be complete in summer of
2009.
- 36 -

President’s 2009-2013 Proposed Capital Improvement Program Facility Improvements
The President’s CIP proposes to spend $13.3 million on facility improvements in 2009 including upgrades to rail stations and various support facilities throughout the system. A total of $133 million has been allocated in the five-year program to construct or improve CTA facilities. The 2009–2013 proposed CIP includes funding for neighborhood rail station rehabilitations. Eighteen stations are funded for reconstruction during the Brown Line Capacity Expansion Project, located in neighborhoods from Albany Park to the Loop. The CTA will make significant progress in increasing rail station accessibility during this proposed CIP. Currently, over 50 percent of the CTA rail stations are accessible (85 of 144). At the completion of the 2009-2013 CIP, 65 percent of stations will have ADA accessibility (93 of 145), providing additional travel options for CTA’s customers. Looking Ahead The CTA is committed to bringing the CTA’s system to a state of good repair. The proposed 2009-2013 Capital Improvement Program projects $3.0 billion will be available over the next five years, but that will only be the first step. To completely rebuild the CTA’s system means addressing a considerable funding shortfall resulting in unfunded capital needs. The CTA’s unfunded need is estimated to be $6.8 billion. Strategic investment is needed in rail car replacement, traction power system modernization, right-of-way, viaduct renewal, escalators and elevators in rail stations, and upgrades of critical communications systems. Population growth continues to prime local economic growth, but brings traffic congestion, transportation gridlock and the need for transit service expansion. Potential future expansion projects such as Circle Line, and Orange, Red and Yellow Line extensions will be predicated on additional capital funding through Federal and non-Federal sources. The CTA supports the RTA’s vision to bridge the funding gap to bring its existing system and infrastructure to a state of good repair and to improve the efficiency of the system by adding critical connections and line extensions. 2009 represents the sixth year of Federal funding under SAFETEA-LU. The expiration of Illinois FIRST has highlighted the need for additional State capital funds to support the CTA capital program. These funds are vital to continue investment in the region’s public transportation infrastructure. These capital funding programs have helped advance the CTA’s efforts to rehabilitate rail lines, to renew the CTA’s bus fleet, and to incorporate or expand vehicle overhaul programs.
CTA Bond Program
Authorized and Let 2004 $250 million 2005 $275 million 2008 $250 million
Authorized
2008 $175 million
Proposed 2010 $150 million 2011 $175 million
- 37 -

President’s 2009-2013 Proposed Capital Improvement Program With every dollar of new capital funding obtained, with every capital dollar well spent, and with each project completed, the CTA comes closer to realizing its goal of providing high quality service for its customers. When one of the New Flyer buses stops to pick up customers, or a fully overhauled 2600-Series rail car pulls into a newly-rebuilt station, the CTA customers experience the results of a vital capital program, experiencing first hand the CTA’s mission of providing quality, affordable transit services that link people, jobs and communities.
- 38 -

President’s 2009-2013 Proposed Capital Improvement Program Detail Capital Improvement Project Descriptions 021.803 Perform Bus Maintenance Activities Funding will provide labor and material to support the repair of buses. Maintenance costs will stabilize as more buses are cycled through the campaign-based overhaul program. The CTA has embarked on an aggressive bus maintenance program to schedule the replacement of parts nearing the end of their useful life before they fail. By investing in a program centered on the timely overhaul and replacement of buses the CTA will improve the comfort, quality and reliability of its service while reducing operating expenses. As more buses are cycled through the program, unscheduled maintenance on buses will be significantly reduced. 021.806 Perform Bus Mid-life Overhaul Funding will provide for the continuation of the mid-life overhaul of the CTA buses. Buses placed into service in 1999-2004 will be overhauled and returned to a state of good repair. The CTA has embarked on an aggressive overhaul program to schedule the replacement of parts nearing the end of their useful life before they fail. Most of this effort will center on the mid-life overhaul of buses in their fifth to seventh year. This program will have many benefits. By investing in an overhaul program centered on the timely overhaul and replacement of buses, the CTA will improve the comfort, quality, and reliability of its service while reducing operating expenses. As more buses are cycled through the mid-life overhaul program, unscheduled maintenance on buses will be significantly reduced. 031.054 Replace Buses Purchase and place into service fully accessible, air conditioned buses, including spare parts inventories. Buses that have reached their industry standard retirement age of 12 years will be replaced. All of the new buses will be air conditioned and fully accessible. 194.115 Expanded Capacity-Brown Line Expand the customer capacity of the Brown (Ravenswood) Line from Kimball Terminal to Tower 18 in the Loop. The elevated portion of the Ravenswood route was constructed between 1893 and 1910 from Belmont to Campbell, and extended at grade to its present terminal in the 1910's. It includes 19 stations and serves approximately 66,000 customers each weekday. Ridership has increased 79% since 1983, and rush hour trains are crush-loaded. The line's market area continues to redevelop and potential customers are discouraged from using the Brown Line due to crowded conditions.
- 39 -

President’s 2009-2013 Proposed Capital Improvement Program Detail Capital Improvement Project Descriptions (continued) 194.115 Expanded Capacity-Brown Line (continued) The Brown Line is limited to six-car trains due to station platform length. Lengthening all platforms to accommodate eight-car trains and selected track, signal and yard improvements will substantially increase capacity of the line. Station alterations will provide ADA accessibility. 121.500 Replace/Upgrade Power Distribution and Signals Replacement and upgrading of the signal and power distribution system must be accomplished in order to provide continued safe operation. Replacing this power distribution system will decrease the possibility of power shutdowns and service disruptions, and will continue to eliminate slow zones. Antiquated substation facilities are susceptible to failure that results in a disruption in service. This project will also replace Loop signals and interlocking systems, and signal equipment systemwide. The block signal equipment system in the Dearborn Subway and the Congress branch is over 40 years old, and parts of the O'Hare branch are beyond their expected service life and maintenance is limited because of lack of spare parts. 171.133 Repair Track and Structure Defects Correct deficiencies in the CTA's extensive track system and structures through systematic inspection and rehabilitation or replacement of substandard structural elements. Defective track and structure must be repaired in order to maintain safe and reliable service. As elements are identified, requiring immediate repair or replacement, field forces are dispatched to the site to repair or replace the component to eliminate the need to impose slow zones. 181.500 Infrastructure Safety and Renewal Program Systematically replace ties and fasteners on the Brown (Ravenswood) Line, Red (North Main) Line, and Dearborn Subway, which have deteriorated to a point where they can no longer provide adequate rail connection and gauge. Additionally, this project will upgrade track components on the Red Line Dan Ryan, South Loop, and on the Englewood branch of the Green Line. This project will also renew rail, track, structure and related elements at locations to be determined by inspection. 181.500 Infrastructure Safety and Renewal Program (continued) Some of the existing track components and ties, as well as many of the right-of-way elements are at least 30 years old and have exceeded their useful life and are in need of replacement. This program to replace these components will reduce the need to impose slow zones due to their deteriorating condition. When completed, train speed can be increased and reliability will be greatly improved. In addition, right-of-way improvements will provide greater access to maintenance personnel and as an emergency evacuation walkway for customers.
- 40 -

President’s 2009-2013 Proposed Capital Improvement Program Detail Capital Improvement Project Descriptions (continued) 022.903 Perform Rail Car Overhaul and Mid-life Rehabilitation Funding will provide for an ongoing overhaul program. Maintenance costs will stabilize as more rail cars are cycled through the preventive maintenance program. The 2600 Series cars are scheduled for a “C” quarter life overhaul and the 3200 Series cars are projected to receive a “D” or midlife overhaul. Funding is provided for the completion of the life extending overhaul program for the 2200 and 2400 series cars so that the service life of these cars can be extended for a period of five to nine years. Subject to available State funding, the CTA plans to embark on an aggressive Rail Overhaul Program to schedule replacement of parts nearing the end of their useful life before they fail. Examples of items to be replaced are control groups, air conditioning units, and truck assemblies including traction motors, brake calipers, and axle assemblies. This effort will center on "C" level overhaul at six and 18 years, and a mid-life ("D" level) overhaul at 12 to 13 years. By performing these scheduled maintenance activities and replacing rail cars at the appropriate time, generally at 25 years of age, the CTA will improve the comfort, quality, and service reliability of the rail cars while reducing operating maintenance costs. As more rail cars are cycled through the overhaul program, unscheduled maintenance will be significantly reduced. As a result of a revised schedule for replacement of the 2200 Series rail cars, necessary overhaul work continues so that the service life of these cars can be extended for a period of five to nine years. 022.906 Perform Rail Car Maintenance Activities Funding will provide for the ongoing repair of rail cars. Maintenance costs will stabilize as more rail cars are cycled through the preventive maintenance overhaul program. The CTA has embarked on an aggressive rail preventative maintenance program to schedule the replacement of parts nearing the end of their useful life before they fail. This effort will center on campaign-based component replacement. By performing these maintenance activities and replacing rail cars at the appropriate time, generally at 25 years of age, the CTA will improve the comfort, quality and service reliability of the rail cars while reducing operating maintenance costs. As more rail cars are cycled through the overhaul program, unscheduled maintenance will be significantly reduced. 132.056 Purchase of Rail Cars Replace the 2200 and 2400 series rapid transit cars and purchase cars to meet expanded service needs. The replacement of the 2200 and 2400 Series rail cars is necessary due to the age and deteriorated condition of these cars. The 2200 Series rail cars have been in service for 38 years, which is well beyond their 25-year design life, and the 2400 Series have been in service for 29 years. The deteriorated condition of these vehicles is evidenced in the form of increased service failures and longer repair times, which result in decreased availability for
- 41 -

President’s 2009-2013 Proposed Capital Improvement Program Detail Capital Improvement Project Descriptions (continued) service. Replacement of these rail cars will provide the CTA with modern, updated vehicles that will decrease maintenance and operating costs while enhancing customer comfort. The new cars will have sliding doors wide enough to accommodate wheelchairs. The number of cars to be purchased will be determined on the basis of bid prices for the rail car procurement, future schedule and maintenance requirements, and the availability of State funds. 150.028 Implement Security & Communication Projects Purchase and install equipment and systems to harden security of transit assets and ensure safety of systems and customers. Implement security strategies to conduct targeted surveillance, control access and stop intrusion. Support enhanced command and control systems to facilitate incident response. Security and safety are of paramount concern for the CTA. Professional security assessment of the CTA system identified priority investment in equipment and infrastructure to protect the public and the CTA employees as well as service continuity. Due to the sensitive nature of the effort, specific projects are not identified in this document. 308.002 Bond Repayment, Interest Costs & Finance Costs Provide for debt service and the cost of issuance of bonds, notes and other indebtedness incurred by the CTA. This project is funded with Federal formula funds and non-Federal local match. This element will provide for the interest costs associated with financing the Bond series issued in 2004, 2006 and 2008. Additional bonds have been authorized to be issued in subsequent years. These bonds are anticipated to support construction of Howard Station, purchase of Automated Fare Collection (AFC) equipment, purchase of replacement rail cars, purchase of replacement buses, and various capital improvement projects. These transit projects will help the CTA continue to meet the dynamic needs of a growing and interdependent region. 400.500 CMAQ, JARC, ICE, and UWP Projects Provide for various demonstration projects and service improvements and service initiatives, funded with local or Federal funds, under regional competitive grant programs. This program of CTA projects will allow for the application and receipt of non-traditional Federal funds under several Federally- and locally-funded programs. CMAQ projects contribute to regional air quality; JARC projects are intended to support job access or reverse commute initiatives; and ICE projects are those selected through a competitive process, which demonstrate innovation, coordination, or which enhance transit service. Planned funding through the regional UWP assists the CTA in developing the regional transportation improvement plan (TIP) and the State Transportation Improvement Plan (STIP) as required under funding regulations.
- 42 -

President’s 2009-2013 Proposed Capital Improvement Program Detail Capital Improvement Project Descriptions (continued) 073.500 Improve Facilities – Systemwide Upgrade and improve facilities systemwide. This program will fund the rehabilitation of the CTA facilities where building components have defects needing repair and requiring security enhancements. These facilities must be kept in a good state of repair in order to allow efficient performance of maintenance duties on the CTA rolling stock and right-of-way, and to serve the needs of the CTA's customers. This project also includes payments for the 567 W. Lake building, which replaced the Merchandise Mart as the CTA’s headquarters. A significant number of rail stations and bus turnarounds have not been improved or enhanced in many years and are in need of upgrades that will improve appearance and give customers a greater sense of security and confidence using the system. Many roofs and canopies are nearing or are at the end of their service life and require replacement in order to avoid safety hazards and to prevent damage to building interiors and roof structures. Various escalators and elevators throughout the system are beyond their service life, and are in disrepair, requiring continual maintenance work. Rehabilitation of these escalators and elevators will reduce maintenance expenses and better serve CTA customers.
- 43 -

- 44 -

Appendices
Table of Contents
1
Business Units & Goals …………………………………………
46
2
Operating Funding Summary …………………………………….
51
3
Debt Administration ………………………………………….…….
55
4
Annual Budget Process …………………………………………...
62
5
Accounting System and Financial Controls ……….................
65
6
Financial Policy……..……………………………………………….
69
7
Operating Statistics – System ……………………………………
72
8
Operating Statistics – Bus ………………………………………..
73
9
Operating Statistics – Rail ……………………………..…………
74
10
Comparative Performance Analysis – Bus …………………....
75
11
Comparative Performance Analysis – Rail ……….………...….
76
12
Acronyms ……….………...….……….………...…………………..
77
13
Glossary ……………………………………………………………...
79
- 45 -

A 1 Business Units & Goals In May 2007, the CTA implemented a performance management system to focus the organization on a data-driven management model aimed at improving operational efficiencies and customer experience. Beginning with Bus Operations, Rail Operations, Facilities Maintenance and Construction, the CTA has expanded the performance management model over the last year to encompass all areas of the organization. All CTA departments are now responsible for managing to targets based on key performance and financial metrics organized around five organizational goals. The CTA has committed to providing a Transit System that is: The CTA recognizes that each business unit affects the organization’s ability to meet its performance goals. While Transit Operations represents most of the public face of the organization, each department within the Authority is integral to ensuring an excellent customer experience. For example, Vehicle Maintenance provides the backbone of Transit Operations through assuring safe, clean and comfortable vehicles. Facilities Maintenance and Power and Way ensure the safety and comfort of customers through the maintenance and construction of physical infrastructure. Security and System Safety support Transit Operations on a daily basis by providing the tools necessary to keep employees and the public safe and professionally served. Other units, such as Communications and Planning, provide the support necessary to create a reliable and predictable transit experience.
Safe The CTA will reduce the number of accidents involving customers, employees and the general public.
On-Time
The CTA will reduce system delays and successfully manage intervals between rail and bus vehicles to provide predictable and reliable service for its customers. Construction and other projects will be completed within the budget and time frame allocated to minimize impacts to customers.
CleanThe CTA will improve and maintain cleanliness standards for all vehicles, stations and work areas to provide a safe and comfortable atmosphere for riders.
Courteous
The CTA will improve and maintain the highest standard of customer service through timely, reliable and clear communication with customers, as well as considerate employees and operational practices.
EfficientThe CTA will responsibly and effectively manage resources to drive performance and provide a safe, reliable and affordable transit service for customers.
- 46 -

A 1 Business Units & Goals The remaining departments within the CTA, including Purchasing and Warehousing, Finance, Technology Management, and a number of other operations support departments, support the CTA’s front line operations and the service provided to customers. Transit Operations Department Overview Bus Operations and Maintenance
• Provides over 1.1 million rides per weekday • Maintains reliable service with approximately 4,700 bus operators, 2,080 buses and 154
routes covering approximately 690,000 miles every weekday • Manages 8 Bus Garages and 1 Heavy Maintenance shop • In the fall of 2008, the average age of the fleet was 7.1 years old
Rail Operations and Maintenance • Provides over 600,000 rides per weekday • Maintains reliable service with approximately 1,500 rail operators, 1,190 rail cars and 8 routes covering approximately 225,400 miles every weekday • Manages 10 Rail Terminals and 1 Heavy Maintenance shop • In fall of 2008, the average age of the fleet was 25 years old
2009 Performance Goals Bus Operations and Maintenance Performance Goals
Metric 2008 YTD 2009 Goals % of Big Gaps ≤ 6% ≤ 5% % of Intervals Bunched ≤ 3.2% ≤ 3% % of Fleet Unavailable for Service ≤14% ≤13% Mean Miles between Road Calls TBA TBA Incidents per 100,000 miles ≤ 4.9 ≤ 4 Average Days between General Cleans 14 days 14 days % of Buses with Defective AVAS ≤ 3% ≤ 2%
Rail Operations and Maintenance Performance Goals
Metric 2008 YTD 2009 Goal Major Delays, Rail Transportation ≤ 13/Month ≤ 11/Month Major Delays, Rail Vehicle Maintenance ≤ 25/Month ≤ 22/Month Mean Miles between Defects ≥ 3500 ≥ 3750 Hold-ins (% of Rail Cars Unavailable) ≤ 13% ≤ 12% Average Days between General Cleans 20 days 14 days General Cleans: % of Fleet Past Due 37% 0%
- 47 -
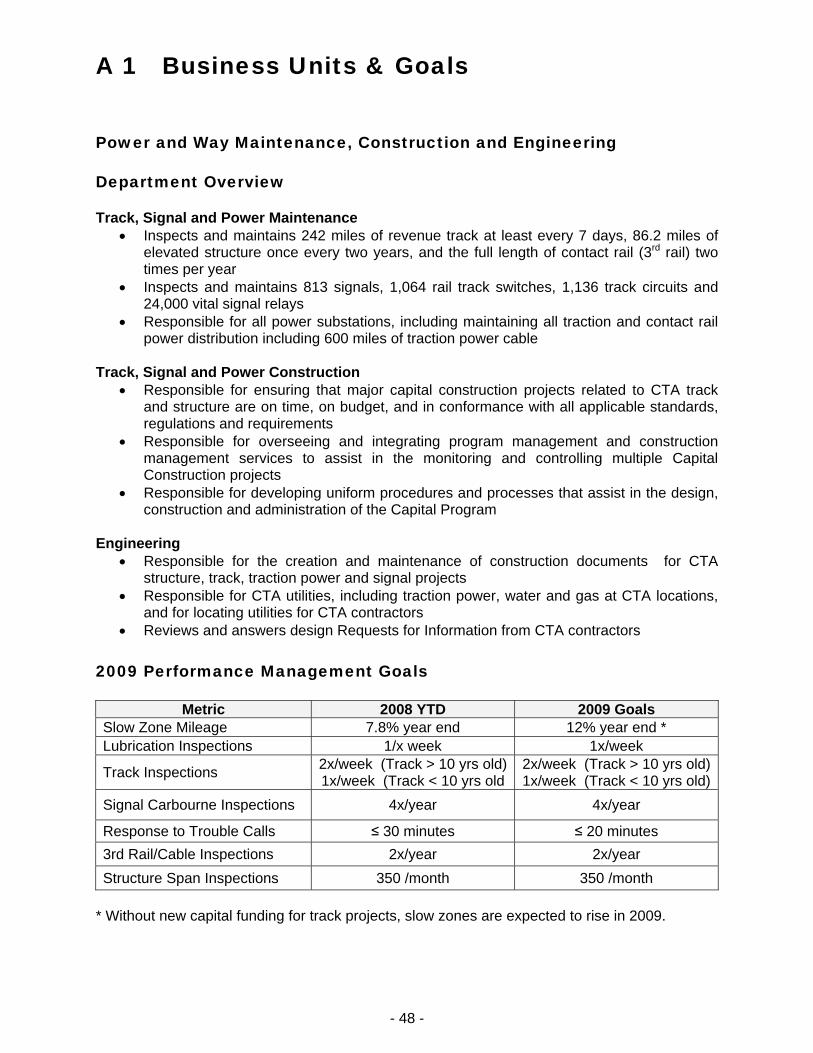
A 1 Business Units & Goals Power and Way Maintenance, Construction and Engineering
Department Overview Track, Signal and Power Maintenance
• Inspects and maintains 242 miles of revenue track at least every 7 days, 86.2 miles of elevated structure once every two years, and the full length of contact rail (3rd rail) two times per year
• Inspects and maintains 813 signals, 1,064 rail track switches, 1,136 track circuits and 24,000 vital signal relays
• Responsible for all power substations, including maintaining all traction and contact rail power distribution including 600 miles of traction power cable
Track, Signal and Power Construction
• Responsible for ensuring that major capital construction projects related to CTA track and structure are on time, on budget, and in conformance with all applicable standards, regulations and requirements
• Responsible for overseeing and integrating program management and construction management services to assist in the monitoring and controlling multiple Capital Construction projects
• Responsible for developing uniform procedures and processes that assist in the design, construction and administration of the Capital Program
Engineering
• Responsible for the creation and maintenance of construction documents for CTA structure, track, traction power and signal projects
• Responsible for CTA utilities, including traction power, water and gas at CTA locations, and for locating utilities for CTA contractors
• Reviews and answers design Requests for Information from CTA contractors 2009 Performance Management Goals
Metric 2008 YTD 2009 Goals
Slow Zone Mileage 7.8% year end 12% year end * Lubrication Inspections 1/x week 1x/week
Track Inspections 2x/week (Track > 10 yrs old)1x/week (Track < 10 yrs old
2x/week (Track > 10 yrs old)1x/week (Track < 10 yrs old)
Signal Carbourne Inspections 4x/year 4x/year
Response to Trouble Calls ≤ 30 minutes ≤ 20 minutes 3rd Rail/Cable Inspections 2x/year 2x/year Structure Span Inspections 350 /month 350 /month
* Without new capital funding for track projects, slow zones are expected to rise in 2009.
- 48 -

A 1 Business Units & Goals Facilities Maintenance, Construction and Engineering Department Overview Facilities Maintenance
• Processes approximately 65,000 work orders for the CTA’s 450 owned and leased facilities covering approximately 5 million square feet
• Cleans and maintains more than 210 locations, including 144 rail stations, 9 terminals, 12 rail yards, all of the rail right-of-way and performs approximately 2,200 station power-washes per year
• Projected to perform 5,200 vehicle tows in 2008 with the expectation that this rate will be maintained in 2009
Facilities Construction and Engineering
• Responsible for completing major capital projects related to CTA facilities • Performs major repairs to and rehabilitation of rail stations, bus garages, and related
structures • Oversees construction management services to ensure that projects are completed on-
time, within budget, and in accordance with highest industry standards 2009 Performance Management Goals
Metric 2008 YTD 2009 Goals
Elevator/Escalator Uptime ≥ 95% ≥ 95% Time to Respond-Bus Tows ≤ 40 minutes ≤ 40 minutes Bus Washer Uptime ≥ 95% ≥ 90% Rail Washer Uptime ≥ 90% ≥ 85% Subway Footwalk Inspections 1x/month 1x/month Graffiti Removed within 7 days ≥ 95% on time ≥ 95% on time % Work Orders Overdue ≤ 10% ≤ 10% % Work Order Backlog ≤ 15% ≤ 15% % Work Orders Completed On Time ≥ 90% ≥ 93%
Administration Operations Support Department Overview and Performance Management Goals Purchasing & Warehouse
• Purchasing processes over 1,000 contracts annually to secure the best prices and ensure the most responsible use of CTA funds
• Warehouse Operations is responsible for timely and reliable parts and material distribution to all CTA maintenance facilities and stock rooms throughout the service network
- 49 -

A 1 Business Units & Goals 2009 Performance Management Goals
Metric 2008 YTD 2009 Goals
% of Contracts Completed within 135 Days
95% 95%
Daily Bus Holds for Material ≤ 20 daily bus holds for material
≤ 12 daily bus holds for material
Parts Availability ≥ 95% ≥ 95%
Technology Management
• Maintains Bus and Rail fare collection equipment throughout the CTA service area • Maintains and upgrades all CTA technology infrastructure including computer hardware,
application software and communications equipment • Manages technology projects for Authority
2009 Performance Management Goals
Metric 2008 YTD 2009 Target
Application Availability ≥ 99.766% uptime ≥ 99.926% uptime Infrastructure Availability ≥ 99.572% uptime ≥ 99.505% uptime Monthly Technology Infrastructure Defects ≤ 306 defects/month ≤ 300 defects/month Monthly Turnstile / AVM defects ≤ 1,645 (turnstile)
≤ 2,748 (AVM) ≤ 1,500 (turnstile)
≤ 2,500 (AVM) Monthly Repair of Bus Farebox Subassemblies ≥ 1,916 ≥ 1,900
Revenue and Marketing
• Responsible for continuing to grow non-fare box revenue and increasing revenue per average service mile
• Customer Communications provides accurate, consistent and timely information to customers and the general public through maps, brochures, fliers, news releases, and a cable television show
• Customer Service responds to customer inquires via phone, email and letters, and works with customers to resolve questions, problems and complaints
• Planning and Development oversees route scheduling and strategic service planning for the Agency
2009 Performance Management Goals
Metric 2008 YTD 2009 Goal Percentage of Complaints closed in 14 days ≥ 90% ≥ 90% Customer Service Hotline Average Wait Time ≤ 2 minutes ≤ 2 minutes
Other Operations Support Departments:
• All other operations support departments track key administrative performance measures such as absence and injury on duty
- 50 -

A 2 Operating Funding Summary
PUBLIC FUNDING Most of the CTA’s public funding for operating and capital needs is funneled through the RTA. The RTA allocates funds to the Service Boards based on a formula included in the 1983 Regional Transportation Authority Act and the 2008 Legislation (P.A. 95-0708) approved by Illinois lawmakers to provide increased operating funds to the Northeastern Illinois Transit System. Other funds are allocated based on the RTA’s discretion. The sources and allocations are outlined below. Sales Tax Revenue: 1983 Formula The RTA Sales Tax is the primary source of operating revenue for the RTA and three Service Boards. The tax is authorized by Illinois statute, imposed by the RTA in the six-county region of northeastern Illinois and collected by the State. The sales tax is the equivalent of 1 percent on sales in Cook County and 0.25 percent on sales in the collar counties of DuPage, Kane, Lake, McHenry and Will. The 1 percent sales tax in Cook County is comprised of 1 percent on food and drugs and 0.75 percent from all other sales, with the State then providing a “replacement” amount to the RTA equivalent to 0.25 percent of all other sales. The RTA retains 15 percent of the total sales tax and passes the remaining 85 percent to the Service Boards according to the following formula that is specified in the Regional Transportation Authority Act.
Chicago Sales Tax Revenue
Suburban Cook Sales Tax Revenue
Collar County Sales Tax Revenue
CTA 100% 30% 0% Metra 0% 55% 70%
Pace 0% 15% 30% Total: 100% 100% 100%
The 2009 Sales Tax Budget for the Region as per the 1983 Formula is estimated to be $758.4 million and is distributed to the RTA and three Service Boards as follows:
($ in 000’s)
Chicago Sales Tax Revenue
Suburban Cook Sales Tax Revenue
Collar County Sales Tax Revenue
Total
CTA $197,796 $102,233 $0 $300,029 Metra $0 $187,428 $74,246 $261,674
Pace $0 $ 51,117 $31,820 $ 82,937
RTA $ 34,905 $ 60,137 $18,718 $113,760
Total: $232,701 $400,916 $124,784 $758,400 In addition, the RTA will distribute at its discretion any funds remaining from the initial allocation of the 15 percent sales tax distribution that is in excess of RTA’s funding needs.
- 51 -

A 2 Operating Funding Summary
Public Transportation Funds: 1983 Formula As authorized by the 1983 Regional Transportation Authority Act, the Illinois State Treasurer transfers from the State General Revenue Fund an amount equal to 25 percent of RTA sales tax collections (or gasoline or parking taxes, if imposed by the RTA). The Treasurer transfers this amount to a special fund, called the “Public Transportation Fund” (PTF), and then remits it to the RTA on a monthly basis. Remittance requires an annual appropriation made by the State of Illinois. In addition, the RTA must certify to the Governor, State Comptroller and Mayor of the City of Chicago that the RTA has adopted a budget and financial plan in conformance with the requirements of the Regional Transportation Authority Act. The RTA uses these funds at its discretion to fund the Service Board needs, RTA operations, debt service and capital investment. RTA's 2009 Budget includes $189.6 million in PTF funds. Sales Tax and Public Transportation Funds: 2008 Legislation Formula RTA sales tax increased by the enactment of PL (P.A. 95-0708) in January 2008 equivalent to a 0.25 percent on sales in each county in the six-county region. By statute, 100 percent of the sales tax receipts and PTF funds, excluding the 25 percent PTF on Real Estate Transfer Tax (RETT) which goes to the CTA, are disbursed by formula to the Service Boards after setting aside funds for ADA paratransit service, suburban mobility, and for innovation, coordination, and enhancement (ICE). Funding for these three initiatives increase or decrease annually based on the percent change in the previous year’s receipts from taxes imposed by PL (P.A. 95-0708) under Section 4.03. The RTA deposits funds each year into an ICE fund as directed by Section 4.03.3 of PL. ICE funds may be used by the RTA based on the affirmative vote of 12 RTA Directors for operating or capital grants or loans to Service Boards, transportation agencies, or units of local government that advance the goals and objectives of the RTA’s Strategic Plan. As per the 2008 legislation formula, the 2009 sales tax budget for the region is estimated to be $281.7 million and PTF is estimated to be $147.6 million (25% on Sales Tax - $70.4 million, 25% on RETT - $21 million and 5% on New and Old Sales Tax - $56.2 million).
Allocation of Sales Tax & PTF Funds to Service Boards (after deductions) CTA Metra Pace Total
% Allocation 48% 39% 13% 100% $ Allocation $155,293 $109,083 $36,361 $300,737
Real Estate Transfer Tax: 2008 Legislation Formula As authorized by the 2008 Legislation (P.A. 95-0708), CTA receives funds at a tax rate of 0.3 percent on real estate transfers in the City of Chicago with 100 percent of the 25 percent PTF. Although RTA's 2009 Budget mark is $84 million in RETT for the CTA, the President’s budget recommendation uses $67.5 million is RETT for 2009 based on estimates made by the City of Chicago. Federal Assistance (Federal Transit Administration)
- 52 -

A 2 Operating Funding Summary
RTA is the region's recipient of Federal assistance, which previously included both operating and capital funds. The FTA eliminated operating assistance to CTA in 1998.
State Assistance The Regional Transportation Authority Act provides supplemental State funding in the forms of additional State assistance and additional financial assistance (collectively, “State Assistance”) to the RTA in connection with its issuance of Strategic Capital Improvement Program (SCIP) bonds. The funding equals debt service amounts paid to bondholders of the Strategic Capital Improvement Bonds issued by RTA, plus any debt service savings from the issuance of refunding or advanced refunding SCIP bonds, less the amount of interest earned by the RTA on the proceeds of SCIP bonds. The Regional Transportation Authority Act limits the amount of State Assistance available to the RTA to the lesser of the debt service or $55.0 million. Remittance requires an annual appropriation made by the State of Illinois. Reduced-Fare Subsidy This funding represents reimbursement of revenues lost by the Service Boards due to providing reduced fares to student, senior citizens and disabled riders, as mandated by State law. The funding is subject to the terms of the grant agreement, State statute (20 ILCS 2705) and annual State appropriation. Reimbursement amounts are allocated to the Service Boards based on reduced fare passenger trips taken during the grant year. However, the 2008 Legislation (PA 95-0708) made free rides available to seniors 65 and older living in the RTA service area. Subsequent actions eliminated State reduced-fare reimbursements of $37.3 million per year, and provided free rides on mainline service to people with disabilities who are enrolled in the State “Circuit Breaker” program and to the U.S. military personnel and qualifying disabled veterans.
- 53 -

A 2 Operating Funding Summary
2008 Budget - Operating Funding Allocation
2009 RTA Proposed Service Board Operations Funding
2009 Service Board Funding CTA Metra Pace –
Mainline Pace -
Paratransit Total Sales Tax (1983 Formula) $302,401 $259,951 $82,288 - $644,640
Sales Tax and PTF (PA 95-0708) $155,293 $109,083 $36,361 $98,998 $399,735
RTA Discretionary $198,059 - $3,158 - $201,217
RTA Suburban Community Mobility Funds - - $19,800 - $19,800
RTA South Suburban Job Access Funds - - $7,500 - $7,500
Total RTA Funds $655,753 $369,034 $149,107 $98,998 $1,272,892
Real Estate Transfer Tax (City of Chicago) $84,000 - - - $84,000
Transfer Capital - ($59,834) - - ($59,834)
CMAQ/JARC Funds - - $2,395 - $2,395
RTA Funds (Reserved)/Used for ADA - - - ($403) ($403)
Total Funding $739,753 $309,200 $151,502 $98,595 $1,299,050
- 54 -

A 3 Debt Administration
DEBT MANAGEMENT POLICY GUIDELINES On October 14, 2004, the Chicago Transit Board approved an ordinance adopting Debt Management Policy Guidelines (the “Debt Policy”). The Debt Policy serves as a management tool to ensure that the CTA a) identifies transactions that utilize debt in the most efficient manner; and b) provides for full and timely repayment of all borrowings. Additionally, the Debt Policy outlines a means of a) achieving the lowest possible cost of capital within prudent risk parameters; and b) ensuring ongoing access to the capital markets. The Debt Policy applies to all short and long term bonds and notes, other long-term lease obligations, and interest rate exchanges. The Debt Policy does not cover commodity hedging, leveraged leases, long-term operating leases, short-term leases and bank obligation transactions. The general debt issuance guidelines outlined in the Debt Policy are summarized below. Use of Debt It is the CTA’s preference to use a pay-as-you-go funding mechanism for all capital projects. As such, CTA explores use of available cash to fund all or part of a particular capital improvement project and other long-term financial needs before proposing the use of debt. However, the CTA recognizes that the size, scope and timing of particular projects in its capital improvement plan, cash flow sufficiency and capital market opportunities may necessitate the use of debt. The Debt Policy allows for the issuance of either long-term or short-term debt. The financing purpose would determine the type of debt the CTA would use.
• Short-Term Debt Obligations: Short-term debt may be used by the CTA as a cash management tool to provide interim financing or to bridge temporary cash flow deficits within a fiscal year. Currently, the CTA has no outstanding short-term debt obligations.
• Long-Term Debt Obligations: The Debt Policy prohibits the use of long-term debt to fund operations. However, long-term bonds are deemed appropriate to finance essential capital activities and certain management initiatives. The CTA may also use long-term lease obligations to finance or refinance capital equipment. Prior to entering into any lease financing, the Authority will evaluate 1) the useful life of assets financed, 2) terms and conditions of the lease and 3) budgetary, debt capacity and tax implications.
Credit Ratings The Debt Policy recognizes the need for a credit rating strategy focused on achieving the best economic value for the CTA. A major goal of CTA’s debt program is to attain a proper balance between minimizing borrowing costs and maximizing financial flexibility. Currently, CTA’s outstanding bond issues are assigned an A2 credit rating from Moody’s Investor Services, and an A rating for Standard & Poor’s Rating Services.
- 55 -

A 3 Debt Administration
Debt Limitations Attaining a proper balance between minimizing borrowing and maximizing financial flexibility is a key goal of the CTA debt program. The CTA is not subject to statutory debt limitations for capital investment. However, the Debt Policy does limit the aggregate amount of CTA’s unhedged variable rate debt at a maximum of 20% of all outstanding long-term debt obligations. Other Provisions The CTA may secure credit enhancement in the form of municipal bond insurance or a letter / line of credit for all or a portion of each bond issue. The Debt Policy also allows the Authority to issue debt on a taxable or tax-exempt basis and to use interest rate exchange agreements when they will 1) reduce the expected interest rate costs, 2) hedge fluctuations in interest rates or 3) gain efficiency in structuring and restructuring debt. CURRENT DEBT Long-term debt includes capital lease obligations and bonds payable, as described below: Lease/Leaseback Agreements The CTA has entered into several economically defeased lease and leaseback agreements in fiscal years 1995 through 2003. These agreements were entered into with various third parties and pertain to certain assets of the CTA, including rail lines and equipment, rail cars, facilities, buses and qualified technology equipment. Under the lease/leaseback financings, the CTA entered into a long-term lease for applicable assets with trusts established by equity investors. The trusts concurrently leased the respective assets back to the CTA under sublease agreements. Each sublease contains a fixed date and a fixed price purchase option that allows the CTA, at its option, to purchase the assets back from the lessor. As of December 31, 2007 the total obligations due under the lease agreements which have been economically defeased were approximately $1.75 billion. OTHER CAPITAL LEASES On March 31, 2003 the Public Building Commission of Chicago (the “PBC”) issued $119,020,000 of Building Revenue Bonds, Series 2003 (Chicago Transit Authority) (the “PBC Bonds”). The PBC used the proceeds of these bonds, among other things, to acquire the site for and construct a 12-story office building, which the PBC leased to the CTA for a 20-year term to be used as its headquarters. Rent payments due to the PBC from the CTA under the lease are general obligations of the CTA payable from any lawfully available funds. Upon satisfaction of all of the obligations of the CTA under the lease and payment, or provision for payment, of the PBC Bonds in full, the PBC will transfer title of the leased premises to the CTA. On October 26, 2006, the PBC issued Building Refunding Revenue Bonds for the benefit of the CTA in the amount of $91,340,000. The proceeds of the bonds were used to advance refund to the Public Building Commission of Chicago, Series 2003 bonds. This refunding decreases debt service payments over the next 27 years by approximately $388,000, resulting in an economic gain of approximately $20,404,000.
- 56 -

A 3 Debt Administration
The original lease that was executed in connection with the Series 2003 bonds was amended accordingly. CTA is obligated to pay to the Trustee on behalf of the PBC on or before February 15 of each year in which the headquarters lease is in effect, rent which equals the debt service on the PBC bonds due through and including September 1 of that calendar year. The source of funds for PBC lease payments is primarily FTA grant funds. The total rent due to PBC over the life of the amended lease is $167,049,254.
PAYMENT YEAR
PORTION OF LEASE PAYMENT
ATTRIBUTABLE TO INTEREST
PORTION OF LEASE PAYMENT
ATTRIBUTABLE TO PRINCIPAL
TOTAL LEASE PAYMENT
PBC DEBT OUTSTANDING (end of period)
2008 4,383,838$ 1,790,000$ 6,173,838$ 87,175,000$ 2009 4,310,438$ 1,880,000$ 6,190,438$ 85,295,000$ 2010 4,233,738$ 1,955,000$ 6,188,738$ 83,340,000$ 2011 4,153,938$ 2,035,000$ 6,188,938$ 81,305,000$ 2012 4,070,938$ 2,115,000$ 6,185,938$ 79,190,000$ 2013 3,984,538$ 2,205,000$ 6,189,538$ 76,985,000$ 2014 3,891,669$ 2,295,000$ 6,186,669$ 74,690,000$ 2015 3,782,775$ 2,405,000$ 6,187,775$ 72,285,000$ 2016 3,659,400$ 2,530,000$ 6,189,400$ 69,755,000$ 2017 3,529,650$ 2,660,000$ 6,189,650$ 67,095,000$ 2018 3,403,969$ 2,785,000$ 6,188,969$ 64,310,000$ 2019 3,271,913$ 2,915,000$ 6,186,913$ 61,395,000$ 2020 3,122,413$ 3,065,000$ 6,187,413$ 58,330,000$ 2021 2,965,163$ 3,225,000$ 6,190,163$ 55,105,000$ 2022 2,799,788$ 3,390,000$ 6,189,788$ 51,715,000$ 2023 2,621,456$ 3,565,000$ 6,186,456$ 48,150,000$ 2024 2,429,175$ 3,760,000$ 6,189,175$ 44,390,000$ 2025 2,226,525$ 3,960,000$ 6,186,525$ 40,430,000$ 2026 2,012,981$ 4,175,000$ 6,187,981$ 36,255,000$ 2027 1,787,888$ 4,400,000$ 6,187,888$ 31,855,000$ 2028 1,550,719$ 4,635,000$ 6,185,719$ 27,220,000$ 2029 1,300,688$ 4,890,000$ 6,190,688$ 22,330,000$ 2030 1,037,138$ 5,150,000$ 6,187,138$ 17,180,000$ 2031 759,413$ 5,430,000$ 6,189,413$ 11,750,000$ 2032 466,725$ 5,720,000$ 6,186,725$ 6,030,000$ 2033 158,288$ 6,030,000$ 6,188,288$ -$
SCHEDULE I: $91,340,000 Building Revenue Bonds (Public Building Commission on behalf of Chicago Transit Authority)
Series 2006 Lease Payment Schedule 2008-2033
- 57 -

A 3 Debt Administration
Bonds Payable-Revenue Bonds Capital Grant Receipts Revenue Bonds, Series 2004A and 2004B On October 20, 2004, the CTA issued Capital Grant Receipts Revenue Bonds, Series 2004A and 2004B, (Federal Transit Administration Section 5307 Formula Funds), (together referred to as the “2004 Bonds”). Par value of the 2004 Bonds was $250,000,000, with $150,000,000 in Series 2004A and $100,000,000 in Series 2004B. The 2004 Bonds are solely secured via Federal Transit Administration 5307 Urbanized Area Formula funds. The proceeds of the 2004 Bonds will be used to pay for, or reimburse the CTA for prior expenditures relating to a portion of certain capital improvement projects identified by the CTA (the “2004 Projects”). These capital improvements must be approved by the CTA Board, the RTA and included in the CTA Capital Plan. The 2004 Projects include infrastructure improvements including facility rehabilitation, rail station reconstruction, replace/upgrade track, structure and signal systems, communication infrastructure improvement and replace bus and rail fleet. The 2004 Projects may be substituted from time to time, provided there are funds in the 2004 Project Account of the Construction fund. The 2004 Bonds bear interest ranging from 3.60% to 5.25%. Interest payments for the 2004 Bonds are payable June 1 and December 1 of each year. Principal payments began June 1, 2006 (Please see Schedule II). Subject to market conditions, CTA may enter into one or more Qualified Swap Agreements. The 2004 Bonds are not eligible for early redemption, except under certain extraordinary circumstances. The source of grant receipts available to the CTA to pay principal and interest on the 2004 Bonds is its annual share of Section 5307 Formula Funds; subject to a prior pledge applied to the funding requirements of the Douglas Branch Bonds through 2006. As of October 1, 2008, $194,550,000 of the 2004 Bonds was outstanding.
PAYMENT YEAR
INTEREST PAYMENT
PRINCIPAL PAYMENT
TOTAL DEBT SERVICE
DEBT OUTSTANDING (end of period)
2008 10,542,825$ 19,335,000$ 29,877,825$ 194,550,000$ 2009 9,562,569$ 20,250,000$ 29,812,569$ 174,300,000$ 2010 8,492,781$ 21,295,000$ 29,787,781$ 153,005,000$ 2011 7,367,856$ 22,390,000$ 29,757,856$ 130,615,000$ 2012 6,173,231$ 23,545,000$ 29,718,231$ 107,070,000$ 2013 4,904,700$ 24,780,000$ 29,684,700$ 82,290,000$ 2014 3,602,494$ 26,085,000$ 29,687,494$ 56,205,000$ 2015 2,231,906$ 27,385,000$ 29,616,906$ 28,820,000$ 2016 756,525$ 28,820,000$ 29,576,525$ -$
Schedule II: $250,200,000 Capital Grant Receipts Revenue Bonds (Federal Transit Administration 5307 Formula Funds)
Series 2004A and Series 2004B Total Debt Service 2008-2016
- 58 -

A 3 Debt Administration
Capital Grant Receipts Revenue Bonds, Series 2006 On November 1, 2006, the CTA issued Capital Grant Receipts Revenue Bonds, “2006 Project,” in the amount of $275,000,000, along with a premium of $19,652,000, in anticipation of the receipt of grants from the Federal government pursuant to a full funding grant agreement. The bonds were issued to provide funds to finance or reimburse the CTA for expenditures relating to a portion of the costs of capital improvements to the Transportation System referred to as the “2006 Project.”
The Series 2006 bonds bear interest ranging from 4.0% to 5.0%. Scheduled interest on the 2006 bonds will be funded through June 1, 2007 with bond proceeds and interest earnings thereon. Interest is payable semiannually on June 1 and December 1 and the bonds mature serially on June 1, 2008 through June 1, 2021.
PAYMENT YEAR
INTEREST PAYMENT
PRINCIPAL PAYMENT
TOTAL DEBT SERVICE
DEBT OUTSTANDING (end of period)
2008 13,223,213$ 8,140,000$ 21,363,213$ 266,860,000$ 2009 12,897,613$ 8,465,000$ 21,362,613$ 258,395,000$ 2010 12,559,013$ 8,800,000$ 21,359,013$ 249,595,000$ 2011 12,207,013$ 9,155,000$ 21,362,013$ 240,440,000$ 2012 11,840,813$ 9,520,000$ 21,360,813$ 230,920,000$ 2013 11,460,013$ 9,900,000$ 21,360,013$ 221,020,000$ 2014 10,965,013$ 10,395,000$ 21,360,013$ 210,625,000$ 2015 10,445,263$ 10,915,000$ 21,360,263$ 199,710,000$ 2016 9,899,513$ 11,465,000$ 21,364,513$ 188,245,000$ 2017 9,412,250$ 34,070,000$ 43,482,250$ 154,175,000$ 2018 7,708,750$ 35,770,000$ 43,478,750$ 118,405,000$ 2019 5,920,250$ 37,560,000$ 43,480,250$ 80,845,000$ 2020 4,042,250$ 39,435,000$ 43,477,250$ 41,410,000$ 2021 2,070,500$ 41,410,000$ 43,480,500$ -$
Schedule III: $275,000,000 Capital Grant Receipts Revenue Bonds(Federal Transit Administration Section 5307 Formula Funds)
Series 2006A Total Debt Service 2008-2021
- 59 -

A 3 Debt Administration
Capital Grant Receipts Revenue Bonds, Series 2008 On April 16, 2008, the CTA issued Capital Grant Receipts Revenue Bonds, “2008 Project,” in the amount of $250,000,000, along with a premium of $7,163,057, in anticipation of the receipt of grants from the Federal government. The bonds were issued to provide funds to finance or reimburse the CTA for expenditures relating to a portion of the costs of capital improvements to the Transportation System referred to as the “2008 Project.”
The Series 2008 bonds bear interest ranging from 3.50% to 5.25%. Interest is payable semiannually on June 1 and December 1 and the bonds mature serially on June 1, 2010 through June 1, 2026.
PAYMENT YEAR INTEREST PAYMENT PRINCIPAL
PAYMENT TOTAL DEBT
SERVICE DEBT OUTSTANDING
(end of period) 2009 12,681,613$ -$ 12,681,613$ 250,000,000$ 2010 12,554,250$ 5,990,000$ 18,544,250$ 244,010,000$ 2011 12,317,688$ 6,240,000$ 18,557,688$ 237,770,000$ 2012 12,063,488$ 6,460,000$ 18,523,488$ 231,310,000$ 2013 11,765,050$ 6,750,000$ 18,515,050$ 224,560,000$ 2014 11,457,206$ 7,060,000$ 18,517,206$ 217,500,000$ 2015 11,137,100$ 7,365,000$ 18,502,100$ 210,135,000$ 2016 10,778,900$ 7,700,000$ 18,478,900$ 202,435,000$ 2017 10,384,275$ 8,085,000$ 18,469,275$ 194,350,000$ 2018 9,969,900$ 8,490,000$ 18,459,900$ 185,860,000$ 2019 9,523,763$ 8,910,000$ 18,433,763$ 176,950,000$ 2020 9,043,650$ 9,380,000$ 18,423,650$ 167,570,000$ 2021 8,538,338$ 9,870,000$ 18,408,338$ 157,700,000$ 2022 7,533,881$ 28,395,000$ 35,928,881$ 129,305,000$ 2023 6,003,900$ 29,890,000$ 35,893,900$ 99,415,000$ 2024 4,393,463$ 31,460,000$ 35,853,463$ 67,955,000$ 2025 2,698,500$ 33,110,000$ 35,808,500$ 34,845,000$ 2026 914,681$ 34,845,000$ 35,759,681$ -$
Schedule IV: $250,000,000 Capital Grant Receipts Revenue Bonds(Federal Transit Administration Section 5307& 5309 Formula Funds)
Series 2008 Total Debt Service 2009-2026
- 60 -

A 3 Debt Administration
PAYMENT YEAR
INTEREST PAYMENT
PRINCIPAL PAYMENT
TOTAL DEBT SERVICE
DEBT OUTSTANDING (end of period)
2007 11,461,900.00$ 18,410,000.00$ 29,871,900.00$ 213,885,000.00$ 2008 10,542,825.00$ 19,335,000.00$ 29,877,825.00$ 194,550,000.00$ 2009 9,562,568.75$ 20,250,000.00$ 29,812,568.75$ 174,300,000.00$ 2010 8,492,781.25$ 21,295,000.00$ 29,787,781.25$ 153,005,000.00$ 2011 7,367,856.25$ 22,390,000.00$ 29,757,856.25$ 130,615,000.00$ 2012 6,173,231.25$ 23,545,000.00$ 29,718,231.25$ 107,070,000.00$ 2013 4,904,700.00$ 24,780,000.00$ 29,684,700.00$ 82,290,000.00$ 2014 3,602,493.75$ 26,085,000.00$ 29,687,493.75$ 56,205,000.00$ 2015 2,231,906.25$ 27,385,000.00$ 29,616,906.25$ 28,820,000.00$ 2016 756,525.00$ 28,820,000.00$ 29,576,525.00$ -$
Schedule II: $250,200,000 Capital Grant Receipts Revenue Bonds (Federal Transit Administration 5307 Formula Funds)
Series 2004A and Series 2004B Total Debt Service 2007-2016
Summary of combined CTA lease and debt service obligations
PAYMENT YEAR 2006 PBC LEASE 2004 BONDS 2006 BONDS 2008 BONDS TOTAL ANNUAL
DEBT SERVICE
2008 6,173,838$ 29,877,825$ 21,363,213$ -$ 57,414,875$ 2009 6,190,438$ 29,812,569$ 21,362,613$ 12,681,613$ 70,047,231$ 2010 6,188,738$ 29,787,781$ 21,359,013$ 18,544,250$ 75,879,781$ 2011 6,188,938$ 29,757,856$ 21,362,013$ 18,557,688$ 75,866,494$ 2012 6,185,938$ 29,718,231$ 21,360,813$ 18,523,488$ 75,788,469$ 2013 6,189,538$ 29,684,700$ 21,360,013$ 18,515,050$ 75,749,300$ 2014 6,186,669$ 29,687,494$ 21,360,013$ 18,517,206$ 75,751,381$ 2015 6,187,775$ 29,616,906$ 21,360,263$ 18,502,100$ 75,667,044$ 2016 6,189,400$ 29,576,525$ 21,364,513$ 18,478,900$ 75,609,338$ 2017 6,189,650$ 43,482,250$ 18,469,275$ 68,141,175$ 2018 6,188,969$ 43,478,750$ 18,459,900$ 68,127,619$ 2019 6,186,913$ 43,480,250$ 18,433,763$ 68,100,925$ 2020 6,187,413$ 43,477,250$ 18,423,650$ 68,088,313$ 2021 6,190,163$ 43,480,500$ 18,408,338$ 68,079,000$ 2022 6,189,788$ 35,928,881$ 42,118,669$ 2023 6,186,456$ 35,893,900$ 42,080,356$ 2024 6,189,175$ 35,853,463$ 42,042,638$ 2025 6,186,525$ 35,808,500$ 41,995,025$ 2026 6,187,981$ 35,759,681$ 41,947,663$ 2027 6,187,888$ 6,187,888$ 2028 6,185,719$ 6,185,719$ 2029 6,190,688$ 6,190,688$ 2030 6,187,138$ 6,187,138$ 2031 6,189,413$ 6,189,413$ 2032 6,186,725$ 6,186,725$ 2033 6,188,288$ 6,188,288$
Schedule V: CTA TOTAL ANNUAL LEASE / DEBT SCHEDULE 2008-2033
- 61 -

A 4 Annual Budget Process The Budget & Financial Plan Process The RTA Act requires the RTA Board to adopt a consolidated annual budget, a two-year financial plan, and a Five-Year Capital Program. The budgetary process contains three phases: budget development, budget adoption, and budget execution and administration. Budget Development April 17: Budget development begins in April with the Business Plan Call from the RTA. The Business Plan Call outlines the required budget information for the RTA, and provides economic assumptions for the region. The RTA's sales tax forecast is based on the most recent sales tax revenue estimate provided by the State Bureau of the Budget (BOB). The RTA uses this estimate and the sales tax growth rates to prepare the annual budget funding marks and to estimate sales tax for the two years of the financial plan. Capital funding estimates are consistent with the projections for funding from all sources including Federal, State, RTA and CTA sources. Budget Adoption August 15: By the middle of August, CTA is required to submit a macro-level operating budget, a two-year financial plan, and a five-year capital program to the RTA. September 15: The RTA Board is required by the RTA Act to set operating and capital funding Marks for the three Service Boards by September 15. The marks include estimates of available funding for the budget and financial plan, a required recovery ratio (the ratio or percentage of operating expenses that must be recovered from system-generated revenue) for the budget, and capital program marks. Upon issuance of the budget marks, the CTA revises its expenses and revenues to conform to the marks.
October 9: Budget released to the public. The statute requires documents be available for public inspection 21 days prior to the public hearing October 29: Public Hearing is held to receive comments from the public. November 5: CTA presents the budget to the Cook County Board after the Public Hearing but prior to the CTA adoption of the budget as required by the RTA Act. November 12: The CTA Board incorporates any changes and adopts the budget and two-year financial plan. November 15: The RTA Act requires CTA by November 15 to submit to RTA its detailed budget and financial plan that conforms to the Budget Marks set by the RTA on September 15.
- 62 -

A 4 Annual Budget Process
December 18: The RTA Board adopts the proposed budget and plan upon the approval of 12 of the RTA's 16 directors. RTA Statutory Requirements for Operating Budget Approval The RTA Board adopts the proposed budget and plan if the budget meets the RTA’s seven criteria identified in the RTA Act outlined below. RTA is required to adopt the budget by December 31. If the RTA Board does not approve the budget, the RTA Board cannot release any funds for the periods covered by the budget and financial plan except the proceeds of sales taxes due by the statutory formula to the CTA until the budget conforms to the criteria specified in the act.
The RTA Act budget and plan approval criteria are as follows:
Balanced Budget: The budget and plan show a balance between (A) anticipated revenues from all sources including operating subsidies and (B) the costs of providing the services specified and of funding any operating deficits or encumbrances incurred in prior periods, including provision for payment when due of principal and interest of outstanding indebtedness. Cash Flow: The budget and plan show cash balances including the proceeds of any anticipated cash flow borrowing sufficient to pay with reasonable promptness all costs and expenses incurred. Recovery Ratio: The budget and plan provide for a level of fares or charges and operating or administrative costs for the public transportation provided by or subject to the system generated revenue recovery ratio. Assumptions: The budget and plan are based upon and employ assumptions and projections which are reasonable and prudent. Financial Practices: The budget and plan have been prepared in accordance with sound financial practices as determined by the RTA board. Other Requirements: The budget and plan meet such other financial, budgetary, or fiscal requirements that the RTA board may by rule or regulation establish. Strategic Plan: The budget and plan are consistent with the goals and objectives adopted by the RTA board in the Strategic Plan. Budget Execution & Administration After the proposed budget and financial plan are adopted, the budget execution and administration phase begins. Detailed budgets of operating revenues and expenses calendarized for the 12 months of the budget year are forwarded to the RTA. CTA’s actual monthly financial performance is measured against the monthly budget and reported to the RTA Board. Detailed capital grant applications are prepared and submitted to funding agencies.
- 63 -

A 4 Annual Budget Process
Quarterly capital program progress reports are provided to the RTA board to monitor expenditures and obligations for capital program items. Amendment Process As CTA monitors actual performance, changes may be required to the budget. The RTA might revise its sales tax forecast, which could result in less public funding for the CTA. This in turn would require reduced spending to meet the revised funding mark and recovery ratio.
When the RTA amends a revenue estimate because of changes in economic conditions, governmental funding, a new program, or other reasons, CTA has 30 days to revise its budget to reflect these changes. The RTA’s Finance Committee must approve all amendments before they are recommended to the RTA Board for approval. The budget may also be amended if CTA is significantly out of compliance with the budget for a particular quarter based upon its financial condition and results of operations. The RTA Board, by a vote of twelve members, may require CTA to submit a revised financial plan and budget, which show that the marks will be met in a time period of less than four quarters. If the RTA Board determines that the revised budget is not in compliance with the marks, the RTA will not release discretionary funds. RTA discretionary funds include monies from The Public Transportation Fund (PTF), discretionary sales tax and other state funding. If the Authority submits a revised financial plan and budget which show the marks will be met within a four quarter period, then the RTA Board shall continue to release funds. As Capital projects proceed, changes may be required to project budgets. Capital funding marks may be revised based on actual federal or state appropriations actions. When revisions are necessary, CTA will amend the five-year capital program and submit the changes to RTA for RTA board action.
- 64 -

A 5 Accounting System & Financial Controls
ORGANIZATION OVERVIEW The CTA was formed in 1945 pursuant to the Metropolitan Transportation Authority Act passed by the Illinois Legislature. The CTA was established as an independent governmental agency (an Illinois municipal corporation) “separate and apart from all other government agencies” to consolidate Chicago’s public and private mass transit carriers. The City Council of the City of Chicago has granted the CTA the exclusive right to operate a transportation system for the transportation of passengers within the City of Chicago. The Regional Transportation Authority Act provides for the funding of public transportation in the six-county region of Northeastern Illinois. The Act established a regional oversight board, the RTA, and designated three Service Boards (CTA, Commuter Rail Board and Suburban Bus Board). The Act requires, among other things, that the RTA approve the annual budget of the CTA, that the CTA obtain agreement from local governmental units to provide an annual monetary contribution of at least $5,000,000 for public transportation and that the CTA (collectively with the other Service Boards) finance at least 50% of their operating costs, excluding depreciation and certain other items, from system-generated sources. Financial Reporting Entity In conformance with Governmental Accounting Standards Board (GASB) standards, the CTA includes in its financial statements all funds over which the Chicago Transit Board exercises oversight responsibility. Oversight responsibility is defined to include the following considerations: selection of governing authority, designation of management, ability to significantly influence operations, accountability for fiscal matters, and the scope of an organization’s public service and/or special financing relationships. Based on the above criteria, the fund established for the employees’ pension plan has been determined not to be part of the reporting entity. The fund is a legal entity separate and distinct from the CTA. The fund is administered by its own oversight committee, of which the CTA appoints five of the eleven members, and over which the CTA has no direct authority. Accordingly, the accounts of the fund are not included in the CTA’s financial statements. Based upon the criteria set forth by Governmental Accounting Standards Board, the CTA is not considered a component unit of the RTA because the CTA maintains separate management, exercises control over all operations, and is fiscally independent from the RTA. Because governing authority of the CTA is entrusted to the Chicago Transit Board comprised of four members appointed by the Mayor of the City of Chicago and three members appointed by the Governor of the State of Illinois, the CTA is not financially accountable to the RTA and is not included as a component unit in the RTA’s financial statements, but is combined in proforma statements with the RTA as statutorily required.
- 65 -

A 5 Accounting System & Financial Controls
BUDGET AND BUDGETARY BASIS OF ACCOUNTING The CTA is required under Section 4.01 of the Regional Transportation Authority Act to submit for approval an annual budget to the RTA by November 15 prior to the commencement of each fiscal year. The budget is prepared on a basis consistent with generally accepted accounting principles, except for the exclusion of certain income and expenses. These amounts include provision for injuries and damage in excess of budget, depreciation expense, pension expense in excess of pension contributions, revenue from leasing transactions, interest income and expense from sale/leaseback transactions and capital contributions. The Act requires that expenditures for operations and maintenance in excess of budget cannot be made without approval of the Chicago Transit Board. All annual appropriations lapse at fiscal year-end. The RTA, in accordance with the Regional Transportation Authority Act, has approved for budgetary basis presentation the CTA's recognition of the amount of the injury and damage reserve and pension contribution, in the approved annual budget. Provisions in excess of the approved annual budget that are unfunded are excluded from the recovery ratio calculation. The RTA funds the budgets of the Service Boards rather than the actual operating expenses in excess of system-generated revenue. Favorable variances from budget remain as operating assistance to the CTA. The RTA approves the proposed budget based on a number of criteria: • That the budget is in balance with regard to anticipated revenues from all sources, including
operating subsidies and the costs of providing services and funding operating deficits. • That the budget provides for sufficient cash balances to pay, with reasonable promptness,
costs and expenses when due. • That the budget provides for the CTA to meet its required system-generated revenue
recovery ratio. • That the budget is reasonable and prepared in accordance with sound financial practices
and complies with such other RTA requirements as the RTA Board of Directors may establish.
The RTA monitors the CTA's performance against the budget on a quarterly basis. If, in the judgment of the RTA, this performance is not substantially in accordance with the CTA's budget for such period, the RTA shall so advise the CTA and the CTA must, within the period specified by the RTA, submit a revised budget to bring the CTA into compliance with the budgetary requirements listed above.
FINANCIAL REPORTING Overview The CTA’s financial statements are prepared in conformity with accounting principles generally accepted in the United States of America (GAAP). GASB is the accepted standard-setting body for establishing governmental accounting and reporting principles. The CTA applies Financial Accounting Standards Board pronouncements (FASBs) and Accounting Principles Board
- 66 -

A 5 Accounting System & Financial Controls
opinions (APBs) issued on or before November 30, 1989, unless those pronouncements conflict with or contradict GASB pronouncements, in which case, GASB prevails, and all of the GASB pronouncements issued subsequently. Basis of Presentation The basic financial statements provide information about the CTA’s business-type and fiduciary (Open Supplemental Retirement Plan) activities. Separate financial statements for each category are presented. The financial statements for the CTA’s business-type activities are used to account for the operations of the CTA and are accounted for on a proprietary (enterprise) fund basis. This basis is used when operations are financed and operated in a manner similar to private business enterprises, where the intent of the governing body is that the costs of providing services to the general public on a continuing basis be financed or recovered primarily through user charges, and the periodic determination of revenues earned, costs incurred, and change in net assets is appropriate. The financial statements for the fiduciary activities are used to account for the assets held by the CTA in trust for the payment of future retirement benefits under the Open Supplemental Retirement Plan. The assets of the Open Supplemental Retirement Plan cannot be used to support CTA operations. Fiscal Year The operating cycle of the CTA is based on the calendar year. Prior to 1995, the CTA operated on a 52-week fiscal year composed of four quarters of “four week, four week, and five week” periods. Periodically, a 53-week fiscal year was required to keep the fiscal year aligned with the calendar. INTERNAL CONTROLS Overview The CTA management is responsible for establishing and maintaining an internal control system designed to ensure that the assets of the CTA are protected from loss, theft or misuse and to ensure that adequate accounting data are compiled to allow for the preparation of financial statements in conformity with generally accepted accounting principles. The internal control system is designed to provide reasonable, but not absolute, assurance that these objectives are met. The concept of reasonable assurance recognizes that the cost of internal control should not exceed the benefits likely to be derived, and that the evaluation of cost and benefits requires estimates and judgments by management. All internal control evaluations occur within the above framework. The CTA’s internal accounting controls are reasonable under the existing budgetary constraints and adequately safeguard assets and provide reasonable assurance of proper recording of all financial transactions.
- 67 -
A 5 Accounting System & Financial Controls
Single Audit As a recipient of Federal, State and RTA financial assistance, the CTA is responsible for ensuring that an adequate internal control system is in place to ensure compliance with applicable laws and regulations related to those programs. This internal control system is subject to periodic evaluation by management and the internal audit staff of the CTA, as well as external auditors. As part of the CTA’s single audit, tests are made to determine the adequacy of the internal control system, including that portion related to Federal financial assistance programs, as well as to determine that the CTA has complied with applicable laws and regulations. The results of the CTA’s single audit for the fiscal year ended December 31, 2007, reported no instances of material weaknesses in the internal control system or violations of applicable laws and regulations. Budgeting Controls In addition, the CTA maintains budgetary controls to ensure compliance with legal provisions embodied in the annual budget appropriated by the Chicago Transit Board and approved by the RTA. The level of budgetary control (that is, the level at which expenditures cannot legally exceed the appropriated amount) is established for total operating expenses. The CTA also maintains a position control system, which requires that every job, which is not part of scheduled transit operations, be budgeted on an annual basis.
- 68 -

A 6 Financial Policy
FINANCIAL PLANNING POLICIES Financial planning policies incorporate both short and long-term strategies focused on the principles of a balanced budget. These policies ensure proper resource allocation and the continued financial viability of the organization. These policies are reviewed on an annual basis as part of the budget process to ensure continued relevance to the organization’s short and long-term goals and objectives. The policies support: A Balanced Budget The budget reflects the short term goals of the agency. Following development, adoption and implementation of the annual budget, the CTA continually monitors actual monthly financial performance against the budget. Each month CTA performs a detailed line-by-line analysis of revenues and expenses to determine operating variances. This includes reviewing position headcount, analyzing material and other expenses, examining revenue scenarios for potential shortfalls, applying seasonality spread in relation to business activities, and conducting continuous audits to ensure a balanced budget. Where potential year-end variances to budget are projected, CTA uses various strategies to manage the variance in order to ensure a balanced budget. A monthly financial performance report is produced and reported to the CTA and RTA boards for their review. The RTA statute requires the CTA to have a balanced budget each year. As such, the CTA takes care in the development of its budget to ensure that assumptions and estimates used to develop the budget are reasonable. The CTA analyzes data from recent years and develops forecasts that are built on actual expense trends. CTA also researches market trends and consultants’ studies that could impact fuel and healthcare expenses. All expenses match available revenues at the time of the budget, including system-generated revenue, public funding and other revenue.
Long-Range Planning The CTA also develops a longer range plan for the period beyond the current budget and two-year financial plan. This 10-year plan assesses the implications of current and proposed budget and policy priorities and financial assumptions. Additionally, external economic studies, demographics and traffic patterns are used to estimate the future transit needs of the Chicago metropolitan area, as well as to establish the future system requirements of the CTA. Current infrastructure needs, as well as system growth needs, are developed, prioritized and incorporated in the long-term plan. Each year, the CTA conducts internal and external audits to test the adequacy of the CTA’s internal control system. Where weaknesses are identified, the CTA takes immediate action to correct such weaknesses to ensure a sound internal control system.
- 69 -

A 6 Financial Policy
Capital Investment Planning The CTA continuously maintains an inventory and assessment of the condition of all major capital assets. A detailed 5-year capital program prioritizes the short-term capital needs in order to bring the system to a state of good repair and maximize customer benefits in the regional transit system. A 20-year capital program condition and assessment report provides a broader list of the CTA’s capital investment needs. REVENUE POLICIES A clear understanding of CTA revenue sources is essential to maintaining a balanced budget and providing quality service to customers. The CTA has policies in place designed to address: Revenue Diversification The CTA’s revenue diversification policy allows the agency to manage potential fluctuations in individual revenue streams. The CTA encourages its organizational units to submit additional revenue ideas for consideration. The CTA has embarked upon numerous alternative revenue enhancements, such as vending machines and ATMs on the system, wireless communications in the subway tunnels, and parking under the elevated right-of-way. Additionally, creative financing transactions have produced millions of dollars over the past few years for the CTA. The CTA continues to find ways to enhance system advertising, charter and concession revenues, as well as revenue from investments. Use of One-Time Revenues Extraordinary revenues from the sale of surplus assets provide one-time benefits to the CTA. These additional revenues are used to fund expense items that are non-recurring.
EXPENDITURE POLICIES Prudent expenditure planning, monitoring and accountability are key elements of fiscal stability. As such, the CTA maintains policies with respect to: Debt Capacity, Issuance and Management These policies serve as a management tool to ensure that the CTA a) may utilize leverage as part of its overall funding strategy to speed up investment in the system, b) may utilize debt in the most efficient and effective manner to fund operating and capital improvement programs, and c) makes full and timely repayment of all borrowings. Additionally, the policy provides broad guidelines to ensure that the agency: 1) achieves the lowest possible cost of capital within prudent risk parameters, 2) secures ongoing access to the capital markets and 3) authorizes the appropriate amount, type and structure of debt for various financing situations.
- 70 -

A 6 Financial Policy
Reserve Accounts To protect against temporary revenue shortfalls or unpredicted one-time expenditures, the RTA maintains a fund balance to provide funding to the Service Boards. These reserve amounts can be used for potentially large one-time expenditures. Expenditure Accountability Every month, the CTA compares its operating and capital performance to budget. Any deviations from budget are reviewed and corrective measures are implemented by the appropriate organizational units. Each unit is responsible for maintaining budget compliance. Actual capital expenditures to budget are also reviewed monthly and adjustments to capital projects spending are made accordingly.
- 71 -

A 7 Operating Statistics – System
2005 2006 2007 2008 2009CHARACTERISTICS Actual* Actual Actual Forecast** Budget
RidershipAvg. Daily Weekday 1,481,695 1,596,351 1,606,360 1,643,740 1,629,624 Avg. Daily Saturday 899,161 966,316 976,563 988,104 972,558 Avg. Daily Sunday 621,450 662,402 674,850 811,657 806,831 System Wide Ridership 492,404,000 494,803,000 499,540,000 524,304,000 517,860,000
ExpenseTop Operator Rate $24.47 $25.33 $26.09 $26.87 $27.68Capital Expenditures $402,951,000 $640,447,000 $730,819,000 $793,400,000 $498,559,000
RevenueAverage Fare per Trip (NTD) $0.85 $0.93 $0.92 $0.91 $1.00Public Funding per Trip (NTD) $1.01 $1.06 $1.10 $1.24 $1.40
* 2005 Statistics for Avg. Daily Ridership do not include rail-to-rail transfers. ** 2008 Avg. Daily Ridership is based on August 2008 YTD actual
System Wide Ridership
470,000,000
480,000,000
490,000,000
500,000,000
510,000,000
520,000,000
530,000,000
2005 Actual 2006 Actual 2007 Actual 2008 Forecast 2009 Budget
- 72 -

A 8 Operating Statistics – Bus
2005 2006 2007 2008 2009CHARACTERISTICS Actual Actual Actual Forecast Budget
ExpensesScheduled Transportation Expense 267,131,081$ 294,371,797$ 298,181,283$ 333,432,662$ 358,740,412$ Garage Maintenance Expense 129,246,941$ 149,523,221$ 162,764,613$ 182,705,609$ 191,305,956$ Support Expense 20,784,554$ 21,859,622$ 21,226,218$ 23,148,485$ 26,727,748$ Heavy Maintenance Expense 30,886,169$ 34,746,708$ 30,185,159$ 38,348,250$ 40,606,063$ Other Expenses 15,533,068$ 17,120,356$ 17,777,849$ 23,076,574$ 25,193,166$ Total Operating Expense - Bus 463,581,813$ 517,621,705$ 530,135,122$ 600,711,580$ 642,573,345$ Fuel Expense 45,787,905$ 57,470,271$ 71,180,811$ 89,918,539$ 102,852,654$
MilesAnnual Vehicle Revenue Miles 66,811,532 66,240,047 68,329,658 68,687,483 68,853,418
TripsAnnual Unlinked Trips (NTD) 303,244,000 298,433,228 308,271,311 331,560,000 309,544,569
VehiclesAnnual Vehicle Revenue Hours (NTD) 6,748,105 6,723,365 6,914,999 7,034,474 7,017,210 Vehicles Operated in Max. Service 1,704 1,797 1,797 1,739 1,757 Vehicles Owned by CTA (at Fall Fleet Assignment) 2,033 2,089 2,175 2,110 2,087 Average Age of Vehicles 9.4 9.4 9.3 5.6 5.6
Annual Vehicle Revenue Hours - Bus
1,000,000
1,500,000
2,000,000
2,500,000
3,000,000
3,500,000
4,000,000
4,500,000
5,000,000
5,500,000
6,000,000
6,500,000
7,000,000
7,500,000
2005 2006 2007 2008 2009
- 73 -

A 9 Operating Statistics – Rail
2005 2006 2007 2008 2009CHARACTERISTICS Actual Actual Actual Forecast Budget*
ExpensesScheduled Transportation Expense 83,501,031$ 90,069,541$ 92,517,533$ 94,916,792$ 97,227,473$ Terminal Maintenance Expense 33,100,142$ 42,951,459$ 41,334,604$ 55,366,856$ 49,718,674$ Support Expense 25,140,426$ 25,939,038$ 26,625,306$ 31,124,012$ 31,645,150$ Heavy Maintenance Expense 8,100,342$ 7,943,783$ 9,426,563$ 11,337,226$ 16,793,169$ Rail Car Appearance Expense 10,099,645$ 11,146,775$ 13,512,415$ 14,945,083$ 13,910,571$ Other Expenses 2,871,320$ 3,329,315$ 3,338,425$ 3,848,380$ 3,168,762$ Total Operating Expense - Rail 162,812,906$ 181,379,911$ 186,754,846$ 211,538,349$ 212,463,799$ Power Expense 22,908,675$ 22,268,274$ 28,141,238$ 35,330,672$ 39,943,579$
MilesAnnual Rail Car Revenue Miles 68,920,555 67,180,033 66,913,835 66,325,792 66,390,695
TripsAnnual Unlinked Trips (NTD) 186,759,000 195,169,000 190,272,997 199,727,172 208,315,440
VehiclesAnnual Train Revenue Hours (NTD) 665,240 659,088 665,477 702,552 702,380 Vehicles Operated in Max. Service 984 1,002 1,008 986 1,002 Vehicles Owned by CTA (at Fall Fleet Assignment) 1,190 1,190 1,190 1,190 1,190 Average Age of Vehicles 22 23 24 25 26
* Assumes no new funding.
Annual Train Revenue Hours - Heavy Rail
-50,000
100,000150,000200,000250,000300,000350,000400,000450,000500,000550,000600,000650,000700,000750,000
2005 2006 2007 2008 2009
- 74 -

A 10 Comparative Performance Analysis – Bus
PERFORMANCE MEASURESService Efficiency CTA WMATA MBTA LACMTA NYCT SEPTA
Operating Exp./Vehicle Rev. Mile $12.50 $12.09 $11.08 $9.03 $18.85 $11.35Operating Exp./Vehicle Rev. Hour $123.17 $128.52 $117.18 $110.26 $146.83 $115.46Maint. Employees/Million Vehicle Rev. Mile 15.80 21.50 23.50 16.20 38.00 21.30
Cost EffectivenessOperating Exp./Passenger Mile $1.11 $1.11 $1.39 $0.57 $1.02 $0.91Operating Exp./Unlinked Trip $2.77 $3.54 $2.80 $2.09 $2.07 $2.53Administrative Exp./Vehicle Rev. Hour $9.50 $22.00 $9.60 $17.00 $16.80 $21.00
Service EffectivenessUnlinked Trips/Vehicle Rev. Mile 4.51 3.42 3.95 4.31 9.13 4.50Unlinked Trips/Vehicle Rev. Hour 44.39 36.34 41.79 52.67 71.06 45.71
Comparison Group
Service Efficiency
Cost Effectiveness
Data obtained from 2006 "Transit Profiles - The Thirty Largest Agencies" published by the National Transit Database Program.
Operating Expense per Vehicle Revenue Mile
$0$2$4$6$8
$10$12$14$16$18$20
CTA WMATA MBTA LACMTA NYCT SEPTA
Operating Expense per Vehicle Revenue Hour
$0
$20
$40
$60
$80
$100
$120
$140
$160
CTA WMATA MBTA LACMTA NYCT SEPTA
Operating Expense per Passenger Mile
$0.00
$0.20
$0.40
$0.60
$0.80
$1.00
$1.20
$1.40
$1.60
CTA WMATA MBTA LACMTA NYCT SEPTA
Operating Expense per Unlinked Trip
$0.00
$0.50
$1.00
$1.50
$2.00
$2.50
$3.00
$3.50
$4.00
CTA WMATA MBTA LACMTA NYCT SEPTA
``
- 75 -

A 11 Comparative Performance Analysis - Rail
PERFORMANCE MEASURES
Service Efficiency CTA WMATA MBTA LACMTA NYCT SEPTAOperating Exp./Vehicle Rev. Mile $7.19 $10.11 $11.56 $13.22 $7.98 $8.80Operating Exp./Vehicle Rev. Hour $132.16 $255.57 $168.45 $301.98 $146.05 $172.09Maint. Employees/Million Vehicle Rev. Mile 8.80 16.00 15.20 20.60 16.40 17.40
Cost EffectivenessOperating Exp./Passenger Mile $0.42 $0.41 $0.44 $0.38 $0.32 $0.36Operating Exp./Unlinked Trip $2.48 $2.34 $1.62 $1.93 $1.44 $1.62Administrative Exp./Vehicle Rev. Hour $15.50 $46.20 $13.60 $57.60 $15.90 $22.30
Service EffectivenessUnlinked Trips/Vehicle Rev. Mile 2.91 4.32 7.14 6.86 5.52 5.43Unlinked Trips/Vehicle Rev. Hour 53.38 109.30 104.11 156.86 101.14 106.14
Comparison Group
Service Efficiency
Cost Effectiveness
Data obtained from 2006 "Transit Profiles - The Thirty Largest Agencies" published by the National Transit Database Program.
Operating Expense per Vehicle Revenue Mile
$0
$2
$4
$6
$8
$10
$12
$14
CTA WMATA MBTA LACMTA NYCT SEPTA
`
Operating Expense per Vehicle Revenue Hour
$0
$50
$100
$150
$200
$250
$300
$350
CTA WMATA MBTA LACMTA NYCT SEPTA
Operating Expense per Passenger Mile
$0.00
$0.05
$0.10
$0.15
$0.20
$0.25
$0.30
$0.35
$0.40
$0.45
$0.50
CTA WMATA MBTA LACMTA NYCT SEPTA
Operating Expense per Unlinked Trip
$0.00
$0.50
$1.00
$1.50
$2.00
$2.50
$3.00
CTA WMATA MBTA LACMTA NYCT SEPTA
`
- 76 -

A 12 Acronyms
AC Alternating Current ADA Americans with Disabilities Act AFC Automated Fare Collection APC Automatic Passenger Counter AVAS Automated Voice Annunciation System BLS Bureau of Labor Statistics BOB State Bureau of the Budget CATS Chicago Area Transportation Study CBO Congressional Budget Office CDOT Chicago Department of Transportation CIP Capital Improvement Program CPD Chicago Police Department CPI Consumer Price Index CTA Chicago Transit Authority DBE Disadvantaged Business Enterprise DC Direct Current EIA Energy Information Administration ePMO Enterprise Program Management Office ERISA Employee Retirement Income Security Act ERP Enterprise Resource Planning FAA Federal Aviation Administration FFGA Full Funding Grant Agreement FOMC Federal Reserve Board Open Market Committee FTA Federal Transit Administration FY Fiscal Year GDP Gross Domestic Product GFOA Government Finance Officers Association IDOT Illinois Department of Transportation LACMTA Los Angeles County Metropolitan Transportation Authority MBTA Massachusetts Bay Transportation Authority MMIS Maintenance Management Information System NABI North American Bus Industries NTD National Transit Database NYCT New York City Transit OPEC Organization of Petroleum Exporting Countries PBC Public Building Commission of Chicago PPA/AV Platform Public Address/Audio Visual POB Pension Obligation Bond PPI Producer Price Index RTA Regional Transportation Authority SAFETEA-LU Safe, Accountable, Flexible, Efficient Transportation Equity Act: A Legacy
for Users SCADA Supervisory Control And Data Acquisition SCIP Strategic Capital Improvement Program SEPTA Southeastern Pennsylvania Transportation Authority SGR State of Good Repair SPTO Scheduled Part-Time Operator
- 77 -

A 12 Acronyms
STO Scheduled Transit Operations TEA-21 Transportation Equity Act - 21st Century TCVM Transit Card Vending Machines TTI Texas Transportation Institute WMATA Washington Metropolitan Area Transit Authority
- 78 -

A 13 Glossary
Accessible As defined by FTA, a site, building, facility, or portion thereof that
complies with defined standards and that can be approached, entered, and used by persons with disabilities.
Accrual Basis A method of accounting in which revenues are reported in the fiscal period it is earned, regardless of when it is received, and expenses are deducted in the fiscal period they are incurred, whether they are paid or not.
ADA The Americans with Disabilities Act of 1990. This federal act requires many changes to ensure that people with disabilities have access to jobs, public accommodations, telecommunications, and public services, including public transit. Examples of these changes includes mandating that all new buses and rail lines be wheel chair accessible, and that alternative transportation be provided to customers unable to access the transit system.
AFC Automated fare collection system. Articulated Bus A high capacity passenger bus that flexes in the middle. Bond An interest-bearing promise to pay a specified sum of money on a
specified date. Capital Budget A formal plan of action for a specified time period for purchases of
fixed assets using capital grants. Capital Expense Expenditures that acquire, improve, or extend the useful life of any
item with an expected life of three or more years and a value of more than $5,000, e.g. rolling stock, track and structure, support facilities and equipment, and stations and passenger equipment. It can also include the costs associated with the long-term maintenance of these assets such as bus overhaul programs, rail overhaul programs, and preventative maintenance. Also referred to as a capital improvement.
Capital Grant Funds received from grantor funding agencies used to finance construction, renovation, and major repairs or the purchase of machinery, equipment, buildings or land.
Chicago Card A stored-value farecard that has an imbedded microchip that can be read to register fares by the fare equipment when touched to the touchpad on the front of rail station turnstiles and bus fareboxes on all CTA routes and Pace buses. Value is added with cash at CTA vending machines or off-site Touch-n-Go devices.
Chicago Card Plus A farecard with its balance maintained in an online account rather than stored on the card itself. Value is added with credit cards or through electronic transit benefit deductions only. The card also features online reloading — customer accounts automatically reload each time their account value falls below the pre-selected reload amounts.
Collar Counties The five counties that surround Cook County as identified in the RTA Act. Collar counties include Will, Kane, DuPage, Lake, and McHenry.
Congestion Pricing A method of pricing that varies during the time of travel. During peak travel times, customers are charged a higher fare than during off-peak travel times.
Corridor A defined study area considered for significant transportation projects such as highway improvements, bus transitways, rail lines, or bikeways (e.g. Dan Ryan corridor, Western Avenue corridor).
- 79 -

A 13 Glossary
Corridor A defined study area considered for significant transportation projects such as highway improvements, bus transitways, rail lines, or bikeways (e.g. Dan Ryan corridor, Western Avenue corridor).
Consumer Price Index (CPI)
A statistical description of price levels provided by the U.S. Department of Labor. The index is used as a measure of the increase in the cost of living (i.e. economic inflation).
Deferred Operating Assistance
Operating funds remaining from a prior year as a result of a budget surplus that can be used to cover shortfalls or capital expenditures in future years. Spending is allowed only after RTA budgetary approval.
Depreciation An accounting term that recognizes the loss in value of a tangible fixed asset over time attributable to deterioration, obsolescence, and impending retirement. Applies particularly to physical assets like vehicles, equipment and structures.
Discretionary Funds Funds that the RTA allocates, at its discretion, to the Service Boards. These funds include Public Transportation Funds and a portion of the 15 percent of the RTA Sales Tax.
DriveCam Technology
A driver risk management system that is designed to monitor, evaluate, and identify driving behavior of CTA bus operators as a means to prevent accidents, increase safety, and reduce the cost of repairs and accident claims.
ERISA The Employee Retirement Income Security Act of 1974. ERISA is a federal law that sets minimum standards for most voluntarily established pension and health plans in private industry to provide protection for individuals in these plans.
Fare The amount charged to passengers for bus and rail services. Farebox Equipment used for the collection of bus fares. Farecard Electronic fare media used for payment of fares. Federal Funds Rate The Federal Funds Rate is the interest rate at which banks lend
balances at the Federal Reserve to other banks overnight. The rate is set by the Federal Open Market Committee (FOMC). The FOMC's long term goals are price stability and sustainable economic growth in the economy.
FICA
Federal Insurance Contributions Act. Social Security payroll taxes are collected under authority of FICA.
Financial Plan In addition to an annual budget, the Regional Transportation Authority Act, amended in 1983, requires that all transit agencies prepare a financial plan encompassing the two years subsequent to the budget year. This provides a three-year projection of expenses, revenues, and public funding requirements.
Fiscal Year A fiscal year is a 12-month period used for calculating annual financial reports in organizations. CTA’s fiscal year is synonymous with the calendar year and begins on January 1 and ends on December 31.
Fixed-Route Service Buses that operate according to fixed schedules and routes (in contrast to demand-response service).
Federal Transit Administration (FTA)
The Federal Transit Administration is the federal agency which provides financial and planning assistance to help plan, build, and operate rail, bus and paratransit systems through grant programs.
- 80 -

A 13 Glossary
Full Funding Grant Agreement (FFGA)
Grant agreements authorized under federal transit law that establish the terms and conditions for federal financial participation in a New Starts project. The FFGA defines the project; sets the maximum amount of Federal new starts funding for a project; covers the period of time for completion of the project; and facilitates efficient management of the project in accordance with applicable federal statutes, regulations, and policy.
Fund Balance The excess of funding over deficit for a given period of time. Refers to the unreserved/undesignated funds. Annual budget surpluses (or deficits) generally add to (or subtract) from the fund balance.
Funding (Budget) Marks
The Regional Transportation Authority Act, as amended in 1983, calls for RTA to advise each of its Service Boards by September 15th of the public funding to be available for the following year, as well as the required recovery ratio.
Gross Domestic Product (GDP)
Gross Domestic Product. A measure of economic activity, it is the amount of goods and services produced in the United States in a year. It is calculated by adding together the market values of all of the final goods and services produced in a year and reported by the Bureau of Economic Analysis.
Headway The time span between service vehicles (bus or rail) on specified routes. Also called service frequency.
Heavy Rail An electric railway with the capacity for a heavy volume of traffic. Heavy rail is characterized by high-speed passenger rail cars and trains operating on fixed rails in separate rights-of-way from which all other vehicular and foot traffic is excluded.
Illinois FIRST Illinois Fund for Infrastructure, Roads, Schools and Transit. Illinois FIRST is a five-year public works improvement program that allocated capital funds between FY 2000 through FY 2004.
Infrastructure Capital assets that make up CTA’s transportation system, including maintenance facilities, rail track, signals, stations, elevated structures, and power substations.
In-Kind Services Refers to services provided at no cost to the CTA. For example, the City of Chicago provides dedicated security forces to the CTA at no cost to the CTA.
Intermodal Transportation by more than one mode (bus, train, etc.) during a single journey.
Labor Base Labor expense for time actually worked. It excludes holidays, sick time, and vacation time.
Labor Load The cost of fringe benefits. The burden includes group health insurance, paid time off, FICA, workers compensation, and retirement obligations.
Metra The Commuter Rail Division of the RTA responsible for the day-to-day operation of the region’s long-distance commuter rail transit service (with the exception of those services provided by the CTA). Metra was created in 1983 by an amendment to the RTA Act.
Moving Beyond Congestion (MBC)
A joint project launched in 2006 by the Regional Transit Authority, CTA, Metra and Pace to address the operating and capital funding challenges for the region, ensure financial viability and accountability and to meet the region’s growing and changing transportation needs.
- 81 -

A 13 Glossary
National Transit Database (NTD)
The Federal Transit Administration's (FTA's) primary national database for statistics on the transit industry.
New Starts The Federal Transit Administration’s (FTA) discretionary program that is the federal government’s primary financial resource for supporting locally-planned, implemented, and operated transit "guideway" capital investments.
Non-Operating Funds Expenses funded with capital grants. Non-Revenue Vehicle Vehicles that do not carry fare-paying passengers used to support
transit operations. Off Peak Periods Non rush-hour time periods. OPEC The Organization of Petroleum Exporting Countries coordinates the
petroleum policies of its members. OPEC member nations supply approximately 40 percent of the world’s crude oil and 16 percent of its natural gas.
Operating Budget Annual revenues and expenses forecast to maintain operations. Operating Expenses Costs associated with the day-to-day operation of the delivery of
service for a transit agency. Examples of operating expenses include labor, material, fuel, power, security, and professional services.
Operating Revenues Revenues generated from user fees or other activities directly related to operations such as advertising, concessions, parking, and investment income, etc.
Owl Service Service that is provided continuously between midnight and 5 a.m. Owl Service is provided only on routes that run 24-hour service.
Pace The Suburban Bus Division of the RTA responsible for all non-rail suburban public transit service and all paratransit service. Pace was created in 1983 by an amendment to the RTA Act.
Paratransit Service Demand-response service utilizing wheelchair-accessible vans and small buses to provide pre-arranged trips to and from specific locations within the service area to certified participants in the program. Paratransit includes demand-response transportation services, subscription bus services and shared-ride taxis.
Passenger Miles The cumulative sum of the distances traveled by passengers. Peak Periods Rush-hour time periods, typically defined as 6:30 a.m. through 9:30
a.m. and 4:00 p.m. through 7:00 p.m., Monday through Friday. Pension Obligation Bonds
A fixed interest financial asset issued by governments, companies, banks, public utilities and other large entities as a means of borrowing money to refinance an unfunded pension liability.
Performance Management
Performance management is the process of assessing and acting upon progress toward achieving predetermined measures and metrics. All personnel are held accountable to these measures and metrics. CTA implemented a performance management program in May 2007.
Platform Time The period of time in which a transit vehicle is in operation. Platform time contains time that buses are in revenue service and time required to support revenue service, for example time from a garage to the beginning of a route.
- 82 -

A 13 Glossary
Positive Budget Variance
Calculated as the difference between a service board’s budgeted and actual deficit, a positive budget variance results when the actual deficit is less than the budgeted deficit. Since the RTA funds the budgeted deficit, a positive budget variance represents available funds for the service boards.
Producer Price Index (PPI)
A family of indexes from the Bureau of Labor Statistics (BLS) that measures the average changes over time in the prices received by domestic producers of goods and services.
Public Funding Funding received from the RTA or other government agencies. Public Transportation Funds (PTF)
Funds transferred from the State of Illinois General Fund into the Public Transportation Fund in an amount equal to 25 percent of RTA Sales Tax collected. All funds deposited are allocated to RTA to be used at its discretion for the benefit of the Service Boards.
Purchase of Paratransit Service
The amount of money paid to contractors who provide transportation to certified participants in the ADA paratransit service program.
QuicTrack A system that allows monitoring and identification of rail cars via a graphical map of the CTA track system. The run number, current schedule, and headway are displayed on the map.
Recovery Ratio The ratio is calculated as system- generated revenues as allowed by the RTA Act. This ratio is calculated for each of the Service Boards and for the RTA region as a whole. The RTA Act mandates that the RTA region must attain an annual recovery ratio of at least 50 percent.
Reduced Fares Discounted fare for children age 7 – 11, grade school and high school students (with CTA ID), seniors 65 and older (with RTA ID), and riders with disabilities (with RTA ID) except paratransit riders.
Reduced Fare Reimbursement
Reimbursements from the State of Illinois are made to the Service Boards for the difference between standard fares and the reduced fares charged to students, the elderly and the disabled.
Revenue Bond A certificate of debt issued by an organization in order to raise revenue. It guarantees payment of the original investment plus interest by a specified date. Debt service payment is secured by a specific revenue source.
Revenue Equipment Includes vehicles that carry fare-paying passengers, and equipment used for the collection of fares.
Ride A trip taken by passengers on the bus or rail system. Ridership (Unlinked Passenger Trips)
Each passenger counted each time that person boards a vehicle.
Rolling Stock Public transportation vehicles, including rail cars and buses. Regional Transit Authority (RTA)
The Regional Transit Authority is the financial oversight and regional planning body for the three public transit operators in northeastern Illinois: the Chicago Transit Authority (CTA), Metra commuter rail and Pace suburban bus.
Run Rail or bus operator's assigned period(s) of work on a given day. SAFETEA-LU Safe, Accountable, Flexible, Efficient Transportation Equity Act: A
Legacy for Users (SAFETEA-LU). Federal transit and highway bill signed into act on August 10, 2005 authorizing $286.4 billion nationwide through 2009, including $52.6 billion for transit.
- 83 -

A 13 Glossary
Senate Bill (SB) 1977 Illinois Senate Bill that stipulates that CTA must make annual contributions to the CTA Pension Fund to achieve a 90 percent funded ratio by the end of 2058 beginning January 1, 2009.
Service Board CTA, Metra commuter rail, and Pace suburban bus system, as referred to by the Regional Transportation Authority Act
Slow Zone Sections of track where trains must reduce speed in order to safely operate rail service.
Special Service A transportation service, as defined by the FTA, specifically designed to serve the needs of persons who, by reason of disability, are unable to use mass transit systems designated for the use of the general public.
Proprietary Fund A classification of fund within the fund accounting system commonly used by non-profit agencies, includes both enterprise funds and internal service funds; not the General Fund.
Part-time operators (PTO)
Part-time operators are part-time STO personnel restricted to a maximum of 30 hours of work per week. They receive a lower pay rate than full-time operators.
Scheduled Transit Operations (STO)
The scheduled transit operations classification includes bus operators, motormen, conductors, and customer assistants.
System Generated Revenue
Revenue generated internally by CTA. Includes fare revenue, advertising, investment income, income from local governments by provision of the Regional Transportation Authority Act, and subsidies for reduced fare riders per 1989 legislation.
TEA–21 Federal transportation package which reauthorized the Federal Transit Program for the eight years from 1998 to 2005. Grants can pay up to 80 percent of a capital project, with the remaining 20 percent funded from local sources.
Top Operator Rate The top hourly rate paid to CTA bus and rail operators, based on employee seniority within the job, as specified by the union contract.
Transit Benefit Program
Employer-administered program which allows employees to pay for transit fare media using pre-tax income.
Trip A one-way bus trip or a one-way train trip from origin to destination terminal.
Unlinked Passenger Trip
A single boarding of a transit vehicle. A single journey by one passenger, consisting of one or more unlinked trips is considered a linked trip.
Vehicle Revenue Hours
The hours that vehicles travel while in revenue service. Vehicle revenue hours include recovery time but exclude travel to and from storage facilities.
Vehicle Revenue Miles
Miles that vehicles travel while in revenue service. Vehicle revenue miles exclude travel to and from storage facilities.
Warranty and Credits Reimbursement for repairs covered by manufacturers’ warranty agreements.
- 84 -

Distinguished Budget Presentation Award
2008 marked the 17th consecutive year that CTA has received the Distinguished budget award from the Government Finance Officers Association (GFOA) for excellence in budget presentation. To receive this award, the budget document must meet program criteria as a policy document, as an operations guide, as a financial plan, and as a communications device. We believe the 2009 budget document continues to satisfy the award criteria and are submitting it to GFOA for 2008.

Chicago Transit Authority
LN08008