smart support & resistance t3 · pdf filesmart support & resistance t3 ... swing,...
TRANSCRIPT
Smart Support & Resistance T3 Automatic universal support and resistance indicator
Description Smart Support & Resistance T3 is a multi-purpose customizable indicator which automatically detects important price levels and plots them in form of support and resistance levels along with optional target levels.
Smart Support & Resistance T3 can be used for any market, any instrument and any time frame. It is intended for discretionary and systematic traders who use trend-following, swing, breakout or mean reversion trading techniques.
Smart Support & Resistance T3 can be used in a number of ways:
• As a trend indicator
• As a breakout indicator
• As an advanced tool to detect chart patterns and formations like triangles, wedges and so on.
The indicator plots 4 lines: support (cyan by default), resistance (red) and target lines (white). There is an option to plot both support and resistance lines with increasing weight showing the strength of the trend: the thicker the line, the stronger. Markets are different, therefore index futures like ES or NQ will show a total domination of uptrends, while in currency futures like EC trends are infrequent and no single direction is prevailing. Most of the time trends take 2 to 5 days, but major trends last for weeks and even months without an interruption, which is clearly shown by this indicator.
Usage The easiest way to trade with Smart Support & Resistance T3 is to follow the trend. When a new support appears it is reasonable to look for opening long positions.
More smart use of Smart Support & Resistance T3 is to trade swings inside a trend. For this purpose it is recommended to wait for a day which closes down in an uptrend or a day which closes up in a down trend and then buy or sell respectively.
Chart pattern traders may take advantage of this indicator to find consolidation patterns like wedges and triangles.
solutions
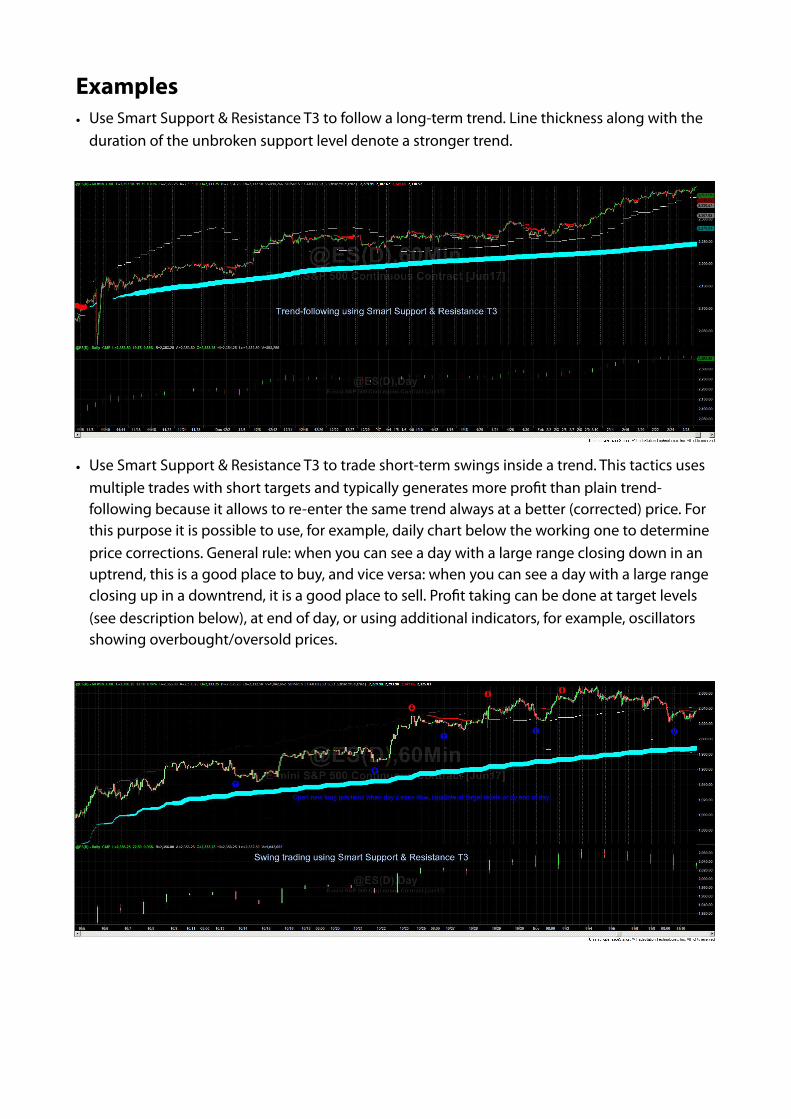
Examples • Use Smart Support & Resistance T3 to follow a long-term trend. Line thickness along with the
duration of the unbroken support level denote a stronger trend.
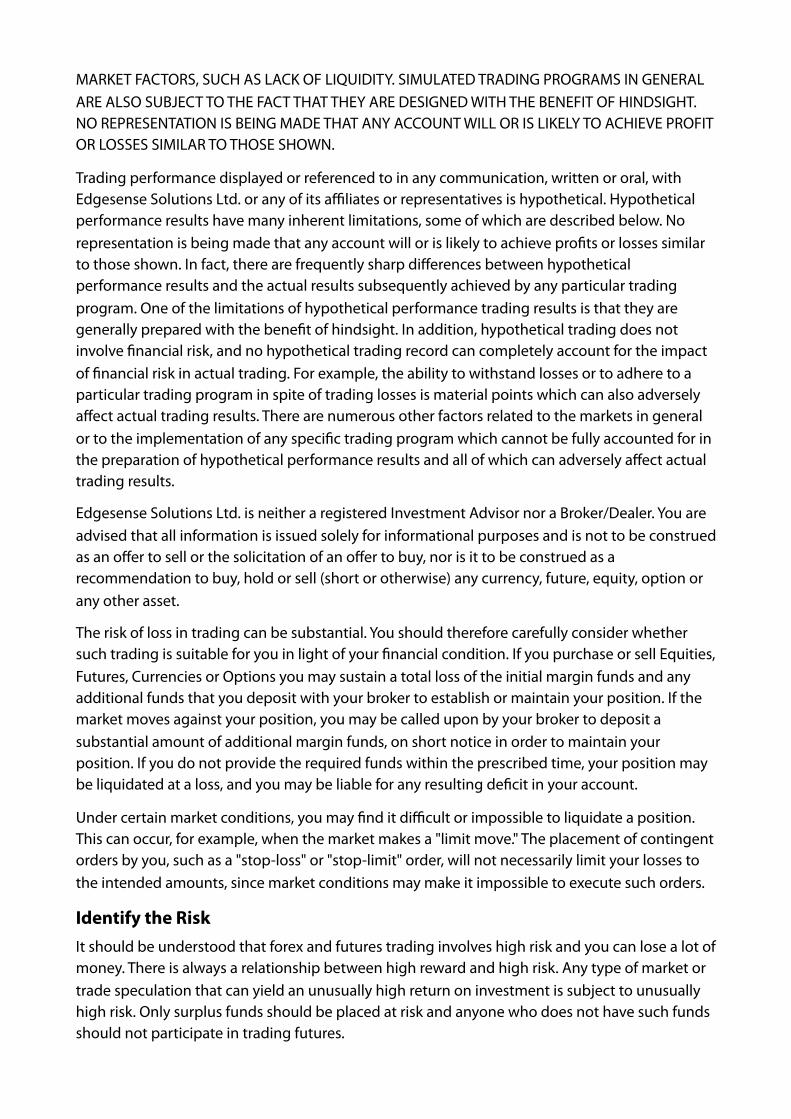
• Use Smart Support & Resistance T3 to trade short-term swings inside a trend. This tactics uses multiple trades with short targets and typically generates more profit than plain trend-following because it allows to re-enter the same trend always at a better (corrected) price. For this purpose it is possible to use, for example, daily chart below the working one to determine price corrections. General rule: when you can see a day with a large range closing down in an uptrend, this is a good place to buy, and vice versa: when you can see a day with a large range closing up in a downtrend, it is a good place to sell. Profit taking can be done at target levels (see description below), at end of day, or using additional indicators, for example, oscillators showing overbought/oversold prices.

• Use Smart Support & Resistance T3 to detect various consolidation chart patters, such as wedges and triangles. Such a formation can be observed when support and resistance overlap, showing the consolidation zone.
Data Smart Support & Resistance T3 can work with virtually any instrument at any resolution. Nevertheless we recommend to use intraday time frames for best results. Depending on the chosen resolution you can see longer and shorter term trends. For example, using 30 minutes time frame and above allows to detect very long-term trends, which sometimes take weeks and even months. Using 5 minutes time frame and below allows to watch for dynamic intraday movements.
There is an option to use daily data along with the main (working) data. Daily data is used only to calculate target levels and is it not required for calculating the support and resistance levels. Besides that daily chart can be used as a simple tool to watch for local pullbacks in major trends as shown in pictures above. Once a day closes up in a downtrend or closes down in an uptrend, it is an opportunity to enter a short-term swing trade which will not conflict with the trend.

Setup The indicator features a few parameters which allow to make it more or less sensitive to important starting price levels, and also to adjust its visual representation.
• RES_strength: adjust the sensitivity of the resistance detector. Lower values will generate more trend-like setups which will break quickly. Greater values may miss certain tradable trends. Optimal values are between 2 and 5, default is 3.
• RES_factor: adjust the target level related to resistance. Target level is calculated as a factor of daily volatility subtracted from the value of the resistance level. The greater the value of RES_factor, the more distant it will be from the resistance. Reasonable values are between 1 (best for currency futures) and 2.5-3 (best for index futures). Default value is 1. Note that daily data as a secondary data stream is required for calculation of the target level. To add daily data to the chart use menu Insert -> Symbol and use the same symbol as in the main chart, only with daily resolution.
• SUP_strength: adjust the sensitivity of the support detector, see explanation on RES_strength above.
• SUP_factor: adjust the target level related to support, see explanation on RES_factor above.
• USE_VOLUME: a logical value, if set to “true” then trade volume is taken into consideration when calculating support and resistance levels, if set to “false” then only price data is used. The latter option may be useful to work with instruments for which volume data is unavailable.
• USE_DAILY_DATA: a logical value, if set to “true” then target levels (see explanation above) are calculated and plotted on chart, if set to “false” then target levels are not calculated.
• USE_WIDTH: a logical value, if set to “true” then the support or resistance line width increases over time which helps easily visually identify major trends. If set to “false” then the width of support or resistance lines does not change.
About the developer Edgesense Solutions is a boutique trading firm with strong focus on automated trading. Since 2003 the company’s founders have been developing strategies for prop trading. Since 2011 the firm offers trading strategies and sophisticated trading solutions to small and medium size institutions along with high net worth individuals. Edgesense Solutions also offers services in portfolio design, risk management and trading platforms development, and runs educational programs for traders. You can reach us at [email protected].
Disclaimer CFTC RULE 4.41: HYPOTHETICAL OR SIMULATED PERFORMANCE RESULTS HAVE CERTAIN LIMITATIONS. UNLIKE AN ACTUAL PERFORMANCE RECORD, SIMULATED RESULTS DO NOT REPRESENT ACTUAL TRADING. ALSO, SINCE THE TRADES HAVE NOT BEEN EXECUTED, THE RESULTS MAY HAVE UNDER-OR-OVER COMPENSATED FOR THE IMPACT, IF ANY, OF CERTAIN
MARKET FACTORS, SUCH AS LACK OF LIQUIDITY. SIMULATED TRADING PROGRAMS IN GENERAL ARE ALSO SUBJECT TO THE FACT THAT THEY ARE DESIGNED WITH THE BENEFIT OF HINDSIGHT. NO REPRESENTATION IS BEING MADE THAT ANY ACCOUNT WILL OR IS LIKELY TO ACHIEVE PROFIT OR LOSSES SIMILAR TO THOSE SHOWN.
Trading performance displayed or referenced to in any communication, written or oral, with Edgesense Solutions Ltd. or any of its affiliates or representatives is hypothetical. Hypothetical performance results have many inherent limitations, some of which are described below. No representation is being made that any account will or is likely to achieve profits or losses similar to those shown. In fact, there are frequently sharp differences between hypothetical performance results and the actual results subsequently achieved by any particular trading program. One of the limitations of hypothetical performance trading results is that they are generally prepared with the benefit of hindsight. In addition, hypothetical trading does not involve financial risk, and no hypothetical trading record can completely account for the impact of financial risk in actual trading. For example, the ability to withstand losses or to adhere to a particular trading program in spite of trading losses is material points which can also adversely affect actual trading results. There are numerous other factors related to the markets in general or to the implementation of any specific trading program which cannot be fully accounted for in the preparation of hypothetical performance results and all of which can adversely affect actual trading results.
Edgesense Solutions Ltd. is neither a registered Investment Advisor nor a Broker/Dealer. You are advised that all information is issued solely for informational purposes and is not to be construed as an offer to sell or the solicitation of an offer to buy, nor is it to be construed as a recommendation to buy, hold or sell (short or otherwise) any currency, future, equity, option or any other asset.
The risk of loss in trading can be substantial. You should therefore carefully consider whether such trading is suitable for you in light of your financial condition. If you purchase or sell Equities, Futures, Currencies or Options you may sustain a total loss of the initial margin funds and any additional funds that you deposit with your broker to establish or maintain your position. If the market moves against your position, you may be called upon by your broker to deposit a substantial amount of additional margin funds, on short notice in order to maintain your position. If you do not provide the required funds within the prescribed time, your position may be liquidated at a loss, and you may be liable for any resulting deficit in your account.
Under certain market conditions, you may find it difficult or impossible to liquidate a position. This can occur, for example, when the market makes a "limit move." The placement of contingent orders by you, such as a "stop-loss" or "stop-limit" order, will not necessarily limit your losses to the intended amounts, since market conditions may make it impossible to execute such orders.
Identify the Risk It should be understood that forex and futures trading involves high risk and you can lose a lot of money. There is always a relationship between high reward and high risk. Any type of market or trade speculation that can yield an unusually high return on investment is subject to unusually high risk. Only surplus funds should be placed at risk and anyone who does not have such funds should not participate in trading futures.
It should also be understood that hypothetical performance results may be posted on the website or given to third parties by other methods. Such hypothetical performance results have inherent limitations in that they have been prepared with the use of past performance and past performance is no guarantee of future results. Performance can and does vary between individuals.
High Risk Investment Trading foreign exchange and futures carries a high level of risk, and may not be suitable for all investors. Before deciding to trade foreign exchange or futures you should carefully consider your investment objectives, level of experience, and risk appetite. The possibility exists that you could sustain a loss of some or all of your initial investment and therefore you should not invest money that you cannot afford to lose. You should be aware of all the risks associated with foreign exchange trading, and seek advice from an independent financial advisor if you have any doubts.
It is essential that a Demo simulator account is first used thoroughly before commencing with a Live account. The services offered by Edgesense Solutions Ltd. are strictly for the use by traders with excess risk capital and who are fully aware of the inherent risks involved in trading. The high degree of volatility, and the ability to leverage your position means that losses can be quick and significant. You may lose your entire investment capital. It is your responsibility to ensure that you fully understand these conditions before proceeding further.
Limitation of liability BY USING THE SERVICES OFFERED BY EDGESENSE SOLUTIONS LTD. OR USING EDGESENSE SOLUTIONS LTD. WEBSITE YOU AGREE THAT ANY EMPLOYEE OR REPRESENTATIVE OF EDGESENSE SOLUTIONS LTD. AND ANY OTHER ENTITIES ASSOCIATED WITH EDGESENSE SOLUTIONS LTD. SHALL NOT BE HELD LIABLE FOR ANY DIRECT, INDIRECT, CONSEQUENTIAL LOSS OR ANY DAMAGES WHATSOEVER ARISING FROM THIS USAGE, OR THE USE OF ANY INFORMATION, SIGNALS, SOFTWARE, MESSAGES, MANUAL, WORKSHEET, INSTRUCTIONS, ALERTS, DIRECTIVES ETC AND ANY OTHER INFORMATION CONTAINED IN REGARD TO ITS USE AND UNDERSTANDING. USE THE SITE AND THE SERVICES OFFERED BY EDGESENSE SOLUTIONS LTD. OR ANY OF ITS EMPLOYEES, REPRESENTATIVES AND/OR ANY OTHER PERSONS AND ENTITIES ASSOCIATED WITH EDGESENSE SOLUTIONS LTD. AT YOUR OWN RISK. NEITHER GUARANTEES OF PERFORMANCE, RESULTS NOR IS ANY ANTICIPATED RETURN ON INVESTMENT OFFERED AT ANY TIME. PAST PERFORMANCE IS NO GUARANTEE OF FUTURE RESULTS.