smart survey report - reliefweb.int · 2.2 sampling procedure: ... 13 2.7 characteristic ... from...
TRANSCRIPT

SMART survey Report
Al-Bab district, Aleppo, North Syria
Conducted by:
Al-Ameen Organization
January 2018

Table of Contents
Acknowledgement ................................................................................................................ 3 List of Acronyms ................................................................................................................... 4 Executive summary .............................................................................................................. 5 2. Methodology .................................................................................................................... 8
2.1 Sample size .................................................................................................................. 8 2.2 Sampling procedure: selecting clusters .................................................................... 10 2.3 Sampling procedure: selecting households and children ......................................... 10 2.4 Case definitions and inclusion criteria ...................................................................... 11 2.5 Questionnaire, training and supervision ................................................................... 11 2.6 Data analysis.............................................................................................................. 13 2.7 Characteristic of the sample ..................................................................................... 13 2.8 limitation: .................................................................................................................. 15
3. Results ............................................................................................................................ 16 Prevalence of acute malnutrition based on weight-for-height z-scores ..................... 16 prevalence of acute malnutrition based on MUAC cut off's (and / or oedema): ....... 18 Prevalence of underweight based on weight-for-age z-score (WAZ) ......................... 19 Prevalence of stunting based on height-for-age z-score (HAZ) ................................... 20 Prevalence of overweight based on weight for height z-score (HAZ) ......................... 21
4. Discussion ....................................................................................................................... 23 4.1 Nutritional status ...................................................................................................... 23 4.2 Causes of malnutrition .............................................................................................. 24
5. Conclusions ..................................................................................................................... 25 6. Recommendations and priorities ................................................................................... 26 7. Annexes .......................................................................................................................... 27
Annex 1: Plausibility report ............................................................................................. 27 Annex 2: Assignment of Clusters .................................................................................... 41 Annex 3: Evaluation of Enumerators (Standardization test result) ................................ 43 Annex 4: Survey Questionnaire:...................................................................................... 47 Annex 5: Calendar events: .............................................................................................. 48 Annex 6: Cluster control form: ........................................................................................ 49 Annex 7: Segmentation table .......................................................................................... 50 Annex 8: Map of the surveyed area: ............................................................................... 51

Acknowledgement
This survey was conducted by Al-Ameen Organization. This survey would not have been
possible without the support of Nutrition Cluster members for the Northern Syria
operations based in Gaziantep, in Southern Turkey.
Technical support for the survey was provided by the technical Assessment working group
, Dr.Ahmed Aldaif Survey Manager for nutrition cluster with support from the Centers
for Disease Control and Prevention (CDC). This report has been prepared by Dr. Abdulaziz
Sadek (SMART survey consultant).
A profound thank you to all people who participated and contributed to have a successful survey. A profound thank you also to the survey teams for their dedication and attention to detail as well as all village leaders, local council and guides for their willingness to assist where needed. Involvement of the mothers and caregivers, particularly for giving their time to answer interview questions is extremely appreciated, without whom the collection of required data would have been impossible.

List of Acronyms CDC Centers for Disease Control and Prevention CHW Community Health Worker CI Confidence Interval ENA Emergency Nutrition Assessment GAM Global Acute Malnutrition HAZ Height-for-Age Z-Scores HFA Height-for-Age HH Household IYCF Infant and Young Child Feeding IYCF-E Infant and Young Child Feeding in Emergencies MAM Moderate Acute Malnutrition MUAC Mid-Upper Arm Circumference NGO Non-Governmental Organization PAC Physicians Across Continents – Turkey (NGO) PLW Pregnant and Lactating Woman PPS Probability Proportional to Size RC Reserve Cluster SAM Severe Acute Malnutrition SD Standard Deviation SMART Standardized Monitoring and Assessment of Relief and
Transitions WAZ Weight-for-Age Z-Scores WFA Weight-for-Age WFH Weight-for-Height WHO World Health Organization WHZ Weight-for-Height Z-Scores

Executive summary Six years of on-going conflict has had a significant negative effect on the Humanitarian sector in Syria. The Health and nutrition services are among some of the most affected sectors in the country. The most vulnerable population groups in Syria consist of mainly Children under 5 years and Pregnant and lactating women (PLW). The Eastern and Northern rural of Aleppo are one of the most IDPs receiving area in Syria, Al Bab area was under the control of the Islamic state for about three years, therefore many NGOs suspended their activities. In light of this, the area lost most of the humanitarian services and the situation had deteriorated. After the oppositions had taken the control of the area, many people had been returned and the area also received a huge wave of IDPs from Raqqa and Deir-Ezzour, many NGOs are now working in the area and are providing Health and Nutrition Services. The last SMART survey conducted in Aleppo in 2015 showed a GAM rate of 1.3 % (0.5 – 3.1 95% C.I) Al Bab area was excluded from that survey due to insecurity. This result could be extended to Al Bab district due to the common factors and similarities in geography. The main Goal of this survey was to Estimate the prevalence of malnutrition in the children between 6-59 months in the accessible areas of AL Bab district. A two-stage cluster sampling methodology was used. 30 clusters from the area were randomly selected. The field data collection was conducted between the 8th and 17th August 2017 and was under taken by four teams selected after training. The data collection lasted for 8 days. In each cluster 12 HH were randomly selected using the systematic random sampling method. Each HH was visited and all questionnaire and measurement were taken. All 30 pre-selected cluster were visited and no reserve cluster were used. 347 HH were visited where 480 children 6 -59 month were surveyed for malnutrition. The overall plausibility score of the Survey was 10 which is considered as good (Annex 1). The GAM rate in children 6- 59 month was 3.1% (1.8 – 5.5 95% C.I.), the severity of this prevalence classified as “low” based on WHO classification1 for severity of malnutrition, if compared to other SMART surveys conducted in Syria in the last years, we find approximately same level of malnutrition ( < 5%) ,The Table 1 below provide a summary of the main indicators.
1 WHO classification of severity of malnutrition:
http://www.who.int/nutgrowthdb/about/introduction/en/index5.html

Table 1: Summary of key indicators
Prevalence of acute malnutrition based on weight-height z-scores2
(n) % 95 % CI
Prevalence of global acute malnutrition (WFH <-2 z-score and/or oedema)
15 3.1 1.8 – 5.5 95% C.I.
Prevalence of moderate acute malnutrition (WFH <-2 z-score and >=-3 z-score, no oedema)
12 2.5 1.3 – 4.7 95% C.I.
Prevalence of severe acute malnutrition (WFH <-3 z-score and/or oedema)
3 0.6 0.2 – 2.0 95% C.I.
Prevalence of acute malnutrition based on MUAC
Prevalence of global malnutrition (< 125 mm and/or oedema)
9 1.9 0.9 – 3.8 95% C.I.
Prevalence of moderate malnutrition (< 125 mm and >= 115 mm, no oedema)
8 1.7 0.8 – 3.4 95% C.I.
Prevalence of severe malnutrition (< 115 mm and/or oedema)
1 0.2 0.0 – 1.6 95% C.I.
Prevalence of underweight based on weight-for-age z-scores2
Prevalence of underweight (WFA <-2 z-score)
59 12.4 9.1 – 16.6 95%
C.I.
Prevalence of moderate underweight (WFA <-2 z-score and >=-3 z-score)
51 10.7 7.8 – 14.6 95%
C.I.
Prevalence of severe underweight (WFA <-3 z-score)
8 1.7 0.8 – 3.4 95% C.I.
Prevalence of stunting based on height-for-age z-scores2
Prevalence of stunting (HFA <-2 z-score)
120 25.6 20.1 – 32.1 95%
C.I.
Prevalence of moderate stunting (HFA <-2 z-score and >=-3 z-score)
96 20.5 16.7 – 25.0 95%
C.I.
Prevalence of severe stunting (HFA <-3 z-score)
24 5.1 3.0 – 8.6 95% C.I.
Prevalence of overweight based on weight for height cut-offs2
Prevalence of overweight (WHZ > 2) 5 1.0 0.4 – 2.4 95% C.I.
Prevalence of severe overweight (WHZ > 3) 0 0 0.0 – 0.0 95% C.I.
Recommendation: Enhancing the ongoing nutrition programs and focus on improving of the Infants and Young Child Feeding IYCF and the Community Health Worker CHW programs and improving the access to health services and water, hygiene and sanitation conditions.
2 Based on WHO Child Growth Standards (2006) and exclusion of z-scores from observed mean (SMART flags: WHZ -4 to 4; HAZ -3 to 3; WAZ -3 to 3).

1. Introduction The survey was conducted in Al Bab district of Aleppo governorate in Syria. the surveyed area has a total population of 328,000 people. The population residing in the area are mix of residents and IDPs. Majority of them are Muslim-Sunni. The population are mix of Arab, Turkmen and Kurdish. Pastoral farming and agriculture are the main subsistence in this area. All accessible communities were included, while inaccessible communities were excluded, in total 68 communities from three sub-district (Ar-Ra'ee, Al Bab and Arima) from Al Bab district were included in the sampling frame (Annex 2). These communities include urban and rural areas. Maps and the location of the surveyed area in Annex 8 Al Bab was under the control of the İslamic state for about 3 years, during this period many NGOs suspended their activities in the area so most of the humanitarian services had deteriorated. After Feb 2017, the oppositions controlled the area, many people returned to the area, following this changes the area received a lot of new İDPs from Raqqa and Deir Ezzour. Access to the area has now improved and many NGOs are working and providing humanitarian services. especially the improvement and well organization of health services through the Turkish ministry of health. 1.1 Survey Objectives The main objective of the survey is to estimate the prevalence of malnutrition in children between 6-59 months in the accessible areas of AL Bab district. Specific objectives:
• To measure the prevalence of acute malnutrition in children aged 6-59 months in Al Bab district.
• To measure the prevalence of stunting in children aged 6-59 months in Al Bab district.

2. Methodology
A two-stage cluster sampling with probability proportional to size (PPS) design was employed for the SMART nutrition assessment.
Stage 1: Cluster Selection Stage 2: Household selection
The basic principle for selecting the households that will be visited is that every child in the whole study population should have an equal no—zero chance of being selected. 2.1 Sample size The following assumptions (based on the given context) were used to calculate the sample size in number of children, which were then converted into number of households to surveyed. All calculations were made using ENA for SMART Software (9th July 2015).
Assumptions based on context (footnote any references used)
Value Parameters for Anthropometry
Assumption Al Bab Parameters
Last survey was conducted by Damascus in Aleppo governorate 2015 – the resulted prevalence was 1.3%.We decided to duplicate the 1.3% (2.6%), as the situation in AL Bab since 2015 is changed a lot after the large numbers of IDPs came to it.
2.6 % Estimated Prevalence of GAM (%)
The desired precision for this survey (± 3%) was chosen based on SMART recommendations for the estimated GAM prevalence (± 3% for estimated prevalence <10%).
±3 % ± Desired precision
Usually for cluster sampling we used 1.5 but as the heterogeneity in the population as the IDPs are from many areas with different situation so we decided to increase it. Decision design effect = 1.7
1.7 Design Effect (if applicable)
Children to be included in the survey 200
The SMART Methodology recommends converting the number of children into number of households (fixed household method) for the numerous reasons: It is easier to create lists of households than lists of children in the field; sample sizes calculated in number of children can encourage teams to skip households without any children (thus introducing a bias for household-level indicators); and households can
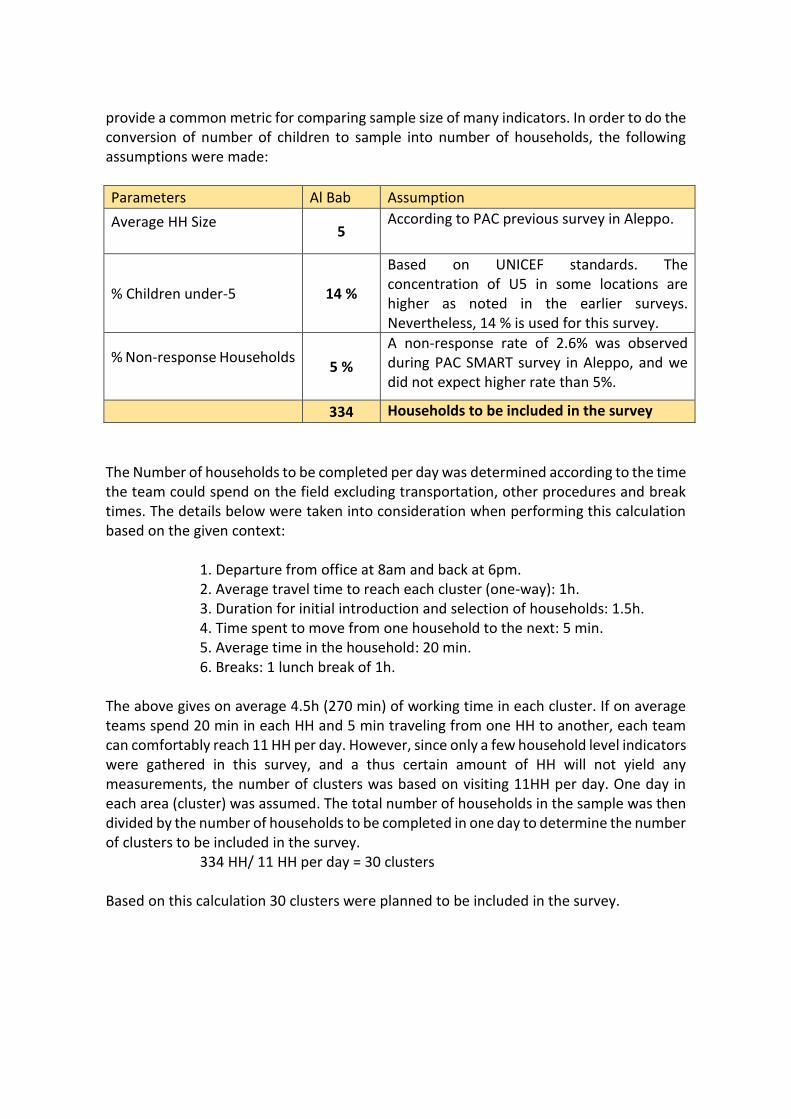
provide a common metric for comparing sample size of many indicators. In order to do the conversion of number of children to sample into number of households, the following assumptions were made:
Assumption Al Bab Parameters
According to PAC previous survey in Aleppo. 5
Average HH Size
Based on UNICEF standards. The concentration of U5 in some locations are higher as noted in the earlier surveys. Nevertheless, 14 % is used for this survey.
14 % % Children under-5
A non-response rate of 2.6% was observed during PAC SMART survey in Aleppo, and we did not expect higher rate than 5%.
5 % % Non-response Households
Households to be included in the survey 334
The Number of households to be completed per day was determined according to the time the team could spend on the field excluding transportation, other procedures and break times. The details below were taken into consideration when performing this calculation based on the given context:
1. Departure from office at 8am and back at 6pm. 2. Average travel time to reach each cluster (one-way): 1h. 3. Duration for initial introduction and selection of households: 1.5h. 4. Time spent to move from one household to the next: 5 min. 5. Average time in the household: 20 min. 6. Breaks: 1 lunch break of 1h.
The above gives on average 4.5h (270 min) of working time in each cluster. If on average teams spend 20 min in each HH and 5 min traveling from one HH to another, each team can comfortably reach 11 HH per day. However, since only a few household level indicators were gathered in this survey, and a thus certain amount of HH will not yield any measurements, the number of clusters was based on visiting 11HH per day. One day in each area (cluster) was assumed. The total number of households in the sample was then divided by the number of households to be completed in one day to determine the number of clusters to be included in the survey.
334 HH/ 11 HH per day = 30 clusters Based on this calculation 30 clusters were planned to be included in the survey.

2.2 Sampling procedure: selecting clusters
• To have a representative sample of all accessible communities of Al Bab district in Aleppo governorate we collect all population data of every community in the area, all these communities were accessible, these community's population data was updated and collected by the NPM (Needs and Population Monitoring) survey and the field staff of Al-Ameen organization (NGO) working in the area, then these data had been checked by the local authorities in the area.
• all inaccessible communities were excluded from the sampling frame before selecting the clusters, four sub district were excluded (Tadaf, Rasm Haram El-Imam, Dayr Hafir, Eastern Kwaires)
• This data covers three sub district (Ar-Ra'ee, Al Bab and Arima) from Al Bab district of Aleppo governorate.
• After we got the population data we listed them to generate the sampling frame then transferred this sampling frame into ENA software for SMART and randomly selected 30 clusters and 4 reserve clusters. Clusters had been selected using the PPS (Probability Proportional to size) method (communities’ chance to be selected are according to their size so the big community has a higher chance than small community to be selected).
• Annex 2 shows the sampling frame and the selected clusters.
2.3 Sampling procedure: selecting households and children
• The survey teams visited 12 HH in each cluster.
• To select these 12 Households in each cluster we trained all teams to use Simple random sampling or Systematic random sampling methods according to cluster size and the availability of HH list or the ability to build a HH list.
• In some communities, the teams used the segmentation, especially in communities that were a little big or contains more than one cluster.
• These big communities had ben segmented to a small segment, then the teams using the segmentation table (Annex 7) (using the PPS methods) selected one or more segments (according to how many clusters are in this community) to be visited. These cluster was (6, 7, 12, 13, 14, 15, 16, 17, 18, 19, 20, 21, 22, 27, 28)
• The systematic random sampling was used in all clusters; this means that the teams did not find an updated list of all HH in the clusters.
• All abandoned HH had been excluded before starting to select the HH, if the selected HH was absent at the visit then the teams revisited this HH at the end of the day and if it is still absent the team only put a notice on the cluster control form and they did not replace it.
• Also, if there is a child absent in the selected HH, the team revisited the HH at the end of the day and if the child had return they measure the child, if not they put a note on the Cluster control form.

2.4 Case definitions and inclusion criteria
• For this survey, we used the following definition of HH: The group of people self-identified as biological family (mother, father, children, grandparents, first aunts, first uncles and first cousins). Any orphans (related or not) under the care of this family were also included in the household, and they eat from the same spot.
• All children 6 – 59 month lives in the selected HH were included in the anthropometry survey, the inclusion criteria were only by age.
• The collected data were: Sex: Male (M) or Female (F) Age: All children 6-59 months from all the selected households were included in the anthropometric survey. Children’s age was determined using Family card. If Family cards were not available a local event calendar was used. If there were no children 6-59 months in the household, the household was still considered as ‘visited household’ within the cluster. Weight: (kg) (00.0) the weight were measured by direct or indirect methods (for the young children who cannot stand alone) using the electronic scale. height or Length: (cm) (000.0) For measuring the length and height, all children under 2 years (6 – 23 month) had been measured laying down (Length) and all children more than 2 years (24 – 59 month) had been measured standing up (Height). MUAC: Mid-Upper Arm Circumference (mm) in the Left hand for all children. Bilateral Oedema: Swollen limbs leaving depression 3 seconds after pressing on the front of both feet (bilateral).
• We used the WHO 2006 standards to analyze and report the anthropometry data.
• We also collected data about separated children, who are separated from their father and mother, we asked if the child is living with his father or mother, if no, we asked with whom he lives, you can see the questionnaire in (Annex 4)
2.5 Questionnaire, training and supervision Questionnaire
• The questionnaire was prepared in the Arabic language, and all the interviews were in the Arabic language, all team's members were Arabic speaker.
• We did not need to do any translation and back-translation for the questionnaire, the translation lead sometimes to some mistakes in the interviews.
• The questionnaire had two parts, one for anthropometric measurement, and the other one for separated children, a copy of the questionnaire can be found in the Annex 4
• Also, all teams used the Cluster control form to manage all aspects of the visit and to be insure that all Selected HH had been visited. Annex 6
Survey teams and supervision
• The supervisor had been chosen before starting the training, he was from the medical staff of Al-Ameen working in the area.

• There were 4 teams worked in the field for 8 days from 8th to 17th August 2017, each team consisted of 3 members, one team leader, one measurer and one assistant, at least one member of each team was female.
• 12 enumerators (4 teams) had been chosen and participated in the survey according to their results during the standardization test.
• Most of the participated were a CHW (Community Health worker) with a background of the malnutrition.
• The supervisor was responsible for all teams, and each day of field work the supervisor was accompanied with one team or more.
• The equipment used for the survey: 1. SECA Scale, electronic, mother/child,150kgx100g 2. Portable baby/child L-hgt mea.syst/SET-2 3. MUAC, Child 11.5 Red/PAC-50
Training
• Due to the difficulty of crossing the border, the survey teams had been trained inside Syria by the survey supervisor.
• The survey supervisor had been chosen from the medical staff working in the area, then the Assessment technical working group of North Syria Nutrition cluster trained the supervisor at Gaziantep – Turkey, the training was for 3 days
• The supervisor repeated the training inside Syria for the enumerators, the training had been repeated two times with online supervision from the Assessment technical working group.
• first time was 5 days and one day for field test, after the training had been finished, the Assessment technical working group decided to repeat the training to avoid some problems found in the standardization test and the field test.
• second time was for 4 days and one day for the field test.
• 15 trainees attended the training. (8 males and 7 female)
• The training covered the following topics (general survey objectives, overview of survey design, household selection procedures, anthropometric measurements, signs and symptoms of malnutrition, data collection and interview skills, how to fill the questionnaire and other format, determine the age of the children), the training contained a practical training for anthropometric measurements with an online supervision.
• At the last day of the second training, a standardization test had been conducted, all teams measured 10 different children between 6 – 59 month twice for Weight, Length or Height and MUAC, then these measurements entered to the ENA software for SMART and Analyzed to select the best teams.
• According to the standardization test results (Annex 3) teams had been selected to participate in the field work.

2.6 Data analysis
• Each survey team finished one cluster per day.
• The collected data had been entered in daily basis, the data had been scanned every day and this scanned files sent to data entry every day.
• Tow separated data entry entered the data in a daily basis. The data had been entered to the ENA software for SMART (Ver of 9 July 2015).
• The data had been reviewed every day and if there was any feedback in general or for a specific team the survey manger sent these feedbacks before the staring of the next day to ensure the good quality of data.
• To ensure high quality of data entry, at the end, a double data entry check had been applied (comparing the two data sets) to check the quality of the data entry and to correct any mistake in the data entry (if there is any difference between the two set we go back to the paper questionnaires and correct the mistakes).
• After that, a random check with the hard copies had been done to check if there is any mistake.
• After we corrected any mistake in the data entry, we started the data analyses.
• When analyze the data some outliers (extremely Z-scores) had been excluded using SMART flag exclusion criteria3.
2.7 Characteristic of the sample
• A total of 480 children 6 – 59 month were surveyed for nutrition status.
• 480 children, 248 boys and 232 girls, aged 6-59 months from 335 households in 30 clusters from Al Bab district - Aleppo were included in the Anthropometric measurements, this total number of children included in the survey exceeded the planned requirement of 200 children (240 %) - Table 2.1.
• The exact age of 38% of children aged 6-59 months was determined using family card or any other documents, and an event calendar (Annex 5) was used to determine the remaining 62%.
• 478 children (248 boys and 230 girls) were included in the WHZ anthropometric analysis (2 cases excluded by SMART flags).
• 360 HH planned to be surveyed, the household non-response was 14 HH (11 absent HH and 2 refuse HH), indicating that 3,6 % of households were absent on a first and second visit on the day of data collection or refused to cooperate with the survey teams (table 2.2).
• 30 clusters were originally planned and all clusters had been visited.
• A 270 HH from the 360 surveyed HH were a host community (75 %) and 90 HH were IDPs (25%).
• A 28 HH from the 360 surveyed HH (7.8 %) contained a child less than 18 years with a disability.
3 SMART flag exclusion criteria exclude the extremely Z-score by ±3 from the mean observed Z-score, for
this survey we increased the exclusion criteria for WHZ to be ±4.

• The distribution of the assessed children sex shows boys and girls were equally represented with the overall sex ratio of 1,1 as expected (Table 3.1).
• The age ratio of 6-29 months to 30-59 months was (0,94) and this finding means that young children and older children were equally represented.
• The age distribution in the plausibility report shows some rounding in the age to half and full years (12, 18, 24, 30, 36, 42, 48 month) You can see the Statistical evaluation of sex and age ratios (using Chi squared statistic) in the ENA Plausibility Report (Annex 1)
• The total number of 6-59 month children included (observed) in the survey, 480 exceeded the planned requirement of 200 children (240%).
• The percent of eligible children included in the survey refers to the total number of eligible children (6-59months) that live in the randomly selected households compared to the number of eligible children that were measured. (A randomly selected household may contain two 6-59 month children but only one was included in the survey because the second child was away playing or visiting their grandparents). A total of 95.6% of eligible 6-59 month children were measured and included in the survey.
Table 2.1: Number of planned, included, eligible 6-59 month children in Aleppo survey
Number of children 6-59 months planned
Number of children 6-59 months included
% 6-59 month children included/planned
Number of eligible 6-59 month children
Number of eligible 6-59 month children included
% of eligible 6-59 month children included
200 480 240% 502 480 95.6%
As shown above, we found more children in the HHs we visited, this is due to the underestimation of the HH size and for the prevalence of Children under 5 in the calculation of the sample size, also the non-response rate was lower than what we estimated. Table 2.2: Percent of household non-response
Number of HH planned*
Number of HH surveyed
% HH Non-Response
360 347 3.6 %

2.8 limitation: The planned sample size for anthropometry measurements was 200 children; however, 480 child were covered by the survey (240%), hence lower than actual sample size was used in the planning. Average number of 6-59 month children per HH found to be about 1.4 (480/335) (measured children / HH included in the survey), which is similar to the usual estimate of 1.5. Due to the accessibility issue, this survey has been conducted through online training and online supervision from the assessment technical working group, but at the end the quality of collected data was acceptable and considered as good in the Plausibility report (Annex 1) The survey does not present the entire Al Bab district level situation, but for only the accessible sub-districts only, from where the clusters were randomly selected from. i.e. 3 sub district out of 7 sub-districts in Al Bab district - Aleppo

3. Results 3.1 Anthropometric results (based on WHO standards 2006): Exclusion of z-scores from Observed mean SMART flags: WHZ -4 to 4; HAZ -3 to 3; WAZ -3 to 3 Table 3.1: Distribution of age and sex of sample
Boys Girls Total Ratio
AGE (mo) no. % no. % no. % Boy:girl
6-17 64 53,8 55 46,2 119 24,8 1,2
18-29 54 47,8 59 52,2 113 23,5 0,9
30-41 52 55,9 41 44,1 93 19,4 1,3
42-53 41 50,6 40 49,4 81 16,9 1,0
54-59 37 50,0 37 50,0 74 15,4 1,0
Total 248 51,7 232 48,3 480 100,0 1,1
Prevalence of acute malnutrition based on weight-for-height z-scores The prevalence of Global Acute Malnutrition (GAM), defined as Weight-for-height Z scores (WHZ) <‐2 and/or oedema was 3.1% (1.8 – 5.5 95% CI), and the prevalence of severe acute malnutrition (SAM), defined as WHZ <‐3 and/or oedema, was 0.6% (0.2- 2.0 95% CI), with no cases of oedema found (Table 3.2). Figure 3.1 shows the distribution of Z-scores. The prevalence of acute malnutrition (WHZ<-2 and/or oedema) was highest among younger age group (6 – 17 month and 18 – 29 month) Table 3.2, this may indicate more problems and low level of IYCF practices in the area Table 3.2: Prevalence of acute malnutrition based on weight-for-height z-scores (and/or oedema) and by sex
All n = 478
Boys n = 248
Girls n = 230
Prevalence of global malnutrition (<-2 z-score and/or oedema)
(15) 3,1 % (1,8 - 5,5 95% C.I.)
(9) 3,6 % (1,7 - 7,5 95% C.I.)
(6) 2,6 % (1,2 - 5,6 95% C.I.)
Prevalence of moderate malnutrition (<-2 z-score and >=-3 z-score, no oedema)
(12) 2,5 % (1,3 - 4,7 95% C.I.)
(6) 2,4 % (1,0 - 5,9 95% C.I.)
(6) 2,6 % (1,2 - 5,6 95% C.I.)
Prevalence of severe malnutrition (<-3 z-score and/or oedema)
(3) 0,6 % (0,2 - 2,0 95% C.I.)
(3) 1,2 % (0,4 - 3,8 95% C.I.)
(0) 0,0 % (0,0 - 0,0 95% C.I.)
The prevalence of oedema is 0.0 % (No cases found)

Table 3.3: Prevalence of acute malnutrition by age, based on weight-for-height z-scores and/or oedema
Severe wasting (<-3 z-score)
Moderate wasting
(>= -3 and <-2 z-score )
Normal (> = -2 z score)
Oedema
Age (mo)
Total no.
No. % No. % No. % No. %
6-17 118 2 1,7 4 3,4 112 94,9 0 0,0
18-29 113 0 0,0 6 5,3 107 94,7 0 0,0
30-41 93 0 0,0 0 0,0 93 100,0 0 0,0
42-53 80 0 0,0 0 0,0 80 100,0 0 0,0
54-59 74 1 1,4 2 2,7 71 95,9 0 0,0
Total 478 3 0,6 12 2,5 463 96,9 0 0,0
Table 3.4: Distribution of acute malnutrition and oedema based on weight-for-height z-scores
<-3 z-score >=-3 z-score
Oedema present Marasmic kwashiorkor No. 0
(0,0 %)
Kwashiorkor No. 0
(0,0 %)
Oedema absent Marasmic No. 4
(0,8 %)
Not severely malnourished No. 476 (99,2 %)
Figure 3.1: WHZ distributions:

prevalence of acute malnutrition based on MUAC cut off's (and / or oedema): The prevalence of global acute malnutrition (GAM) in children 6 – 59 month, defined as MUAC <125 mm was 1,9% (0,9 – 3,8 95% C.I), and the prevalence of severe acute malnutrition (SAM), defined as MUAC < 115 mm was 0.2 % (0.0 – 1,6 95% C.I), No cases of oedema had been found. The GAM rate was higher between girls (3.4%) more than boys (0.4%), and there were statically difference between them (p=0.033) As shown in the GAM prevalence by WHZ, the prevalence of GAM rate was highest in the age group of 6 -17 month (Table 3.6). Table 3.5: Prevalence of acute malnutrition based on MUAC cut off's (and/or oedema) and by sex
All n = 480
Boys n = 248
Girls n = 232
Prevalence of global malnutrition (< 125 mm and/or oedema)
(9) 1,9 % (0,9 - 3,8 95% C.I.)
(1) 0,4 % (0,1 - 3,1 95% C.I.)
(8) 3,4 % (1,5 - 7,6 95% C.I.)
Prevalence of moderate malnutrition (< 125 mm and >= 115 mm, no oedema)
(8) 1,7 % (0,8 - 3,4 95% C.I.)
(1) 0,4 % (0,1 - 3,1 95% C.I.)
(7) 3,0 % (1,4 - 6,6 95% C.I.)
Prevalence of severe malnutrition (< 115 mm and/or oedema)
(1) 0,2 % (0,0 - 1,6 95% C.I.)
(0) 0,0 % (0,0 - 0,0 95% C.I.)
(1) 0,4 % (0,1 - 3,3 95% C.I.)
Table 3.6: Prevalence of acute malnutrition by age, based on MUAC cut off's and/or oedema
Severe wasting (< 115 mm)
Moderate wasting
(>= 115 mm and < 125 mm)
Normal (> = 125 mm )
Oedema
Age (mo)
Total no.
No. % No. % No. % No. %
6-17 119 0 0,0 8 6,7 111 93,3 0 0,0
18-29 113 1 0,9 0 0,0 112 99,1 0 0,0
30-41 93 0 0,0 0 0,0 93 100,0 0 0,0
42-53 81 0 0,0 0 0,0 81 100,0 0 0,0
54-59 74 0 0,0 0 0,0 74 100,0 0 0,0
Total 480 1 0,2 8 1,7 471 98,1 0 0,0

Prevalence of underweight based on weight-for-age z-score (WAZ) The prevalence of underweight in children 6-59 months, defined as weight- for-age Z scores (WAZ) <‐2 was 12,4% (9,1 – 16,6 95% C.I.) with 1,7% (0,8 – 3,4 95% C.I.) severely underweight, defined as Weight-for-Age Z scores (WAZ) <‐3 (Table 3.7). A higher prevalence of underweight by age group was observed among the age groups 42 - 53 months and 54 – 59 month (Table 3.8). Table 3.7: Prevalence of underweight based on weight-for-age z-scores by sex
All n = 476
Boys n = 246
Girls n = 230
Prevalence of underweight (<-2 z-score)
(59) 12,4 % (9,1 - 16,6 95% C.I.)
(30) 12,2 % (7,6 - 18,9 95% C.I.)
(29) 12,6 % (8,9 - 17,6 95% C.I.)
Prevalence of moderate underweight (<-2 z-score and >=-3 z-score)
(51) 10,7 % (7,8 - 14,6 95% C.I.)
(27) 11,0 % (6,8 - 17,2 95% C.I.)
(24) 10,4 % (7,0 - 15,2 95% C.I.)
Prevalence of severe underweight (<-3 z-score)
(8) 1,7 % (0,8 - 3,4 95% C.I.)
(3) 1,2 % (0,4 - 3,6 95% C.I.)
(5) 2,2 % (0,9 - 4,9 95% C.I.)
Table 3.8: Prevalence of underweight by age, based on weight-for-age z-scores
Severe underweight (<-3 z-score)
Moderate underweight
(>= -3 and <-2 z-score )
Normal (> = -2 z score)
Oedema
Age (mo)
Total no.
No. % No. % No. % No. %
6-17 118 1 0,8 16 13,6 101 85,6 0 0,0
18-29 112 2 1,8 14 12,5 96 85,7 0 0,0
30-41 92 1 1,1 7 7,6 84 91,3 0 0,0
42-53 80 1 1,3 4 5,0 75 93,8 0 0,0
54-59 74 3 4,1 10 13,5 61 82,4 0 0,0
Total 476 8 1,7 51 10,7 417 87,6 0 0,0

Prevalence of stunting based on height-for-age z-score (HAZ) The prevalence of stunting, defined as Height-for-age Z scores (HAZ) <‐2 in children 6-59 months was 25,6 % (20.1 – 32.1 95% C.I.) with 5.1 % (3.0 – 8.6 95% C.I.) severely stunted, defined as height-for-age Z scores (HAZ) <‐3 (Table 3.9). Stunting peaked amongst the age group of 18 -29 months (25.7% moderate stunting and 5.5% severe stunting) (Table 3.10). Table 3.9: Prevalence of stunting based on height-for-age z-scores and by sex
All n = 468
Boys n = 240
Girls n = 228
Prevalence of stunting (<-2 z-score)
(120) 25,6 % (20,1 - 32,1
95% C.I.)
(57) 23,8 % (17,8 - 30,9
95% C.I.)
(63) 27,6 % (19,5 - 37,5
95% C.I.)
Prevalence of moderate stunting (<-2 z-score and >=-3 z-score)
(96) 20,5 % (16,7 - 25,0
95% C.I.)
(47) 19,6 % (15,0 - 25,2
95% C.I.)
(49) 21,5 % (15,3 - 29,4
95% C.I.)
Prevalence of severe stunting (<-3 z-score)
(24) 5,1 % (3,0 - 8,6 95% C.I.)
(10) 4,2 % (2,1 - 8,0 95% C.I.)
(14) 6,1 % (3,3 - 11,2 95% C.I.)
Table 3.10: Prevalence of stunting by age based on height-for-age z-scores
Severe stunting (<-3 z-score)
Moderate stunting (>= -3 and <-2 z-score )
Normal (> = -2 z score)
Age (mo)
Total no.
No. % No. % No. %
6-17 115 5 4,3 12 10,4 98 85,2
18-29 109 6 5,5 28 25,7 75 68,8
30-41 91 6 6,6 21 23,1 64 70,3
42-53 80 4 5,0 19 23,8 57 71,3
54-59 73 3 4,1 16 21,9 54 74,0
Total 468 24 5,1 96 20,5 348 74,4

Figure 3.2 : HAZ Z-score distribution:
Prevalence of overweight based on weight for height z-score (HAZ) The prevalence of overweight, defined as weight-for-height Z scores (WHZ) > 2 in children 6-59 months was 1,0 % (0.4 – 2.4 95% C.I.). With 0.0 % (0.0 – 0.0 95% C.I.) of a severely overweight, defined as weight-for-height Z scores (WHZ) > 3 (Table 3.11). Prevalence of overweight by age group is indicated in Table 3.12. Table 3.11: Prevalence of overweight based on weight for height cut off's and by sex (no oedema)
All n = 478
Boys n = 248
Girls n = 230
Prevalence of overweight (WHZ > 2)
(5) 1,0 % (0,4 - 2,4 95% C.I.)
(4) 1,6 % (0,6 - 4,3 95% C.I.)
(1) 0,4 % (0,1 - 3,1 95% C.I.)
Prevalence of severe overweight (WHZ > 3)
(0) 0,0 % (0,0 - 0,0 95% C.I.)
(0) 0,0 % (0,0 - 0,0 95% C.I.)
(0) 0,0 % (0,0 - 0,0 95% C.I.)

Table 3.12: Prevalence of overweight by age, based on weight for height (no oedema)
Overweight (WHZ > 2)
Severe Overweight (WHZ > 3)
Age (mo) Total no. No. % No. %
6-17 118 1 0,8 0 0,0
18-29 113 0 0,0 0 0,0
30-41 93 1 1,1 0 0,0
42-53 80 2 2,5 0 0,0
54-59 74 1 1,4 0 0,0
Total 478 5 1,0 0 0,0
Table 3.13: Mean z-scores, Design Effects and excluded subjects
Indicator n Mean z-scores ± SD
Design Effect (z-score < -2)
z-scores not
available*
z-scores out of range
Weight-for-Height
478 -0,19±0,95 1,17 0 2
Weight-for-Age 476 -0,81±0,99 1,44 0 4
Height-for-Age 468 -1,23±1,14 2,11 0 12
* contains for WHZ and WAZ the children with oedema.

4. Discussion 4.1 Nutritional status Good nutrition is essential for optimum child development throughout the first 1,000 days of life and beyond. Suboptimum growth (stunting, wasting and underweight) increases risk of childhood morbidity and mortality, among children under 5 years of age. Acute malnutrition, or wasting, is a global public health concern during crisis. The nutrition SMART survey conducted in Al Bab district – Aleppo, found the prevalence of Global Acute Malnutrition (GAM) rate of 3,1% (1,8 – 5,5 95% C.I) and SAM rate of 0.6% (0,2 – 2,0 95% C.I), with no cases of oedema found, this rate Classified as low Severity (GAM rate less than 5%) according to the WHO classification of severity of Malnutrition. Prevalence of GAM appears higher in boys 3,6% (1,7 – 7,5 95% C.I) than girls 2,6% (1,2 – 5,6 95% C.I), however this difference is not statistically significant (p=0.542). The higher prevalence was found in younger children aged 6-17 month and 18 – 29 month (5,1% and 5,3% respectively). The GAM rate found in Al Bab is slightly higher than GAM rate found by SMART nutrition survey conducted by PAC in Aleppo governorate in 2015 (1.3% (0.5-3.1 95% C.I.), It’s however worth noting that these results are not directly comparable due to difference in population coverage The level of acute malnutrition found in this survey is also higher than the result of the survey carried out in Jarabulus camps in Aleppo governorate in December 2013 (GAM 2.6%)4. Similarly, when the prevalence of acute malnutrition is determined using MUAC (<125mm), the prevalence was found to be 1,9% (0,9 – 3,8 95% C.I), with a relatively higher prevalence in younger children aged 6-17 months (6.7%) (all cases were from this age group). (This higher prevalence in younger children may be due to the high sensitivity and low specificity of MUAC in younger children). Chronic malnutrition, or stunting, as indicated by low height for age, has an impact on child’s health and chance of survival, contributing to over one million of childhood deaths worldwide (UNICEF Global Report, 2014). The main causes of stunting include intrauterine growth retardation, inadequate nutrition to support the rapid growth and development of infants and young children and frequent infections during early life. In Al Bab district, the SMART nutrition survey found 25,6 % (20.1 – 32.1 95% C.I.) of children 6-59 months stunted with 5.1 % (3.0 – 8.6 95% C.I.) severely stunted. Stunting often increases with age, and is best prevented before a child’s second birthday. The stunting rate is slightly higher than the stunting rate 23.2% (18.2 - 29.2 95% C.I.) found in Aleppo SMART survey 2015 and higher than Jarabulus camp survey 2013 (22%). The stunting rate found to be high in most SMART survey conducted in other area in Syria, the stunting rate in Syria was also high before the crises which was 27.5% in 2009 (worldbank.org5).
4 Anthropometric survey in Jarabulus, Aleppo Governorate of Syria 20/12/ 2013 to 24 / 12 / 2013 ) Confidential internal
report for organizations working in Syria and technical working groups 5 https://data.worldbank.org/indicator/SH.STA.STNT.ZS?locations=SY

Childhood overweight results in both immediate and long-term risks to child’s health. Among the immediate risks are metabolic abnormalities including increased risks of diabetes type 2, and high blood pressure. Childhood overweight is also a strong risk factor for adult obesity and its consequences. In Al Bab district the prevalence of overweight was 1.0% (0.4 – 2.4 95% C.I.). which is much lower than 3.5% found in Aleppo SMART survey 2015. 4.2 Causes of malnutrition
Malnutrition is a complex condition and is cause by multiples and overlapping factors including inadequate dietary intake (quality and quantity) and repeated infections. Household food insecurity, poor health services, poor care practices including inappropriate IYCF practices, and the lack of safe water and sanitation are some of the underlying causes. The prevalence of acute malnutrition was approximately the same comparing with all other nutrition and SMART survey conducted in Aleppo, The peak of acute malnutrition was between younger children, which can be explained by the poor IYCF practices in the area.

5. Conclusions Despite the presence of risk factors for under nutrition like poor IYCF practices, increased food insecurity, poor hygiene and sanitation due to limited water availability, decreased availability and accessibility to health services and on-going conflict and displacement in the area, the survey results showed a low prevalence of global acute malnutrition in Al Bab district. Which means that the Nutrition situation in the area are acceptable. The low severity of GAM (GAM rate less than 5%) indicates an acceptable situation, according to the WHO classification for severity of nutrition situation. The low prevalence is similar to what found in Aleppo survey 2015, but in the other hand, it is unexpected as the reported pre-crisis wasting prevalence in Aleppo governorate was 5.7% PAPFAM 2009. Nevertheless, the severity of chronic malnutrition is categorized as medium (prevalence between 20-29%), potentially reflecting a longer term inadequate dietary intake, including micronutrients, repeated infections such as diarrhoea in younger children, as well as poor feeding practices. As well as poor feeding practices as reflected by low uptake of exclusive breastfeeding in the first 6 months of life. Inappropriate IYCF practices remain an issue of concern, whereby feeding infants with formula milk in an emergency carries high risks of malnutrition, morbidity and mortality. In accordance with the internationally accepted standards and guidelines, any procurement and use of Breast milk substitute (BMS) should be strictly controlled to prevent its negative impact on the population in need.

6. Recommendations and priorities The results of this survey and Aleppo SMART survey 2015 indicate that GAM prevalence is low based on WHO classifications; hence, there may not be further need to repeat the SMART surveys in the next year, unless there is an indication based on screening result of deteriorated situation.
Immediate recommendation:
• Implement and enhance the IYCF programs to consult the mothers and provide them with the proper feeding practices for infants and young children
Intermediate recommendation:
• According to the survey results, it is preferred to conduct an IYCF survey, to better understand the actual IYCF practices and to explore the causes behind the IYCF malpractices
• Enhancing the ongoing nutrition programs
• Enhance the CHW (Community Health Worker) programs in the area to focus on improving the knowledge and practices of care givers at the community level
Long-term recommendation:
• Improving the access to health services and water, hygiene and sanitation
conditions to reduce the prevalence of stunting.

7. Annexes Annex 1: Plausibility report Plausibility check for: Al Bab SMART .AS Standard/Reference used for z-score calculation: WHO standards 2006 (If it is not mentioned, flagged data is included in the evaluation. Some parts of this plausibility report are more for advanced users and can be skipped for a standard evaluation) Overall data quality Criteria Flags* Unit Excel. Good Accept Problematic Score Flagged data Incl % 0-2.5 >2.5-5.0 >5.0-7.5 >7.5 (% of out of range subjects) 0 5 10 20 0 (0.4 %) Overall Sex ratio Incl p >0.1 >0.05 >0.001 <=0.001 (Significant chi square) 0 2 4 10 0 (p=0.465) Age ratio(6-29 vs 30-59) Incl p >0.1 >0.05 >0.001 <=0.001 (Significant chi square) 0 2 4 10 0 (p=0.294) Dig pref score - weight Incl # 0-7 8-12 13-20 > 20 0 2 4 10 2 (8) Dig pref score - height Incl # 0-7 8-12 13-20 > 20 0 2 4 10 0 (7) Dig pref score - MUAC Incl # 0-7 8-12 13-20 > 20 0 2 4 10 2 (9) Standard Dev WHZ Excl SD <1.1 <1.15 <1.20 >=1.20 . and and and or . Excl SD >0.9 >0.85 >0.80 <=0.80 0 5 10 20 0 (0.95) Skewness WHZ Excl # <±0.2 <±0.4 <±0.6 >=±0.6 0 1 3 5

1 (-0.31) Kurtosis WHZ Excl # <±0.2 <±0.4 <±0.6 >=±0.6 0 1 3 5 5 (0.75) Poisson dist WHZ-2 Excl p >0.05 >0.01 >0.001 <=0.001 0 1 3 5 0 (p=0.389) OVERALL SCORE WHZ = 0-9 10-14 15-24 >25 10 % The overall score of this survey is 10 %, this is good. There were no duplicate entries detected. Percentage of children with no exact birthday: 62 % Anthropometric Indices likely to be in error (-4 to 4 for WHZ, -3 to 3 for HAZ, -3 to 3 for WAZ, from observed mean - chosen in Options panel - these values will be flagged and should be excluded from analysis for a nutrition survey in emergencies. For other surveys this might not be the best procedure e.g. when the percentage of overweight children has to be calculated): Line=1/ID=8: WHZ (-4.390), WAZ (-4.627), Weight may be incorrect Line=24/ID=4: HAZ (2.705), Height may be incorrect Line=39/ID=17: HAZ (-4.934), Age may be incorrect Line=74/ID=4: HAZ (-5.574), WAZ (-3.830), Age may be incorrect Line=123/ID=8: HAZ (1.975), Age may be incorrect Line=174/ID=16: HAZ (-4.782), Age may be incorrect Line=235/ID=15: HAZ (3.254), Age may be incorrect Line=330/ID=9: HAZ (3.942), Age may be incorrect Line=378/ID=16: HAZ (-7.696), WAZ (-4.159), Age may be incorrect Line=396/ID=17: HAZ (2.544), Age may be incorrect Line=407/ID=13: HAZ (2.315), Age may be incorrect Line=441/ID=10: HAZ (-5.847), Age may be incorrect Line=450/ID=7: HAZ (-4.574), Height may be incorrect Line=480/ID=15: WHZ (6.944), WAZ (4.457), Weight may be incorrect Percentage of values flagged with SMART flags:WHZ: 0.4 %, HAZ: 2.5 %, WAZ: 0.8 % Age distribution:

Month 6 : #### Month 7 : ################### Month 8 : ########### Month 9 : ###### Month 10 : ### Month 11 : ######## Month 12 : ################# Month 13 : ######## Month 14 : ############# Month 15 : ######## Month 16 : ####### Month 17 : ########### Month 18 : ################# Month 19 : ########## Month 20 : ######### Month 21 : ## Month 22 : ### Month 23 : ########## Month 24 : ############### Month 25 : ####### Month 26 : ############ Month 27 : ########## Month 28 : ############ Month 29 : ###### Month 30 : ################## Month 31 : ######### Month 32 : ### Month 33 : ####### Month 34 : ##### Month 35 : ####### Month 36 : ################## Month 37 : ########## Month 38 : ###### Month 39 : ## Month 40 : ###### Month 41 : ### Month 42 : ############### Month 43 : ###### Month 44 : ##### Month 45 : ### Month 46 : ## Month 47 : ### Month 48 : ################### Month 49 : ##### Month 50 : ##### Month 51 : ####### Month 52 : ######## Month 53 : #####

Month 54 : ########### Month 55 : ####### Month 56 : ############ Month 57 : ########### Month 58 : ############# Month 59 : ##################### Age ratio of 6-29 months to 30-59 months: 0.94 (The value should be around 0.85).: p-value = 0.294 (as expected) Statistical evaluation of sex and age ratios (using Chi squared statistic): Age cat. mo. boys girls total ratio boys/girls ------------------------------------------------------------------------------------- 6 to 17 12 64/57.5 (1.1) 55/53.8 (1.0) 119/111.4 (1.1) 1.16 18 to 29 12 54/56.1 (1.0) 59/52.5 (1.1) 113/108.6 (1.0) 0.92 30 to 41 12 52/54.4 (1.0) 41/50.9 (0.8) 93/105.2 (0.9) 1.27 42 to 53 12 41/53.5 (0.8) 40/50.1 (0.8) 81/103.6 (0.8) 1.02 54 to 59 6 37/26.5 (1.4) 37/24.8 (1.5) 74/51.2 (1.4) 1.00 ------------------------------------------------------------------------------------- 6 to 59 54 248/240.0 (1.0) 232/240.0 (1.0) 1.07 The data are expressed as observed number/expected number (ratio of obs/expect) Overall sex ratio: p-value = 0.465 (boys and girls equally represented) Overall age distribution: p-value = 0.002 (significant difference) Overall age distribution for boys: p-value = 0.091 (as expected) Overall age distribution for girls: p-value = 0.029 (significant difference) Overall sex/age distribution: p-value = 0.001 (significant difference) Digit preference Weight: Digit .0 : #################### Digit .1 : ###################################### Digit .2 : ########################## Digit .3 : ######################## Digit .4 : ######################### Digit .5 : #################### Digit .6 : #################### Digit .7 : ################## Digit .8 : ####################### Digit .9 : ########################## Digit preference score: 8 (0-7 excellent, 8-12 good, 13-20 acceptable and > 20 problematic)

p-value for chi2: 0.002 (significant difference) Digit preference Height: Digit .0 : ##################################### Digit .1 : ############################################## Digit .2 : ########################################################### Digit .3 : ############################################# Digit .4 : ############################################################## Digit .5 : ################################################## Digit .6 : ####################################################### Digit .7 : ################################### Digit .8 : ############################## Digit .9 : ############################################################# Digit preference score: 7 (0-7 excellent, 8-12 good, 13-20 acceptable and > 20 problematic) p-value for chi2: 0.004 (significant difference) Digit preference MUAC: Digit .0 : ################## Digit .1 : ######################################################## Digit .2 : ########################################################### Digit .3 : ############################################################# Digit .4 : ######################################################### Digit .5 : ####################################### Digit .6 : ##################################################### Digit .7 : ######################################## Digit .8 : ############################################################ Digit .9 : ##################################### Digit preference score: 9 (0-7 excellent, 8-12 good, 13-20 acceptable and > 20 problematic) p-value for chi2: 0.000 (significant difference) Evaluation of Standard deviation, Normal distribution, Skewness and Kurtosis using the 3 exclusion (Flag) procedures . no exclusion exclusion from exclusion from . reference mean observed mean . (WHO flags) (SMART flags)

WHZ Standard Deviation SD: 1.02 0.96 0.95 (The SD should be between 0.8 and 1.2) Prevalence (< -2) observed: 3.3% calculated with current SD: 3.7% calculated with a SD of 1: 3.4% HAZ Standard Deviation SD: 1.31 1.28 1.14 (The SD should be between 0.8 and 1.2) Prevalence (< -2) observed: 26.3% 26.1% 25.6% calculated with current SD: 28.0% 27.2% 25.0% calculated with a SD of 1: 22.2% 21.8% 22.1% WAZ Standard Deviation SD: 1.05 1.05 0.99 (The SD should be between 0.8 and 1.2) Prevalence (< -2) observed: 12.9% 12.9% calculated with current SD: 13.1% 13.1% calculated with a SD of 1: 11.9% 11.9% Results for Shapiro-Wilk test for normally (Gaussian) distributed data: WHZ p= 0.000 p= 0.000 p= 0.007 HAZ p= 0.000 p= 0.004 p= 0.397 WAZ p= 0.000 p= 0.000 p= 0.234 (If p < 0.05 then the data are not normally distributed. If p > 0.05 you can consider the data normally distributed) Skewness WHZ 0.31 -0.44 -0.31 HAZ -0.16 0.06 -0.03 WAZ -0.01 -0.01 -0.10 If the value is:

-below minus 0.4 there is a relative excess of wasted/stunted/underweight subjects in the sample -between minus 0.4 and minus 0.2, there may be a relative excess of wasted/stunted/underweight subjects in the sample. -between minus 0.2 and plus 0.2, the distribution can be considered as symmetrical. -between 0.2 and 0.4, there may be an excess of obese/tall/overweight subjects in the sample. -above 0.4, there is an excess of obese/tall/overweight subjects in the sample Kurtosis WHZ 5.53 1.22 0.75 HAZ 1.96 1.11 -0.26 WAZ 1.44 1.44 0.03 Kurtosis characterizes the relative size of the body versus the tails of the distribution. Positive kurtosis indicates relatively large tails and small body. Negative kurtosis indicates relatively large body and small tails. If the absolute value is: -above 0.4 it indicates a problem. There might have been a problem with data collection or sampling. -between 0.2 and 0.4, the data may be affected with a problem. -less than an absolute value of 0.2 the distribution can be considered as normal. Test if cases are randomly distributed or aggregated over the clusters by calculation of the Index of Dispersion (ID) and comparison with the Poisson distribution for: WHZ < -2: ID=1.05 (p=0.389) WHZ < -3: ID=0.93 (p=0.573) GAM: ID=1.05 (p=0.389) SAM: ID=0.93 (p=0.573) HAZ < -2: ID=2.19 (p=0.000) HAZ < -3: ID=1.82 (p=0.005) WAZ < -2: ID=1.39 (p=0.084) WAZ < -3: ID=1.01 (p=0.451) Subjects with SMART flags are excluded from this analysis. The Index of Dispersion (ID) indicates the degree to which the cases are aggregated into certain clusters (the degree to which there are "pockets"). If the ID is less than 1 and p > 0.95 it indicates that the cases are UNIFORMLY distributed among the clusters. If the p value is between 0.05 and 0.95 the cases appear to be randomly distributed among the clusters, if ID is higher than 1 and p is less than 0.05 the cases are aggregated into certain cluster (there appear to be pockets of cases). If this is the case for Oedema but not for WHZ then aggregation of GAM and SAM cases is likely due to inclusion of oedematous

cases in GAM and SAM estimates. Are the data of the same quality at the beginning and the end of the clusters? Evaluation of the SD for WHZ depending upon the order the cases are measured within each cluster (if one cluster per day is measured then this will be related to the time of the day the measurement is made). Time SD for WHZ point 0.8 0.9 1.0 1.1 1.2 1.3 1.4 1.5 1.6 1.7 1.8 1.9 2.0 2.1 2.2 2.3 01: 0.87 (n=29, f=0) ### 02: 0.90 (n=29, f=0) #### 03: 1.06 (n=29, f=0) ########### 04: 1.05 (n=29, f=0) ########## 05: 0.93 (n=29, f=0) ###### 06: 0.85 (n=29, f=0) ## 07: 1.04 (n=29, f=0) ########## 08: 1.30 (n=29, f=1) ##################### 09: 0.84 (n=29, f=0) ## 10: 1.15 (n=29, f=0) ############### 11: 0.85 (n=29, f=0) ## 12: 1.06 (n=28, f=0) ########### 13: 1.09 (n=27, f=0) ############ 14: 0.76 (n=25, f=0) 15: 1.71 (n=20, f=1) ###################################### 16: 1.17 (n=17, f=0) ################ 17: 0.64 (n=15, f=0) 18: 0.67 (n=07, f=0) 19: 0.51 (n=06, f=0) 20: 1.22 (n=03, f=0) ~~~~~~~~~~~~~~~~~~ 21: 0.32 (n=03, f=0) 22: 0.21 (n=03, f=0) 23: 0.41 (n=03, f=0) 24: 0.19 (n=02, f=0) (when n is much less than the average number of subjects per cluster different symbols are used: 0 for n < 80% and ~ for n < 40%; The numbers marked "f" are the numbers of SMART flags found in the different time points) Analysis by Team Team 1 2 3 4 n = 121 103 106 150 Percentage of values flagged with SMART flags: WHZ: 0.8 0.0 0.0 0.7 HAZ: 2.5 2.9 2.8 2.0

WAZ: 1.7 1.0 0.0 0.7 Age ratio of 6-29 months to 30-59 months: 0.86 0.84 1.12 0.95 Sex ratio (male/female): 1.16 0.98 0.96 1.14 Digit preference Weight (%): .0 : 9 6 12 6 .1 : 16 23 15 12 .2 : 12 11 8 13 .3 : 11 10 8 10 .4 : 12 12 13 7 .5 : 1 12 12 9 .6 : 9 6 9 8 .7 : 8 2 7 12 .8 : 13 8 8 9 .9 : 10 12 7 14 DPS: 12 18 9 8 Digit preference score (0-7 excellent, 8-12 good, 13-20 acceptable and > 20 problematic) Digit preference Height (%): .0 : 11 5 10 5 .1 : 6 15 9 9 .2 : 12 16 10 11 .3 : 8 6 8 14 .4 : 16 15 10 11 .5 : 7 8 16 11 .6 : 11 12 13 11 .7 : 7 10 5 8 .8 : 7 9 4 5 .9 : 15 7 14 14 DPS: 11 12 12 10 Digit preference score (0-7 excellent, 8-12 good, 13-20 acceptable and > 20 problematic) Digit preference MUAC (%): .0 : 4 4 4 3 .1 : 11 13 8 15 .2 : 14 13 14 9 .3 : 10 17 10 14 .4 : 17 5 16 9 .5 : 3 10 8 11 .6 : 12 7 11 13 .7 : 7 14 8 6 .8 : 14 12 15 10 .9 : 8 8 6 9 DPS: 14 13 13 11 Digit preference score (0-7 excellent, 8-12 good, 13-20 acceptable and > 20 problematic) Standard deviation of WHZ: SD 1.19 0.94 1.02 0.88 Prevalence (< -2) observed: % 2.5 5.7

Prevalence (< -2) calculated with current SD: % 5.6 2.2 Prevalence (< -2) calculated with a SD of 1: % 2.9 2.1 Standard deviation of HAZ: SD 1.23 1.49 1.29 1.21 observed: % 23.1 39.8 17.9 25.3 calculated with current SD: % 25.4 39.9 21.3 25.4 calculated with a SD of 1: % 20.7 35.2 15.3 21.1 Statistical evaluation of sex and age ratios (using Chi squared statistic) for: Team 1: Age cat. mo. boys girls total ratio boys/girls ------------------------------------------------------------------------------------- 6 to 17 12 12/15.1 (0.8) 11/13.0 (0.8) 23/28.1 (0.8) 1.09 18 to 29 12 14/14.7 (1.0) 19/12.7 (1.5) 33/27.4 (1.2) 0.74 30 to 41 12 14/14.3 (1.0) 12/12.3 (1.0) 26/26.5 (1.0) 1.17 42 to 53 12 15/14.0 (1.1) 6/12.1 (0.5) 21/26.1 (0.8) 2.50 54 to 59 6 10/6.9 (1.4) 8/6.0 (1.3) 18/12.9 (1.4) 1.25 ------------------------------------------------------------------------------------- 6 to 59 54 65/60.5 (1.1) 56/60.5 (0.9) 1.16 The data are expressed as observed number/expected number (ratio of obs/expect) Overall sex ratio: p-value = 0.413 (boys and girls equally represented) Overall age distribution: p-value = 0.278 (as expected) Overall age distribution for boys: p-value = 0.720 (as expected) Overall age distribution for girls: p-value = 0.124 (as expected) Overall sex/age distribution: p-value = 0.048 (significant difference) Team 2: Age cat. mo. boys girls total ratio boys/girls ------------------------------------------------------------------------------------- 6 to 17 12 16/11.8 (1.4) 14/12.1 (1.2) 30/23.9 (1.3) 1.14 18 to 29 12 7/11.5 (0.6) 10/11.8 (0.9) 17/23.3 (0.7) 0.70 30 to 41 12 14/11.2 (1.3) 12/11.4 (1.1) 26/22.6 (1.2) 1.17 42 to 53 12 6/11.0 (0.5) 9/11.2 (0.8) 15/22.2 (0.7) 0.67 54 to 59 6 8/5.4 (1.5) 7/5.5 (1.3) 15/11.0 (1.4) 1.14

------------------------------------------------------------------------------------- 6 to 59 54 51/51.5 (1.0) 52/51.5 (1.0) 0.98 The data are expressed as observed number/expected number (ratio of obs/expect) Overall sex ratio: p-value = 0.921 (boys and girls equally represented) Overall age distribution: p-value = 0.108 (as expected) Overall age distribution for boys: p-value = 0.114 (as expected) Overall age distribution for girls: p-value = 0.840 (as expected) Overall sex/age distribution: p-value = 0.066 (as expected) Team 3: Age cat. mo. boys girls total ratio boys/girls ------------------------------------------------------------------------------------- 6 to 17 12 16/12.1 (1.3) 12/12.5 (1.0) 28/24.6 (1.1) 1.33 18 to 29 12 14/11.8 (1.2) 14/12.2 (1.1) 28/24.0 (1.2) 1.00 30 to 41 12 7/11.4 (0.6) 7/11.8 (0.6) 14/23.2 (0.6) 1.00 42 to 53 12 8/11.2 (0.7) 13/11.7 (1.1) 21/22.9 (0.9) 0.62 54 to 59 6 7/5.5 (1.3) 8/5.8 (1.4) 15/11.3 (1.3) 0.88 ------------------------------------------------------------------------------------- 6 to 59 54 52/53.0 (1.0) 54/53.0 (1.0) 0.96 The data are expressed as observed number/expected number (ratio of obs/expect) Overall sex ratio: p-value = 0.846 (boys and girls equally represented) Overall age distribution: p-value = 0.186 (as expected) Overall age distribution for boys: p-value = 0.318 (as expected) Overall age distribution for girls: p-value = 0.511 (as expected) Overall sex/age distribution: p-value = 0.091 (as expected) Team 4: Age cat. mo. boys girls total ratio boys/girls ------------------------------------------------------------------------------------- 6 to 17 12 20/18.6 (1.1) 18/16.2 (1.1) 38/34.8 (1.1) 1.11 18 to 29 12 19/18.1 (1.0) 16/15.8 (1.0) 35/33.9 (1.0) 1.19 30 to 41 12 17/17.5 (1.0) 10/15.3 (0.7) 27/32.9 (0.8) 1.70 42 to 53 12 12/17.3 (0.7) 12/15.1 (0.8) 24/32.4 (0.7) 1.00 54 to 59 6 12/8.5 (1.4) 14/7.5 (1.9) 26/16.0 (1.6) 0.86 ------------------------------------------------------------------------------------- 6 to 59 54 80/75.0 (1.1) 70/75.0 (0.9) 1.14

The data are expressed as observed number/expected number (ratio of obs/expect) Overall sex ratio: p-value = 0.414 (boys and girls equally represented) Overall age distribution: p-value = 0.044 (significant difference) Overall age distribution for boys: p-value = 0.528 (as expected) Overall age distribution for girls: p-value = 0.078 (as expected) Overall sex/age distribution: p-value = 0.018 (significant difference) Evaluation of the SD for WHZ depending upon the order the cases are measured within each cluster (if one cluster per day is measured then this will be related to the time of the day the measurement is made). Team: 1 Time SD for WHZ point 0.8 0.9 1.0 1.1 1.2 1.3 1.4 1.5 1.6 1.7 1.8 1.9 2.0 2.1 2.2 2.3 01: 1.11 (n=08, f=0) ############# 02: 0.89 (n=08, f=0) #### 03: 1.29 (n=08, f=0) ##################### 04: 1.17 (n=08, f=0) ################ 05: 1.01 (n=08, f=0) ######### 06: 0.79 (n=08, f=0) 07: 1.28 (n=08, f=0) #################### 08: 1.29 (n=08, f=0) #################### 09: 0.78 (n=08, f=0) 10: 1.18 (n=08, f=0) ################ 11: 0.54 (n=08, f=0) 12: 0.87 (n=07, f=0) ### 13: 1.14 (n=06, f=0) ############## 14: 0.99 (n=06, f=0) ######## 15: 3.31 (n=05, f=1) OOOOOOOOOOOOOOOOOOOOOOOOOOOOOOOOOOOOOOOOOOOOOOOOOOOOOOOOOOOOOOOO 16: 0.96 (n=04, f=0) OOOOOOO 17: 0.80 (n=03, f=0) (when n is much less than the average number of subjects per cluster different symbols are used: 0 for n < 80% and ~ for n < 40%; The numbers marked "f" are the numbers of SMART flags found in the different time points) Team: 2 Time SD for WHZ point 0.8 0.9 1.0 1.1 1.2 1.3 1.4 1.5 1.6 1.7 1.8 1.9 2.0 2.1 2.2 2.3 01: 0.59 (n=06, f=0) 02: 0.87 (n=06, f=0) ### 03: 1.25 (n=06, f=0) ###################

04: 0.88 (n=06, f=0) ### 05: 0.71 (n=06, f=0) 06: 0.53 (n=06, f=0) 07: 1.18 (n=06, f=0) ################ 08: 0.91 (n=06, f=0) #### 09: 0.57 (n=06, f=0) 10: 0.77 (n=06, f=0) 11: 0.28 (n=06, f=0) 12: 1.61 (n=06, f=0) ################################## 13: 0.93 (n=06, f=0) ##### 14: 0.79 (n=06, f=0) 15: 0.50 (n=04, f=0) 16: 2.30 (n=03, f=0) OOOOOOOOOOOOOOOOOOOOOOOOOOOOOOOOOOOOOOOOOOOOOOOOOOOOOOOOOOOOOOO 17: 0.34 (n=03, f=0) (when n is much less than the average number of subjects per cluster different symbols are used: 0 for n < 80% and ~ for n < 40%; The numbers marked "f" are the numbers of SMART flags found in the different time points) Team: 3 Time SD for WHZ point 0.8 0.9 1.0 1.1 1.2 1.3 1.4 1.5 1.6 1.7 1.8 1.9 2.0 2.1 2.2 2.3 01: 0.89 (n=07, f=0) #### 02: 1.32 (n=07, f=0) ###################### 03: 0.90 (n=07, f=0) #### 04: 1.31 (n=07, f=0) ##################### 05: 0.89 (n=07, f=0) #### 06: 1.32 (n=07, f=0) ###################### 07: 0.71 (n=07, f=0) 08: 1.21 (n=07, f=0) ################# 09: 0.58 (n=07, f=0) 10: 1.75 (n=07, f=0) ######################################## 11: 0.98 (n=07, f=0) ####### 12: 0.82 (n=07, f=0) # 13: 0.85 (n=07, f=0) ## 14: 0.56 (n=05, f=0) 15: 1.18 (n=03, f=0) OOOOOOOOOOOOOOOO 16: 0.43 (n=03, f=0) 17: 1.08 (n=02, f=0) ~~~~~~~~~~~~ (when n is much less than the average number of subjects per cluster different symbols are used: 0 for n < 80% and ~ for n < 40%; The numbers marked "f" are the numbers of SMART flags found in the different time points) Team: 4

Time SD for WHZ point 0.8 0.9 1.0 1.1 1.2 1.3 1.4 1.5 1.6 1.7 1.8 1.9 2.0 2.1 2.2 2.3 01: 0.43 (n=08, f=0) 02: 0.56 (n=08, f=0) 03: 0.84 (n=08, f=0) ## 04: 0.76 (n=08, f=0) 05: 0.97 (n=08, f=0) ####### 06: 0.71 (n=08, f=0) 07: 0.48 (n=08, f=0) 08: 1.41 (n=08, f=1) ########################## 09: 0.91 (n=08, f=0) ##### 10: 0.83 (n=08, f=0) # 11: 1.06 (n=08, f=0) ########### 12: 1.06 (n=08, f=0) ########### 13: 0.94 (n=08, f=0) ###### 14: 0.73 (n=08, f=0) 15: 0.72 (n=08, f=0) 16: 1.01 (n=07, f=0) ######### 17: 0.62 (n=07, f=0) 18: 0.35 (n=04, f=0) 19: 0.62 (n=03, f=0) 20: 1.72 (n=02, f=0) ~~~~~~~~~~~~~~~~~~~~~~~~~~~~~~~~~~~~~~~ 21: 0.46 (n=02, f=0) 22: 0.06 (n=02, f=0) 23: 0.32 (n=02, f=0) (when n is much less than the average number of subjects per cluster different symbols are used: 0 for n < 80% and ~ for n < 40%; The numbers marked "f" are the numbers of SMART flags found in the different time points) (for better comparison it can be helpful to copy/paste part of this report into Excel)

Annex 2: Assignment of Clusters
Geographical unit Population size Cluster
Olan 1500
Haji kusa 2500
Alshikh Naser 3000 1
jbine 1500
Tal Jerji 1500
Shbiran 1500
Zamka 1500
Tarheen 4000 2
Msibin 2500
Arab Boran 4000
Kenderli 2500 3
Brshaya 2500
Alwash 2500
Biesh Jeren 3000
Qnaqoi 2500 4
Shwiehah 3000
Shazar 2500
Kor Hyok 1800
Sab Wyran 1500 5
Alamrya 4000
Qabasin 23500 6,7
Qubbet Elsheikh 3500 8
Su Sinbat 3500
Sheikh Jarrah 1750
Borj 1600 9
Sosyan 4000
Qdeiran 4000
Hadath 2800 RC
Noman 14500 10
shawa 4000 11
Albab 105000 12,13,14,15,16,17,18,19,20,RC
Bazagha 14500 21,22
Saflaniyeh 3500
Aldana 3000 23
Olan 5000
Hazwan 5000 24
Sheikh Elwan 2500
Shdud 1500

Almoghri 2000
Om Adeseh 1500
Sandi 5500 25
Alayoubia 1500
Tal Eisheh 2000
Tal Atieh 2000 26
Tweiran 2500
Waqf 4500
Ar-Ra'ee 21000 27,28,RC
Karsanli 2000
Shikh Yakoub 4000
Ayyasha 1000
Silsileh 2500 29
Aljalylya 2500
Bab Laymun 4000
Hamady 1000
Tal Mizab 500
Zyaret Elbab 1500
Almortafaa 1500 30
Zalaf 700
Tal Elhawa 2000
Hleisa 3500
Atharia 2000
Hadabat 800 RC
Raghbieh 1000
Tal safar 700
Qemmet Daghelbash 680
jub albarazi 350
Tal Birshah 400
Big Amya 225
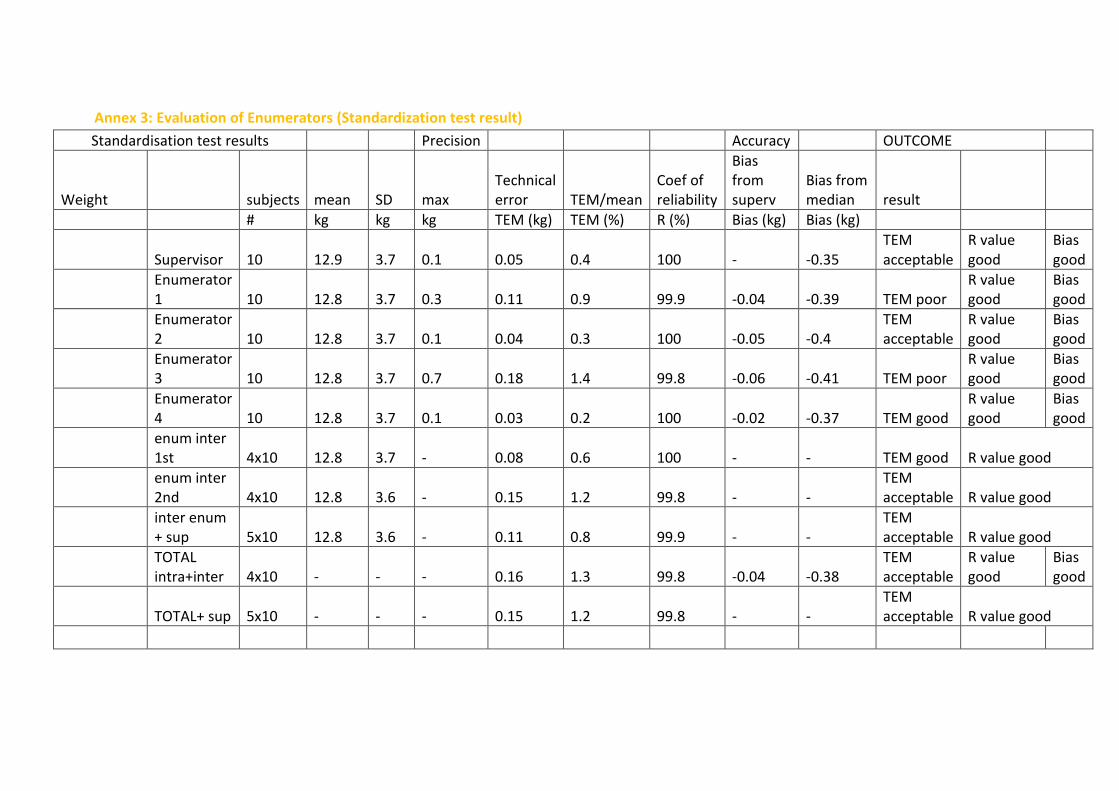
Annex 3: Evaluation of Enumerators (Standardization test result)
Standardisation test results Precision Accuracy OUTCOME
Weight subjects mean SD max Technical error TEM/mean
Coef of reliability
Bias from superv
Bias from median result
# kg kg kg TEM (kg) TEM (%) R (%) Bias (kg) Bias (kg)
Supervisor 10 12.9 3.7 0.1 0.05 0.4 100 - -0.35 TEM acceptable
R value good
Bias good
Enumerator 1 10 12.8 3.7 0.3 0.11 0.9 99.9 -0.04 -0.39 TEM poor
R value good
Bias good
Enumerator 2 10 12.8 3.7 0.1 0.04 0.3 100 -0.05 -0.4
TEM acceptable
R value good
Bias good
Enumerator 3 10 12.8 3.7 0.7 0.18 1.4 99.8 -0.06 -0.41 TEM poor
R value good
Bias good
Enumerator 4 10 12.8 3.7 0.1 0.03 0.2 100 -0.02 -0.37 TEM good
R value good
Bias good
enum inter 1st 4x10 12.8 3.7 - 0.08 0.6 100 - - TEM good R value good
enum inter 2nd 4x10 12.8 3.6 - 0.15 1.2 99.8 - -
TEM acceptable R value good
inter enum + sup 5x10 12.8 3.6 - 0.11 0.8 99.9 - -
TEM acceptable R value good
TOTAL intra+inter 4x10 - - - 0.16 1.3 99.8 -0.04 -0.38
TEM acceptable
R value good
Bias good
TOTAL+ sup 5x10 - - - 0.15 1.2 99.8 - - TEM acceptable R value good

Height subjects mean SD max Technical error TEM/mean
Coef of reliability
Bias from superv
Bias from median result
# cm cm cm TEM (cm) TEM (%) R (%) Bias (cm) Bias (cm)
Supervisor 10 90.4 14.6 0.3 0.09 0.1 100 - -0.93 TEM good R value good
Enumerator 1 10 90.7 14.4 1 0.4 0.4 99.9 0.33 -0.6 TEM good
R value good
Bias good
Enumerator 2 10 90.7 14.6 0.6 0.14 0.2 100 0.28 -0.64 TEM good
R value good
Bias good
Enumerator 3 10 90.7 14.5 0.7 0.27 0.3 100 0.29 -0.64 TEM good
R value good
Bias good
Enumerator 4 10 90.6 14.9 0.2 0.08 0.1 100 0.24 -0.69 TEM good
R value good
Bias good
enum inter 1st 4x10 90.7 14.4 - 0.35 0.4 99.9 - - TEM good R value good
enum inter 2nd 4x10 90.6 14.3 - 0.45 0.5 99.9 - - TEM good R value good
inter enum + sup 5x10 90.6 14.3 - 0.39 0.4 99.9 - - TEM good R value good
TOTAL intra+inter 4x10 - - - 0.48 0.5 99.9 0.28 -0.7 TEM good
R value good
Bias good
TOTAL+ sup 5x10 - - - 0.45 0.5 99.9 - - TEM good R value good
MUAC subjects mean SD max Technical error TEM/mean
Coef of reliability
Bias from superv
Bias from median result
# mm mm mm TEM (mm) TEM (%) R (%)
Bias (mm) Bias (mm)

Supervisor 10 149.5 14.6 3 1.1 0.7 99.4 - -0.5 TEM good R value good
Bias good
Enumerator 1 10 148 12.5 4 1.48 1 98.6 -1.5 -2 TEM good
R value acceptable
Bias good
Enumerator 2 10 147.1 13.7 3 0.92 0.6 99.5 -2.35 -2.85 TEM good
R value good
Bias good
Enumerator 3 10 148.1 12.9 6 1.77 1.2 98.1 -1.45 -1.95 TEM good
R value acceptable
Bias good
Enumerator 4 10 149.8 14.3 1 0.55 0.4 99.9 0.3 -0.2 TEM good
R value good
Bias good
enum inter 1st 4x10 148.3 13.3 - 2.29 1.5 97.1 - -
TEM acceptable
R value acceptable
enum inter 2nd 4x10 148.2 13.1 - 2.05 1.4 97.6 - -
TEM acceptable
R value acceptable
inter enum + sup 5x10 148.5 13.4 - 2.23 1.5 97.2 - -
TEM acceptable
R value acceptable
TOTAL intra+inter 4x10 - - - 2.52 1.7 96.3 -1.25 -1.5
TEM acceptable
R value acceptable
Bias good
TOTAL+ sup 5x10 - - - 2.55 1.7 96.4 - - TEM acceptable
R value acceptable
Suggested cut-off points for acceptability of measurements
Parameter MUAC mm
Weight Kg Height cm
individual good <2.0 <0.04 <0.4 TEM acceptable <2.7 <0.10 <0.6 (intra) poor <3.3 <0.21 <1.0
reject >3.3 >0.21 >1.0 Team TEM good <2.0 <0.10 <0.5

(intra+inter) acceptable <2.7 <0.21 <1.0 and Total poor <3.3 <0.24 <1.5
reject >3.3 >0.24 >1.5 R value good >99 >99 >99
acceptable >95 >95 >95
poor >90 >90 >90
reject <90 <90 <90 Bias good <1 <0.04 <0.4 From sup if good acceptable <2 <0.10 <0.6 outcome, otherwise poor <3 <0.21 <1.4 from median reject >3 >0.21 >1.4

Annex 4: Survey Questionnaire:

Annex 5: Calendar events: Event Calendar
Aug-13 عيد الفطر 80سقوط اللواء Jun-15 ي البابزز سوق الهال الجديد ف البدء تجهي
Sep-13 مجزرة الكيماوي بالغوطة Jul-15 عيد الفطر
Oct-13 عيد األضىح Aug-15
Nov-13 Sep-15 عيد األضىح
Dec-13 Oct-15
Jan-14 سقوط الباب -حرب داعش Nov-15
Feb-14 Dec-15 حملة القصف الروسي موجة الثلج
Mar-14 Jan-16
Apr-14 اغالق الجمعيات االغاثية Feb-16 حملة القصف الروسي الثانية
May-14 سقوط حمص المدينة و حصار بعض
Mar-16 االحياء
Jun-14 اعالن الخالفة Apr-16
Jul-14 عيد الفطر May-16
Aug-14 تحرير الرقة بشكل كامل Jun-16 ي مقتل الشيشانز
Sep-14 ي اول حصار لحلب Jul-16 حرب كوبانز
عيد الفطر
Oct-14 مذبحة الشعيطات عيد األضىح Aug-16 حلب فك الحصار عن
Nov-14 Sep-16 عيد األضىح
Dec-14 ي Oct-16 انتهاء حرب كوبانز
Jan-15 الجزراوي -مقتل الوالي Nov-16 بداية معركة الباب
Feb-15 حملة القصف النظام Dec-16 سقوط حلب
Mar-15 Jan-17
Apr-15 Feb-17 تحرير الباب
May-15

Annex 6: Cluster control form:

Annex 7: Segmentation table

Annex 8: Map of the surveyed area: